Article

Innovative Methodologies for Higher Global MPP of Photovoltaic Arrays under PSCs: Experimental Validation

by
Belqasem Aljafari
1,
Rupendra Kumar Pachauri
2,
Sudhakar Babu Thanikanti
3,* and
Bamidele Victor Ayodele
4,*
1
Department of Electrical Engineering, College of Engineering, Najran University, Najran 11001, Saudi Arabia
2
Electrical and Electronics Engineering Department, School of Engineering, University of Petroleum and Energy Studies, Dehradun 248007, India
3
Department of Electrical and Electronics Engineering, Chaitanya Bharathi Institute of Technology, Hyderabad 500075, India
4
Department of Chemical Engineering, Universiti Teknologi PETRONAS, Seri Iskandar 32610, Malaysia
*
Authors to whom correspondence should be addressed.
Sustainability 2023, 15(15), 11852; https://doi.org/10.3390/su151511852
Submission received: 9 May 2023 / Revised: 20 June 2023 / Accepted: 27 July 2023 / Published: 1 August 2023

Abstract

:
Partial shading conditions (PSCs) are responsible for the root causes of photovoltaic (PV) system performance deprivation such as hotspots (damaged PV cells), mismatch power losses and multiple power maxima. Recently, PV array reconfiguration strategies have proven to be beneficial in improving PV system performance and achieving improved shade dispersion properties. This research analyzes the improved Su-Do-Ku (I-SDK) PV array configuration in order to counteract the shading effect. This approach implements a 6 × 6 size PV array configuration and performance evaluation under different realistic shading scenarios. The performance of the I-SDK configuration is assessed and compared to that of the total-cross-tied (TCT) and Su-Do-Ku (SDK) arrangements. The performance indices such as power loss (PL), power at global maximum power point (GMPP), fill-factor (FF), performance ratio (PR), power enhancement (PE) and execution ratio (ER) are analyzed to show comprehensive comparison. An experimental analysis confirms the MATLAB/Simulink findings, demonstrating that the I-SDK configuration outperforms both the TCT and SDK array setups. The GMPP values of 143.5 W, 141.7 W, 138.1 W and 129.3 W also show the superiority of I-SDK during four shading instances compared to conventional SP, TCT, SDK and SM arrangements. Moreover, under similar PSCs, higher %FF (74.61%, 76.10%, 77.1%, 75.92%) and lower PL (36.7 W, 38.5 W, 42.1 W, 50.9 W) support the adoptability of I-SDK for experimental validation/commercial viability.

1. Introduction

As a climate-sustainable solution, the world needs urgent and rapid incorporation of renewable energy (RE) into the global energy scenario. RE sources are commonly known as clean energy solutions, gaining the deep attention of energy users in commercial and domestic applications. The PV energy conversion method has received immense attention from researchers in recent days [1]. Concerns about the worldwide energy problems and the threat of climate change posed by existing energy sources have spurred the research for alternative energy sources. The most popular renewable energy source is solar PV, which is nonpolluting and requires no maintenance [2].
During the first half of 2020, thirteen countries pledged the largest amount of new RE ever, nearly 50 GW, to be installed in the year span of 2021–2024. Global demand in 2021 is expected to be 25% higher than in 2020 [3,4]. The researchers performed different studies to establish an effective and stable conversion of solar PV energy. Module mismatching and PSCs are two key contributors to PV system losses. Under these conditions, the PV system (P-V and I-V characteristics) becomes more complex and has many power peaks. The amount of energy made by a PV array is greatly reduced when it is in the shade [5,6,7]. To boost the efficiency of PV systems, a number of modules are coupled in specified combinations. An evaluation of the most recent research papers is conducted in this work in order to determine the research gap. The many varieties of PV array configurations’ performance, reliability, precision, resilience, efficiency and operation are all investigated. There are several things that can cause PSCs, such as passing clouds, high-rise buildings, telecommunications towers, adjacent trees, dead leaves, and so on.
The PV power output is reduced, allowing shaded modules to waste a significant percentage of the power produced by unshaded modules, resulting in hotspots that might eventually destroy the PV cell/module [8,9]. When designing an array, several PV modules are arranged in series and parallel to satisfy the load power demand. Parallel and series configurations of PV modules are used to meet a PV array’s power requirements. Traditional and game puzzle-based reconfiguration approaches such as series, series-parallel (SP), bridge-link (BL), total cross-tied (TCT), honey-comb (HC), Latin square (LS), magic square (MS) and Su-Do-Ku (SDK) puzzles have been adopted to design PV array systems.
Because of the way these algorithms are designed, the operative point is the earliest peak in the PV characteristic, which may or may not be a global power peak. Several advancements in the literature have been recorded to promote these algorithms in order to find the global power peak under PSCs. This is accomplished by adding more stages to the algorithm, making it more complex and restricting monitoring speed. Recently, an improved SDK-puzzle-based algorithm for MPP monitoring was discovered to yield good results.

1.1. Literature Review

The paper is a survey of the most recent research publications with the goal of identifying important research gaps. [10,11,12,13,14,15,16,17,18,19,20,21,22,23,24,25,26,27,28,29,30,31]. We examined several PV array topologies for consistency, stability and easy implementation.
The authors in [10] observed the effects of PV faults on the power grid under various faulty conditions using the MATLAB/Simulink-based study. A comprehensive analysis is investigated in terms of power at GMPP with selected SP, BL, TCT and reconfigured methodology (RM) configurations as 3.99 kW, 4.01 kW, 4.6 kW and 5.02 kW. In [11], an auto-reconfiguration approach is performed through switching-based PV array electrical connections from SP to TCT under PSCs. For shading pattern-1, the power at GMPP of conventional setups (SP and TCT) is 25.22 W and 26.19 W, respectively. In addition, PL values are observed for SP and TCT configurations under similar shadowing conditions as 3.75 W and 2.78 W. In [12], a detailed study is carried out with various PV array interconnections, including SP, HC and TCT. In the adopted PV array interconnections, power at GMPP of existing setups (SP, HC and TCT) is found as 4.39 kW, 4.44 kW and 4.72 kW, respectively. It is observed that the TCT configuration has a higher rating compared to conventional configurations. The authors of [13] presented a comprehensive study to mitigate shading effects, a novel LS-puzzle-based configuration compared to the TCT configuration. Locations of GMPP for shading pattern-1 exist as 1976 W and 2279 W. During all shading cases, Latin square—TCT (LS-TCT) has the best performance compared to TCT configuration. The Futoshiki puzzle (FP) is investigated in [14] and obtained results show that the power produced by the FP configuration is highest and minimized ML under various shading instances. Power generated as 40.07 W, 53.93 W and 53.93 W in TCT, EAR and Futoshiki configurations for a short wide (SW) shading scenario. For a long narrow (LN) shading condition, the generated power at GMPP is 59.41 W, 60.56 W and 60.56 W. In [15], the authors developed a novel method to reconfigure the PV module’s interconnection and compared it to the TCT configuration. The behavior of the P-V characteristic generated from the reconfigured PV array is found to be smoother than that of TCT-configured PV arrays under-considered PSCs. The half-reconfigured PV array (HRPVA) and full-reconfigured PV array (FRPVA) have increased the coherence between the obtained GMPP. With a performance ratio of 0.93, the generated power increased by 14.75% in HRPVA. Furthermore, with a unity performance ratio, FRPVA enhanced generated power by 23.3%. The proposed MS configuration in [16] is tested using a 3 × 3 PV array coupled to the TCT pattern under SN, LW, LN and SW shadowed conditions. TCT and MS configurations are investigated under SN shading scenarios, with GMPP locations of 1.8576 kW and 2.3734 kW being observed, respectively. For the shading pattern subjected to LN, the GMPP locations are assessed as 2.4278 kW and 2.8849 kW, respectively. The authors of [17] investigated the PV array arrangements, e.g., SP, TCT, BL, HC and hybrid series parallel-total cross tied (SP–TCT) and BL–TCT, and game-puzzle-based configurations such as nonsymmetrical-1, 2 (NS-1 and NS-2) are reported. The shading pattern-3 subjected to TCT array configuration has power at GMPP as 5260 W, 4545 W, 4332 W, 4182 W for four distinguished shading cases, respectively. In a similar shading scenario, the NS-2 configuration has power levels at GMPP locations of 5260 W, 5013 W, 4811 W and 4182 W, which are higher than conventional methods.
In [18], the performance of PV array designs of 4 × 4 sizes, i.e., MATLAB/Simulink is used to investigate TCT, hybrid SP-TCT, BL-TCT, BL-HC and MS, RSP-TCT, RBL-TCT and RBL-HC. The power at GMPP is observed as 2279 W, 1976 W, 2279 W, 1976 W, 2197 W, 1976 W, 2233 W, 1976 W and 2255 W for the respective topologies. The authors of [19] analyzed TCT configuration for performance improvement under PSCs. The power at GMPP under shading case-4 is observed as 377.2 W, 468.9 W and 468.9 W for TCT, Optimal TCT and Novel TCT configurations, respectively. Performance indices such as FF are observed at 40.46%, 60.26% and 60.28%, respectively. The authors of [20] discussed the result and test conducted on a 4 × 5 size PV array configuration with distinguishing shading scenarios. The power at GMPP for shading scenarios is observed as 797.24 W, 823.75 W, 819.22 W, 850.25 W, 851.57 W for SP, BL, HC, TCT and Novel PV array topologies. Furthermore, the calculated PL are found as 1.88%, 4.13%, 2.32%, 2.59% and 1.30%, respectively. The authors of [21] proposed a shade dispersion scheme (SDS) arrangement compared to other conventional PV module interconnections such as SP, BL and TCT under realistic shading patterns. The power at GMPP of PV array for SP, BL, TCT and SDS configurations is 1644.36 W, 1689.84 W, 1721.55 W and 1746.33 W, respectively. Also, results in PL for the same are 301.40 W, 256.12 W, 224.41 W and 199.63 W. The SDS configuration has a higher performance among all the PV array configurations. In [22], the recently developed cross diagonal view (CDV) configuration is proposed and compared to the conventional SP and TCT configuration for a 9 × 9 size PV array module. The power at GMPP is observed for SP, SDK, TCT and TCT-CDV as 6307.5 W, 6307.5 W, 4861.2 W and 7492.5 W. In [23], new physical PV array setups are introduced to reduce the shading impact and generated power at GMPP for SP, TCT and modified TCT (M-TCT) configurations under the considered shading conditions 174.60 W, 185.33 W, 215.74 W and 523.80 W, respectively.
Interconnection methods are proposed in [24] to reduce PL during PSCs. The TCT and proposed configurations have increased the power output by 7.8% and 6.9% compared to the conventional SP arrangement. The GMPP locations are found as 4065.3 W, 4419.3 W and 4393.1 W for SP, TCT and proposed topologies, respectively. The authors of [25] calculated the comparative result in terms of maximum power for parallel and series configurations under distinguished shading effects as 544.2 W, 492.45 W, 381.1 W and 446.5 W. For minimizing the shadowing effect, the parallel configuration is convenient. In [26], SDK arrangement was compared to TCT and validated experimentally on a 5 × 5 size array. Power of 266.4 W and 280.2 W was generated for the proposed Su-Do-Ku and TCT configuration subjected to two types of PSCs. People who came up with this idea say it makes P-V curves more even and eliminates the MPPT algorithm as well as the financial risk. In [27], the authors proposed a column-index-based topology for PV reconfiguration scheme. The generated power at GMPP for PV array topologies was such as proposed, DS, TCT and SP are 5338 W, 5101 W, 5066 W and 4815 W under LN-based shading pattern. The proposed technique was tested on a 9 × 9 size PV array and the results showed that it increased the global maximum power when compared to DS, TCT and SP array configurations.
In [28], the I-SDK arrangement enhanced the global power peaks (28.6%, 22.1%, 22.8%, 17.2%, 6.2% and 5.2%) compared to conventional (SP, BL, HC, TCT) and puzzle-based (SDK and optimal SDK) PV array setups under a realistic shading scenario. The authors of [29] designed 6 × 4 size PV array setups for performance investigation under shading scenarios. The SP, TCT, BL, HC, BL-HC, BL-TCT and SP-TCT arrangements were adopted for performance investigation and the generated power at GMPP was observed as 2177 W, 2394 W, 235.2 W, 2235 W, 2187 W, 2389 W, 2306 W and 2298 W, respectively. Moreover, TCT and BL-TCT configurations have shown a better response in terms of the highest power at GMPP, minimum PL and improved FF. The authors of [30] reviewed the performance of the proposed SRBL-TCT configuration compared to SP, TCT, BL, HC and BL-TCT results obtained under the realistic moving clouds phenomenon. At each of the five shading instants, the obtained GMPP location of the SRBL-TCT configuration was found to be superior to the SP, TCT, BL, HC and BL-TCT configurations. The obtained power at GMPP for the BL-TCT PV array configuration subjected to all five shading scenarios was 39.57 W, 23.89 W, 38.85 W, 38.05 W, 26.5 W. In the SRBL-TCT PV array configuration, the power at GMPP for all five considered shading scenarios as 44.31 W, 38.63 W, 42.44 W, 41.04 W and 40.93 W, respectively. The skyscraper methodology was simulated along with its application to a 9 × 9 size PV array and was matched to the TCT, DS and SDK arrangement using MATLAB/Simulink in [31]. Under PSCs, the PL for skyscraper, TCT, DS and SDK was 0.305%, 0.35%, 0.325% and 0.316%.

1.2. Novelty of Work

The I-SDK PV array enhances PV system performance in terms of a higher GMPP, FF and minimal PL. Furthermore, the I-SDK PV array arrangement is a viable solution for a number of reasons:
  • The suggested I-SDK configuration improves performance compared to standard setups because it more evenly disperses the shadow impact throughout the PV array.
  • The utility and functionality of the proposed I-SDK configuration are tested by a comprehensive experimental study under distinctive shading scenarios and validated the MATLAB/Simulink results, i.e., GMPP locations, PL, ER and FF.

2. PV Modelling and Array System

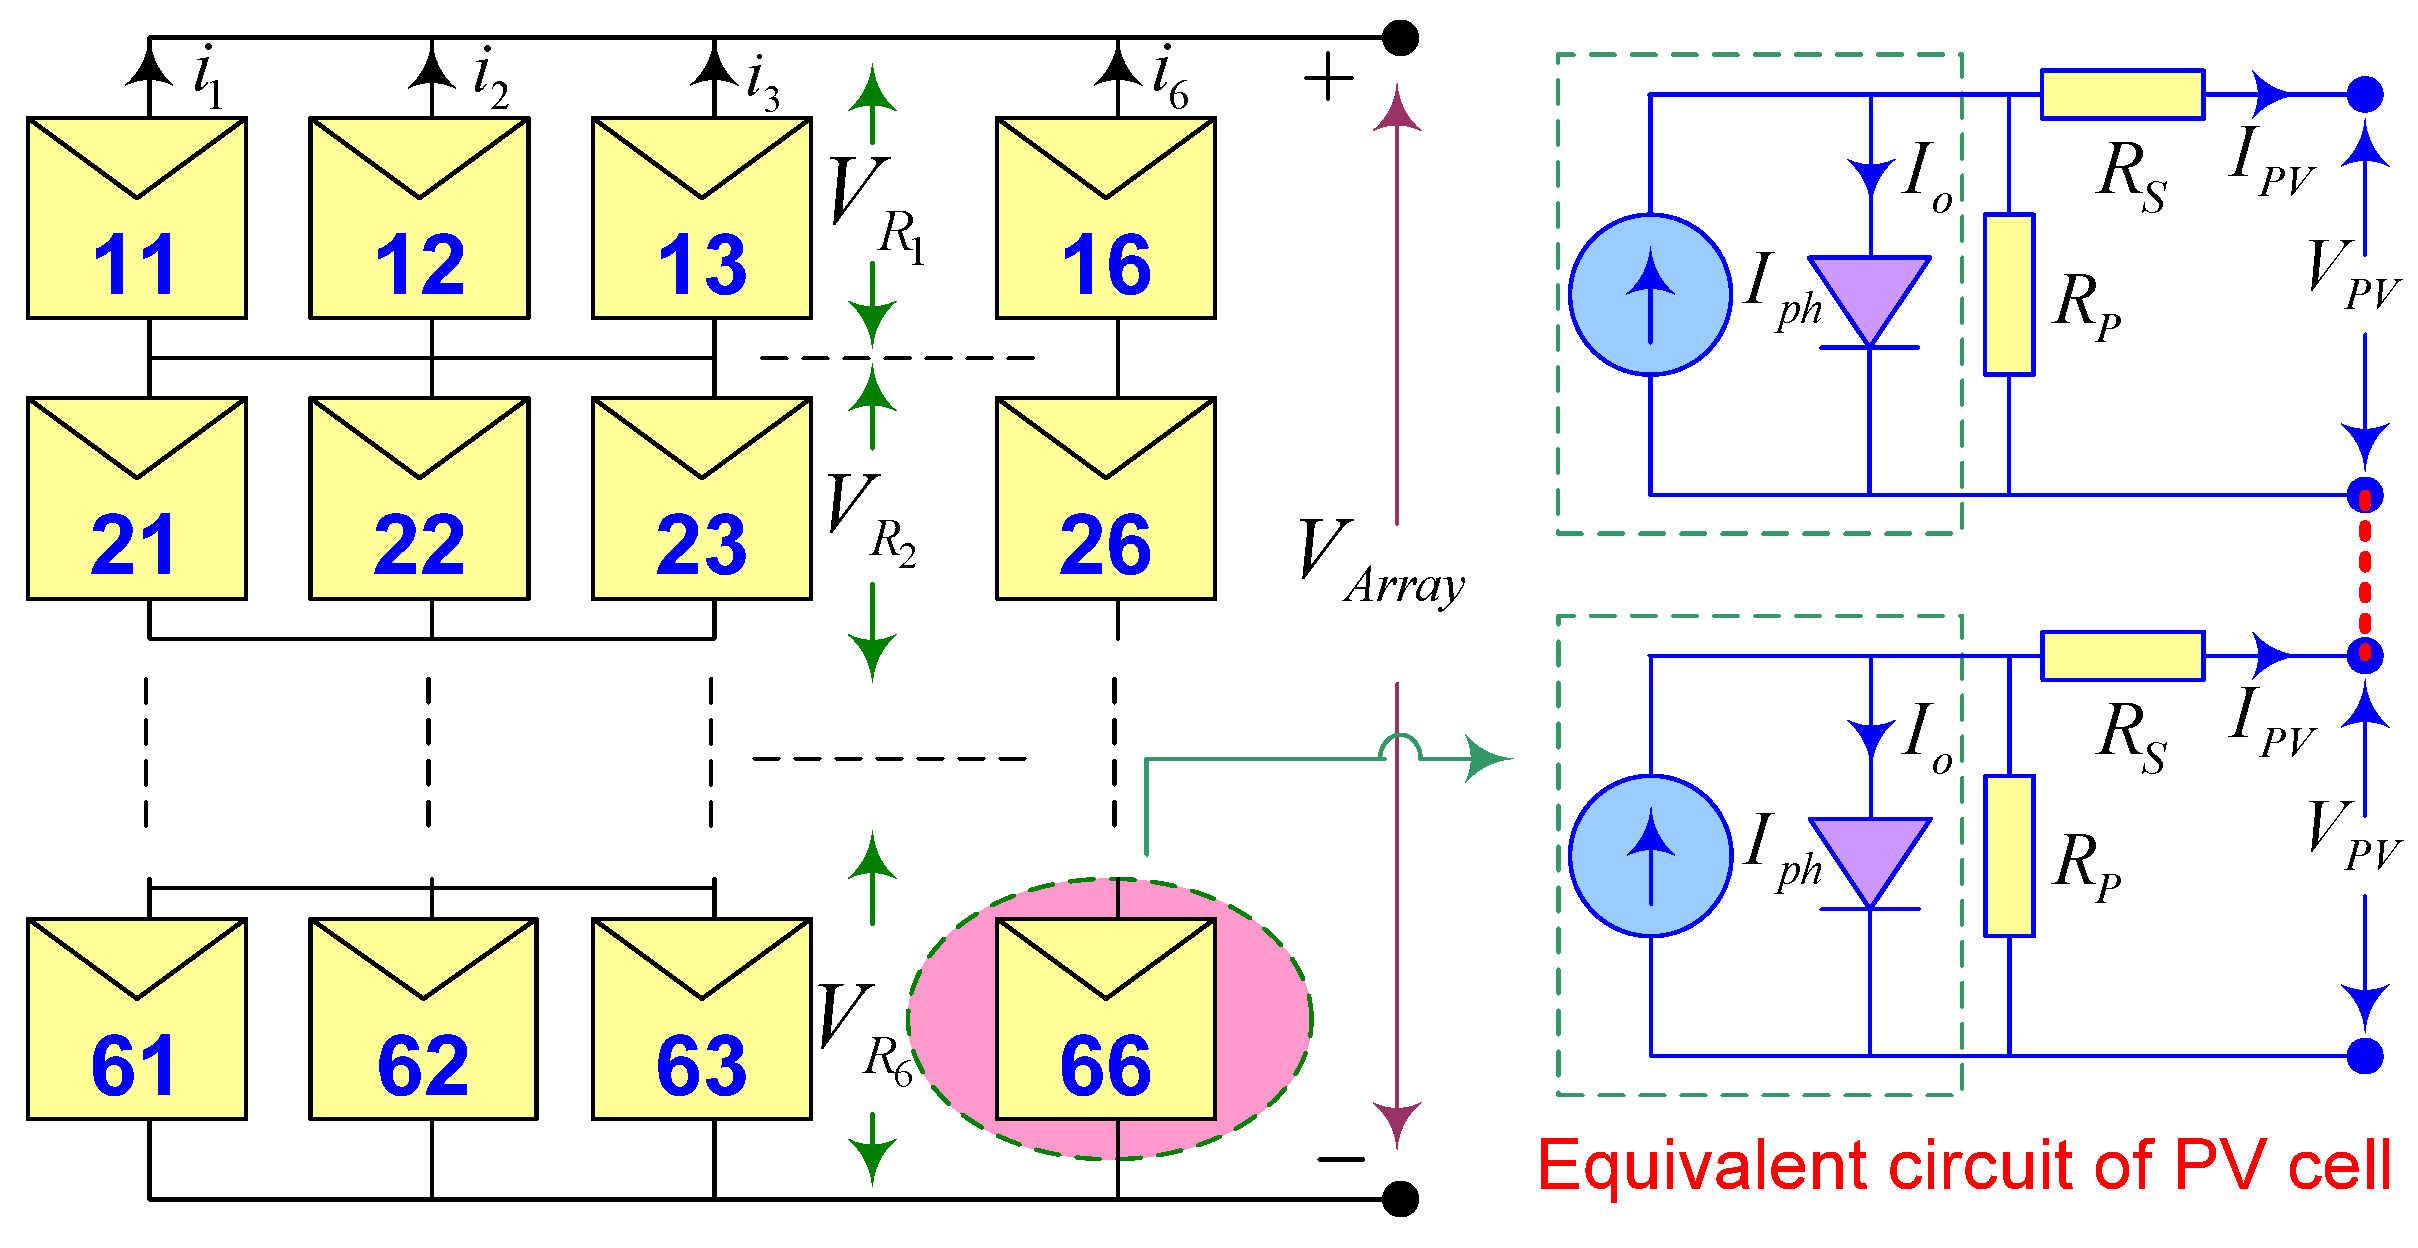
2.1. PV Cell Modeling

The PV module’s mathematical analysis was used for MATLAB/Simulink modeling of the PV cell and electrical equivalent circuit of a single diode model, as shown in Figure 1.
The output current of a solar PV cell is given in Equation (1) [19] as
I P V = N p p I P V n I O exp V P V + I P V R S V t N S S 1 V P V + I P V R S R P
where ‘ I P V ’—PV cell current, ‘ R p ’—parallel resistance, ‘S’—series resistance, ‘ I O ’—reverse saturation current, ‘ V t ’—thermal voltage, ‘ N S S ’ and ‘ N p p ’ are the number of cells connected in systematic order (series and parallel).

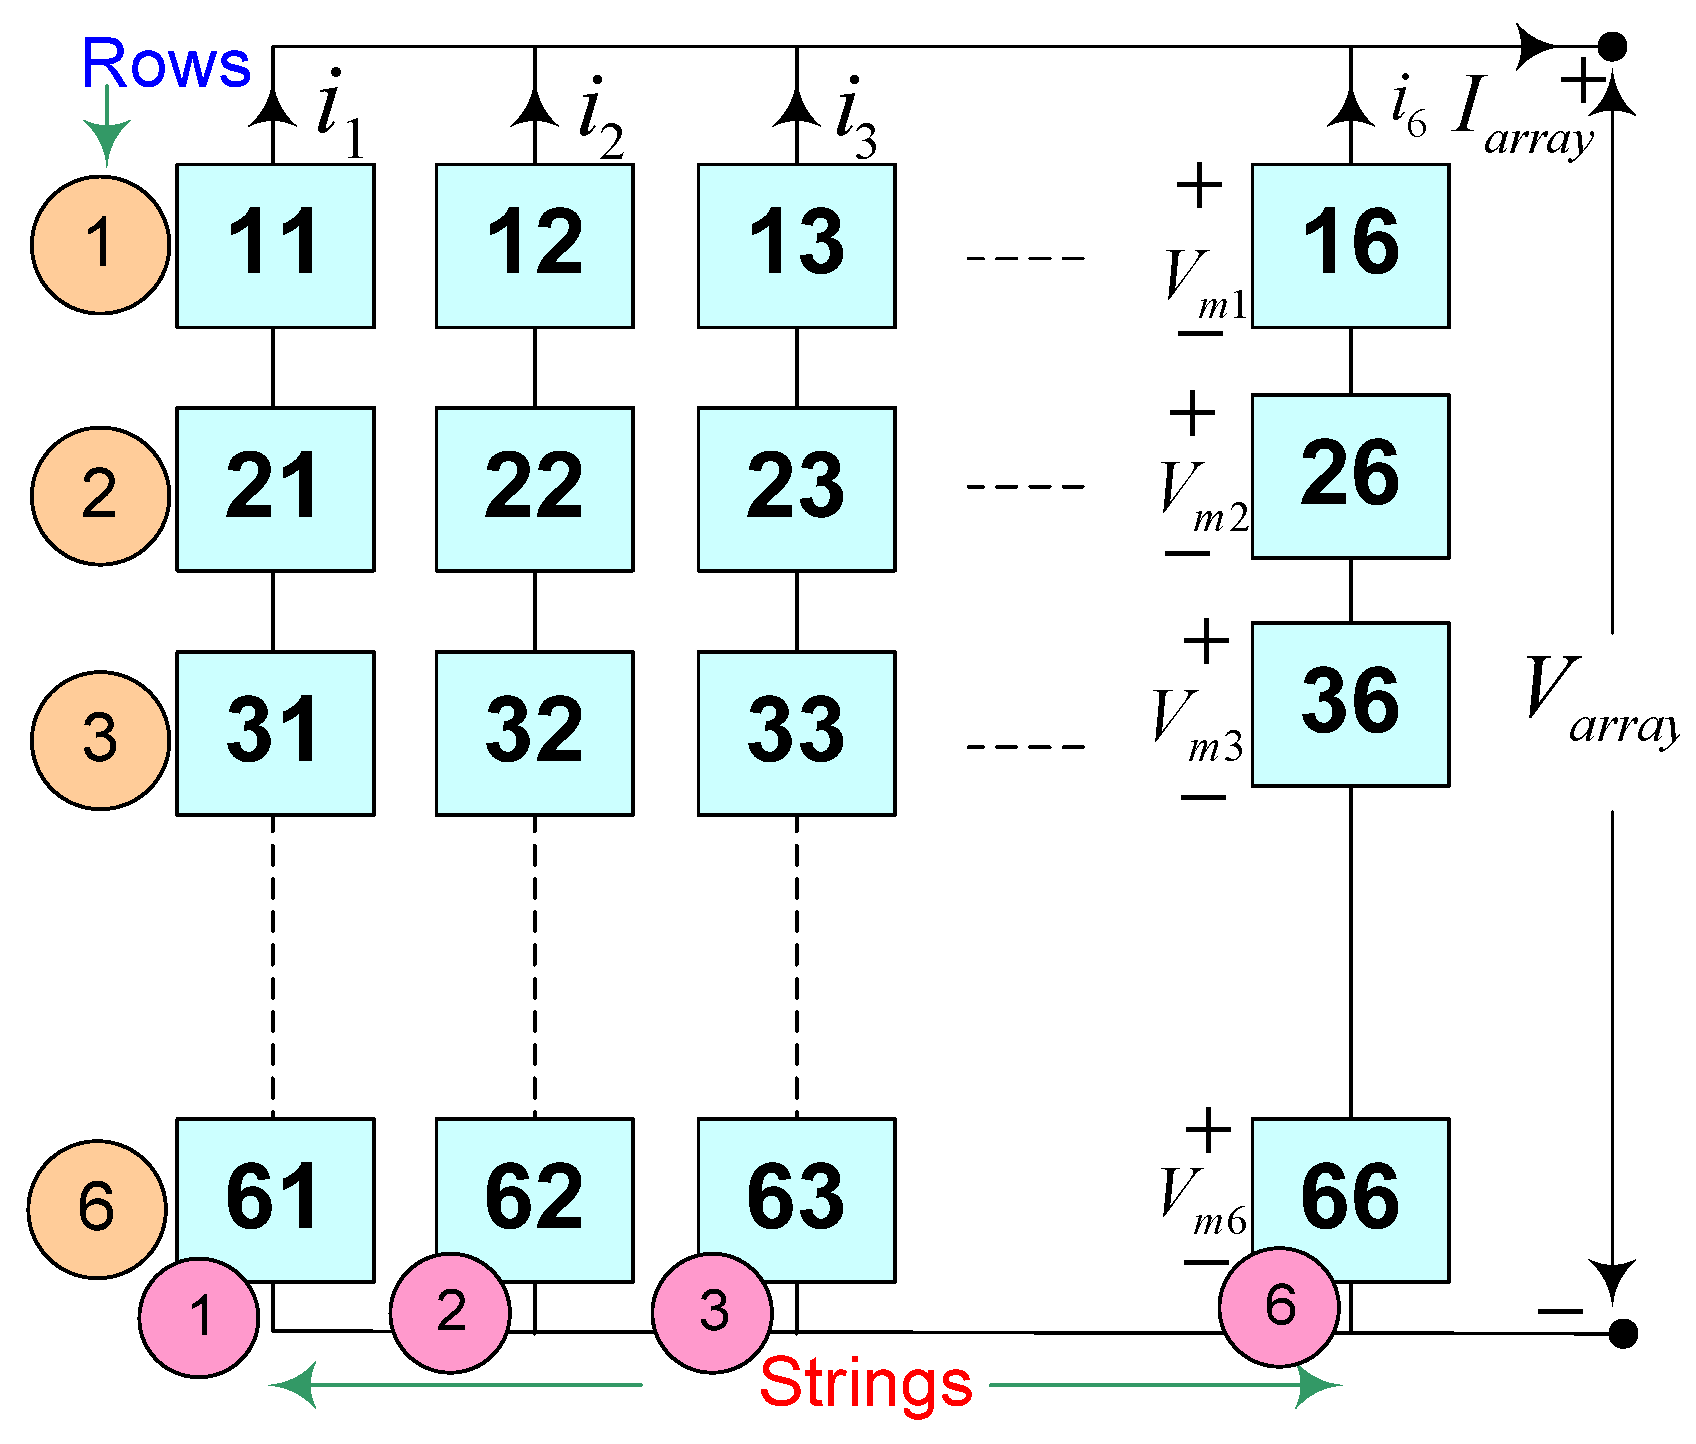
2.2. PV Array Configurations: Conventional

(a)
Series-parallel configuration
In a PV array, a finite number of PV modules are arranged in parallel strings to increase the voltage and current to meet the required load power demand. The electrical arrangements are used to show the 6 × 6 size SP configuration in Figure 2 as
(b)
Total-cross-tied configuration
The TCT electrical arrangement is an extended modification of the SP configuration by means of fixing ties across the parallel strings. This cross-tied-based modification is responsible for enhancing the current through each parallel string and constant voltage during PSCs. Mathematically; voltage analysis is expressed for the PV array in Equation (2).
V array = k = 1 6 V mk
where V m k refers to the voltage (maximum) at the k t h row. Each string of the PV modules is linked in parallel; therefore, the total current drawn by the PV array is the sum of the individual currents drawn by each module in the array. Furthermore, a mathematical approach is applied to each node using Kirchhoff’s current law. As a consequence, the array current ( I a r r a y ) can be expressed in Equation (3) as
I a r r a y = q = 1 6 I k q I k + 1 q = 0 ,   p = 1,2 , 3 , 9
where k and q are the number of rows and columns in the considered 6 × 6 size PV array. Figure 3 depicts the TCT array’s electrical configuration of PV modules.

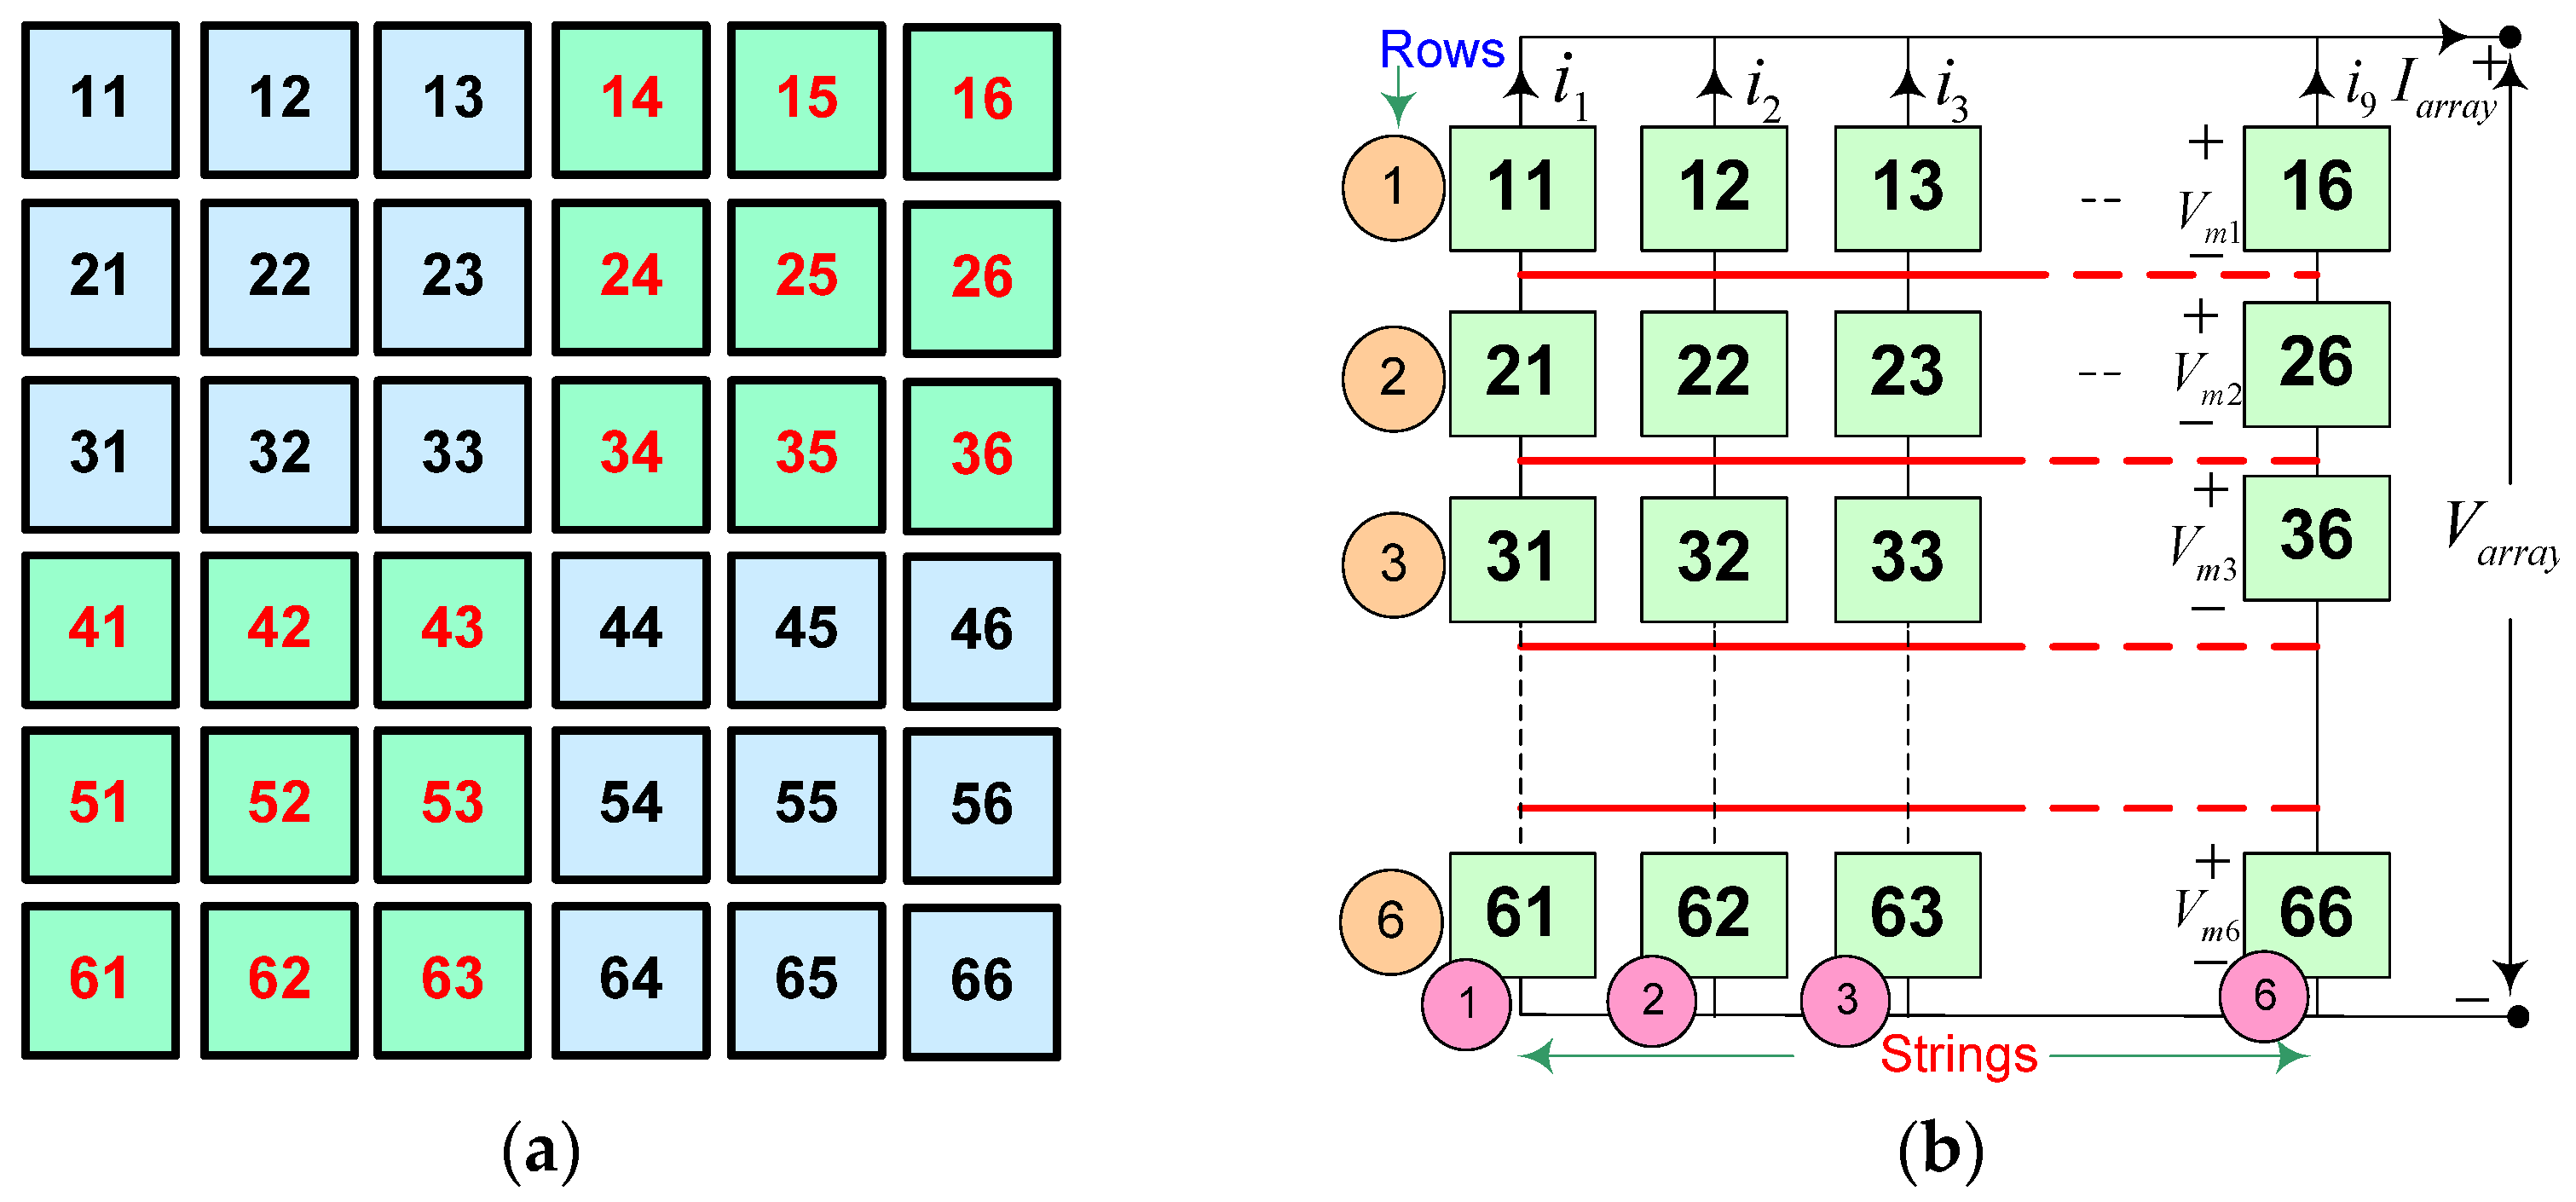
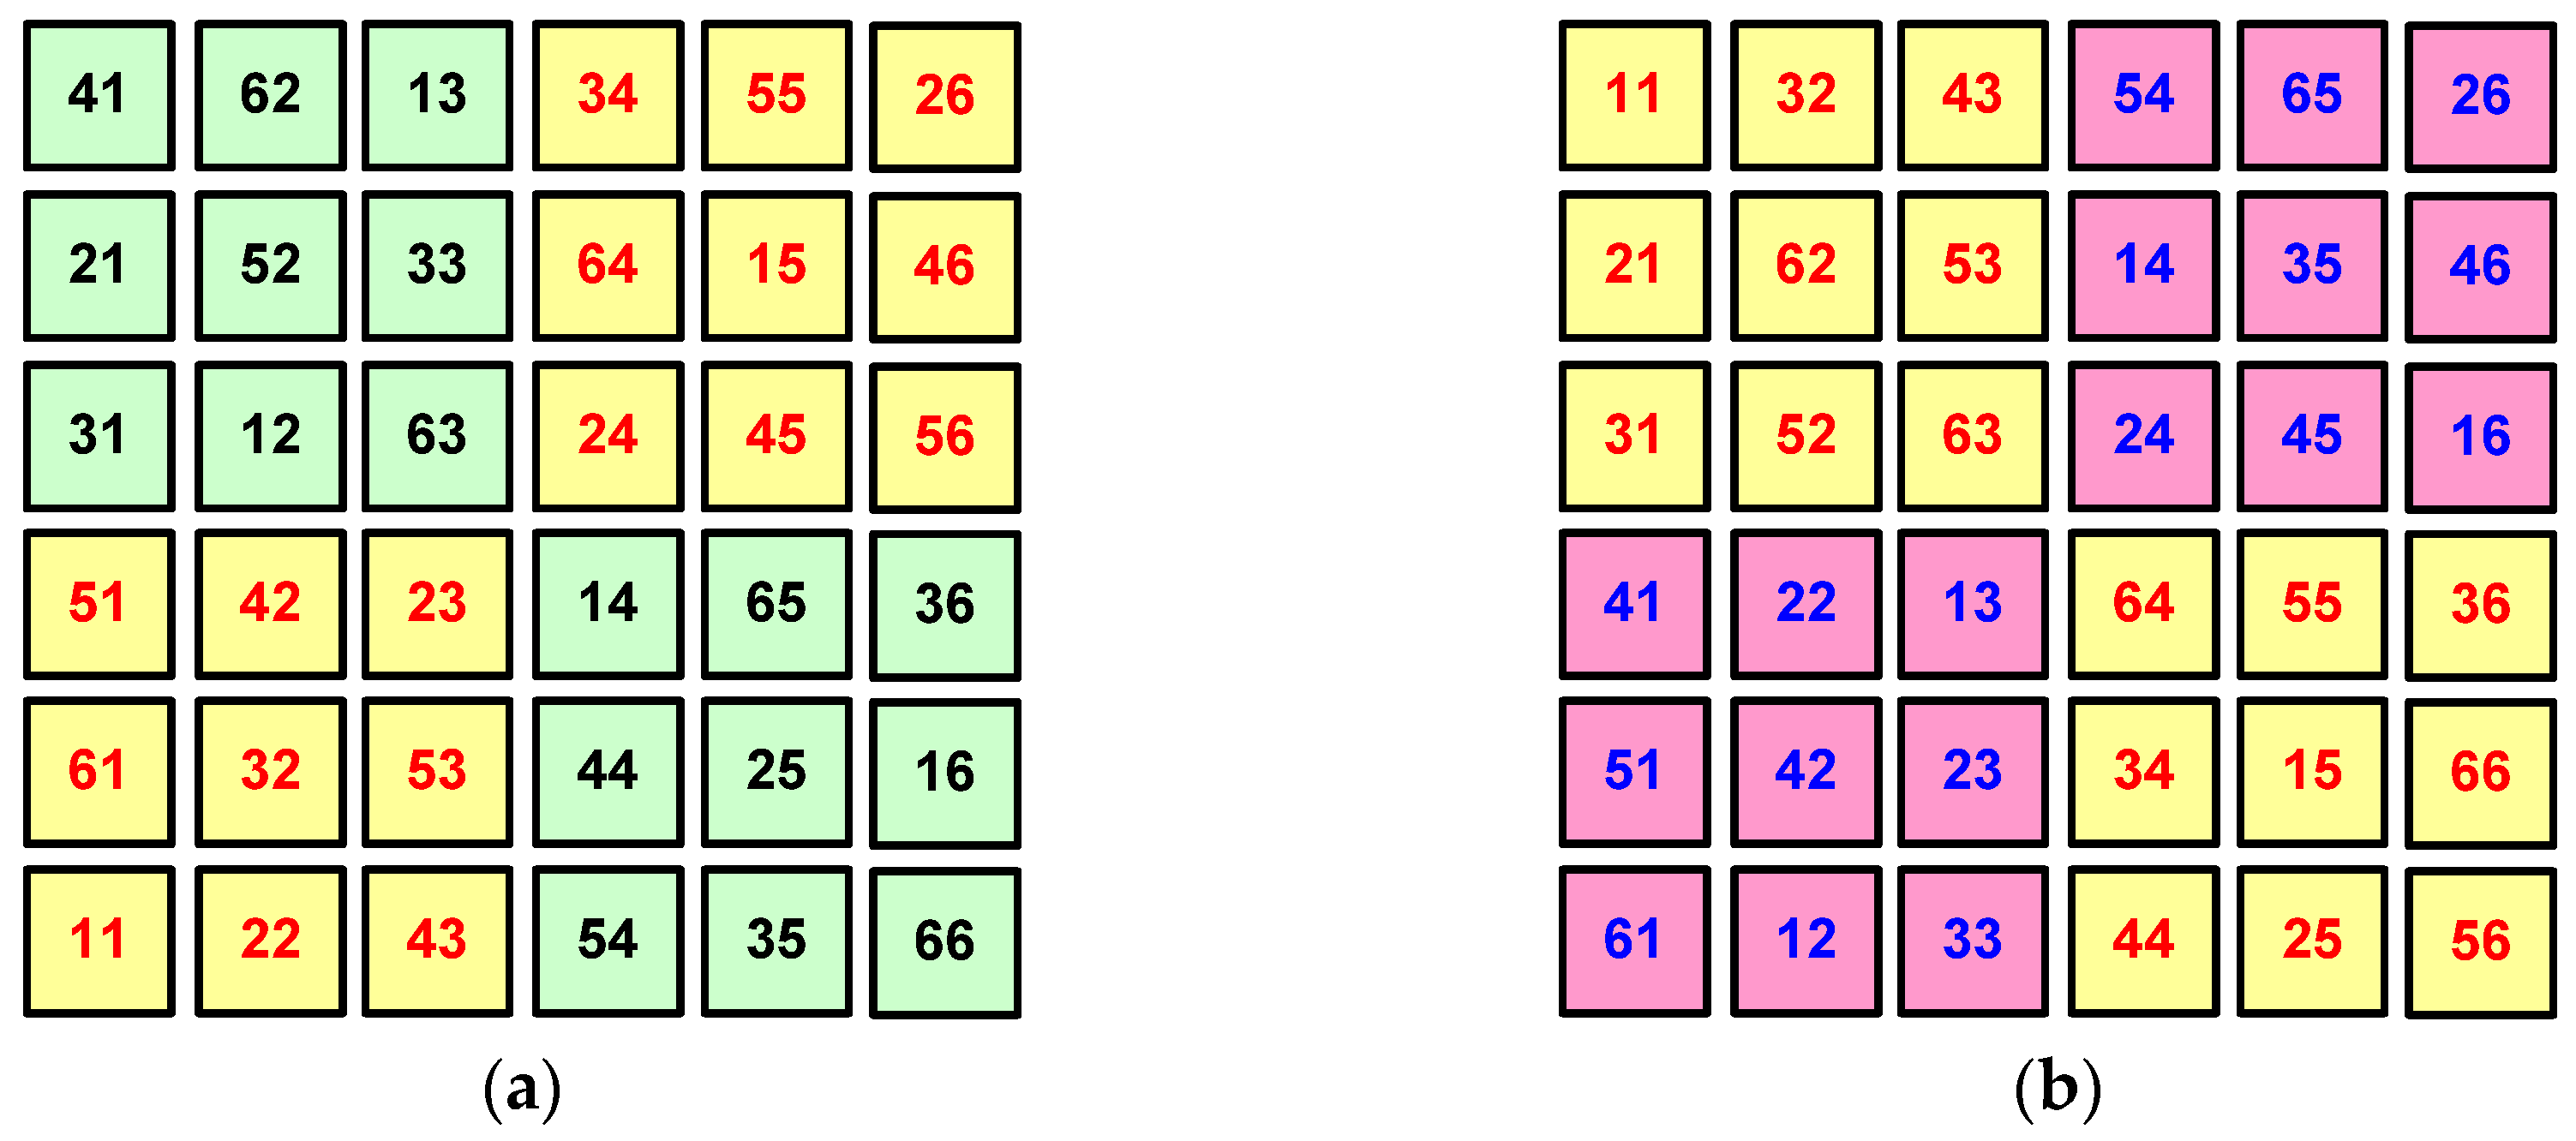
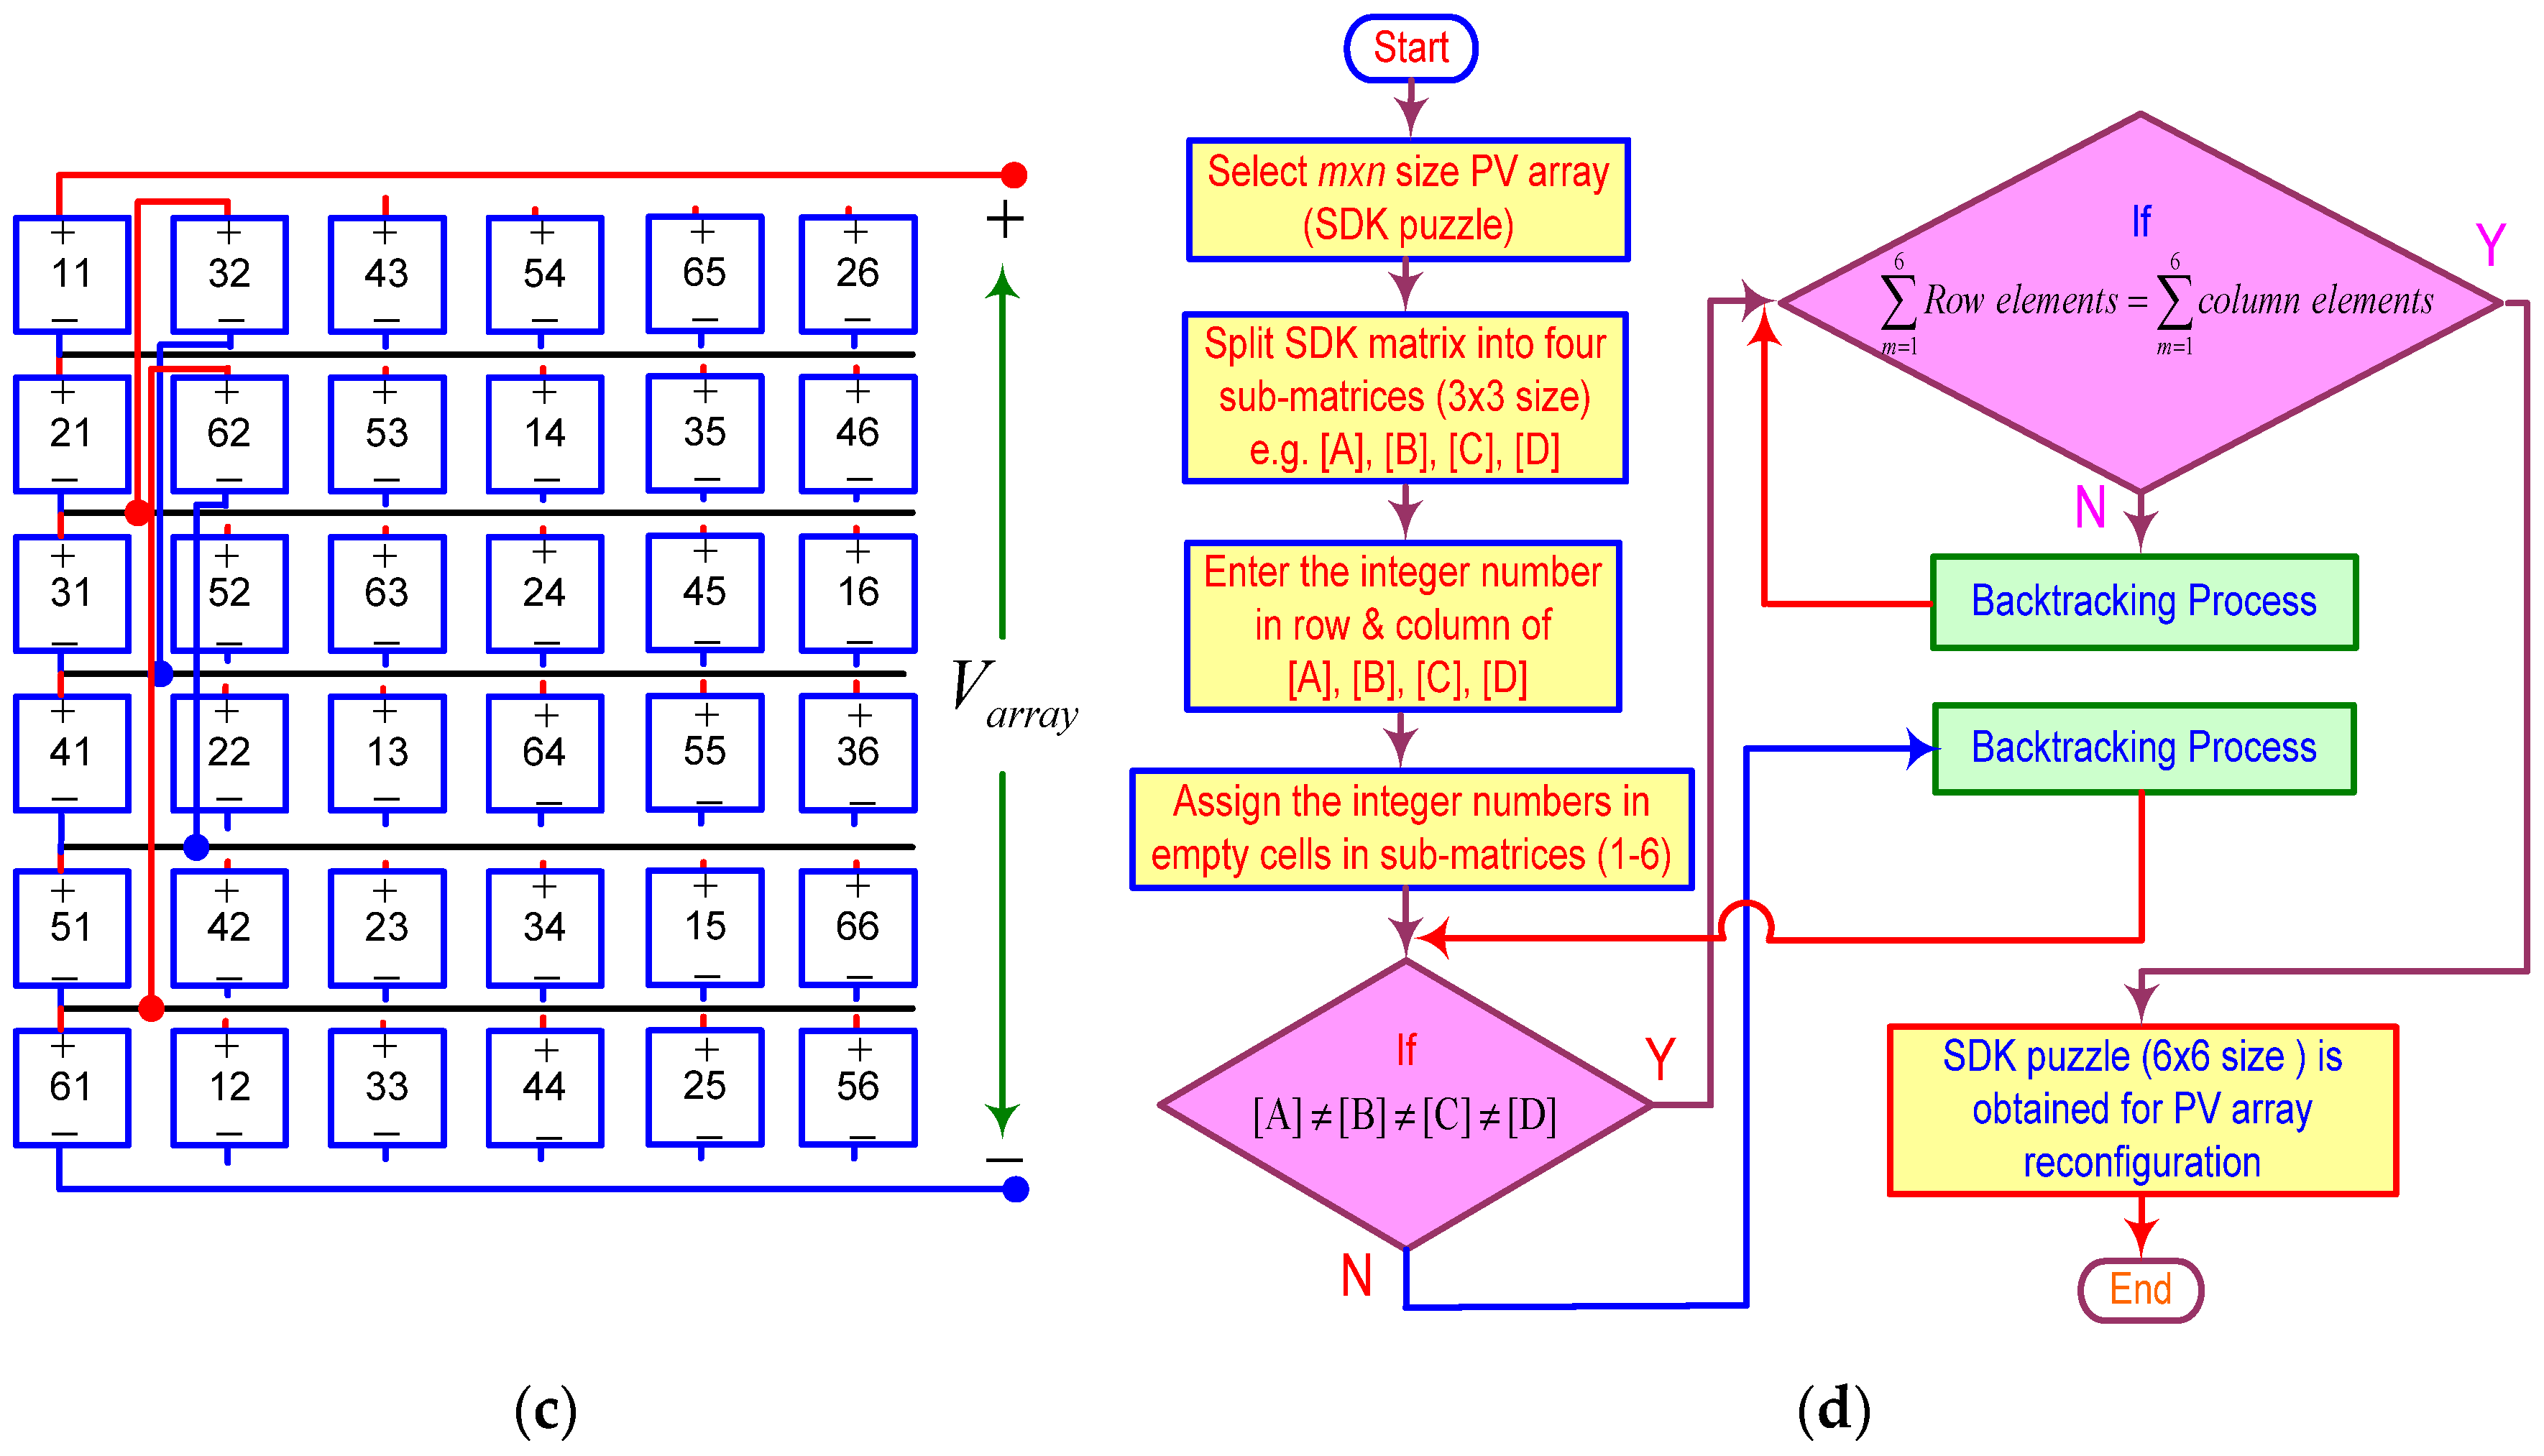
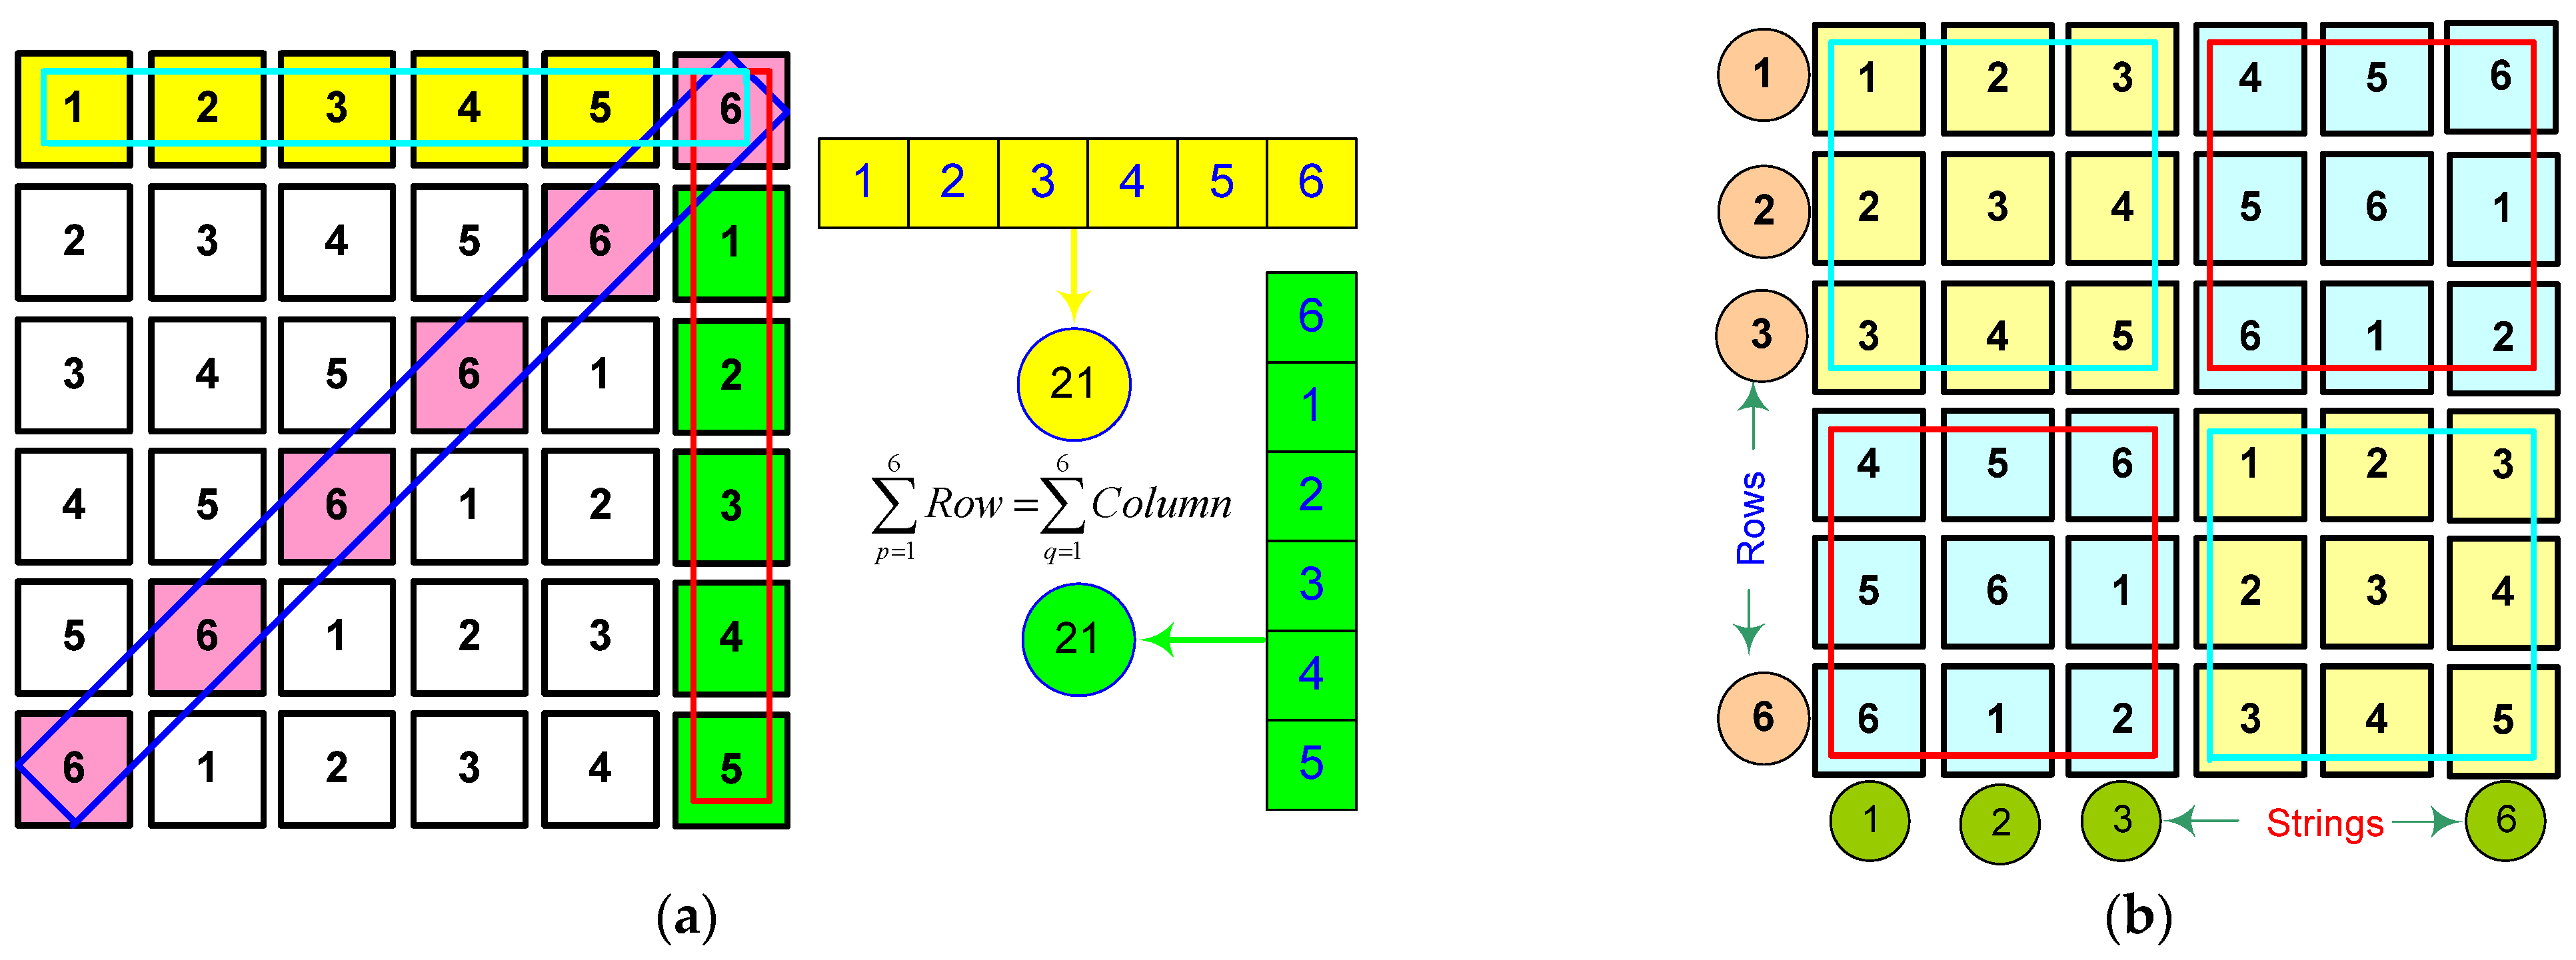
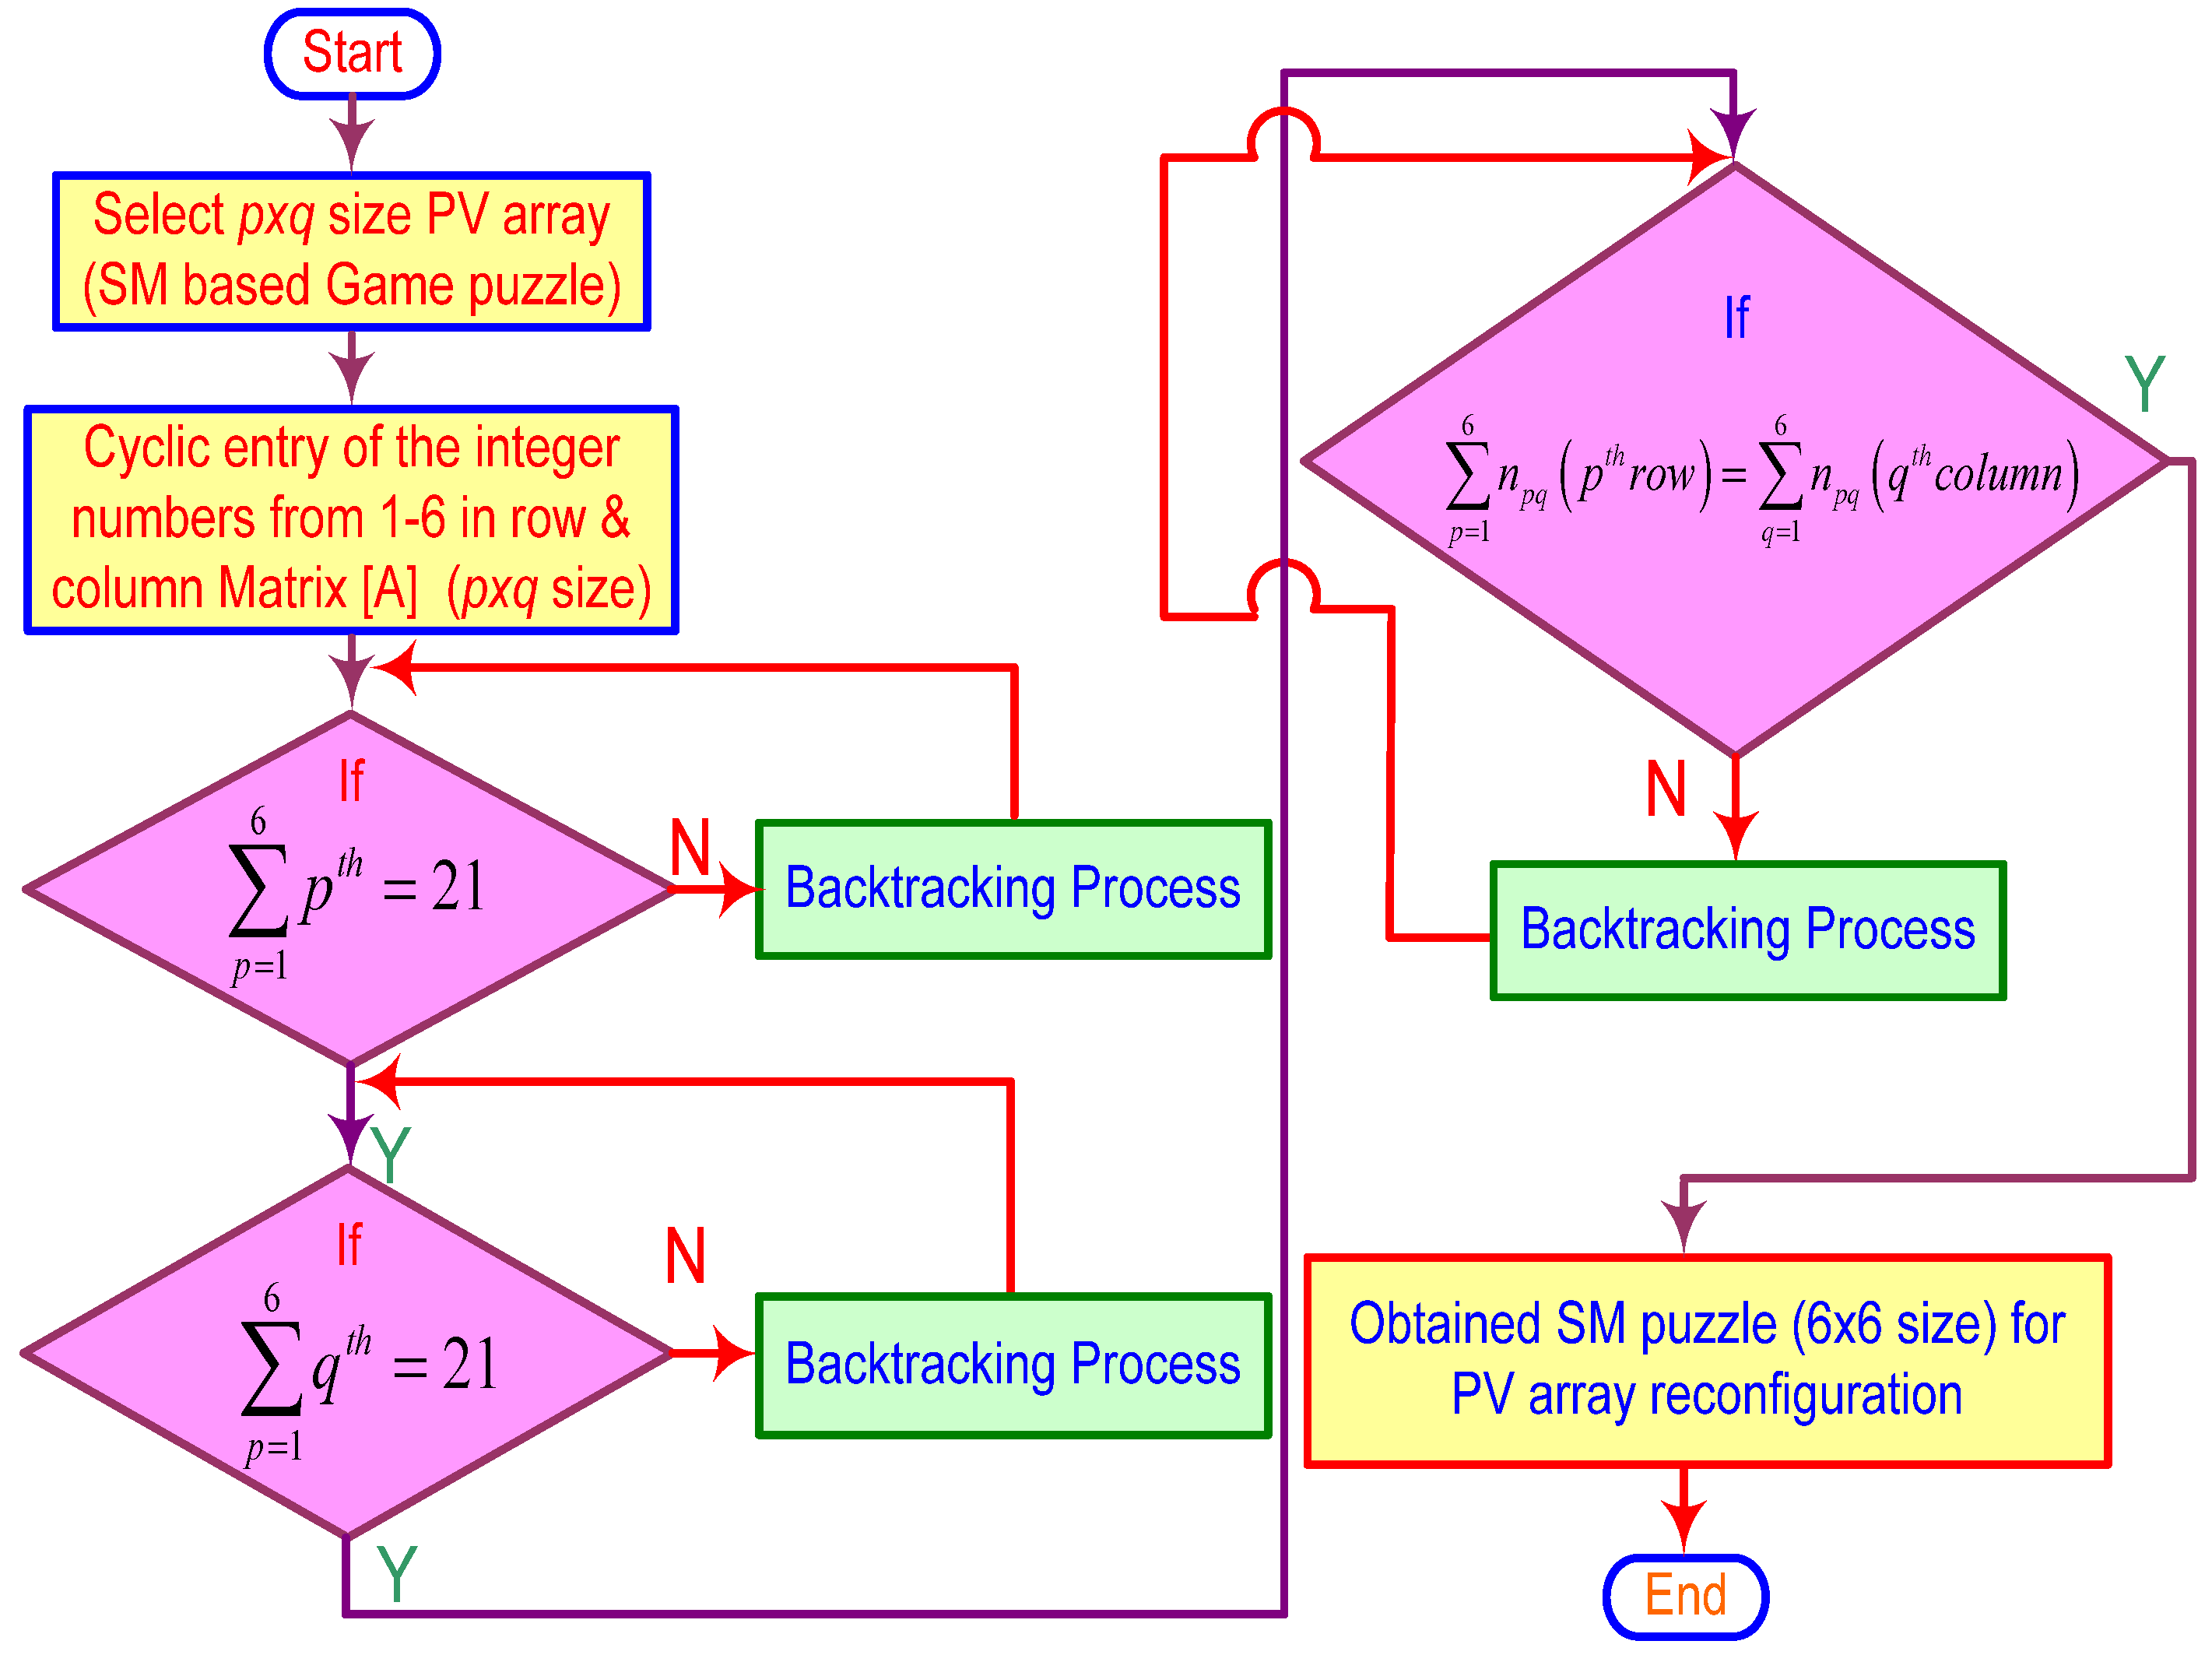
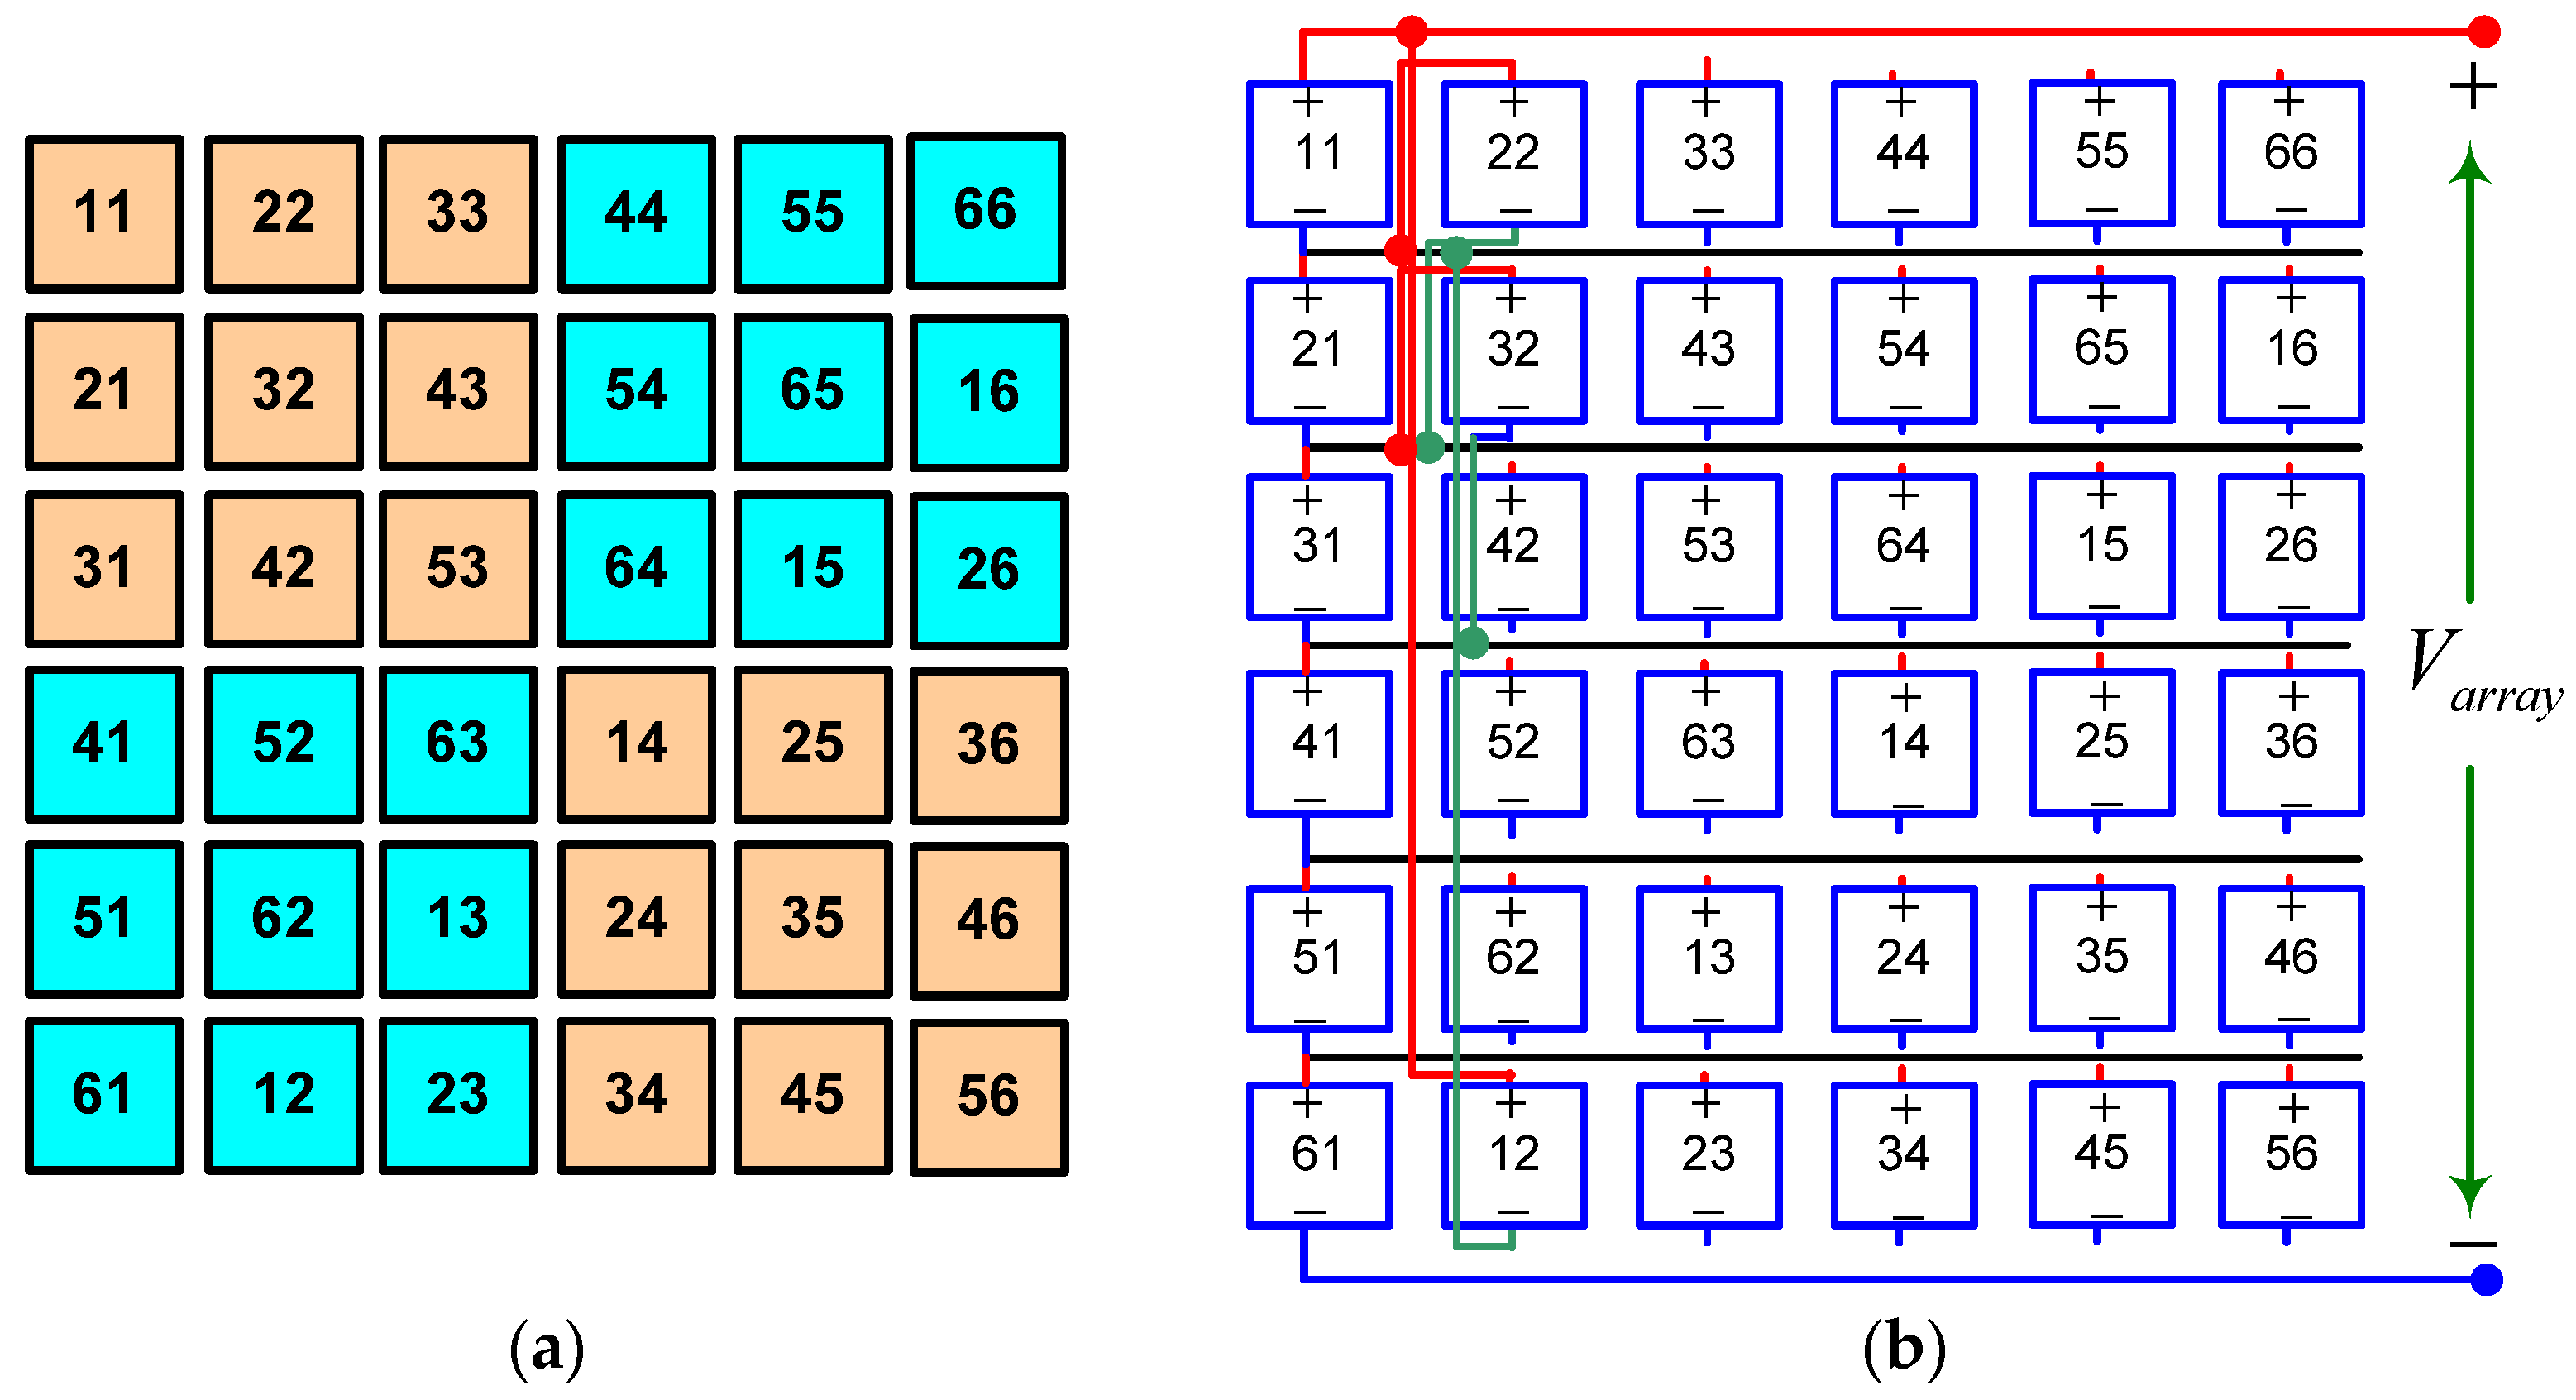
2.3. Game-Theory-Based PV Array Configurations

(a)
SDK and I-SDK configurations
As the shadow is diffused over the array, the game-theory-based SDK layout guarantees that mismatch losses are minimized. The wiring connections are completed once the panels have been properly arranged and they stay unmodified. This decreases computing difficulties while also preventing the overuse of sensors and switches [33].
The SDK change in columns 2–6 is known as the I-SDK puzzle. By repositioning the PV modules without disturbing the electrical arrangement, the suggested I-SDK layout is implemented in the TCT PV array. In this game puzzle, higher dispersion is found based on the optimal placement of all the integer numbers in an array. This integer placement modification is responsible for higher shade dispersion. The SDK and I-SDK puzzles and approach are depicted in Figure 4a–d as
(b)
Symmetric matrix-based configurations
Cyclic arrangement of integer numbers from 1 to 6 is carried out to establish the SM game-theory-based arrangement. The summation of the considered integer numbers in each row and column is found to be equal as per SM development guidelines. In addition to that, either of the diagonal elements keeps repeating within it. Figure 5a depicts all of the assets of the 6 × 6 size SM as
The summation of all the items in each particular row/column, according to SM characteristics, is 21. Furthermore, in Figure 5b, there is a repetition of 3 × 3 size square submatrices.
To represent the row-column summation rules, mathematical assumptions are made. In this context, the SM size is considered in the order of p × q. Moreover, the nth element can be placed corresponding to the pth and qth row-column, respectively. So, the location of the PV module (npq) in an array can be written in a generalized way and expressed in Equation (4) as
n p q , where   p = n o .   of   row ( p = 1 , 2 , .... 6 ) q = no .   of   column ( q = 1 , 2 , .... 6 )
In Figure 5a,b, we see the mathematical equations for four distinct cases of row-wise summing and that are accomplished using Equation (5) as follows:
p = 1 6 n p q ( Summation   for   p th row ) = q = 1 6 n p q ( Summation   for   q th column )
The above Equations (4) and (5) are involved in the guidelines to achieve the 6 × 6 size SM setup, and the scientific method to establish the SM is shown in Figure 6 as
In SM, there are six rows and columns in a 6 × 6 PV array, respectively. As per the nomenclature shown in Figure 7a, the first digit of each individual PV module depicts the row count, while the second digit depicts the column count. It is an easier nomenclature-based methodology to understand the electrical arrangements of PV modules in an array. In Figure 7b, the PV module locations are migrated using the recommended SM structure but the electrical contacts of the PV panels within PSCs remain unchanged.

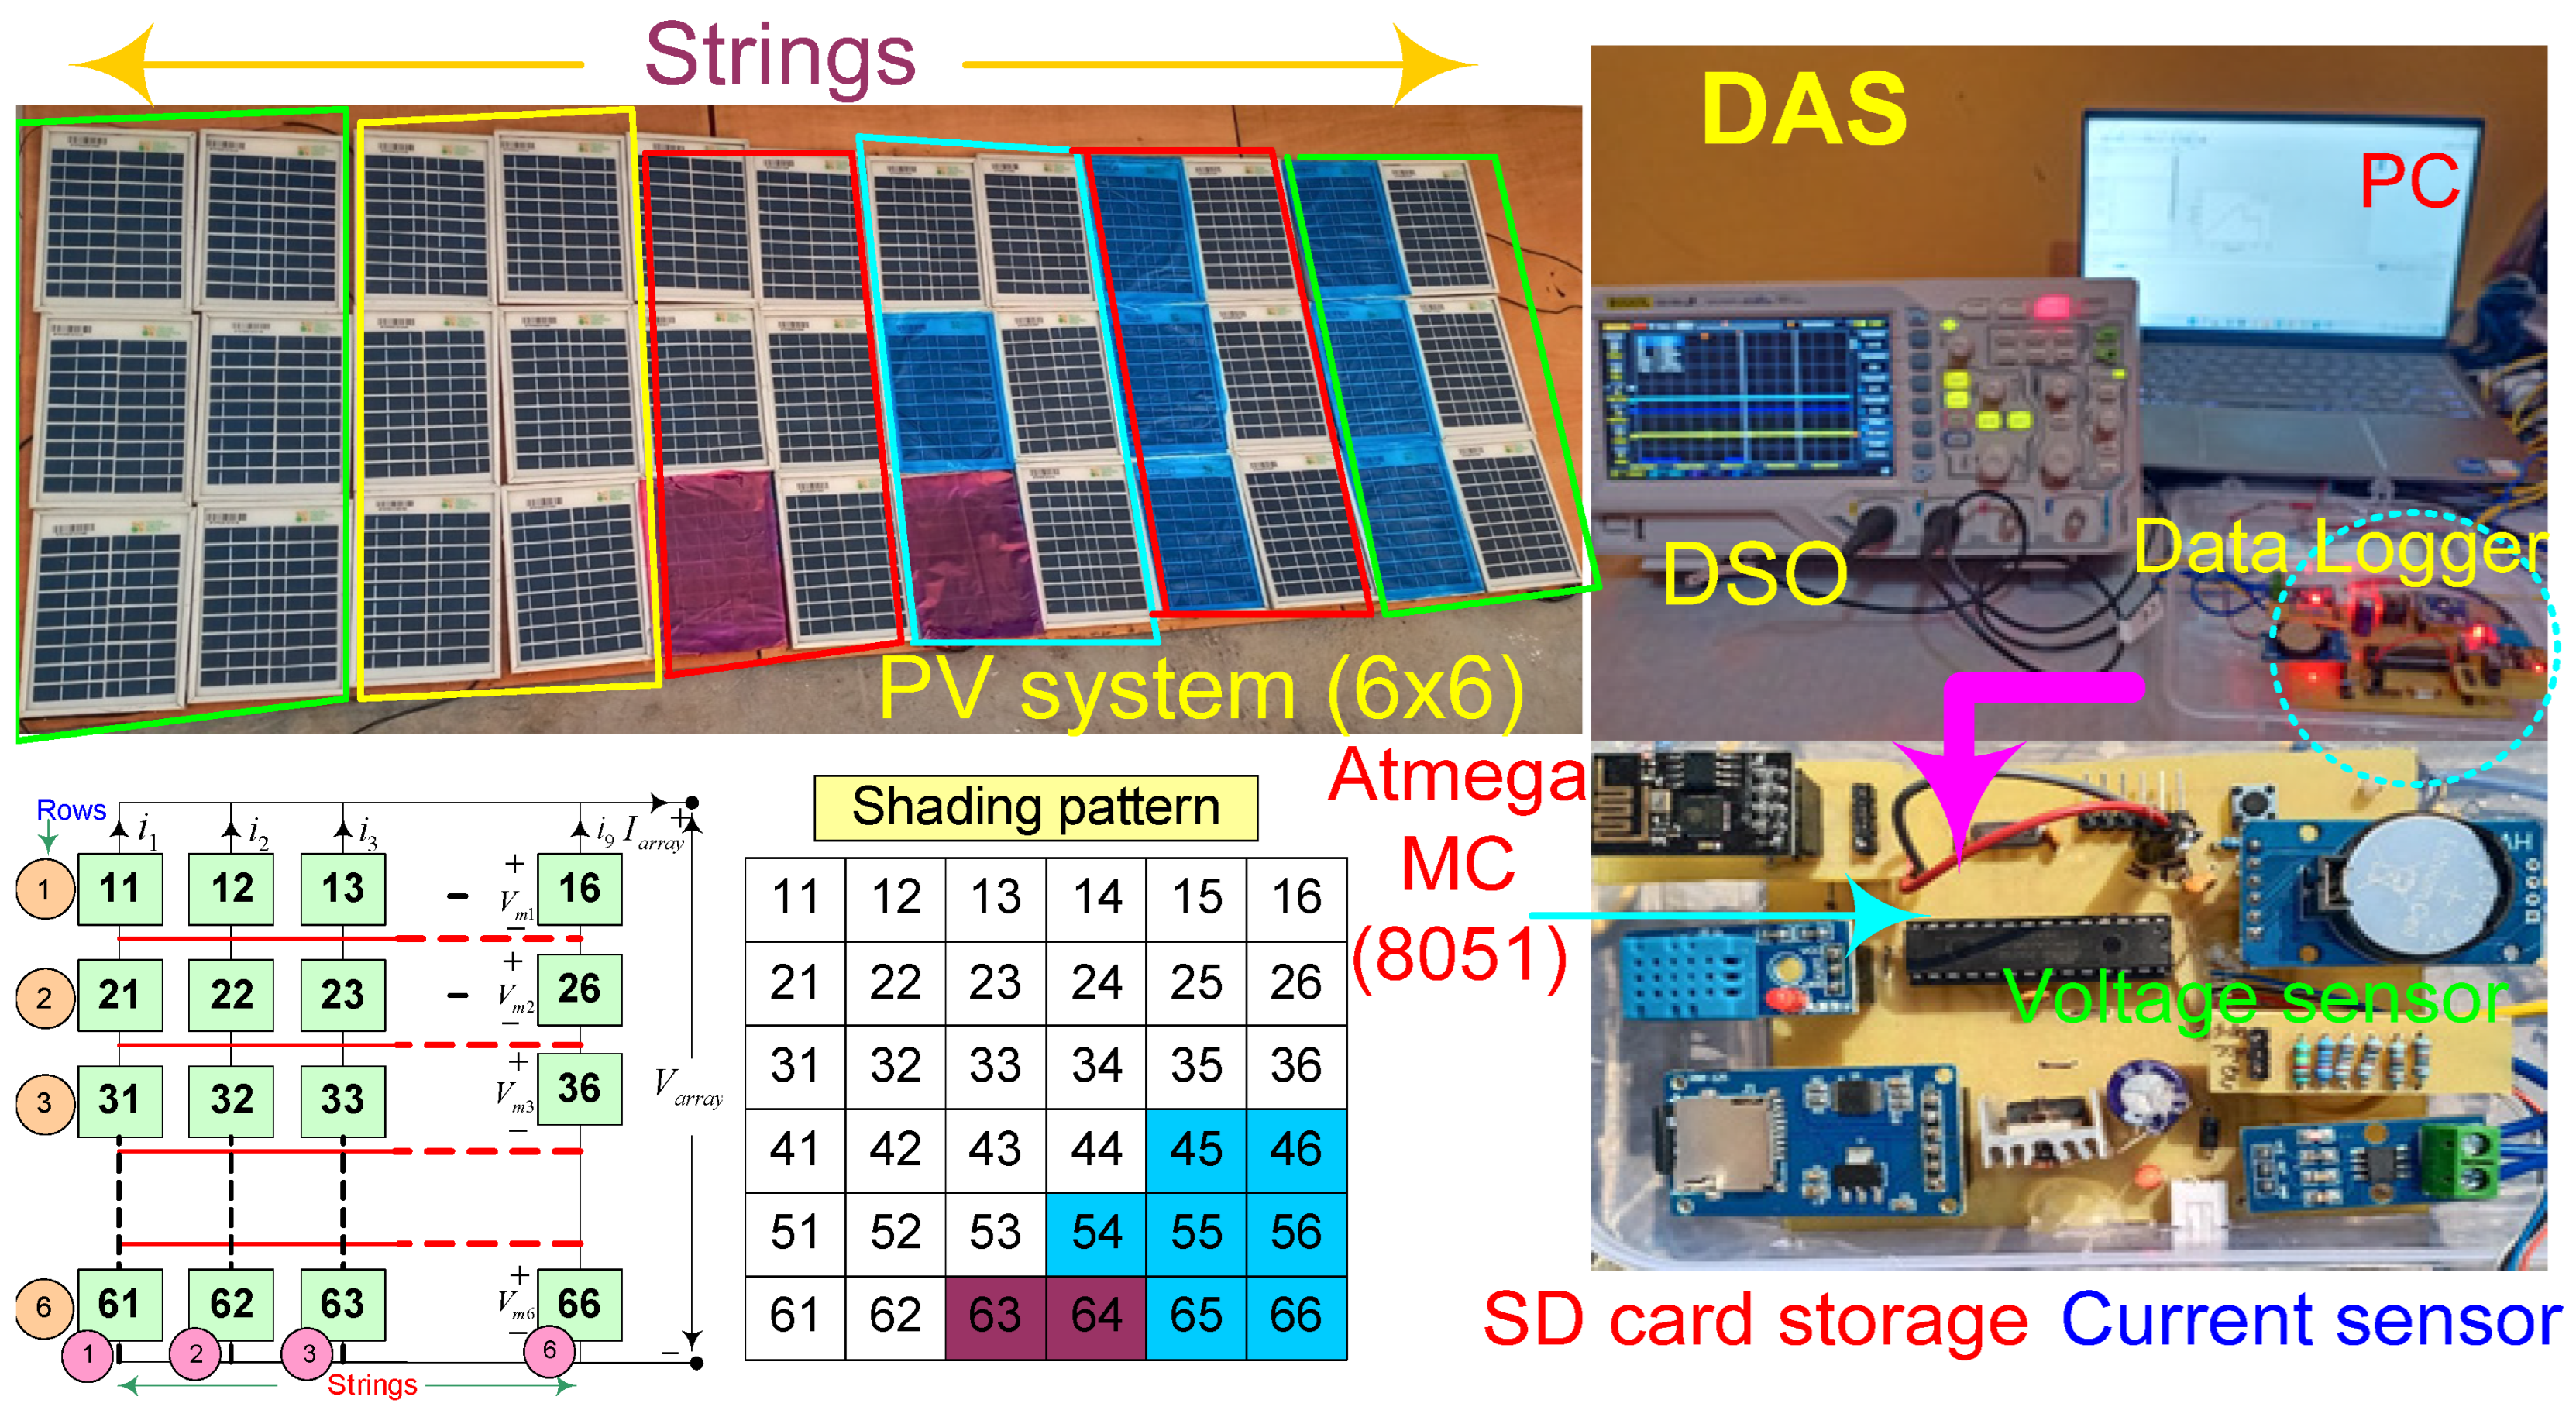
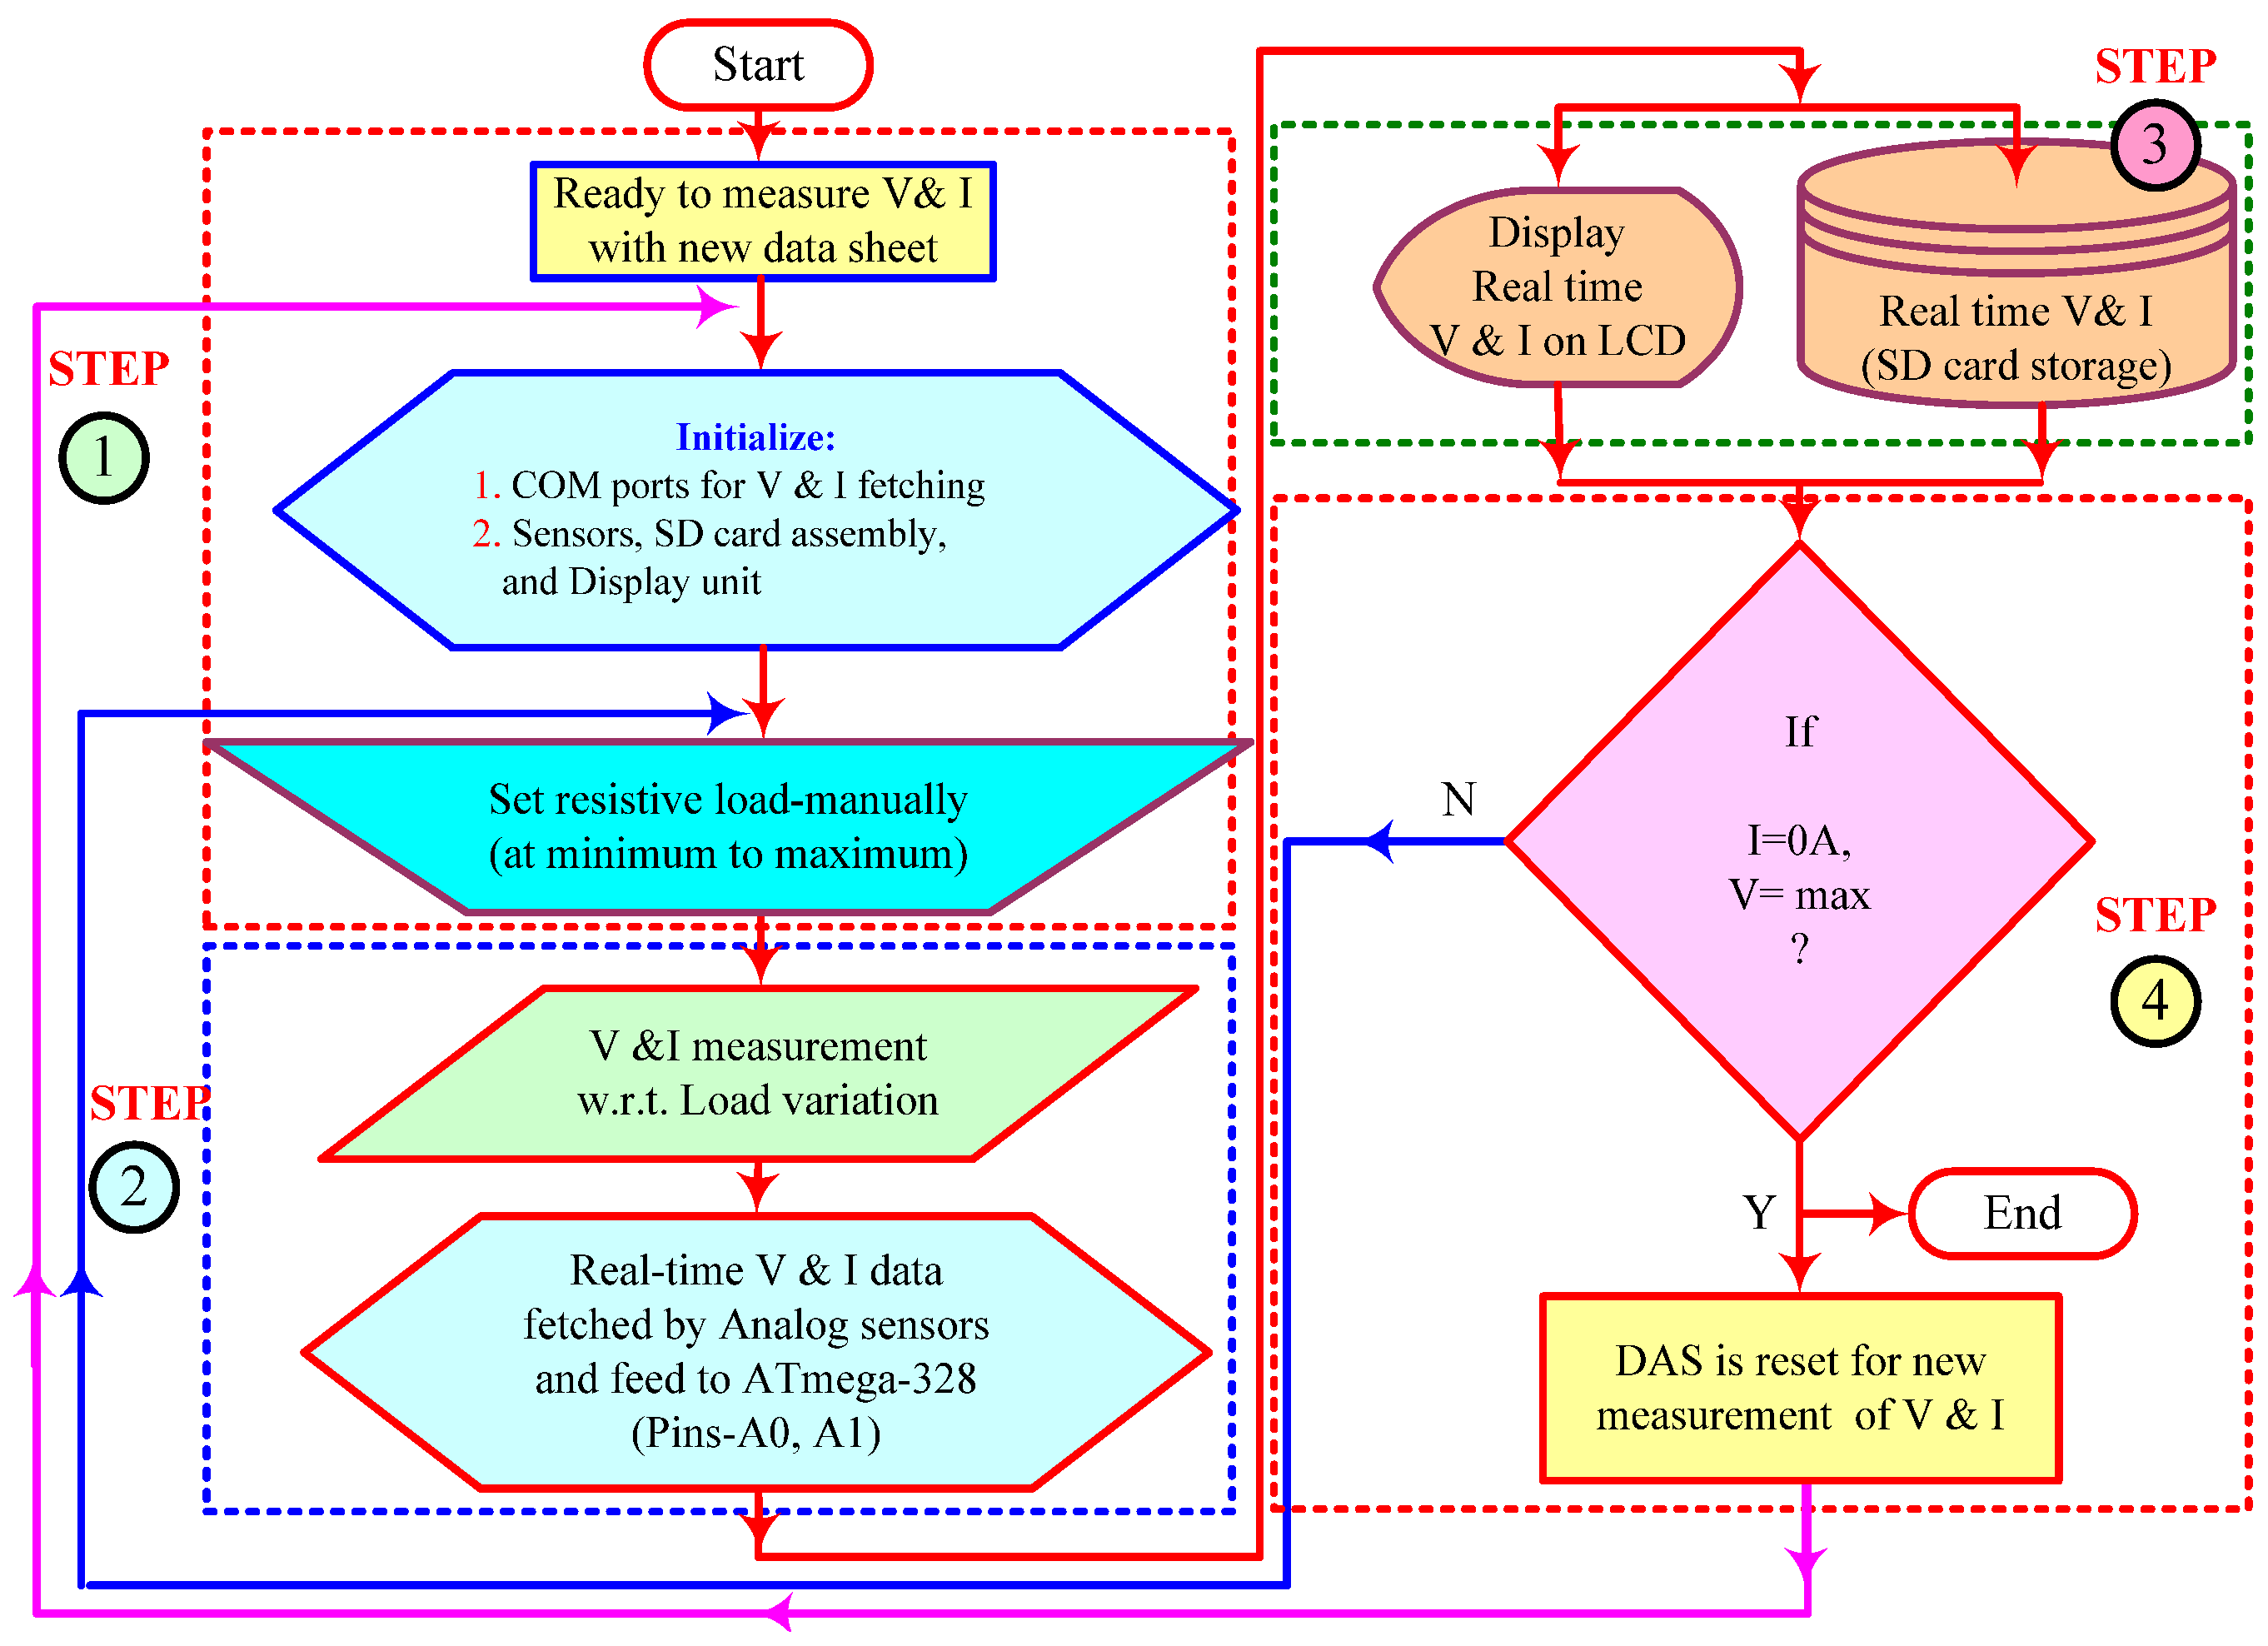
2.4. Experimental Setup

MATLAB/Simulink modeling and experimentation utilize a commercially available 5 W PV module, as shown in Table 1.
For performance validation, an experimental setup is established with 6 × 6 size PV array configurations with the assistance of an embedded-based data acquisition system (DAS) for logging real-time electrical parameters. The performance characterization in terms of I-V and P-V curves is performed for extensive performance analysis in different realistic shading scenarios. The above experimental setup comprises mainly four sections such as (a) PV system (6 × 6 size), arranged in SP, SDK and I-SDK configurations; (b) variable resistive load (Rheostat: 800 Ω, 6 A); (c) self-developed DAS. The developed experimental setup is shown in Figure 8.
Using the AT-mega microcontroller (8051), a self-designed data logger is utilized, which includes analog voltage and current sensors for electrical data investigation. Realistic electrical performance parameters in terms of voltage and current are stored in a micro-SD card. These recorded data are used for I-V and P-V characterization and rigorous investigation of performance parameters. Figure 9 also depicts the working of the constructed data logger. The code has processes for measuring electrical characteristics that have been fine-tuned based on an assessment and data gathering that use a simple algorithm.

3. Performance Parameters and Shading Scenarios

This unique MPP is due to P-V curves and PSCs in PV modules in an array. The MPP tracking device function refuses to give the maximum power to the load because of redundant GMPP and LMPP. In the performance assessment under standard test conditions, maximum power and voltage were found to be 180.2 W and 58.09 V, respectively. Figure 10 shows the performance characteristics under uniform irradiances as a result of the P-V and I-V curves.

3.1. Power and Voltage at GMPP

During the PSCs, multiple power points, i.e., GMPP and LMPP, were observed on the P-V curve. The higher power value is known as “power at GMPP ( P G M P P ) ”. Furthermore, at which value of voltage, the higher power at GMPP is also called the “voltage at GMPP ( V G M P P ) ”.

3.2. Power Mismatch Loss

The power M L is represented as Δ P L and it is calculated based on the maximum power generated during the ideal irradiance scenario and PSCs [34]. The theoretical assessment of power ML is expressed in Equation (6) [17].
% Δ P L = P u n i f o r m   i r r a d i a n c e P P S C P u n i f o r m   i r r a d i a n c e × 100

3.3. Power Loss

Theoretically, the evaluation of PL is measured by the difference in maximal power produced between perfect and nonuniform irradiation. The calculated PL is expressed in Equation (7) [17] as
P L = P m a x   a t   I d e a l   I r r a d i a n c e P G M P P   a t   P S C s

3.4. Fill Factor

The FF is defined in Equation (8) [17] as the ratio of the generated GMPP at PSCs to the maximum rated capacity of the PV facility
F F = V m p p × I m p p V o c × I s c

3.5. Performance Ratio

This is a quality factor that indicates how much solar energy is efficiently used. It compares the actual and theoretical power production of a PV installation. The closer the PR is to 100%, the more efficient the PV plant. This nondimensional factor is defined in Equation (9) [18] as
P R = Y final Y ref
where Y final uses the following formula shown in Equation (10) to express the relationship between the total energy produced by an array (EA) and the absolute power produced by a PV panel P D C as
Y final = E A P D C
Whereas the “ Y r e f ” calculated by dividing the amount of insolation (HA) received by a panel over a given time period by the amount of irradiance received over the same time period at STC as shown in Equation (11) as
Y r e f = H A G

3.6. Execution Ratio

This is the ratio between the power at GMPP achieved at PSCs ( P G M P P ) and power achieved at STCs ( P m ) . The mathematical representation of ER is given in Equation (12) [18] as
% E R = P m   a t   P S C s P S T C × 100

3.7. Power Enhancement

The power enhancement of game-puzzle-based configurations is evaluated with respect to the existing TCT scheme and expressed in Equation (13) [18] as
% P E = P G M P P ( S M / S D K / I - S D K ) P G M P P ( T C T ) P G M P P ( S M / S D K / I - S D K ) × 100

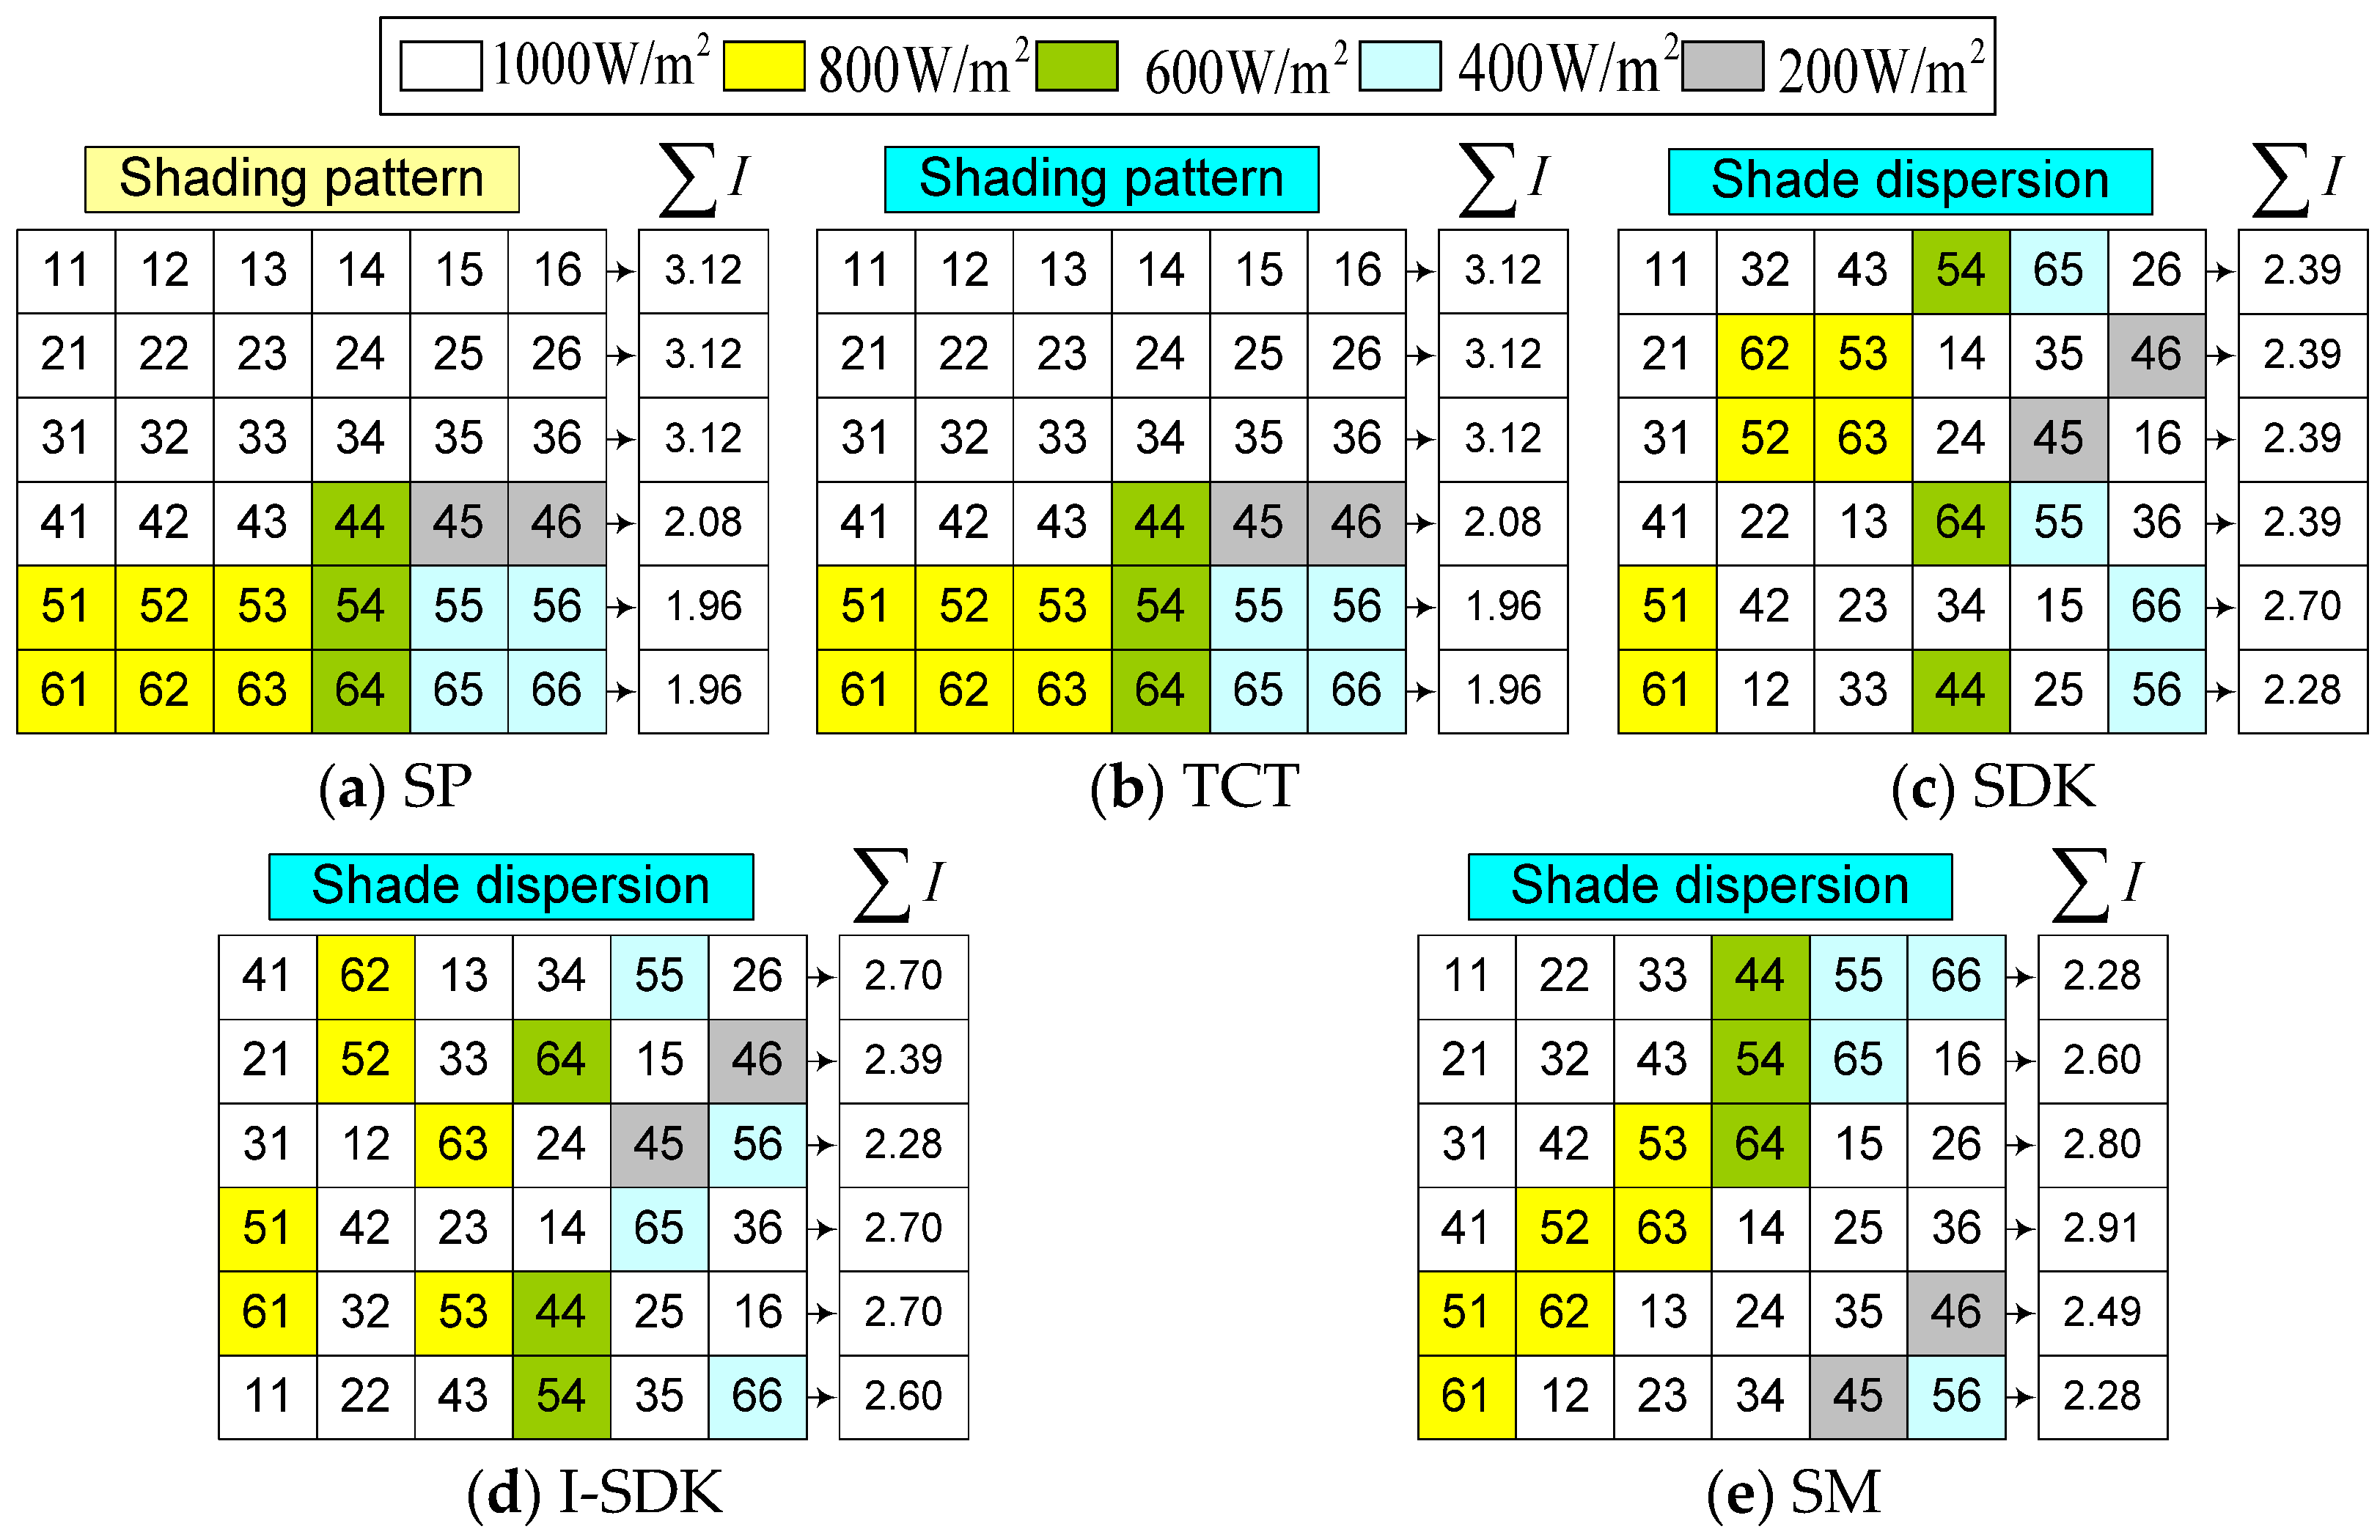
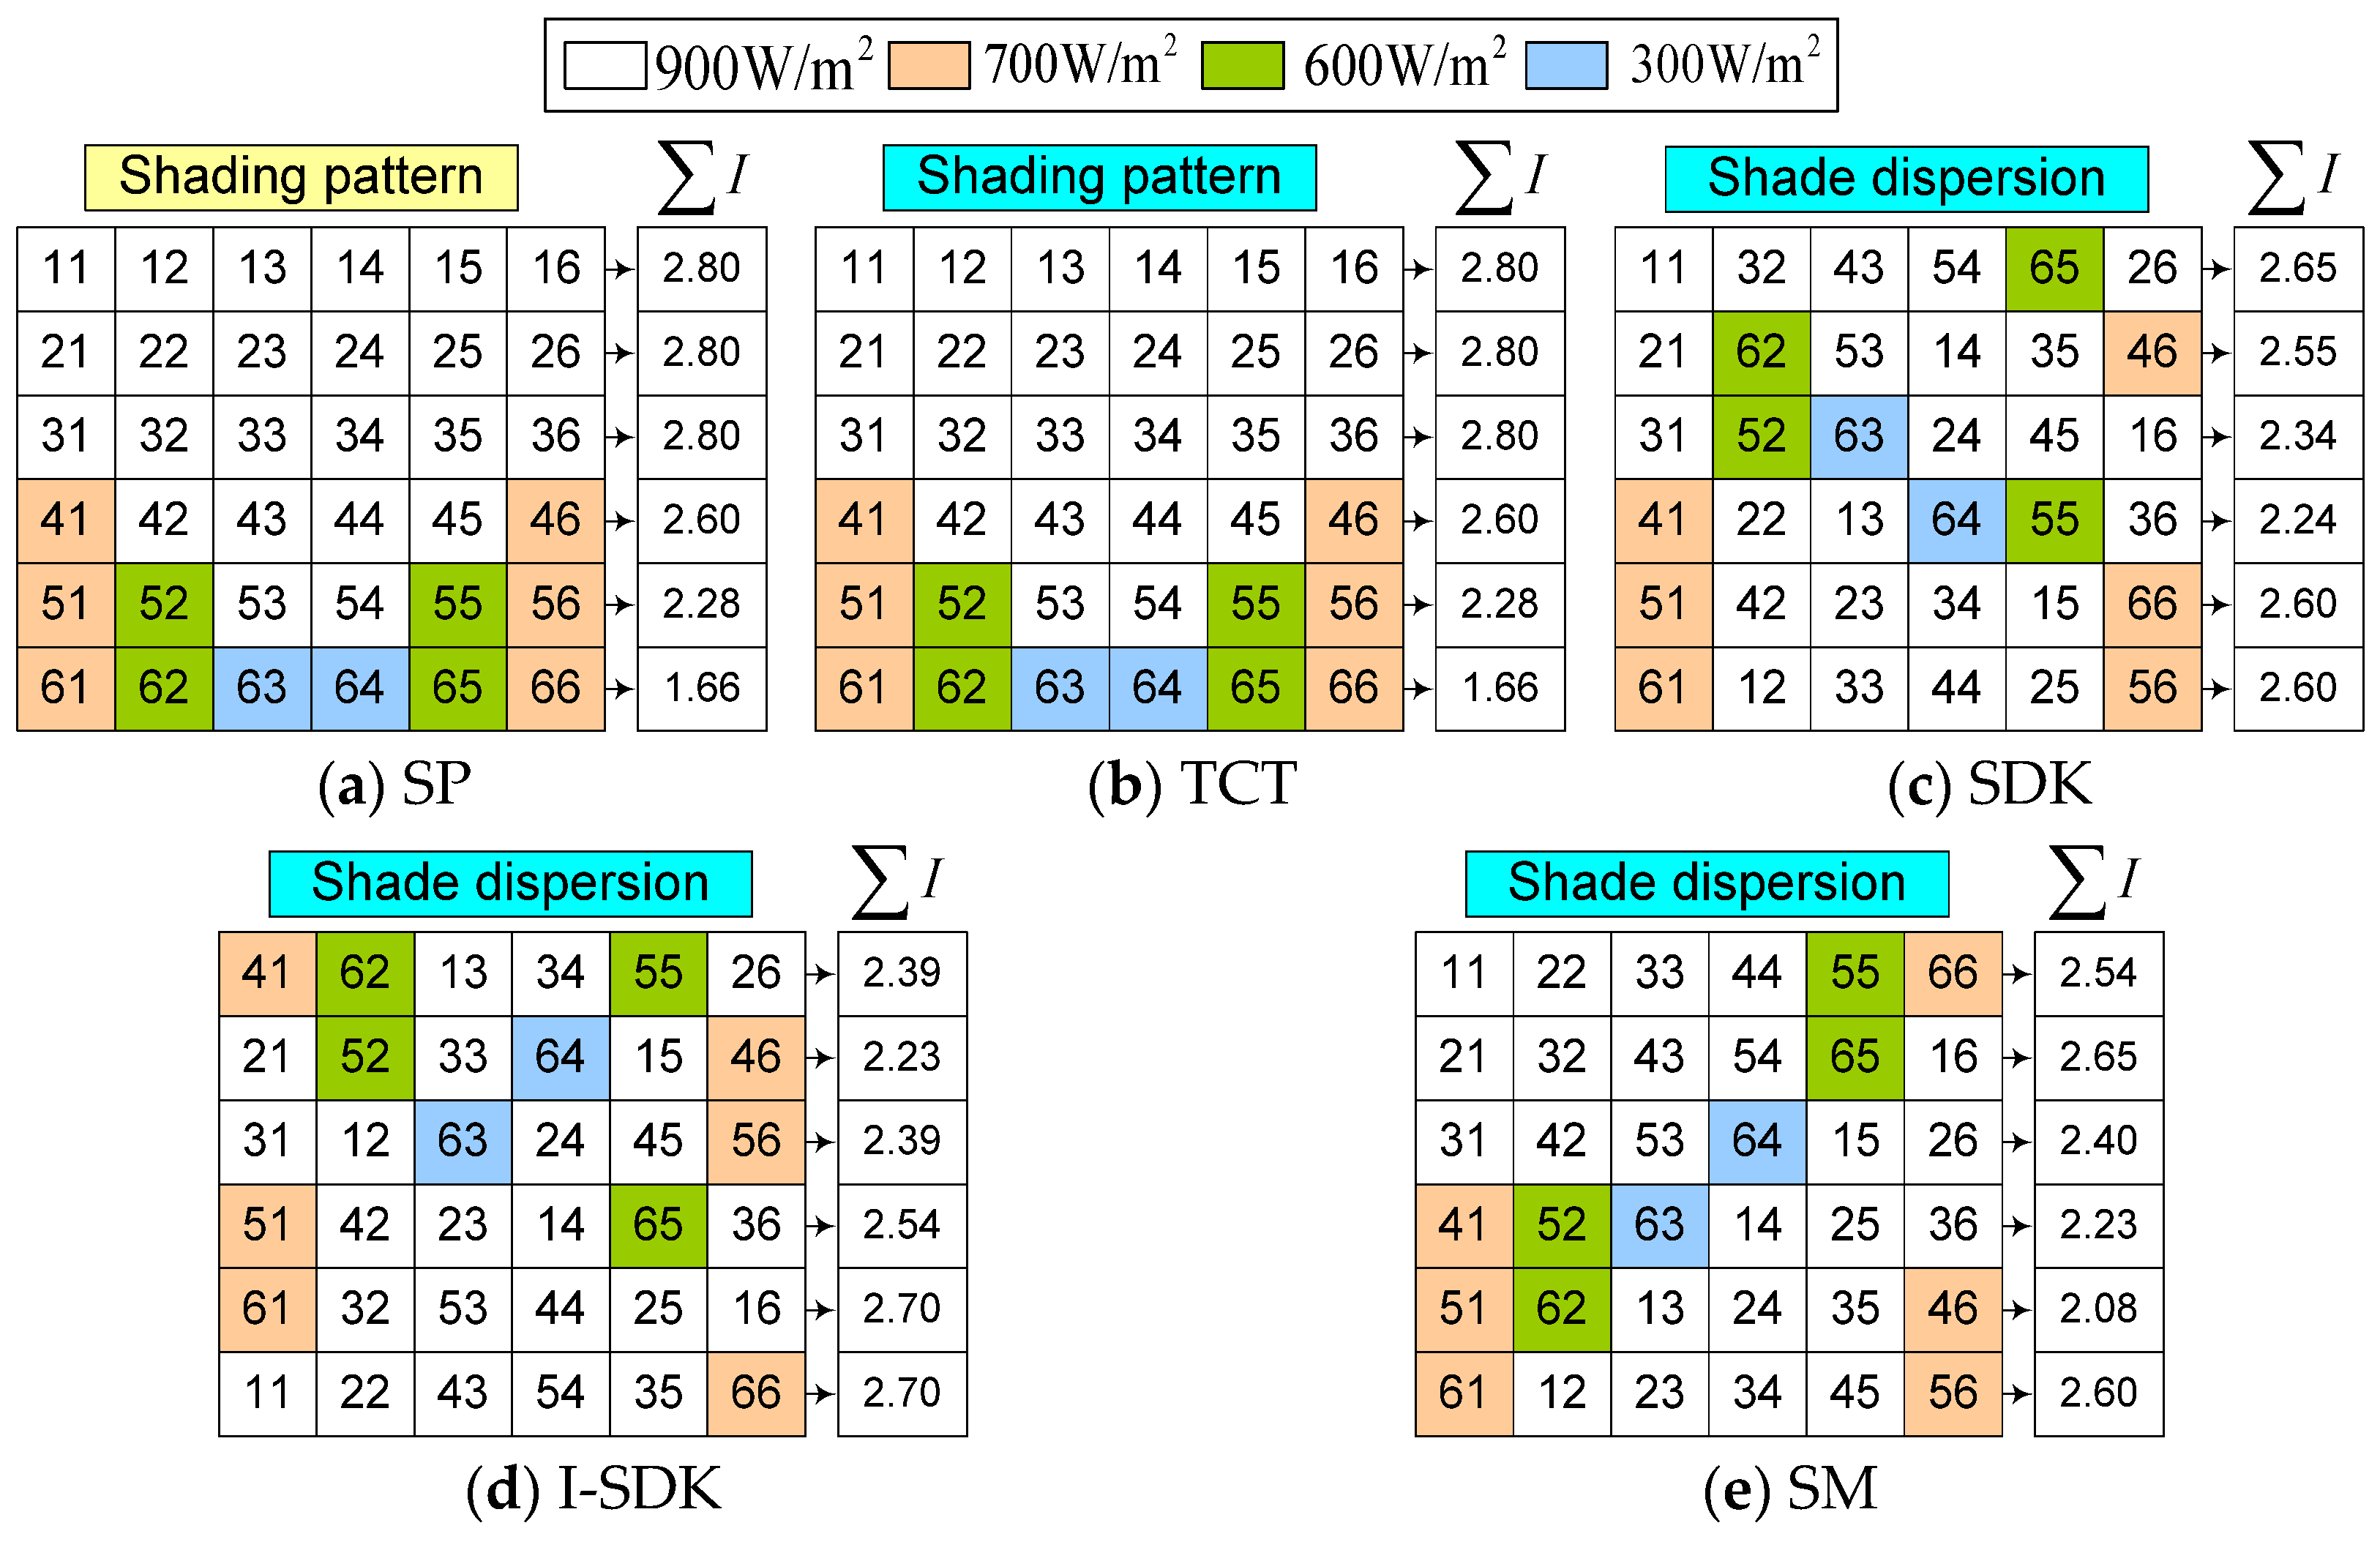
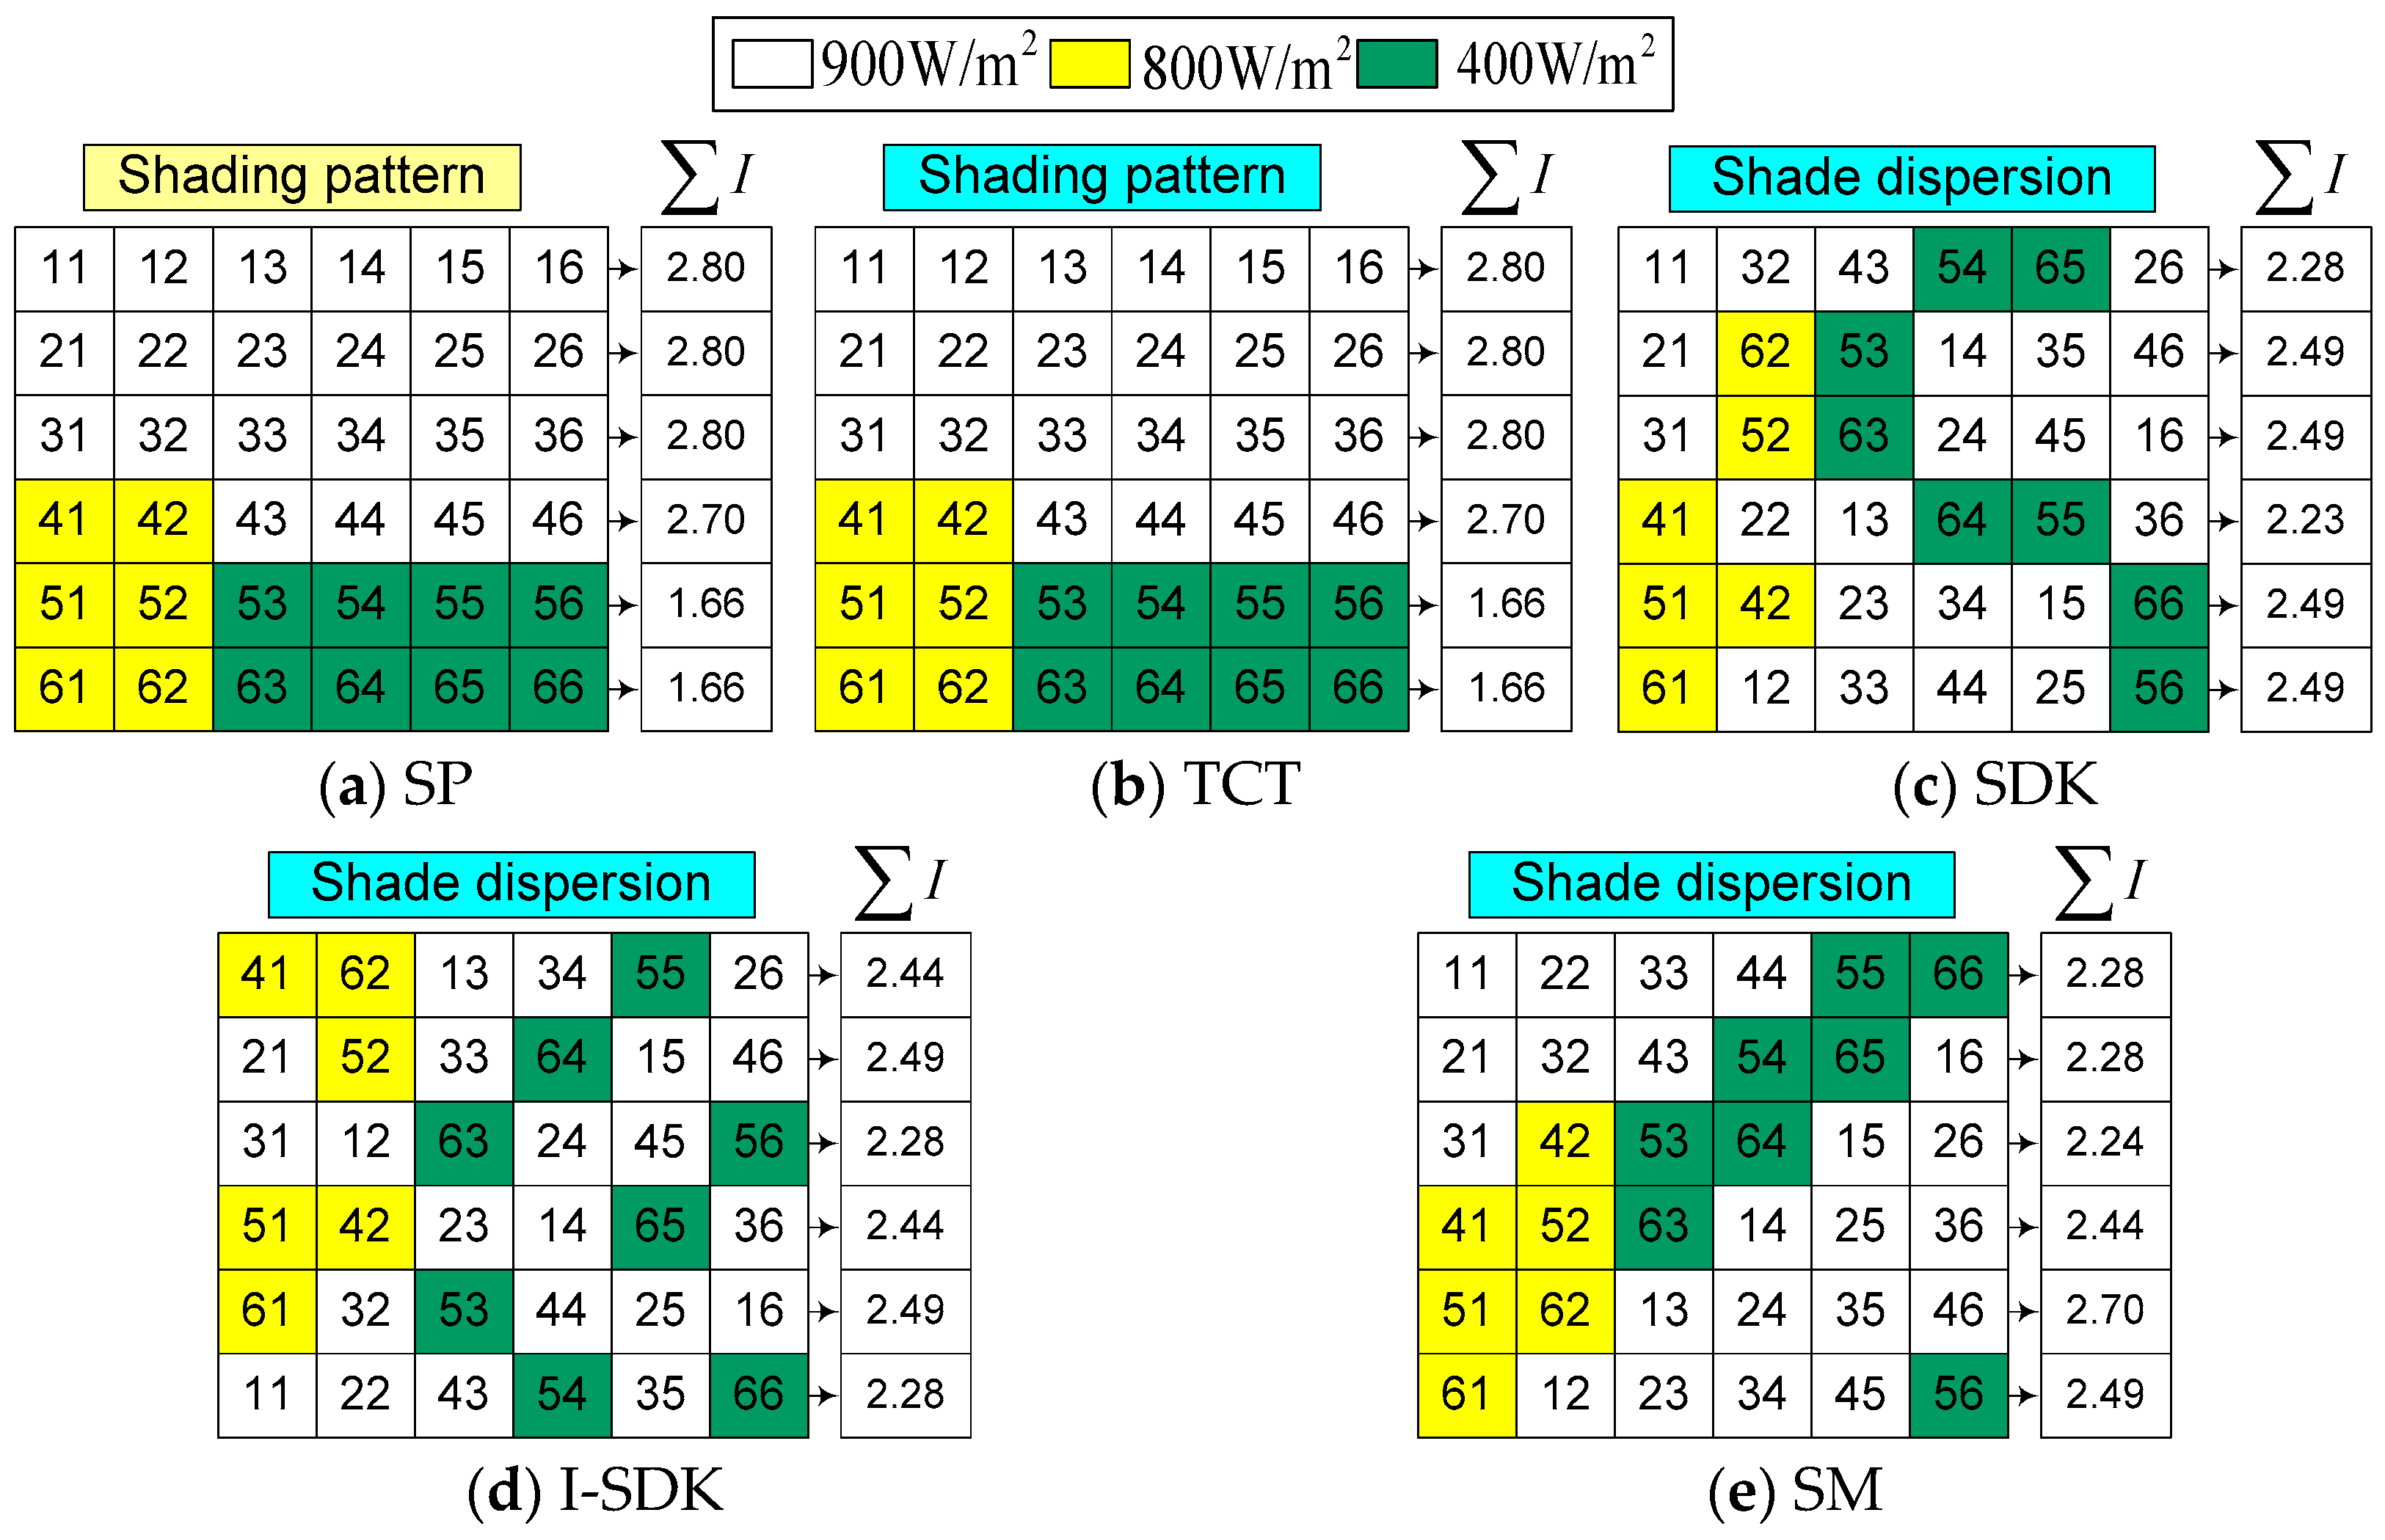
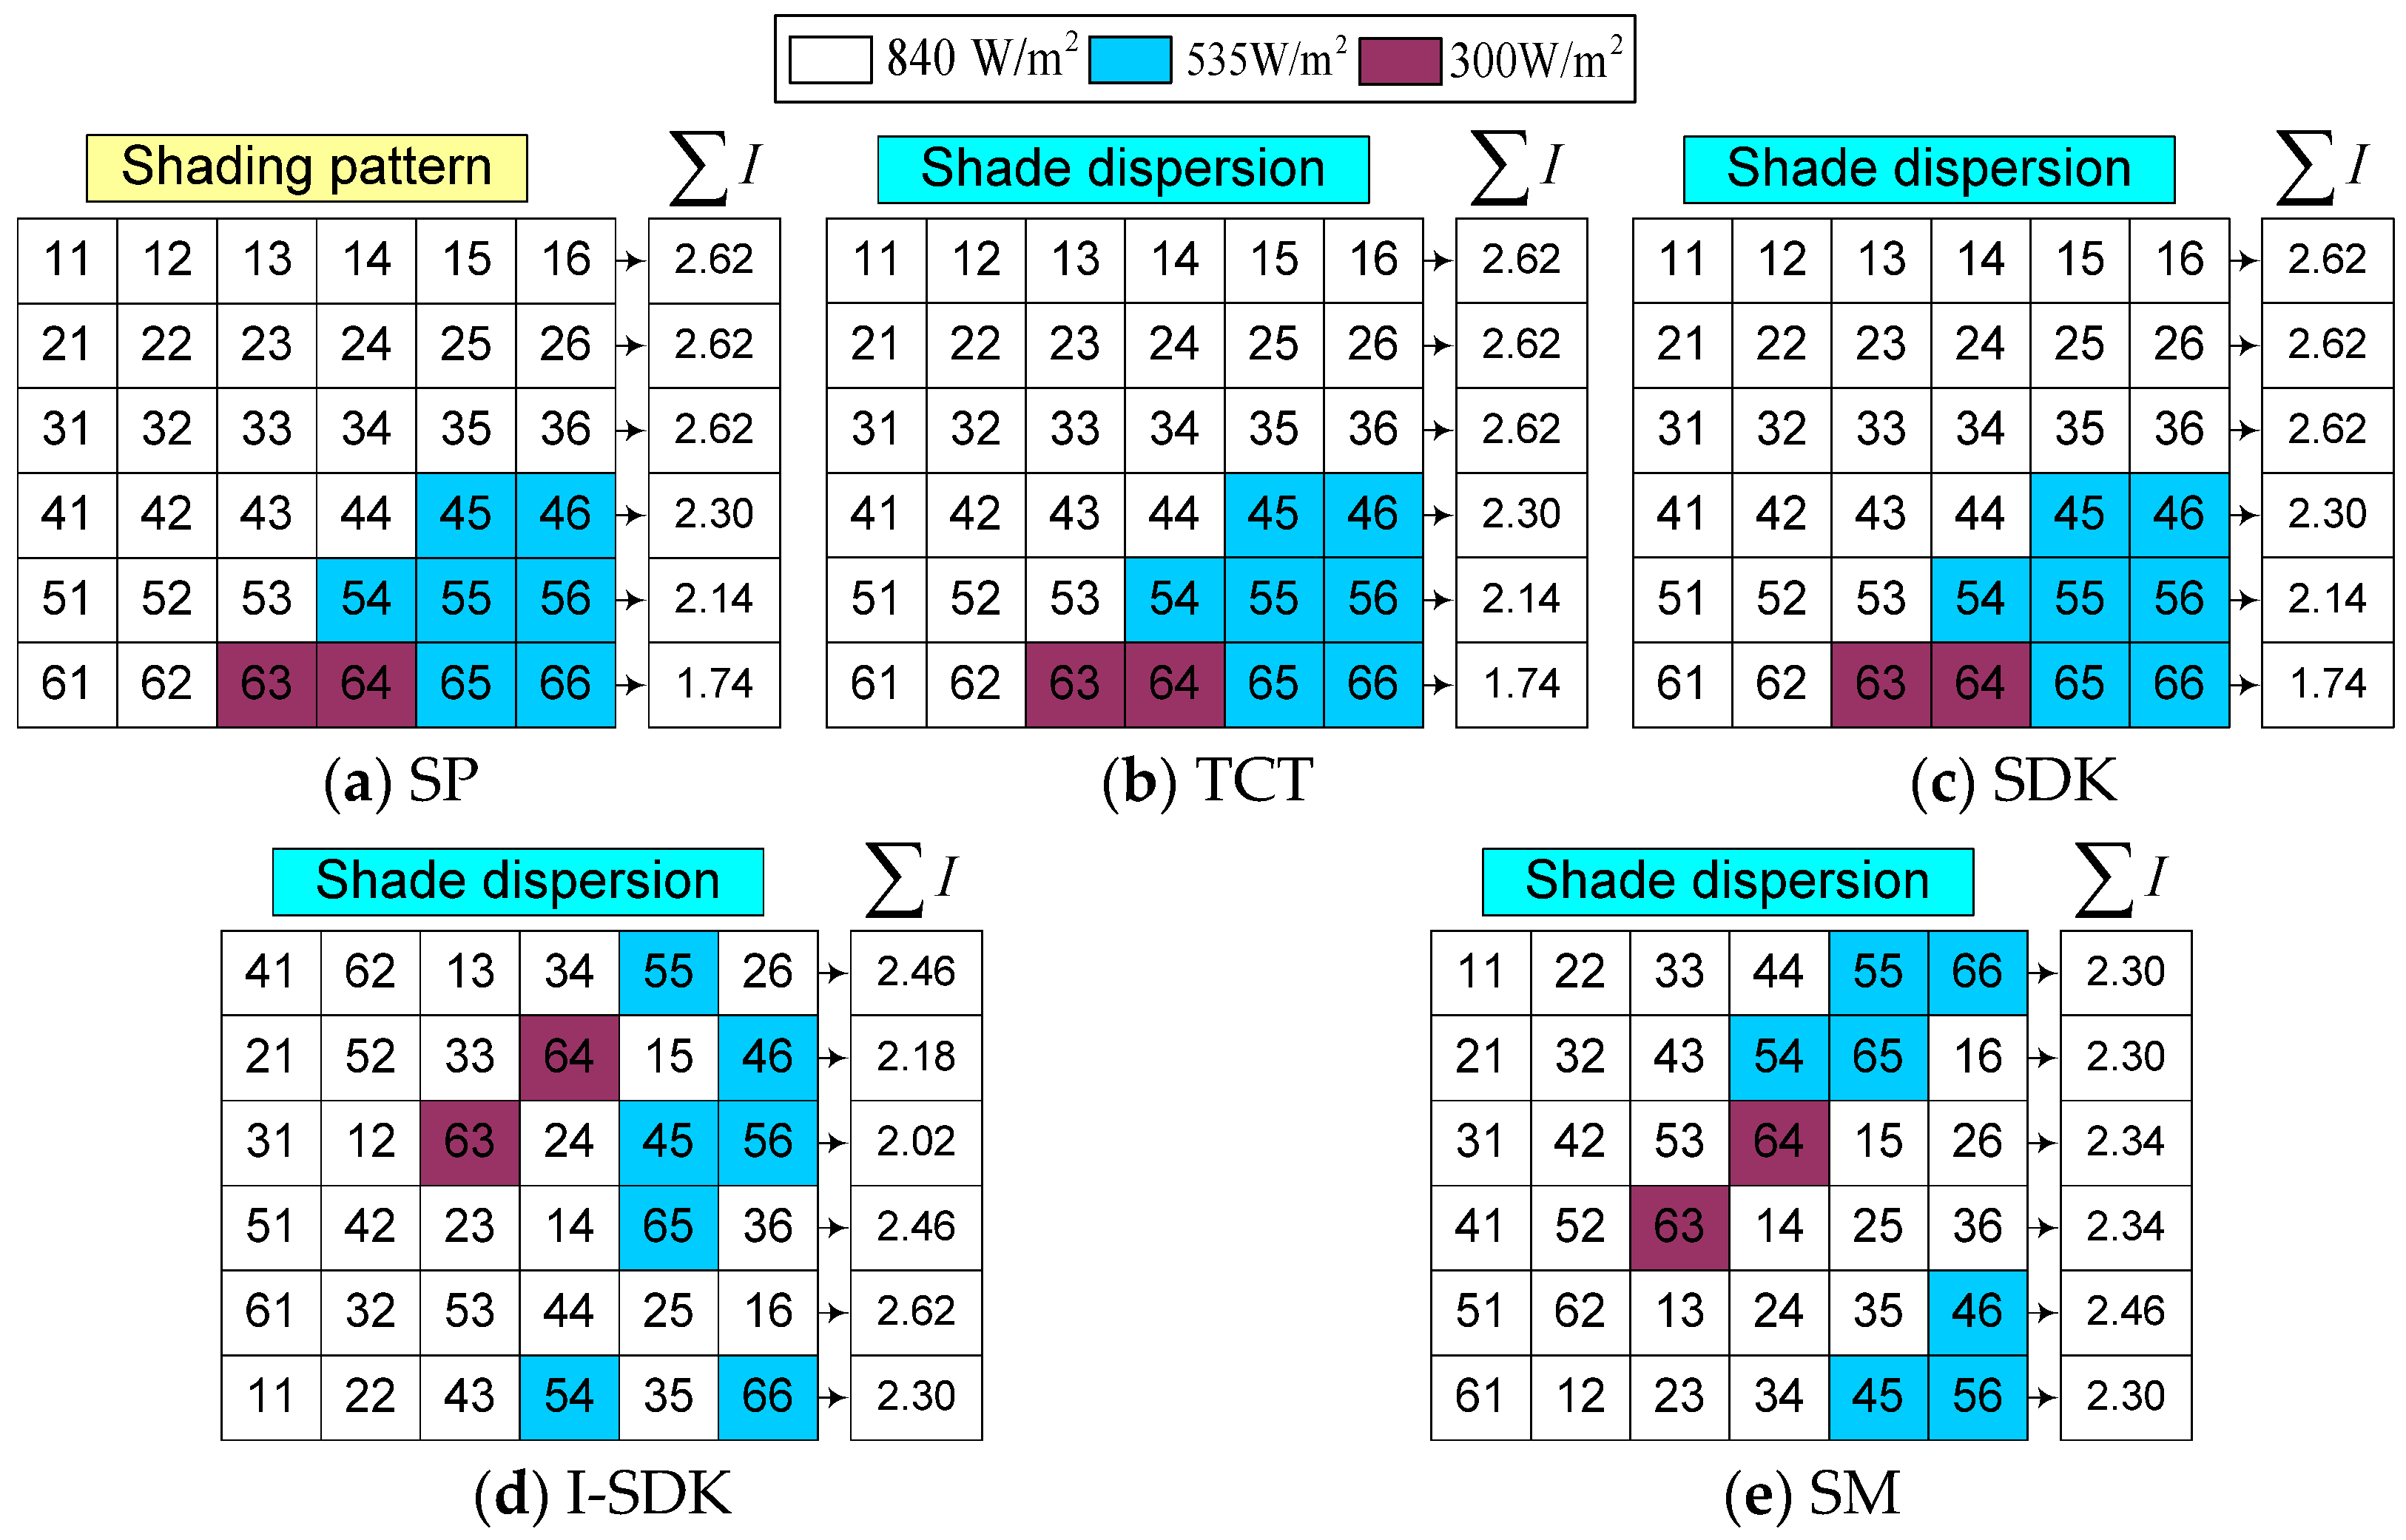
3.8. Shading Patterns Analysis

The obtained P-V and I-V curves during PSCs are described using MATLAB/Simulink modeling and experimentation studies.
(a)
Shadowing pattern-I
Based on the different methodologies and placement of integer numbers, these are responsible for developing the game puzzle with shade dispersion capability as shown in Figure 11a–e. With the consideration of nonuniform shade profiles from a minimum to maximum irradiance range such as 200 W/m2, 400 W/m2, 600 W/m2, 800 W/m2 and 1000 W/m2, an inclusive study was carried out with conventional (SP, TCT) and game theory (SDK, I-SDK and SM) based configurations. The considered shading pattern showed a highly nonuniform nature in irradiance. Furthermore, the game-theory-based reconfigurable methodologies are beneficial in terms of performance improvement due to the higher shade dispersion factor.
To understand the feasibility of considered reconfiguration methodologies, a theoretical valuation of row-wise current was performed. The theoretical valuation of the produced row-wise current for the conventional SP configuration is expressed in Equations (14)–(16). Table 2 depicts the theoretical current assessment of other game-theory-based PV array systems.
I r 1 = I r 2 = I r 3 = 1000 1000 I m + 1000 1000 I m + 1000 1000 I m + 1000 1000 I m + 1000 1000 I m + 1000 1000 I m = 6 I m
I r 4 = 1000 1000 I m + 1000 1000 I m + 1000 1000 I m + 600 1000 I m + 200 1000 I m + 200 1000 I m = 4 I m
I r 5 = I r 6 = 800 1000 I m + 800 1000 I m + 800 1000 I m + 600 1000 I m + 400 1000 I m + 400 1000 I m = 3.8 I m
(b)
Shadowing pattern-II
Based on the different methodologies and placement of integer numbers, these are responsible for developing the game puzzle with shade dispersion capability as shown in Figure 12a–e. With the consideration of nonuniform shade profiles from minimum to maximum irradiance ranges such as 300 W/m2, 600 W/m2, 700 W/m2 and 900 W/m2, a comprehensive study was carried out with existing and game-theory-based arrangements.
To understand the feasibility of the considered reconfiguration methodologies, a theoretical assessment of row-wise current was performed. The theoretical row-wise current generated by the usual SP design is expressed in Equations (17)–(20). Table 3 depicts the theoretical current assessment of other game-theory-based PV array systems.
I r 1 = I r 2 = I r 3 = 900 1000 I m + 900 1000 I m + 900 1000 I m + 900 1000 I m + 900 1000 I m + 900 1000 I m = 5.4 I m
I r 4 = 700 1000 I m + 900 1000 I m + 900 1000 I m + 900 1000 I m + 900 1000 I m + 700 1000 I m = 5 I m
I r 5 = 700 1000 I m + 600 1000 I m + 900 1000 I m + 900 1000 I m + 600 1000 I m + 700 1000 I m = 4.38 I m
I r 6 = 700 1000 I m + 600 1000 I m + 300 1000 I m + 300 1000 I m + 600 1000 I m + 700 1000 I m = 3.19 I m
(c)
Shadowing pattern-III
Based on the different methodologies and placement of integer numbers, these are responsible for developing the game puzzle with shade dispersion capability as shown in Figure 13a–e. With the consideration of nonuniform shade profiles from minimum to maximum irradiance ranges such as 400 W/m2, 800 W/m2 and 900 W/m2, a comprehensive study was carried out with conventional and game-theory-based configurations. Furthermore, the game-theory-based reconfigurable methodologies are beneficial in terms of higher GMPP under shading profiles.
The theoretical row-wise current generated by the usual SP design is expressed in Equations (21)–(23). Table 4 depicts the theoretical current assessment of other game-theory-based PV array systems.
I r 1 = I r 2 = I r 3 = 900 1000 I m + 900 1000 I m + 900 1000 I m + 900 1000 I m + 900 1000 I m + 900 1000 I m = 5.4 I m
I r 4 = 800 1000 I m + 800 1000 I m + 900 1000 I m + 900 1000 I m + 900 1000 I m + 900 1000 I m = 5.2 I m
I r 5 = I r 6 = 800 1000 I m + 800 1000 I m + 400 1000 I m + 400 1000 I m + 400 1000 I m + 400 1000 I m = 3.2 I m
(d)
Shadowing pattern-IV
Based on the different methodologies and placement of integer numbers, these are responsible for developing the game puzzle with shade dispersion capability as shown in Figure 14a–e. With the consideration of nonuniform shade profiles from minimum to maximum irradiance ranges such as 300 W/m2, 535 W/m2 and 840 W/m2, a comprehensive study was carried out with conventional and game-theory-based configurations. The shading pattern appears to be building a corner shading on the PV array system.
Equations (24)–(26) give a theoretical evaluation of the generated row-wise current for the typical SP configuration. Table 5 depicts the theoretical current assessment of other game-theory-based PV array systems.
I r 1 = I r 2 = I r 3 = I r 4 = 840 1000 I m + 840 1000 I m + 840 1000 I m + 840 1000 I m + 840 1000 I m + 840 1000 I m = 5.04 I m
I r 5 = 840 1000 I m + 535 1000 I m + 535 1000 I m + 535 1000 I m + 535 1000 I m + 535 1000 I m = 3.51 I m
I r 6 = 200 1000 I m + 200 1000 I m + 200 1000 I m + 200 1000 I m + 535 1000 I m + + 535 1000 I m = 1.87 I m

4. Results and Discussion

The suggested PV array configurations were used to estimate performance in all four shading circumstances. The preferred PV array setups were used to estimate performance under all four distinct shading scenarios. An investigation into the PV system’s performance was carried out using MATLAB/Simulink, while experimentation was used to verify the results.

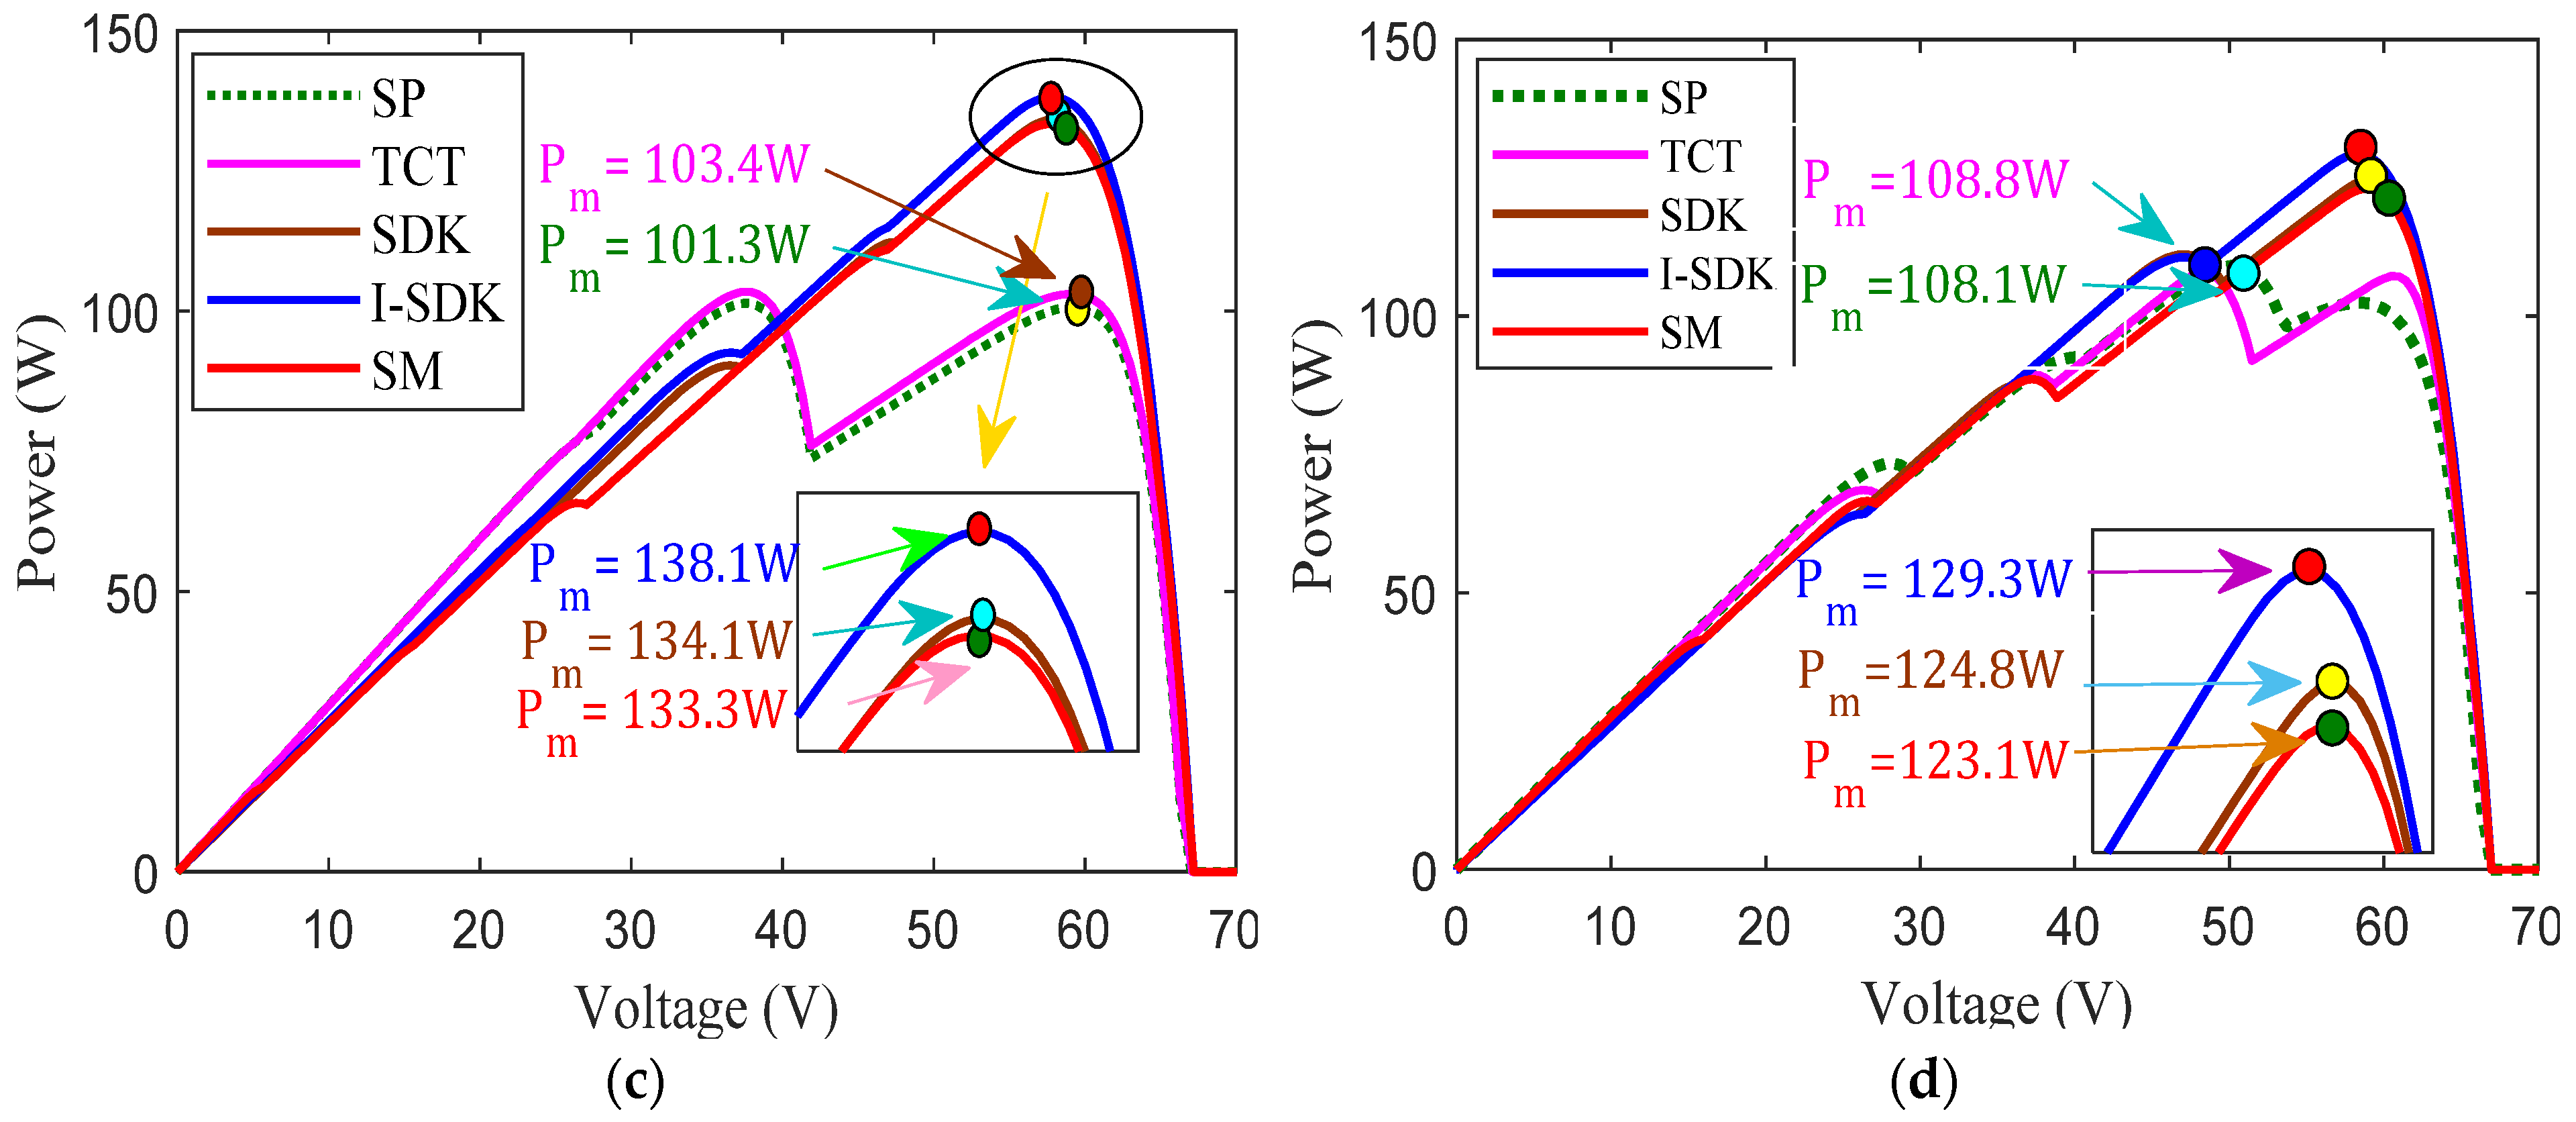
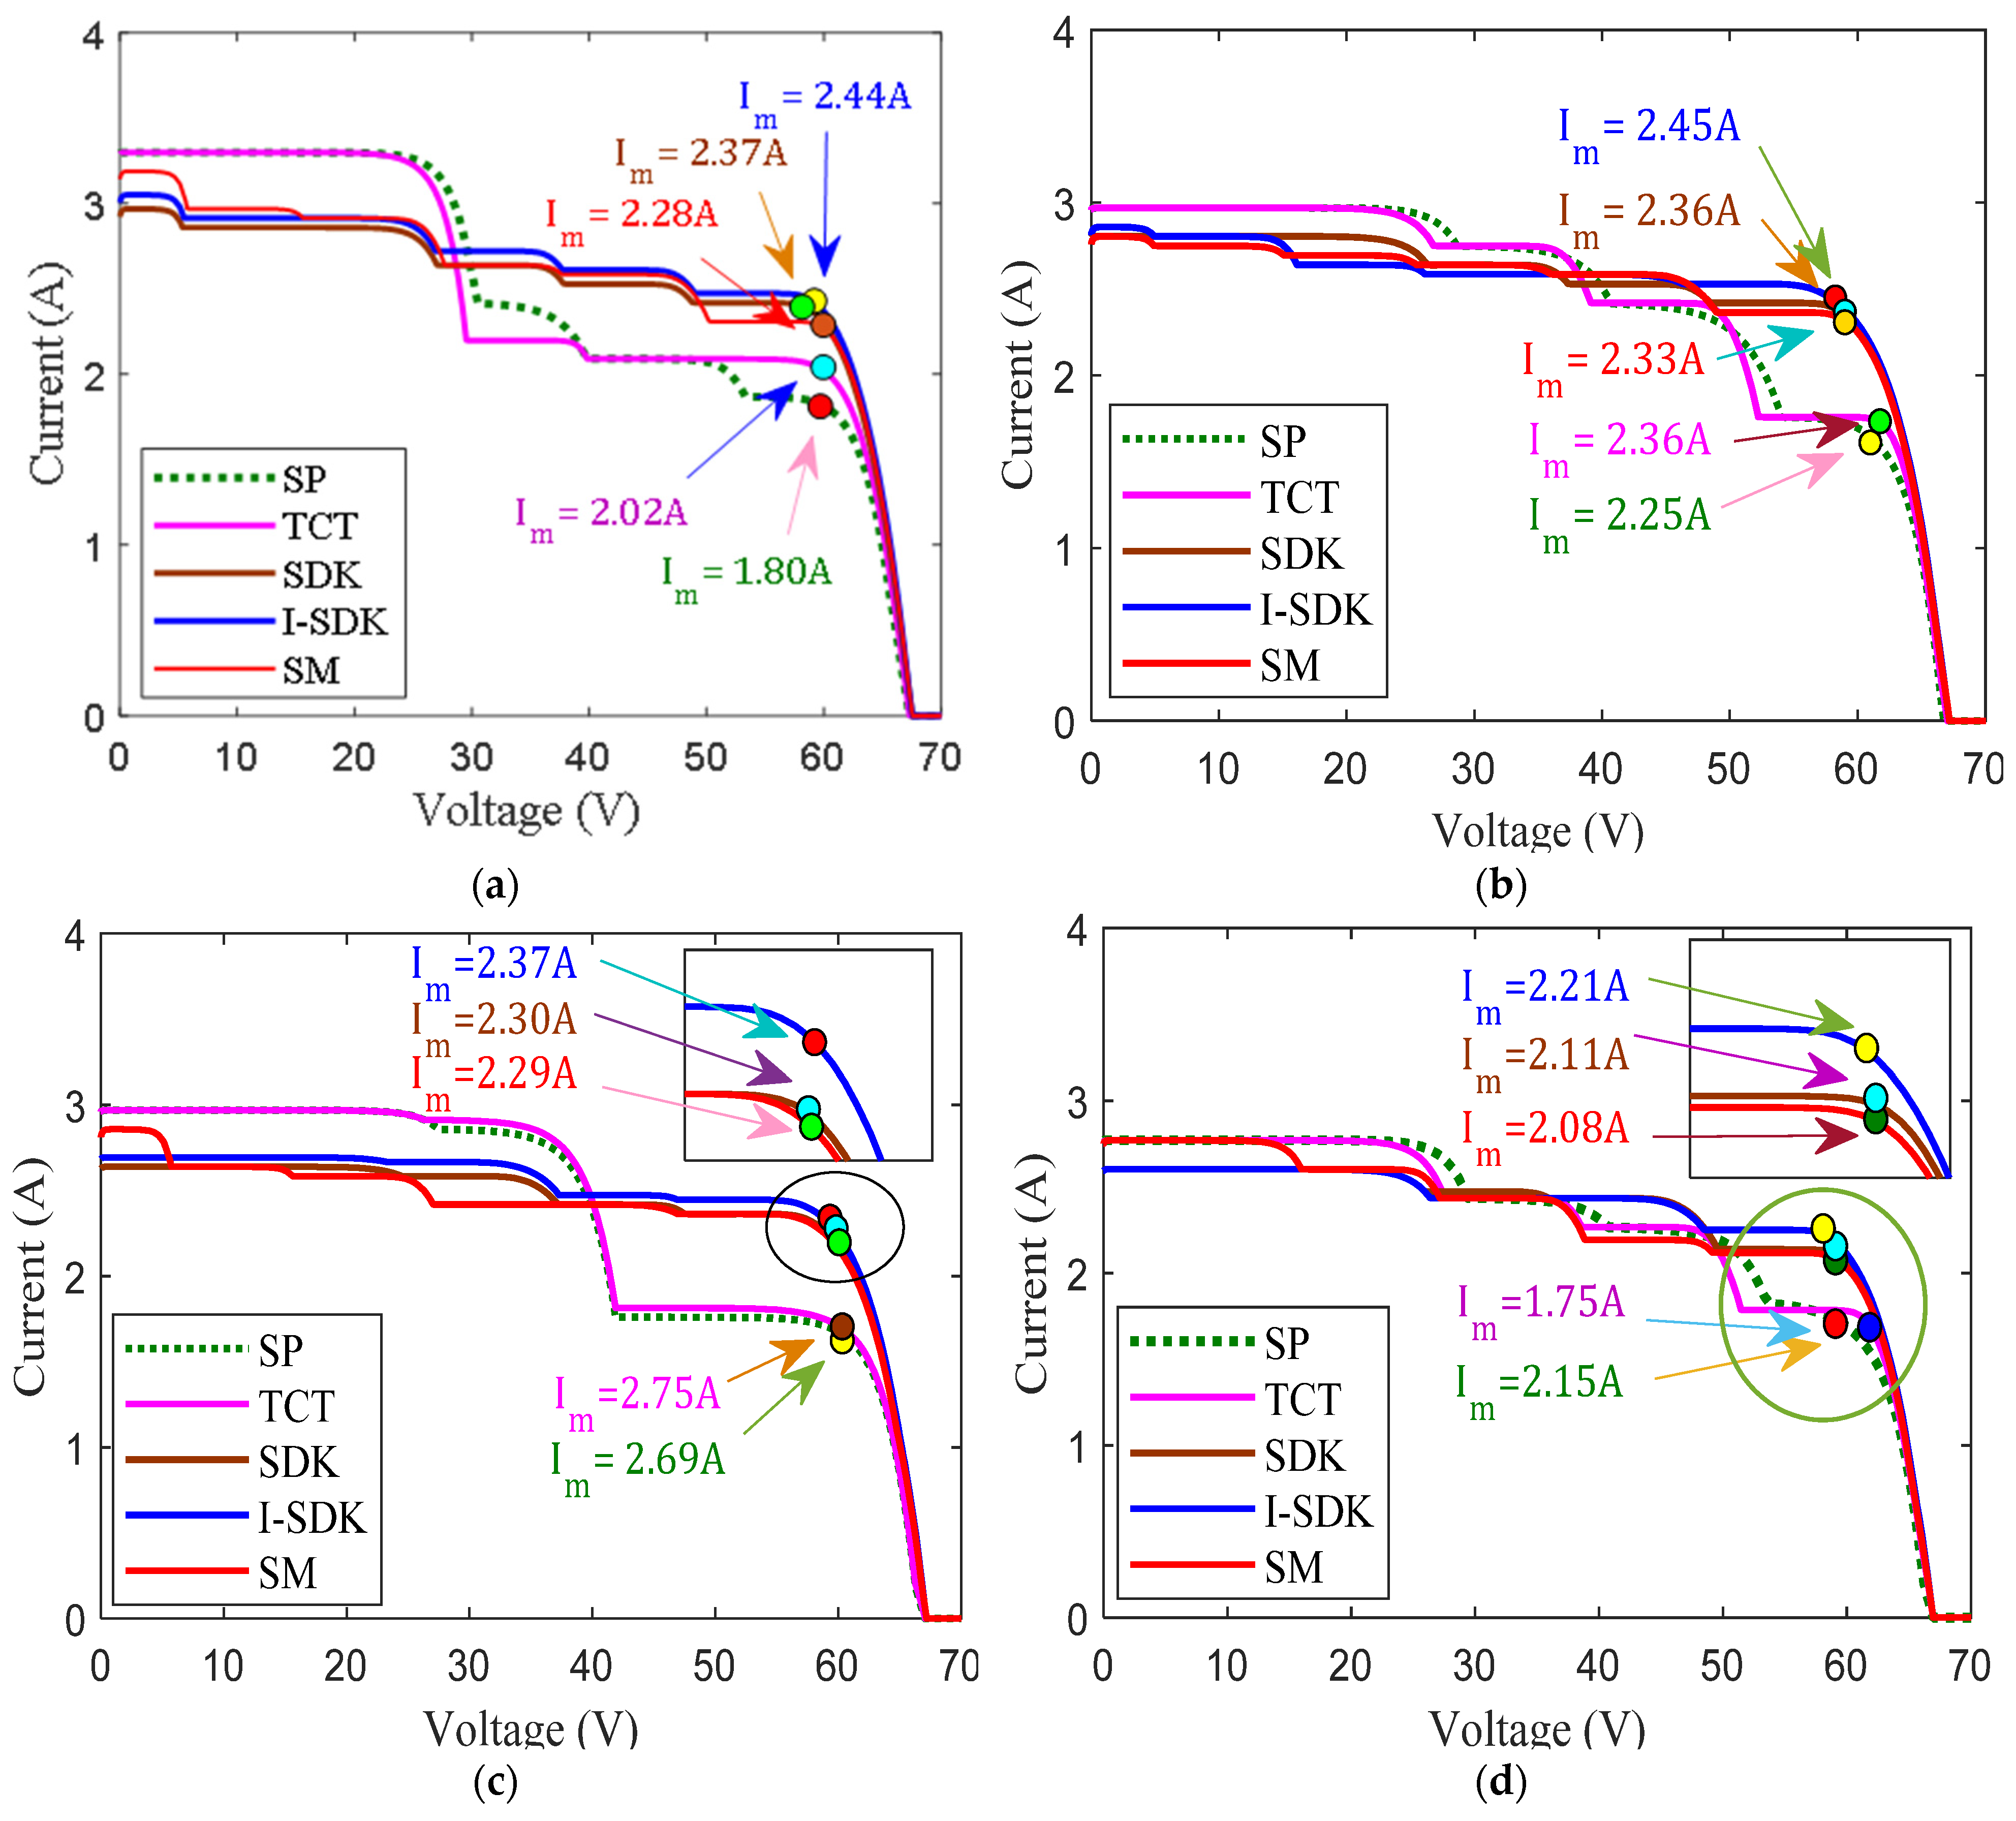
4.1. MATLAB/Simulink Study: P-V and I-V Curves under Shading Case I–IV

A thorough examination of the achieved performance of SP, TCT, SDK, I-SDK and SM arrangements was considered. The behavior of the characterized P-V and I-V curves for PV array topologies under shading scenarios I-IV is depicted in Figure 15 and Figure 16.
Shade losses are greater in the SP and TCT configurations due to a lack of coherence between the maximum power of the module and the GMPP of the PV array. The SP and TCT configurations, GMPPs are 108.7 W and 121.3 W for shading case-I at nonuniform irradiation levels: 1000 W/m2 -200 W/m2, respectively. Moreover, for other reconfigured PV arrays such as SDK, I-SDK and SM, the GMPPs are investigated as 139.9 W, 143.5 W and 136.3 W.
During the shade case-II, the SP and TCT electrical arrangements had inferior power performance at GMPPs of 113.2 W and 115.9 W, respectively. SDK, I-SDK and SM configurations feature different GMPP sites for equivalent climatic conditions, including 139.1 W, 141.7 W and 136.9 W, respectively, in terms of uniform irradiance levels (1000 W/m2 -200 W/m2).
P-V curves with several maximum points show that GMPP power is present. Under the shading case-III, the TCT, SDK and SM models performed better than the SP configuration in terms of GMPP, with values of 103.4 W, 134.1 W and 133.3 W, respectively. Because of its shade dispersion characteristics, the I-SDK design had the maximum power among the examined PV array topologies at GMPP of 138.1 W.
The SP setup had a low power output at GMPP of 108.1 W when using shading case-IV. For identical environmental needs, TCT, SDK, I-SDK and SM setups with multiple GMPP locations such as 108.8 W, 124.8 W, 129.3 W and 123.1 W are available.
In Case-I, the I-SDK configuration had smoother I-V characteristics than the SP, TCT, SDK and SM versions. When compared to other configurations, the ISC for the I-SDK configuration was judged to be 2.90 A after the examination. The values for ISC for all PV array configurations were SP (3.29 A), TCT (3.29 A), SDK (2.87 A) and SM (2.96 A) arrangements.
For shading case II, the I-V characteristic of the I-SDK setup exhibited smooth behavior, achieving ISC and VOC of 2,80 A and 66.65 V, respectively. For the SP, TCT, SDK and SM models, the ISC values were 2.96 A, 2.96 A, 2.80 A and 2.77 A, respectively. When compared to other settings, the shading effects of SP and TCT settings enhanced volatility.
During shading case-III, the nature of the I-V curve for I-SDK was confirmed to be smoother and reported as 2.63 A when compared to SP, TCT, SDK and SM arrangements. The ISC was 2.97 A (SP), 2.97 A (TCT), 2.63 A (SDK) and 2.85 A for other setups (SM).
The nature of the I-V curves was investigated in shading case-IV. In this scenario, the I-SDK setup exhibited smooth behavior to achieve ISC and VOC in the 2.60 A and 65.5 V ranges. In addition, the ISC values for the 2.77 A, 2.77 A, 2.77 A and 2.77 A configurations were obtained.
The MATLAB and simulation study was analyzed from a critical perspective. The efficiency of solar photovoltaic systems decreased dramatically when realistic shading patterns were used. Voltage and power at GMPP, PL and FF can be calculated using P-V and I-V curves. Table 6 provides the quantitative findings of the MATLAB/Simulink study for shading profiles I–IV.

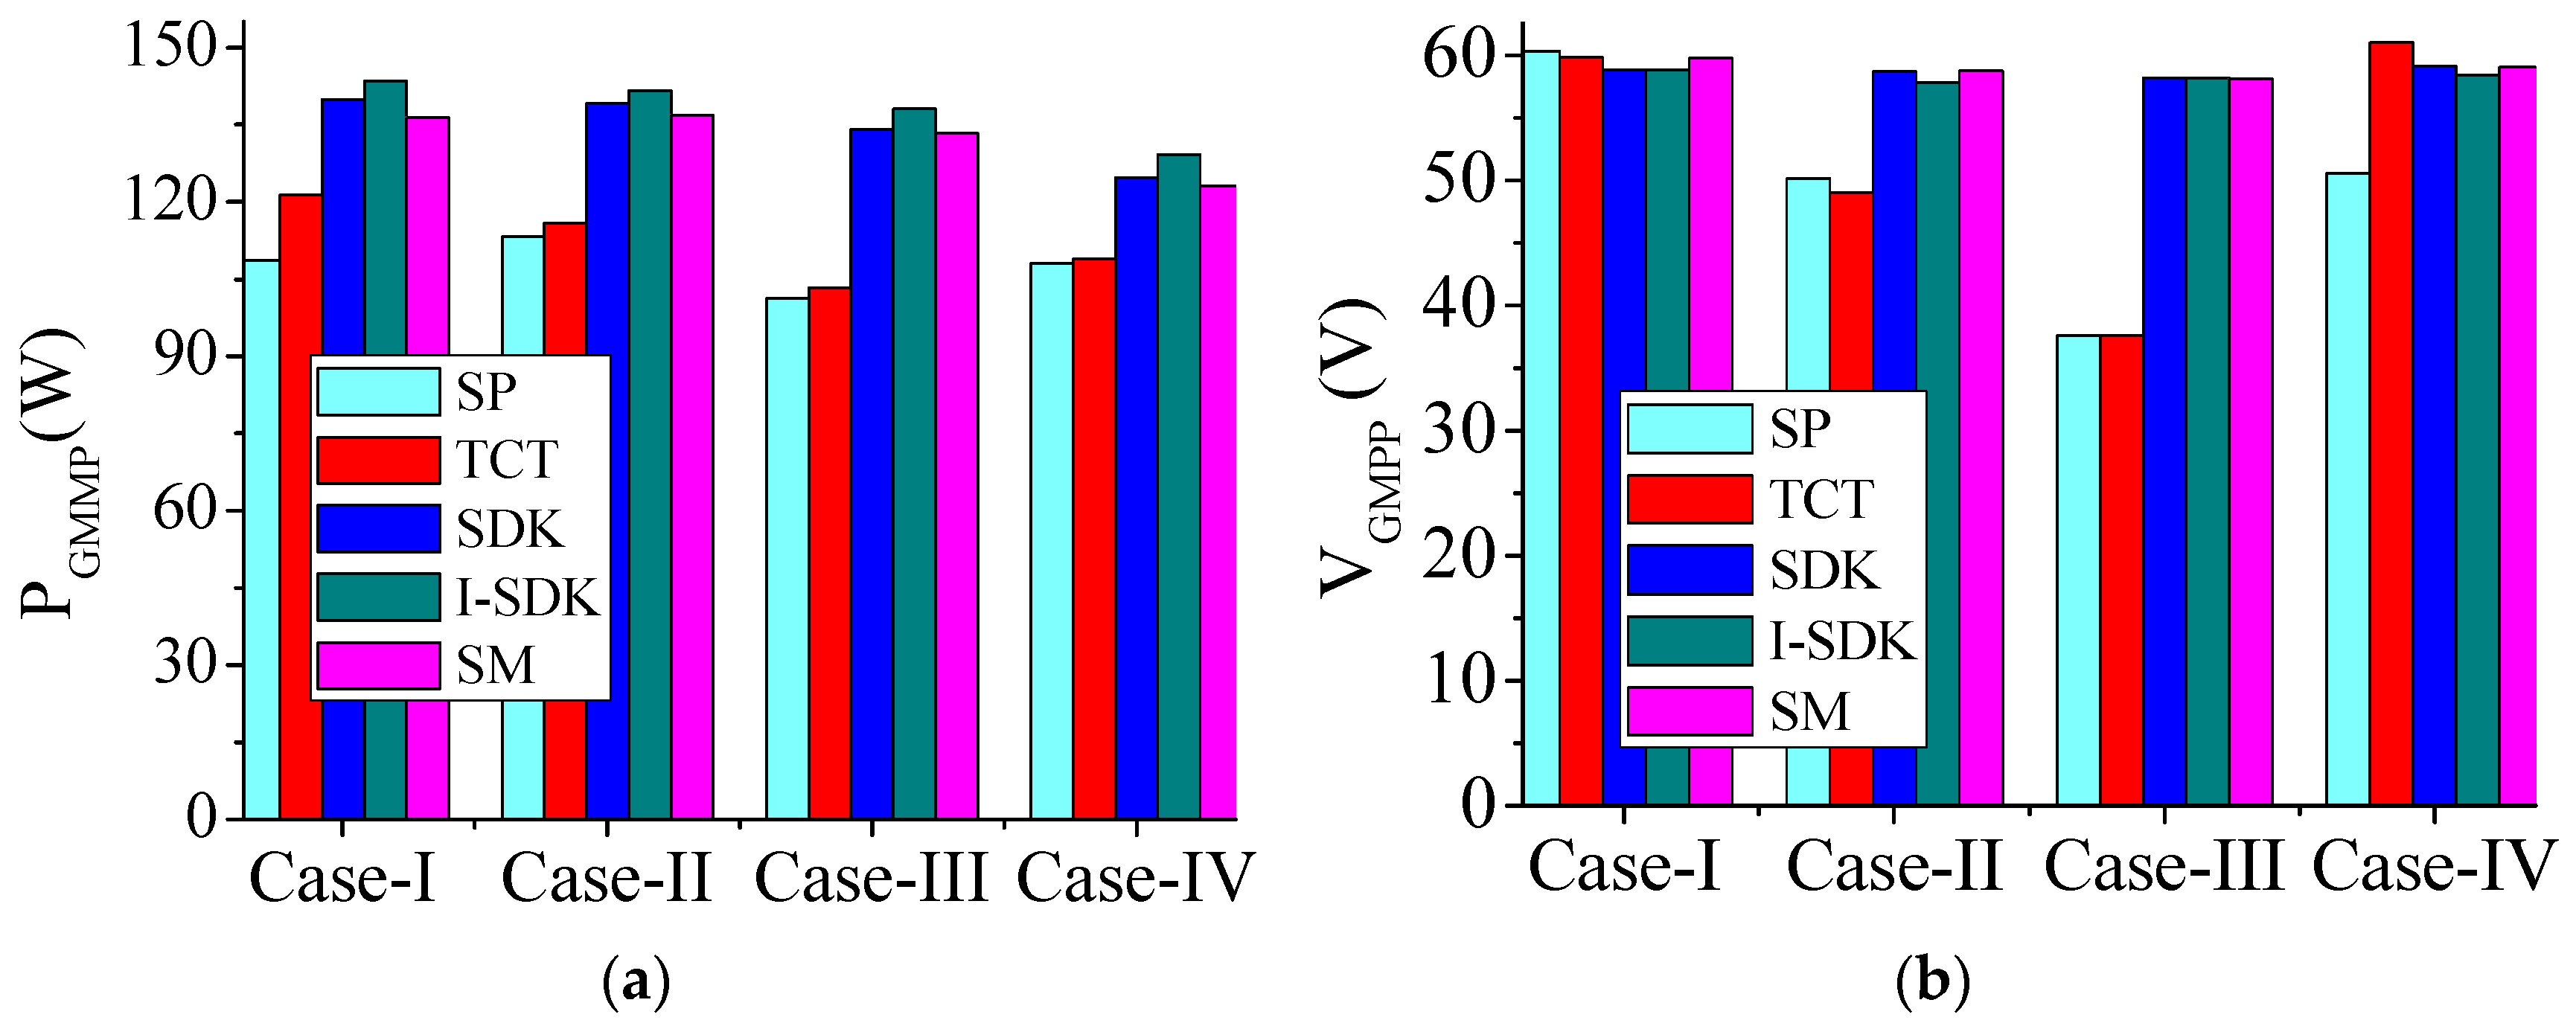
4.2. Power and Voltage at GMPP

GMPP’s power evaluation results are given in Figure 17. The I-SDK arrangement delivered the greatest power at GMPP of 143.5 W, 141.7 W, 128.3 W and 129.3 W.
Power distribution to the load side involves many factors, including voltage at GMPP. The voltage at GMPP has distinct values in the MATLAB/Simulation research for SP, TCT, SDK, I-SDK and SM setups under shading case-I (60.35 V, 59.82 V, 8.82 V, 58.81 V and 59.73 V), case-II (50.15 V, 49 V, 58.71 V, 57.81 V and 58.73 V), case-III (37.6 V, 37.6 V, 58.18 V, 58.17 V and 58.10 V) and case-IV (50.55 V, 61 V, 59.08 V, 58.43 V and 59.04 V).

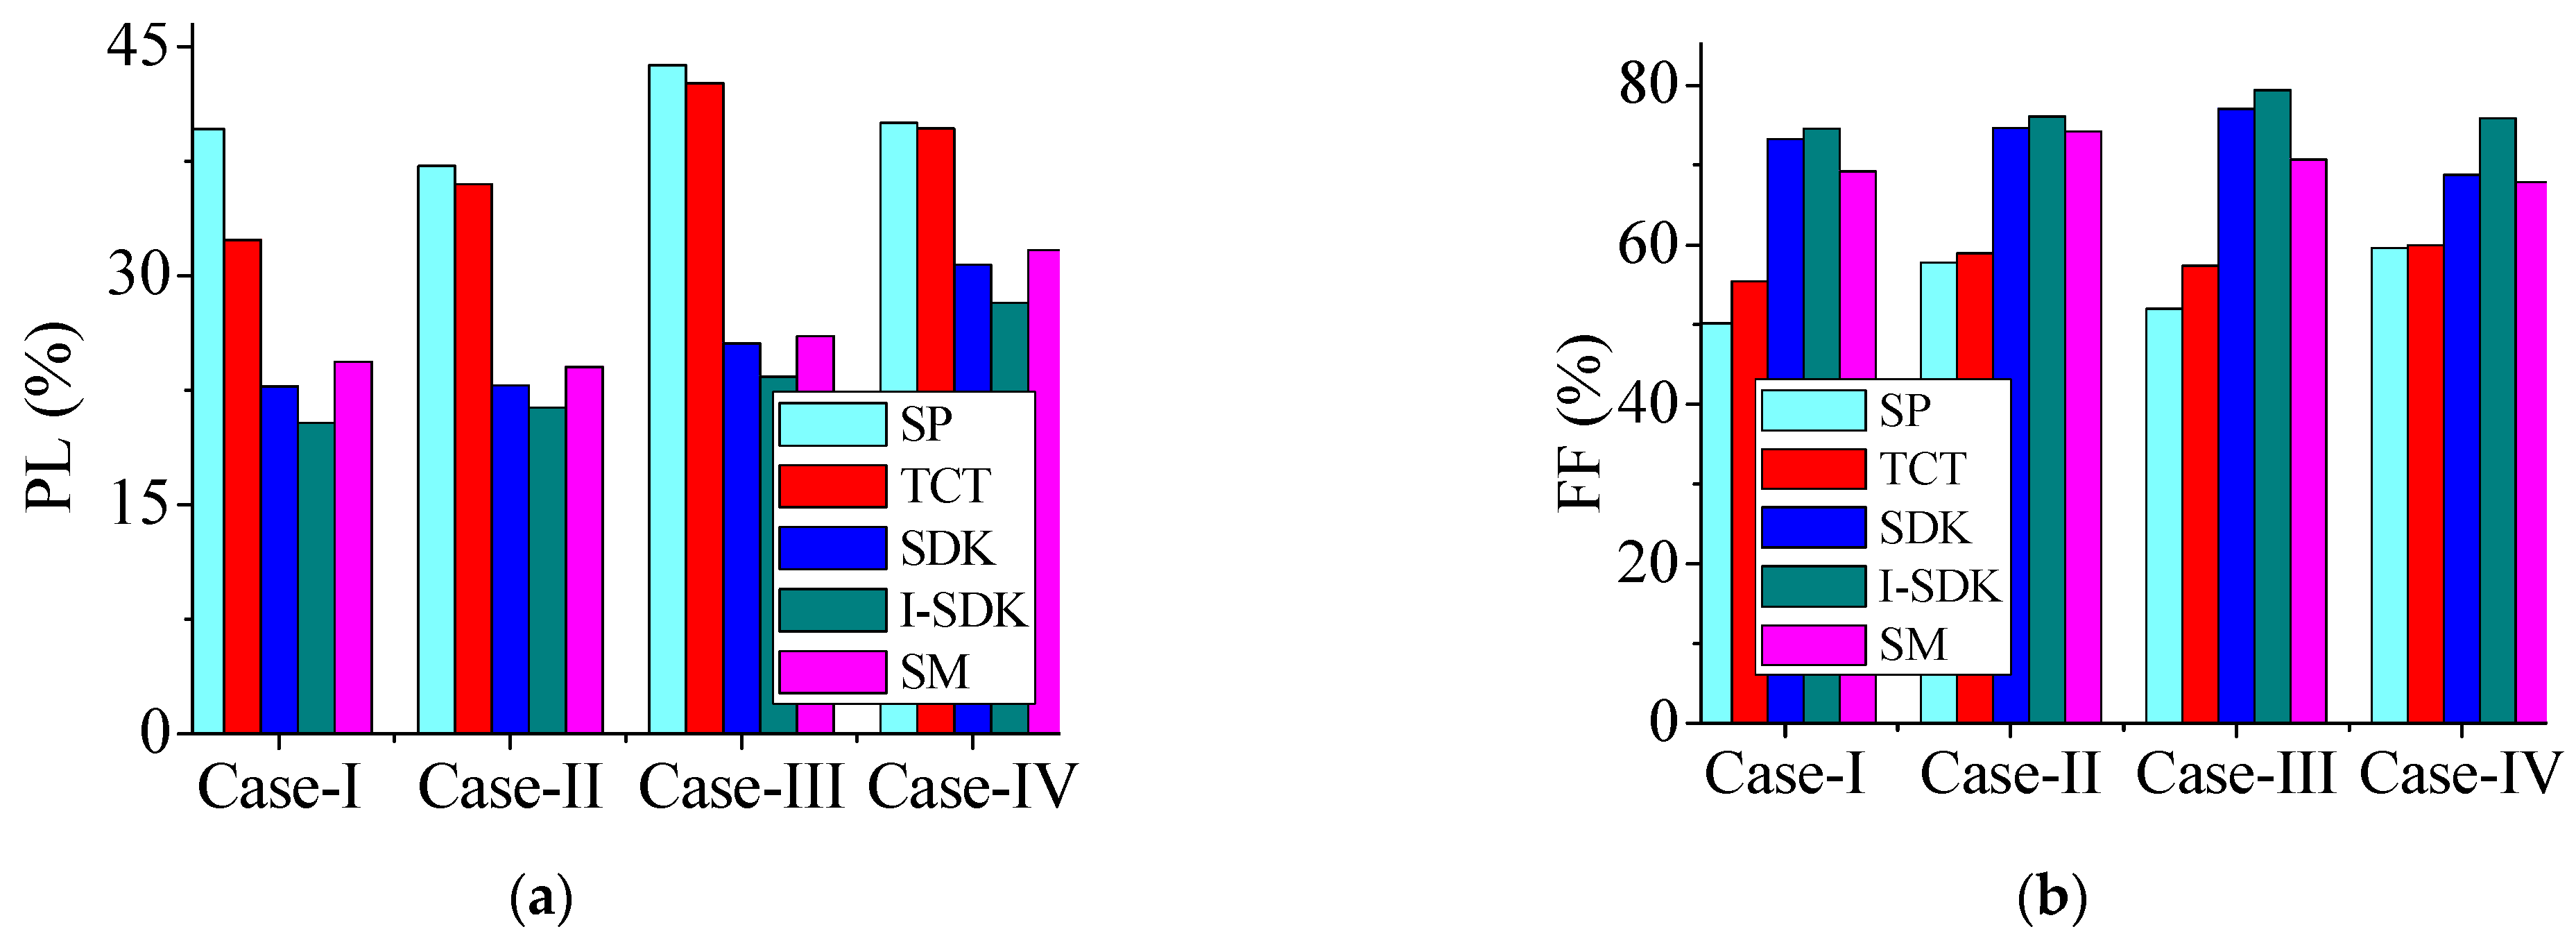
4.3. PL and FF Analysis

Power losses due to shade on PV systems such as SP, TCT, SDK, SM and I-SDK configurations were observed in the MATLAB/Simulink study. In order to do this, the I-SDK configuration had a minimum PL of 20.36%, 21.36%, 23.36% and 28.24% under shading cases I–IV, respectively.
Deviation in the FF due to different shadowing scenarios are given in Figure 18 when comparing SP, TCT, SDK, SM and I-SDK layouts. Shade instances I-IV in the MATLAB/Simulink study, according to I-SDK, demonstrated the greatest gains in shading efficiency in terms of FF at 74.61%, 76.10%, 79.4% and 75.72%, respectively.

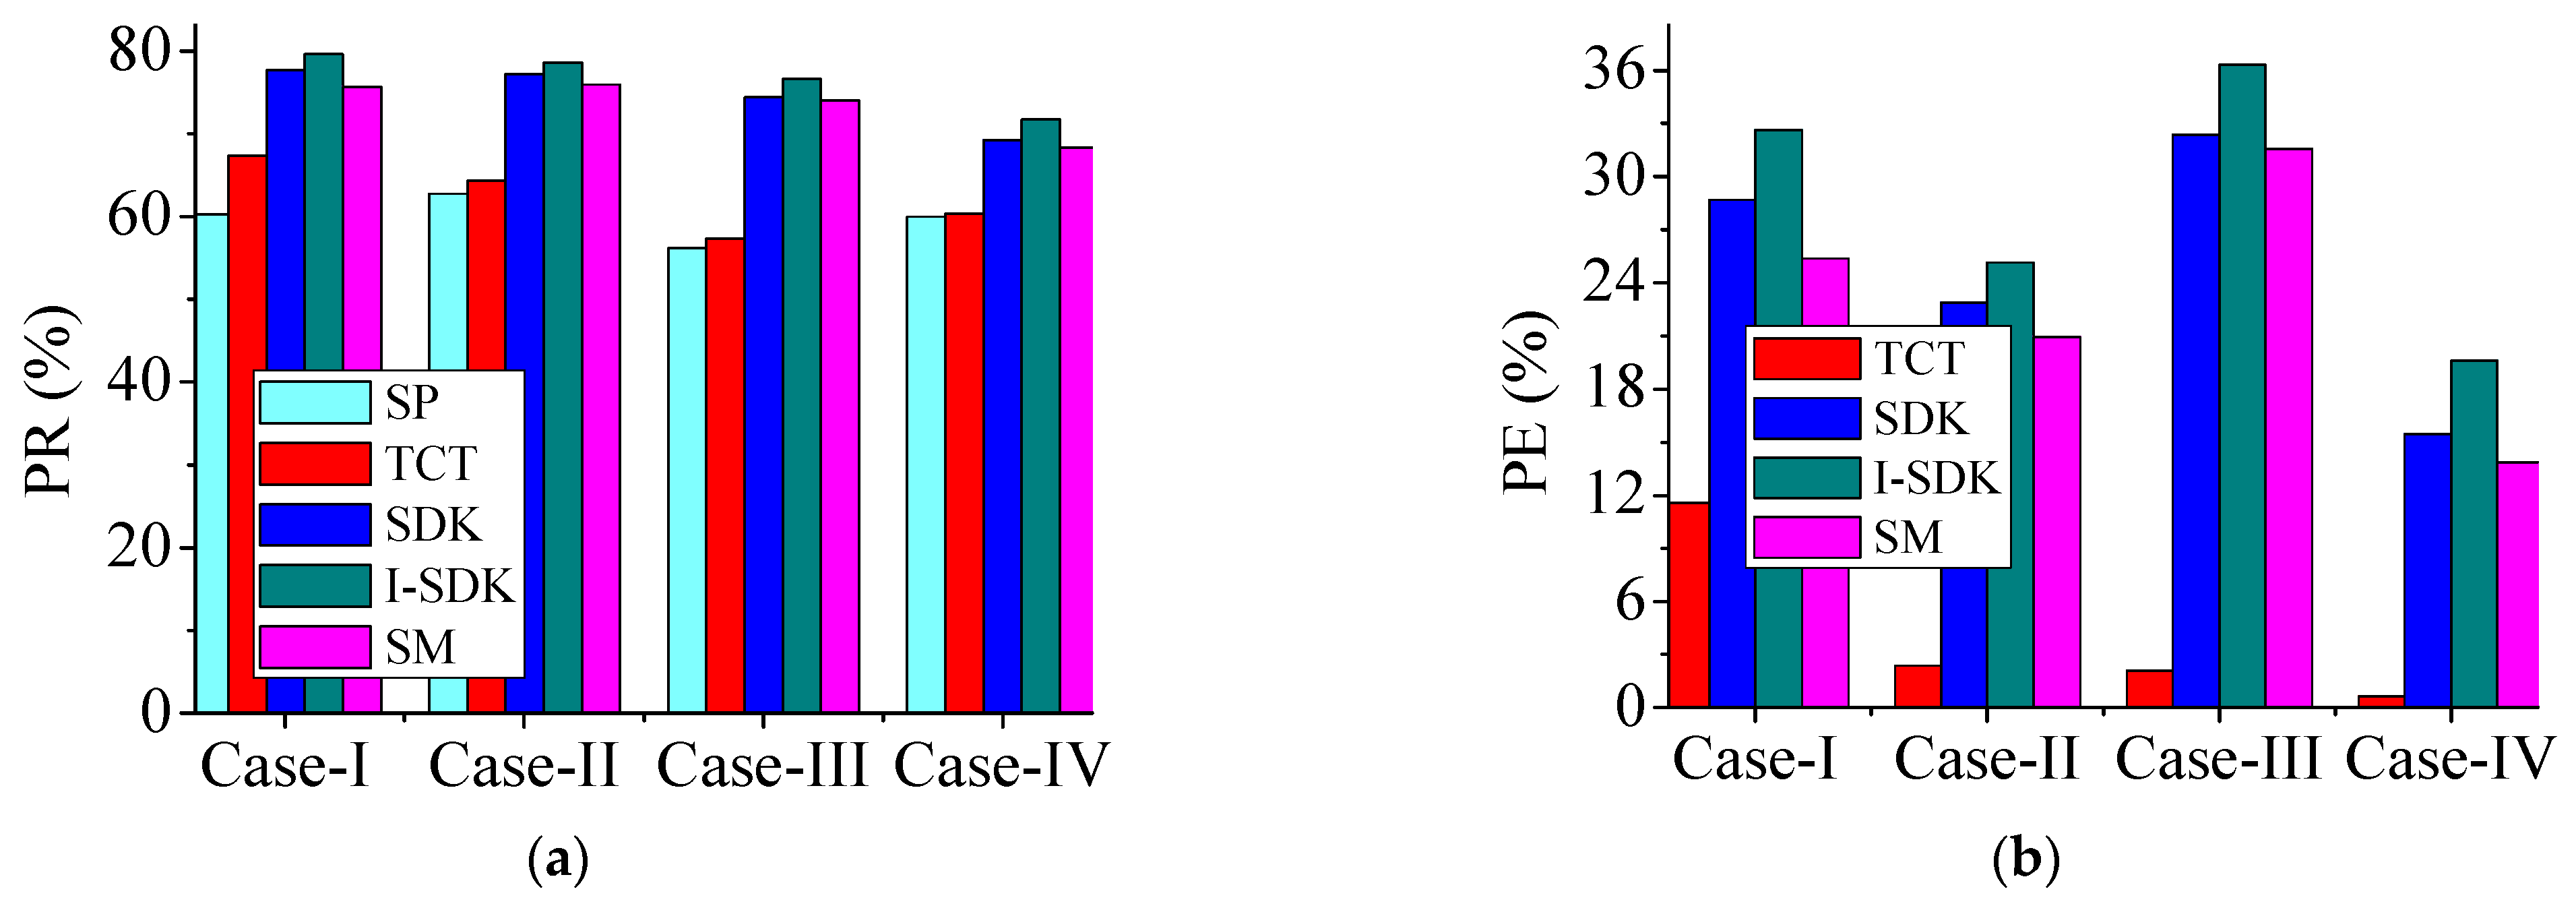
4.4. PR and PE Analysis

The PR and PE analysis was performed using MATLAB/Simulink, as illustrated in Figure 19. When compared to SP, TCT, SDK and SM arrangements, I-SDK had the highest PR of 79.63%, 78.63%, 76.63% and 71.75% in shading patterns I-IV.
In addition to this, the PE was investigated under shading scenarios I-IV, though MATLAB/Simulink analysis was observed to be highest as 32.62%, 25.17%, 36.32% and 19.61% compared to TCT (11.59%, 2.38%, 2.07% and 0.64%), SDK (28.17%, 22.87%, 32.37%, 15.44%) and SM (25.39%, 20.93%, 31.58%, 13.87%) configurations.

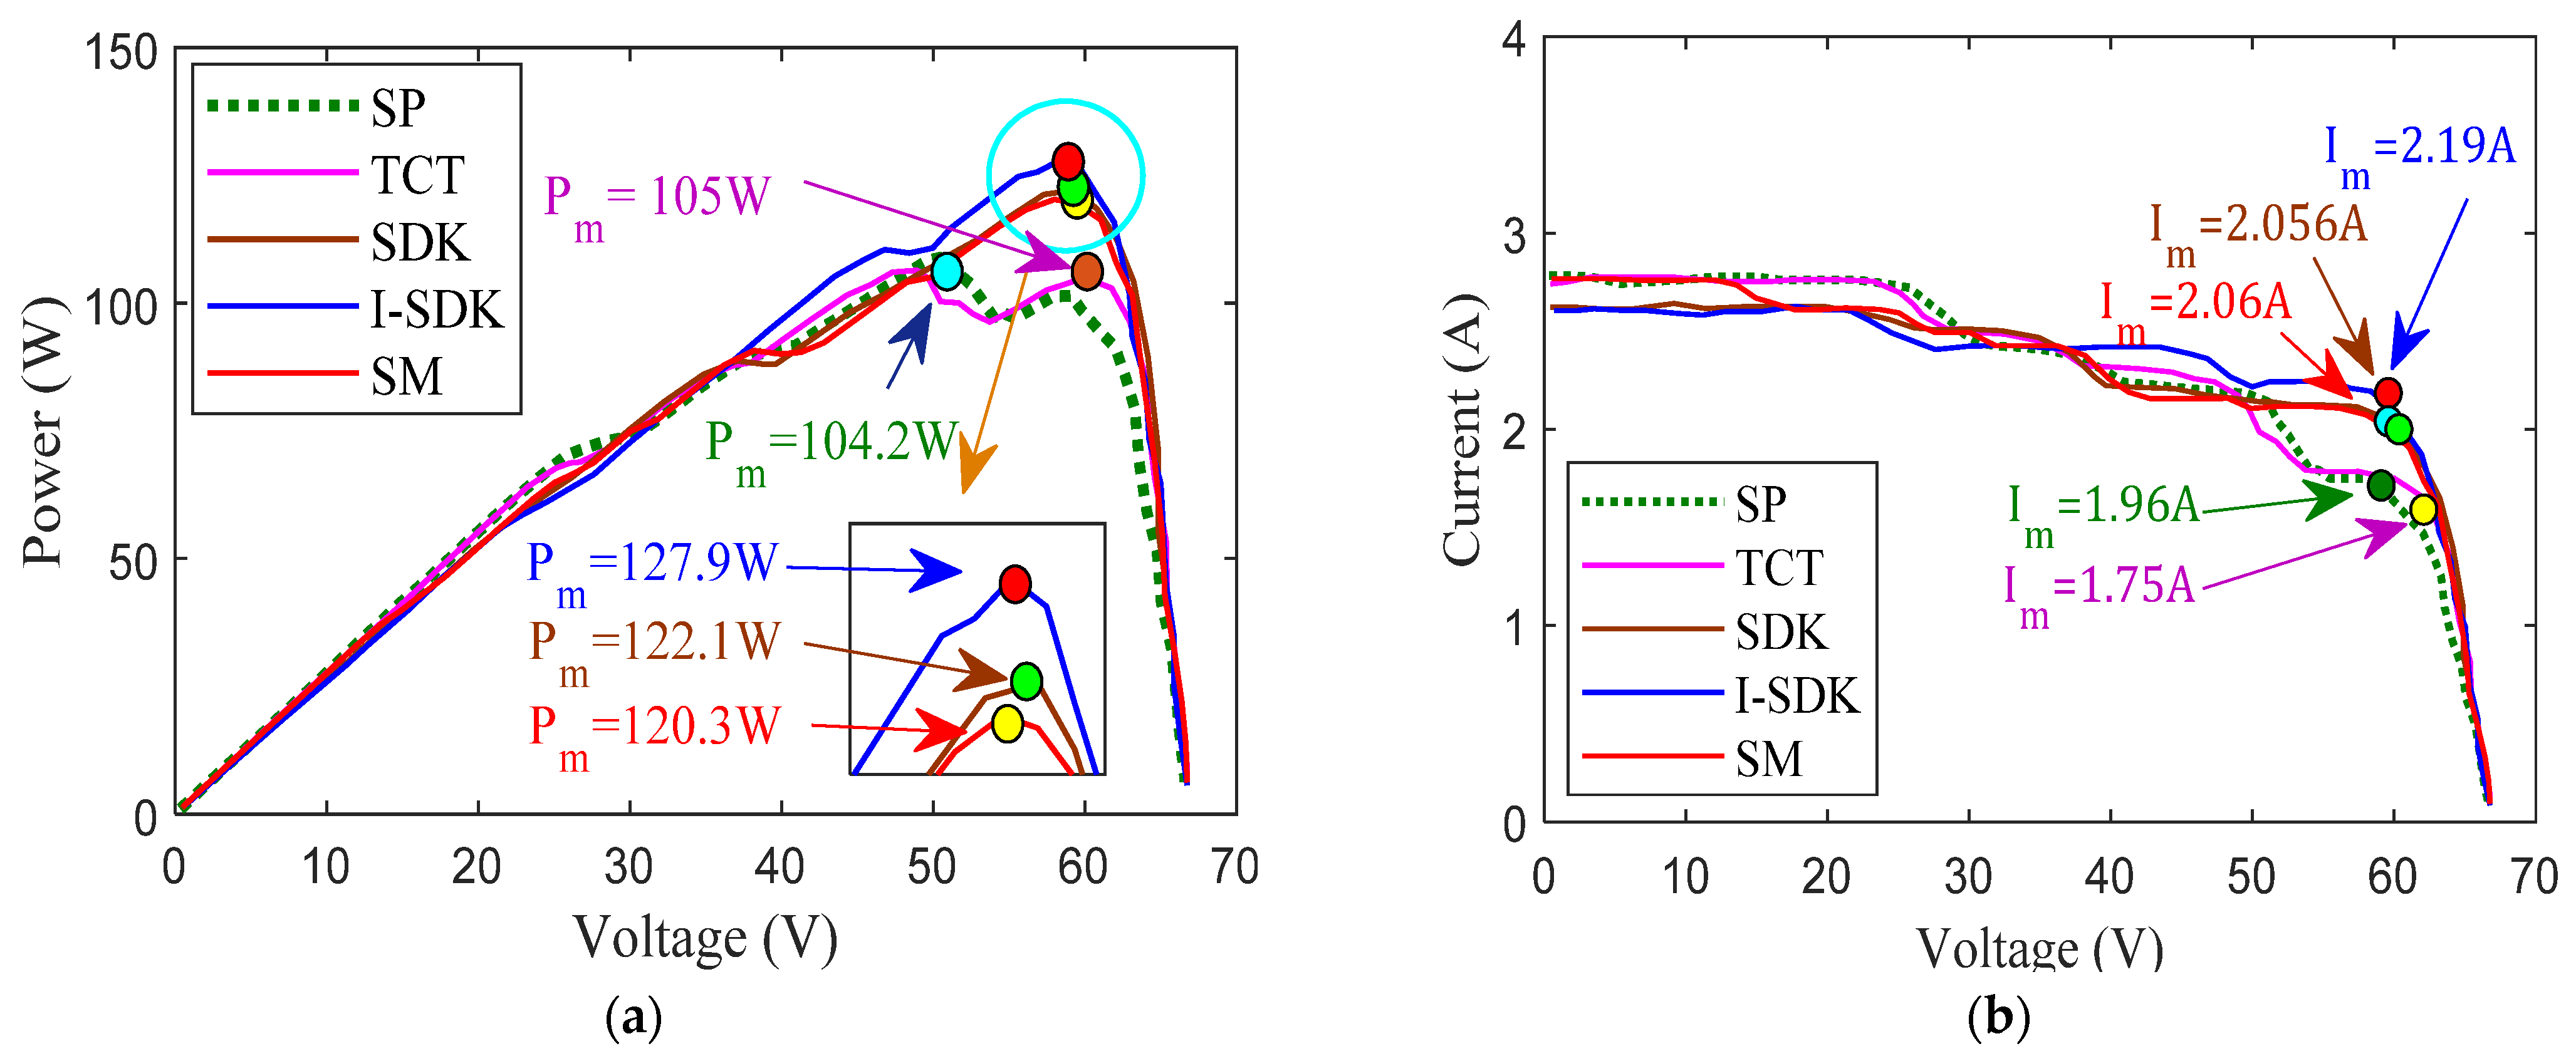
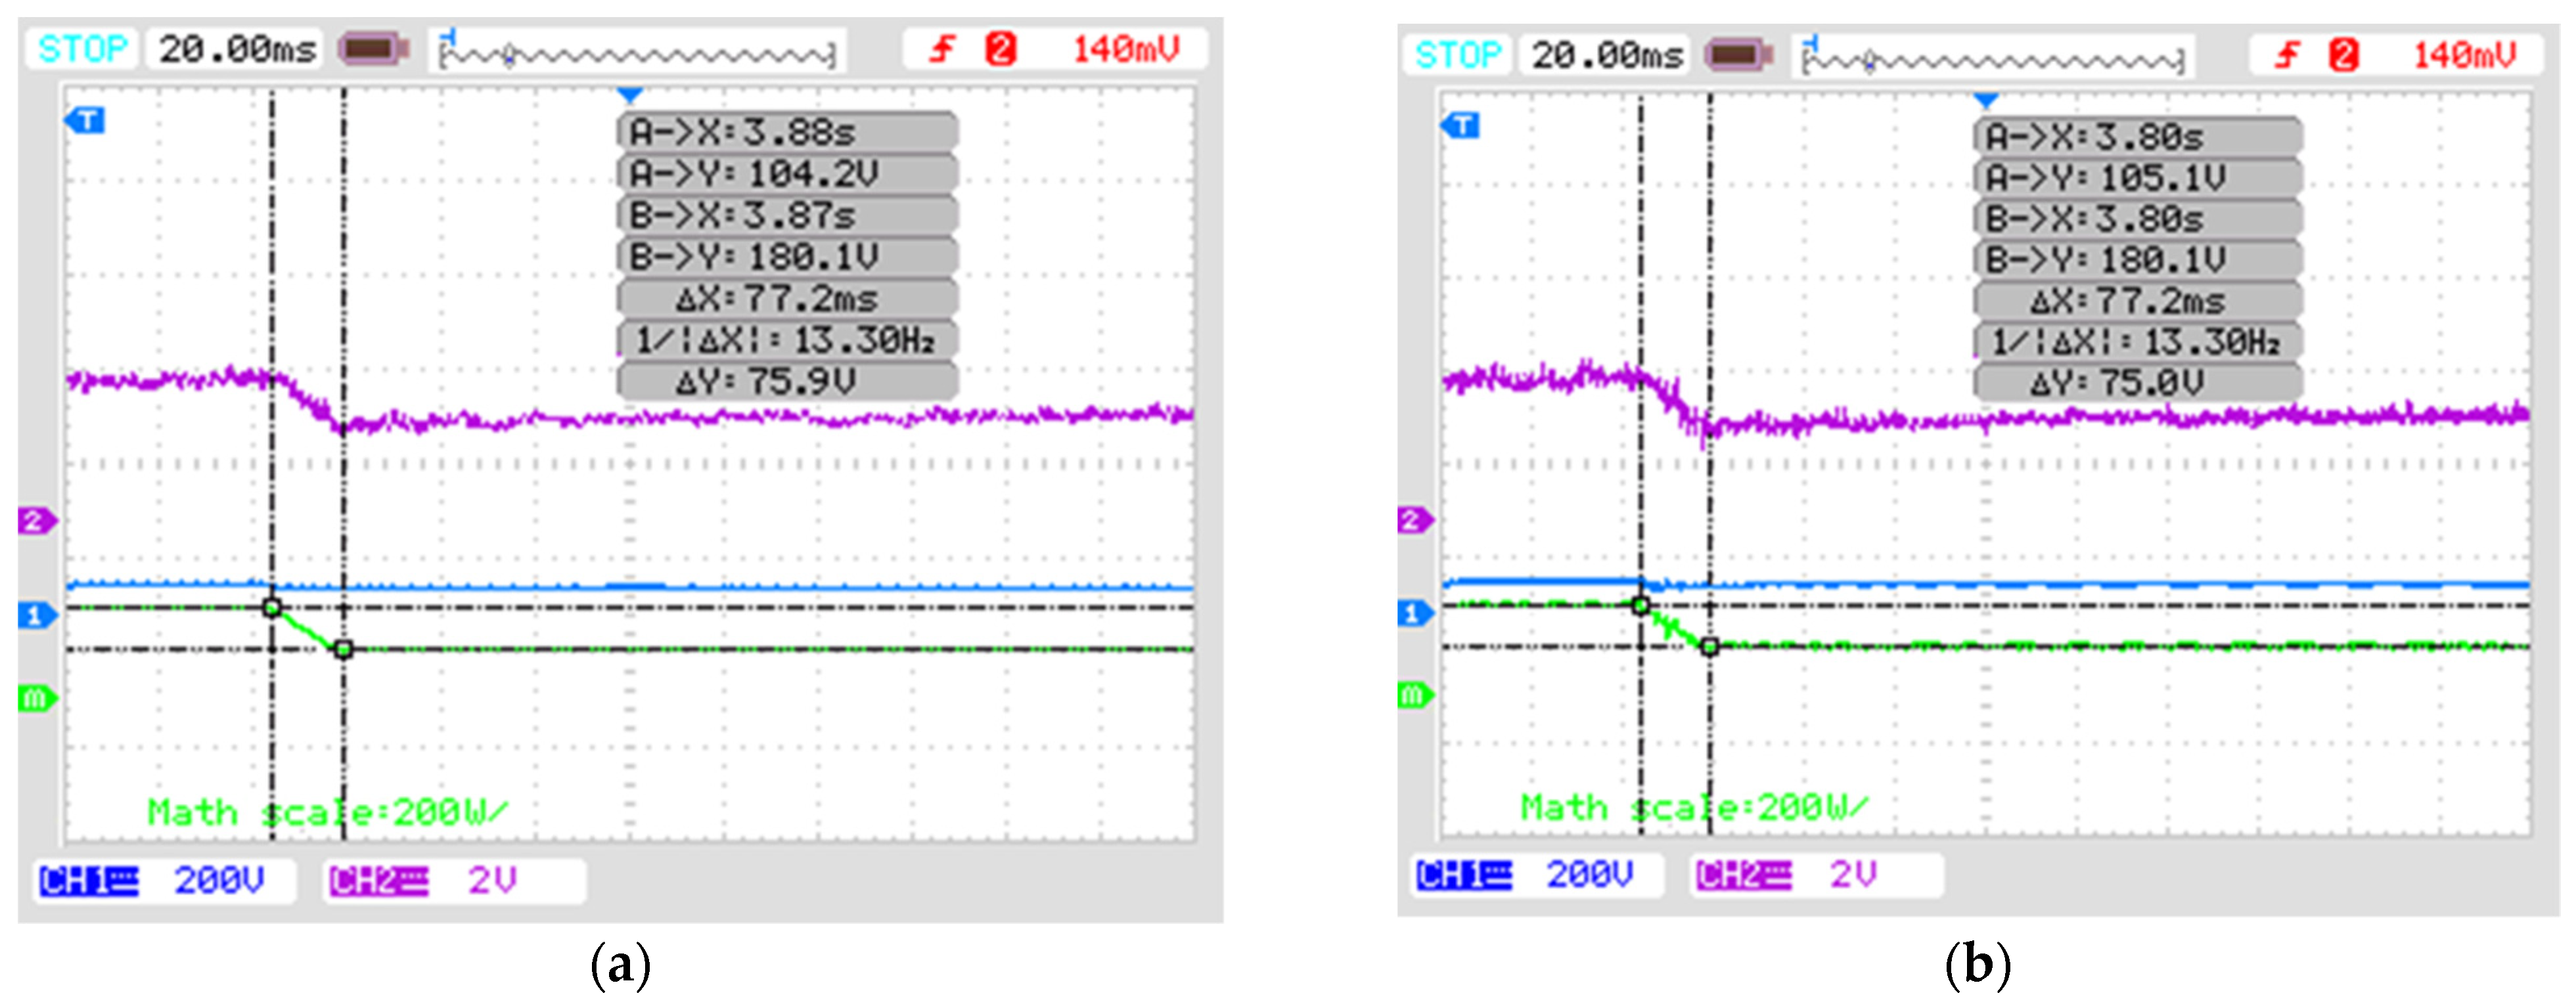
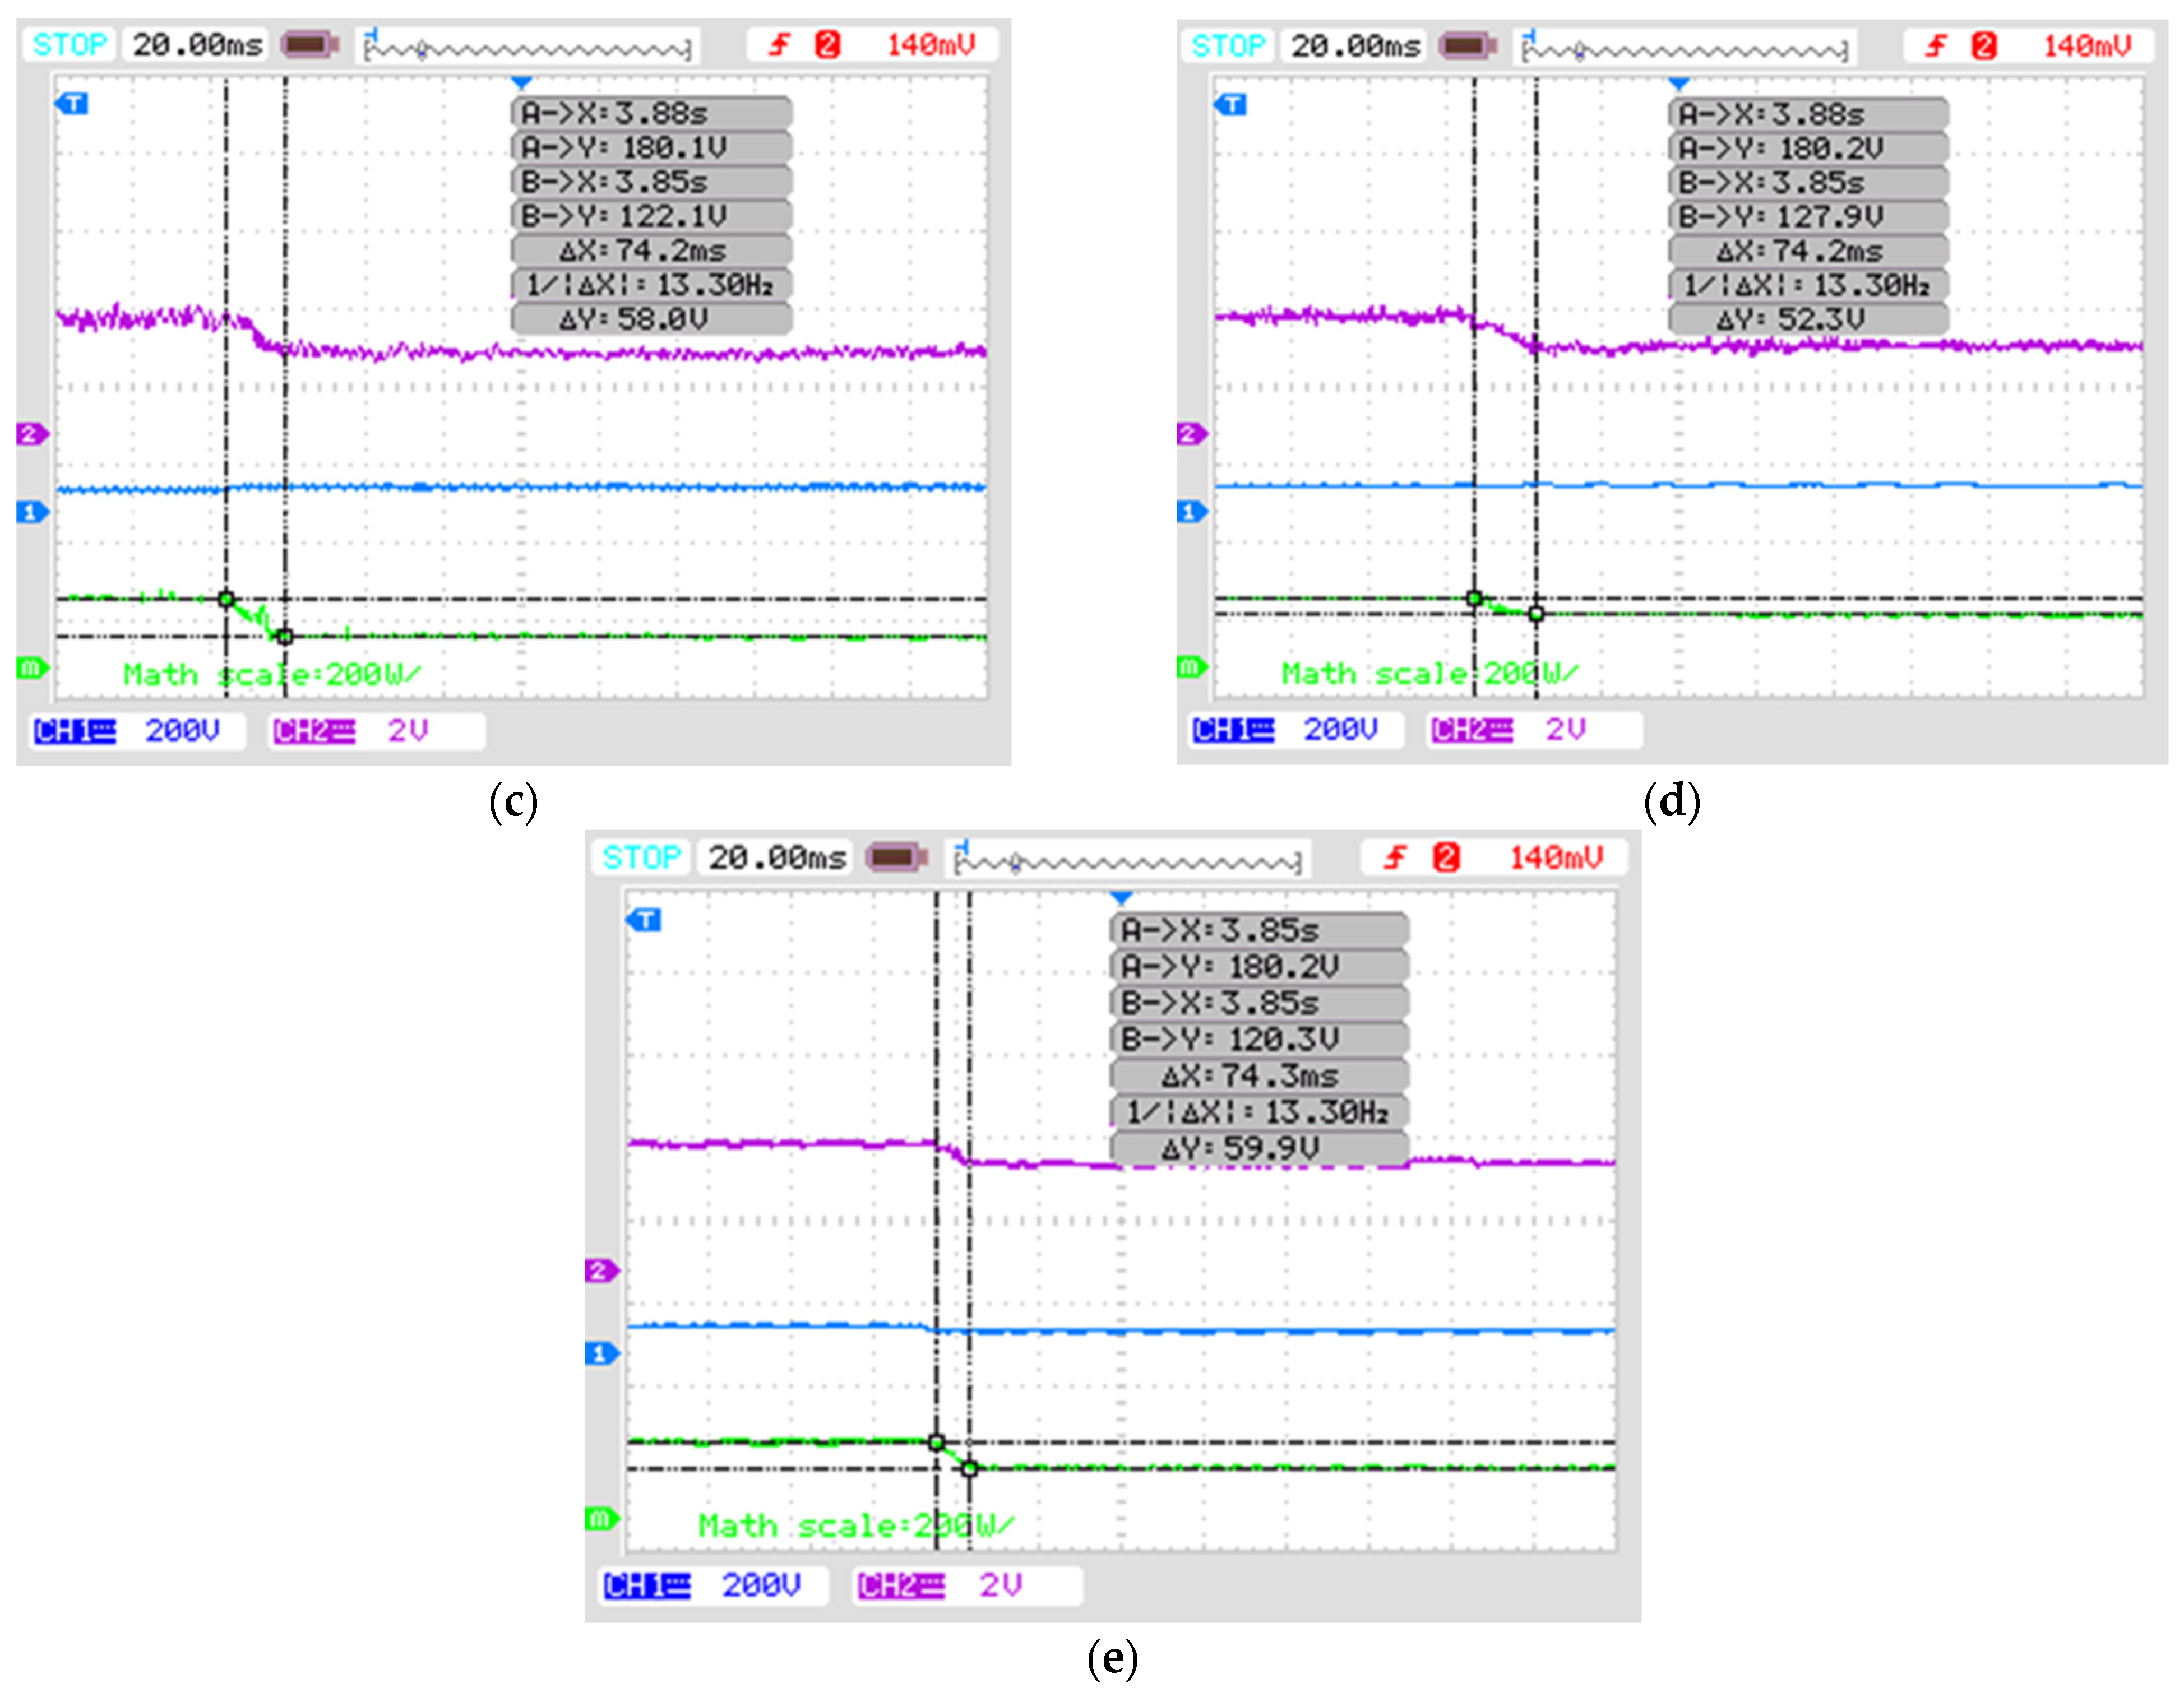
4.5. Experimental Study: P-V and I-V Curves under Shading Case-IV

This research investigated the effect of shading on the electrical performance of typical SP, TCT, SDK, SM and I-SDK puzzle-based designs. The P-V curve for each of the four PV array installations is given in Figure 20a,b for shading scenarios I–IV.
The presence of numerous power maximum points on P-V curves defined the position of the GMPP. In terms of shading case-IV, the GMPP for the SP, TCT, SDK and SM models were 104.2 W, 105 W, 122.1 W and 120.3 W, respectively. The I-SDK-based setup outperformed the other PV topologies in terms of power at GMPP (127.9 W) due to its shade dispersion capabilities.
I-V characteristics of the I-SDK configuration were smoother than those of the SP, TCT, SDK and SM puzzle-based setups. Under the scrutiny of shading scenario-IV, the ISC values were discovered to be 2.61 A for the I-SDK configuration. Furthermore, the I S C values for all PV arrays based on SP, TCT, SDK and SM configurations were 2.8 A, 2.8 A, 2.62 A and 2.62.A, respectively. In addition, the quantitative observation during experimentation is reported in Table 7.
A transient analysis of electrical performance characteristics was monitored during experimental activities to verify the results. Under shading pattern-I, the maximum current, voltage and power were settled from ideal/rated power (180 W) to 104.2 W (SP), 105 W (TCT) and 122.1 W (SDK), 127.9 W (I-SDK) and 120.3 W (SM), respectively, and are shown in Figure 21 as

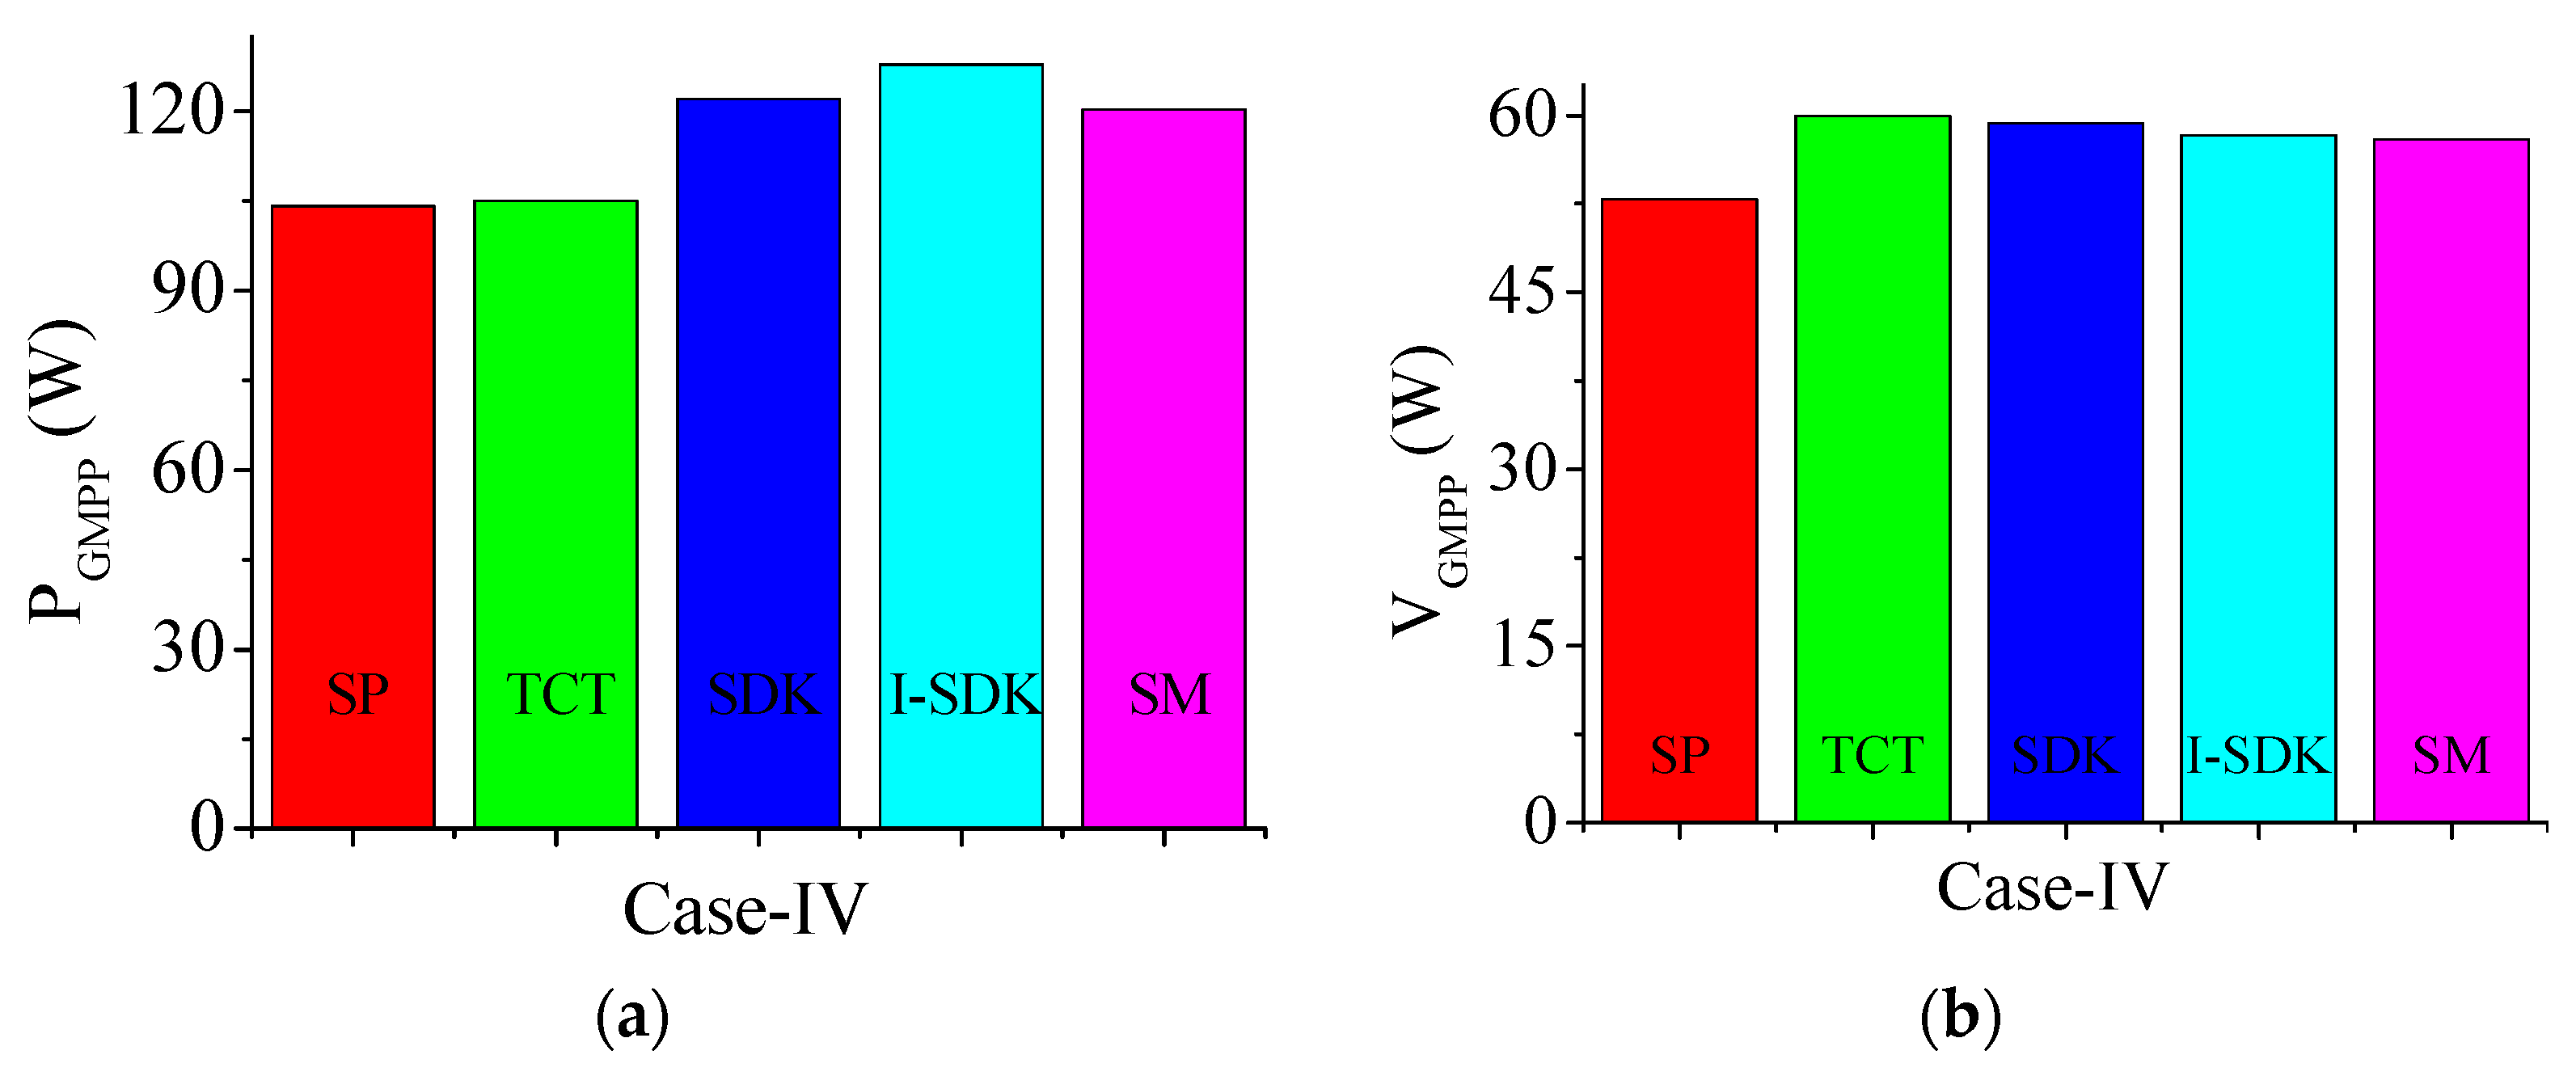
4.6. Power and Voltage at GMPP

In addition, when compared to traditional SP, TCT, SDK and SM configurations, I-SDK setups produced more power at GMPP of 127.9 W.
Under shading case-IV, the SP, TCT, SDK, I-SDK and SM setups had different voltages at GMPP (52.90 V, 59.97 V, 59.36 V, 58.34 V and 58 V). Figure 22 is a bar chart depicting the power and voltage at GMPP.

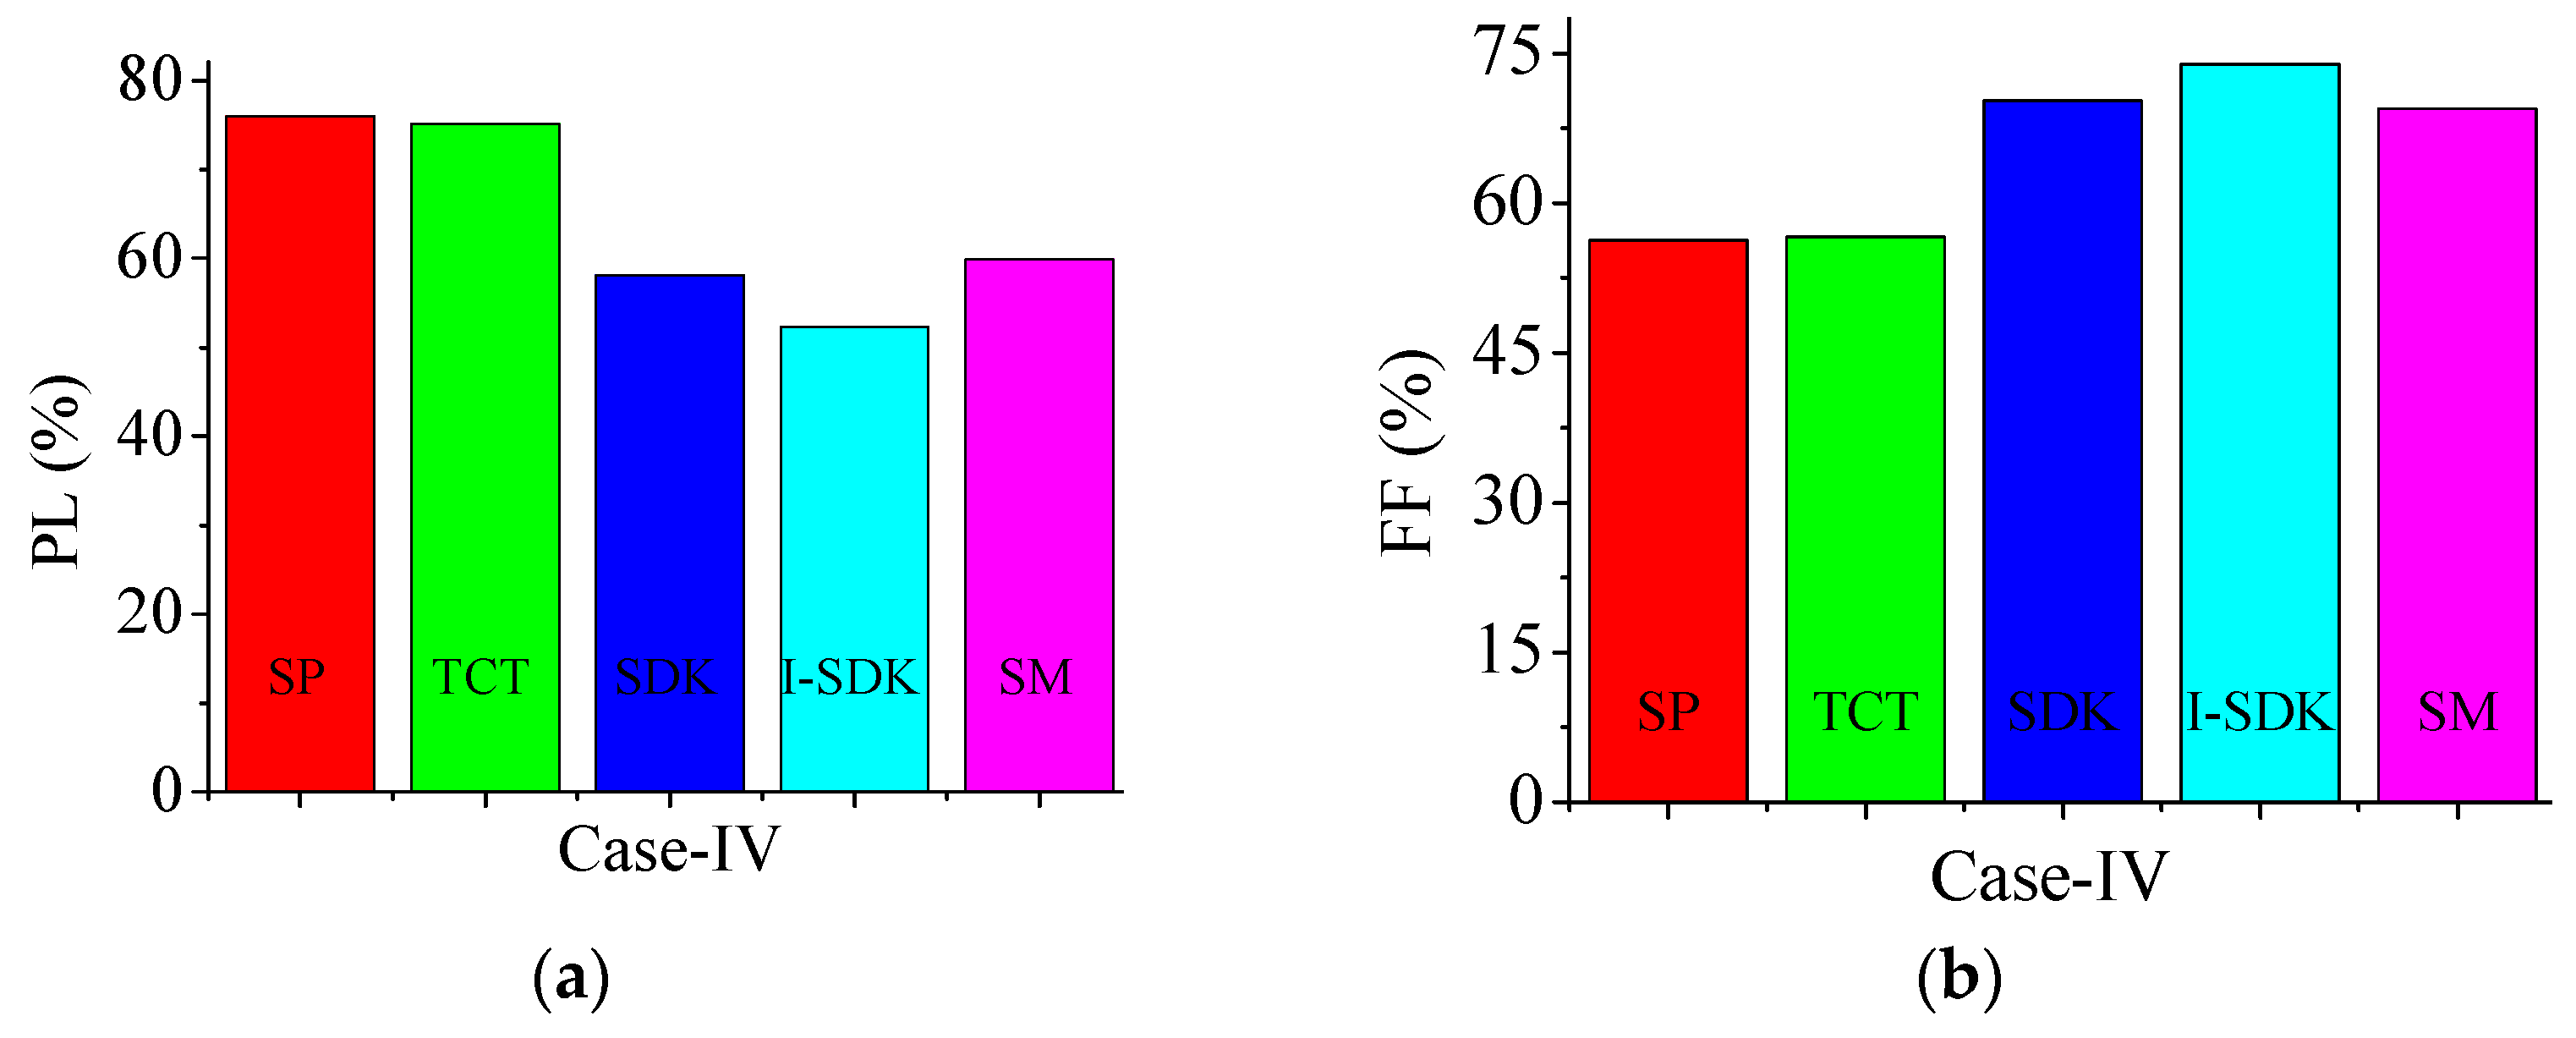
4.7. PL and FF Analysis

According to a recent experimental investigation, the I-SDK configuration had the lowest PL of 29.02% for performance evaluation during shading case-IV. I-SDK had lower PL values than the SP, TCT, SDK and SM setups according to the bar chart analysis in Figure 23.
Experimental research was carried out under comparable lighting conditions as in Case-IV. As a result, the I-SDK setup had a higher FF of 73.91%, validating the MATLAB/Simulink study results.

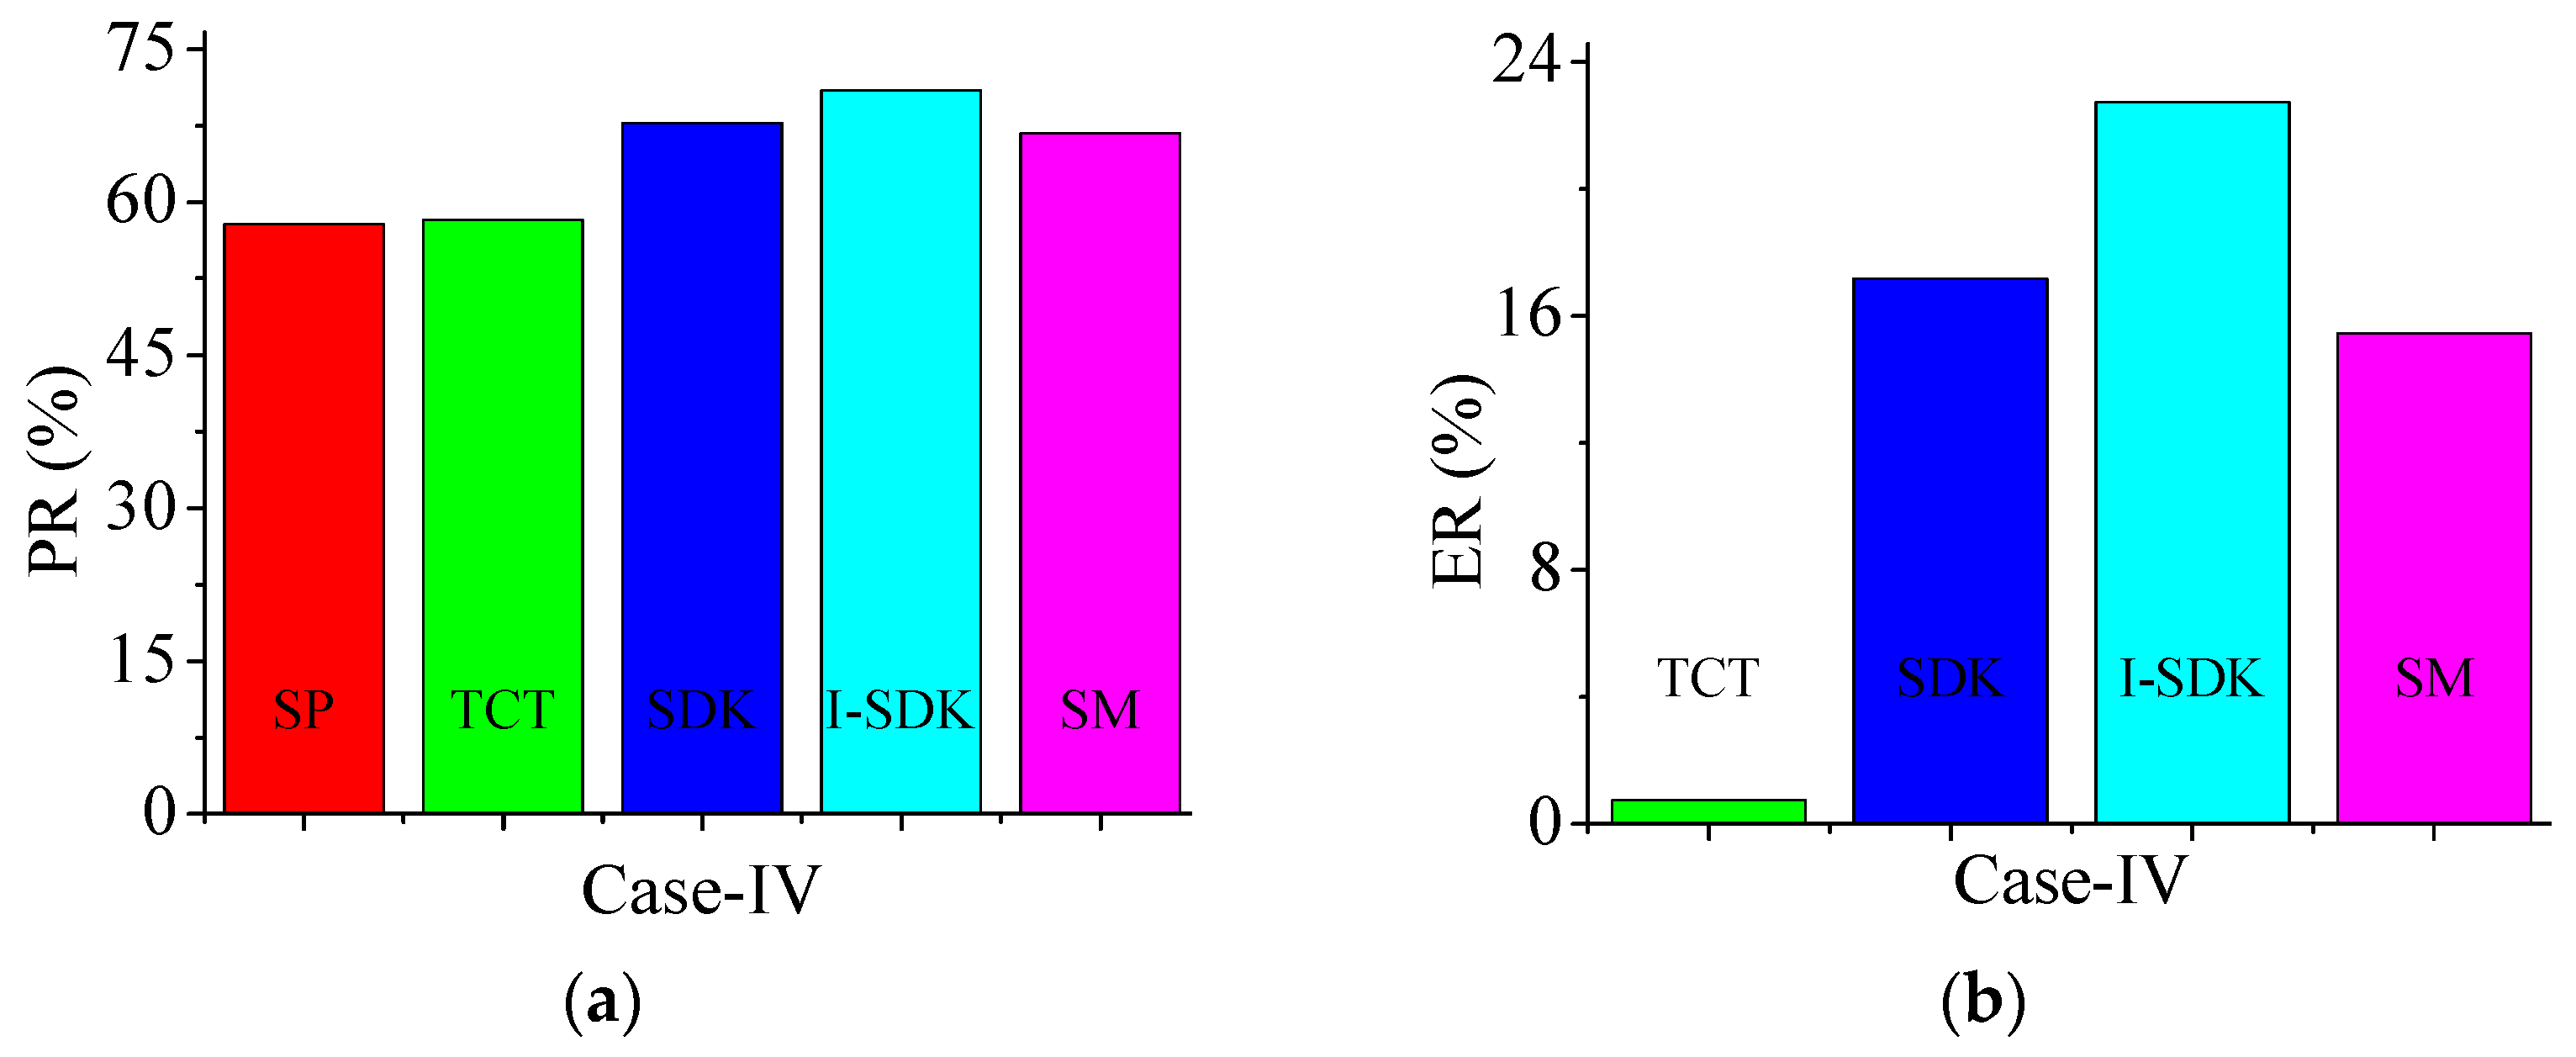
4.8. PR and PE Analysis

The experimental study was conducted for PR assessment. When compared to SP, TCT, SDK and SM arrangements, I-SDK had the highest PR of 70.97% in shading patterns IV.
The experimental value of PE was detected and certified as 22.74% during the shading case-IV experimental investigation. For experimental research, PR and PE analysis are depicted as a bar chart in Figure 24.

4.9. Comparison of Simulation and Experimental Results under Shading Case-IV

The key performance parameters were investigated during the MATLAB/Simulink study and validated through an experimental study under shading case-IV. Table 8 was explored to show the difference between the key parameters during both the studies under shading case-IV as:

5. Conclusions

An I-SDK shade dispersion configuration approach was proposed in this study to increase a PV array’s power generation under PSCs. A MATLAB/Simulink model was used to assess the performance of several 6 × 6 size PV array configurations, such as TCT, SDK, I-SDK and SM, for various parameters such as power at GMPP, FF, PL and PE.
  • In shading scenario-I, the minimized PL for I-SDK configuration was quite a bit less as 36.7 W compared to SP (71.5 W), TCT (58.3 W), SDK (41 W) and SM (43.9) configurations. Furthermore, the maximum FF was found to be 74.61% for the I-SDK configuration, which is more than the SP (50.13%), TCT (55.45%), SDK (73.30%) and SM (69.24%) configurations, respectively. The power at GMPP of the I-SDK configuration was found to be highest compared to conventional configurations, at 143.5 W
  • In shading scenario-II, the PL in the I-SDK configuration was observed to be smaller, at 38.5 W, compared to SP (67 W), TCT (64.9 W), SDK (41.1 W) and SM (43.3 W) configurations. In the I-SDK configuration, the FF also had a maximum value of 76.10%, which is more than other existing PV array configurations.
When compared to the SP, TCT, SDK and SM configurations under different shading patterns, the improved I-SDK configuration enhanced the global maximum power, uniformly dispersed the shading influence and minimized the PL. In addition, an experimental inquiry was conducted to analyze the data and determine the practicality of the proposal. Using machine learning and artificial intelligence techniques, new puzzle-solving algorithms can be developed for dealing with realistic shading situations on a more generic scale. More research and development into reconfigurable PV array technology is needed to get us closer to commercial viability in the future using metaheuristics techniques to enhance the shade dispersion factor.

Author Contributions

Conceptualization, B.A.; Methodology, B.A.; Software, S.B.T.; Formal analysis, R.K.P.; Resources, B.V.A.; Data curation, R.K.P. and S.B.T.; Writing—original draft, B.A.; Writing—review & editing, R.K.P. and S.B.T.; Visualization, B.V.A.; Project administration, B.V.A. All authors have read and agreed to the published version of the manuscript.

Funding

Authors would like to acknowledge the support of the Deputy for Research and Innovation- Ministry of Education, Kingdom of Saudi Arabia for this research through a grant (NU/IFC/2/SERC/-/25) under the Institutional Funding Committee at Najran University, Kingdom of Saudi Arabia.

Institutional Review Board Statement

Not applicable.

Informed Consent Statement

Not applicable.

Data Availability Statement

No new data were created or analyzed in this study. Data sharing is not applicable to this article.

Conflicts of Interest

The authors declare no conflict of interest.

Copyright License Disclaimer

MATLAB software (R2023a) license is registered with the UPES, Dehradun and Simulink study is carried out in the manuscript.

References

  1. Bai, J.; Cao, Y.; Hao, Y.; Zhang, Z.; Liu, S.; Cao, F. Characteristic output of PV systems under partial shading or mismatch conditions. Sol. Energy 2015, 112, 41–54. [Google Scholar] [CrossRef]
  2. Report Is Available IEA, Renewables 2020, IEA, Paris. Available online: https://www.iea.org/reports/renewables-2020 (accessed on 28 March 2022).
  3. Fu, X.; Zhou, Y. Collaborative Optimization of PV Greenhouses and Clean Energy Systems in Rural Areas. IEEE Trans. Sustain. Energy 2023, 14, 642–656. [Google Scholar] [CrossRef]
  4. Chow, T.T. Review on photovoltaic/thermal hybrid solar technology. Appl. Energy 2010, 87, 365–379. [Google Scholar] [CrossRef]
  5. Fu, X. Statistical machine learning model for capacitor planning considering uncertainties in photovoltaic power. Prot. Control Mod. Power Syst. 2022, 7, 51–63. [Google Scholar] [CrossRef]
  6. Ibrahim, A.; Othman, M.Y.; Ruslan, M.H.; Mat, S.; Sopian, K. Recent advances in flat plate photovoltaic/thermal (PV/T) solar collectors. Renew. Sustain. Energy Rev. 2011, 15, 352–365. [Google Scholar] [CrossRef]
  7. Raju, V.B.; Chengaiah, C. A Comprehensive Study on Re-arrangement of Modules Based TCT Configurations of Partial Shaded PV Array with Shade Dispersion Method. Trends Renew. Energy 2020, 6, 37–60. [Google Scholar] [CrossRef]
  8. Nasiruddin, I.; Khatoon, S.; Jalil, M.F.; Bansal, R.C. Shade diffusion of partial shaded PV array by using odd-even structure. Sol. Energy 2019, 181, 519–529. [Google Scholar] [CrossRef]
  9. Pachauri, R.K.; Mahela, O.M.P.; Member, S. Impact of Partial Shading on Various PV Array Configurations and Different Modeling Approaches: A Comprehensive Review. IEEE Access 2020, 8, 181375–181403. [Google Scholar] [CrossRef]
  10. Ul-Haq, A.; Alammari, R.; Iqbal, A.; Jalal, M.; Gul, S. Computation of Power Extraction from Photovoltaic Arrays under Various Fault Conditions. IEEE Access 2020, 8, 47619–47639. [Google Scholar] [CrossRef]
  11. Pachauri, R.; Singh, R.; Gehlot, A.; Samakaria, R.; Choudhury, S. Experimental analysis to extract maximum power from PV array reconfiguration under partial shading conditions. Eng. Sci. Technol. Int. J. 2019, 22, 109–130. [Google Scholar] [CrossRef]
  12. Gul, S.; Haq, A.U.; Jalal, M.; Anjum, A.; Khalil, I.U. A unified approach for analysis of faults in different configurations of PV arrays and its impact on power grid. Energies 2019, 13, 156. [Google Scholar] [CrossRef] [Green Version]
  13. Pachauri, R.; Yadav, A.S.; Chauhan, Y.K.; Sharma, A.; Kumar, V. Shade dispersion-based photovoltaic array configurations for performance enhancement under partial shading conditions. Int. Trans. Electr. Energy Syst. 2018, 28, e2556. [Google Scholar] [CrossRef]
  14. Sahu, H.S.; Nayak, S.K.; Mishra, S. Maximizing the Power Generation of a Partially Shaded PV Array. IEEE J. Emerg. Sel. Top. Power Electron. 2016, 4, 626–637. [Google Scholar] [CrossRef]
  15. Pareek, S.; Dahiya, R. Enhanced power generation of partial shaded photovoltaic fields by forecasting the interconnection of modules. Energy 2016, 95, 561–572. [Google Scholar] [CrossRef]
  16. Samikannu, S.M.; Namani, R.; Subramaniam, S.K. Power enhancement of partially shaded PV arrays through shade dispersion using magic square configuration. J. Renew. Sustain. Energy 2016, 8. [Google Scholar] [CrossRef]
  17. Yadav, A.S.; Pachauri, R.K.; Chauhan, Y.K. Comprehensive investigation of PV arrays with puzzle shade dispersion for improved performance. Sol. Energy 2016, 129, 256–285. [Google Scholar] [CrossRef]
  18. Yadav, A.S.; Pachauri, R.K.; Chauhan, Y.K.; Choudhury, S.; Singh, R. Performance enhancement of partially shaded PV array using novel shade dispersion effect on magic-square puzzle configuration. Sol. Energy 2017, 144, 780–797. [Google Scholar] [CrossRef]
  19. Vijayalekshmy, S.; Bindu, G.R.; Iyer, S.R. A novel Zig-Zag scheme for power enhancement of partially shaded solar arrays. Sol. Energy 2016, 135, 92–102. [Google Scholar] [CrossRef]
  20. Bana, S.; Saini, R.P. Experimental investigation on power output of different photovoltaic array configurations under uniform and partial shading scenarios. Energy 2017, 127, 438–453. [Google Scholar] [CrossRef]
  21. Satpathy, P.R.; Sharma, R.; Jena, S. A shade dispersion interconnection scheme for partially shaded modules in a solar PV array network. Energy 2017, 139, 350–365. [Google Scholar] [CrossRef]
  22. Bosco, M.J.; Mabel, M.C. A novel cross diagonal view configuration of a PV system under partial shading condition. Sol. Energy 2017, 158, 760–773. [Google Scholar] [CrossRef]
  23. Djilali, N.; Djilali, N. PV array power output maximization under partial shading using new shifted PV array arrangements. Appl. Energy 2017, 187, 326–337. [Google Scholar]
  24. Pareek, S.; Chaturvedi, N.; Dahiya, R. Optimal interconnections to address partial shading losses in solar photovoltaic arrays. Sol. Energy 2017, 155, 537–551. [Google Scholar] [CrossRef]
  25. Vengatesh, R.P.; Rajan, S.E. Analysis of PV module connected in different configurations under uniform and non-uniform solar- radiations. Int. J. Green Energy 2016, 13, 1507–1516. [Google Scholar] [CrossRef]
  26. Malathy, S.; Ramaprabha, R. Reconfiguration strategies to extract maximum power from photovoltaic array under partially shaded conditions. Renew. Sustain. Energy Rev. 2018, 81, 2922–2934. [Google Scholar] [CrossRef]
  27. Pillai, D.S.; Ram, J.P.; Nihanth, M.S.S.; Rajasekar, N. A simple, sensorless and fixed reconfiguration scheme for maximum power enhancement in PV systems. Energy Convers. Manag. 2018, 172, 402–417. [Google Scholar] [CrossRef]
  28. Krishna, G.S.; Moger, T. Improved SuDoKu reconfiguration technique for total-cross-tied PV array to enhance maximum power under partial shading conditions. Renew. Sustain. Energy Rev. 2019, 109, 333–348. [Google Scholar] [CrossRef]
  29. Premkumar, M.; Subramaniam, U.; Babu, T.S.; Elavarasan, R.M.; Mihet-Popa, L. Evaluation of mathematical model to characterize the performance of conventional and hybrid PV array topologies under static and dynamic shading patterns. Energies 2020, 13, 3216. [Google Scholar] [CrossRef]
  30. Sagar, G.; Pathak, D.; Gaur, P.; Jain, V. A Su-Do-Ku puzzle based shade dispersion for maximum power enhancement of partially shaded hybrid bridge-link-total-cross-tied PV array. Sol. Energy 2020, 204, 161–180. [Google Scholar] [CrossRef]
  31. Siva, M.; Nihanth, S.; Ram, J.P.; Pillai, D.S.; Ghias, A.M.Y.M. Enhanced power production in PV arrays using a new skyscraper puzzle based one-time recon fi guration procedure under partial shade conditions (PSCs). Sol. Energy 2019, 194, 209–224. [Google Scholar]
  32. Thanikanti, S.B.; Kumar, P.; Devakirubakaran, S.; Aljafari, B.; Colak, I. A dynamic mismatch loss mitigation algorithm with dual input dual output converter for solar PV systems. Sol. Energy Mater. Sol. Cells 2023, 251, 112163. [Google Scholar] [CrossRef]
  33. Rani, B.I.; Ilango, G.S.; Nagamani, C. Enhanced Power Generation From PV Array Under Partial Shading Conditions by Shade Dispersion Using Su Do Ku Configuration. IEEE Trans. Sustain. Energy 2013, 4, 594–601. [Google Scholar] [CrossRef]
  34. Aljafari, B.; Balachandran, P.K.; Samithas, D.; Thanikanti, S.B. Solar photovoltaic converter controller using opposition-based reinforcement learning with butterfly optimization algorithm under partial shading conditions. Environ. Sci. Pollut. Res. 2023, 30, 72617–72640. [Google Scholar] [CrossRef] [PubMed]
Figure 1. PV cell: electrical equivalent model [32].
Sustainability 15 11852 g001
Figure 2. SP arrangement of PV array.
Sustainability 15 11852 g002
Figure 3. PV module arrangements in TCT configuration (6 × 6 size). (a) Nomenclature, (b) placement of PV module.
Sustainability 15 11852 g003
Figure 4. (a) Number placement for I-SDK; (b) number placement for SDK; (c) electrical connections for SDK (d) methodology to achieve SDK game theory.
Sustainability 15 11852 g004aSustainability 15 11852 g004b
Figure 5. (a) Row, column and single diagonal property; (b) repeated submatrix elements.
Sustainability 15 11852 g005
Figure 6. Methodology to achieve SM game theory.
Sustainability 15 11852 g006
Figure 7. (a) Nomenclature of PV modules; (b) PV module arrangements for SM configuration.
Sustainability 15 11852 g007
Figure 8. Developed experimental setup for comprehensive study during PSCs.
Sustainability 15 11852 g008
Figure 9. Flow chart for data logger operation.
Sustainability 15 11852 g009
Figure 10. (a) I-V (b) P-V curves under STC and nonuniform irradiation levels.
Sustainability 15 11852 g010
Figure 11. (ae) Shade dispersion profiles for pattern-I.
Sustainability 15 11852 g011
Figure 12. (ae) Shade dispersion profiles for pattern-II.
Sustainability 15 11852 g012
Figure 13. (ae) Shade dispersion profiles for the pattern-III.
Sustainability 15 11852 g013
Figure 14. (ae) Shade profiles based on the reconfigured PV array.
Sustainability 15 11852 g014
Figure 15. (ad) P-V curves of SP, TCT, SDK, I-SDK and SM models under shading scenarios: I–IV.
Sustainability 15 11852 g015aSustainability 15 11852 g015b
Figure 16. (ad) I-V curves for SP, TCT, SDK, I-SDK and SM models under shading scenarios: I–IV.
Sustainability 15 11852 g016
Figure 17. (a) Power; (b) voltage at GMPP.
Sustainability 15 11852 g017
Figure 18. (a) PL (b) FF analysis for case I-IV.
Sustainability 15 11852 g018
Figure 19. (a) PR (b) PE analysis for case I-IV.
Sustainability 15 11852 g019
Figure 20. (a,b) I–V curves for SP, TCT, SDK, I-SDK and SM models under shading scenarios-IV.
Sustainability 15 11852 g020
Figure 21. (ae) Steady-state analysis of PV array configurations under shading case-IV.
Sustainability 15 11852 g021aSustainability 15 11852 g021b
Figure 22. (a) Power (b) voltage at GMPP.
Sustainability 15 11852 g022
Figure 23. (a) PL (b) FF analysis case IV.
Sustainability 15 11852 g023
Figure 24. (a) PR (b) PE analysis for case IV.
Sustainability 15 11852 g024
Table 1. PV module specifications (Manf. Universal solar: 5 W, poly-crystalline).
ParametersValues
Maximum   power   ( P m ) 5 W
Maximum   current   ( I m ) 0.52 A
Maximum   voltage   ( V m ) 9.62 V
Open   circuit   voltage   ( V OC ) 11.25 V
Short   circuit   current   ( I SC ) 0.55 A
Table 2. Theoretical assessment: PV performance under shading pattern-I.
Row123456
SP
V   ( V ) V m 2 V m 3 V m 4 V m 5 V m 6 V m
I   ( A ) 6 I m 6 I m 6 I m 4 I m 3.8 I m 3.8 I m
P   ( W ) 6 I m V m 12 I m V m 18 I m V m 16 I m V m 19 I m V m 22.8 I m V m
TCT
V   ( V ) V m 2 V m 3 V m 4 V m 5 V m 6 V m
I   ( A ) 6 I m 6 I m 6 I m 4 I m 3.8 I m 3.8 I m
P   ( W ) 6 I m V m 12 I m V m 18 I m V m 16 I m V m 19 I m V m 22.8 I m V m
SDK
V   ( V ) V m 2 V m 3 V m 4 V m 5 V m 6 V m
I   ( A ) 4.59 I m 4.59 I m 4.59 I m 4.59 I m 5.19 I m 4.38 I m
P   ( W ) 4.59 I m V m 9.18 I m V m 13.77 I m V m 18.36 I m V m 25.95 I m V m 26.28 I m V m
I-SDK
V   ( V ) V m 2 V m 3 V m 4 V m 5 V m 6 V m
I   ( A ) 5.19 I m 4.59 I m 4.38 I m 5.19 I m 5.19 I m 5.0 I m
P   ( W ) 5.19 I m V m 9.18 I m V m 13.14 I m V m 20.76 I m V m 25.95 I m V m 30.06 I m V m
SM
V   ( V ) V m 2 V m 3 V m 4 V m 5 V m 6 V m
I   ( A ) 4.38 I m 5.0 I m 5.38 I m 5.59 I m 4.78 I m 4.38 I m
P   ( W ) 4.38 I m V m 10.0 I m V m 16.14 I m V m 22.36 I m V m 23.9 I m V m 26.28 I m V m
Table 3. Theoretical assessment: PV performance under shading pattern-II.
Row123456
SP
V   ( V ) V m 2 V m 3 V m 4 V m 5 V m 6 V m
I   ( A ) 5.38 I m 5.38 I m 5.38 I m 5 I m 4.38 I m 3.19 I m
P   ( W ) 5.38 I m V m 10.76 I m V m 16.14 I m V m 20 I m V m 21.9 I m V m 19.14 I m V m
TCT
V   ( V ) V m 2 V m 3 V m 4 V m 5 V m 6 V m
I   ( A ) 5.38 I m 5.38 I m 5.38 I m 5 I m 4.38 I m 3.19 I m
P   ( W ) 5.38 I m V m 10.76 I m V m 16.14 I m V m 20 I m V m 21.9 I m V m 19.14 I m V m
SDK
V   ( V ) V m 2 V m 3 V m 4 V m 5 V m 6 V m
I   ( A ) 5.09 I m 4.90 I m 4.5 I m 4.30 I m 5.0 I m 5.0 I m
P   ( W ) 5.09 I m V m 9.80 I m V m 13.5 I m V m 17.2 I m V m 25 I m V m 30 I m V m
I-SDK
V   ( V ) V m 2 V m 3 V m 4 V m 5 V m 6 V m
I   ( A ) 4.59 I m 4.28 I m 4.59 I m 4.88 I m 5.19 I m 5.19 I m
P   ( W ) 4.59 I m V m 8.56 I m V m 13.77 I m V m 19.52 I m V m 25.95 I m V m 31.14 I m V m
SM
V   ( V ) V m 2 V m 3 V m 4 V m 5 V m 6 V m
I   ( A ) 4.88 I m 5.09 I m 4.61 I m 4.28 I m 4.0 I m 5.0 I m
P   ( W ) 4.88 I m V m 10.18 I m V m 13.8 I m V m 17.12 I m V m 20.0 I m V m 30.0 I m V m
Table 4. Theoretical assessment: PV performance under shading pattern-III.
Row123456
SP
V   ( V ) V m 2 V m 3 V m 4 V m 5 V m 6 V m
I   ( A ) 5.38 I m 5.38 I m 5.38 I m 5.19 I m 3.19 I m 3.19 I m
P   ( W ) 5.38 I m V m 10.76 I m V m 16.14 I m V m 20.76 I m V m 15.95 I m V m 19.14 I m V m
TCT
V   ( V ) V m 2 V m 3 V m 4 V m 5 V m 6 V m
I   ( A ) 5.38 I m 5.38 I m 5.38 I m 5.19 I m 3.19 I m 3.19 I m
P   ( W ) 5.38 I m V m 10.76 I m V m 16.14 I m V m 20.76 I m V m 15.95 I m V m 19.14 I m V m
SDK
V   ( V ) V m 2 V m 3 V m 4 V m 5 V m 6 V m
I   ( A ) 4.38 I m 4.78 I m 4.78 I m 4.28 I m 4.78 I m 4.78 I m
P   ( W ) 4.38 I m V m 9.56 I m V m 14.34 I m V m 17.12 I m V m 23.9 I m V m 28.68 I m V m
I-SDK
V   ( V ) V m 2 V m 3 V m 4 V m 5 V m 6 V m
I   ( A ) 4.69 I m 4.78 I m 4.38 I m 4.69 I m 4.78 I m 4.38 I m
P   ( W ) 4.69 I m V m 9.56 I m V m 13.14 I m V m 18.76 I m V m 23.9 I m V m 26.28 I m V m
SM
V   ( V ) V m 2 V m 3 V m 4 V m 5 V m 6 V m
I   ( A ) 4.38 I m 4.38 I m 4.30 I m 4.69 I m 5.19 I m 4.78 I m
P   ( W ) 4.38 I m V m 8.76 I m V m 12.90 I m V m 18.76 I m V m 25.95 I m V m 28.68 I m V m
Table 5. Theoretical assessment: PV performance under shading pattern-IV.
Row123456
SP
V   ( V ) V m 2 V m 3 V m 4 V m 5 V m 6 V m
I   ( A ) 5.03 I m 5.03 I m 5.03 I m 4.42 I m 4.11 I m 3.34 I m
P   ( W ) 5.03 I m V m 10.06 I m V m 15 . 09 I m V m 17.68 I m V m 20.55 I m V m 20.04 I m V m
TCT
V   ( V ) V m 2 V m 3 V m 4 V m 5 V m 6 V m
I   ( A ) 5.03 I m 5.03 I m 5.03 I m 4.42 I m 4.11 I m 3.34 I m
P   ( W ) 5.03 I m V m 10.06 I m V m 15 . 09 I m V m 17.68 I m V m 20.55 I m V m 20.04 I m V m
SDK
V   ( V ) V m 2 V m 3 V m 4 V m 5 V m 6 V m
I   ( A ) 4.42 I m 4.73 I m 4.19 I m 4.19 I m 4.73 I m 4.73 I m
P   ( W ) 4.42 I m V m 9.46 I m V m 12.57 I m V m 16.76 I m V m 23.65 I m V m 28.38 I m V m
I-SDK
V   ( V ) V m 2 V m 3 V m 4 V m 5 V m 6 V m
I   ( A ) 4.73 I m 4.19 I m 3.68 I m 4.73 I m 5.03 I m 4.42 I m
P   ( W ) 4.73 I m V m 8.38 I m V m 11.04 I m V m 18.92 I m V m 25.15 I m V m 26.52 I m V m
SM
V   ( V ) V m 2 V m 3 V m 4 V m 5 V m 6 V m
I   ( A ) 4.42 I m 4.42 I m 4.5 I m 4.5 I m 4.73 I m 4.42 I m
P   ( W ) 4.42 I m V m 8.84 I m V m 13.5 I m V m 18 I m V m 23.65 I m V m 26.52 I m V m
Table 6. MATLAB/Simulink quantitative study of shading scenarios I–IV.
Performance
Parameters
Case-ICase-II
SPTCTSDKI-SDKSMSPTCTSDKI-SDKSM
P G M P P   ( W ) 108.7121.3139.9143.5136.3113.2115.9139.1141.7136.9
V G M P P   ( V ) 60.3559.8258.8258.8159.7350.154958.7157.8158.73
I m   ( A ) 1.802.0272.3782.442.282.252.362.362.452.33
V O C   ( V ) 65.966.366.566.566.566.266.266.5566.5566.55
I S C   ( A ) 3.2993.2992.872.902.962.9692.9692.802.802.77
P L   ( W ) 71.558.34136.743.96764.941.138.543.3
P l o s s   ( % ) 39.632.3522.7520.3624.3637.1836.0122.8021.3624.02
F F   ( % ) 50.1355.4573.3074.6169.2457.7658.9774.6476.1074.21
PR (%)60.3267.3177.6379.6375.6362.8164.3177.1978.6375.97
P E   ( % ) w.r.t TCT-11.5928.7032.6225.39-2.3822.8725.1720.93
Best topologyI-SDKI-SDK
Performance
Parameters
Case-IIICase-IV
SPTCTSDKI-SDKSMSPTCTSDKI-SDKSM
P G M P P   ( W ) 101.3103.4134.1138.1133.3108.1108.8124.8129.3123.1
V G M P P   ( V ) 37.637.658.1858.1758.1050.5561.059.0858.4359.04
I m   ( A ) 2.692.752.302.372.292.151.752.112.212.08
V O C   ( V ) 65.565.566.166.166.165.465.565.565.565.5
I S C   ( A ) 2.9720972.632.632.852.772.772.772.602.77
P L   ( W ) 78.976.846.142.146.972.171.455.450.957.1
P l o s s   ( % ) 43.7842.6125.5823.3626.0240.0139.6230.7428.2431.68
F F   ( % ) 5257.477.179.470.759.659.9668.7875.9267.8
PR (%)56.2157.3874.4176.6373.9759.9860.3769.2571.7568.31
P E   ( % ) w.r.t TCT-2.0732.3736.3231.58-0.6415.4419.6113.87
Best topologyI-SDKI-SDK
Table 7. Quantitative analysis with experimental shading study- IV.
Performance
Parameters
Case-IV
SPTCTSDKI-SDKSM
P G M P P   ( W ) 104.2105122.1127.9120.3
V G M P P   ( V ) 52.9059.9759.3658.3458
I m   ( A ) 1.961.752.052.192.06
V O C   ( V ) 66.166.266.366.366.1
I S C   ( A ) 2.82.82.622.612.62
P L   ( W ) 7675.258.152.359.9
P l o s s   ( % ) 42.1741.7332.2429.0233.24
F F   ( % ) 56.2956.6470.2973.9169.46
PR (%) 57.8258.2667.7570.9766.75
P E   ( % ) w.r.t TCT-0.76717.1722.7415.45
Best topologyI-SDK
Table 8. Parameters for Simulink and experimental studies under shading case-IV.
ParametersSimulink StudyExperimental Study
GMPP (W)129.3127.9
FF (%)75.9273.91
PR (%)71.7570.97
PL (W)50.952.3
Disclaimer/Publisher’s Note: The statements, opinions and data contained in all publications are solely those of the individual author(s) and contributor(s) and not of MDPI and/or the editor(s). MDPI and/or the editor(s) disclaim responsibility for any injury to people or property resulting from any ideas, methods, instructions or products referred to in the content.

