


Spatial–Temporal Evolution and Driving Factors of Economic Dual Circulation Coordinated Development in China’s Coastal Provinces
Abstract
:1. Introduction
2. Literature Review
2.1. The Definition and Measurement of Economic Dual Circulation
2.2. The Relationship between Economic Internal Circulation and Economic External Circulation
2.3. The Driving Factors of Economic Dual Circulation
3. Materials and Methods
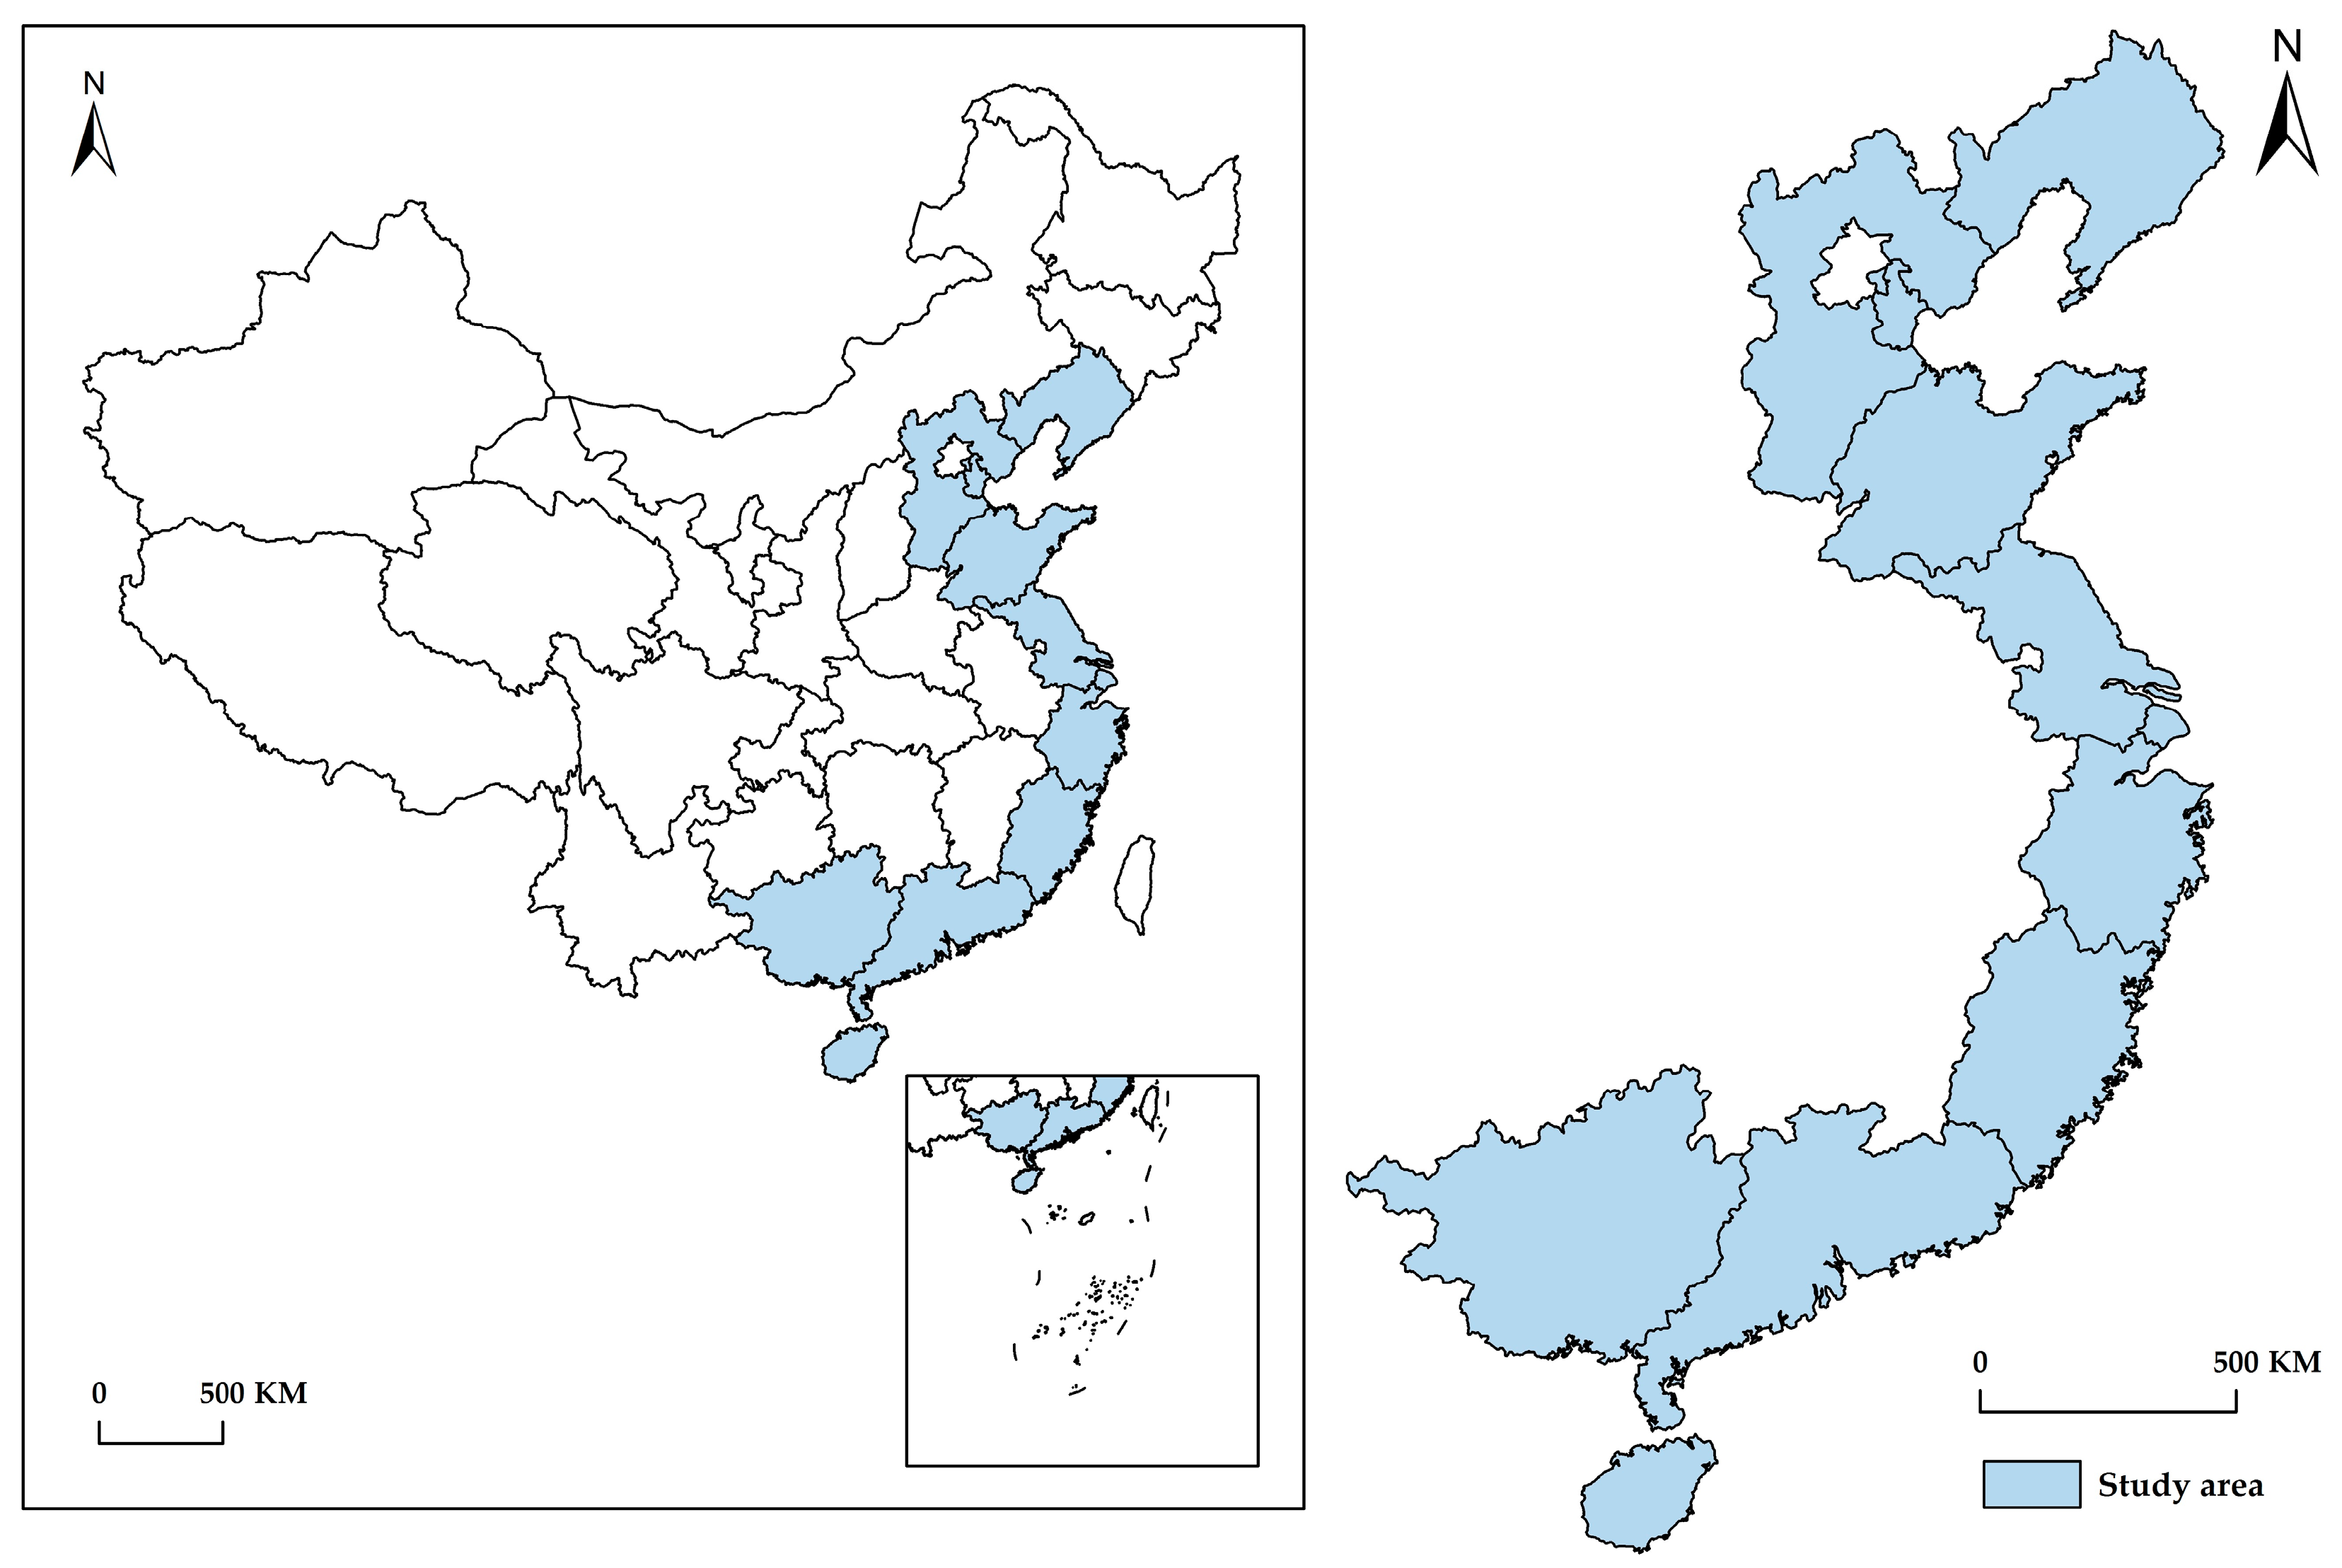
3.1. Study Area
3.2. Construction of the Indicator System and Data Sources
3.3. Methods
3.3.1. CRITIC-Entropy Weight Method
3.3.2. TOPSIS Evaluation Model
3.3.3. Coupling Coordination Model
3.3.4. Standard Deviation Ellipse
3.3.5. Exploratory Spatial Data Analysis
3.3.6. Geographical Detector
4. Results and Analysis
4.1. Spatial–Temporal Evolution Characteristics of Economic Dual Circulation Coordinated Development
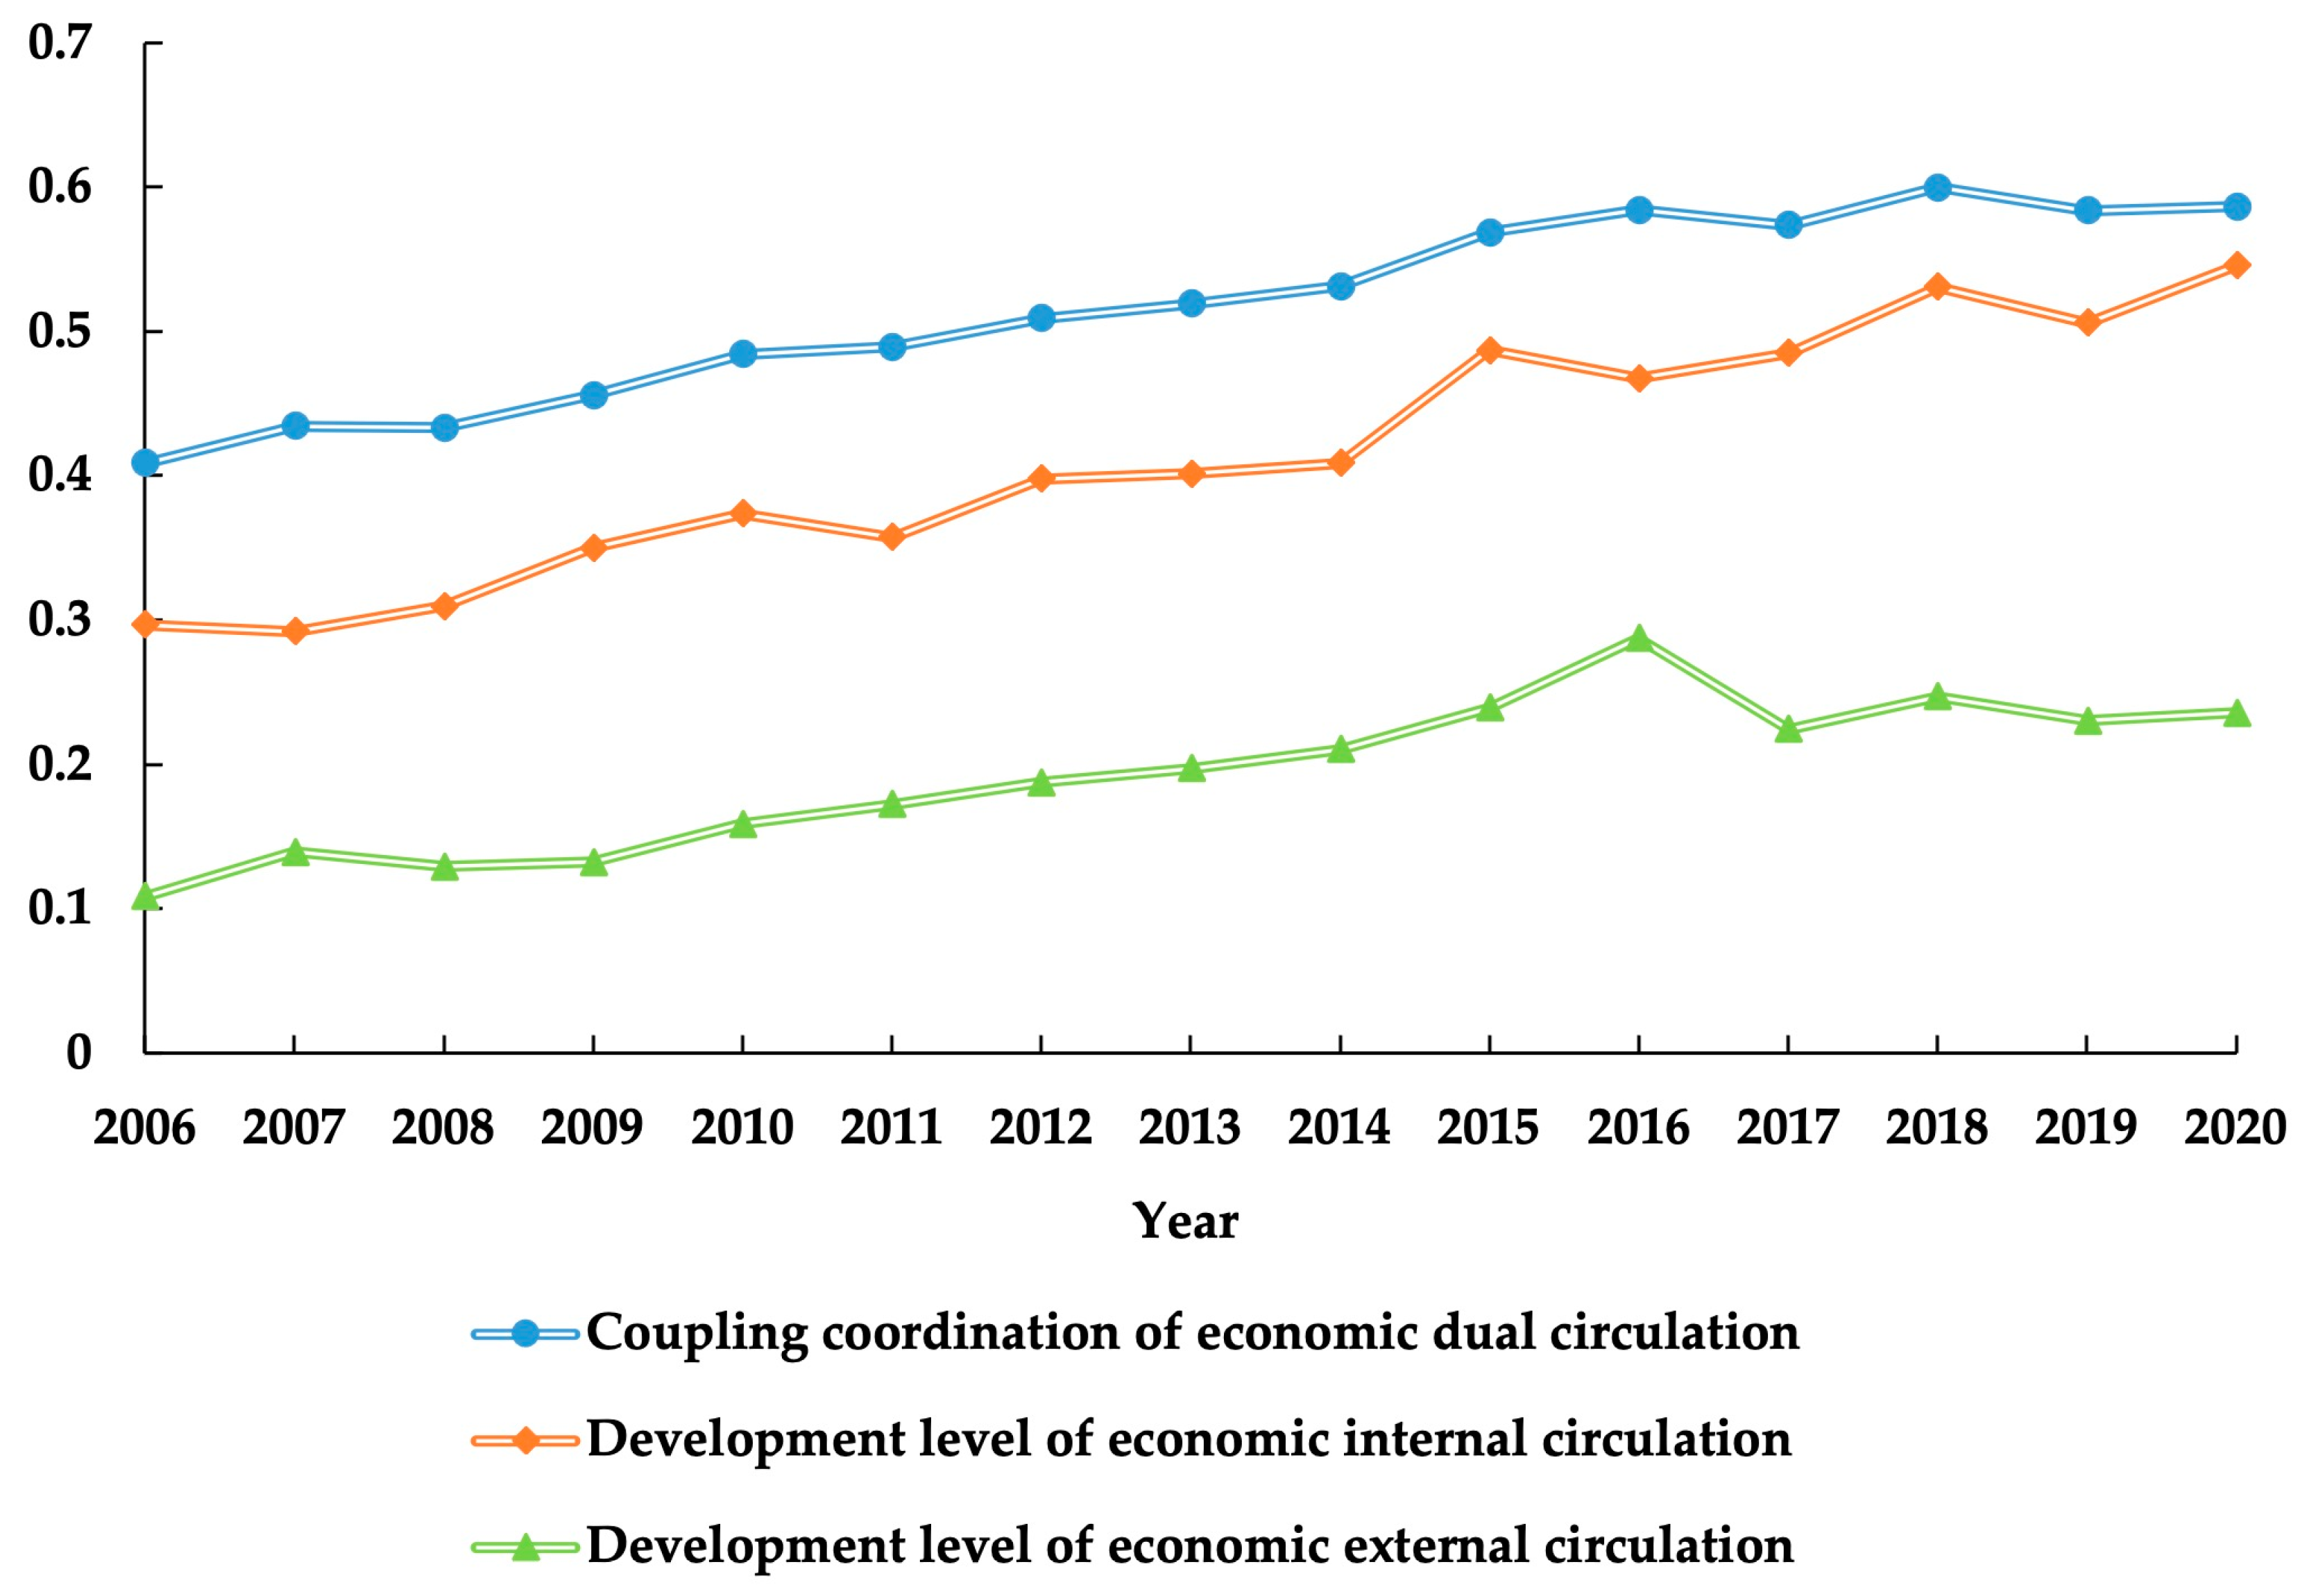
4.1.1. Temporal Evolution Characteristics of Economic Dual Circulation Coordinated Development
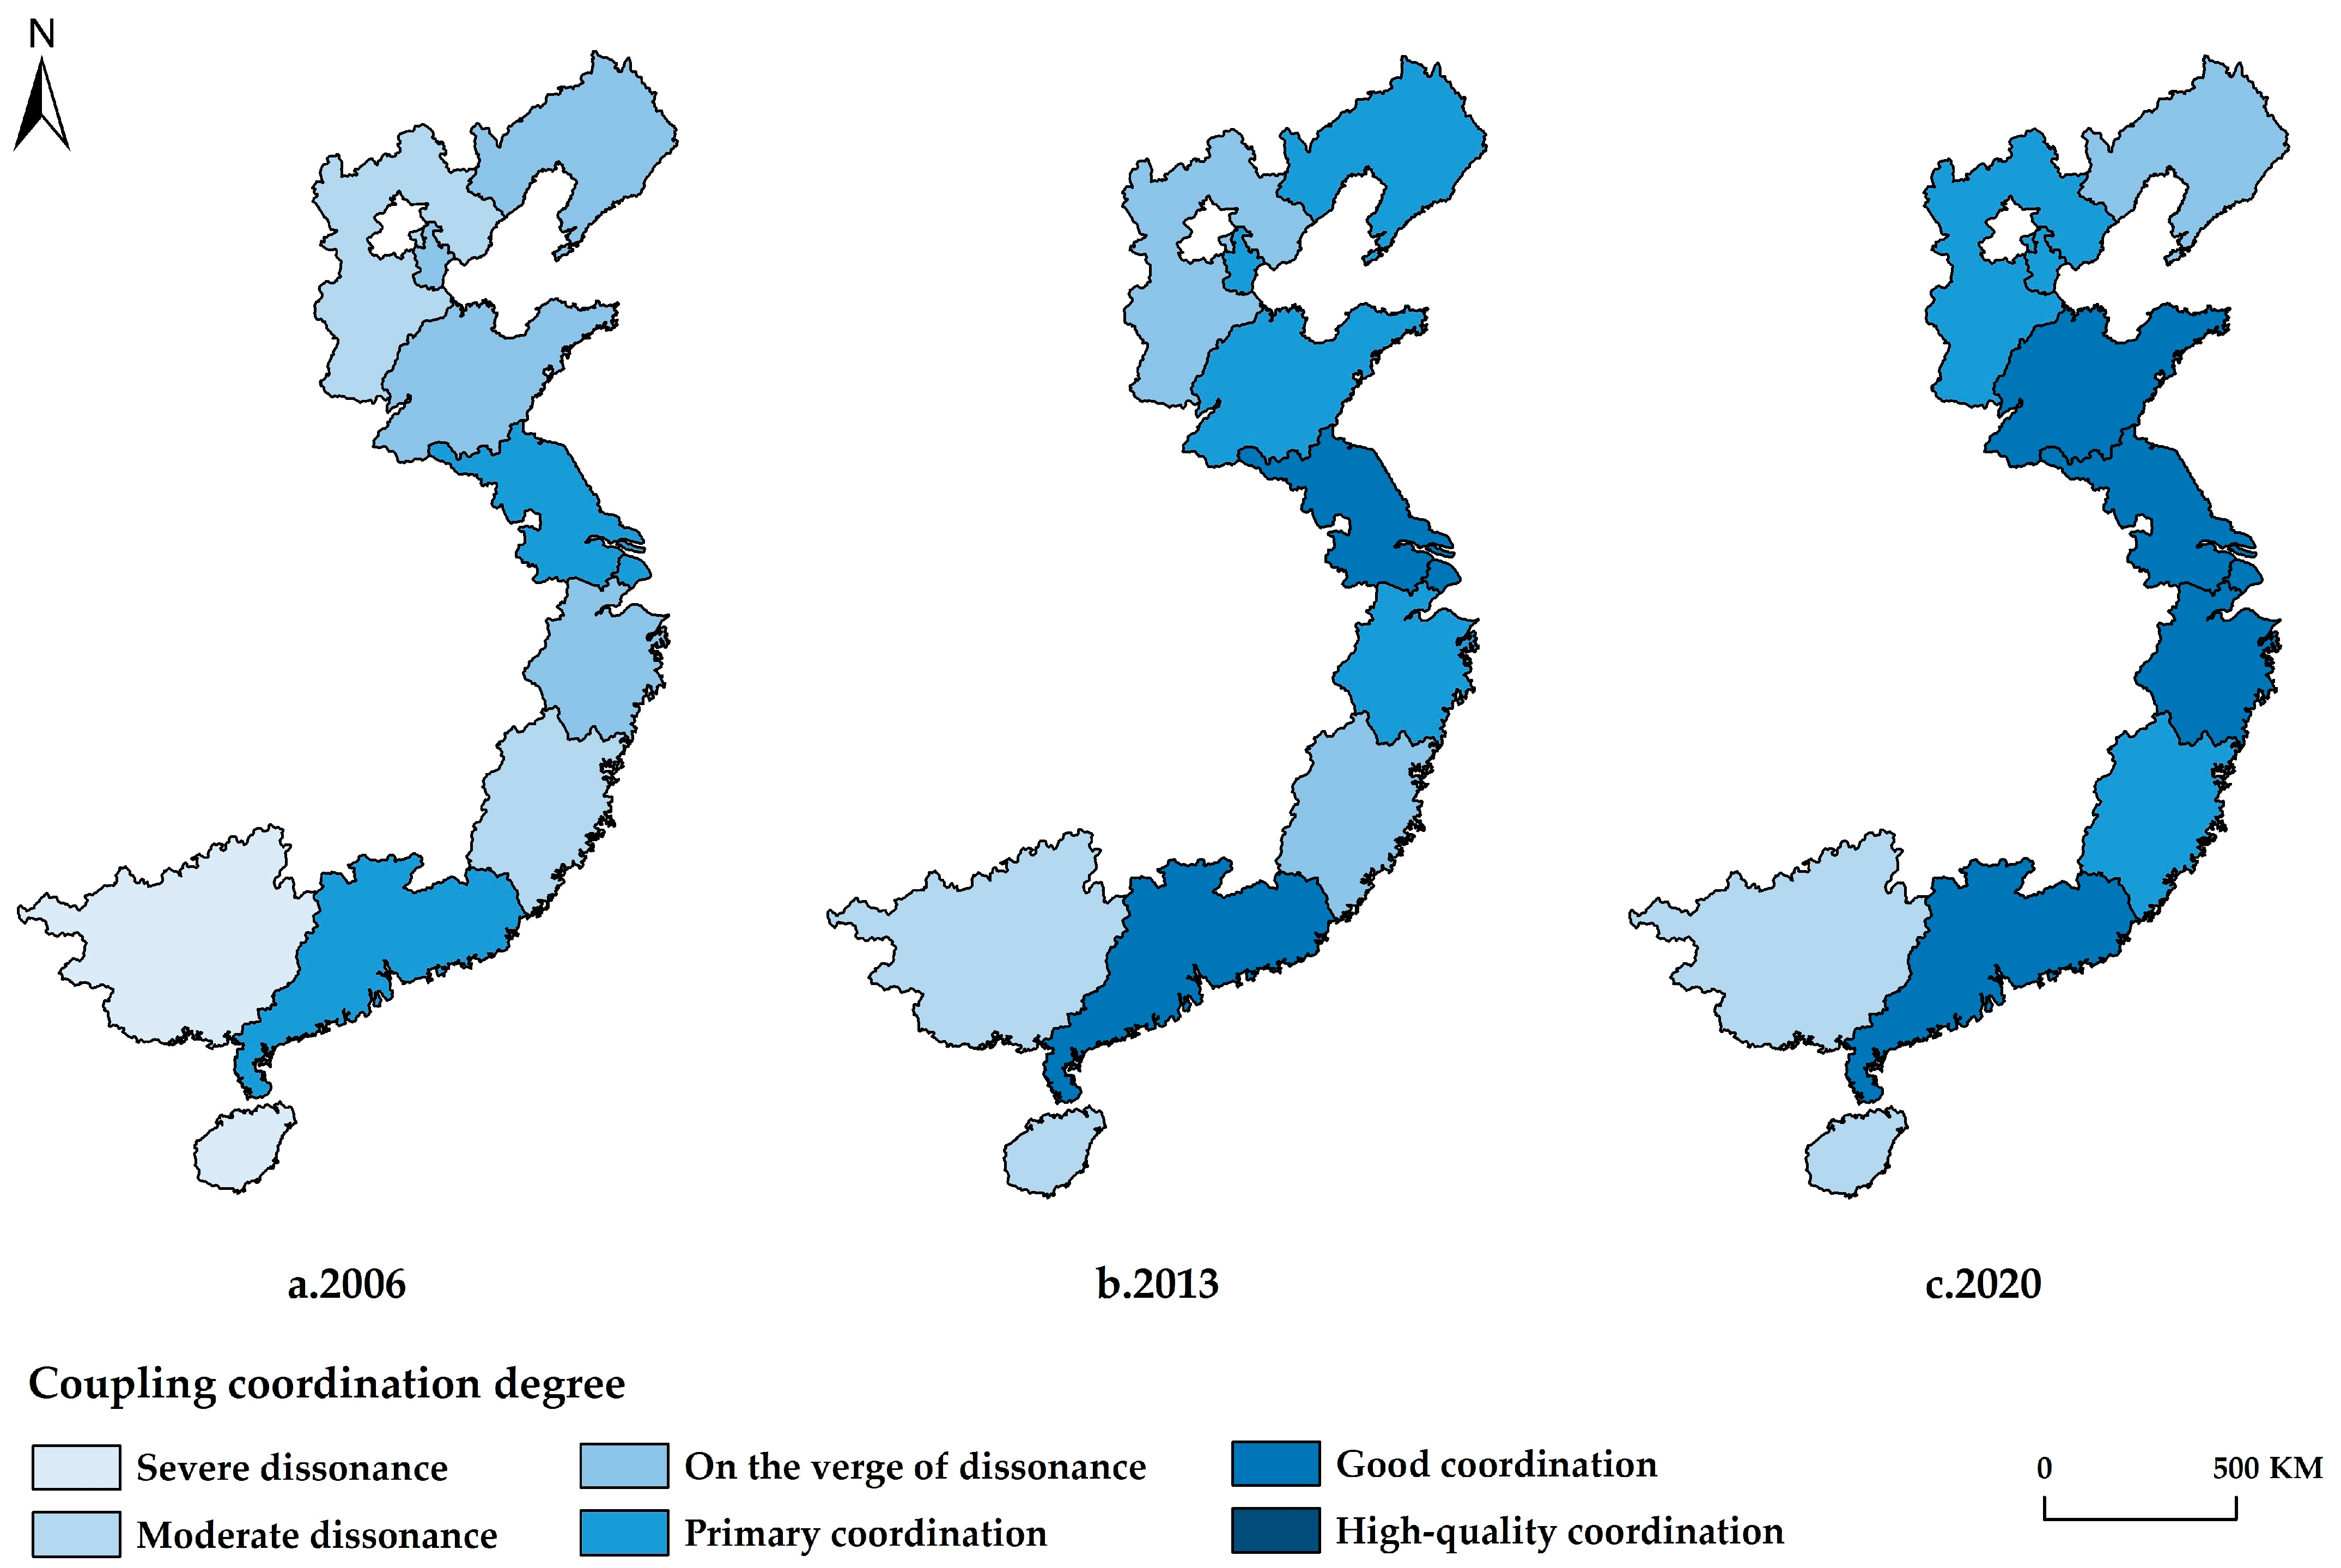
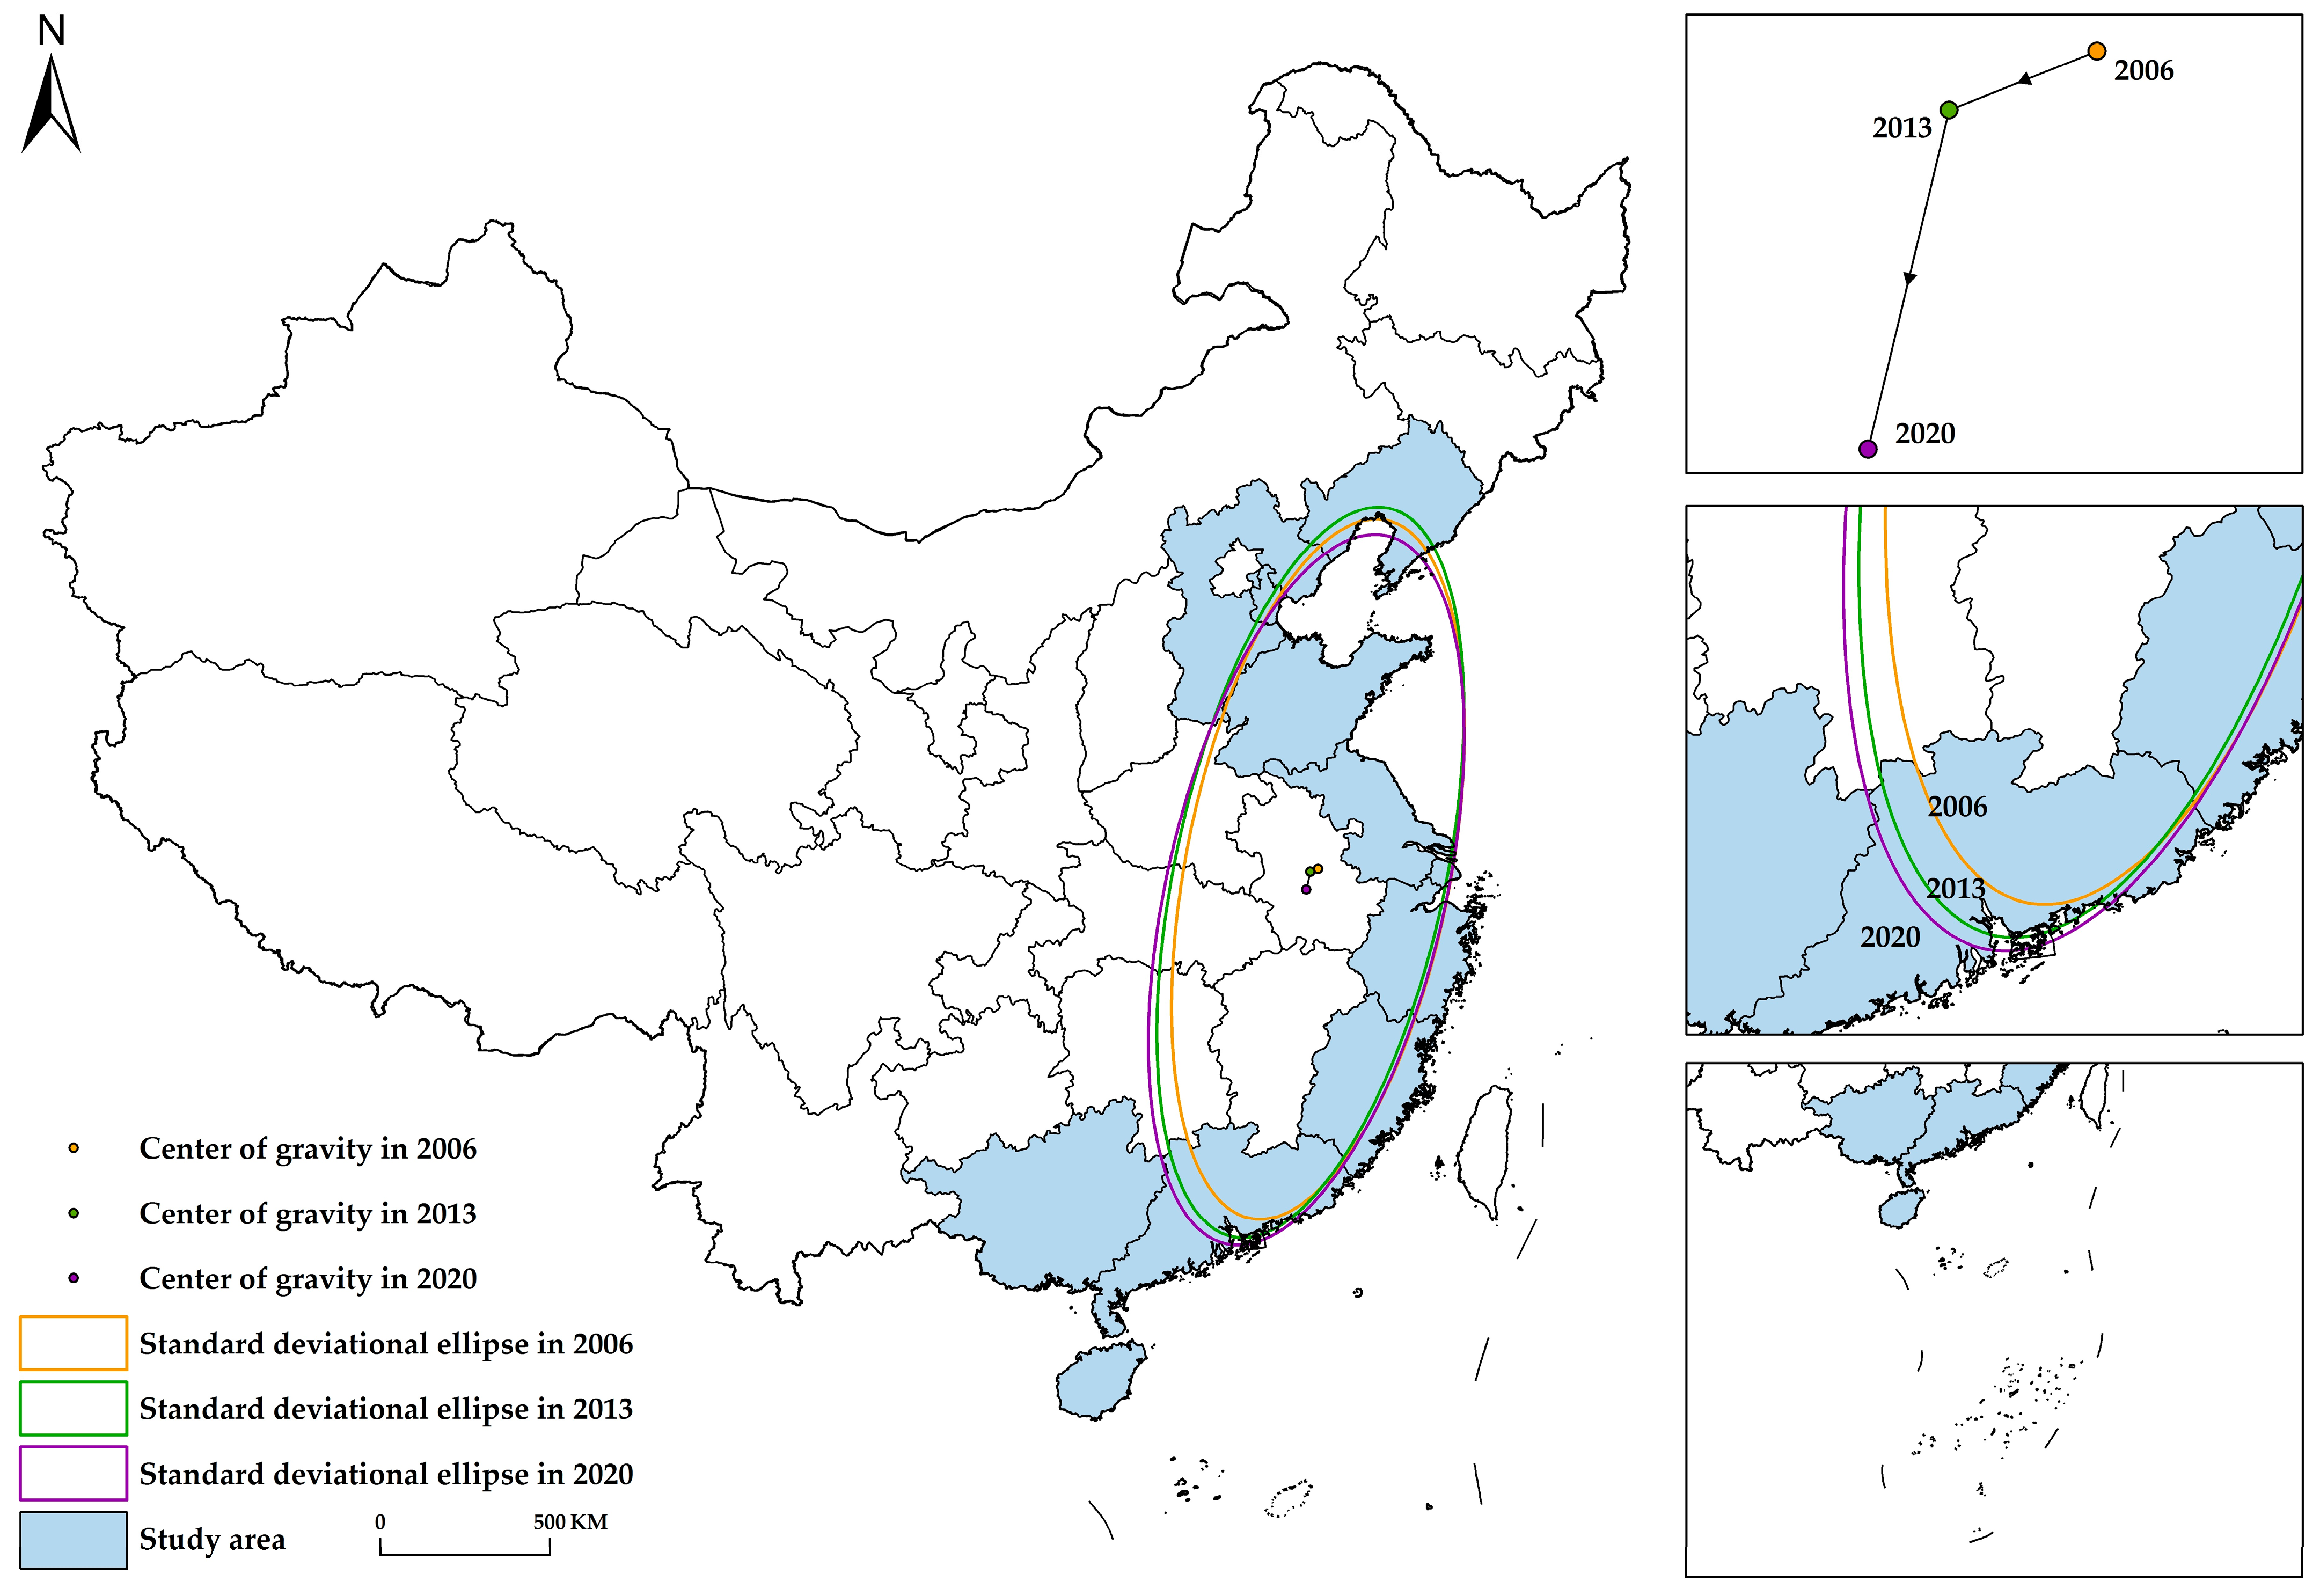
4.1.2. Spatial Evolution Characteristics of Economic Dual Circulation Coordinated Development
4.2. Analysis of the Driving Factors of Economic Dual Circulation Coordinated Development
4.2.1. Selection of Driving Factors
4.2.2. Detection Results
5. Discussion
6. Conclusions, Implications and Policy Recommendations
6.1. Conclusions
- (1)
- The changes in the development level of internal and external economic circulation in the coastal area were mainly stable and rising in a fluctuating manner, and the level of internal circulation was better than that of external circulation;
- (2)
- There was significant regional heterogeneity and spatial correlation in the coupling and coordinated development of economic dual circulation in the coastal area, and the degree of spatial dependence showed an inverted U-shaped development trend. The spatial distribution pattern showed the characteristic of “strong in the internal and weak in the external”;
- (3)
- The coordinated development of economic dual circulation was the result of multifactor functions and resonant development. Regional technological innovation capability, per capita income level, circulation development level, marketization process, digitization level and financial development level were the core driving forces.
6.2. Implications
6.3. Policy Recommendations
- (1)
- Pay attention to the spatial differences in the coupling coordination degree of economic dual circulation in the coastal area and formulate differentiated strategies to promote the dual circulation development. Northeastern coastal provinces such as Liaoning need to speed up industrial transformation and upgrading and reshape the economic development momentum and vitality;
- (2)
- Make use of the positive spatial correlation of the coupling coordination degree of economic dual circulation, allow full play to the radiation and driving role of provinces with high coupling coordination degrees, such as Jiangsu, Shanghai and Guangdong, and strengthen exchange and cooperation among different provinces, encouraging provinces with low coupling coordination degrees to keep up with provinces with high coupling coordination degrees.
- (3)
- Adhere to innovation-driven development and accelerate key core technology research to enhance the economic system resilience. At the same time, it is necessary to make the most of the joint effect of different driving factors and promote the coordinated development of economic dual circulation.
Author Contributions
Funding
Institutional Review Board Statement
Informed Consent Statement
Data Availability Statement
Conflicts of Interest
References
- Lin, J.Y.; Wang, Y. Seventy years of economic development: A review from the angle of new structural economics. China World Econ. 2020, 28, 26–50. [Google Scholar] [CrossRef]
- Jiang, X.; Meng, L. Mainly inner circulation, outer circulation empowerment and higher level double circulation: International experience and Chinese practice. J. Manag. World 2021, 37, 1–19. [Google Scholar]
- Shen, K.; Zhao, Q. Promoting high-quality economic development during the 14th Five-Year Plan period by adopting new development pattern of dual cycle. Econ Rev. 2020, 10, 18–25. [Google Scholar]
- Huang, Q.; Ni, H. Measurement of domestic and international double cycle of China’s economy: The essential characteristics of the new development pattern. J. Manag. World 2021, 37, 40–58. [Google Scholar]
- Song, L.; Zhou, Y. The COVID-19 pandemic and its impact on the global economy: What does it take to turn crisis into opportunity? China World Econ. 2020, 28, 1–25. [Google Scholar] [CrossRef]
- Quesnay, F. Tableau Économique; MacMillan: London, UK, 1972. [Google Scholar]
- Marx, K.H. Das Kapital; People’s Publishing House: Beijing, China, 2004. [Google Scholar]
- Leontief, W. The economy as a circular flow. Struct. Chang. Econ. Dyn. 1991, 2, 181–212. [Google Scholar] [CrossRef]
- Tang, D.; Liu, X.; Ni, H.; Yang, Y.; Huang, Q.; Zhang, X. The Changing Global Economic Landscape and China’s Potential Growth Rate and High-quality Development in the Post-epidemic Era. Econ. Res. J. 2020, 55, 4–23. (In Chinese) [Google Scholar]
- Grassman, S. Long-term trends in openness of national economies. Oxf. Econ. Pap. 1980, 32, 123–130. [Google Scholar] [CrossRef]
- Li, X.; Xu, D. Reassessing China’s Foreign Trade Degree of Dependence and Imbalance: Value-Added Trade in the Global Link of Production. Soc. Sci. China 2013, 1, 29–55+205. [Google Scholar]
- Fan, J.; Wan, W.; Yuan, X.; Ranaei, F. Evolution trends and structural decomposition of China’s green value-added over 40 years of reform and opening-up. China Popul. Resour. Environ. 2019, 29, 79–89. [Google Scholar] [CrossRef]
- Xie, R.; Chen, X.; Zhu, B. A Study on the Global Inclusiveness of the Economic Growth in the Core Countries of Global Value Chains Network. J. Manag. World 2020, 36, 65–77. (In Chinese) [Google Scholar]
- Liu, R.; Huang, S.; Fan, J. Global production chain reconstruction under import substitution and its impact on China’s economic growth. J. Quant. Tech. Econ. 2021, 38, 83–103. (In Chinese) [Google Scholar]
- Johnson, R.C.; Noguera, G. Accounting for intermediates: Production sharing and trade in value added. J. Int. Econ. 2012, 86, 224–236. [Google Scholar] [CrossRef] [Green Version]
- Belke, A.; Wang, L. The Degree of Openness to Intra-Regional Trade-Towards Value-Added Based Openness Measures. Jahrb. Natl. Stat. 2006, 226, 115–138. [Google Scholar] [CrossRef]
- Belke, A.; Mattes, A.; Wang, L. The Bazaar Economy Hypothesis Revisited. A New Trade-Related Measure for Germany’s International Openness. Appl. Econ. Q. 2011, 57, 67–87. [Google Scholar] [CrossRef]
- Larudee, M. Measuring openness: VADE, not trade. Oxf. Dev. Stud. 2012, 40, 119–137. [Google Scholar] [CrossRef]
- Koopman, R.; Wang, Z.; Wei, S.J. Tracing value-added and double counting in gross exports. Am. Econ. Rev. 2014, 104, 459–494. [Google Scholar] [CrossRef] [Green Version]
- Chen, Q.; Xu, J.; Xia, Y.; Jikang, X. The measurement and trend analysis of domestic and international dual circulation. Chin. J. Manag. Sci. 2022, 30, 12–19. (In Chinese) [Google Scholar]
- Lu, J.; Xiang, W.; Gu, Y. Theoretical Synthesis of the “Dual Circulation” Development Pattern and Its Practices in China. Financ. Trade Econ. 2022, 43, 54–67. (In Chinese) [Google Scholar]
- Wang, F.; Wang, R.; He, Z. Exploring the impact of “double cycle” and industrial upgrading on sustainable high-quality economic development: Application of spatial and mediation models. Sustainability 2022, 14, 2432. [Google Scholar] [CrossRef]
- Chenery, H.B. Patterns of industrial growth. Am. Econ. Rev. 1960, 50, 624–654. [Google Scholar]
- Zhou, S.; Han, J.; Ge, J.; Sheng, M. Theoretical Exploration of Domestic and International Dual Circulation Strategy with Domestic Grand Circulation Being the Mainstay. J. Nanjing Agric. Univ. (Soc. Sci. Ed.) 2021, 21, 22–29. (In Chinese) [Google Scholar]
- Bazan, L.; Navas-Alemán, L. The underground revolution in the Sinos Valley: A comparison of upgrading in global and national value chains. Local Enterp. Glob. Economy. Issues Gov. Upgrad. 2004, 3, 110–139. [Google Scholar]
- Li, G.; Pan, W. How Do Domestic Value Chains Embed into Global Value Chains. J. Manag. World 2016, 7, 10–22. [Google Scholar]
- Yi, X.; Ouyang, Y. How Should Large Economies Export: International Experience and Rebuilding of China’s Export Model. Financ. Trade Econ. 2018, 39, 79–94. [Google Scholar]
- Amiti, M.; Davis, D.R. Trade, firms, and wages: Theory and evidence. Rev. Econ. Stud. 2012, 79, 1–36. [Google Scholar] [CrossRef]
- Shu, P.; Steinwender, C. The impact of trade liberalization on firm productivity and innovation. Innovat. Pol. Econ. 2019, 19, 39–68. [Google Scholar] [CrossRef]
- Bastos, P.; Silva, J.; Verhoogen, E. Export destinations and input prices. Am. Econ. Rev. 2018, 108, 353–392. [Google Scholar] [CrossRef] [Green Version]
- Fan, H.; Li, Y.A.; Xu, S.; Yeaple, S.R. Quality, variable markups, and welfare: A quantitative general equilibrium analysis of export prices. J. Int. Econ. 2020, 125, 103327. [Google Scholar] [CrossRef]
- Zheng, X.; Liu, Q.; Zhao, Z. Mutual Promotion of Dual Circulation of Domestic and Foreign Markets under the Influence of Industrial Linkage and Inter-provincial Boundary: An Empirical Study based on Simultaneous Equations Model. J. Manag. World 2022, 38, 56–70+145+171–180. (In Chinese) [Google Scholar]
- Chen, C.; Steinwender, C. Import competition, heterogeneous preferences of managers, and productivity. J. Int. Econ. 2021, 133, 103533. [Google Scholar] [CrossRef]
- Mayer, T.; Melitz, M.J.; Ottaviano, G.I.P. Product mix and firm productivity responses to trade competition. Rev. Econ. Stat. 2021, 103, 874–891. [Google Scholar] [CrossRef]
- Li, Z.; Chang, Z.; Dai, W. The dual circulation promote each other: Theoretical logic, strategic key and policy orientation. Shanghai J. Econ. 2021, 4, 16–27. (In Chinese) [Google Scholar]
- Liu, Y.; Li, L. The mechanism, path and policy recommendations of enterprise transformation and development under the “Dual Circulation” New development pattern. J. Hebei Univ. Econ. Bus. 2021, 42, 41–50. (In Chinese) [Google Scholar]
- Poon, T.S.C. Beyond the global production networks: A case of further upgrading of Taiwan’s information technology industry. Int. J. Technol. Glob. 2004, 1, 130–144. [Google Scholar] [CrossRef]
- Yang, W.; Su, L.; Sun, R.; Yuan, W. Has digital finance promoted consumption upgrading?—Evidence based on panel data. Stud. Int. Financ. 2021, 38, 13–22. [Google Scholar]
- Li, T.; Wang, X. Digital economy empowers China’s “dual cycle” strategy–Internal logic and practice path. Economist 2021, 269, 102–109. [Google Scholar]
- Wang, Y. Changes unseen in a century, high-quality development, and the construction of a new development pattern. J. Manag. World 2020, 36, 1–13. [Google Scholar]
- Song, M.; Zhou, P.; Si, H. Financial technology and enterprise total factor productivity—Perspective of “enabling” and credit rationing. China Ind. Econ. 2021, 4, 138–155. [Google Scholar]
- Zhang, S.; Wang, Z.; Jin, Z. The economic growth effect of dual circulation. J. Quant. Tech. Econ. 2022, 39, 5–26. (In Chinese) [Google Scholar]
- Gereffi, G. International trade and industrial upgrading in the apparel commodity chain. J. Int. Econ. 1999, 48, 37–70. [Google Scholar] [CrossRef]
- Sun, Z.; Xu, X. Industrial innovation and consumption upgrade: An empirical study based on the perspective of supply-side structural reform. China Ind. Econ. 2018, 7, 98–116. [Google Scholar]
- He, C.; Wang, W.; Zhu, S. The industry spatial layout optimization in the new pattern of dual circulation in China. Reg. Econ. Rev. 2021, 4, 54–63. (In Chinese) [Google Scholar]
- Malone, T.W.; Yates, J.; Benjamin, R.I. Electronic markets and electronic hierarchies. Commun. ACM 1987, 30, 484–497. [Google Scholar] [CrossRef] [Green Version]
- Shi, B.; Li, J. Does the internet promote division of labor? Evidences from Chinese manufacturing enterprises. J. Manag. World 2020, 36, 130–149. [Google Scholar]
- Sturgeon, T.J. Upgrading strategies for the digital economy. Glob. Strateg. J. 2021, 11, 34–57. [Google Scholar] [CrossRef]
- Shi, W. The theoretical logic and implementation path of constructing the new development pattern of “double circulation” from the perspective of political economy. Open J. Soc. Sci. 2021, 9, 29–39. [Google Scholar] [CrossRef]
- Liu, H. Analysis of coupling and coordination between double cycle pattern and industrial technological innovation. Stud. Sci. Sci. 2022, 40, 1328–1344. (In Chinese) [Google Scholar]
- Liu, C.; Chen, Y.; Chen, Q.; Zhou, J.; Wang, J. Evolution characteristics and driving mechanism of China’s dual circulation coordinated development. Econ. Geogr. 2022, 42, 1–8. (In Chinese) [Google Scholar]
- Zhao, W.; Zhang, Z. Research on the dynamic distribution, spatial difference and convergence of China’s economic dual circulation coupling coordination degree. J. Quant. Tech. Econ 2022, 39, 23–42. [Google Scholar]
- Wang, S.; Sun, Y. Research on the measurement and application of the effective linkage of domestic economic cycle and international economic cycle. Stat. Inf. Forum 2023, 38, 28–42. (In Chinese) [Google Scholar]
- Lin, L.; Wang, Y. Transport Cost, Labor Mobility and the Spatial Distribution of Manufacturing Industries. Econ. Res. J. 2006, 41, 115–125. [Google Scholar]
- Li, X.; Chen, Y. The Labor Flow, Capital Shift and Productivity Growth based on Chinese Industrial Sector’s Structure-Bonus Hypotheses. Stat. Res. 2007, 24, 22–28. [Google Scholar]
- Keller, W.; Yeaple, S.R. Multinational enterprises, international trade, and productivity growth: Firm-level evidence from the United States. Rev. Econ. Stat. 2009, 91, 821–831. [Google Scholar] [CrossRef] [Green Version]
- Diakoulaki, D.; Mavrotas, G.; Papayannakis, L. Determining objective weights in multiple criteria problems: The critic method. Comput. Oper. Res. 1995, 22, 763–770. [Google Scholar] [CrossRef]
- Wu, Z.; Guan, J.; He, J. An empirical study on the calculation of minimum wage standard—Dynamic combination calculation based on objective weight of Critic-entropy weight method. Mod. Econ. Sci 2019, 41, 103–117. [Google Scholar]
- Yao, L.; Halike, A.; Wei, Q.; Tang, H.; Tuheti, B. Research on Coupling and Coordination of Agro-Ecological and Agricultural Economic Systems in the Ebinur Lake Basin. Sustainability 2022, 14, 10327. [Google Scholar] [CrossRef]
- Hwang, C.L.; Yoon, K. Methods for multiple attribute decision making. In Multiple Attribute Decision Making; Springer: Berlin/Heidelberg, Germany, 1981; pp. 58–191. [Google Scholar]
- Ozernoy, V.M. Choosing the “Best” multiple criterlv decision-making method. INFOR Inf. Syst. Oper. Res. 1992, 30, 159–171. [Google Scholar] [CrossRef]
- Stewart, T.J. A critical survey on the status of multiple criteria decision making theory and practice. Omega 1992, 20, 569–586. [Google Scholar] [CrossRef]
- Valerie, I. The Penguin Dictionary of Physics; Foreign Language Press: Beijing, China, 1996. [Google Scholar]
- Liu, Y.; Li, R.; Song, X. Analysis of coupling degrees of urbanization and ecological environment in China. J. Nat. Res. 2005, 20, 105–112. [Google Scholar]
- Liao, C. Quantitative judgement and classification system for coordinated development of environment and economy: A case study of the city group in the Pearl River Delta. Trop. Geogr. 1999, 19, 171–177. [Google Scholar]
- Wong, D.W.S. Several fundamentals in implementing spatial statistics in GIS: Using centrographic measures as examples. Geo Inf. Sci. 1999, 5, 163–174. [Google Scholar]
- Lefever, D.W. Measuring geographic concentration by means of the standard deviational ellipse. Am. J. Sociol. 1926, 32, 88–94. [Google Scholar] [CrossRef]
- Zhao, L.; Zhao, Z. Projecting the spatial variation of economic based on the specific ellipses in China. Sci. Geogr. Sin. 2014, 34, 979–986. [Google Scholar]
- Le Gallo, J.; Ertur, C. Exploratory spatial data analysis of the distribution of regional per capita GDP in Europe, 1980–1995. Pap. Reg. Sci. 2003, 82, 175–201. [Google Scholar] [CrossRef] [Green Version]
- Weng, G.; Li, L. The coupling coordination degree and spatial correlation analysis on integrational development of tourism industry and cultural industry in China. Econ. Geogr. 2016, 36, 178–185. [Google Scholar]
- Moran, P.A. Notes on continuous stochastic phenomena. Biometrika 1950, 37, 17–23. [Google Scholar] [CrossRef]
- Anselin, L. Local indicators of spatial association—LISA. Geogr. Anal. 1995, 27, 93–115. [Google Scholar] [CrossRef]
- Wang, J.; Xu, C. Geodetector: Principle and prospective. Acta Geogr. Sin. 2017, 72, 116–134. [Google Scholar]
- Zhu, H.; Liu, J.; Tao, H.; Li, L.; Wang, R. Temporal-spatial pattern and contributing factors of urban RBDs in Beijing. Acta Geogr. Sin. 2015, 70, 1215–1228. [Google Scholar]
- Wang, S.; Wang, Y.; Lin, X.; Zhang, H. Spatial differentiation patterns and influencing mechanism of housing prices in China: Based on data of 2872 counties. Acta Geogr. Sin. 2016, 71, 1329–1342. [Google Scholar]
- Yifu, L.J.; Wang, X. Dual circulation: A new structural economics view of development. J. Chin. Econ. Bus. Stud. 2022, 20, 303–322. [Google Scholar] [CrossRef]
- Lv, S.; Zhao, S.; Liu, H. Research on the coupling between the double cycle mode and technological innovation systems: Empirical evidence from data envelopment analysis and coupled coordination. Systems 2022, 10, 62. [Google Scholar] [CrossRef]
- Wang, S.; Hou, D.; Guo, Y.; Dai, L. The mediation effect of innovation in the domestic and international economic development circulation. Technol. Anal. Strateg. Manag. 2022, 34, 1054535. [Google Scholar] [CrossRef]
- Lu, M. On the concept of internal economic cycle, its characteristics and approaches to its realization. J. Xinjiang Norm. Univ. 2021, 42, 19–31. (In Chinese) [Google Scholar]


| First-Level Indicator | Second-Level Indicator | Third-Level Indicator | Specific Indicator (Character) |
|---|---|---|---|
| Economic external circulation | Capital openness | Foreign capital introduction | FDI (USD 10,000) (+) |
| Investment abroad | Flow of non-financial OFDI (USD 10,000) (+) | ||
| Trade openness | Trade abroad | Total import and export volume (USD 100,000,000) (+) | |
| Foreign trade upgrading | High-tech import and export volume (USD 1,000,000) (+) | ||
| Economic internal circulation | Production link | Production scale | Per capita fixed assets investment (10,000 CNY/person) (+) |
| Production efficiency | Labor productivity (%) (+) | ||
| Circulation link | Commodity circulation | Proportion of total retail sales of consumer goods to regional GDP (%) (+) | |
| Element flow | Net population change rate (‰) (+) | ||
| Capital share growth rate (%) (+) | |||
| Patent application and authorization growth rate (%) (+) | |||
| Distribution link | Income distribution | Per capita income ratio of urban and rural residents (%) (−) | |
| Consumption link | Consumption level | Proportion of per capita consumption expenditure of residents to GDP (%) (+) | |
| Consumption structure | Engel coefficient (%) (−) |
| Value Range | Class |
|---|---|
| 0.0–0.2 | Severe dissonance |
| 0.2–0.4 | Moderate dissonance |
| 0.4–0.5 | On the verge of dissonance |
| 0.5–0.6 | Primary coordination |
| 0.6–0.8 | Good coordination |
| 0.8–1.0 | High-quality coordination |
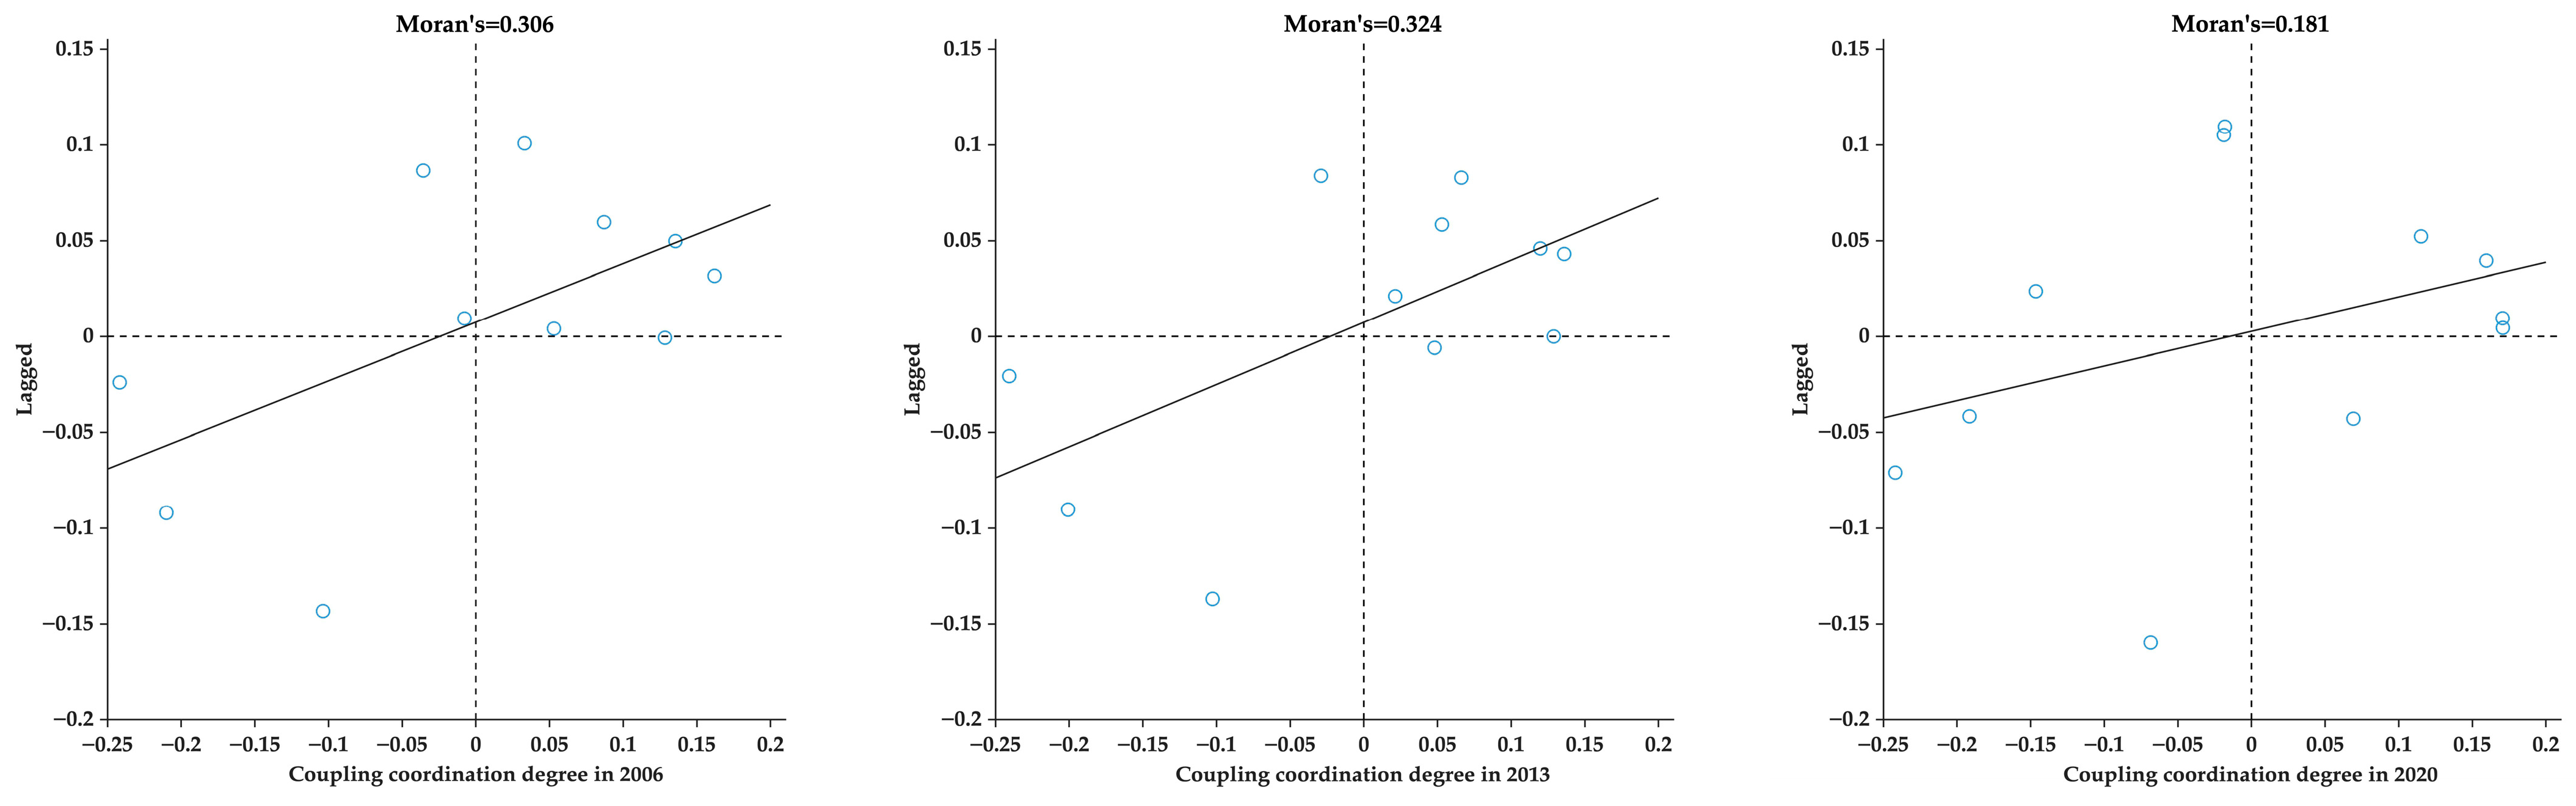
| Year | Moran’s I | Z-Value |
|---|---|---|
| 2006 | 0.306 *** | 2.373 |
| 2007 | 0.284 ** | 2.234 |
| 2008 | 0.308 *** | 2.377 |
| 2009 | 0.299 ** | 2.320 |
| 2010 | 0.314 *** | 2.424 |
| 2011 | 0.308 *** | 2.389 |
| 2012 | 0.334 *** | 2.543 |
| 2013 | 0.324 *** | 2.504 |
| 2014 | 0.341 *** | 2.581 |
| 2015 | 0.347 *** | 2.545 |
| 2016 | 0.347 *** | 2.560 |
| 2017 | 0.198 ** | 1.698 |
| 2018 | 0.212 ** | 1.759 |
| 2019 | 0.209 ** | 1.739 |
| 2020 | 0.181 * | 1.591 |
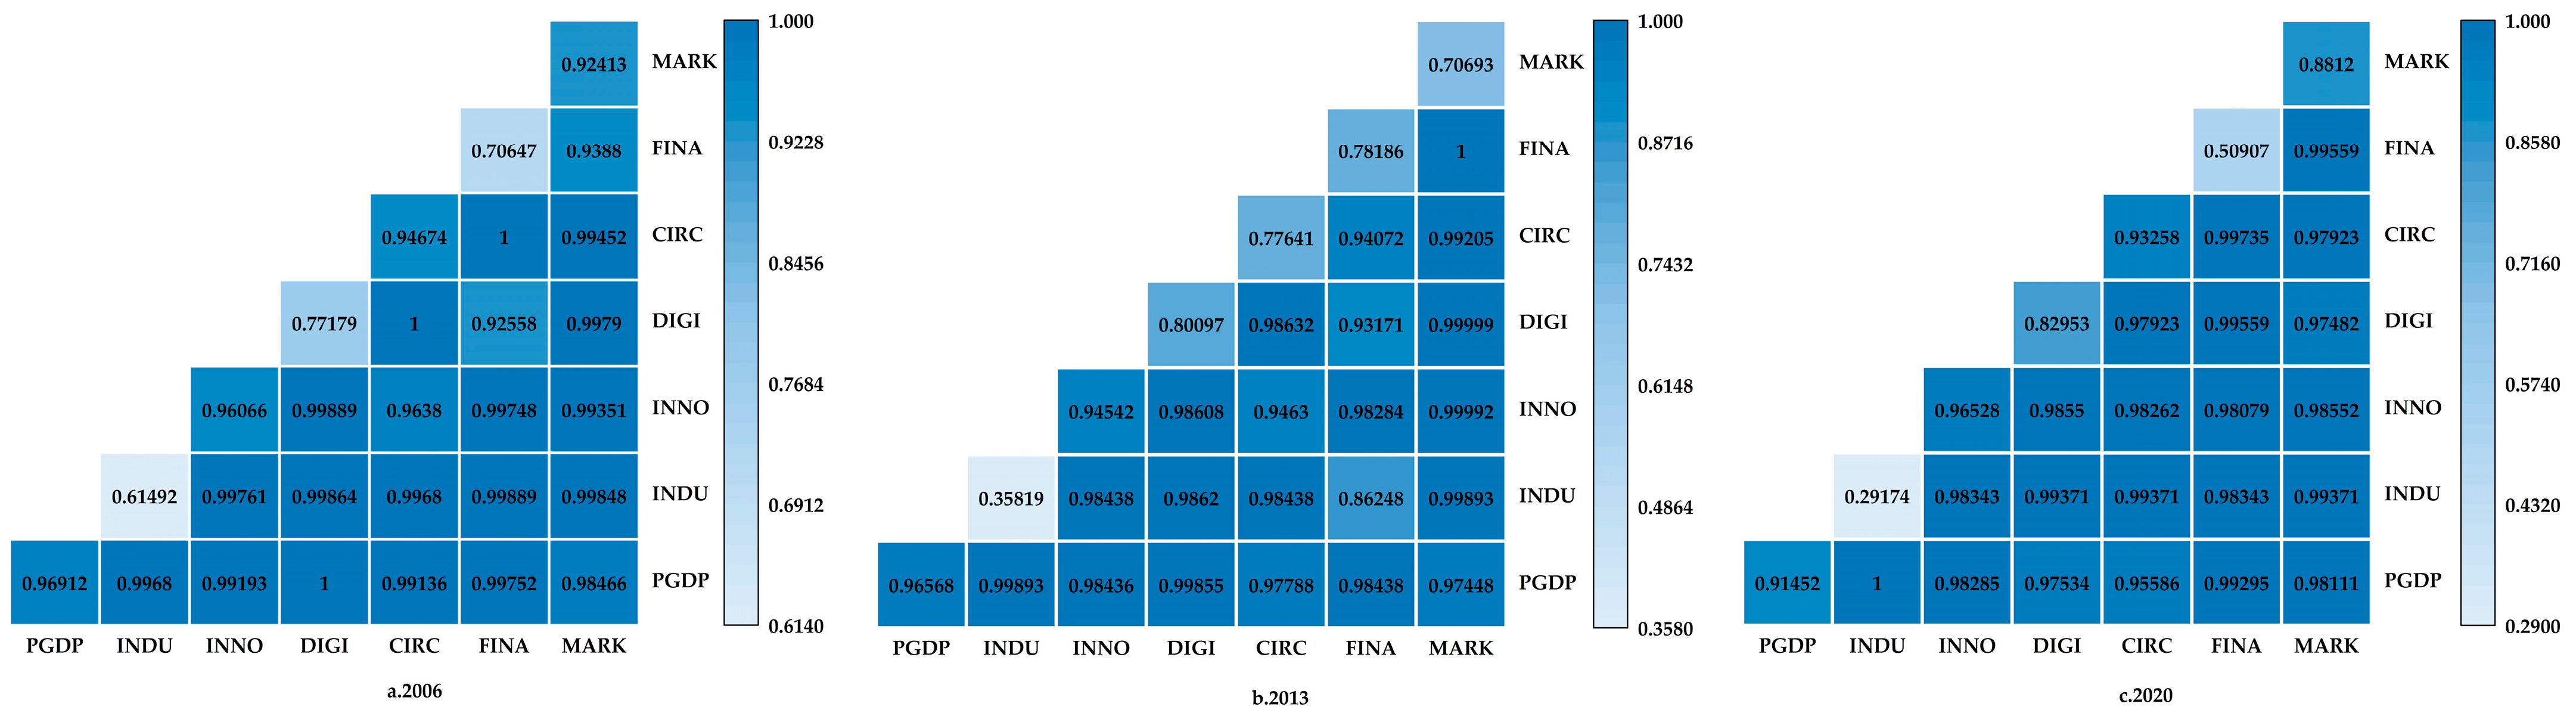
| Factor | 2006 | 2013 | 2020 | Average |
|---|---|---|---|---|
| Per capita income level (PGDP) | 0.9691 *** | 0.9657 *** | 0.9145 *** | 0.9498 |
| Industrial economic structure (INDU) | 0.6149 *** | 0.3582 *** | 0.2917 *** | 0.4216 |
| Regional technological innovation capability (INNO) | 0.9607 *** | 0.9454 *** | 0.9653 *** | 0.9571 |
| Digitization level (DIGI) | 0.7718 *** | 0.8010 *** | 0.8295 *** | 0.8008 |
| Circulation development level (CIRC) | 0.9467 *** | 0.7764 *** | 0.9326 *** | 0.8852 |
| Financial development level (FINA) | 0.7065 *** | 0.7819 *** | 0.5091 *** | 0.6658 |
| Marketization process (MARK) | 0.9241 *** | 0.7069 *** | 0.8812 *** | 0.8374 |
Disclaimer/Publisher’s Note: The statements, opinions and data contained in all publications are solely those of the individual author(s) and contributor(s) and not of MDPI and/or the editor(s). MDPI and/or the editor(s) disclaim responsibility for any injury to people or property resulting from any ideas, methods, instructions or products referred to in the content. |
© 2023 by the authors. Licensee MDPI, Basel, Switzerland. This article is an open access article distributed under the terms and conditions of the Creative Commons Attribution (CC BY) license (https://creativecommons.org/licenses/by/4.0/).
Share and Cite
Wang, J.; Liu, S.; Zhao, Y. Spatial–Temporal Evolution and Driving Factors of Economic Dual Circulation Coordinated Development in China’s Coastal Provinces. Sustainability 2023, 15, 11009. https://doi.org/10.3390/su151411009
Wang J, Liu S, Zhao Y. Spatial–Temporal Evolution and Driving Factors of Economic Dual Circulation Coordinated Development in China’s Coastal Provinces. Sustainability. 2023; 15(14):11009. https://doi.org/10.3390/su151411009
Chicago/Turabian StyleWang, Jingyi, Shuguang Liu, and Yubin Zhao. 2023. "Spatial–Temporal Evolution and Driving Factors of Economic Dual Circulation Coordinated Development in China’s Coastal Provinces" Sustainability 15, no. 14: 11009. https://doi.org/10.3390/su151411009