1. Introduction
The 20th National Congress of the Communist Party of China emphasized the importance of “improving total factor productivity.” The most direct manifestation of this improvement is the enhancement of per capita labor productivity [
1]. As China’s population ages, by the end of 2022, there will be nearly 210 million people over 65, making up 14.9% of the entire population, a rise of 6.03 percentage points since 2010. At the same time, since 2018, China’s national employment has been declining for five consecutive years. Facing the dual pressures of a gradually weakening demographic dividend and an aging population, the traditional model of relying solely on labor input to drive economic growth is fading. Enhancing labor productivity will become a crucial tenet for the sustainable development of China’s economy, which is one of the three pillars of sustainable development [
2]. Numerous research has been conducted on the variables that affect labor productivity. Scholars have approached the issue from different angles and found that the proportion of tax deductions for employee education expenses [
3], population agglomeration [
4], environmental regulations [
5], city size [
6], and air quality [
7] all have significant effects on labor productivity.
Simultaneously, with the acceleration of digitalization, financial services are developing towards convenience and precision, leading to the emergence of digital inclusive finance—“a new financial service model realized by digital technology” [
8]. This model has extensively penetrated various fields of production and life [
9], changing labor production and people’s lives. Presently, there is a lack of consensus among scholars regarding the precise definition of digital inclusive finance. According to the
G20 High-level Principles on Digital Financial Inclusion [
10], the concept of digital inclusive finance can be broadly defined as the utilization of digital technology within the financial industry to foster financial inclusion and expand access to financial services for underserved and marginalized populations [
11]. Some international studies show that digital inclusive finance development can optimize resource allocation and promote economic growth [
12,
13,
14,
15]. There is also some research covering aspects such as digital inclusive finance development and real economic growth [
16,
17], urban–rural income gap [
18,
19], innovation and entrepreneurship [
20], and urban crime [
21].
Through the literature review, it is found that there are few direct studies on the relationship between digital inclusive finance development and labor productivity. Existing research mainly focuses on two aspects. On the one hand, several academics have researched the link between the growth of digital inclusive finance and total factor productivity. From a regional perspective, digital inclusive finance development can improve urban total factor productivity by optimizing industrial structure [
22]; from an industry perspective, digital inclusive finance development contributes to the enhancement of agricultural total factor productivity and the production of rural households [
11,
23,
24,
25]. Additionally, digital inclusive finance can significantly increase China’s agricultural green total factor productivity [
26,
27]; from an enterprise perspective, digital inclusive finance development enriches corporate financing channels, alleviates the shortage of corporate funds, and is of great significance to enterprise total factor productivity [
28,
29]. On the other hand, some scholars focus on the impact of the digital economy and internet development on labor productivity. Tang et al. argue that corporate digitalization has a “U-shaped” nonlinear effect on labor productivity from a micro-enterprise perspective [
30]. Yang and Fu believe the digital economy significantly boosts labor productivity [
31]. Cheng et al. suggest that internet development can enhance labor productivity by promoting labor force transfer [
32].
The existing literature provides a good idea for this paper. However, there are few empirical studies involving the effect of digital inclusive finance on labor productivity and heterogeneity, and scholars have yet to explicitly discuss how the growth of digital inclusive finance affects a region’s labor productivity. In light of this, this research examines the relationship between labor productivity in China and the development of digital inclusive finance. The possible marginal contributions of this paper are mainly reflected in the following: (1) Using empirical data from the province level in China, this study investigates the implications of the growth of digital inclusive finance on labor productivity. It also examines the effects of regional, industry, and digital inclusive finance development heterogeneity. This article provides a new perspective on the research of digital inclusive finance and labor productivity, which may fill the gap in the existing literature. (2) This paper examines the mediating function of capital deepening between the growth of digital inclusive finance and labor productivity. It offers recommendations for fostering the growth of digital inclusive finance and improving labor productivity (
Figure 1).
2. Mechanisms and Research Hypotheses
2.1. The Impact of Digital Inclusive Finance Development on Labor Productivity
From the perspective of financial services, financial resources, as relatively limited resources, should be preferentially allocated to enterprises and production sectors with higher production efficiency. However, enterprises with more financial resources exhibit lower productivity, a phenomenon known as economic misallocation [
33], which is prevalent in China’s financial system [
34]. The misallocation of economic resources weakens the intertemporal resource allocation function and risk diversification effect of finance, thereby inhibiting enterprises’ production activities [
35]. Credit resources, an essential part of financial resources, are an important manifestation of financial resources in the credit field. The growth of digital inclusive finance can ease financial barriers for small and medium-sized businesses and independent entrepreneurs, which can overcome geographical limitations and reliance on physical outlets [
36,
37,
38]. Simultaneously, through extensive data analysis and risk assessment technology, the development of digital inclusive finance can more accurately assess the credit demand and risk of enterprises and individuals, thereby achieving precise allocation of credit resources, promoting technological innovation, and empowering production.
From the labor perspective, the development of digital inclusive finance helps attract labor mobility across regions, improves regional human capital accumulation levels [
39], and thus enhances labor productivity. The main reasons for labor mobility include the following: first, digital inclusive finance development provides more flexible financial support for workers, such as education loans, which help workers improve their skills and qualities and seek better development opportunities in different labor markets. Second, digital inclusive finance development promotes entrepreneurial activities by reducing capital costs [
20] and attracting labor mobility through job creation. Third, digital inclusive finance development can promote labor mobility by increasing individual expected income [
40]. Fourth, digital inclusive finance development utilizes digital technology advantages to alleviate market information asymmetry, assists workers in decision making, and promotes labor mobility [
41].
Based on the above, this paper proposes hypothesis:
Hypothesis 1 (H1). Digital inclusive finance development can comprehensively improve labor productivity through various influences.
2.2. Digital Inclusive Finance Development, Capital Deepening, and Labor Productivity
Capital deepening is China’s most significant driving force for labor productivity growth [
42]. It is also a fundamental approach for digital inclusive finance development to promote labor productivity improvement. Li believes that the economy’s overall labor productivity can be divided into three main parts: capital deepening, improvement of labor quality, and total factor productivity, with capital deepening playing a dominant role [
43]. Huang points out that capital levels and total factor productivity impact labor productivity [
44]. Still, the capital factor’s influence is more noticeable because adjusting total factor productivity in the short term is challenging. Wu suggests that capital deepening promotes a steady increase in labor productivity through the combined effects of the “De La Grandville effect” and the “Kaldor–Verdoorn effect” [
45]. De La Grandville proposed the famous De La Grandville hypothesis in 1989, which posits that factor substitution elasticity and economic growth rates are positively correlated, and countries with higher factor substitution rates generally experience faster economic growth. Chen and Lian analyzed and verified the existence of this effect in China through the two-stage least squares (2SLS) and the generalized method of moments (GMM) [
46]. The Kaldor–Verdoorn law emphasizes that capital deepening first promotes output growth, followed by an accelerated increase in labor productivity. Ref. [
47] also confirms this law, stressing that output growth endogenously drives labor productivity growth. In addition, Hecht argues that industries with different capital intensities have different funding costs and risk-bearing capacities, and industries with higher capital intensity have more conditions to create higher labor productivity [
48].
At the same time, digital inclusive finance development has a particular impact on capital deepening. Ren and Lei claim that the growth of digital inclusive finance, based on big data and artificial intelligence technologies, broadens and deepens the range of financial services, reduces the cost of credit funds, precisely identifies and satisfies the credit needs of production individuals, and aids in realizing industry capital accumulation [
49]. On the other hand, with the continuous optimization of industrial structure, the wages of labor-intensive positions gradually decrease compared to high-tech industry positions, leading to a gradual increase in the opportunity cost of engaging in labor-intensive work. As a result, the relative price of labor factors rises while the relative price of capital elements falls. According to the induced technological progress theory by Williamson [
50], the direction of technological progress will favor factors with relatively lower prices, promoting the growth of capital factors. The development of digital inclusive finance fosters the fast growth of entrepreneurial and innovative activity [
20], introducing more mechanized equipment and technology into the production process. Producers will gradually reduce their dependence on traditional low-cost production factors such as land and actively adopt mechanized production methods to expand production capacity. This implies an increase in capital factor input relative to labor factor input, thereby deepening capital accumulation.
Based on the above, this paper proposes hypothesis:
Hypothesis 2 (H2). Digital inclusive finance development not only directly affects labor productivity through comprehensive effects but also influences labor productivity through the mediating effect of capital deepening.
3. Research Design
3.1. Model Construction
Considering the research questions of this paper, there may be omitted variables that do not vary with time or individual heterogeneity. Therefore, we attempt to establish a two-way fixed effects model as follows:
where represents labor productivity,
is the proxy variable for digital inclusive finance development,
represents control variables,
represents individual effects that do not vary with time,
represents time effects that do not go with individuals, and
is the random error term. Subscripts
and
represent different regions (provinces) and different periods, respectively.
3.2. Variable Selection
3.2.1. Dependent Variable: Labor Productivity ()
Shen et al. [
51] used the ratio of the added value of the primary industry to the number of employees in the primary industry to represent agricultural labor productivity. Similarly, we measure the total labor productivity by calculating the ratio of actual GDP to the total number of employees across various provinces and cities. Each of the three industries’ labor productivity in China is also represented as the ratio of added value of each industry to the number of employees, respectively. The data is adjusted by using 2011 as the base year. The advantage of measuring this indicator is that it eliminates the influence of labor scale on productivity. This allows for a more accurate comparison of productivity between economies of different sizes, as their scale differences do not distort labor productivity.
3.2.2. Core Explanatory Variable: Digital Inclusive Finance Development ()
Khera et al. [
52] have introduced a new index for digital inclusive finance, which encompasses multiple aspects of digital financial inclusion in 52 EMDEs across time. These indices facilitate cross-country analysis and enable a more detailed understanding of the relative contributions of digitization and traditional services to economic growth.
However, for a more comprehensive study of the development of digital inclusive finance in China, we have chosen to utilize the Digital Inclusive Finance Development Index developed by Guo et al. [
53] at Peking University, which effectively captures the evolving trends in financial development in China over the years and has been widely cited in academic research. The index encompasses three dimensions: the breadth of digital inclusive finance coverage, the depth of digital inclusive finance usage, and the degree of digitization in the field of digital inclusive finance. It comprises a comprehensive set of 33 specific indicators. The coverage dimension focuses on indicators related to account penetration, while the depth dimension examines various aspects of payment, money market funds, credit, insurance, investment, and credit-related services. The digitization dimension evaluates metrics related to mobility, affordability, credit accessibility, and convenience in the digital finance domain.
3.2.3. Control Variables
- (1)
Technological innovation (). Some studies regard R&D expenditure as a proxy variable for technological innovation. However, technological innovation activities, in reality, entail certain risks, and R&D investment does not necessarily translate effectively into innovation output, which may overestimate the technological innovation capacity. This paper selects the more appropriate number of domestic patent applications accepted as an indicator of innovation capacity.
- (2)
Trade openness (). According to the internal economies of scale theory, countries with high trade openness have larger market scales. They can achieve more significant economies of scale by expanding market shares and increasing production scales, thus improving labor productivity. The ratio of each province’s total import and export trade to its local GDP is used in this study to indicate how open each province’s commerce is.
- (3)
Industrial upgrading (). The “structural dividend hypothesis” states that productivity can be increased by shifting manufacturing resources from low- to high-productivity sectors. The ratio of tertiary industry output to secondary industry output is used in this study to measure industrial upgrading.
- (4)
Human capital (). In line with Li and Cai [
54], this study measures human capital by dividing the proportion of college students per 10,000 residents in each province.
- (5)
Government intervention (). The government is one of the virtual channels of resource allocation, and the academic community usually regards fiscal expenditure as a crucial instrumental variable affecting economic growth. This study measures the level of government intervention by comparing local fiscal expenditure to regional GDP.
- (6)
Environmental regulation (). Environmental regulation is an essential factor influencing enterprise production processes and behaviors. This paper measures this via the ratio of industrial pollution control investment in each province to the added value of local industrial output during the same period.
In summary, this research design intends to comprehensively analyze the effects of the growth of digital inclusive finance on labor productivity in various Chinese regions and industries. By constructing a two-way fixed effects model and selecting relevant variables such as technological innovation, trade openness, industrial upgrading, human capital, government intervention, and environmental regulation as control variables, the goal of this study is to give readers a thorough grasp of the connection between the growth of digital inclusive finance and labor productivity. The results of this study can offer policy makers and practitioners in digital finance and economic development valuable insights.
3.3. Data Description and Variable Explanation
This study gathers pertinent data for 30 provinces and municipalities across China from 2011 to 2020 (except Tibet, Hong Kong, Macau, and Taiwan), taking into account the currently available data. The primary data sources are the Peking University Digital Finance Research Center’s Digital Inclusive Finance Development Index and its sub-indices, China’s National Bureau of Statistics, the China Statistical Yearbook, and regional statistical bulletins on national economic and social development. This paper’s variables were logarithmized to eliminate heteroskedasticity. The descriptive statistics of the main relevant variables are shown in
Table 1.
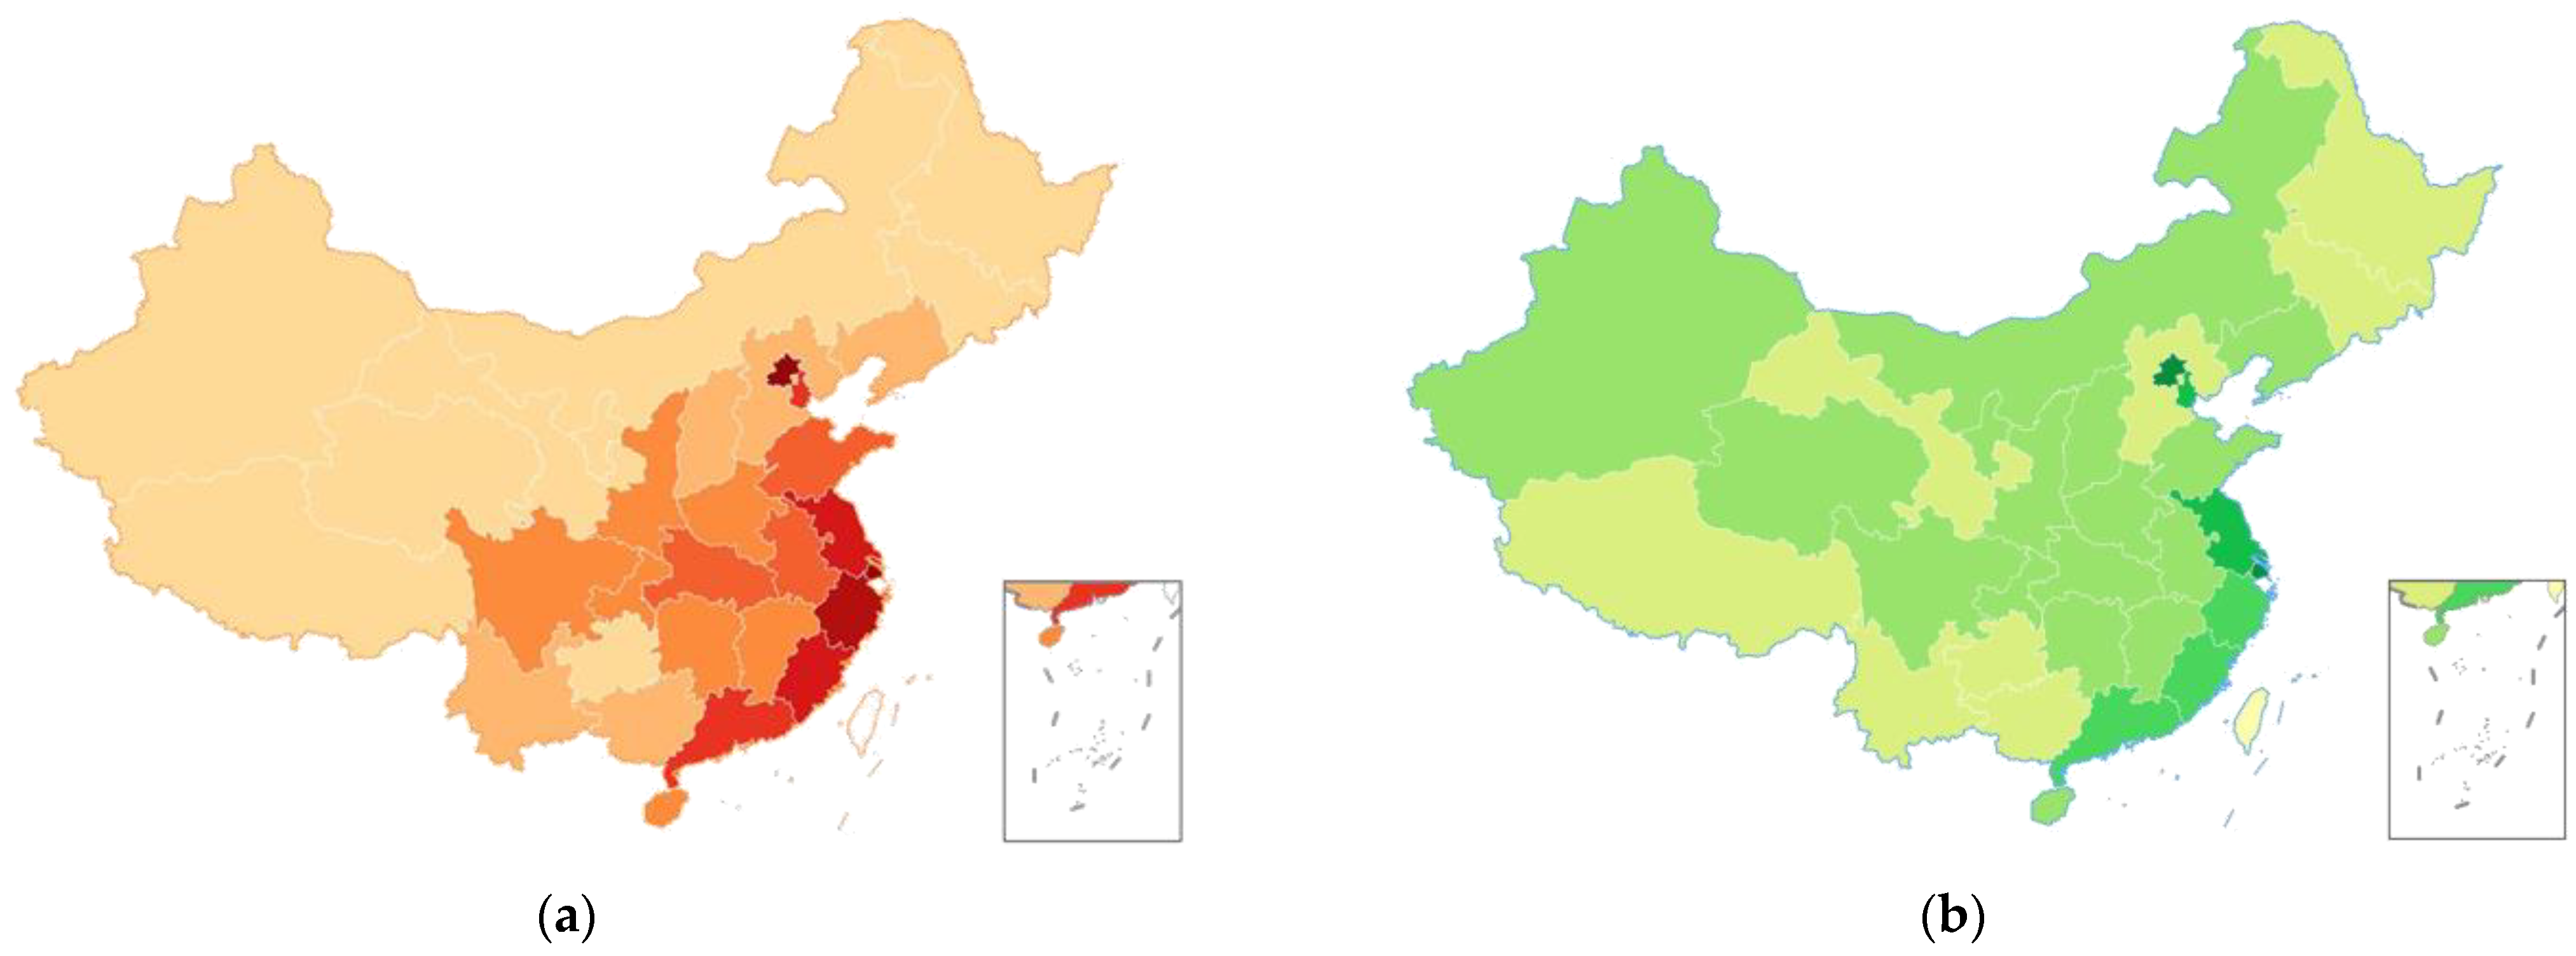
As the descriptive statistics of 2011–2020 show in
Table 1, the average national digital inclusive finance development index is 5.22, and the eastern region has the highest level. In terms of labor productivity, the eastern region also occupies the highest level, followed closely by the central and western regions. The control variables also exhibit regional heterogeneity, which could have an impact on labor productivity and therefore requires further analysis.
4. Empirical Results and Discussion
4.1. Full Sample Baseline Regression Analysis
First, this study uses balanced panel data from 30 Chinese provinces and municipalities from 2011 to 2020 for empirical analysis.
Table 2 reports the baseline estimation results of the impact of digital inclusive finance development on labor productivity using Equation (1).
According to column (1) of
Table 2, there is a positive correlation between labor productivity and digital inclusive finance at the 1% significant level. Columns (2) and (3) add corresponding control variables, and the results of both regressions show a significant positive correlation between digital inclusive finance and labor productivity. This may be attributed to the enhanced level of financial services in China through digital inclusive finance, which offers laborers and enterprises more convenient and flexible financing channels. Reducing the costs associated with traditional financing assists them in expanding their production scale, leading to an improvement in labor productivity. The
H1 is verified.
4.2. Robustness Tests
4.2.1. Changing the Proxy Indicator for Labor Productivity
In this study, we replace the proxy indicator for labor productivity with the per capita GDP of each province, and the estimated results are shown in column (1) of
Table 3. The results show that, despite modifying the labor productivity proxy indicator, the empirical results of the digital financial inclusion development variable are unchanged and continue to show a positive relationship with labor productivity. The outcomes of the other control variables are concurrently essentially verified.
4.2.2. Excluding Interfering Factors
Due to the unique economic characteristics and political status of the four municipalities (Beijing, Shanghai, Tianjin, and Chongqing), we exclude them from the national and provincial samples and compare the regression results to test the positive effect of digital financial inclusion development still holds. The estimated results are displayed in column (2) of
Table 3, and the digital financial inclusion development proxy variable remains significantly positive at the 1% level, demonstrating that the promotion effect of digital financial inclusion development on labor productivity is relatively stable.
4.2.3. Excluding the COVID-19 Time Period
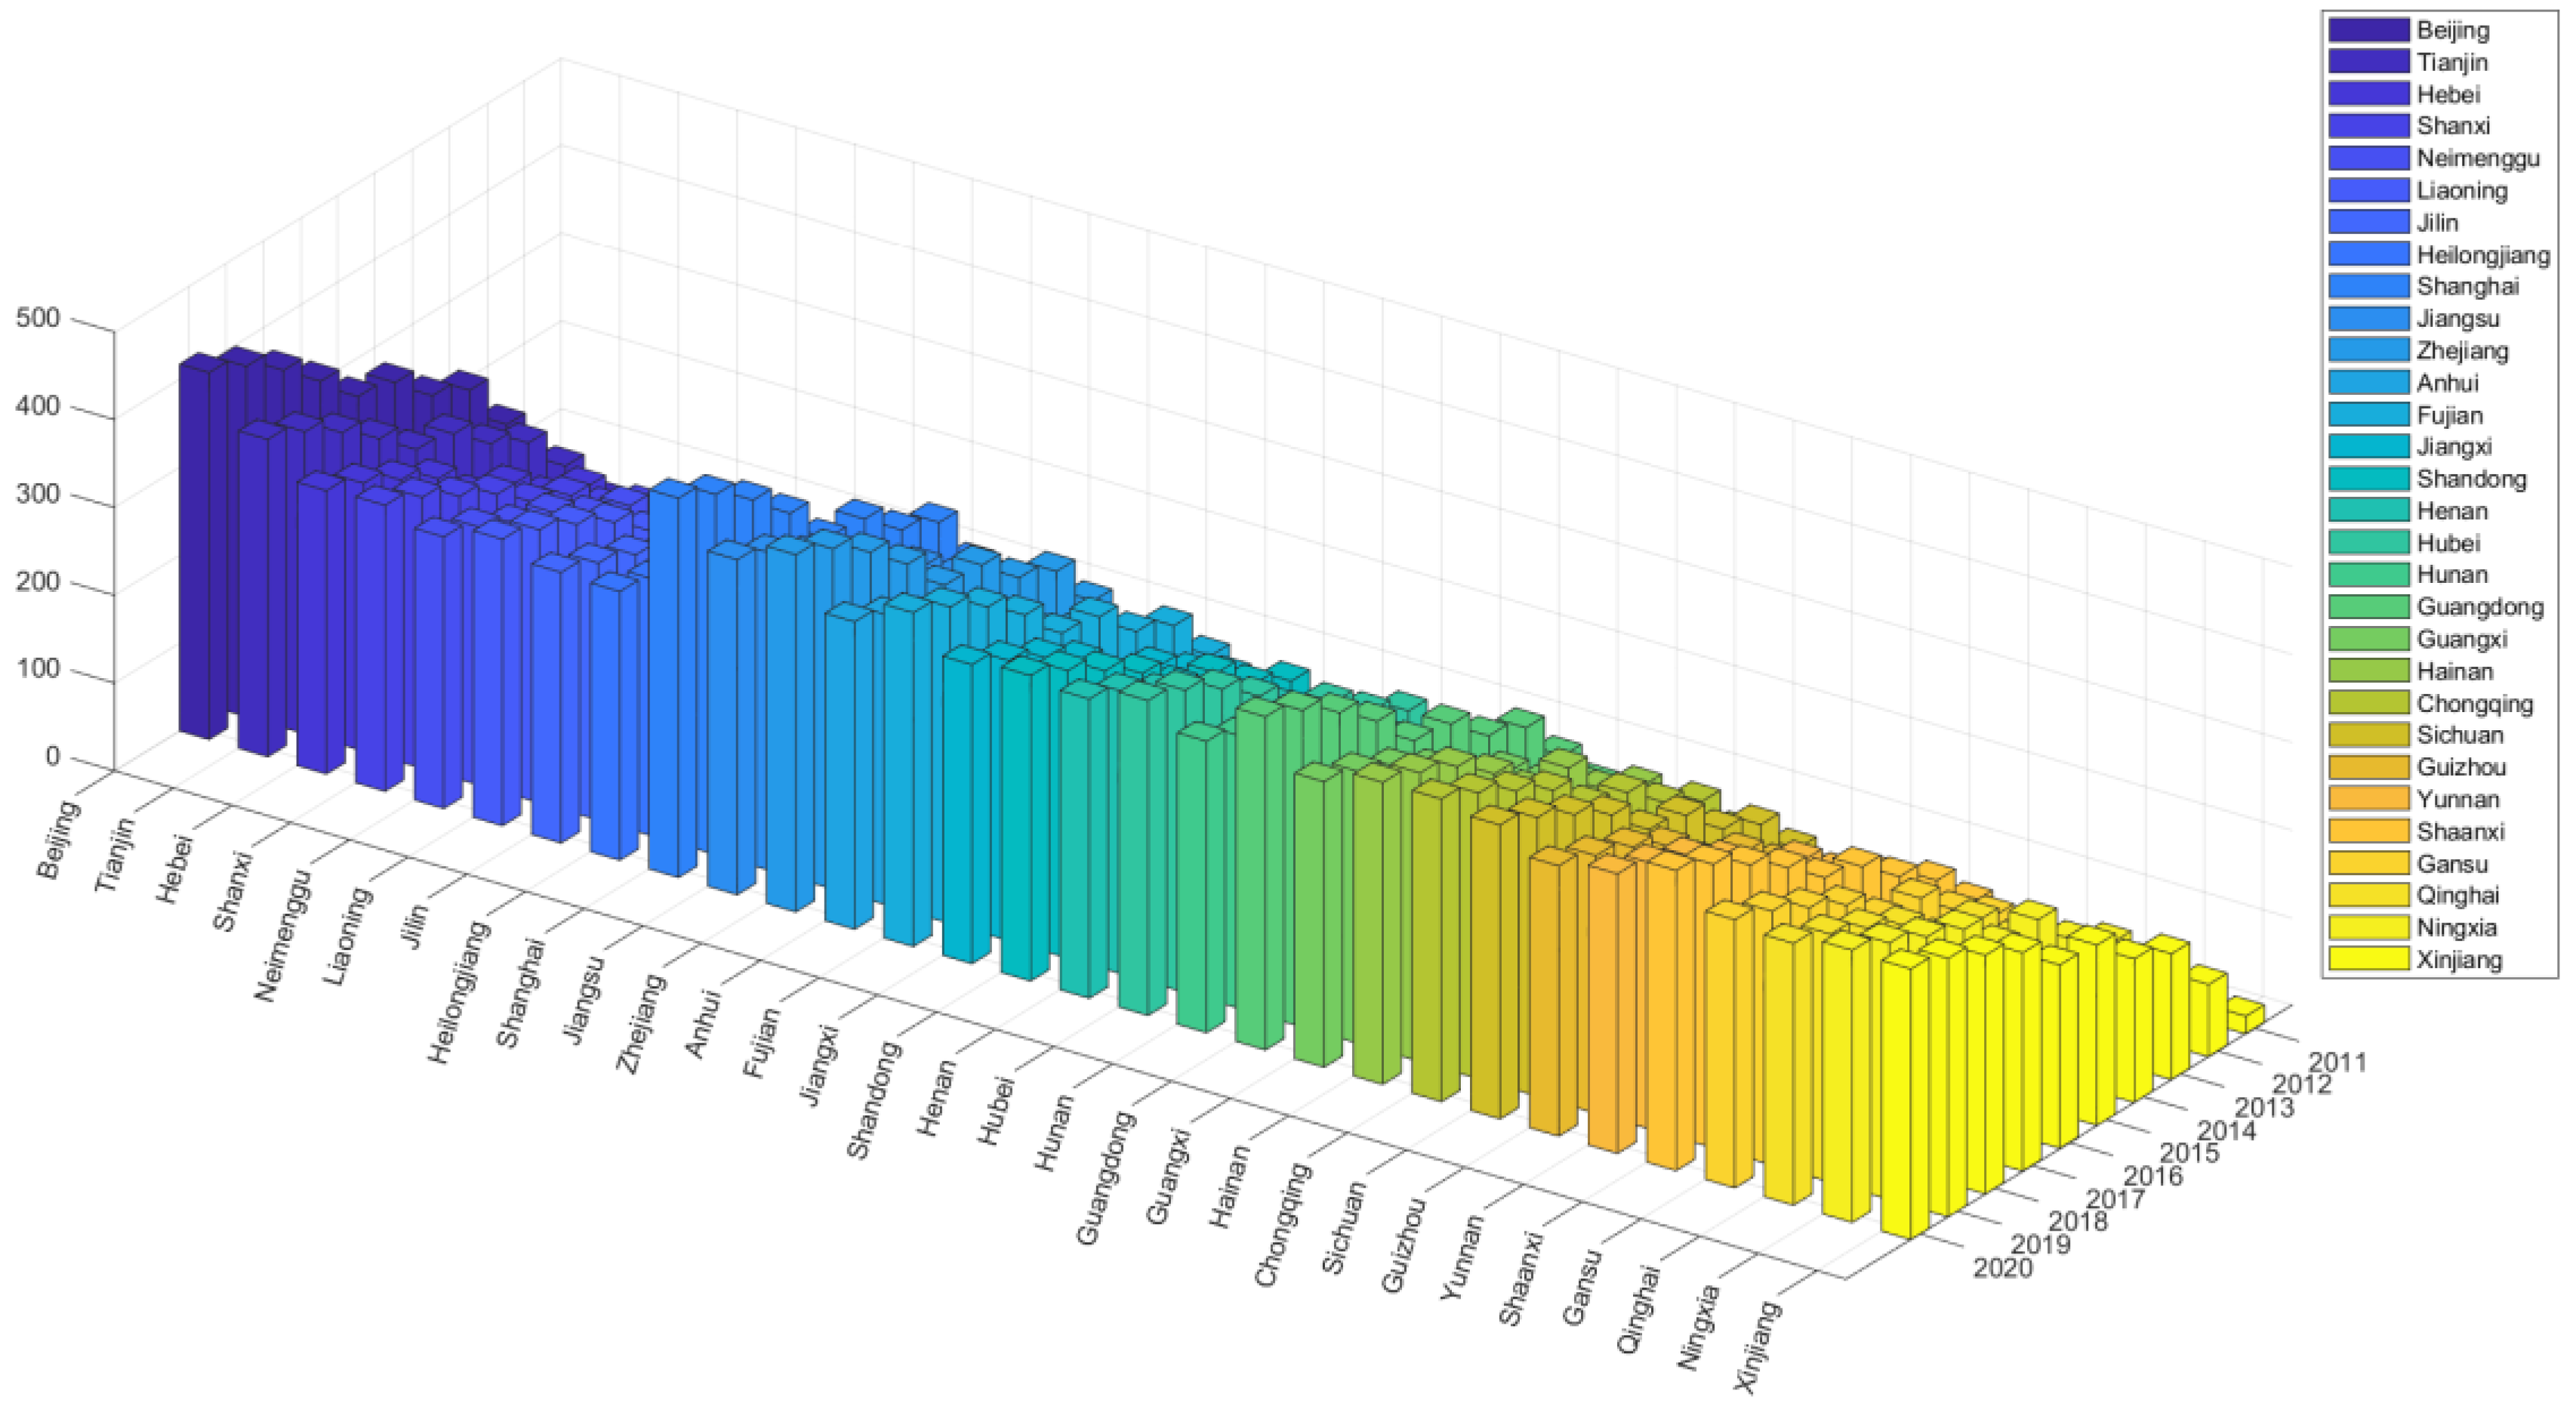
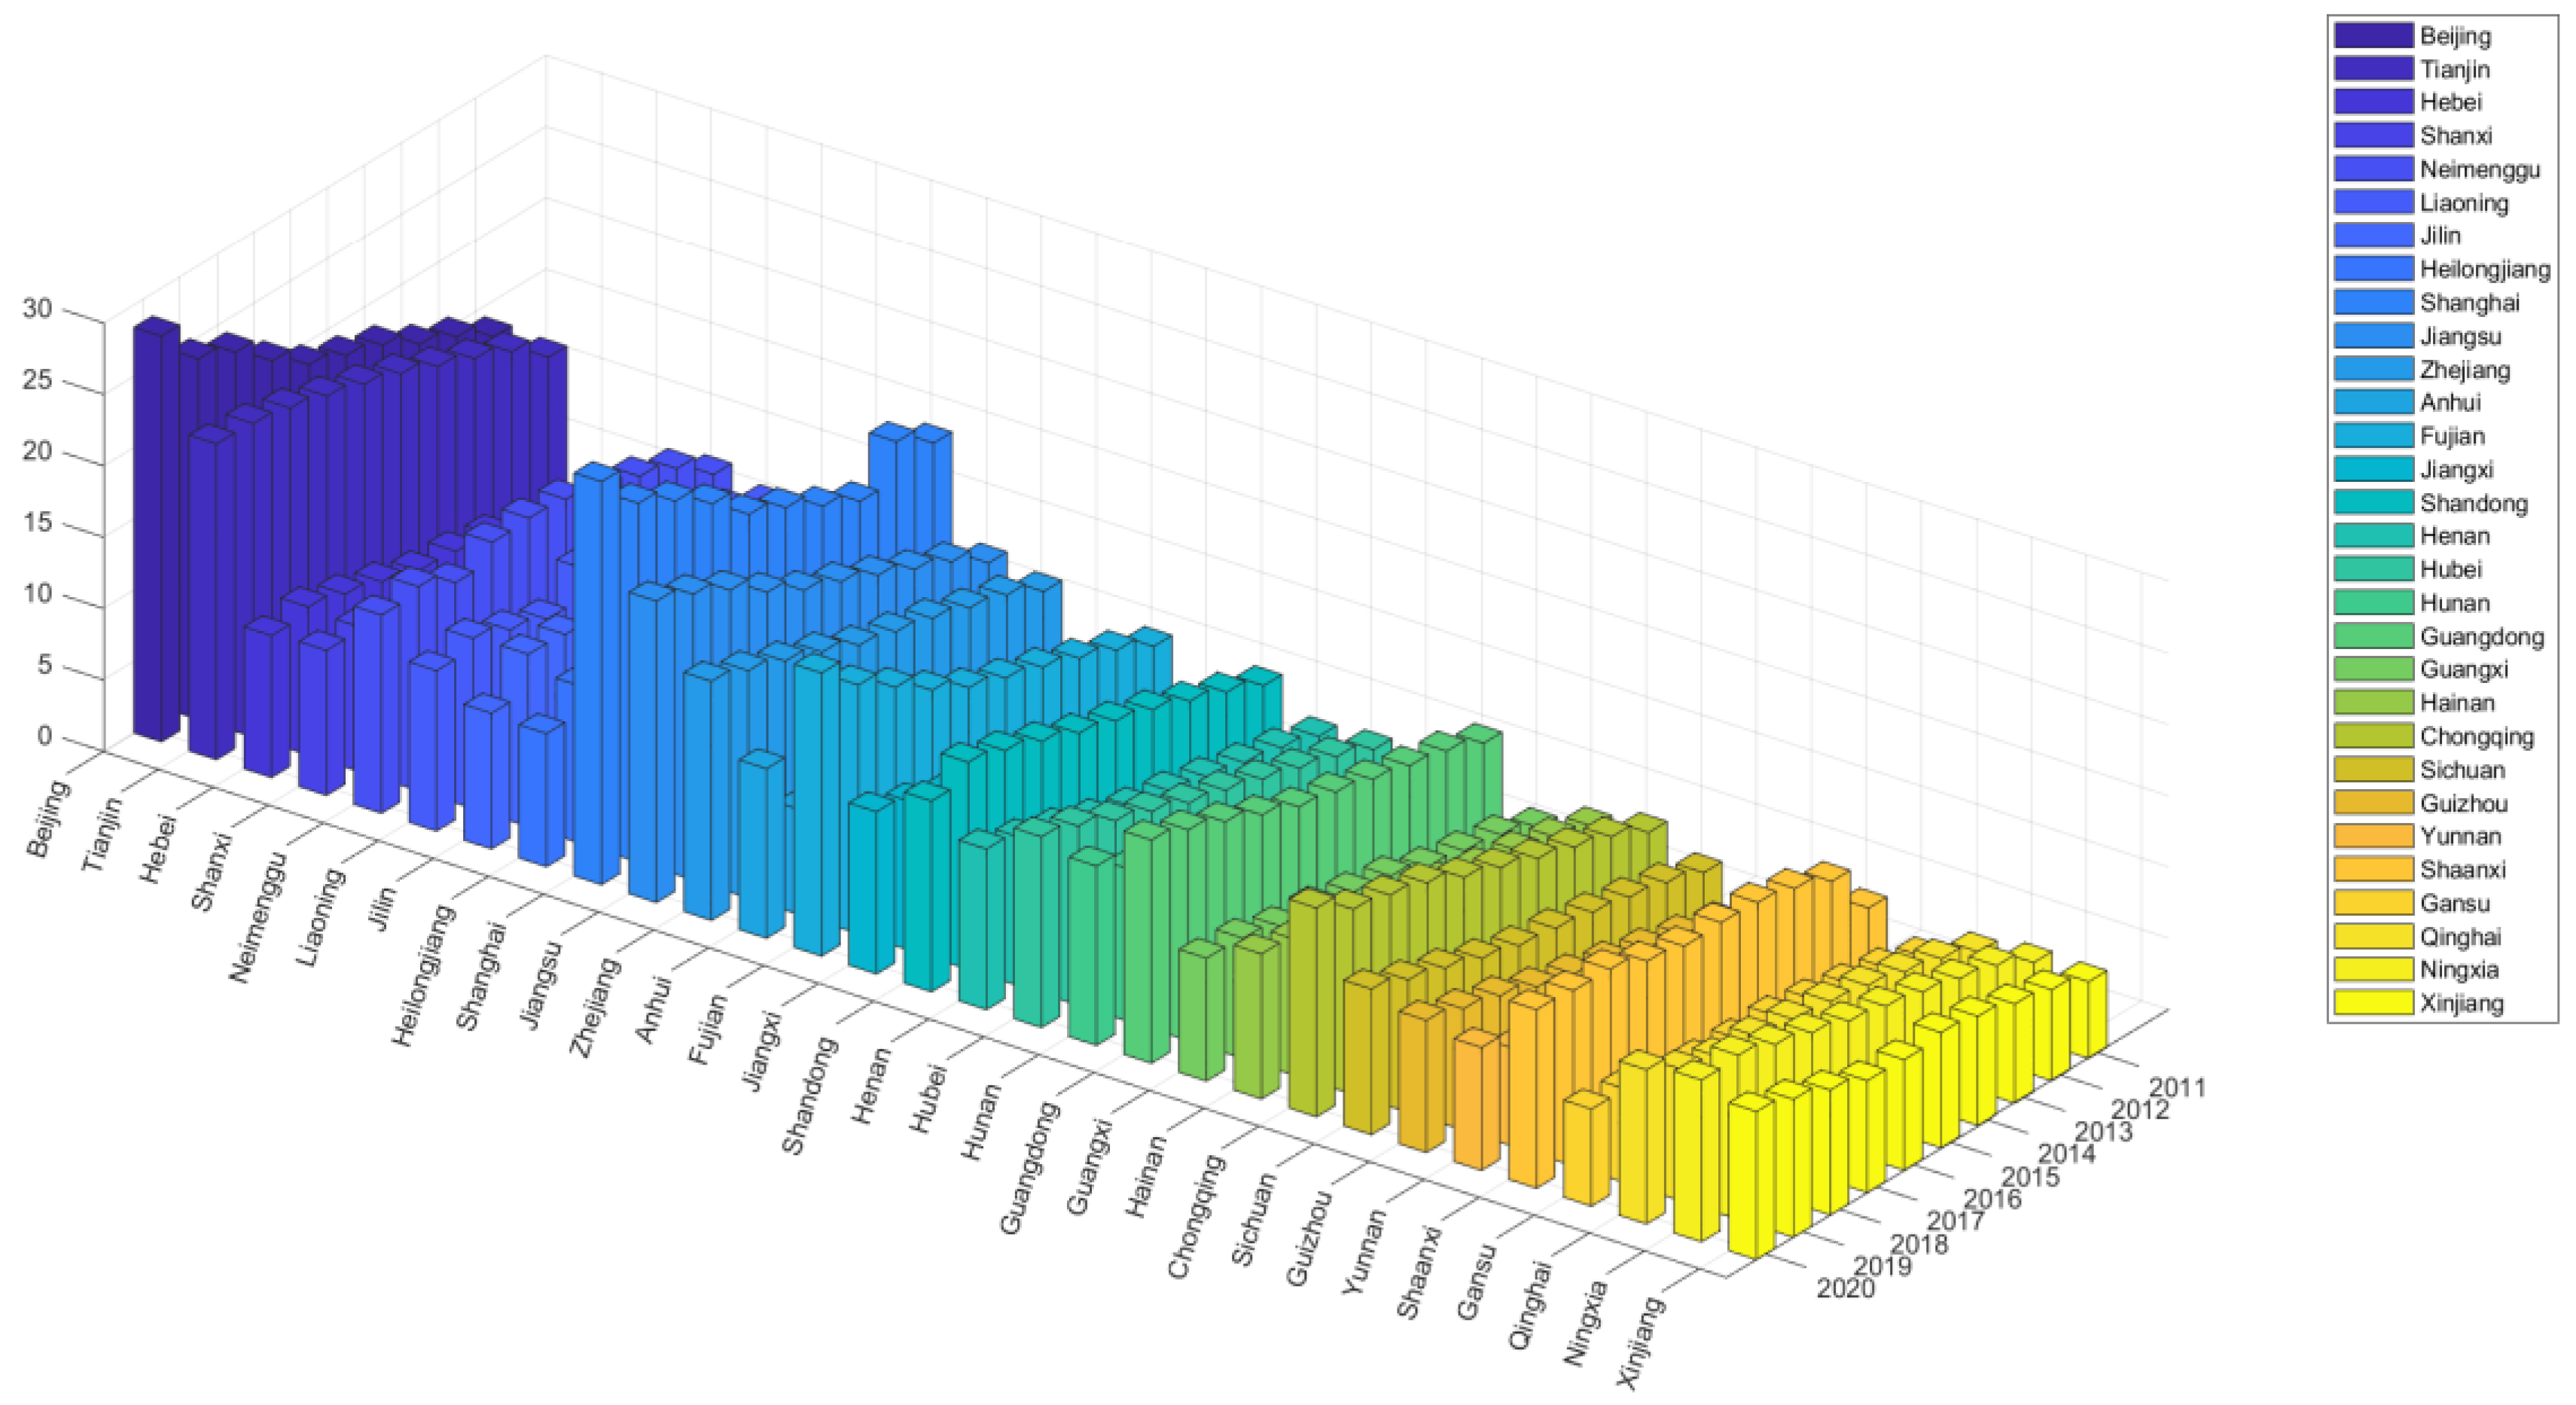
Considering the outbreak of COVID-19 at the end of 2019, which may have an impact on the development of digital inclusive finance and labor productivity, this study first visualizes the data using MATLAB for a more intuitive analysis. According to
Figure 2 and
Figure 3, it can be observed that the development of digital inclusive finance in almost all provinces and cities showed an upward trend in 2020, indicating that the impact of COVID-19 on the development of digital inclusive finance during the study period was relatively minor. However, some provinces and cities experienced a slowdown or even a decline in labor productivity in 2020, suggesting that labor productivity was affected to some extent by COVID-19. To ensure the robustness of the results, this study excludes the sample data from 2020 (the COVID-19 period) and conducts a re-examination of the conclusions. According to the result shown in column (3) of
Table 3, the correlation between digital inclusive finance and labor productivity is still positive, which proves the robustness of the conclusion.
4.2.4. Addressing Endogeneity
In the baseline regression, although this study has controlled for some influencing factors, other unobservable individual factors may still affect labor productivity, thus causing endogeneity problems due to omitted variables. To alleviate this issue, we refer to the studies of [
42,
55,
56,
57] and select two instrumental variables for investigation. The first instrumental variable is the Bartik instrumental variable, represented by the product of the first-order lag and the first-order difference of digital financial inclusion development. The second instrumental variable is the geographical instrumental variable, represented by the spherical distance from each provincial capital city to Hangzhou. According to the financial geography perspective, geographical distance positively correlates with the likelihood of information asymmetry. The geographic distance between each provincial capital and Hangzhou, the home of digital financial inclusion in China, will affect the digital inclusive finance development stage where this industry is. On the other hand, each province’s labor productivity is unaffected by the distance from its capital to Hangzhou. Since the distance between each province capital and Hangzhou is cross-sectional data, this study’s 2SLS regression analysis includes the interaction term between each province capital and Hangzhou and the mobile phone penetration rate. The estimated results of the models with the two instrumental variables are shown in columns (4) and (5) of
Table 3. The results indicate that digital financial inclusion development has a significant positive impact on labor productivity. Both models report Anderson LM statistics and Cragg–Donald Wald F statistics, which pass the tests for under-identification and weak instrumental variables, respectively. Based on the above analysis, the selected instrumental variables in this study are valid, and the endogeneity problem is somewhat resolved.
Table 3.
Robustness test results.
Table 3.
Robustness test results.
| | (1) | (2) | (3) | (4) | (5) |
|---|
| 0.806 ***
(3.33) | 0.128 **
(2.41) | 0.124 ***
(3.44) | 0.819 ***
(3.11) | 0.732 ***
(2.67) |
| 0.020
(1.60) | 0.014
(0.57) | 0.009
(0.47) | −0.025
(−0.96) | −0.037
(−0.97) |
| 0.050 ***
(4.42) | 0.072 ***
(3.35) | 0.052 ***
(2.88) | 0.056 **
(2.20) | 0.085 ***
(2.76) |
| −0.182 ***
(−6.78) | −0.191 ***
(−3.68) | −0.226 ***
(−5.73) | −0.285 ***
(−5.27) | −0.048 ***
(−1.11) |
| 0.122 ***
(3.46) | 0.166 **
(2.44) | 0.253 ***
(3.86) | 0.070
(0.86) | −0.120
(−0.72) |
| −0.114 ***
(−3.850) | −0.229 ***
(−3.80) | −0.103 **
(−2.10) | −0.140 **
(−2.25) | −0.225 ***
(−2.88) |
| −0.008
(−1.58) | −0.007
(−0.61) | −0.0104
(−1.25) | 0.001
(0.03) | −0.003
(−0.22) |
| Time Effect | Yes | Yes | Yes | Yes | Yes |
| Regional Effect | Yes | Yes | Yes | Yes | Yes |
| 0.545 **
(2.10) | 0.774
(1.56) | −0.456
(−1.64) | −1.135
(−0.82) | −1.370
(−0.93) |
| Anderson LM | | | | 26.798 *** | 7.831 *** |
Cragg-Donald
Wald F | | | | 30.930 | 18.659 |
| 0.972 | 0.916 | 0.94 | 0.973 | 0.957 |
| 300 | 260 | 270 | 270 | 300 |
4.3. Heterogeneity Analysis
4.3.1. Dimensional Heterogeneity Analysis
The digital financial inclusion comprehensive index includes three sub-indices: the digital financial inclusion coverage breadth index (
), the digital financial inclusion usage depth index (
), and the digital financial inclusion digitalization degree (
). This study separately regresses the sub-indices of digital financial inclusion with labor productivity to comprehensively analyze the relationship between each dimension of digital financial inclusion and labor productivity. The results are displayed in
Table 4.
The findings show that of the three aspects of digital financial inclusion, coverage breadth significantly positively impacts labor productivity at the 1% level. In contrast, usage depth and digitalization of digital financial inclusion have no significant impact on labor productivity. The development of digital financial inclusion in China is currently in a stable stage. It depends on several infrastructures, including widespread Internet and mobile device use, secure and reliable payment and settlement systems, and extensive data and information networks. However, these infrastructures have significant differences between different regions and industries, and the popularization and promotion of digital financial inclusion services also face certain limitations. Improving digital financial inclusion coverage breadth can help more businesses and individuals obtain financing support, assist businesses in growing their scale, improve production efficiency and innovation capabilities, and ultimately increase labor productivity as digital financial inclusion gradually develops horizontally and in-depth.
4.3.2. Regional Heterogeneity Analysis
The growth of digital inclusive finance also exhibits a severe spatial imbalance, particularly with the eastern region’s development being more advanced than other areas, given the stark inequalities in a physical location and economic development levels between provinces. For the independent regression analysis, the 30 sample provinces were divided into eastern, central, and western areas. The precise results are displayed in
Table 5.
It can be demonstrated that the development of digital inclusive finance has a considerable positive influence on labor productivity in the eastern provinces at the 1% level, demonstrating that the benefits of developing digital inclusive finance on labor productivity are still present in the eastern provinces. However, in the central and western areas, the impact of inclusive digital financial development on labor productivity is not particularly apparent. From a practical perspective, many provinces in the eastern region of China are at the forefront of the country’s economic development. Shangguan and Ge believe that digital inclusive finance development has a “high initial investment, low marginal cost” scale effect, and during its development, the eastern region, with well-established infrastructure and a large user base, benefits more significantly [
58]. From the perspective of labor productivity, the favorable geographical location and urban development conditions have improved the agglomeration capacity of production factors in the eastern region [
59], which is more conducive to digital inclusive finance development promoting the improvement of labor productivity.
Table 5.
Results of regional heterogeneity analysis.
Table 5.
Results of regional heterogeneity analysis.
| | Eastern | Central | Western |
|---|
| 0.248 ***
(2.86) | 0.204
(0.80) | −0.059
(−0.71) |
| 0.065 *
(1.82) | −0.053
(−0.86) | −0.022
(−0.58) |
| 0.103
(1.26) | 0.205 ***
(3.67) | 0.027
(0.97) |
| −0.541 ***
(−6.03) | −0.118
(−1.08) | −0.187 ***
(−2.52) |
| 0.006
(0.03) | 0.295
(−1.19) | 0.426 ***
(5.08) |
| −0.134 *
(−1.837) | −0.382 ***
(−2.95) | −0.275 ***
(−2.66) |
| −0.006
(−0.56) | 0.053 **
(2.13) | −0.031 *
(−1.73) |
| Time Effect | Yes | Yes | Yes |
| Regional Effect | Yes | Yes | Yes |
| −0.714
(−0.453) | −1.712
(−0.944) | 2.996 ***
(4.26) |
| 0.944 | 0.935 | 0.943 |
| 110 | 80 | 110 |
4.3.3. Industry Heterogeneity Analysis
To further understand the different impacts of digital inclusive finance development on the productivity within industries, this study regresses the labor productivity of the primary, secondary, and tertiary industries in China separately, with the results shown in
Table 6.
The empirical results indicate that the impact of digital inclusive finance development on labor productivity in the primary and tertiary industries is significantly positive at the 10% and 5% levels, respectively. This suggests that digital inclusive finance development can help improve labor productivity in the primary and tertiary industries in China’s provinces while having no appreciable impact on labor productivity in the secondary industry. Possible reasons include the following: First, digital inclusive finance development plays a vital role in improving the financing and financial service levels of farmers and rural small and micro enterprises. The primary sector still makes up a sizable component of China’s economy. Due to limitations in funding sources and transactional procedures, farmers and rural small and micro companies sometimes struggle to receive adequate financial backing. The development of digital inclusive finance can enhance their access to financial services and their ability to produce goods more efficiently. Second, digital inclusive finance development has complex impacts on multiple industries in the tertiary sector, such as providing more convenient payment tools for the tertiary industry and reducing transaction costs to improve production efficiency. Third, large enterprises dominate the secondary industry and often have better financing channels and credit ratings. Due to their relatively low reliance on the development of digital inclusive finance, the impact of supporting this development on labor productivity in the secondary industry is also relatively insignificant.
5. Mechanism Test
The findings of the initial regression demonstrate that the growth of digital inclusive finance contributes significantly to encouraging an increase in labor productivity in China. The scholarly world has not yet agreed on how the two work. This study tests the “digital inclusive finance development—capital deepening—labor productivity” chain path. Following the approach of Jiang [
60], we first establish the following model to test the mechanism effect of capital deepening:
The equation represents the degree of capital deepening, represents digital inclusive finance development, and represents control variables. Moreover, it represents individual and time effects, respectively, and random disturbances.
This study measures capital deepening with capital intensity and calculates the capital stock of each province using the perpetual inventory method at constant prices, which can be expressed as follows:
The subscript represents the province, the capital stock in year
, the capital stock in year
− 1, the fixed asset investment in year
, and the average depreciation rate. Referring to the approach of Zhang [
61], a 9.6% depreciation rate is used. Both are deflated using the fixed asset price index. Due to the lack of a fixed asset price index for 2020, the geometric average growth rate of the previous five years is used to calculate and fill the gap.
is the number of actually employed people, and the capital intensity can be represented as follows:
As shown in
Table 7, the expansion of digital inclusive finance has a significant favorable influence on capital deepening, and this benefit persists even with the addition of control factors. Combined with the previous mechanism analysis, it can be concluded that digital inclusive finance development can improve labor productivity by promoting capital deepening. To ensure the robustness of the mechanism test, this study further adopts the research approach of Wen et al. [
62], using digital inclusive finance development and capital deepening as explanatory variables and labor productivity as the dependent variable, constructing the following model:
According to
Table 8, the coefficients of the development of digital inclusive finance in column (2) and (3) are statistically significant positives based on the regression results of the mediating effect model. The fact that the coefficient of the development of digital inclusive finance in column (3) is less than that in column (1) suggests that the growth of digital inclusive finance strengthens capital deepening, which, in turn, enhances labor productivity. Capital deepening’s partially mediating involvement in this path demonstrates the resilience of its mechanism effect. The
H2 is verified.
In summary, digital inclusive finance development expands the coverage of financial services and improves credit availability, enabling capital to flow more widely into areas with demand, thereby promoting capital deepening. Capital deepening implies an increase in the capital stock per unit of labor, allowing workers to produce more products and services simultaneously, increasing labor productivity.
6. Conclusions and Implications
Using panel data from 30 Chinese provinces (cities) from 2011 to 2020, this study investigates the effects of the growth of digital inclusive finance on labor productivity and the mediating function of capital deepening. The following are the primary conclusions.
First, digital inclusive finance development has promoted the improvement of labor productivity. From a national standpoint, developing digital inclusive finance aids in enhancing labor productivity. This finding holds despite taking into account endogeneity concerns and robustness testing. Even though the level of digitization and its usage depth are not yet significant from the perspective of the financial sector’s development dimension heterogeneity, the broadening of digital inclusive finance significantly benefits labor productivity. Digital inclusive finance significantly boosts labor productivity development in Eastern China but not in Central and Western China in terms of regional variability. Digital inclusive finance significantly boosts labor productivity in China’s primary and tertiary industries but not in the secondary sector, according to the theory of industry heterogeneity.
Second, the growth of digital inclusive finance that promotes increasing labor productivity depends on capital deepening. The panel two-way fixed-effect model’s mechanism analysis findings demonstrate how the growth of digital inclusive finance might support higher labor productivity by bolstering capital deepening. The robustness of the mechanical effect of capital deepening is examined further in this research using the mediating effect model, and the analysis’s findings support this claim.
Based on the research findings presented in this paper, the following policy recommendations are proposed.
First, the development of digital inclusive finance should be expanded. Although the development of digital inclusive finance in our country is still in its early stages, its role in promoting labor productivity has begun to emerge. The government and financial institutions can enhance support for the financial technology industry and encourage innovation in financial technology to create a favorable environment for digital inclusive finance. In addition, financial institutions can innovate financial products and services, going beyond inclusiveness to reach more remote areas and vulnerable groups, thereby further reducing the barriers to financial services and including more people in the financial system. At the same time, it is essential to establish and improve appropriate financial policies and regulatory measures to facilitate the healthy and sustainable development of digital inclusive finance. Second, strategies for the development of digital inclusive finance should be flexibly formulated. This involves expanding the coverage of digital inclusive finance, continuously harnessing the positive impact of its broad development on labor productivity, and gradually stimulating greater impetus from the depth and digitization it offers. In the eastern regions, efforts should be made to maintain and enrich the application scenarios of digital inclusive finance while promoting its deeper development in the central and western regions. It is also important to accelerate the integration of industries with the development of digital inclusive finance, unleashing the driving force of digital inclusive finance and improving labor productivity. Third, experts in the field pay attention to capital deepening. Strengthening the construction of financial infrastructure is necessary to enhance the efficiency of financial resource allocation. Policy makers should promote the improvement of the financial market, such as the development of a multi-tiered capital market, to provide more financing channels for enterprises. Additionally, it is essential to enhance research and application in the development of digital inclusive finance, leveraging technologies such as big data and artificial intelligence to improve the precision and efficiency of financial resource allocation. This will encourage more capital investment in productive projects, further deepening capital accumulation and promoting the enhancement of labor productivity.
Author Contributions
Writing—original draft, D.W.; writing—review and editing, Y.C. All authors have read and agreed to the published version of the manuscript.
Funding
This work is supported by the National Natural Science Foundation of China under Grant No. 12001377.
Institutional Review Board Statement
Not applicable.
Informed Consent Statement
Not applicable.
Data Availability Statement
The data presented in this study are available online, such as China’s National Bureau of Statistics, China’s Statistical Yearbook, and regional statistical bulletins on national economic and social development.
Conflicts of Interest
The authors declare no conflict of interest.
References
- Hu, C.P.; Hu, X. Agricultural Labor Transfer, Productivity Improvement and Regional Labor Productivity Growth—Based on the Comparison of Labor Productivity among 31 Provinces. Contemp. Econ. Manag. 2023, 45, 69–76. [Google Scholar]
- Manioudis, M.; Meramveliotakis, G. Broad strokes towards a grand theory in the analysis of sustainable development: A return to the classical political economy. N. Political Econ. 2022, 27, 866–878. [Google Scholar] [CrossRef]
- Ye, Y.W.; Tao, Y.Q.; Wang, Q.H.; Liu, Z.D. Tax Incentives, Human Capital Investment, and Corporate Labor Productivity: Evidence from Tax Deduction Policy on Firms’ Employee Education Expenses in 2018. J. Quant. Technol. Econ. 2023, 40, 136–157. [Google Scholar]
- Wu, H.; Zhao, Y. Studies on the Non-linear Effect of Population Agglomeration on Labor Productivity in China. Popul. J. 2019, 41, 78–88. [Google Scholar]
- Song, D.Y.; Zhao, F.F. The influence of environmental regulation and capital deepening on labor productivity. In Proceedings of the 12th Annual Chinese Development Economics Conference, Kunming, China; 2018. [Google Scholar]
- Tao, A.P.; Jiang, X. The influence of city size on labor productivity: Taking 267 cities for example. Urban Probl. 2017, 265, 15–21. [Google Scholar]
- Han, G.Y.; Liu, T.S. Effect of Air Quality on Labor Productivity: Based on the Moderating Effect of Forest Resources. J. Agro-For. Econ. Manag. 2021, 20, 640–648. [Google Scholar]
- Huang, Y.P.; Huang, Z. The Development of Digital Finance in China: Present and Future. China Econ. Q. 2018, 17, 1489–1502. [Google Scholar]
- Chen, L. From Fintech to Finlife: The case of Fintech Development in China. China Econ. J. 2016, 9, 225–239. [Google Scholar] [CrossRef]
- G20 High-Level Principles for Digital Financial Inclusion. People’s Bank of China. Available online: http://www.pbc.gov.cn/goutongjiaoliu/113456/113469/3142307/2016091419074418496.pdf (accessed on 17 May 2023).
- Liu, Y.; Liu, C.; Zhou, M. Does digital inclusive finance promote agricultural production for rural households in China? Research based on the Chinese family database (CFD). China Agric. Econ. Rev. 2021, 13, 475–494. [Google Scholar] [CrossRef]
- Sassi, S.; Goaied, M. Financial development, ICT diffusion and economic growth: Lessons from MENA region. Telecommun. Policy 2013, 37, 252–261. [Google Scholar] [CrossRef]
- Cheng, C.; Chien, M.; Lee, C. ICT diffusion, financial development, and economic growth: An international cross-country analysis. Econ. Model 2021, 94, 662–671. [Google Scholar] [CrossRef]
- Kablana, A.S.K.; Chhikara, K.S. A Theoretical and Quantitative Analysis of Financial Inclusion and Economic Growth. Manag. Labour Stud. 2013, 38, 103–133. [Google Scholar]
- Khera, P.; Ng, M.S.Y.; Ogawa, M.S.; Sahay, M.R. Is Digital Financial Inclusion Unlocking Growth? IMF Working Paper No. 21/xx; International Monetary Fund: Washington, DC, USA, 2021. [Google Scholar]
- Jiang, S.; Sun, Y.X. An empirical study on the effect of the digital economy on the real economy. Sci. Res. Manag. 2020, 41, 32–39. [Google Scholar]
- Zhang, X.; Wan, G.H.; Zhang, J.J.; He, Z.Y. Digital Economy, Financial Inclusion, and Inclusive Growth. Econ. Res. 2019, 54, 71–86. [Google Scholar]
- Ren, T.Z.; Yin, Z.G. Digital Financial Inclusion and Inclusive Growth of Chinese Economy: Theoretical Analysis and Empirical Evidence. J. Manag. 2022, 35, 23–35. [Google Scholar]
- Zhao, H.; Zheng, X.; Yang, L. Does Digital Inclusive Finance Narrow the Urban-Rural Income Gap through Primary Distribution and Redistribution? Sustainability 2022, 14, 2120. [Google Scholar] [CrossRef]
- Xie, X.L.; Shen, Y.; Zhang, H.X.; Guo, F. Can Digital Finance Promote Entrepreneurship?—Evidence from China. China Econ. Q. 2018, 17, 1557–1580. [Google Scholar]
- Xu, X.; Yang, Y. Can Digital Financial Inclusion Help Reduce Urban Crime? Evidence from Chinese Criminal Judgment on Theft Cases. Systems 2023, 11, 203. [Google Scholar] [CrossRef]
- Hui, X.B. The Development of Digital financial inclusion and urban total factor productivity—Empirical Evidence From 278 Cities. Rev. Invest. Stud. 2021, 40, 4–15. [Google Scholar]
- Zhang, Q.W.; Tian, J. Can Digital Inclusive Finance Improve Agricultural Total Factor Productivity?—Based on Perspective of Heterogeneity and Spatial Spillover Effects. Agric. Econ. Manag. 2023, 77, 45–56. [Google Scholar]
- Shen, Y.; Guo, X.; Zhang, X. Digital Financial Inclusion, Land Transfer, and Agricultural Green Total Factor Productivity. Sustainability 2023, 15, 6436. [Google Scholar] [CrossRef]
- Zhang, L.; Chen, J.; Liu, Z.; Hao, Z. Digital Inclusive Finance, Financing Constraints, and Technological Innovation of SMEs—Differences in the Effects of Financial Regulation and Government Subsidies. Sustainability 2023, 15, 7144. [Google Scholar] [CrossRef]
- Hong, M.; Tian, M.; Wang, J. Digital Inclusive Finance, agricultural industrial structure optimization and agricultural green total factor productivity. Sustainability 2022, 14, 11450. [Google Scholar] [CrossRef]
- Song, J.; Zhou, H.; Gao, Y.; Guan, Y. Digital Inclusive Finance, Human Capital and Inclusive Green Development—Evidence from China. Sustainability 2022, 14, 9922. [Google Scholar] [CrossRef]
- Zhou, R.H.; Li, S.L.; Yu, H.X. The Impact of Digital Inclusive Finance on TFP of Enterprises: From the Perspective of Entrepreneurship. N. Financ. 2023, 410, 43–49. [Google Scholar]
- Chen, Y.; Yang, S.; Li, Q. How does the development of digital financial inclusion affect the total factor productivity of listed companies? Evidence from China. Financ. Res. Lett. 2022, 47, 102956. [Google Scholar] [CrossRef]
- Tang, T.; Li, F.J.; Xia, L. The Impact of Enterprise Digitalization on Labor Productivity—Empirical Evidence from Chinese Private Companies. J. China Univ. Geosci. Soc. Sci. Ed. 2022, 22, 112–124. [Google Scholar]
- Yang, J.; Fu, D.Y. Impact of Digital Economy on Labor Productivity—Empirical Study Based on Provincial Panel Data. Stat. Decis. 2023, 1, 5–10. [Google Scholar]
- Cheng, M.W.; Zhang, J.P.; Li, L.L. Internet Development, Labor Transfer and the Improvement of Labor Productivity. World Econ. Pap. 2020, 258, 1–17. [Google Scholar]
- Ozbas, O. Integration, organizational processes, and allocation of resources. J. Financ. Econ. 2005, 75, 201–242. [Google Scholar] [CrossRef]
- Gui, Y.; Lv, J.L.; Wang, Y. Financial Mismatch and Enterprise Financialization. Contemp. Financ. Econ. 2023, 459, 68–80. [Google Scholar]
- Lv, J.L.; Chen, J.F. Credit Imbalance, Business Efficiency Heterogeneity and Formation of Zombie Enterprises. Contemp. Financ. Econ. 2018, 405, 44–59. [Google Scholar]
- Yang, J.; Lu, Y.; Li, J.Z.; Xue, R. The impact of inclusive finance on entrepreneurship in the digital age: Evidence from Chinese household micro survey. J. Manag. Sci. China 2023, 39, 5–10. [Google Scholar]
- Wang, M.; Li, Z.W. Digital Inclusive Finance and Enterprise Innovation: Theoretical Logic and Empirical Test. J. Manag. 2023, 36, 102–119. [Google Scholar]
- Liu, Y.; Zhang, Y. Digital Financial Inclusion and Sustainable Growth of Small and Micro Enterprises—Evidence Based on China’s New Third Board Market Listed Companies. Sustainability 2020, 12, 3733. [Google Scholar]
- Zhang, H.J.; Huang, F. Digital Inclusive Finance, Factor Flow Efficiency and Coordinated Economic Development. Stat. Decis. 2023, 39, 132–137. [Google Scholar]
- Ma, S.Z.; Hu, Z.X. Does Digital Finance Affects Labor Mobility?—Based on the Micro Perspective of China’s Floating Population. China Econ. Q. 2022, 22, 303–322. [Google Scholar]
- Zhou, T.Y. Digital Inclusive Finance, Factor Price and Labor Mobility. Contemp. Econ. Manag. 2022, 44, 77–87. [Google Scholar]
- Deng, J.F.; Yang, J. Labor Productivity during Economic Transformation in China: Factors and Growth Decomposition. Popul. Econ. 2022, 253, 122–138. [Google Scholar]
- Li, Z. Analysis on the Driving Forces and Industry Origins of China’s Labor Productivity Growth: 1978–2018. Mod. Econ. Sci. 2022, 44, 1–12. [Google Scholar]
- Huang, H. An empirical examination of the relationship between capital deepening and labor force employment in China’s manufacturing industry. Stat. Decis. 2016, 458, 129–132. [Google Scholar]
- Wu, H.M. Does Capital Deepening Bring about Labor Productivity Decline. Financ. Econ. 2013, 306, 40–50. [Google Scholar]
- Chen, X.L.; Lian, Y.J. Capital-labor elasticity of substitution and regional economic growth: An empirical investigation of the De La Grandville hypothesis. China Econ. Q. 2013, 12, 93–118. [Google Scholar]
- Baumol, W.J. Productivity growth, convergence, and welfare: What the long-run data show. Am. Econ. Rev. 1986, 76, 1072–1085. [Google Scholar]
- Hecht, J. Modelling cross-sectional profitability and capital intensity using panel corrected significance tests. Appl. Financ. Econ. 2008, 18, 1501–1513. [Google Scholar] [CrossRef]
- Ren, J.H.; Lei, H.Z. Digital Financial Inclusion, Capital Deepening and Total Factor Productivity in Agriculture. Soc. Sci. 2022, 302, 86–95. [Google Scholar]
- Williamson, J.G. Agricultural Development: An International Perspective. J. Econ. Hist. 1973, 33, 484–487. [Google Scholar] [CrossRef]
- Shen, D.; Liang, H.; Shi, W. Rural Population Aging, Capital Deepening, and Agricultural Labor Productivity. Sustainability 2023, 15, 8331. [Google Scholar] [CrossRef]
- Khera, P.; Ng, S.; Ogawa, S.; Sahay, R. Measuring Digital Financial Inclusion in Emerging Market and Developing Economies: A New Index; IMF Working Paper No. 21/xx; International Monetary Fund: Washington, DC, USA, 2021. [Google Scholar]
- Guo, F.; Wang, J.Y.; Wang, F.; Kong, T.; Zhang, X.; Cheng, Z.Y. Measuring the Development of Digital Inclusive Finance in China: Indexing and Spatial Characteristics. China Econ. Q. 2020, 19, 1401–1418. [Google Scholar]
- Li, H.J.; Cai, W.H. The Promotion Effect of Participation in the Division of Global Value Chain on Productivity and Wages in the Service Industry of China. J. Guangdong Univ. Financ. Econ. 2016, 31, 16–26. [Google Scholar]
- Bartik, T. How do the effects of local growth on employment rates vary with initial labor market conditions? W.E. Upjohn Inst. Employ. Res. 2006, 09-148, 36. [Google Scholar]
- Tan, L.Z.; Zhang, Y.Z.; Zhou, Z.S. The Impact of Digital Inclusive Finance on Rural Multidimensional Relative Poverty: Evidence from Provincial Data in China. J. Agro-For. Econ. Manag. 2023, 22, 224–232. [Google Scholar]
- Zhang, M.X.; Xie, S.X.; Qiang, H.F.; Zheng, L.K. Digital Financial Inclusion and Export of SMEs: Timely Help or Additional Improvement. J. World Econ. 2022, 45, 30–56. [Google Scholar]
- Shangguan, X.M.; Ge, B.H. Digital Finance, Environmental Regulation and High-Quality Economic Development. Mod. Financ. Econ. J. Tianjin Univ. Financ. Econ. 2021, 41, 84–98. [Google Scholar]
- Zheng, Y.X. Can Digital Inclusive Finance Promote the Output of Chinese Regional Innovation? An Empirical Study Based on China’s Provincial Panel Data. Econ. Probl. 2020, 494, 53–61. [Google Scholar]
- Jiang, T. Mediating Effects and Moderating Effects in Causal Inference. China Ind. Econ. 2022, 5, 100–120. [Google Scholar]
- Zhang, J.; Wu, G.Y.; Zhang, J.P. The Estimation of China’s provincial capital stock: 1952–2000. Econ. Res. J. 2004, 10, 35–44. [Google Scholar]
- Wen, Z.L.; Zhang, L.; Hou, J.T.; Liu, H.Y. Testing and application of the mediating effects. Acta Psychol. Sin. 2004, 5, 614–620. [Google Scholar]
| Disclaimer/Publisher’s Note: The statements, opinions and data contained in all publications are solely those of the individual author(s) and contributor(s) and not of MDPI and/or the editor(s). MDPI and/or the editor(s) disclaim responsibility for any injury to people or property resulting from any ideas, methods, instructions or products referred to in the content. |
© 2023 by the authors. Licensee MDPI, Basel, Switzerland. This article is an open access article distributed under the terms and conditions of the Creative Commons Attribution (CC BY) license (https://creativecommons.org/licenses/by/4.0/).


