Article

Feasibility Study of Managed Aquifer Recharge Deployment on the Island of Vis (Croatia)

1
Department of Hydrogeology and Engineering Geology, Croatian Geological Survey, Sachsova 2, 10000 Zagreb, Croatia
2
Vitar u Krmu Ltd., Vukovac 5, 22202 Primošten, Croatia
3
Faculty of Mining, Geology and Petroleum Engineering, University of Zagreb, Pierottijeva 6, 10000 Zagreb, Croatia
*
Author to whom correspondence should be addressed.
Sustainability 2023, 15(13), 9934; https://doi.org/10.3390/su15139934
Submission received: 9 May 2023 / Revised: 15 June 2023 / Accepted: 18 June 2023 / Published: 21 June 2023
(This article belongs to the Special Issue Groundwater Protection and Sustainable Utilization)

Abstract

:
Over the last decades, the quality and quantity of the Mediterranean freshwater resources have significantly deteriorated due to climate change, unsustainable utilization, user conflicts, and seawater intrusions. On the small and remote island of Vis, where similar issues prevail, the need for alternative water management solutions has yielded managed aquifer recharge (MAR) as a promising option for increasing the safety and resilience of the local and autonomous water supply. By performing a cost–benefit analysis (CBA) to evaluate the feasibility of the deployment of an infiltration pond method in the Korita well field, the results evidenced a positive financial performance and sustainability of the proposed MAR solution. In addition, the overall economic benefits of the project, quantified through the willingness-to-pay method, significantly exceeded its costs, as evidenced by the high benefit/cost ratio of 2.83. The most significant uncertainty related to the infiltration pond method is represented by the high sensitivity to changes in the applied hydrological assumptions (i.e., the evaporation coefficient and number of annual infiltration pond recharges). This study aims to contribute to the understanding of interrelated socio-economic factors of MAR projects in karst aquifers, and represents the first of its kind in Croatia.

1. Introduction

Since the beginning of the 20th century, freshwater withdrawal and use have substantially increased to sustain the global population increase and the economic shift towards more resource-intensive production [1]. These trends represent a significant management challenge in areas with an arid and semiarid climate, such as the Mediterranean region. Here, freshwater resources, represented mostly by groundwater, are spatially and temporally limited and often highly vulnerable. The Mediterranean region and its groundwater resources have been facing increasing anthropic pressure in the last decades to support the growing population [2], and the consequent increases in living standards, agricultural and industrial developments, as well as tourism [3]. Currently, approximately 20% and 53% of the Mediterranean population live under permanent and summer-related water stress, respectively [4]. It is anticipated that this condition will further be intensified by climate change, user conflicts, rapid urbanization, industrialization, and the unmanaged development of tourism. In particular, sustainable water management remains a great challenge in the scattered environment of the Mediterranean islands. Islands nearby the coast could be connected to the water supply system of the mainland, while small or remote islands generally depend on desalination units, boats, or rainwater harvesting for their water supply. Furthermore, they could host small aquifers that rely on precipitation as a sole recharge of groundwater. Irregular precipitation regimes, coupled with a relatively small surface area, as well as a high risk of seawater intrusion, stipulate a shift towards innovative and resilient water management (e.g., managed aquifer recharge, rainwater harvesting, reuse of treated municipal wastewater or brackish water, and a reduction in losses from distribution systems).
Over the last decades, managed aquifer recharge (MAR) methods have emerged as a promising new strategy for groundwater replenishment. MAR is an umbrella term that refers to a suite of recharge methods that maintain, enhance, or secure groundwater systems under stress [5]. These methods focus on collecting excess water (e.g., stormwater, flood water, purified urban wastewater, and desalinated water) and recharging intentionally into aquifers for subsequent recovery or for improving the groundwater quality [6]. Some benefits of MAR systems over surface reservoirs include lower capital costs, an avoidance of evaporation losses, subsurface treatment benefits, scalability, and proximity to areas where it is needed [7]. Globally, the highest MAR capacity was achieved by India, Australia, and the USA. In Europe, Germany, France, and the Netherlands have the highest number of active sites [8]. In the Mediterranean region, the number of active sites is relatively marginal in comparison with the EU or global standard, with the exception of several dozen sites located in Spain, Italy, Israel, and Tunisia [9].
Over the last decades, significant progress has been achieved in understanding the geological, hydrogeological, and infrastructure-related considerations to make MAR more effective (e.g., [5,10,11,12,13]); however, critical evaluations of the most appropriate, site-specific designs and implementations are limited. To assess the merits and viability (i.e., feasibility) of a MAR project, a cost–benefit analysis is commonly used [14]. A cost–benefit analysis assesses the economic feasibility of a project by comparing all the relevant costs (e.g., direct and indirect, or private and public) and benefits of a project, and the validation for the investment is given when the total economic value of the benefits exceeds the project costs [15]. For MAR projects, the benefits to water resources management need to be considered. MAR solutions tend to be economically feasible when the recharged water is applied for high-value use (e.g., the drinking water supply), particularly in areas with significant climatological and hydrological challenges (e.g., scattered island communities, arid to semiarid climates, or a limited recharge area) and/or when alternative solutions are either technically unsuitable or more cost-intensive [16,17].
Croatia has abundant groundwater resources, but the coastal aquifers are suffering increasing pressure as for similar resources in the Mediterranean region. This pressure is enhanced by the concomitant sudden increase in tourist arrivals and prolonged droughts during the summer months, as well as the precipitation decrease and the increasing frequency and intensity of storms during winter months. Furthermore, most of Croatia’s coastal and island aquifers are karst aquifers [18], with a heterogeneous permeability field fostered by large conduits being a preferential path for seawater infiltration. In such aquifers, the underground mixing of seawater and groundwater forms wide transition zones and wedges. Among the 718 islands and islets in the Croatian part of the Adriatic Sea, some have favorable hydrogeological conditions, where karst aquifers are protected from seawater intrusions by geological or structural barriers (e.g., Vis, and Rab), enabling an autonomous water supply [19]. Additionally, some islands have freshwater lakes or brackish marshes. The inherent complexity of karst aquifers, coupled with the irregular precipitation regimes in the Mediterranean region, as well as the rapidly changing hydrodynamic conditions in karst aquifers, pose a significant challenge for the investigation, utilization, and management of their water resources.
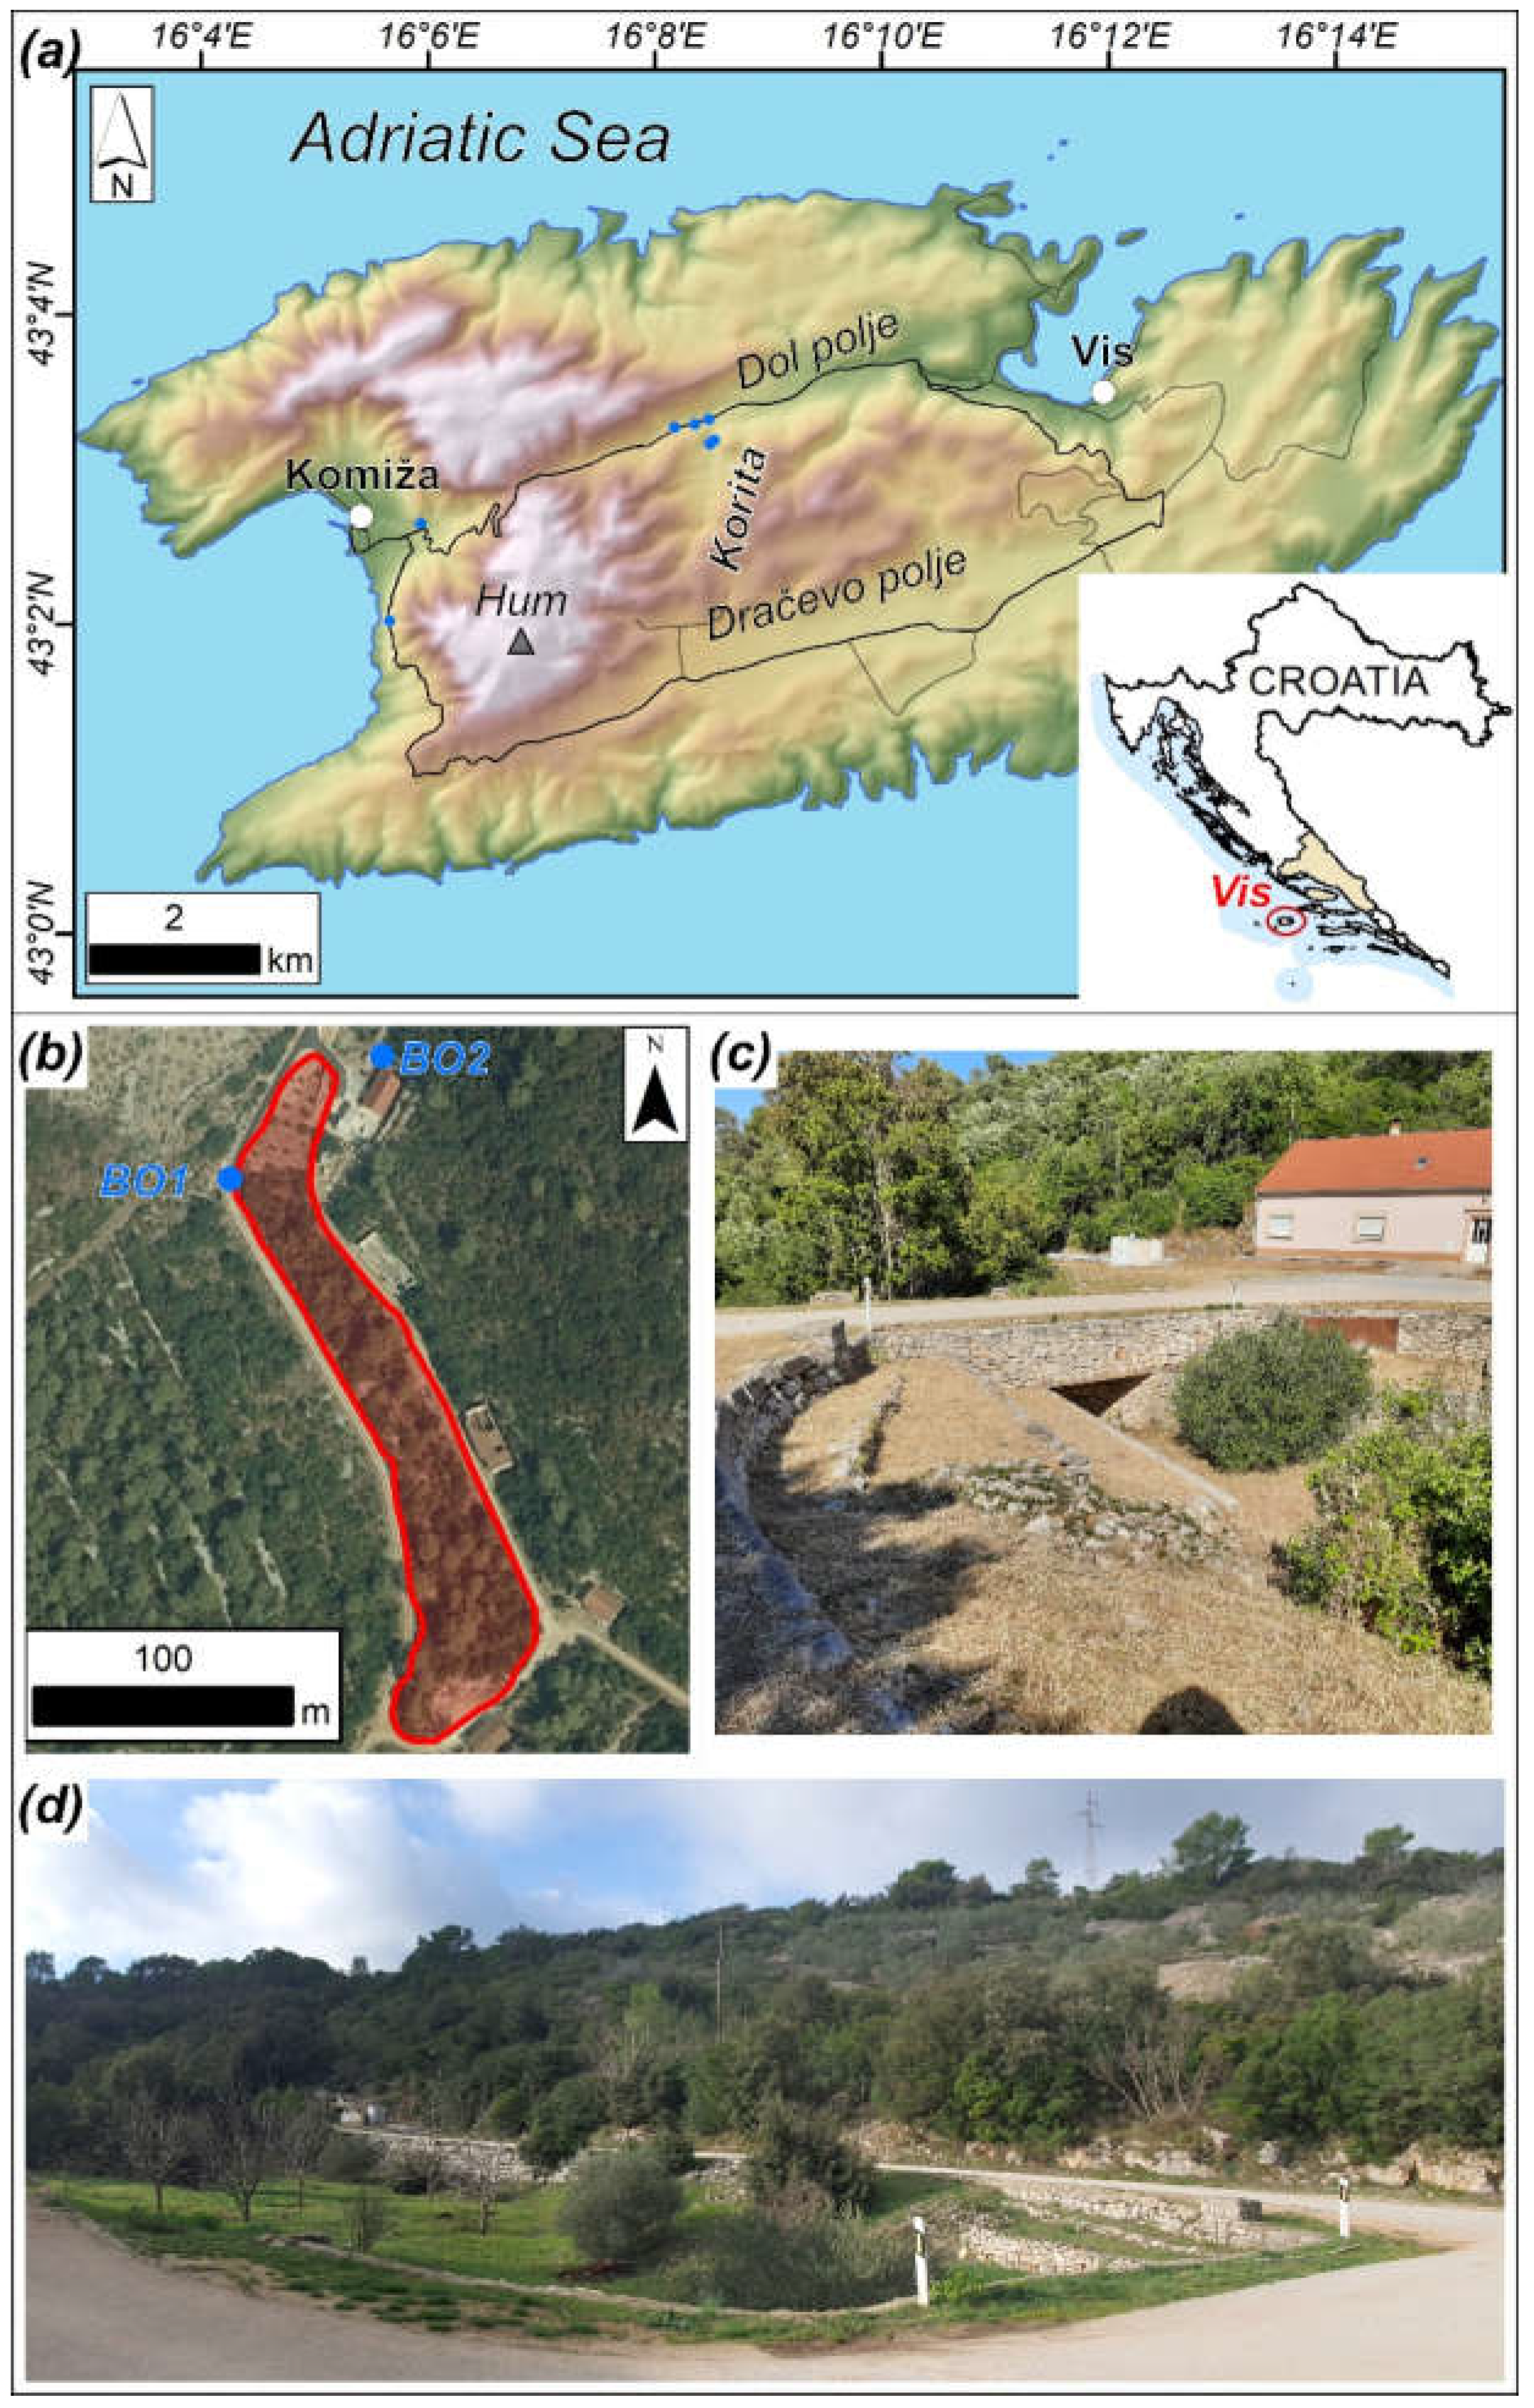
The aim of this study is to evaluate the costs and benefits of the deployment of MAR on the island of Vis in Croatia (
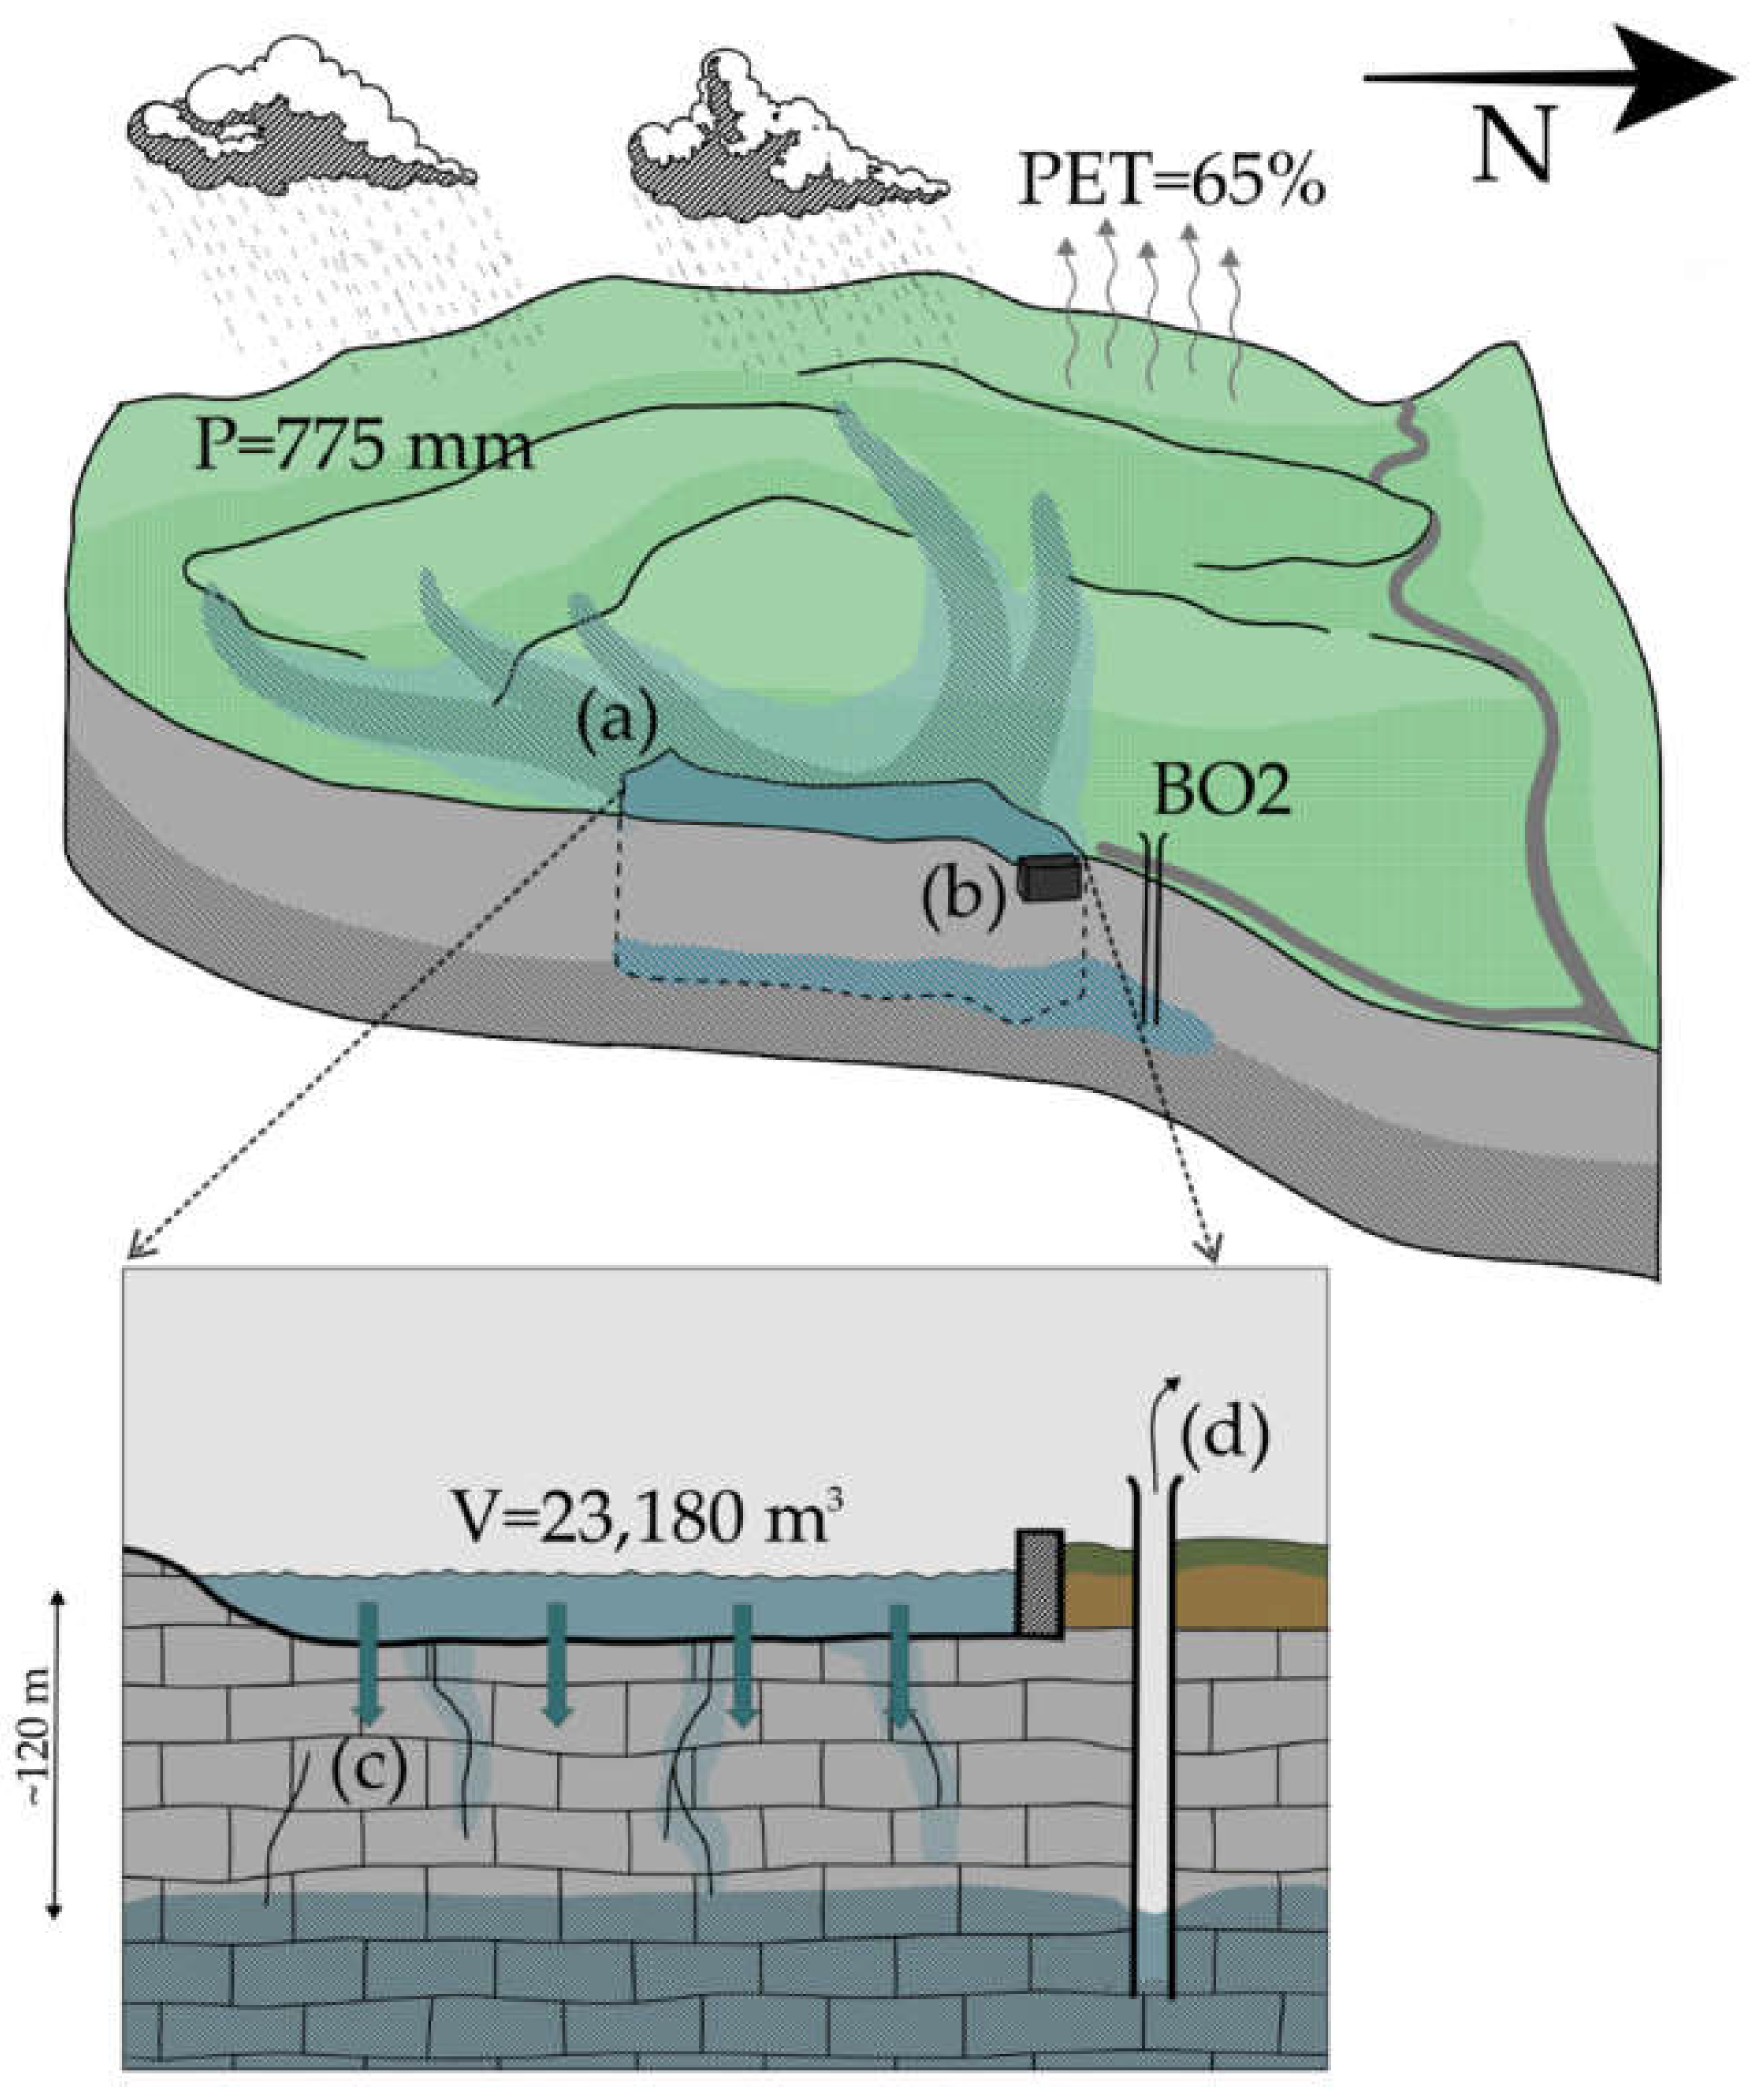
Figure 1a). In this case, the MAR concept is based on the recharge of the karst aquifer by the infiltration pond method, commonly used to recharge unconfined aquifers. The aim of MAR is to enhance and secure the quantitative status of groundwater resources in a karst aquifer, which endures high stresses during the dry summer season, and to foster further development of the island community by providing additional and much-needed freshwater resources.
In particular, the island of Vis was chosen due to its autonomy in terms of water supply, which is uncommon for most islands in the Adriatic and Mediterranean seas [18,19,20,21]. However, the karstic aquifer from which the groundwater is abstracted, as mentioned above, is under considerable stress during the dry summer season, and reductions for consumers have occurred on several occasions in the last decade. In addition, the demand for additional freshwater resources on the island of Vis is imposed by: (i) its remote position in the Adriatic Sea, (ii) a fivefold increase in population during the summer months, (iii) high variability in precipitation, (iv) climate change, and (v) an increase in local agricultural and industrial production [22,23,24]. Furthermore, alternative solutions to meet the increasing freshwater demand (e.g., desalination plant, rainwater harvesting, and the construction of a submarine water supply pipeline) are not adequate considering the cost–benefit and long-term sustainability issues.
Firstly, an overview of the geographical and socio-economic aspects of the study area is given. Then, the geological, hydrogeological, and climate settings are described, as well as the conceptual model of the proposed MAR solution. A historical analysis of the water demand and future utilization scenarios are provided, supporting the cost–benefit analysis of the MAR solution on the island of Vis.

2. Study Area

2.1. Territorial, Demographic, and Economic Aspects

The island of Vis is located in southern Croatia, in Split-Dalmatia County. Figure 1 shows the geographical position of the island as well as the position of the proposed MAR site within the main water supply site on the island—the Korita well field.
The island of Vis is located 43 km from the mainland and has a surface area of 89.7 km2, being the ninth largest island in the Adriatic Sea [25]. There are two towns on the island: the town of Vis in the northeast and the town of Komiža in the western part of the island. Other smaller settlements are situated in the island’s interior.
In the last population census of 2021, the island of Vis had 3312 inhabitants [26]. Due to the age structure of the population, the island of Vis has negative demographic statistics with negative birth rates.
The economy of Vis is primarily based on tourism and agriculture. The island is a well-known destination in terms of summer tourism. In the period from 2010 to 2019, it experienced an increase of approximately 90% in tourist arrivals (Figure 2) [27]. Presently, the annual number of tourist arrivals is approximately 50,000 and it is expected to increase. Tourism on the island of Vis is extremely seasonal, with the high season spanning from June to September. Private accommodation in households, accounting for more than 80% of all tourist capacities, is in most cases not suitable for off-season stay. With only 11% of the total island’s accommodation capacity, both hotels on the island are closed in the off-season.

2.2. Geology, Hydrogeology, and Climate

The complex relief on the island of Vis is the result of interrelated geological, tectonic, paleo-geomorphological, paleo-climatological, and anthropogenic processes. The relief consists of three hilly chains, with two valleys of an E–W orientation between them. The highest peak is Hum (587 m a.s.l.). The Korita well field is located in the Korita valley, a dextral valley along the Dol polje (Figure 1a).
The main hydrostratigraphic units on the island of Vis are (i) Cretaceous limestones and dolomites, which host a karst aquifer with heterogeneous transmissivity depending on the variable karstification degree of the different carbonate rocks, (ii) the volcanic–sedimentary–evaporite complex of Komiža bay, composed of various lithological units that collectively function as a hydrogeological barrier, and (iii) quaternary deposits, represented mostly by discontinuous terra rossa cover in karst poljes that decrease infiltration and locally act as a hydrogeological barrier [18,28,29,30].
Favorable geological and hydrogeological conditions enabled the formation of high-quality karst aquifers from which the groundwater is abstracted. The water supply system is comprised of five drilled wells in the Korita well field, wells K1 and B1 near Komiža, and the Pizdica spring. The maximum pumping capacity at Korita is approximately 42 L/s from all wells, and the groundwater quality is excellent since the aquifer is protected from seawater intrusions by various hydrogeological barriers [18]. The wells K1 and B1 and the Pizdica spring in the western part of the island provide a total of approximately 5 L/s, and here the water quality is variable and mostly depends on the seasonal hydrological conditions [21]. In the last several years, the annual quantity of the abstracted groundwater has ranged from 300,000 to 450,000 m3, depending on the summer tourism demand, and there are 4150 registered water users on the island. The sole recharge of the island’s aquifer is the local precipitation, and most of the natural recharge occurs from October to March. Based on the analogous karst regions and climate types, the average annual recharge equals approximately 40% of the annual precipitation. The main potential source of groundwater quality deterioration is seawater intrusion.
The climate of Vis is classified as a Mediterranean climate with dry and hot summers (Csa) [31,32]. Due to the island’s position in the open sea, there is a strong maritime influence reflected in the mitigation of climate extremes [33,34]. In the period from 1991 to 2019, the mean annual air temperature at the Komiža meteorological station was 17.1 °C, and the mean annual precipitation was 775 mm (with a minimum 487 mm and maximum 1269 mm; Figure 3). Within the analyzed period, the annual seasonality index after Walsh and Lawler [35] ranged from 0.65 to 0.93, reflecting mostly seasonal regimes of precipitation with periodical drier periods. The majority of precipitation occurs during the colder parts of the year (i.e., October–March). There are no permanent surface water bodies on the island, and significant surface runoff occurs only after storms or long rainy periods. A slightly increasing trend in the mean annual air temperature (Figure 3) is consistent with the recorded global trend, as well as regional trends in the Mediterranean and Adriatic regions [36,37,38,39]. According to the available data, the average annual potential evapotranspiration (PET) is 0.65, ranging from 0.8 during the summer to 0.3 during the winter [18,33,34].

2.3. Conceptual Model of the Proposed MAR Site

The conceptual model for MAR on the island of Vis is based on recharge by the infiltration pond method. It is a surface spreading method: water is directly flooded or stored within a confining structure and then slowly infiltrated into the aquifer through a permeable subsurface, mimicking natural infiltration [40]. If the soil or bedrock has low permeability, ditches, infiltration galleries, or wells are commonly used to bypass the low permeability zone. Furthermore, surface spreading methods are commonly used to recharge unconfined aquifers. The target for the artificial recharge is the unconfined karst aquifer in the Korita water supply site, which meets the geological and hydrogeological prerequisites for the application of MAR [18,21]. The conceptual model of the infiltration pond at the Korita well field (Figure 4) is based on (i) the revitalization and enclosure of the abandoned channel and pond system used for the discharge of stormwater towards the sea (Figure 1c,d), (ii) the construction of a spill dam to enable the accumulation of water, (iii) the removal of topsoil to enhance the natural infiltration, and eventually, (iv) the construction of an infiltration ditch or gallery that serves as a sink in order to control the infiltration and water quality issues (e.g., turbidity). The size of the proposed infiltration pond is 9272 m2, and its average depth is 2.5 m, providing a total pond capacity of approximately 23,180 m3 (Figure 4).
Based on the available climatological and hydrological studies, the infiltration pond would be filled with variable dynamics during different periods of the year. The highest rainfall on the island is expected in the winter, early spring, and late autumn months, and most of the source water for MAR would be secured during these periods. Given the depth of the groundwater table (approximately 120 m) and the favorable hydrogeological properties of the karst aquifer in the Korita well field (i.e., its sufficient storage capacity and matrix-dominated flow; [18,21]), the conceptual model envisions that the water recharged during the wet period would have a positive long-term effect on the local groundwater level and assist with peaks in demand during summer.

3. Materials and Methods

3.1. Analysis of Water Supply and Demand

Analyses of the water demand on the island of Vis were performed based on the data provided by the local water supply company—“Vodovod i odvodnja otoka Visa” (Water supply and drainage of the island of Vis). The analyzed period spanned from 2014 to 2020. Furthermore, the projection of the future water demand was made under the assumption of further development of tourism on the island that can be reasonably expected given the strategic development plans of the town of Vis and the town of Komiža, and the actual growing attractiveness of the island as a tourist destination. Table 1 shows the assumptions used in the projection of the future water demand.

3.2. Cost–Benefit Analysis

Cost–benefit analysis (CBA in further text) is a systematic method that assesses the economic feasibility, profitability, and sustainability of a project by comparing all the benefits and costs [42], and can be expressed as:
t = 1 T = B t C t 1 + r t
where t is time, T is the time horizon, Bt is the expected stream of benefits, Ct is the expected stream of costs, and r is the discount rate. The criterion for the approval of the construction of the MAR system is that the total economic value of benefits should exceed the total costs.
In particular, the CBA employed in this paper encompasses the (i) financial (i.e., cost) analysis, and the (ii) economic (i.e., benefit) analysis. The main methodological approach for the financial analysis is based on the methodology proposed by the EU [43,44]. Additionally, the economic analysis was attributed by the experiences and data from specific MAR projects (e.g., [17,44,45,46,47,48]).

3.2.1. Financial Analysis

The financial analysis aims to verify the project’s financial viability from the position of the investor. The main outputs of the financial analysis are the financial net present value (FNPV) and the financial internal rate of return (FRR). The FNPV shows the present value of the difference between the costs and benefits of the project (net cash flow) and determines whether the revenues can cover the investment and operational costs. A positive FNPV shows that the project is profitable and should, therefore, be accepted on a financial basis, while a negative FNPV indicates that the project entails a loss and should be rejected. The FRR shows the discount rate at which the difference between the costs and benefits (net cash flow) has a net present value of zero. If the FRR is higher than the financial discount rate, the project brings a profit.
The following assumptions have been used in the financial analysis:
  • Prices (e.g. construction works, investigations, materials, and labor hours) available on the Croatian market from 2020 were used to ensure the comparability of the costs and benefits, converted to EUR according to the fixed conversion rate from 2022;
  • A 30-year reference period was applied, following the most common methodologies for MAR projects [17,47,48];
  • A 4% financial discount rate was applied [43];
  • The MAR project will generate direct revenues in the form of the additional water distributed and billed to the consumers on the island of Vis.
The main investment and capital costs associated with the construction of the infiltration pond include (i) the costs of detailed site investigations (e.g., geological, hydrogeological, geophysical, and geodetic investigations), (ii) the cost of project documentation and associated studies (e.g., permits and environmental impact assessments), (iii) construction costs (e.g., excavation and removal of topsoil and shrubbery from the existing pond structure, construction of a dam, construction of the infiltration gallery, and sealing off the sides and the bottom of the pond), (iv) the costs of mandatory water quality tests, and (v) the supervision costs. The main operating and maintenance costs include (i) the operating cost of groundwater use, (ii) labor costs, (iii) electricity costs, (iv) the analysis of water quality, (v) infrastructure maintenance costs (including periodical cleaning of structures and equipment), and (vi) the costs of water treatment (i.e., chlorination).
The direct revenues of the project were estimated based on the current price of water paid by the users on the island of Vis. In the revenue projection, it was assumed that the water price for the final consumers on the island of Vis would remain unchanged throughout the reference period.

3.2.2. Economic Analysis

The economic analysis of the project assesses the project’s contribution to overall well-being and is performed from the point of view of society; hence, an economically justified project creates the goods and services that society needs, contributes to productivity and economic growth, and creates sustainable jobs. The main outputs of the economic analysis are the economic net present value (ENPV), the economic internal rate of return (ERR), and the benefit/cost ratio indicator (B/C).
Additionally, non-market effects were also considered in the economic analysis. MAR projects are commonly associated with (i) improved access to drinking water in terms of availability, reliability, and quality of service, (ii) groundwater ecosystem conversion, (iii) additional quantity of drinking water during periods of scarcity (e.g., dry and summer seasons), and (iv) increased attractiveness of an island as a tourist destination and additional accommodation capacities. Non-market effects were quantified by the willingness-to-pay (WTP) method. The WTP method was conducted through an online survey from 11 August 2021 to 31 August 2021. The online survey was distributed through several local Facebook groups and profiles, as well as mailing lists with various local stakeholders. During the given period, 157 completed surveys were received, representing 5.2% of all the adult inhabitants of Vis island, i.e., 11% of all households on the island (assuming that one completed survey represented one household). Based on the WTP method, the total annual average premium was obtained and applied in the economic analysis.

4. Results and Discussion

4.1. Analysis of Water Supply and Demand

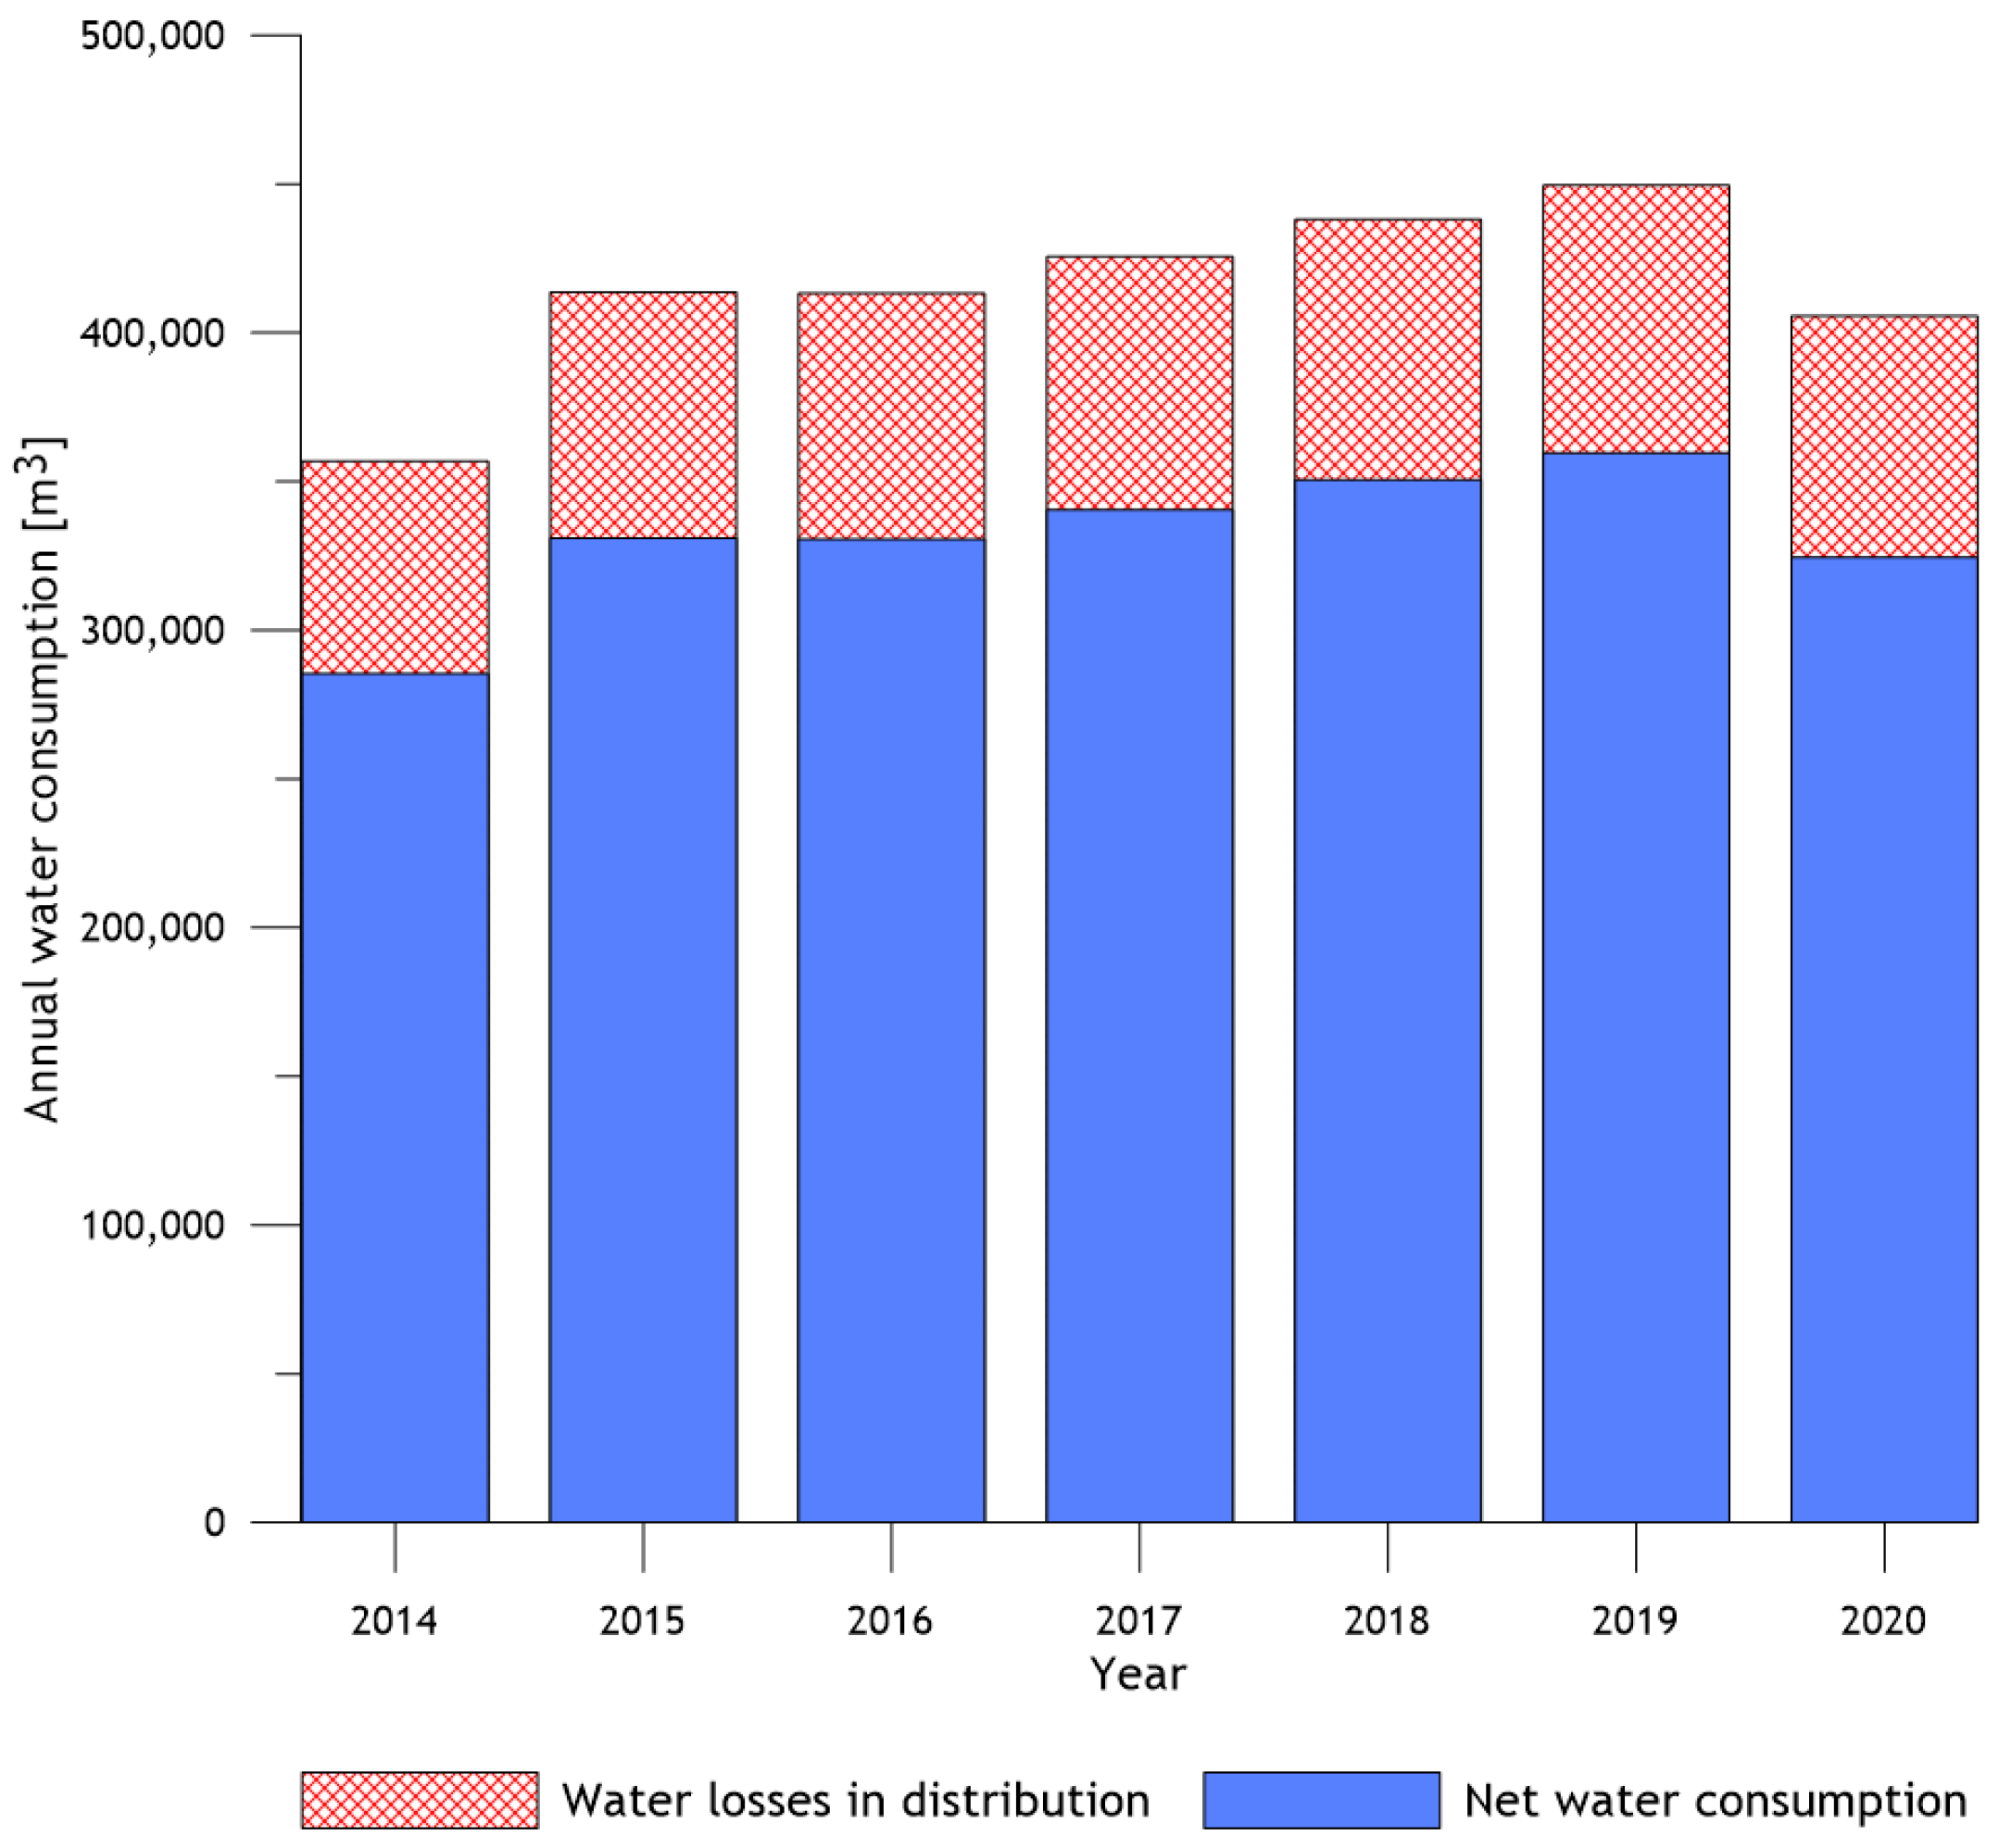
Figure 5 shows the annual water consumption in the period from 2014 to 2020. Losses in the water distribution system amounted to approximately 25%.
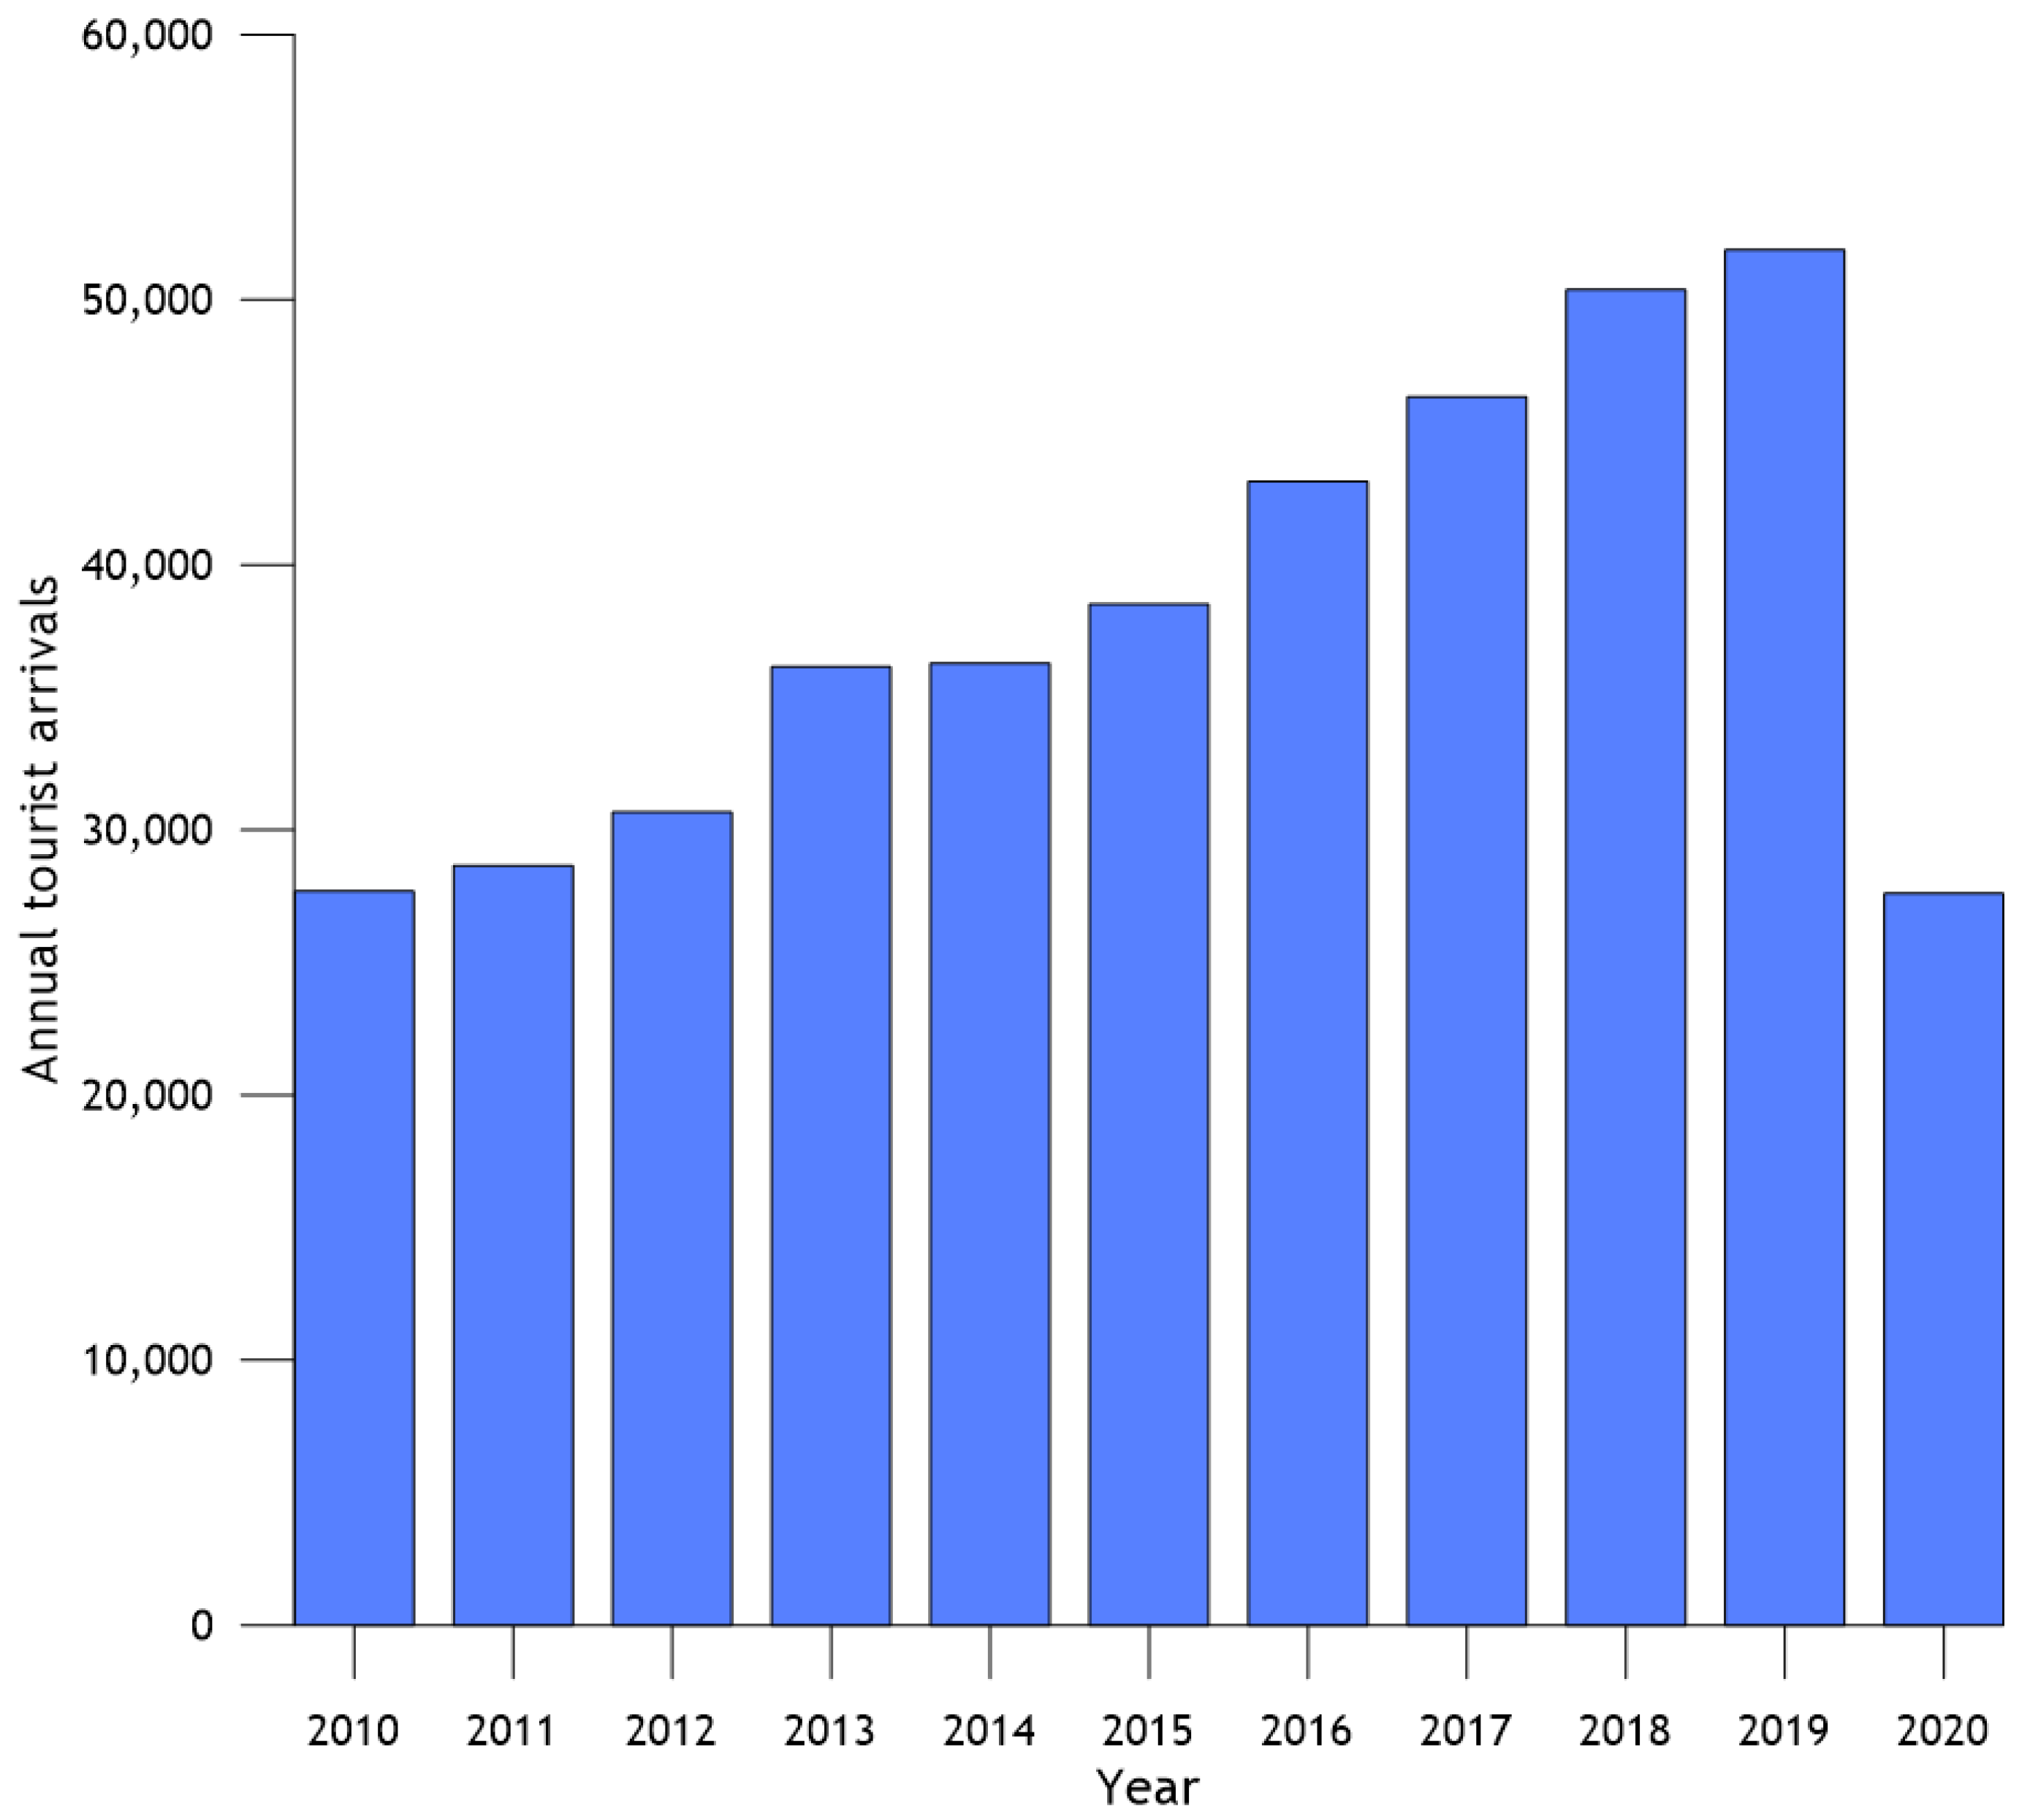
Water consumption on the island of Vis is slightly increasing, and the most significant influence on the increasing trends can be attributed to the increase in tourist arrivals and overnight stays on the island (Figure 2). The highest water consumers are households (~255,000 m3/a), followed by tourism and agriculture (~90,000 m3/a) and public institutions (~6700 m3/a). Water consumption among the local population did not change significantly over the years, which could be attributed to the awareness of the inhabitants about the need for continuous water saving.
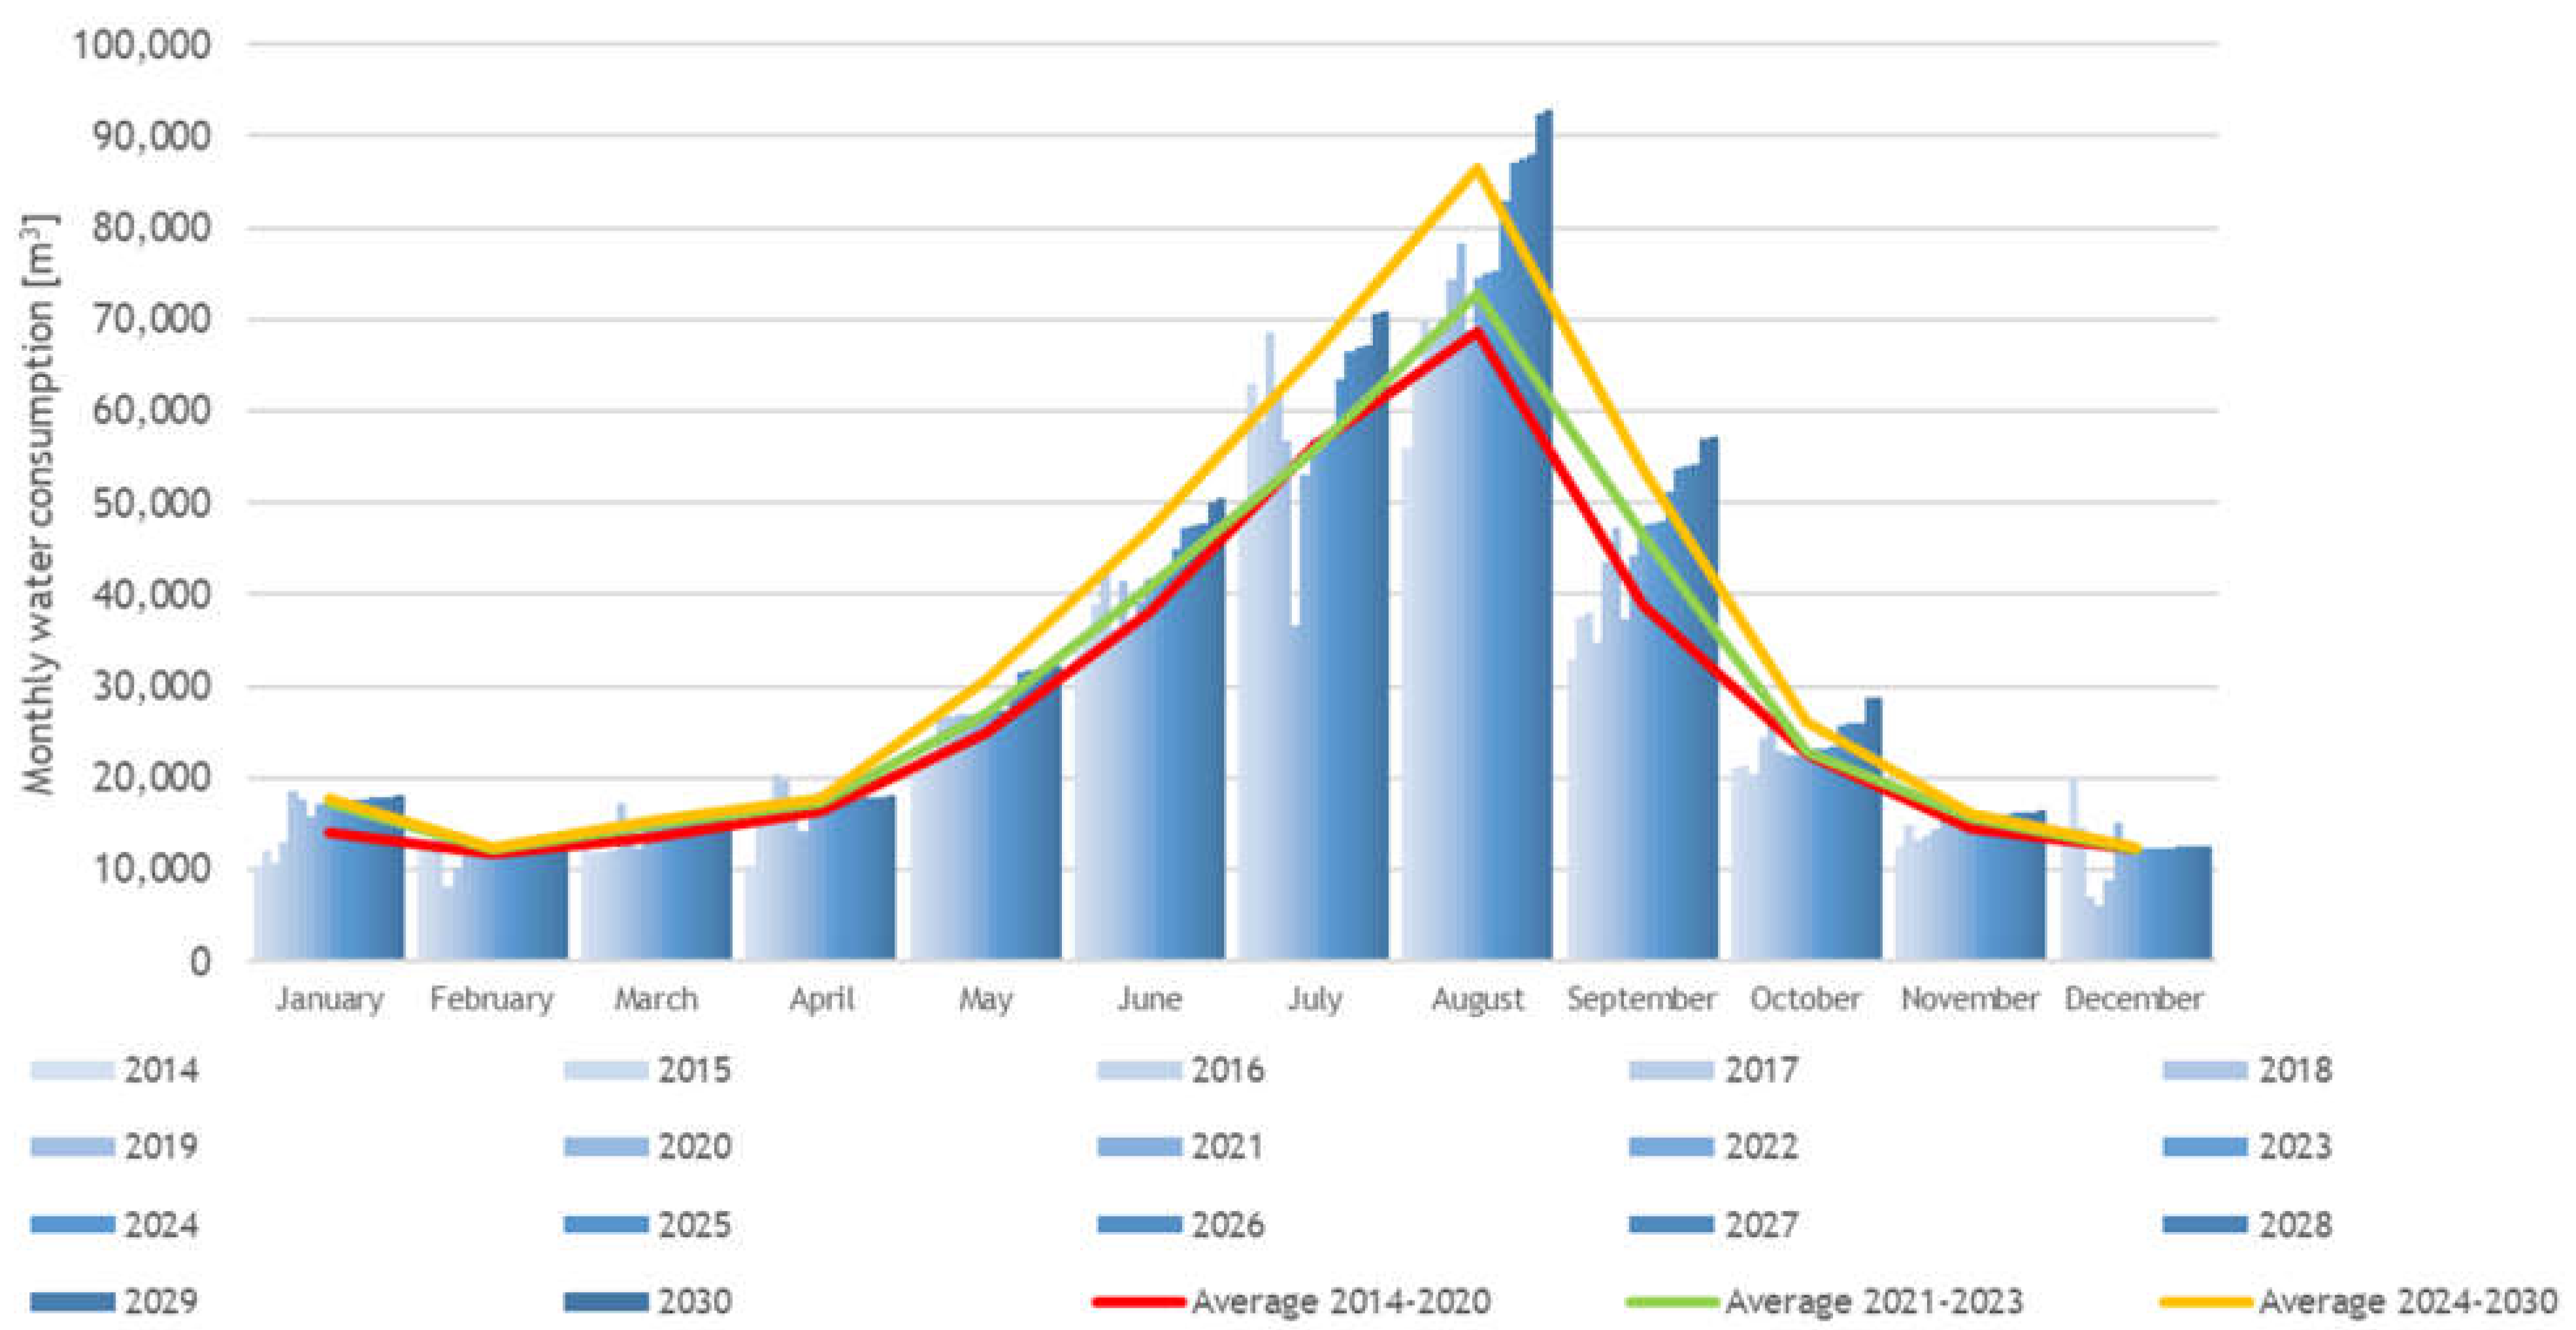
A distinct increase in water consumption during the summer months is evident in Figure 6. In August, the water consumption was the highest, and this represents approximately a six-fold increase compared to the winter months, which commonly had the lowest water consumption. The year 2020 was a non-specific year in terms of water consumption; however, in August, the water consumption was very high compared to the remaining summer season due to the arrival of many domestic guests. The water consumption data in 2020 shows the significance of tourism in terms of water consumption on the island. By applying the assumption from Table 1, the future demand was projected until 2030 (Figure 6).
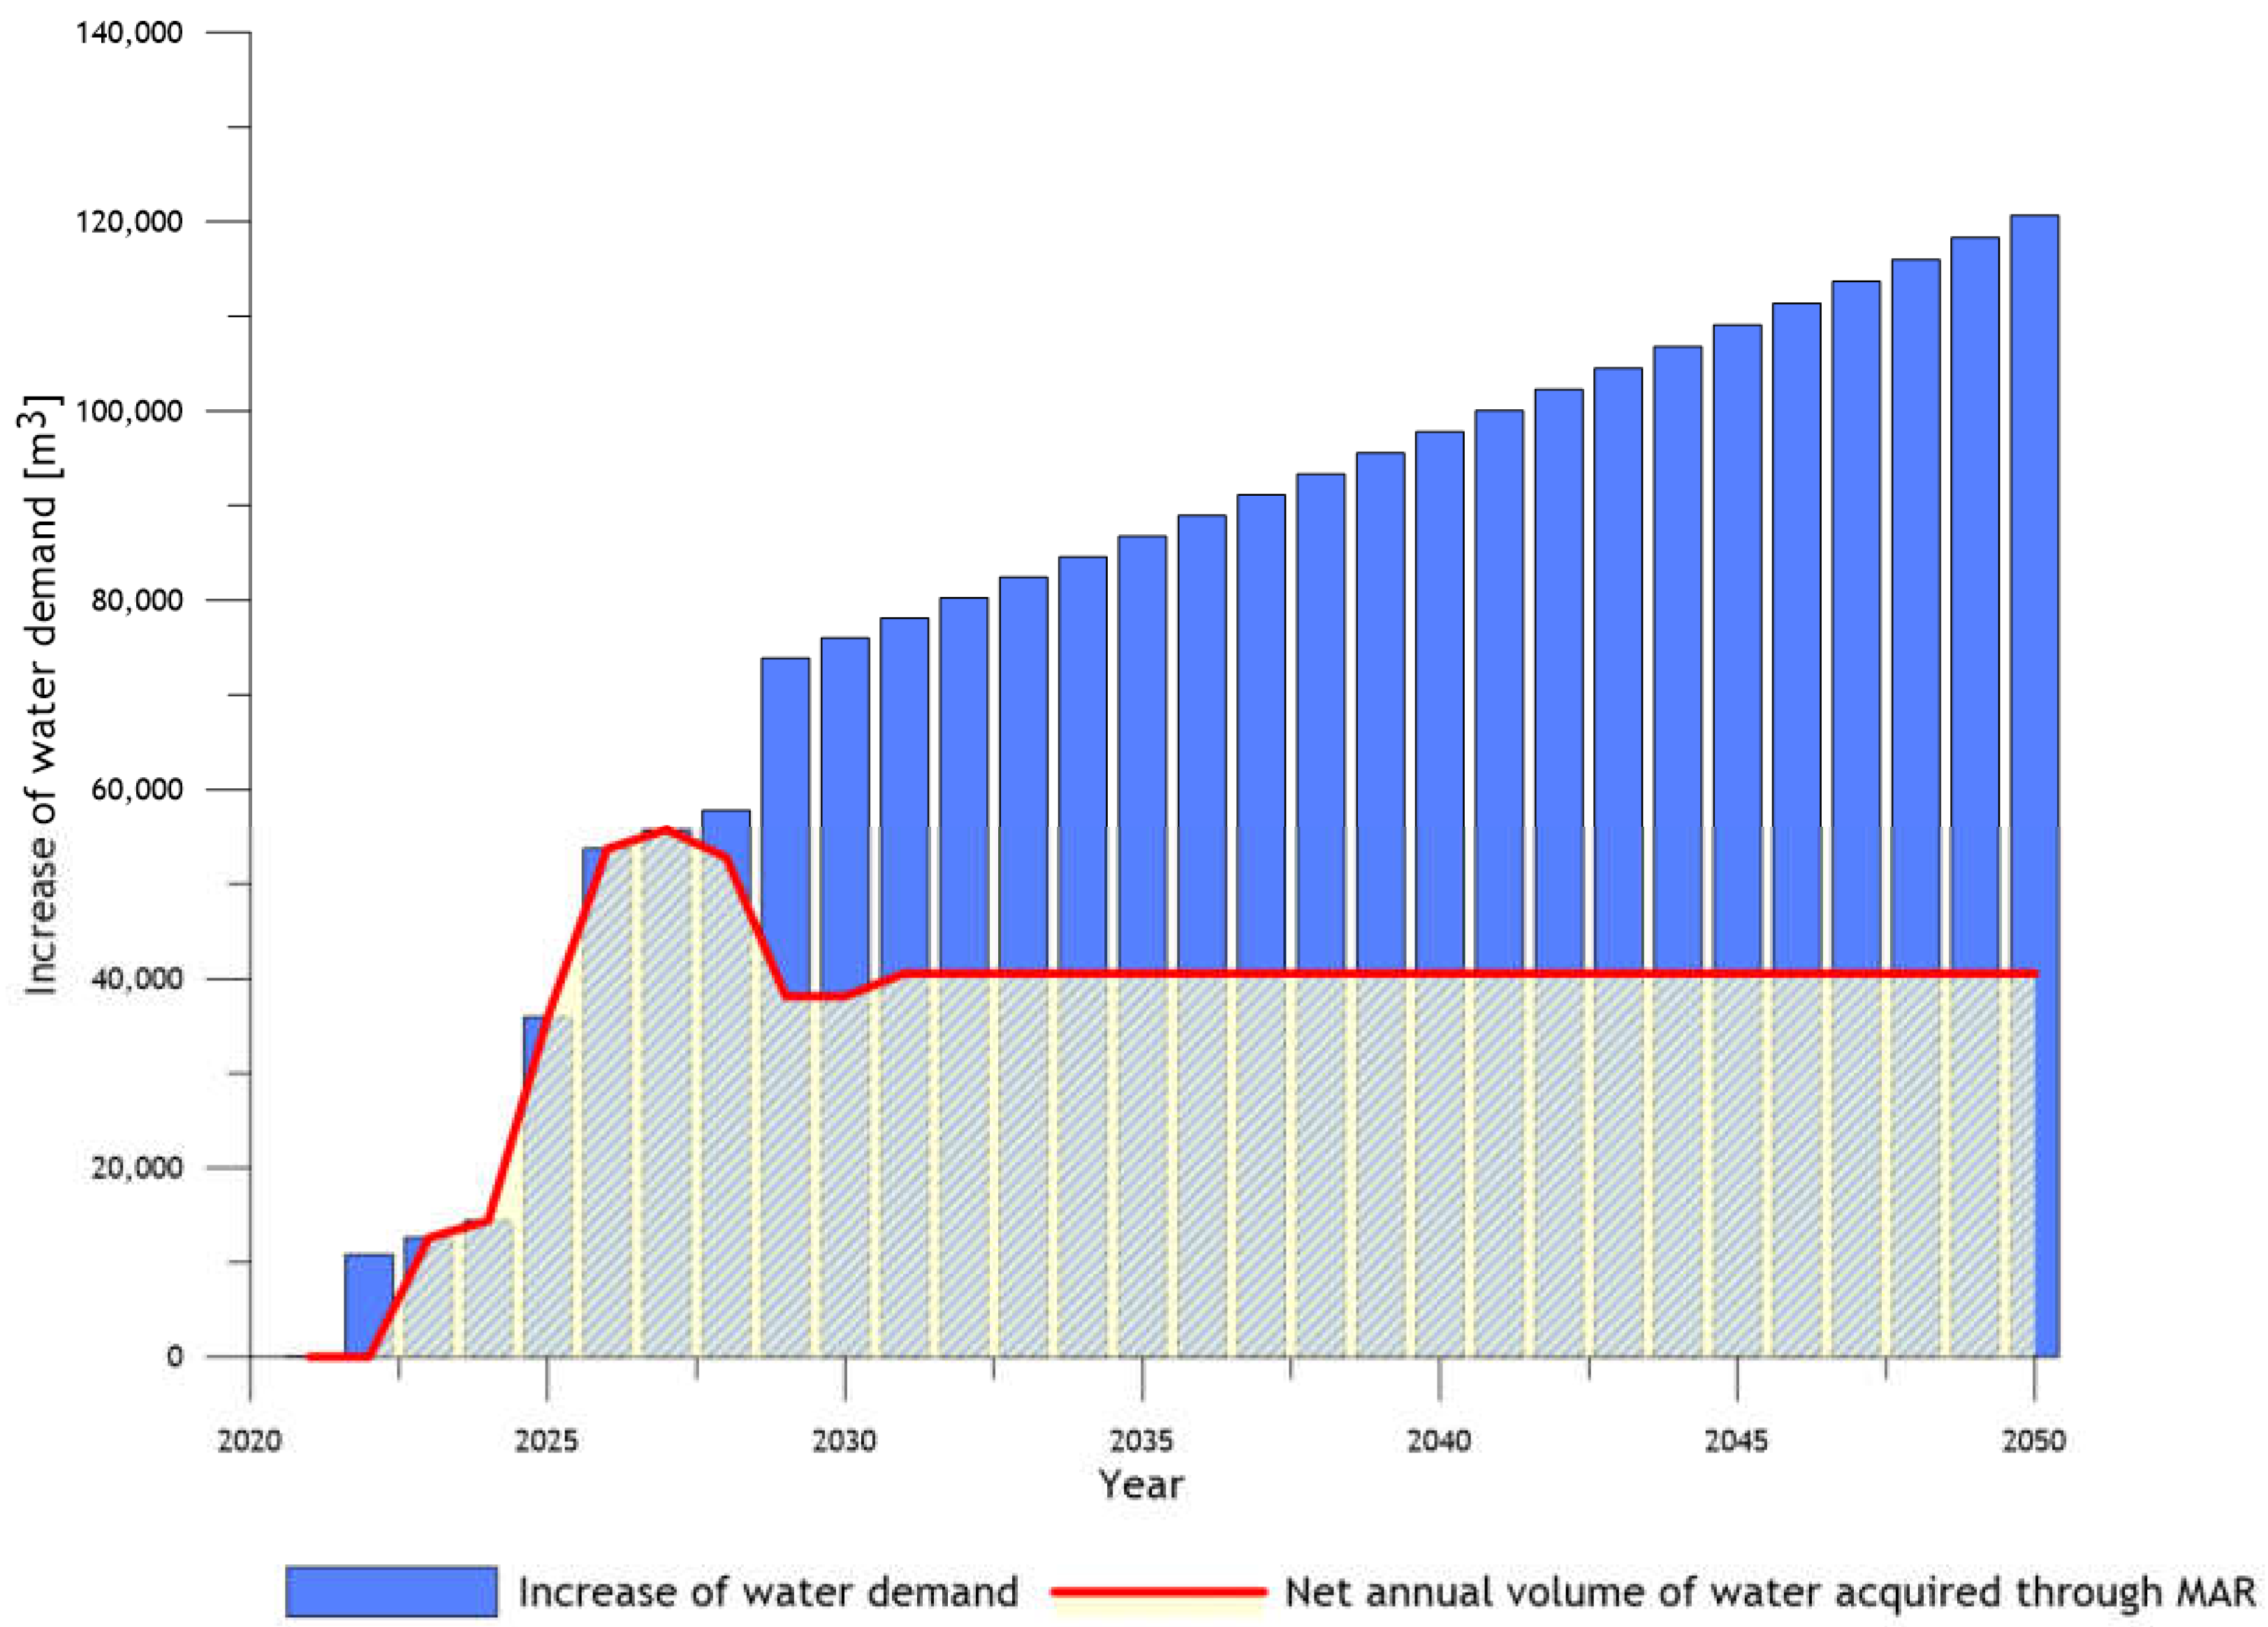
Figure 7 shows the long-term comparison of the water acquired through MAR and the projection of water demand in the period from 2021 to 2050. It was considered that the MAR solution in Vis could provide a baseline of 3.5 recharges of the infiltration pond per year, corresponding to a gross quantity of water acquired through MAR of 81,130 m3. Evapotranspiration and losses in the water supply system could reduce the net amount of water acquired through MAR. Considering that most of the recharge would occur during the colder parts of the year (October–March) and that the infiltration pond would be devoid of trees and plants (i.e., the transpiration component of evapotranspiration could be neglected), an evaporation coefficient of 0.35 was applied. Loss from the water supply system amounted to 25%, with an assumed reduction to 15% after 2030. Therefore, the net annual volume of water acquired through MAR was obtained by subtracting the evaporation and water supply losses from the gross quantity, resulting in a net volume of 40,565.00 m3, representing the baseline scenario.
At the beginning of the projection (i.e., in 2021), the entire additional water demand could be covered by the MAR. Additionally, the recharged quantity surpassed the increase in water demand in the first years of the project, hence, the cumulative annual (“unspent” water) would remain in the aquifer for subsequent recovery in the upcoming years. Afterward, approximately half to one-third of the demand could be covered in the mid-term and long-term, respectively (Figure 7).
It is an essential fact that the further development of the island of Vis depends on the ability and success of providing additional quantities of drinking water. The available quantities meet the current demand, despite the risks, periodical reductions, and difficulties during summer. Without providing additional water quantities, further development of the island could be significantly hindered. Furthermore, the strategic development plans of the towns of Vis and Komiža include several activities and projects that are directly linked to the additional demand for water on the island (e.g., expansion and construction of additional hotel accommodations).

4.2. Cost–Benefit Analysis

Financial and economic calculations in this paper were performed considering the baseline of 3.5 recharges per year of the infiltration pond; however, to obtain more realistic insight into the feasibility and sustainability of the MAR project, several scenarios (from 1 to 10 infiltration pond recharges annually) reflecting the expected hydrological scenarios were taken into account.
The total investment cost for the deployment of the infiltration pond method on the island of Vis is approximately EUR 417,128 (Table S1 of the Supplementary Material). The material investments (e.g., site preparation, construction works, and the installation of associated engineering equipment) represent 49.28% of the total investment, while non-material investments (e.g., preparation of the project and permits, project management, labor costs, supervision and audit, and promotion and visibility) represent 50.72%. Deployment of the MAR facility will generate direct financial revenue in the form of the charged price of the additional quantity of water distributed to the final consumers. Since the operation phase of the MAR facility is expected to start in the 3rd year of the project, revenues are not expected during the first two years of the project. The projection of the revenues is shown in Table 2.
Based on the estimated investment costs and revenues of the project, the annual cash flow and other financial indicators were calculated. The annual cash flow is negative in the first two years of the project, i.e., during the construction phase when there are no revenues. After the first two years and during the project lifespan, the financial viability of the project is verified by a positive cash flow. Furthermore, financial indicators evidenced the financial rationality of the project, i.e., the rationale of the project for the investor. The financial rate of return on investment was calculated based on estimated incremental costs and revenues. The MAR project was compared to the “business as usual” scenario, which represents a situation without such an investment. The calculation of the financial indicators was based on the estimated costs and revenues of the pilot project in the 30-year reference period, taking the financial discount rate of 4% into account. The results showed that, from a financial point of view, this investment would be profitable and would bring a minimum positive financial net present value (i.e., FNPV > 0) and a positive financial internal rate of return (i.e., FRR > 4%) (Table 3).
To identify the critical variables of the project, a sensitivity analysis was performed. Critical variables were considered those whose variations would significantly impact the project’s financial or economic performance. A variable was considered critical if a variation of ±1% of the value adopted in the baseline case would rise to a variation of more than 1% in the net present value. All three analyzed variables (i.e., the operating revenues, investment costs, and operating costs) are critical, with the assumption that all other variables would remain unchanged. The sensitivity analysis evidenced:
  • A 1% decrease in the operating revenues causes a decrease in the NPV of 7.71%;
  • A 1% increase in the investment costs causes a decrease in the NPV of 4.30%;
  • A 1% increase in the operating costs causes a decrease in the NPV of 2.47%.
These results point to the high risk of the project and the need for significant attention in its planning. The FNPV becomes negative (i.e., the project becomes financially irrational) with the following variation of each variable (with the other variables remaining unchanged):
  • The operating revenues are reduced by 13%;
  • The investment costs are increased by 24%;
  • The operating costs are increased by 41%.
The financial analysis of the project and the sensitivity analysis highlighted the operating revenues as the most sensitive variable. Furthermore, the risk of an insufficient source water (i.e., rainfall) is one of the most significant risks associated with the project and could directly impact the revenues of the project. Considering possible hydrological scenarios regarding the dynamics of the infiltration pond recharge and a loss of source water due to evaporation, the physical and financial impacts of the project under these scenarios are presented in Table 4 and Table 5.
Due to the small amount of recharged water through MAR, scenarios A and B would yield a negative NPV and fail to meet the financial requirements of the project. Larger amounts of recharged water are provided in scenarios 0, C, and D; therefore, positive financial results and coverage of an additional water demand are evidenced.
Furthermore, considering the potential loss of source water due to evaporation, several scenarios were performed to investigate its effect on the annual net amount of the source water in the infiltration pond, reflecting the MAR operation in different seasons (i.e., high evaporation in spring and summer, and low evaporation during winter and autumn). Following the available literature sources as well as the hydrological studies performed on the island of Vis, the base scenario assumed 35% of the annual evaporation loss as an average annual value. In Table 5, the project performance under the changing evaporation scenarios is shown.
Different hydrological scenarios and evaporation loss rates evidenced the high sensitivity of the project. Scenarios 0 and A, accounting for evaporation losses of 35% and 25%, respectively, yielded a positive NPV; therefore, the project is financially viable under these scenarios. The changing climate directly affects those variables and more detailed local-scale climatological and hydrological studies are necessary to mitigate the risks or to modify the conceptual design of the project (e.g., construction of additional accumulation structures), in order to avoid financially unfavorable scenarios that would endanger the project’s implementation.
Public infrastructure projects are often not intended to generate profits, but their fundamental objective is to create a wider scope of benefits for the target groups and beneficiaries. As the starting point of an economic analysis, cash flows from the financial analysis were considered. Furthermore, the transition from a financial to economic analysis required the following adjustments:
  • Fiscal corrections: taxes and subsidies are transfer payments that do not represent actual economic costs or benefits to society. The following fiscal corrections were made:
    • All prices were considered excluding indirect taxes (e.g., VAT as an indirect tax);
    • Input prices were considered excluding direct taxes (e.g., tax on income that is part of gross salaries);
    • All prices were considered without subsidies and other transfers provided by the public authority (e.g., grants and government incentives).
  • Conversion from market prices to economic prices. Here, specific conversion factors were applied to the market prices according to the EU CBA methodology, excluding direct taxes and compensations for market failures, in order to reflect their social value. The following specific conversion factors were applied:
    • A figure of 0.834 for labor costs, 0.917 for construction costs, 0.807 for non-material costs, 0.900 for operating costs, and 1.000 (no conversion) for materials and equipment.
  • A social discount rate of 5% was applied in the economic analysis [43]
Based on the above assumptions and the transformation of the financial categories to economic ones, the economic (social) indicators of the pilot project on the island of Vis were calculated. The economic analysis encompassed the direct social benefits and costs of the pilot project (i.e., the market benefits and costs from the financial analysis, which we have transformed into economic categories through adjustments) and its non-market benefits and costs. The non-market benefits and costs encompassed input obtained through the willingness-to-pay (WTP) method, as well as direct benefits for the tourism sector (i.e., improved attractiveness of the island as a tourist destination). The economic analysis of this pilot project evidenced that the socio-economic impacts of the project would significantly exceed its socio-economic costs; therefore, the economic indicators are very favorable (Table 6).
The economic net present value of the project at the economic discount rate of 5% is positive and amounts to EUR 801,354. The economic internal rate of return of the project is 22.59% and significantly exceeds the economic discount rate of 5%. The economic benefits of the project are higher than the economic costs, as evidenced by the B/C indicator of 2.83, indicating EUR 1 of the investment returns as EUR 2.83 of the economic benefits.
Furthermore, an economic sensitivity analysis was performed following the same methodology as the financial sensitivity analysis. The sensitivity analysis for various scenarios with changing variables is shown in Table 7.
The sensitivity analysis evidenced that the project is stable from a socio-economic point of view and is not very sensitive to small changes in the value of the tested variables.

5. Conclusions

Globally, MAR schemes play an important role in the sustainable management of water resources and represent an emerging technique to address water quantity and quality challenges. The underlying motives for the assessment of a MAR feasibility on the island of Vis are imposed by the increasing trends in water demand (an approximately 75,000 m3 increase of the water demand by 2030, corresponding to ~20% of the current annual pumping quantity), an erratic and changing climate (e.g., an increase in air temperature and a decrease in winter precipitation and natural recharge of the aquifer), and an increase in the arrival of tourists (doubling from 2010 to 2019), which will further be aggravated by the new hotel capacities from 2025 onward. The proposed MAR project on the island of Vis was assessed by using a CBA, a widely used tool for the assessment of water management projects. The conceptual model for MAR on the island of Vis is based on the artificial recharge by the infiltration pond method. The total investment cost for the deployment of the infiltration pond in the Korita well field is slightly over EUR 400,000 and is made up of relatively simple operations. The results of the CBA indicated that the infiltration pond method is justified in financial and economic terms. During the 30-year reference period, the project would entail a financial profit, evidenced by the positive financial net present value and internal rate of return. The most significant underlying problem of the project is its relatively high riskiness and high sensitivity to changes in the applied assumptions in the financial analysis. In particular, variations in the number of pond recharges per year and evaporation coefficient play a crucial role in the financial performance of the project; however, the rationale of the project is further supported by the positive economic indicators, encompassing the direct social benefits and non-market effects, as quantified through the willingness-to-pay (WTP) method. The economic benefits of the project significantly exceed its costs, as evidenced by the positive economic net present value and economic internal rate of return, as well as a high benefit/cost ratio of 2.83. Given the favorable financial and economic indicators of the project, it would be inadvisable to reject it on the basis of its high riskiness. To mitigate the uncertainty regarding the hydrological assumption on the number of recharges of the infiltration pond and the evapotranspiration coefficient, further hydrological studies are required, focusing on establishing a high-resolution precipitation monitoring network (ideally on the proposed MAR site in the Korita well field), as well as numerical hydrological and hydrogeological models.
This paper could provide an asset to water supply operators and hydrogeologists, as well as to policy and decision-makers, particularly in areas where a MAR is feasible and a suitable option for addressing issues of water quality or quantity. Currently, both the EU and Croatia struggle with certain gaps in management and legislation related to the operation of MAR facilities. The uncertain climatic future and the emerging problems in water management, however, urge the prompt reaction of key decision-makers to institutionally support the implementation of MAR projects, particularly in the context provided by the several directives and plans of national and international institutions.

Supplementary Materials

The following supporting information can be downloaded at: https://www.mdpi.com/article/10.3390/su15139934/s1, Table S1. The total investment cost for the deployment of the infiltration pond method.

Author Contributions

Conceptualization, M.P. (Matko Patekar) and M.S.; methodology, M.S., M.P. (Matko Patekar) and S.B.; software, M.S. and M.P. (Marco Pola); validation, Z.N., S.B. and J.T.; formal analysis, M.P. (Matko Patekar), M.S. and M.B.; investigation, M.S., M.P. (Matko Patekar) and M.P. (Marco Pola); resources, M.S., Z.N., J.T. and S.B.; data curation, M.P. (Matko Patekar) and M.S.; writing—original draft preparation, M.P. (Matko Patekar) and M.S.; writing—review and editing, M.P. (Marco Pola), Z.N., M.B., J.T. and S.B.; visualization, M.S. and M.P. (M. Pola); supervision, Z.N. and S.B.; project administration, M.P. (Matko Patekar), M.B., S.B. and J.T.; funding acquisition, S.B. and J.T. All authors have read and agreed to the published version of the manuscript.

Funding

This research was supported by the Interreg Central Europe project DEEPWATER-CE.

Institutional Review Board Statement

Not applicable.

Informed Consent Statement

Not applicable.

Data Availability Statement

Data from this paper is available directly from the authors on demand.

Acknowledgments

The authors would like to thank Marko Plenča and Boris Ivanišević (Vis water supply company) for providing the data on water consumption. Additionally, the authors thank Boris Bulović and Božidar Čapalija (Split water supply company) for providing valuable advice and guidance related to the construction costs of key infrastructure for this project.

Conflicts of Interest

The authors declare no conflict of interest.

References

  1. Ritchie, H.; Roser, M. Water Use and Stress. Available online: https://ourworldindata.org/water-use-stress (accessed on 25 October 2022).
  2. United Nations Environment Programme. Mediterranean 2017 Quality Status Report. Available online: https://www.medqsr.org/population-and-development (accessed on 30 September 2022).
  3. Cudennec, C.; Leduc, C.; Koutsoyiannis, D. Dryland hydrology in Mediterranean regions—A review. Hydrol. Sci. J. 2007, 52, 1077–1087. [Google Scholar] [CrossRef]
  4. European Environmental Agency. Use of Freshwater Resources in Europe. Available online: https://www.eea.europa.eu/ims/use-of-freshwater-resources-in-europe-1 (accessed on 12 September 2022).
  5. Dillon, P.; Stuyfzand, P.; Grishcek, T.; Lluria, M.; Pyne, R.D.G.; Jain, R.C.; Bear, J.; Schwarz, J.; Wang, W.; Fernandez, E.; et al. Sixty years of global progress in managed aquifer recharge. Hydrogeol. J. 2019, 27, 1–30. [Google Scholar] [CrossRef] [Green Version]
  6. Dillon, P.; Pavelic, P.; Page, D.; Beringen, H.; Ward, J. Managed Aquifer Recharge: An Introduction; National Water Commission: Canberra, Australia, 2009; ISBN 978-1-921107-71-9. [Google Scholar]
  7. Alley, W.; Dillon, P.; Zheng, Y. Basic Concepts of Managed Aquifer Recharge. In Managed Aquifer Recharge: Overview and Governance; Dillon, P., Zheng, Y., Alley, W., Vanderzalm, J., Eds.; International Association of Hydrogeologists: Reading, UK, 2022; ISBN 978-1-3999-2814-4. [Google Scholar]
  8. Sprenger, C.; Hartog, N.; Hernández, M.; Vilanova, E.; Grützmacher, G.; Scheibler, F.; Hannappel, S. Inventory of managed aquifer recharge sites in Europe: Historical development, current situation and perspectives. Hydrogeol. J. 2017, 25, 1909–1922. [Google Scholar] [CrossRef] [Green Version]
  9. International Groundwater Resources Assessment Centre. MAR Portal. Available online: https://ggis.un-igrac.org/view/marportal#/ (accessed on 1 October 2022).
  10. Daher, W.; Pistre, S.; Kneppers, A.; Bakalowicz, M.; Najem, W. Karst and artificial recharge: Theoretical and practical problems; a preliminary approach to artificial recharge assessment. J. Hydrol. 2011, 408, 189–202. [Google Scholar] [CrossRef]
  11. Galloway, D.L.; Alley, W.M.; Barlow, P.M.; Reilly, T.E.; Tucci, P. Evolving Issues and Practices in Managing Ground-Water Resources: Case Studies on the Role of Science. Available online: https://pubs.usgs.gov/circ/2003/circ1247/pdf/Circ1247.pdf (accessed on 13 August 2022).
  12. Dillon, P.; Fernández Escalante, E.; Megdal, S.B.; Massmann, G. Managed Aquifer Recharge for Water Resilience. Water 2020, 12, 1846. [Google Scholar] [CrossRef]
  13. Page, D.; Bekele, E.; Vanderzalm, J.; Sidhu, J. Managed aquifer recharge (MAR) in sustainable urban water management. Water 2018, 10, 239. [Google Scholar] [CrossRef] [Green Version]
  14. Maliva, R.G. Economics of Managed Aquifer Recharge. Water 2014, 6, 1257–1279. [Google Scholar] [CrossRef] [Green Version]
  15. Halytsia, O.; Vrachioli, M.; Janik, K.; Sitek, S.; Wojtal, G.; Imig, A.; Rein, A.; Sauer, J. Assessing Economic Feasibility of Managed Aquifer Recharge Schemes: Evidence from Cost-benefit Analysis in Poland. Water Resour. Manag. 2022, 36, 5241–5258. [Google Scholar] [CrossRef]
  16. Rupérez-Moreno, C.; Pérez-Sánchez, J.; Senent-Aparicio, J.; Flores-Asenjo, P.; Paz-Aparicio, C. Cost-Benefit Analysis of the Managed Aquifer Recharge System for Irrigation under Climate Change Conditions in Southern Spain. Water 2017, 9, 343. [Google Scholar] [CrossRef] [Green Version]
  17. Arshad, M.; Guillaume, J.H.A.; Ross, A. Assessing the Feasibility of Managed Aquifer Recharge for Irrigation under Uncertainty. Water 2014, 6, 2748–2769. [Google Scholar] [CrossRef] [Green Version]
  18. Terzić, J.; Frangen, T.; Borović, S.; Reberski, J.L.; Patekar, M. Hydrogeological Assessment and Modified Conceptual Model of a Dinaric Karst Island Aquifer. Water 2022, 14, 404. [Google Scholar] [CrossRef]
  19. Terzić, J.; Peh, Z.; Marković, T. Hydrochemical properties of transition zone between fresh groundwater and seawater in karst environment of the Adriatic islands, Croatia. Environ. Earth. Sci. 2010, 59, 1629–1642. [Google Scholar] [CrossRef]
  20. Borović, S.; Terzić, J.; Pola, M. Groundwater quality on the Adriatic karst island of Mljet (Croatia) and its implications on water supply. Geofluids 2019, 2019, 14. [Google Scholar] [CrossRef] [Green Version]
  21. Patekar, M.; Bašić, M.; Pola, M.; Kosović, I.; Terzić, J.; Lucca, A.; Mittempergher, S.; Berio, L.R.; Borović, S. Multidisciplinary investigations of a karst reservoir for managed aquifer recharge applications on the island of Vis (Croatia). Acque Sotter. Ital. J. Groundw. 2022, 11, 37–48. [Google Scholar] [CrossRef]
  22. Krklec, K.; Lozić, S.; Perica, D. Neke Značajke Klime Otoka Visa [Some Climate Features of the Island of Vis]. Naše More 2012, 59, 148–160. [Google Scholar]
  23. Krklec, K.; Lozić, S.; Šiljeg, A. Geomorfološke Značajke Otoka Visa [Geomorphological Features of the Vis Island]. Naše More 2012, 59, 290–300. [Google Scholar]
  24. Croatian Waters. Water Supply Plan of the Split-Dalmatia County. Available online: https://www.dalmacija.hr/Portals/0/docs/Skupstina/2011/24/12a.%20vodplanst.pdf (accessed on 8 May 2023).
  25. Duplančić Leder, T.; Ujević, T.; Čala, M. Coastline lengths and areas of islands in the Croatian part of Adriatic Sea determined from the topographic maps at the scale of 1:25,000. Geoadria 2004, 9, 5–32. [Google Scholar] [CrossRef] [Green Version]
  26. Croatian Bureau of Statistics. Population Census of 2021. Available online: https://podaci.dzs.hr/hr/podaci/stanovnistvo/popis-stanovnistva (accessed on 12 September 2022).
  27. Tourist Board of Split-Dalmatia County. Statistical Analyses of Tourism Activities. Available online: https://www.dalmatia.hr/hr/statistike (accessed on 15 September 2022).
  28. Terzić, J. Hidrogeološki odnosi na krškim otocima–primjer otoka Visa [Hydrogeological relations on kart islands–the island of Vis case study]. Min.-Geol.-Pet. Eng. Bull. 2004, 16, 47–58. [Google Scholar]
  29. Korbar, T.; Belak, M.; Fuček, L.; Husinec, A.; Oštrić, N.; Palenik, D.; Vlahović, I. Basic Geological Map of the Republic of Croatia 1:50. In Sheets Vis 3 and Biševo 1 with Part of the Sheet Vis 4 and Islands Sv Andrija, Brusnik, Jabuka and Palagruža; Croatian Geological Survey: Zagreb, Croatia, 2012. [Google Scholar]
  30. Korbar, T. Orogenic evolution of the External Dinarides in the NE Adriatic region: A model constrained by tectonostratigraphy of Upper Cretaceous to Paleogene carbonates. Earth Sci. Rev. 2009, 96, 296–312. [Google Scholar] [CrossRef]
  31. Filipčić, A. Klimatska regionalizacija Hrvatske po W. Köppenu za standardno razdoblje 1961–1990. u odnosu na razdoblje 1931–1960. [Climatic regionalization of Croatia according to W. Köppen for the standard period 1961–1990 in relation to the period 1931–1960]. Acta Geogr. Croat. 1998, 33, 7–14. [Google Scholar]
  32. Gajić-Čapka, M.; Zaninović, K. Climate of Croatia. In Climate Atlas of Croatia 1961–1990, 1971–2000; Zaninović, K., Gajić-Čapka, M., Perčec Tadić, M., Vučetić, M., Milković, J., Bajić, A., Cindrić, K., Cvitan, L., Katušin, Z., Kaučić, D., et al., Eds.; Meteorological and Hydrological Service of Croatia: Zagreb, Croatia, 2008. [Google Scholar]
  33. Bonacci, O.; Patekar, M.; Pola, M.; Roje-Bonacci, T. Analyses of climate variations at four meteorological stations on remote islands in the Croatian part of the Adriatic Sea. Atmosphere 2020, 11, 1044. [Google Scholar] [CrossRef]
  34. Bonacci, O.; Bonacci, D.; Patekar, M.; Pola, M. Increasing Trends in Air and Sea Surface Temperature in the Central Adriatic Sea (Croatia). J. Mar. Sci. Eng. 2021, 9, 358. [Google Scholar] [CrossRef]
  35. Walsh, R.P.D.; Lawler, D.M. Rainfall seasonality: Description, spatial patterns and change through time. Weather 1981, 36, 201–208. [Google Scholar] [CrossRef]
  36. Branković, Č.; Güttler, I.; Gajić-Čapka, M. Evaluating climate change at the Croatian Adriatic from observations and regional climate models’ simulations. Clim. Dyn. 2013, 41, 2353–2373. [Google Scholar] [CrossRef]
  37. Bonacci, O. Increase of mean annual surface air temperature in the Western Balkans during last 30 years. Vodoprivreda 2012, 44, 75–89. [Google Scholar]
  38. Touhami, I.; Chirino, E.; Andreu, J.M.; Sánchez, J.R.; Moutahir, H.; Bellot, J. Assessment of climate change impacts on soil water balance and aquifer recharge in a semiarid region in south east Spain. J. Hydrol. 2015, 527, 619–629. [Google Scholar] [CrossRef] [Green Version]
  39. Luterbacher, J.; Xoplaki, E.; Casty, C.; Wanner, H.; Pauling, A.; Küttel, M.; Brönnimann, S.; Fischer, E.; Fleitmann, D.; Gonzalez-Rouco, F.J.; et al. Mediterranean climate variability over the last centuries: A review. In Mediterranean; Developments in Earth and Environmental, Sciences; Lionello, P., Malanotte-Rizzoli, P., Boscolo, R., Eds.; Elsevier: Amsterdam, The Netherlands, 2006; Volume 4, pp. 27–148. [Google Scholar]
  40. DEMEAU—Demonstration of Promising Technologies to Address Emerging Pollutants in Water and Waste Water. Classification of Managed Aquifer Recharge Types. Available online: https://demeau-fp7.eu/toolbox/introduction/basic-concepts/classification-mar/infiltration-ponds.html (accessed on 10 July 2022).
  41. Development Strategy of the Town of Vis 2021–2027. Available online: https://www.gradvis.hr/wp-content/uploads/2021/02/RAZVOJNA-STRATEGIJA-GRADA-VISA-2021_2027-6.pdf (accessed on 10 November 2022).
  42. European Commission, Directorate-General for Regional and Urban Policy. Guide to Cost-Benefit Analysis of Investment Projects: Economic Appraisal Tool for Cohesion Policy 2014–2020; European Comission: Brusells, Belgium, 2015.
  43. European Commission, Directorate-General for Regional and Urban Policy. Economic Appraisal Vademecum 2021–2027; General Principles and Sector Applications; European Commission: Brussels, Belgium, 2021. Available online: https://jaspers.eib.org/LibraryNP/EC%20Reports/Economic%20Appraisal%20Vademecum%202021-2027%20-%20General%20Principles%20and%20Sector%20Applications.pdf (accessed on 12 May 2022).
  44. Ross, A.; Hasnain, S. Factors affecting the cost of managed aquifer recharge (MAR) schemes. Sustain. Water Resour. Manag. 2018, 4, 179–190. [Google Scholar] [CrossRef]
  45. Megdal, S.B.; Dillon, P.; Seashole, K. Water Banks: Using Managed Aquifer Recharge to Meet Water Policy Objectives. Water 2014, 6, 1500–1514. [Google Scholar] [CrossRef] [Green Version]
  46. Dillon, P.; Page, D.; Dandy, G.; Leonard, R.; Tjandraatmadja, G.; Vanderzalm, J.; Rouse, K.; Barry, K.; Gonzalez, D.; Myers, B. Managed Aquifer Recharge Stormwater Use Options: Summary of Research Findings. Goyder Institute for Water Research, Technical Report 14/13. 2014. Available online: https://www.researchgate.net/publication/275953507_Managed_Aquifer_Recharge_and_Stormwater_Use_Options_Net_Benefits_Report (accessed on 10 June 2022).
  47. Damigos, D.; Tentes, G.; Balzarini, M.; Furlanis, F.; Vianello, A. Revealing the economic value of managed aquifer recharge: Evidence from a contingent valuation study in Italy. Water Resour. Res. 2017, 53, 6597–6611. [Google Scholar] [CrossRef]
  48. Dashora, Y.; Dillon, P.; Maheshwari, B.; Soni, P.; Mittal, H.K.; Dashora, R.; Singh, P.K.; Purohit, R.C.; Katara, P. Hydrologic and cost benefit analysis at local scale of streambed recharge structures in Rajasthan (India) and their value for securing irrigation water supplies. Hydrogeol. J. 2019, 27, 1889–1909. [Google Scholar] [CrossRef] [Green Version]
Figure 1. (a) The geographical position of the island of Vis in the Adriatic Sea, with towns of Vis and Komiža (white dots), the highest peak Hum (triangle) and Korita wells (blue dots), (b) with the proposed location of the MAR site (red polygon) and the BO1 and BO2 wells (blue dots) within the Korita well field. On-site conditions in the Korita well field: (c) view from BO1 well towards NE, and (d) from BO2 towards SW.
Sustainability 15 09934 g001
Figure 2. Annual tourist arrivals on the island of Vis (2010–2020). The number of arrivals is significantly lower in 2020, reflecting the lockdown due to the COVID-19 pandemic.
Sustainability 15 09934 g002
Figure 3. Time series of the mean annual air temperature and precipitation measured at the meteorological station Komiža from 1991 to 2019.
Sustainability 15 09934 g003
Figure 4. (a) The schematic conceptual model of the proposed MAR site within the Korita well field. Surface runoff from the surrounding hills is accumulated in the channel and pond system, (b) enclosed by a spill dam at the northern end, (c) from where it is slowly infiltrated through the fractured rock mass towards the saturated zone at the approximate depth of 120 m, and (d) subsequently abstracted by the Korita wells. P is the mean annual precipitation, PET is the potential evapotranspiration, and V is the volume (i.e., the capacity of the pond).
Sustainability 15 09934 g004
Figure 5. Annual water consumption and water losses (in m3) on the island of Vis from 2014 to 2020.
Sustainability 15 09934 g005
Figure 6. Data on monthly water consumption (2014–2020) and the projected future monthly demand (2021–2030) with period averages (red, green, and yellow) on the island of Vis.
Sustainability 15 09934 g006
Figure 7. Long-term projection of increase in water demand and net annual volume of water acquired through MAR in the period from 2021 to 2050. Net annual volume of water acquired through MAR was obtained by subtracting the evaporation and water supply system losses from the gross quantity (i.e., 81,130 m3). A sharp increase in water demand in the period from 2021 to 2028 was imposed by the new hotel capacities foreseen by the urban development plans. After 2030, a linear increase of water demand of 0.5% per year was projected, with the assumption that the losses in the distribution system will further decrease to 15% in 2031.
Sustainability 15 09934 g007
Table 1. Assumptions for the projection of future water demand on the island of Vis.
Consumer GroupAssumptions Used
HouseholdsThe towns of Vis and Komiža are continuously implementing a pro-natal policy that shows promising results. The island’s population is slowly increasing. Various activities and campaigns are continuously carried out among the inhabitants to raise awareness of the importance of water consumption reduction. At the same time, habits and needs are changing, as well as the age structure of the inhabitants. The final assumption used is a continuously increasing future water demand by the local population by 0.5% per year.
TourismFollowing the Development strategy of the town of Vis 2021–2027 [41], the towns of Vis and Komiža will support investors in constructing new tourist accommodation capacities (i.e., hotel and apartment accommodation). The newly built capacities will affect the increase in tourist arrivals in the pre-season (May) and the increase in tourist traffic during the 2025 season and beyond. We assumed that the newly built capacities would impact the water consumption in May by 5%, in June and September by 7%, and during July and August by 10%. Hence, an overall increase in the water consumption in tourism by 20% by 2028 is foreseen.
EconomyIn the future, the resource-intensive economy will not be present on the island. On the other hand, the island is increasingly turning towards smart growth and development. Furthermore, the island is becoming a comfortable place to live and work, attracting new investments in modern technologies and activities that accompany sustainable development. Even though the island’s economy is developing, the island is not affected by the intensive exploitation of natural resources.
Losses in the water supply distribution systemBased on the recent trends and data provided by the local water supply company, the continuous investment in the renovation, development, and improvements of the water distribution system will reduce water losses from the current 25% to 18% by 2029.
Table 2. The projection of the annual revenues of the MAR project.
Year of OperationRevenues from Water Pricing (EUR)Revenues from the Fixed Monthly Fee (EUR)
1–200
313,4250
415,3570
538,3071918
657,2743835
759,4254166
856,2994498
940,6394612
1040,6394727
1143,2334842
1243,2334956
1343,2335071
1443,2335186
1543,2335300
16–3043,2335415
Applied prices in the projection of revenues are—1. Water supply service: (i) 1.05 EUR/m3 for households, (ii) 1.41 EUR/m3 for economic subjects, and (iii) 0.90 EUR/m3 for public institutions; 2. Fixed monthly fee: (i) 4.77 EUR/month for households, (ii) 117.86 EUR/month for hotels, (iii) 7.43 EUR/month for small and medium tourist accommodation facilities, and (iv) 10.61 EUR/month for large tourist accommodation facilities.
Table 3. Financial indicators for the project performance.
Financial Discount Rate4%
FNPVEUR 91,044
FRR5.74%
NPV of the investmentEUR 391,359
NPV of the residual value0
NPV of revenuesEUR 707,198
NPV of costsEUR 224,795
Financial discount rate: 4%. FNPV: financial net present value. FRR: financial internal rate of return.
Table 4. The physical and financial impacts of the project in various hydrological scenarios (i.e., the annual number of infiltration pond recharges).
Scenarion * of RechargeGross Annual Quantity (m3)Net Annual Quantity (m3) **NPV (EUR)Coverage of Additional Needs for Drinking Water (%)
Short-TermMedium-TermLong-Term
0 (base)3.581,13040,56591,0441005033
A123,18011,590−336,6111001410
B246,36023,180−163,5481003020
C5115,90057,950336,78310010050
D10231,800115,900655,817100100100
* n refers to the number of infiltration pond recharges per year. ** Evaporation losses of 35%, as well as 15% losses from the water supply system were considered in all scenarios.
Table 5. The physical and financial impacts of the project considering various evaporation losses.
ScenarioEvaporation Loss (%)Gross Annual Quantity (m3) *Net Annual Quantity (m3) **NPV (EUR)Coverage of Additional Needs for Drinking Water (%)
Short-TermMedium-TermLong-Term
0 (base)3581,13040,56591,0441005033
A2081,13052,735271,82610010050
B5081,13028,396−58,1851003525
C6581,13016,226−195,4981001815
* Base scenario of 3.5 recharges annually was considered in the evaporation projections. ** Losses from the water supply system (i.e., 15%) were taken into consideration in all scenarios.
Table 6. Economic indicators for the project performance.
Economic IndicatorCalculated Indicator ValueReferential Value
ENPVEUR 801,354>0
ERR22.59%>5%
B/C2.83>1
NPV of economic benefitsEUR 1,237,639>than NPV of economic costs
NPV of economic costsEUR 436,295<than NPV of economic benefits
Social discount rate: 5%. ENPV: economic (social) net present value. ERR: economic (social) internal rate of return. B/C: benefit/cost ratio indicator.
Table 7. Sensitivity analysis of the economic variables.
ScenarioVariableChange (%)ENPV (EUR)Change in ENPV (%)Evaluation of the Variable
0 (base)801,354
ARevenues from tourism−1796,900−0.55non-critical
BFinancial revenues−1795,185−0.77non-critical
CInvestment costs+1798,676−0.33non-critical
DOperating costs+1799,651−0.21non-critical
Disclaimer/Publisher’s Note: The statements, opinions and data contained in all publications are solely those of the individual author(s) and contributor(s) and not of MDPI and/or the editor(s). MDPI and/or the editor(s) disclaim responsibility for any injury to people or property resulting from any ideas, methods, instructions or products referred to in the content.

