Article

Multidisciplinary Research of Thermal Springs Area in Topusko (Croatia)

Croatian Geological Survey, Ulica Milana Sachsa 2, HR-10000 Zagreb, Croatia
*
Author to whom correspondence should be addressed.
Sustainability 2023, 15(6), 5498; https://doi.org/10.3390/su15065498
Submission received: 28 February 2023 / Revised: 15 March 2023 / Accepted: 16 March 2023 / Published: 21 March 2023
(This article belongs to the Special Issue Groundwater Protection and Sustainable Utilization)

Abstract

:
Topusko is the second warmest natural thermal water spring area in Croatia, located at the southwest edge of the Pannonian Basin System. Due to favourable geothermal properties, these waters have been used for heating and health and recreational tourism since the 1980s. Thermal springs with temperatures up to 50 °C are the final part of an intermediate-scale hydrothermal system. However, systematic research on the Topusko spring area has not been conducted to lay the foundation for sustainable resource utilisation. Multidisciplinary research including the hydrogeochemical characterisation of naturally emerging thermal water, an electrical resistivity tomography (ERT) investigation conducted to reconstruct the subsurface geology, and hydrogeological parametrisation of the geothermal aquifer was carried out to refine the existing local conceptual model. The results show Ca-HCO3 facies of Topusko thermal waters, which get heated in a Mesozoic carbonate aquifer. The water equilibrium temperature in the geothermal aquifer is estimated to be 78 °C based on the SiO2-quartz geothermometer. The fault damage zone, which enables the upwelling of thermal water, was identified by ERT investigations. The transmissivity values of the aquifer derived from the results of step-drawdown tests range from 1.8 × 10⁻² to 2.3 × 10⁻² m2/s. Further multidisciplinary research is necessary to improve the existing conceptual model of the Topusko hydrothermal system.

1. Introduction

Geothermal energy is a renewable energy source that encompasses the thermal energy generated and/or stored in the subsurface, representing a strong driver of the EU’s clean energy transition as envisioned by the European Green Deal [1,2,3,4,5]. It is considered an inherently clean form of energy without combustion that facilitates meeting environmental standards and regulations. When it can be economically extracted from an aquifer and used for generating electric power or any domestic, agricultural, or industrial application, it forms a geothermal resource [6]. The availability of a geothermal resource can contribute to domestic economic health, decrease the annual energy trade deficit, and reduce dependence on imported energy. Its characteristics and possible modalities of utilisation are closely related to the geological and hydrogeological setting of the connected geothermal system. To classify a geological system as geothermal, three main elements must be present: a source of heat and fluid, an aquifer that accumulates them, and a barrier that retains them [7].
There are several classifications for geothermal resources based on their geological or engineering characteristics [8,9,10]. According to [10], there are three main types of geothermal resources based on their geological characteristics and the heat transfer mechanism: (i) hydrothermal convection resources, (ii) hot igneous resources, and (iii) conduction-dominated resources. When the underlying mechanism of heat transfer involves the convection of water in a liquid or vapour state, it is considered a hydrothermal system. Hydrothermal systems include a recharge area where meteoric water infiltrates into the subsurface, a geothermal aquifer where water gets heated by terrestrial heat flow, and a discharge area where the heated water flows out in the form of natural thermal springs [7,11]. The outflow of thermal waters is generally driven by favourable structural conditions that increase the local permeability [10,11,12].
Determining the geological and hydrogeological settings driving a hydrothermal system is crucial in order to understand its development and renewability. The renewability of a hydrothermal system depends on continuous and sufficient recharge by meteoric water and heat inflow, while sustainable utilisation depends on both the local hydrogeological characteristics and the exploitation scheme. As many European and Croatian strategic documents regulating energy, tourism, and environmental protection envisage the use of thermal water in order to transit towards climate neutrality, a detailed characterisation of the resource is needed to assess its renewability and propose a long-term sustainable utilisation scenario.
The characterisation of resources through hydrogeochemical, geophysical, hydrodynamic, and geological investigations is commonly used for the exploration of hydrothermal resources and to assess their renewability and the sustainability of utilisation practices [7,11,13,14,15]. Hydrogeochemical methods are an effective tool to determine the origin of the geothermal fluid, the interaction with the aquifer, aquifer equilibrium temperature, water mean residence time, and possible mixing processes [16,17,18]. Geophysical methods can be used to reconstruct the geological and structural settings in the subsurface assessing the volume of the aquifer and the geometry of the fault network that drives the fluid flow [19,20,21]. In addition, the management of the geothermal aquifer requires an assessment of the hydrogeological parameters of an aquifer, such as hydraulic conductivity, transmissivity, and porosity.
Geothermal waters in the Republic of Croatia have significant potential for large-scale heat generation, cascading water uses, and local power generation [22]. They generally occur in areas of high surface heat flow and are predominantly hosted in Mesozoic carbonate rock [23,24]. One of the most relevant thermal manifestations in Croatia is represented by the thermal springs in Topusko, being the second warmest natural spring area in Croatia. Springs with temperatures of up to 50 °C attracted people’s attention already in Roman times [25]. Four exploitation wells were drilled in the 1980s with depths of 80–250 m, enabling the outflow of artesian waters of up to 66 °C. Thermal waters have been directly used for heating and balneology. During the Croatian War of Independence (1991–1995), the area of Topusko suffered enormous destruction, and the damage has not been fully repaired to this day. Before that, the consumption of thermal water for therapy, recreation, and heating of residential and commercial buildings was higher.
Despite the great natural potential of the Topusko geothermal resource, research is scarce, and unpublished reports on well construction and revitalisation make up most of the available data. Multidisciplinary research of the discharge area is one of the steps leading to the development of an improved conceptual model of the Topusko hydrothermal system (THS). The main objectives of this work are (i) the hydrogeochemical characterisation of the naturally emerging thermal water and the estimation of the aquifer equilibrium temperature, (ii) the reconstruction of the subsurface geological setting and the identification of preferential flow paths allowing the thermal water outflow in the spring area, and (iii) the hydrogeological parameterisation of the geothermal aquifer.

2. Materials and Methods
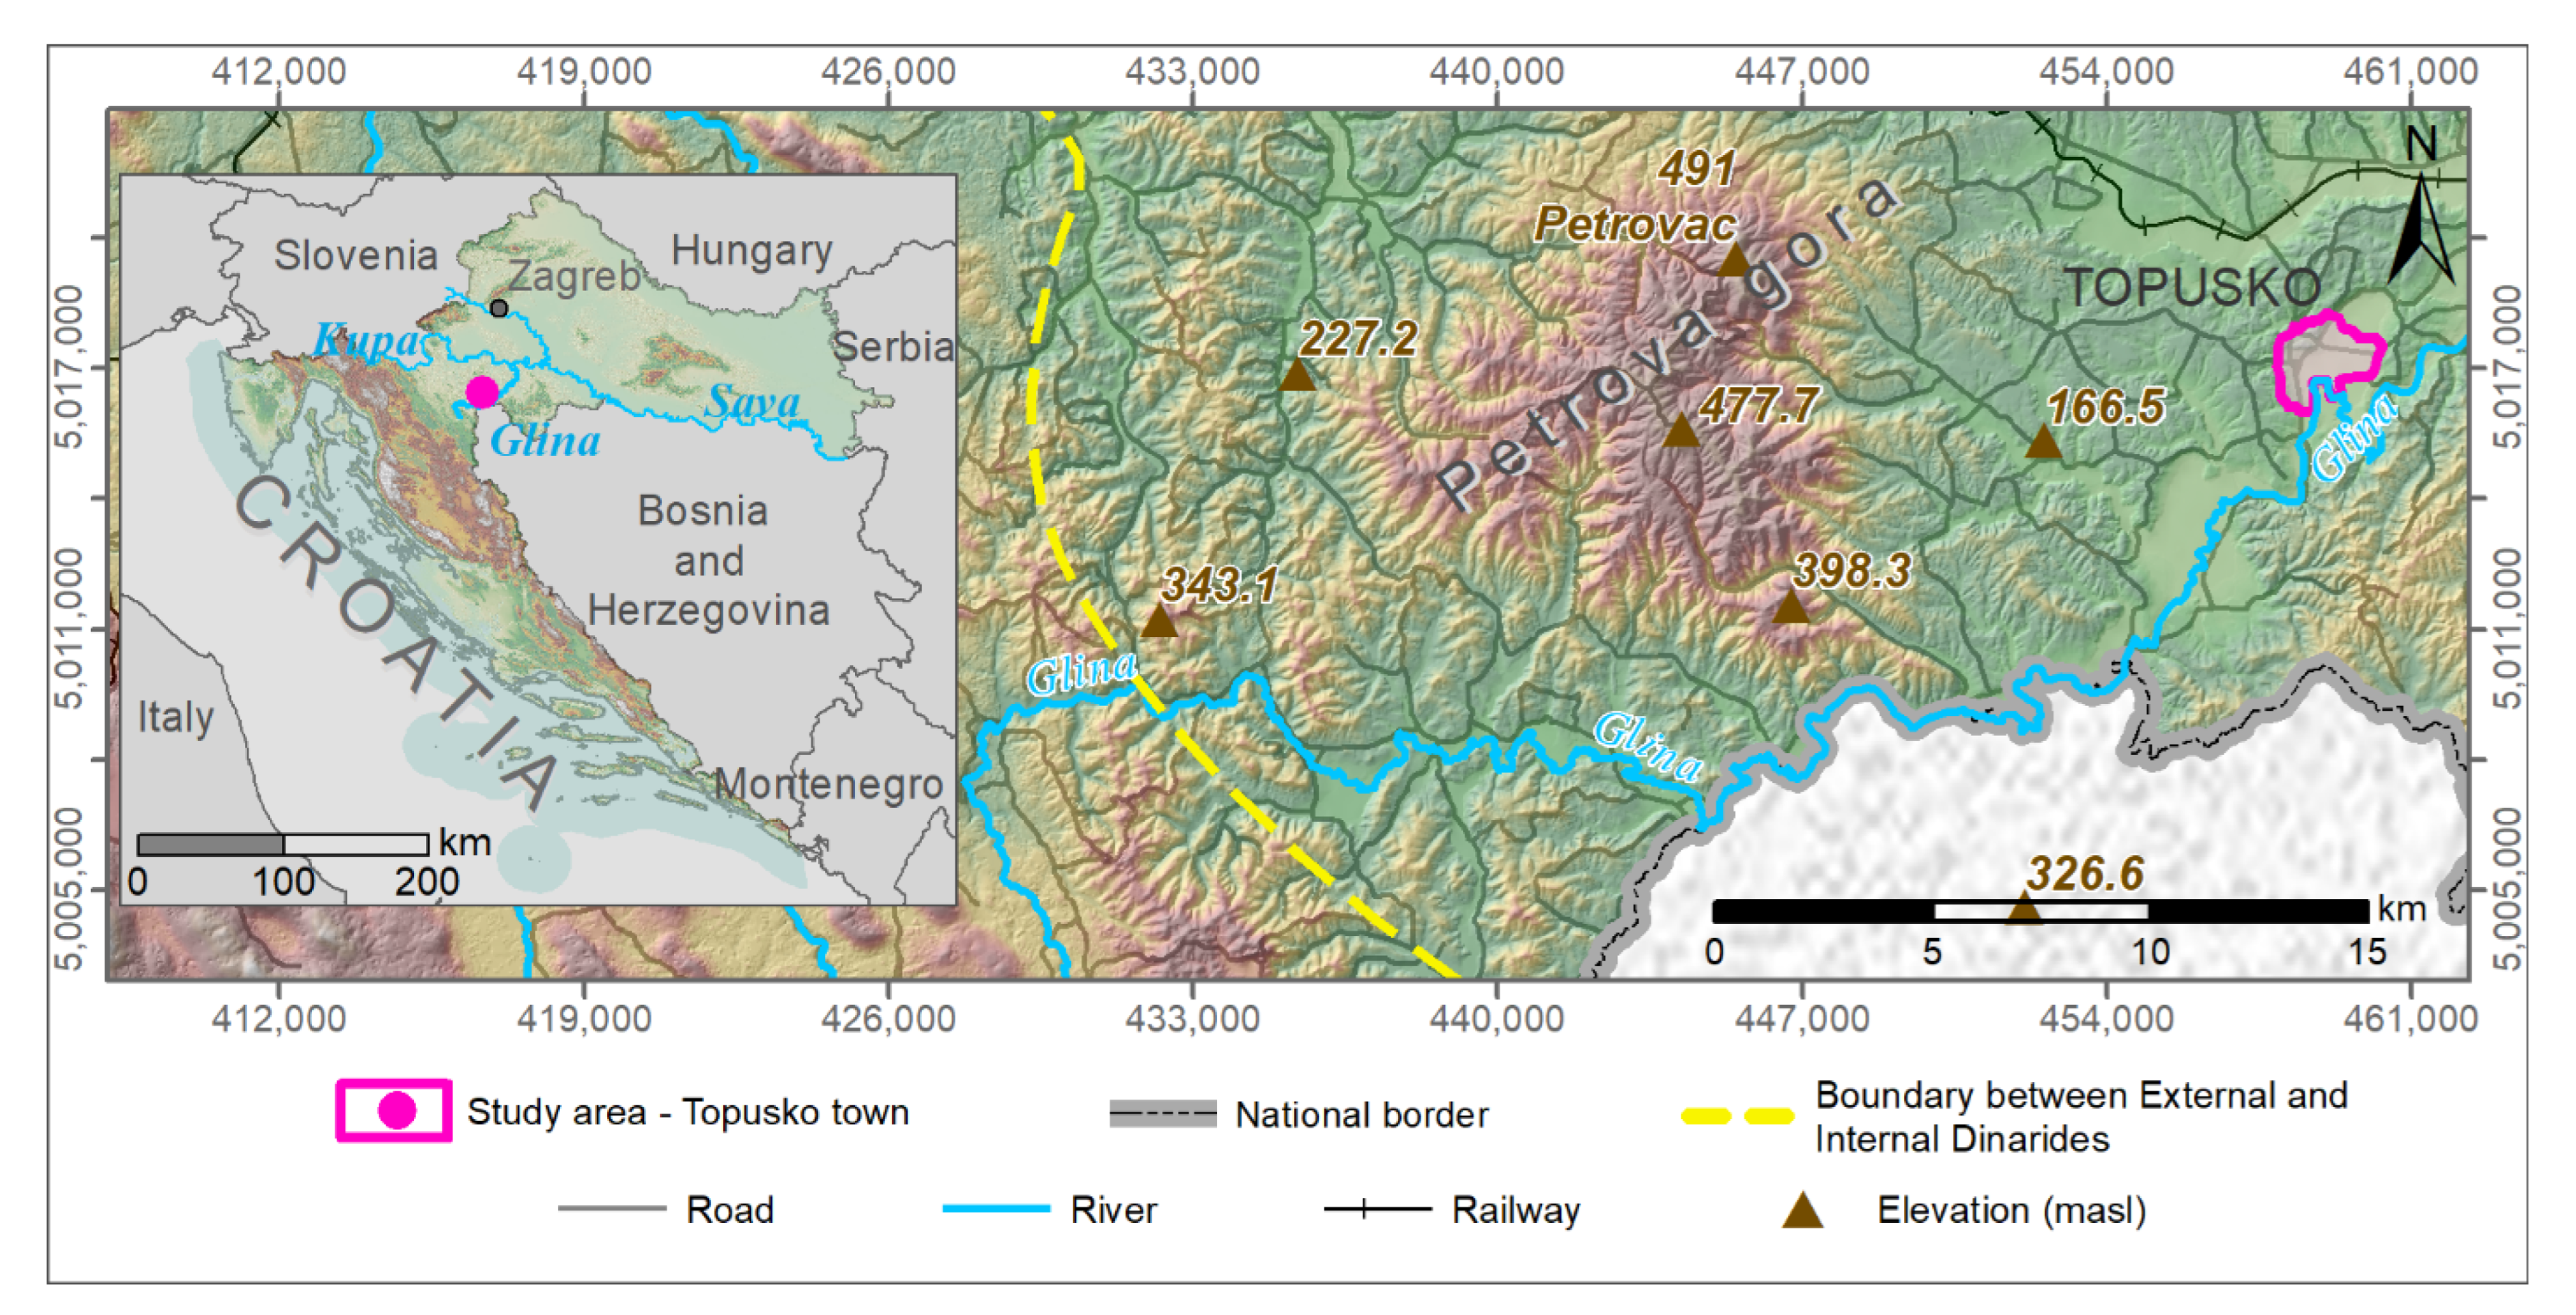
2.1. Study Area

The town of Topusko is located approximately 60 km south of Zagreb in the lowlands along the eastern slopes of Petrova gora hill (Figure 1). Geomorphologically, the Topusko area belongs to the floodplain along the middle course of the Glina river. According to the 2021 census, the town of Topusko had 2310 inhabitants [26]. This area has been inhabited since ancient times due to the rich thermal water springs and ore deposits. A moderate continental climate prevails in the study area, slightly influenced by the Mediterranean climate of the northern Adriatic [27]. The annual average precipitation is 900 mm and up to 1400 mm in the period of 1961–1990 (Sisak meteorological station), with peaks at the beginning of summer and the end of autumn. Average monthly air temperatures range from −1.1 °C in January to 20.8 °C in July, while the annual average is 10 °C [28].

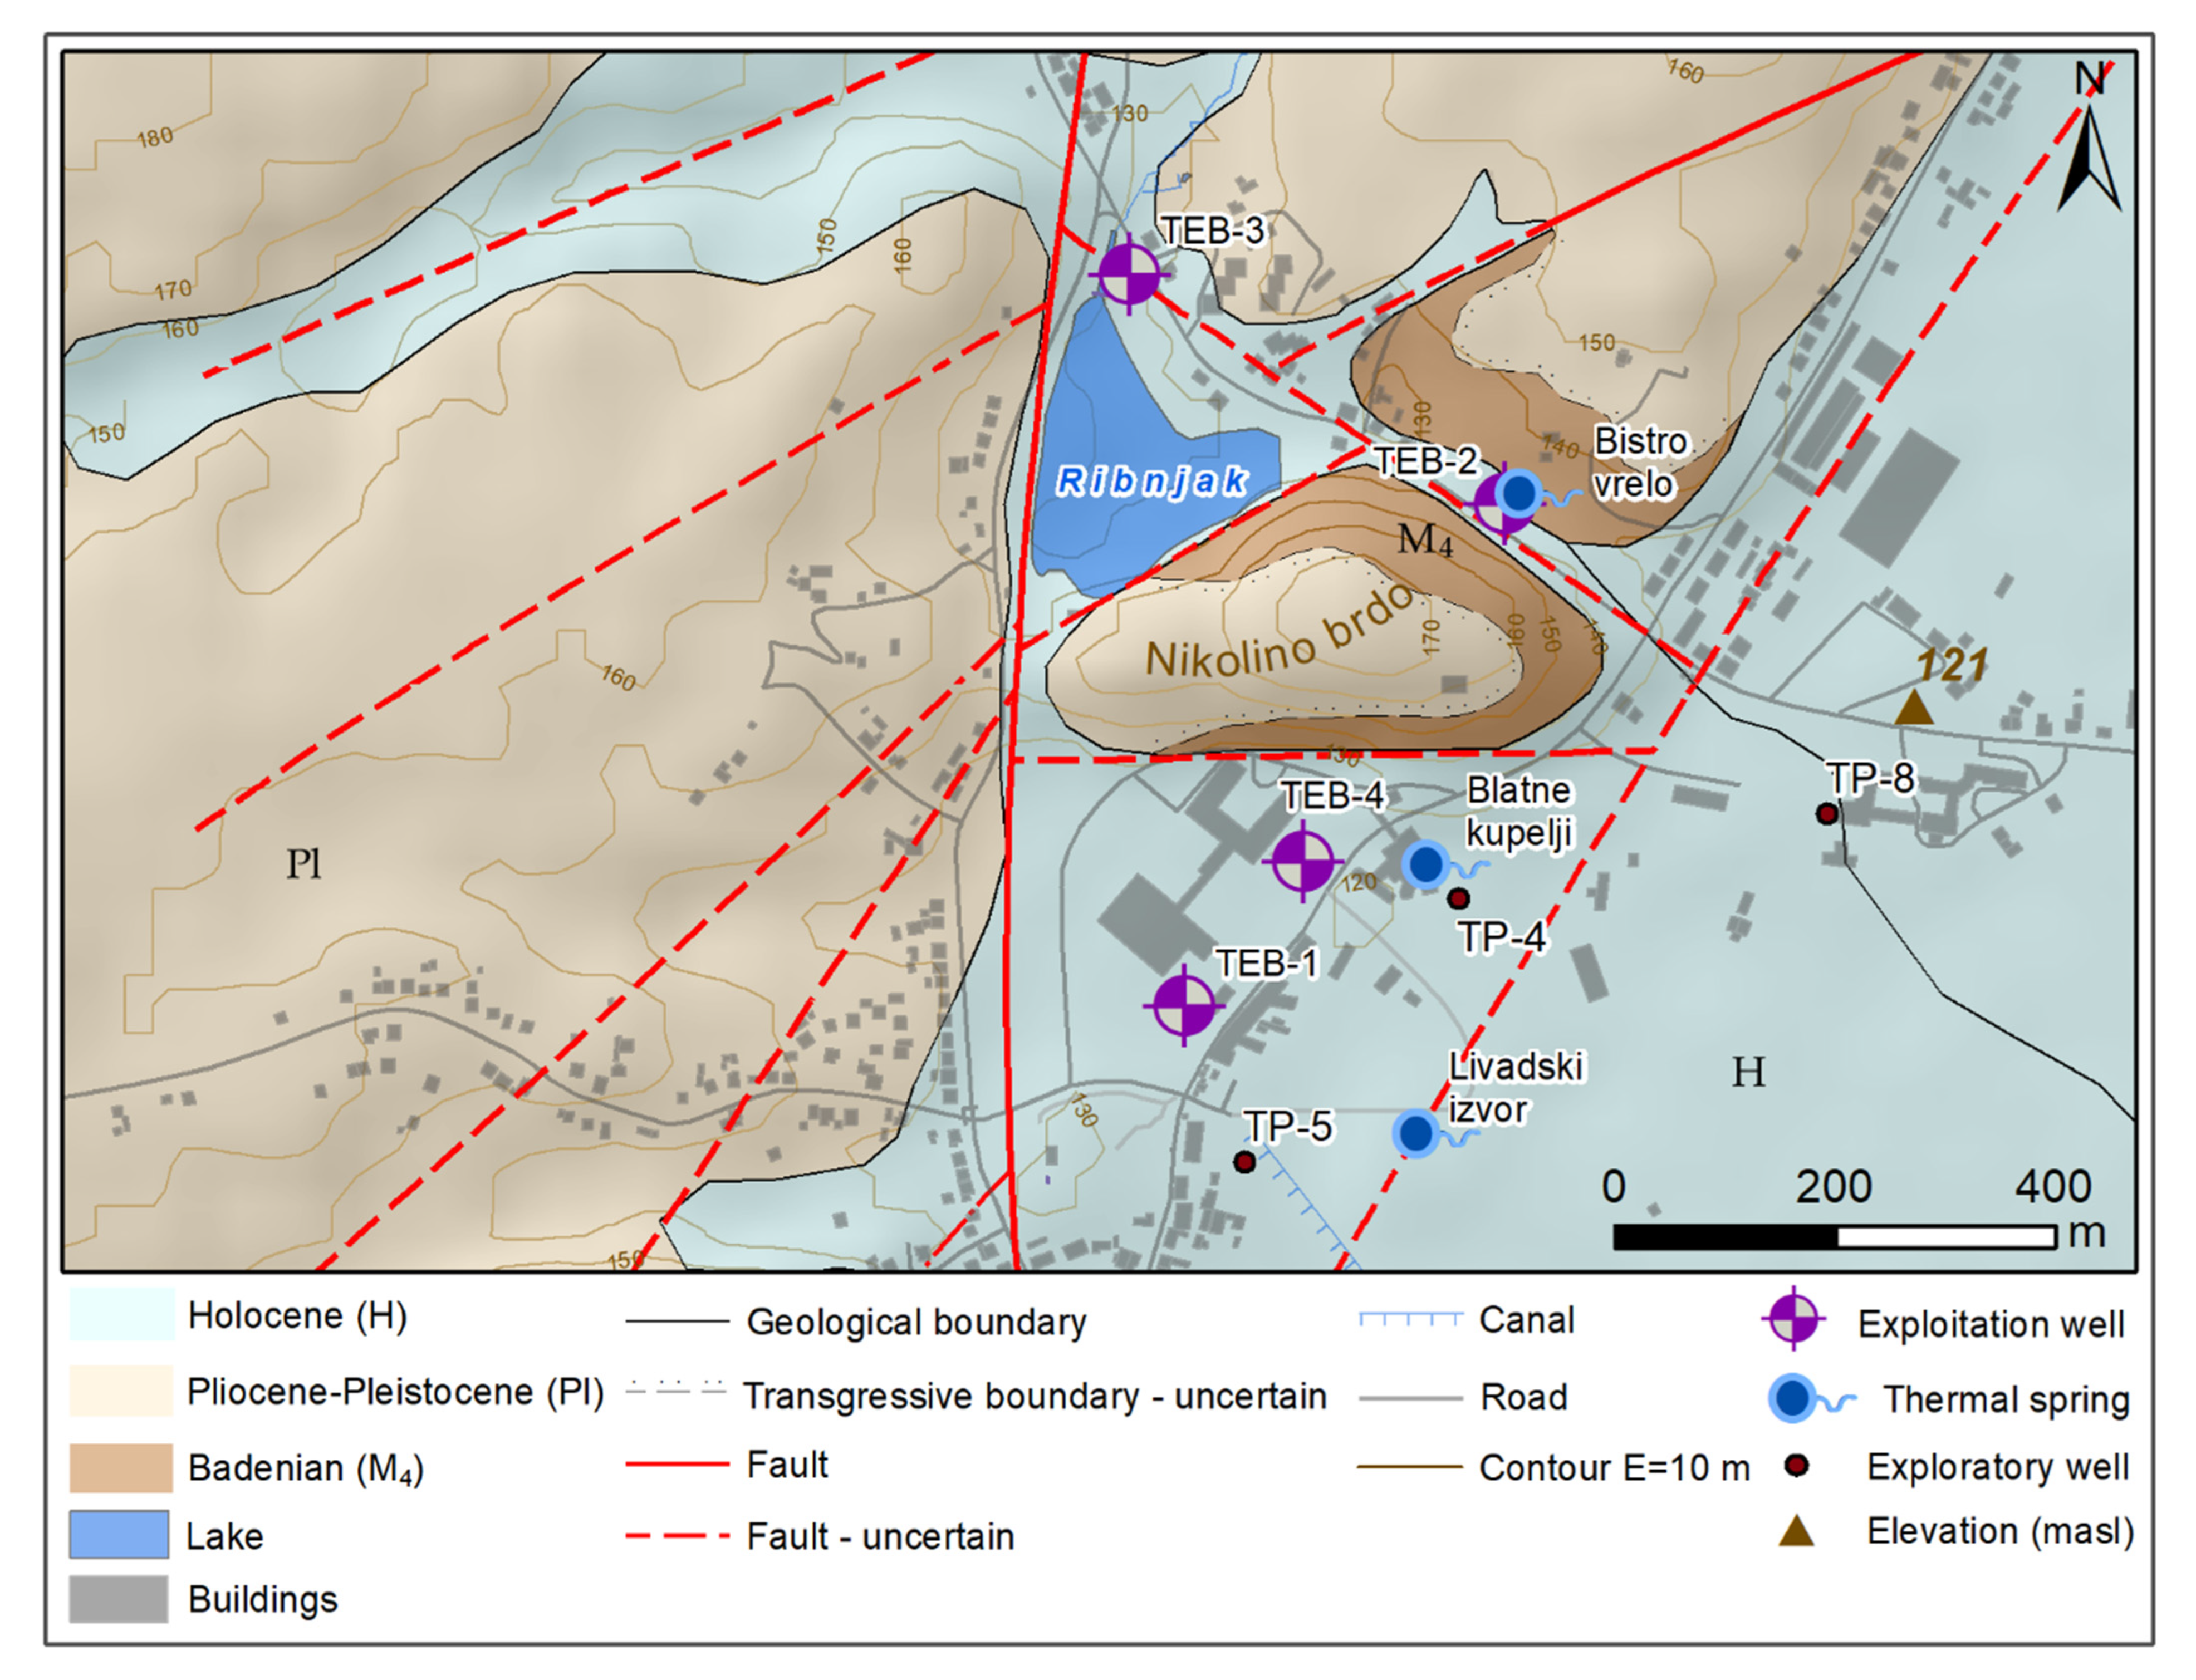
Geological and Hydrogeological Setting

The study area is located at the NE margin of the Dinarides, belonging to the tectonic unit of the Internal Dinarides [23,29]. Figure 1 shows the tectonic contact dividing External and Internal Dinarides. External Dinarides are characterised by a thick sequence of Mesozoic carbonates (up to 8 km), being part of the Adriatic microplate [29,32]. The Internal Dinarides consist of a set of complex nappe sheets comprising continental-derived deposits sedimented at the distal edge of the Adriatic microplate, formed mainly during the last orogeny from the Cretaceous to the Cenozoic [30]. Furthermore, the Topusko area is located at the southwest margin of the Pannonian Basin System, sharing its favourable geothermal characteristics connected to back-arc crustal thinning. In the Croatian part of the Pannonian basin, natural thermal water springs emerge at two dozen localities, with temperatures up to 58 °C [24,33].
The surface geology in the area of Topusko is mostly characterised by Pliocene to Holocene sedimentary deposits (hereafter referred to as Plio–Quaternary deposits) up to 90 m thick. They consist of clays, sands, and gravels laying discordantly over older lithological units (Figure 2). Locally, older deposits consisting of loose Badenian arenites (M4) crop out. Below these units, the occurrence of Miocene marls and sandstones and Mesozoic dolomites interlayered with sandstones and marls was determined by drilling. The spring area is presumed to be bounded by three faults that form a block in the form of a three-sided prism (Figure 2), enabling the uplifting of Triassic carbonates, which were determined to be the aquifer [34].
There are three natural artesian thermal springs (Figure 2; Livadski izvor, Blatne kupelji, and Bistro vrelo springs) with temperatures up to 50 °C and an estimated total capacity of approximately 20 L/s [36,37]. In particular, the Livadski izvor spring is the second warmest thermal spring in Croatia. Four exploitation wells (TEB-1 to 4) were drilled during the 1980s based on the results of eight exploratory wells (i.e., TP 1 to 7 with depths up to 50 m and temperatures between 28 and 62 °C, and TP 8 with a depth of 170 m and temperature of 62 °C). TEB-1, 3, and 4 have constantly been operating, being the source for heating, balneology, and health tourism in Topusko. TEB-2 was damaged, and it is no longer in operation. The wells are artesian with a pressure of 0.5 to 2.3 bar, a temperature of 64 to 68 °C, and an estimated total capacity of 200 L/s [38,39]. A water permit was issued in 1998, allowing exploitation with a maximum flow rate of 151 L/s. However, annual consumption data (2009–2013) show that the actual average flow rate is approximately 30 L/s, pointing to very low utilisation.
From a hydrogeological perspective, Mesozoic carbonates represent the geothermal aquifer of the THS, while younger Neogene sediments characterised by generally lower permeability represent the aquitard at the top of the aquifer [35,40].
Šimunić [34] proposed a conceptual model of THS. The recharge area is to the west of the Petrova gora hills, where Triassic carbonates crop out. Infiltrated waters flow in the Mesozoic carbonates below the Paleozoic metamorphic units of the Petrova gora nappe, reaching a depth of 3 km. In Topusko, a set of faults forming a block in the shape of a three-sided prism enabled the uplifting of the aquifer. However, the geological relations that enable the emergence of thermal water on the surface are still not fully understood.

2.2. Geochemical Investigations

2.2.1. Chemical Composition of Groundwater

The chemical composition of groundwater is determined by the original composition of the infiltrated water and the chemical reactions occurring in the aquifer during its flow. Its final composition is influenced by many factors including altitude, vegetation, climate, and the mineralogical composition of the aquifer. The principal anion and cation composition gives insight into the mineralogical composition of the aquifer, as well as possible mixing with water from shallower cold aquifers in the spring areas [17,41]. In addition, selected chemical compounds can be used to calculate the aquifer equilibrium temperature by using different empirical formulae [42,43,44].
Hydrochemical analyses conducted during several sampling campaigns in the 1980s were collected for this work [36,45,46,47]. The hydrogeochemical parameters of thermal water samples included groundwater temperature (T), pH, major ions (Ca2+, Mg2+, Na+, K+, HCO3, SO42−, and Cl), and silica (SiO2). The quality of the analysis was tested by evaluating the charge balance and its error through the equation:
Charge   balance   error   ( % ) = cations anions ions ×   100 ,
where the ionic concentrations are in meq/L. Samples with a charge balance error of more than ±2% were excluded from further analysis [17,48,49].
Processing of acquired data was carried out in Excel and DIAGRAMMES computer software, which was used to make the Piper diagram and to calculate total dissolved solids (TDS) [50]. A trilinear Piper diagram was used to graphically determine groundwater hydrochemical facies based on the chemical composition of thermal water samples and their dominant ions [51,52]. In addition, the equivalent ratio of Ca2+/Mg2+, (Ca2+ + Mg2+)/(HCO3), (Ca2+ + Mg2+)/(HCO3 + SO42−), and the molar ratio of Ca2+/(Mg2+ + Ca2+) vs. SO42−/(SO42− + HCO3) in groundwater were graphically analysed, detailing the water–rock interactions in the system.

2.2.2. Geothermometers

The maximum temperature reached by the thermal waters in the aquifer is an important parameter determining the potential of using an individual geothermal resource [18]. This parameter can be determined using chemical geothermometers. Chemical geothermometry is based on the temperature dependence of mineral–fluid equilibrium. The main assumptions of geothermometry are that (i) fluids are in chemical equilibrium, (ii) the mineral assemblage is thermodynamically stable, and (iii) thermal water retains its chemical properties during its upwelling to the surface [53].
Classical chemical geothermometers, which include the dissolved silica geothermometer SiO2-quartz and SiO2-chalcedony, were used to predict the aquifer temperature of the THS. They consist of experimentally calibrated equations ([54] (2), [55] (3), and [56] (4) for the SiO2-quartz geothermometer; [55] (5) and [57] (6) for the SiO2-chalcedony geothermometer) that enable the determination of the water temperature in the aquifer using the SiO2 concentrations. The equations used for the SiO2-quartz geothermometers are:
T = 1315 5 . 205     log   ( SiO 2 ) 273 . 15   ( ° C ) ,
T = 1309 5 . 19     log   ( SiO 2 ) 273 . 15   ( ° C ) ,
T = 1315 0 . 435     log   ( SiO 2 ) 273 . 15   ( ° C ) .
The equation used for the SiO2-chalcedony geothermometers are:
T = 1032 0 . 435   log   ( SiO 2 ) 273 . 15   ( ° C ) ,
T = 1112 4 . 91     log   ( SiO 2 ) 273 . 15   ( ° C ) .
Concentration units are in mg/L, except for (4), which is in mol/L. The application of a quartz geothermometer is recommended for aquifer temperatures above 150 °C. Below that, chalcedony usually controls the dissolved silica content [11,18].

2.3. Hydrogeological Investigations

Well tests on TEB-1 and 3 were conducted in September 2021 and 2022 to assess the hydrogeological characteristics of the aquifer. Due to the construction of the wells, step-drawdown tests with variable pumping rates (Q) were carried out by estimating the wells’ efficiencies and the transmissivity of the aquifer. The water pressure was measured at a time interval of 1 s using a digital manometer (Keller LEX1) with a resolution of 0.1 mbar, while the water temperature was measured once for every pumping rate step. The water density was determined from its temperature, and the pressure drop was converted in drawdown (Δ in m).
The drawdown results were determined from both aquifer and well losses [58]. The aquifer losses (B) are head losses occurring in the aquifer that vary linearly with the well discharge. Well losses can be linear (B′) and non-linear (C) and are caused respectively by (i) the damage to the aquifer during the drilling and the completion of the well and (ii) the turbulent flow in the well and its surroundings. Linear and non-linear losses can be determined using the equation [59]:
Δ = ( B + B ) Q + CQ n ,
with n varying from 1.5 and 3.5. The generally accepted value of n = 2 was used in the interpretation of the step-drawdown test results [60].
The B + B′ and C parameters were calculated through a linear regression from the experimental Δ and Q values [61]:
Δ Q = ( B + B ) + CQ
Different statistical indicators were used to assess the reliability of the linear regression. The B + B′ and C coefficients were used to calculate the theoretical Δ at the measured Q. The well efficiency was calculated as the ratio between the linear losses and the total Δ.
The collected data were also used to assess the transmissivity of the thermal aquifer through the well-established experimental relation between the transmissivity of the aquifer and the specific capacity of the well (SC = Q/Δ). Both experimental and theoretical Δ were used to calculate SC. The aquifer transmissivity (T) was estimated following the equations:
T   ( m 2 / day ) = 0 . 85   ×   SC 1 . 07 ,
T   ( m 2 / s ) = 2 . 39   ×   SC 1 . 07 .
These equations [62,63] were considered since they were developed, respectively, for a carbonate thermal aquifer in Italy and dolomite aquifers in Slovenia. SC was calculated for steps showing well efficiency higher than 50%, and an average value of SC was used to determine T.

2.4. Geophysical Investigations

Geophysical investigations can be used to reconstruct the geological and structural settings of the subsurface based on the physical properties of the different geological elements. These methods are fruitful where the geological setting is concealed below the alluvial cover and boreholes could provide only partial reconstruction due to lateral variations in the geological setting. Electrical resistivity tomography (ERT) is a non-invasive and fast geophysical method, usually applied to obtain high-resolution 2D images of the subsurface resistivity. This method can be used to define the geometry of an aquifer, delineate the structural and lithological setting of the subsurface, and determine the geometry of faults and the width of the connected, water-saturated fault zones [64,65,66].
Three ERT profiles (TOP-1, TOP-2, and TOP-3) were recorded in 2021. The ERT surveys were performed using the POLARES 2.0 electrical imaging system by P.A.S.I. srl, which uses a sinusoidal alternating current of variable frequency. A multi-electrode resistivity system consisting of stainless-steel electrodes with constant spacing, connected by a multi-core cable, was used [67,68]. Surveys were performed using a Wenner–Schlumberger array at a frequency of 1.79 Hz and a maximum phase of 20° (delay of the voltage signal with respect to the current signal). This configuration resolves horizontal and vertical structures, maintaining a good investigation depth (i.e., approximately one-fifth of the section length in the central part of the profile [69,70,71,72]). The TOP-1 profile was measured using 64 electrodes spaced 5 m apart, resulting in a total length of 315 m. TOP-2 and 3 profiles were conducted using 32 and 48 electrodes, respectively, and an electrode spacing of 10 m, resulting in a total profile length of 310 m and 470 m, respectively.
RES2DINV resistivity inversion software was used to invert the apparent resistivity data measured in the field into a 2D resistivity model of the subsurface [73]. The smoothness-constrained least-squares method [74,75] based on an L2 norm [76,77] was used for the data inversion. This method minimises the square of the differences between the measured and calculated apparent resistivity values and typically produces smoothly varying resistivity distributions.
The stratigraphic logs of the wells provided hard data to corroborate the interpretation of the resistivity models. In particular, the TOP-1 profile crosses the TEB-2 well, while TOP-2 and TOP-3 profiles are located in the close vicinity of the TEB-4 well.

3. Results

3.1. Geochemical Characterisation of Thermal Groundwater

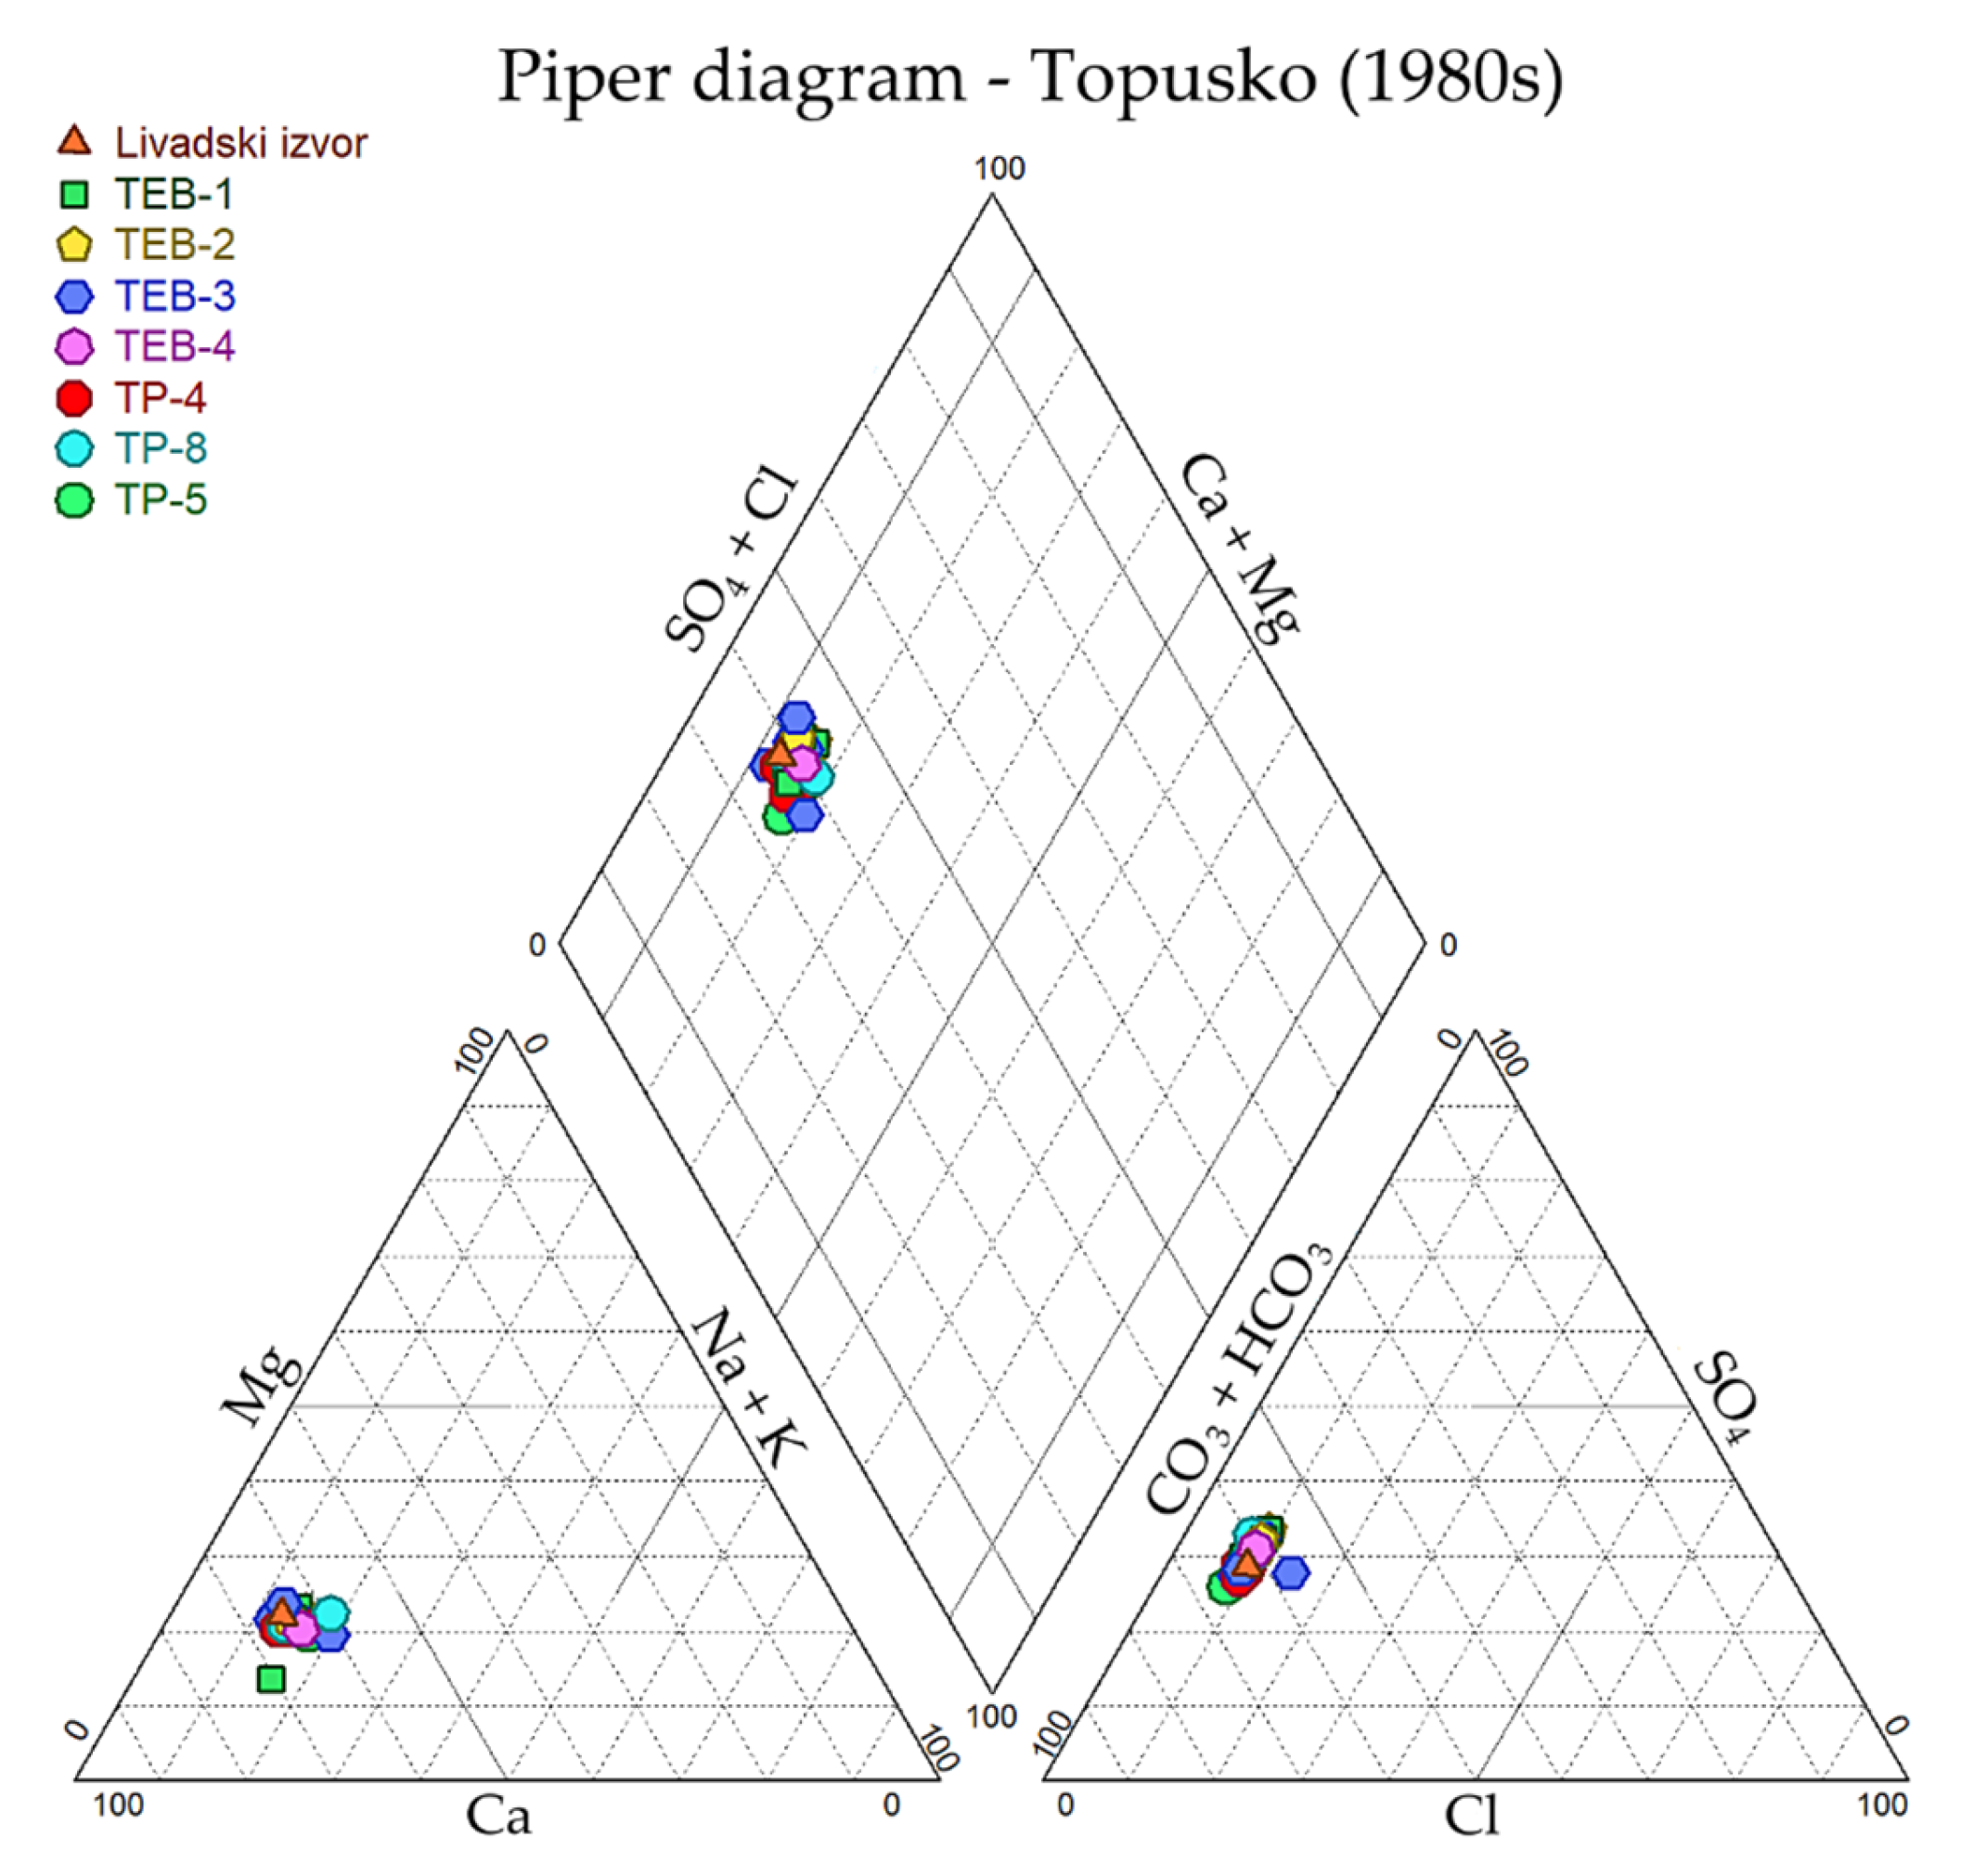
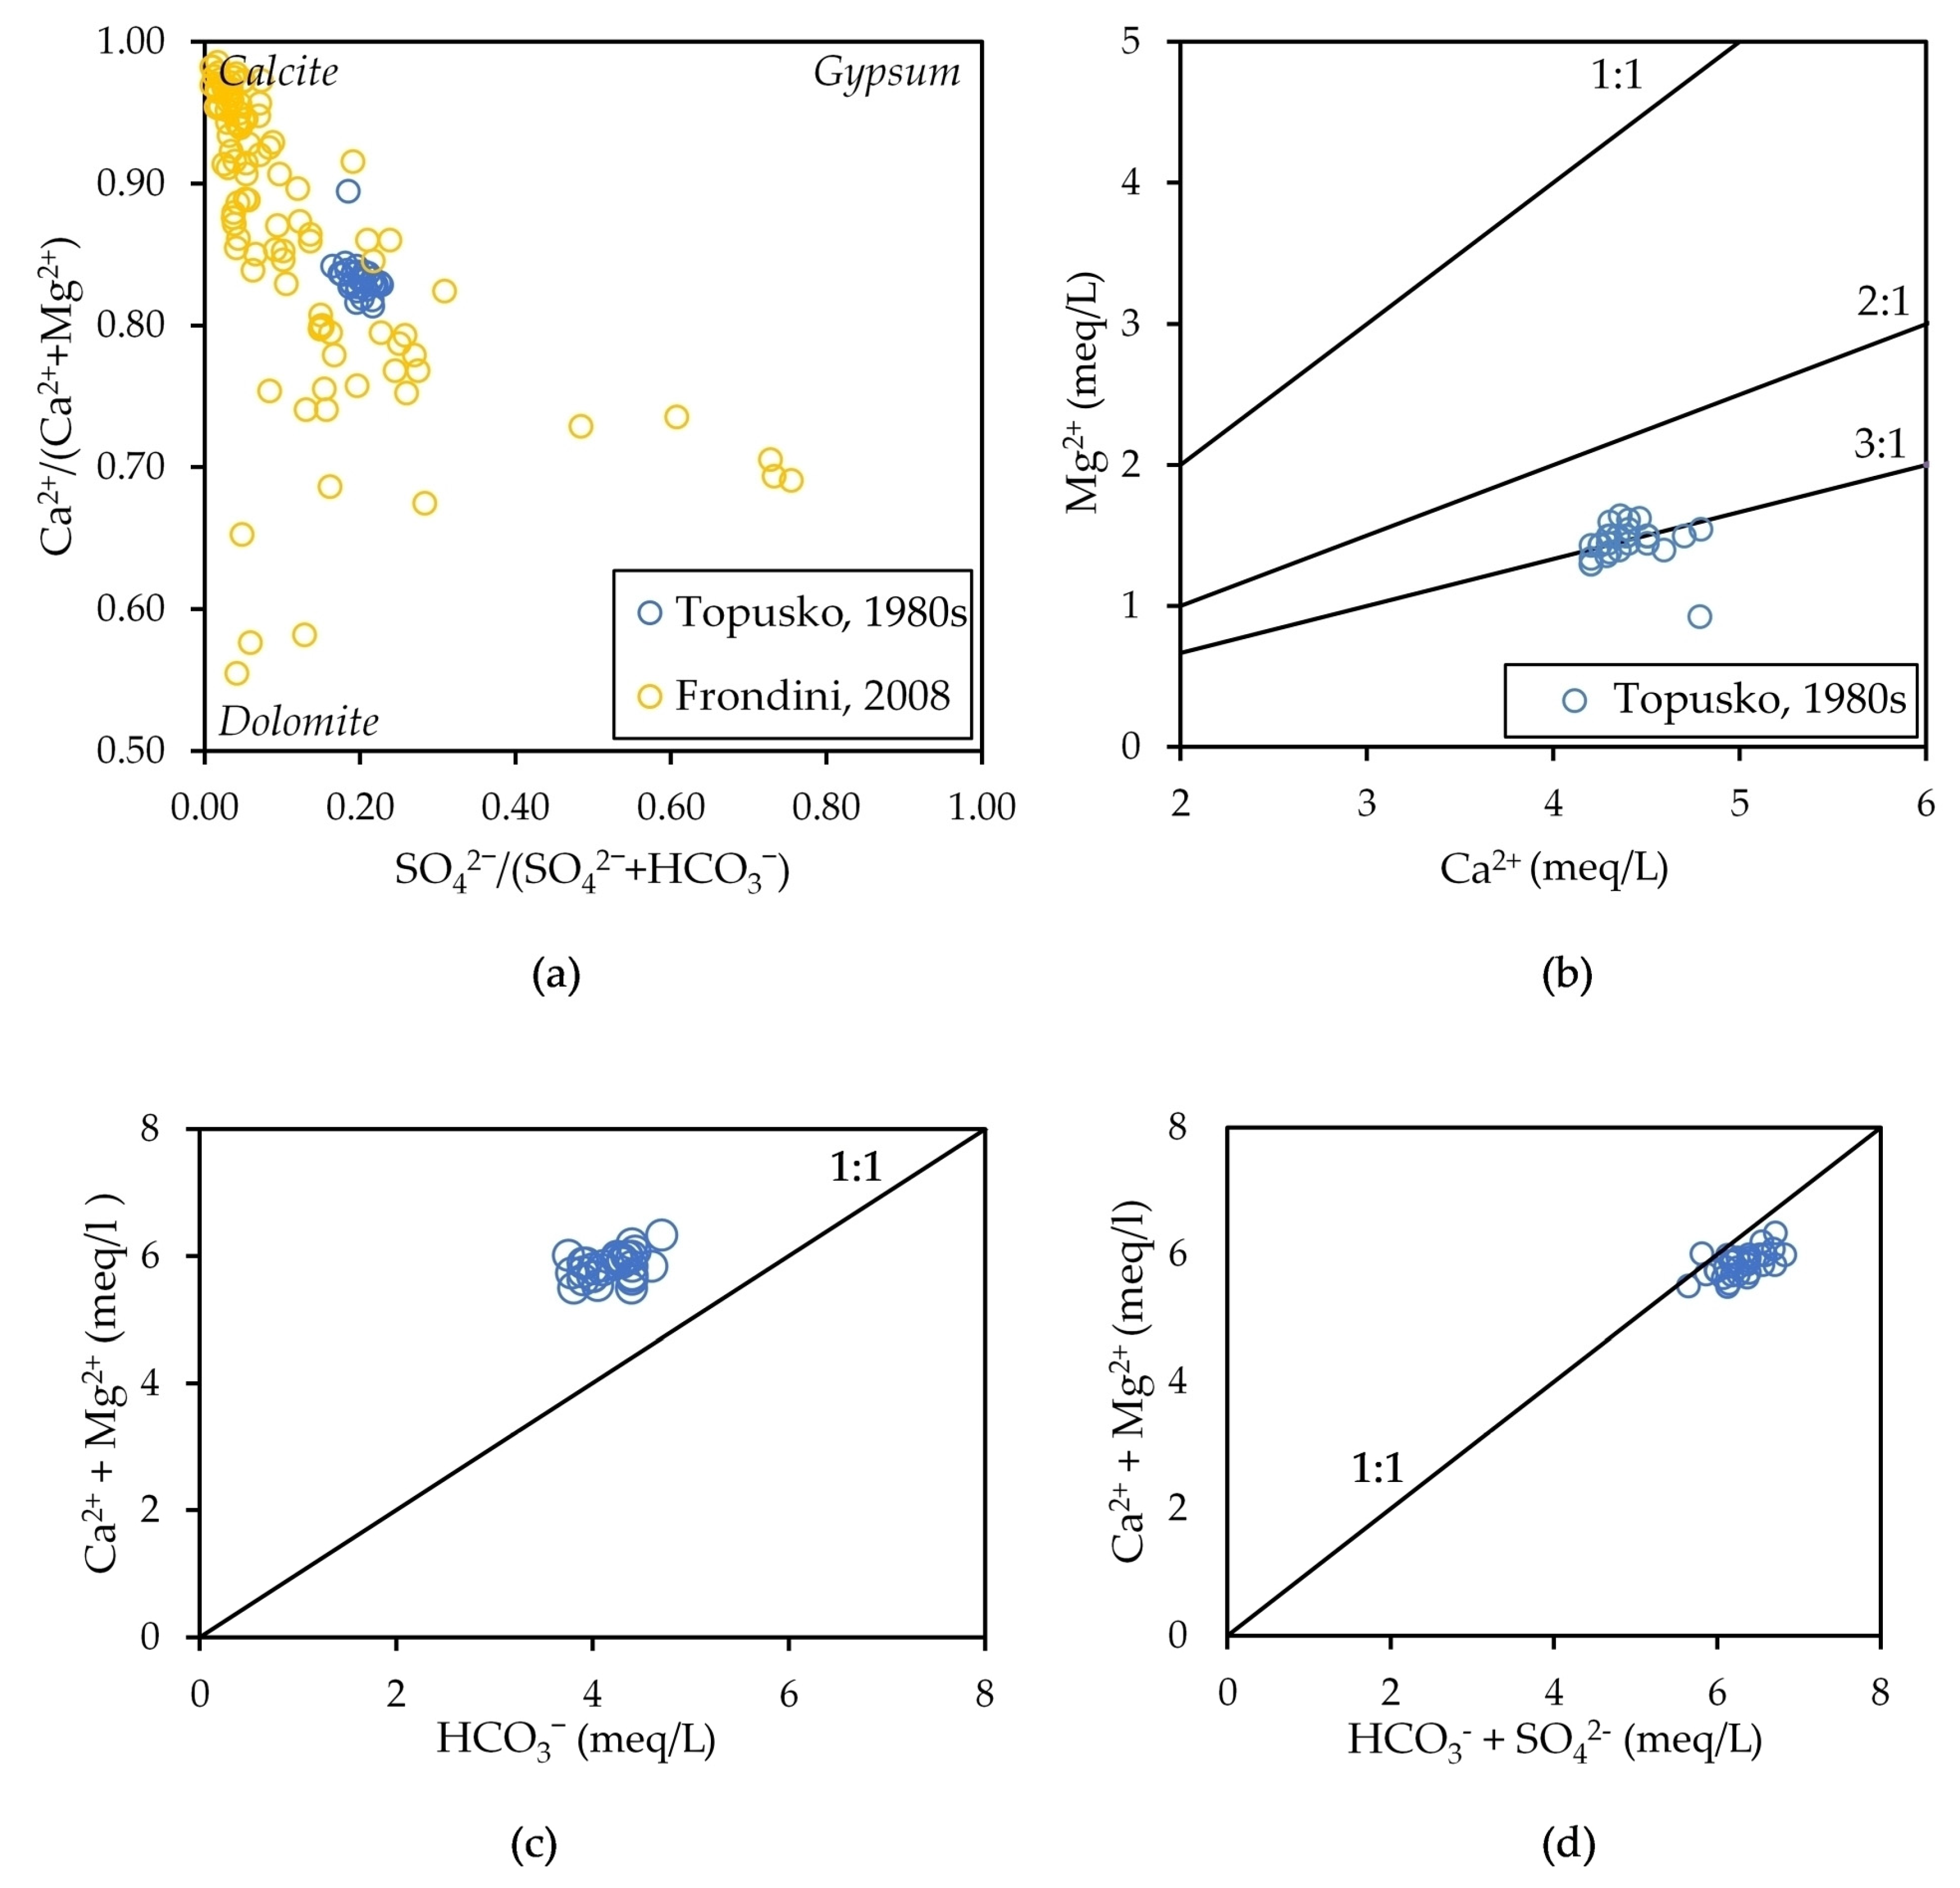
3.1.1. Major Ions Chemistry

A total of 39 chemical analyses of major ion content from thermal waters in Topusko were collected from unpublished reports. Nine samples with a reaction error over ±2% were excluded from further analysis. Table 1 shows the concentrations of major ions of sampled thermal water, along with temperature, pH, and SiO2 measurements. The data are organised based on the sampling location.
The monitored thermal spring Livadski izvor showed a temperature of 50 °C, while the exploitation and exploration wells showed average temperatures of 65 and 51 °C, respectively. Thermal water pH was neutral to slightly basic, averaging 7.0 and 7.5 for Livadski izvor spring and exploitation wells, respectively (Table 1). TDS ranged from 505 to 592 mg/L, being within the range for thermal springs in carbonate aquifers of the Inner Dinarides, which generally show TDS lower than 1 g/L [78]. Nonetheless, the generally low concentrations of the cations and anions resulting in low mineralisation of the groundwater in the study area indicate a precipitation recharge-dominated groundwater system.
The major anion and cation composition of thermal water is graphically presented in the Piper diagram (Figure 3) [51]. All samples show Ca-HCO3 hydrochemical facies [79], with a dominance of Ca2+ cation followed by Mg2+, which is a characteristic of groundwater in carbonate aquifers [80,81,82]. The ion composition is almost constant over time, which indicates a large and stable hydrothermal system.
The diagram in Figure 4a shows the Ca2+/(Ca2+ + Mg2+) mole ratio in Topusko thermal waters compared with freshwater samples from the carbonate–evaporite formation aquifer [83]. A mole ratio of 1 corresponds to the dissolution of pure calcite, while 0.5 corresponds to the dissolution of stoichiometric dolomite. All samples from Topusko are characterised by values from 0.81 to 0.89 (average 0.83), indicating that groundwater reacts with both dolomite and calcite. In Figure 4b, the Ca2+/Mg2+ ratio diagram shows the dominance of Ca2+ in all sampled thermal waters, which should be 1 in a system dominated by pure dolomite. This ratio suggests the interaction of Topusko thermal water with limestones [84,85], pointing to their occurrence in the aquifer together with the dolomites found in the thermal wells. Figure 4c shows the ratio of Ca2+ + Mg2+ and HCO3. According to the stoichiometry of the reaction of carbonate rock dissolution, the milligram equivalent ratio of (Ca2+ + Mg2+)/(HCO3) should be 1 when HCO3 is derived from the dissolution of carbonate minerals (calcite and dolomite) and only carbonic acid is involved in the reaction. Collected thermal groundwater samples have an average equivalent ratio of 1.4, suggesting that the dissolved inorganic carbon is mainly composed of bicarbonate and related to carbonate dissolution. This ratio positions the samples slightly above the 1:1 line, indicating an excess of Ca2+ + Mg2+ ions over HCO3¯ and reflecting an additional source of Ca2+ and Mg2+. The milligram equivalent ratio of (Ca2+ + Mg2+)/(HCO3 + SO42−) for the thermal water samples is 0.9, almost on the 1:1 line (Figure 4d), indicating that in addition to HCO3, the SO42 ion is also involved in balancing Ca2+ and Mg2+. The dissolution of carbonate rocks with carbonic acid is accompanied by sulphuric acid. If the gypsum dissolution was the main natural process, Ca2+/SO42− would have had an equivalent ratio of 1. Instead, the samples showed an equivalent ratio of 2.1, suggesting that the excess of Ca2+ comes from carbonate dissolution, and the origin of the sulphate anion remains undetermined. The dissolution resulting from silicate weathering may have contributed to the groundwater chemistry, providing the additional source of Ca2+ and Mg2+ balanced by sulphate anions [80,86,87].
Figure 3 and Figure 4 point to (i) carbonate dissolution as the primary process driving the solute content in the thermal waters of Topusko, (ii) the interaction of the waters with Mesozoic carbonates that represent the main aquifer of THS, and (iii) the presence of limestone and dolomite rock in the system.

3.1.2. Geothermometrical Results

Table 2 shows the results obtained by the application of SiO2-quartz and SiO2-chalcedony geothermometers for assessing the aquifer equilibrium temperature of the THS. The average mass concentration of SiO2 (Table 1) is 27.8 mg/L for the Livadski izvor spring and ranges from 23.5 to 29.8 mg/L for wells TEB-1 to 4. These silica concentrations provide an aquifer equilibration temperature of 76 °C applying the SiO2-quartz and 46 °C applying SiO2-chalcedony geothermometers. The medians of the calculated temperatures are 78 °C and 47 °C, respectively.
The temperatures calculated using the chalcedony geothermometers are slightly lower than the measured temperature in the natural thermal spring and significantly lower than temperatures measured in wells. Consequently, these results are unreliable since the water temperature would have decreased during its ascent to the surface due to the cooling effect.
Therefore, quartz is the phase most likely to control the dissolved silica content in thermal waters [88]. Dissolved silica is most likely released into the water due to chert dissolution or clay mineral alteration [46,47]. The average aquifer temperature of THS is predicted to be approximately 78 °C, as several studies showed realistic results for the temperatures obtained with experimentally calibrated SiO2-quartz geothermometers [88,89].

3.2. Hydrogeological Parametrisation Results

3.2.1. TEB-1 Step-Drawdown Test

Six pumping rates (Q) ranging from 2.7 to 24.1 L/s were used, resulting in a progressive decline in water pressure from 1.4 to 1.05 bar. The density of water was calculated using its temperature, and the pressure drop was converted to drawdown (in m), yielding a maximum reduction of 3.62 m with a flow rate of 23.41 L/s. A representative pressure value for every pumping rate was calculated using the last 100 measurements in the step (Pfin in Table SA1 of Figure S1).
The linear regression between Δ/Q and Q (Table SA2 of Figure S1) resulted in an intercept of 62.78, corresponding to B + B′, and a slope of 3686.34, corresponding to C. The high coefficient of determination and the low standard errors (r2 and se, respectively, in Table SA2 of Figure S1) suggest a good fit between the regression and the data. The B + B′ and C values were inserted into (7), obtaining the theoretical drawdown vs. flow rate curve (Table SA3 in Figure S1) for the TEB-1 well:
Δ = 62 . 78 Q + 3686 . 3 Q 2
The obtained parameters were used to determine the well efficiency. The well efficiency is good (70–80%) at low flow rates, and it drastically drops to approximately 40% at higher flow rates, suggesting significant head losses in the well. Poor well efficiency is also suggested by the C value, indicating severe clogging in the well [58].
An average specific capacity was calculated from the flow rates and the drawdowns of the first to fourth testing steps since the fifth and sixth steps showed the highest well losses reflecting the lowest efficiency. The resulting transmissivity from Equations (9) and (10) was approximately 2 × 10⁻² m2/s, which corresponds to a hydraulic conductivity of approximately 2 × 10⁻⁴ m/s considering that the thickness of the aquifer in TEB-1 is 106 m [47].

3.2.2. TEB-3 Step-Drawdown Test

Four pumping rates (Q) ranging from 2.8 to 12.8 L/s were used, resulting in a progressive decline in water pressure from 0.7 to 0.66 bar. The density of water was calculated using its temperature, and the pressure drop was converted to drawdown (in m), yielding a maximum reduction of 0.35 m with a flow rate of 12.8 L/s. A representative pressure value for every pumping rate was calculated using the last 100 measurements in the step (Pfin in Table SB1 of Figure S2).
The linear regression between Δ/Q and Q (Table SB2 of Figure S2) resulted in an intercept of 9.81, corresponding to B + B′, and a slope of 1316.4, corresponding to C. The Pearson coefficient r > 0 (r = 0.84) shows a positive correlation, indicating an increase in pressure drop (Δ/Q) with an increase in the pumping rate (Q). Compared to TEB-1 results, the linear correlation between the variables is weaker. However, medium to low standard errors (se in Table SB2 of Figure S2) suggest a relatively good fit between the regression and the data. Therefore, a linear relationship between these two variables is considered. The B + B′ and C values were inserted in (7), obtaining the theoretical drawdown vs. flow rate curve (Table SB3 in Figure S2) for the TEB-3 well:
Δ = 9 . 81 Q + 1316 . 4 Q 2
The obtained parameters were used to calculate the well efficiency. The well efficiency is good (60–70%) at low flow rates, and it drops to approximately 37% at higher flow rates, suggesting significant head losses in the well.
An average specific capacity was calculated from the flow rates and the drawdowns of the first and second testing steps. The resulting transmissivity for both Equations (9) and (10) in Section 2.3 was 1.1 × 10⁻² m2/s and 1.4 × 10⁻² m2/s, respectively. However, since the stratigraphic log of the well is not available, the corresponding hydraulic conductivity was not calculated.

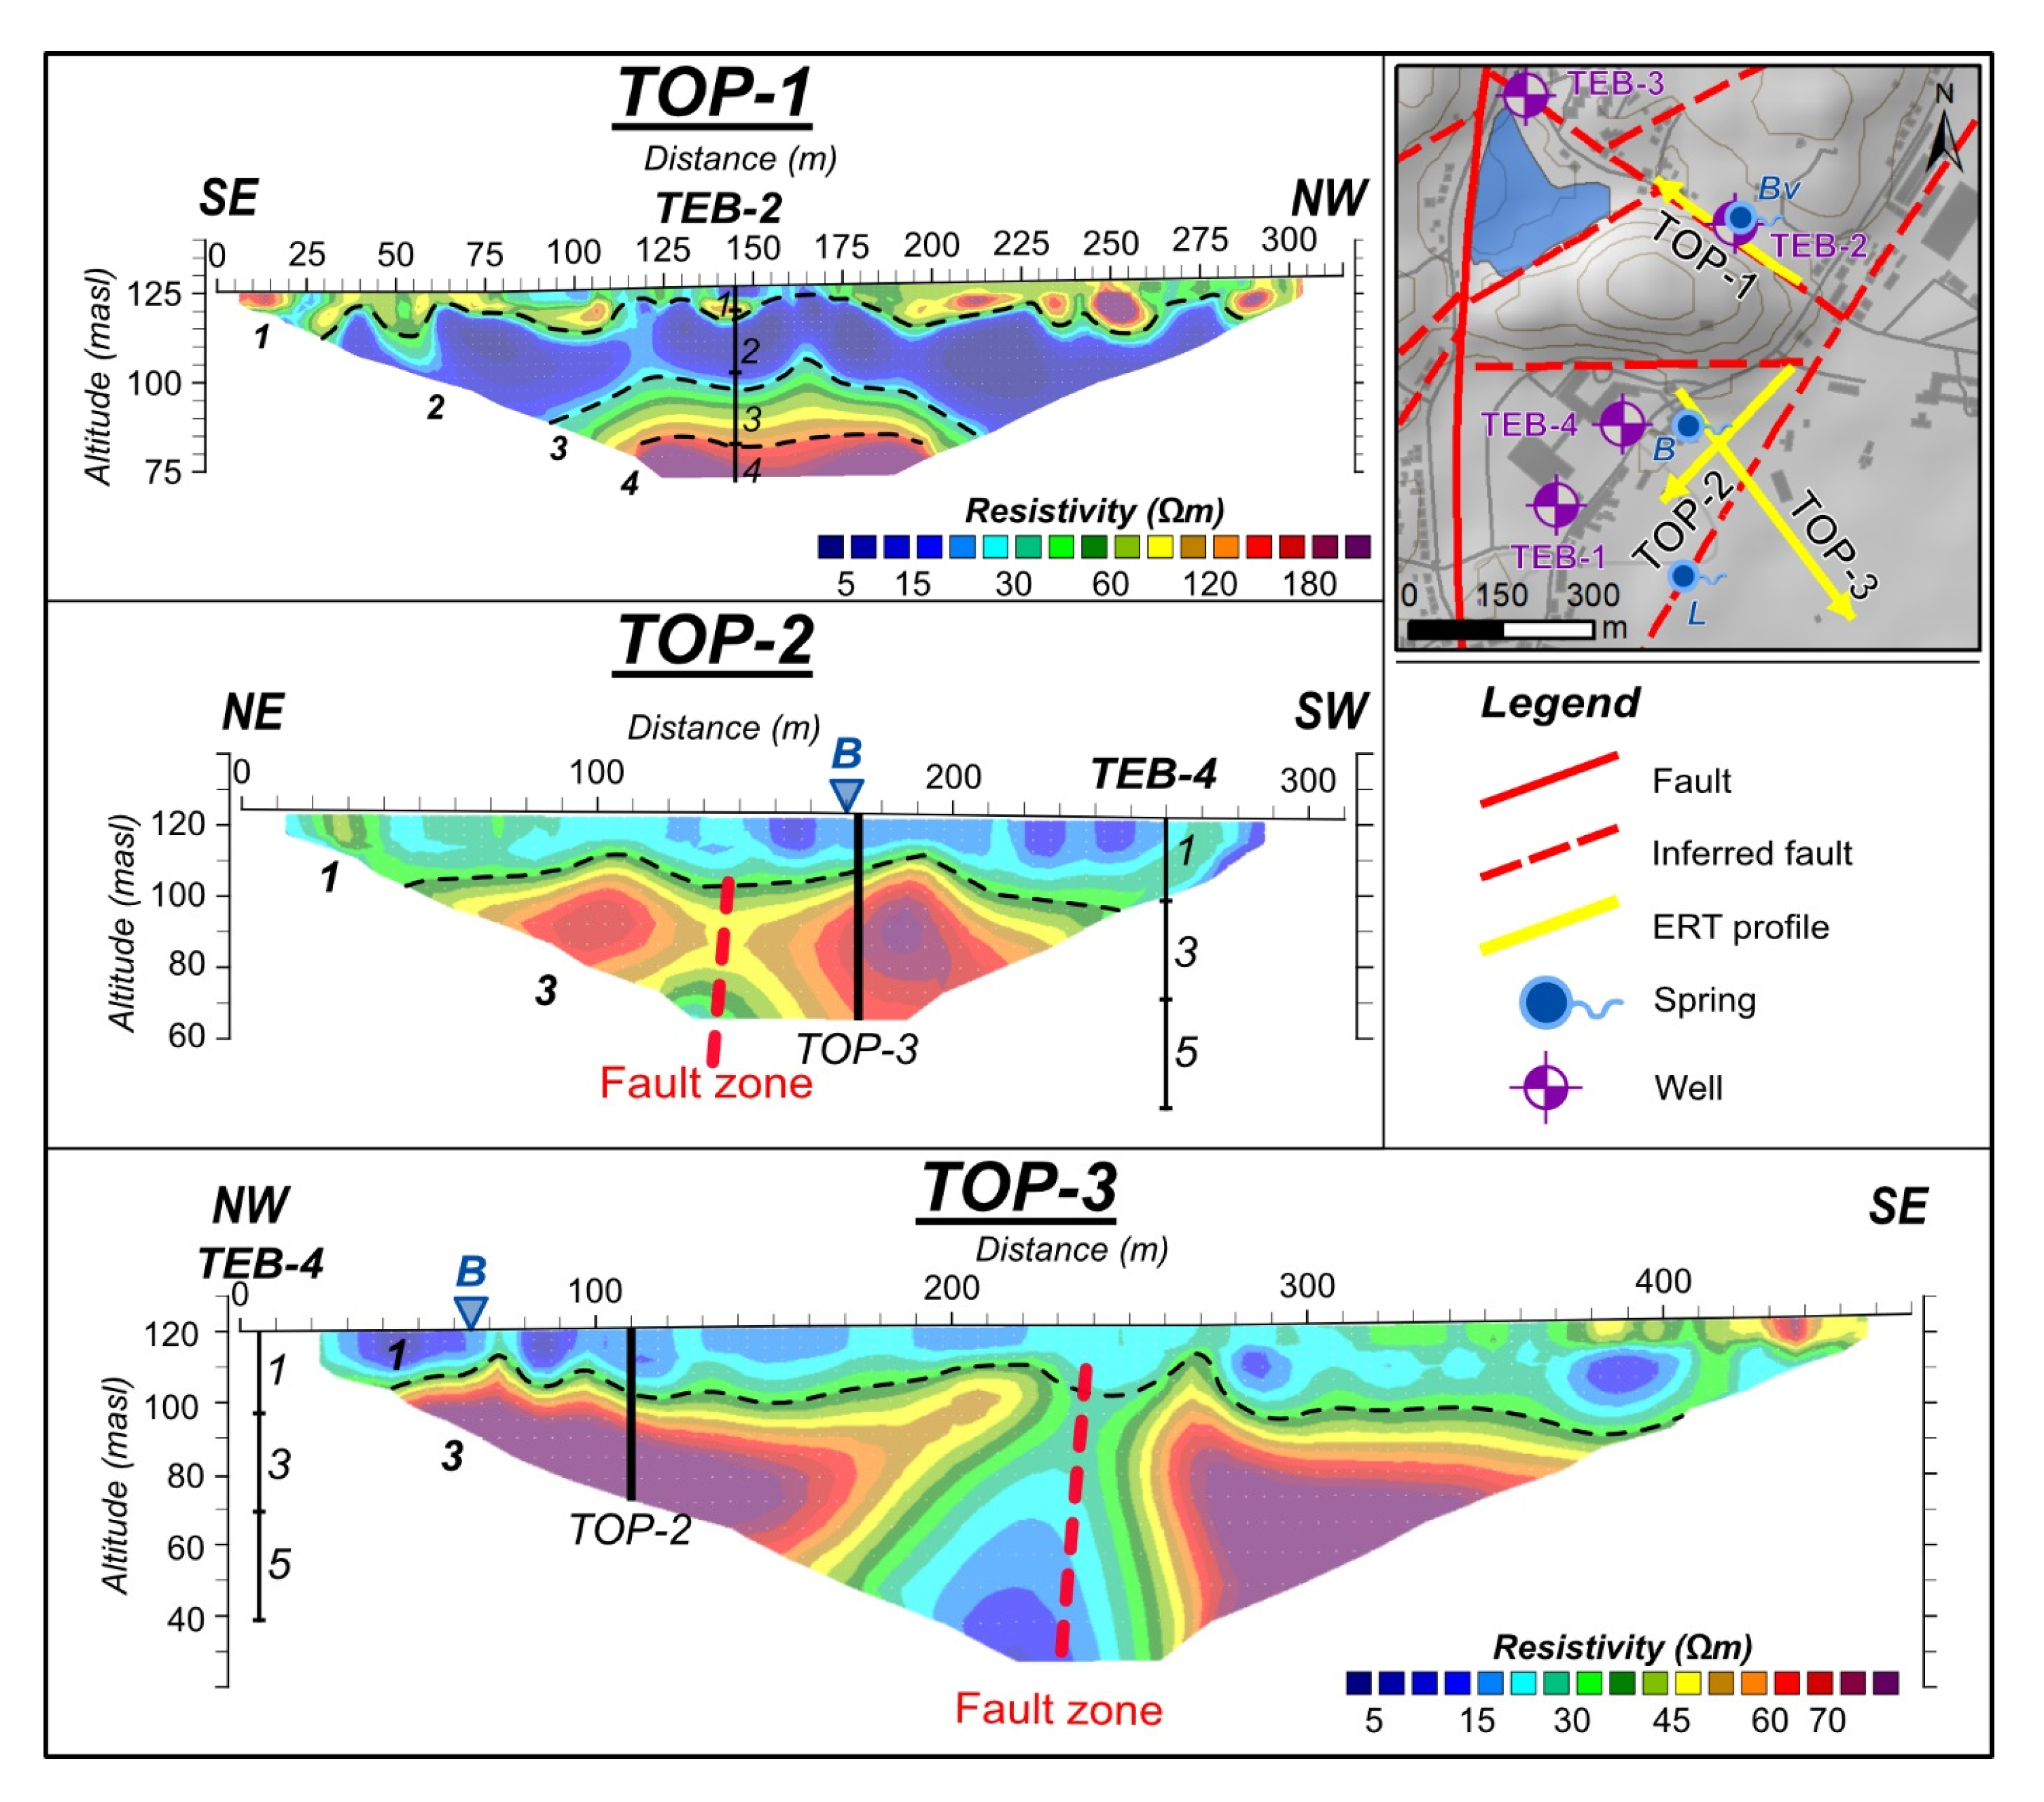
3.3. Interpretation of ERT Results

Figure 5 shows three cross-sections (TOP-1, 2, and 3) of continuous 2D resistivity models of the subsurface.
The TOP-1 profile reached an investigation depth of approximately 50 m. The data inversion resulted in an RMS error of 12.5% with resistivity values between 2 and 650 Ωm. Four layers could be distinguished based on resistivity distribution (Figure 5). The upper layer (1) has a variable thickness of 5–10 m and is characterised by resistivity values ranging from 35 to 100 Ωm. This zone contains local anomalies with both low (5–30 Ωm) and high (generally 100–150 Ωm, and up to 650 Ωm at 250 m distance) resistivity values. Considering the stratigraphic log of the TEB-2 well, this layer can be interpreted as Plio–Quaternary alluvial and proluvial deposits comprising unconsolidated sediments with variable grain sizes. The observed resistivity variations are consistent with the typical lateral heterogeneity of such deposits, with clays characterised by low and sands by high resistivities. The second layer (2) has a relatively constant thickness of approximately 20 m and shows lower resistivity values ranging from 5 to 25 Ωm. According to the stratigraphic log of TEB-2, this layer can be interpreted as Miocene marls, which is consistent with the observed resistivity range. The third layer (3) has a constant thickness of 35 m and resistivities ranging from 80 to 140 Ωm, which are consistent with the values expected for Miocene sandstones saturated with thermal water as detected in the TEB-2. Below layer 3 follows a layer characterised by resistivity values of 150 to 300 Ωm (4). According to the stratigraphic log of the TEB-2, this layer corresponds to Miocene interbedded sandstones and marls.
The profiles TOP-2 and TOP-3 reached an investigation depth of approximately 60 and 80 m, respectively, and the data inversion resulted in an RMS error of 6.2% and 7.6%, respectively. Their interpretations are comparable because they show similar resistivity distributions (Figure 5). Resistivity inversion values range from 5 to 110 Ωm, and two layers could be distinguished. The upper layer (1) shows a variable thickness from 10 to 25 m and is characterised by resistivity values generally from 5 to 45 Ωm. This layer was interpreted as Plio–Quaternary deposits based on the stratigraphic log of the TEB-4 well. The resistivities of these deposits generally correspond to the values observed in the TOP-1 profile. The lower layer (3) shows higher resistivities ranging from 60 to 110 Ωm. Based on the stratigraphic log of TEB-4, the resistivities of this layer can be linked to Miocene sandstone deposits. Similarly, the values of this layer can be correlated with the resistivity values of layer 3 in the TOP-1 profile. Furthermore, the TOP-2 and TOP-3 profiles show a sudden decrease in the resistivity within layer 3. The low resistivity anomaly is located at approximately 140 m in TOP-2 with values from 30 to 50 Ωm and at approximately 240 m in TOP-3 with values from 5 to 30 Ωm. These anomalies can be interpreted as highly permeable fault damage zones, which enable the upwelling of thermal waters. Due to its high secondary porosity, the fault zone could store a higher volume of thermal water, resulting in lower resistivity values than in the unfractured surrounding sandstones.

4. Discussion and Conclusions

In Topusko town, thermal waters have been used for heating, medicinal, and recreational purposes since the 1980s. However, detailed research on the processes driving this hydrothermal system has never been conducted. Multidisciplinary research (i.e., hydrogeochemistry, hydrogeology, and geophysics) was conducted in Topusko to improve the existing local conceptual model.
According to [18], the first step in geothermal exploration is a geochemical characterisation of thermal water. Thermal springs in Topusko show a discharge temperature of 50 °C (Livadski izvor), while nearby exploitation wells produce water of an average temperature of 65 °C and a near-neutral pH. Thermal water major ions content shows Ca-HCO3 hydrochemical facies and indicates the origin of all samples from the same aquifer. According to [90], thermal waters have medium to low mineralisation [52,91], corroborating the precipitation recharge-dominated groundwater system. The major anion and cation composition does not show significant changes over time, which suggests a large and stable hydrothermal system. Carbonate dissolution is the primary process driving the solute content in the thermal water, which suggests the interaction of the water with Mesozoic carbonates and supports the assumption that they represent the main geothermal aquifer of THS. The Ca2+/Mg2+ ratio shows the dominance of Ca2+ in all samples, which would be 1 in a system with a predominance of dolomite formations, as proposed by [34]. The results of this research (Figure 4) indicate a water–rock interaction with both limestones and dolomites, suggesting that both lithologies are present in the system. The premise by [34] was probably based on the observed dolomite outcrops W of Petrova gora nappe.
Hydrochemical data were used to assess the aquifer equilibrium temperature. A minimum groundwater circulation depth [17] can be calculated using the surface temperature of the water as the ratio between (i) the temperature difference of measured spring or well temperature and the local average annual surface temperature (°C) and (ii) the local geothermal heat gradient (°C/km). This calculation is based on the assumption that cooling is negligible, as occurring in artesian aquifers or springs/wells with high flow rates. The minimum groundwater circulation depth for Topusko water was calculated as approximately 1.1 km. Furthermore, the aquifer temperature was estimated using a classical chemical SiO2-quartz geothermometer. The results pointed to an aquifer equilibrium temperature of 78 °C, suggesting a circulation depth of 2 km and considering a geothermal gradient of 35–40 °C/km [92]. The main limitation of hydrochemical investigations was that recent data are lacking and it was necessary to rely on older existing data. Since the 1980s, analytical techniques have been improved in general, and many other parameters are now routinely measured, which was not the case in those times.
Electrical resistivity tomography (ERT) survey was conducted, identifying fault damage zones in the spring area, which provide a preferential pathway for groundwater upwelling to the surface from a confined geothermal aquifer [12] since no significant flow is expected through confining units. In addition, the geographical location of the springs themselves may indicate the fault occurrence below the surface. The correlation between the observed resistivity and lithology, together with nearby stratigraphic well logs, helped to refine the conceptual model of the local geological setting.
Step-drawdown tests on wells TEB-1 and 3 were performed in order to estimate a substantial hydrogeological parameter—transmissivity (T). It is approximately 2 × 10⁻² m2/s, which corresponds to a hydraulic conductivity (K) of approximately 2 × 10⁻⁴ m/s, considering that the thickness of the carbonate aquifer in TEB-1 is 106 m. The calculated hydraulic conductivity value is within the range of hydraulic conductivities for fractured carbonates commonly found in the literature [81,93].
The presented research improved the local conceptual model of THS. The main findings point to (i) faults-driven thermal springs, (ii) the geothermal aquifer hosted in Mesozoic carbonates, comprising limestones and dolomites, (iii) the equilibrium aquifer temperature estimated at 78 °C, and (iv) the hydraulic conductivity of the geothermal aquifer in the spring area up to 2 × 10⁻⁴ m/s.
A further step would include detailing the regional conceptual model since the existence of a hydrothermal system is generally the result of a delicate balance between the flow rate, dissolution/precipitation processes, and local/regional scale structural setting. In order to use the existing thermal water resource sustainably, the functioning of the whole system, from recharge to discharge area, needs to be subjected to multidisciplinary study. Hydrothermal systems can change due to local or distant events (i.e., climate changes, earthquakes, and thermal water abstraction) that could alter the water source, the preferential flow paths, the subsurface thermal characteristics, or the permeability field in the fractured geothermal aquifer [94]. Hydrogeochemical monitoring helps to detect such changes, and it is considered one of the most effective tools to assess the response of the aquifer to production stress, including recharge and pressure drop [18]. The choice of method suitable for the disposal of utilised thermal water also depends on the quality of the thermal fluids and local hydrogeological and environmental conditions. Future research should involve monitoring the thermal waters in Topusko and the application of both chemical and isotopic analyses [11,18,89].
In addition to hydrochemical surveys, in the search and determination of the recharge area, the second step would be scanning for carbonates on the surface and conducting structural–geological research to understand the regional geological setting and possible flow directions. This will provide more evidence for the hypotheses on the recharge area of the Topusko geothermal aquifer.
Multidisciplinary research is an indispensable tool for the development and improvement of the existing conceptual model of THS. The integration of local and regional models will serve as a base for the sustainable utilisation of THS, as increasing interest in this resource is expected in the near future.

Supplementary Materials

The following supporting information can be downloaded at: https://www.mdpi.com/article/10.3390/su15065498/s1, Figure S1: Interpretation of the step-drawdown test results conducted in the TEB-1 well; Figure S2: Interpretation of the step-drawdown test results conducted in the TEB-3 well.

Author Contributions

Conceptualisation and methodology, M.P. (Marco Pola), S.B. and M.P. (Mirja Pavić); data collection by all authors; data curation, M.P. (Mirja Pavić), M.P. (Marco Pola), M.B. and I.K.; software and formal analysis, I.K., M.P. (Marco Pola), M.P. (Mirja Pavić), K.U. and M.B.; writing—original draft preparation, M.P. (Mirja Pavić); writing—review and editing, M.P. (Marco Pola), M.P. (Mirja Pavić) and S.B.; visualisation, M.P. (Marco Pola), M.P. (Mirja Pavić) and I.K.; supervision, S.B.; research design and funding acquisition, S.B.; project administration, M.P. (Mirja Pavić) and S.B. All authors have read and agreed to the published version of the manuscript.

Funding

This research was funded by Croatian Science Foundation (HRZZ), grant number UIP-2019-04-1218.

Institutional Review Board Statement

Not applicable.

Informed Consent Statement

Not applicable.

Data Availability Statement

Data available on request from the authors.

Acknowledgments

The authors would like to thank Lječilište Topusko and Top-Terme d.o.o. for cordial cooperation, logistic help on-site, and sharing of existing materials (unpublished reports from their archives).

Conflicts of Interest

The authors declare no conflict of interest.

References

  1. A European Green Deal—European Commission. Available online: europhttps://commission.europa.eu/strategy-and-policy/priorities-2019-2024/european-green-deal_ena.eu (accessed on 16 January 2022).
  2. CORDIS-EU Research Results—Supporting the Development of Europe’s Geothermal Energy Sector. Available online: https://cordis.europa.eu/article/id/442048-supporting-the-development-of-europe-s-geothermal-energy-sector (accessed on 16 January 2022).
  3. Aliyu, S.; Garba, M.M. Review on current global geothermal energy potentials and the future prospects. Int. J. Adv. Sci. Eng. 2019, 5, 10-31695. [Google Scholar] [CrossRef]
  4. Roscini, A.V.; Rapf, O.; Kockat, J.; Milne, C.; Jeffries, B.; D’angiolella, R. On the Way to a Climate-Neutral Europe Contributions from the Building Sector to A Strengthened 2030 Climate Target; Buildings Performance Institute Europe (BPIE): Brussels, Belgium, 2020; Available online: www.bpie.eu (accessed on 14 November 2022).
  5. Avci, A.C.; Kaygusuz, O.; Kaygusuz, K. Geothermal energy for sustainable development. J. Eng. Appl. Sci. 2020, 9, 1414–1426. [Google Scholar]
  6. Gupta, H.; Sukanta, R. Geothermal systems and resources. In Geothermal Energy; Gupta, H., Sukanta, R., Eds.; Elsevier: Amsterdam, The Netherlands, 2007; pp. 49–59. [Google Scholar] [CrossRef]
  7. Muffler, L.P.J.; Cataldi, R. Methods for regional assessment of geothermal resources. Geothermics 1978, 7, 53–89. [Google Scholar] [CrossRef] [Green Version]
  8. Moeck, I.S. Catalog of geothermal play types based on geologic controls. Renew. Sustain. Energy Rev. 2014, 37, 867–882. [Google Scholar] [CrossRef] [Green Version]
  9. Zarrouk, S.J.; McLean, K. Chapter 2—Geothermal systems. In Geothermal Well Test Analysis; Zarrouk, S.J., McLean, K., Eds.; Academic Press: Cambridge, MA, USA, 2019; pp. 13–38. [Google Scholar] [CrossRef]
  10. Blair, P.D. Geothermal Resources and Technology: Introduction. In Mechanical Engineers’ Handbook, 4th ed.; Kutz, M., Ed.; Energy and Power; John Wiley & Sons, Inc.: Hoboken, NJ, USA, 2014; Volume 4, pp. 1–17. [Google Scholar] [CrossRef]
  11. Hochstein, M.P. Classification and assessment of geothermal resources. In Small Geothermal Resources—A Guide to Development and Utilization; Dickson, M.H., Fanelli, M., Eds.; UNITAR/UNDP Centre for Small Energy Resources: Rome, Italy, 1990; pp. 31–59. [Google Scholar]
  12. Keegan-Treloar, R.; Irvine, D.J.; Solórzano-Rivas, S.C.; Werner, A.D.; Banks, E.W.; Currell, M.J. Fault-controlled springs: A review. Earth-Sci. Rev. 2022, 230, 104058. [Google Scholar] [CrossRef]
  13. Bowen, R. Geothermal Exploration. In Geothermal Resources, 2nd ed.; Springer: Dordrecht, The Netherlands, 1989; pp. 117–158. [Google Scholar] [CrossRef]
  14. Torresan, F.; Piccinini, L.; Cacace, M.; Pola, M.; Zampieri, D.; Fabbri, P. Numerical modeling as a tool for evaluating the renewability of geothermal resources: The case study of the Euganean Geothermal System (NE Italy). Env. Geochem. Health 2022, 44, 2135–2162. [Google Scholar] [CrossRef]
  15. Pola, M.; Cacace, M.; Fabbri, P.; Piccinini, L.; Zampieri, D.; Torresan, F. Fault control on a thermal anomaly: Conceptual and numerical modeling of a low-temperature geothermal system in the Southern Alps foreland basin (NE Italy). J. Geophys. Res. Solid Earth 2020, 125, e2019JB017394. [Google Scholar] [CrossRef]
  16. Pastorelli, S.; Marini, L.; Hunziker, J.C. Water chemistry and isotope composition of the Acquarossa thermal system, Ticino, Switzerland. Geothermics 1999, 28, 75–93. [Google Scholar] [CrossRef]
  17. Mazor, E. Chemical and Isotopic Groundwater Hydrology, 3rd ed.; Marcel Dekker: New York, NY, USA, 2004; pp. 13–179. [Google Scholar]
  18. D’Amore, F.; Arnórsson, S. Geothermometry. In Isotopic and Chemical Techniques in Geothermal Exploration, Development and Use; Arnórsson, S., Ed.; International Atomic Energy Agency: Vienna, Austria, 2000. [Google Scholar]
  19. Bruhn, D.; Manzella, A.; Vuataz, F.; Faulds, J.; Moeck, I.; Erbas, K. Exploration Methods. In Geothermal Energy Systems; Wiley-VCH Verlag GmbH & Co. KGaA: Weinheim, Germany, 2010; pp. 37–112. ISBN 9783527408313. [Google Scholar]
  20. Hasan, M.; Shang, Y.; Meng, H.; Shao, P.; Yi, X. Application of electrical resistivity tomography (ERT) for rock mass quality evaluation. Sci. Rep. 2021, 11, 23683. [Google Scholar] [CrossRef]
  21. Nabi, A.; Liu, X.; Gong, Z.; Ali, A. Electrical resistivity imaging of active faults in palaeoseismology: Case studies from Karachi Arc, southern Kirthar Fold Belt, Pakistan. NRIAG J. Astron. Geophys. 2020, 9, 116–128. [Google Scholar] [CrossRef] [Green Version]
  22. Borović, S.; Marković, I. Utilization and tourism valorisation of geothermal waters in Croatia. Renew. Sustain. Energy Rev. 2015, 44, 52–63. [Google Scholar] [CrossRef]
  23. Horváth, F.; Musitz, B.; Balázs, A.; Végh, A.; Uhrin, A.; Nádor, A.; Koroknai, B.; Pap, N.; Tóth, T.; Wórum, G. Evolution of the Pannonian basin and its geothermal resources. Geothermics 2015, 53, 328–352. [Google Scholar] [CrossRef]
  24. Borović, S.; Marković, T.; Larva, O.; Brkić, Ž.; Mraz, V. Mineral and Thermal Waters in the Croatian Part of the Pannonian Basin. In Mineral and Thermal Waters of Southeastern Europe; Papić, P., Ed.; Springer: Cham, Switzerland, 2016; pp. 31–45. [Google Scholar] [CrossRef]
  25. Čučković, L.; Ožanić, M.; Abramović, M. Topusko: Monografija; Aura: Sisak, Croatia, 2009. (In Croatian) [Google Scholar]
  26. Državni Zavod za Statistiku—Popis ’21. Available online: https://popis2021.hr (accessed on 22 November 2022). (In Croatian).
  27. Zaninović, K.; Gajić-Čapka, M.; Perčec Tadić, M.; Vučetić, M.; Milković, J.; Bajić, A.; Cindrić, K.; Cvitan, L.; Katušin, Z.; Kaučić, D. Klimatski atlas Hrvatske/Climate atlas of Croatia 1961–1990, 1971–2000; Državni Hidrometeorološki Zavod: Zagreb, Croatia, 2008; (In Croatian and English). [Google Scholar]
  28. DHMZ—Državni Hidrometeorološki Zavod. Available online: https://meteo.hr/klima.php?section=klima_podaci&param=k2_1 (accessed on 18 January 2021).
  29. Schmid, S.M.; Fügenschuh, B.; Kissling, E.; Schuster, R. Tectonic map and overall architecture of the Alpine orogen. Eclogae Geol. Helvetiae. 2004, 7, 93–117. [Google Scholar] [CrossRef]
  30. Schmid, S.M.; Bernoulli, D.; Fügenschuh, B.; Matenco, L.; Schefer, S.; Schuster, R.; Tischler, M.; Ustaszewski, K. The Alpine-Carpathian-Dinaridic orogenic system: Correlation and evolution of tectonic units. Swiss J. Geosci. 2008, 101, 139–183. [Google Scholar] [CrossRef] [Green Version]
  31. Handy, M.R.M.; Schmid, S.; Bousquet, R.; Kissling, E.; Bernoulli, D. Reconciling plate-tectonic reconstructions of Alpine Tethys with the geological–geophysical record of spreading and subduction in the Alps. Earth-Sci. Rev. 2010, 102, 121–158. [Google Scholar] [CrossRef]
  32. Vlahović, I.; Tišljar, J.; Velić, I.; Matičec, D. Evolution of the Adriatic Carbonate Platform: Palaeogeography, main events and depositional dynamics. Palaeogeogr. Palaeoclimatol. Palaeoecol. 2005, 220, 333–360. [Google Scholar] [CrossRef]
  33. Marković, T.; Borović, S.; Larva, O. Geochemical characteristics of thermal waters of Hrvatsko zagorje. Geol. Croat. 2015, 68, 67–77. [Google Scholar] [CrossRef]
  34. Šimunić, A. Topusko. In Mineral and Thermal Waters of the Republic of Croatia; Šimunić, A., Hećimović, I., Eds.; Croatian Geological Survey: Zagreb, Croatia, 2008; pp. 185–195. (In Croatian) [Google Scholar]
  35. Korolija, B.; Živaljević, T.; Šimunić, A. Osnovna geološka Karta SFRJ 1:100 000, List Slunj. L 33-104 [Basic Geological Map of SFRY 1:100000, Geology of the Slunj sheet L33-104]; Institut za geološka istraživanja: Zagreb, Croatia; Geološki zavod: Sarajevo, Bosnia and Herzegovina; Savezni Geološki Zavod: Beograd, Yugoslavia, 1980. (In Croatian) [Google Scholar]
  36. Bahun, S.; Raljević, B. Mineralna, Termalna i Ljekovita Vrela [Mineral and Thermal Springs]; unpublished report; Institute for Geological Research: Zagreb, Yugoslavia, 1969; p. 4769/5. (In Croatian) [Google Scholar]
  37. INA-Projekt Zagreb. Elaborat o Rezervama i Bilanci Termalnih Voda u Topuskom [Report on the Reserves and Mass Balance of Thermal Water in Topusko]; unpublished report; INA-Projekt, OOUR Kompleksna geološka istraživanja: Zagreb, Yugoslavia, 1984. (In Croatian) [Google Scholar]
  38. Čubranić, A. Osmatranje Termalnih Voda u Topuskom [Monitoring of Thermal Waters in Topusko]; unpublished report; INA-Projekt, OOUR Kompleksna Geološka Istraživanja: Zagreb, Croatia, 1984. (In Croatian) [Google Scholar]
  39. Šegotić, B.; Šmit, I. Studija Optimirane Energetske Učinkovitosti Korištenja Geotermalnih Voda [Study of Optimized Energy Efficiency of Geothermal Water Use]; unpublished report; Termoinženjering-projektiranje: Zagreb, Croatia, 2007. (In Croatian) [Google Scholar]
  40. Korolija, B.; Živaljević, T.; Šimunić, A. Osnovna geološka Karta SFRJ. Tumač za list Slunj [Basic Geological Map of SFRY 1:100000, Guide for the Slunj Sheet L33-104]; Institut za geološka istraživanja: Zagreb, Croatia; Geološki zavod: Sarajevo, Bosnia and Herzegovina; Savezni Geološki Zavod: Beograd, Yugoslavia, 1980. (In Croatian) [Google Scholar]
  41. Blake, S.; Henry, T.; Murray, J.; Flood, R.; Muller, M.R.; Jones, A.G.; Rath, V. Compositional multivariate statistical analysis of thermal groundwater provenance: A hydrogeochemical case study from Ireland. Appl. Geochem. 2016, 75, 171–188. [Google Scholar] [CrossRef] [Green Version]
  42. Verma, S.P.; Pandarinath, K.; Santoyo, E. SolGeo: A new computer program for solute geothermometers and its application to Mexican geothermal fields. Geothermics 2008, 37, 597–621. [Google Scholar] [CrossRef]
  43. Pola, M.; Fabbri, P.; Piccinini, L.; Zampieri, D. Conceptual and numerical models of a tectonically-controlled geothermal system: A case study of the Euganean Geothermal System, Northern Italy. Cent. Eur. Geol. 2015, 58, 129–151. [Google Scholar] [CrossRef]
  44. Powell, T.; Cumming, W. Spreadsheets for Geothermal Water and Gas Geochemistry. In Proceedings of the Thirty-Fifth Workshop on Geothermal Reservoir Engineering, Stanford University, California, CA, USA, 1–3 February 2010. [Google Scholar]
  45. Dumančić, E.; Čubranić, A. Prijedlog Projekta Sanacije Livadskih Izvora [Project Proposal—Revitalisation of Livadski Izvori Spring]; unpublished report; INA-Projekt Zagreb: Zagreb, Yugoslavia, 1989; p. 5517. (In Croatian) [Google Scholar]
  46. Blinja, T. Izvedba Eksploatacione Bušotine TEB-4 u Topuskom [Construction of the Exploitation Well TEB-4 in Topusko]; unpublished report; INA-Projekt: Zagreb, Yugoslavia, 1986. (In Croatian) [Google Scholar]
  47. Blinja, T. Sanacioni Radovi Eksploatacionih Bušotina TEB-1 i TEB-2 u Topuskom [Revitalisation of Exploitation Wells TEB-1 and 2 in Topusko]; unpublished report; INA-Projekt, OOUR Kompleksna geološka istraživanja: Zagreb, Croatia, 1986. (In Croatian) [Google Scholar]
  48. Nevada Division of Environmental Protection (NDEP). Evaluation of Inorganic Chemical Analysis. Available online: https://ndep.nv.gov/uploads/documents/sept-2009-cation-anion-balance-guide.pdf (accessed on 22 August 2022).
  49. Appelo, C.A.J.; Postma, D. Geochemistry, Groundwater and Pollution, 2nd ed.; A.A. Balkema Publishers: Leiden, The Netherlands, 2005; pp. 17–18. [Google Scholar]
  50. Simler, R. Software Diagrammes, V6.5, Laboratoire d’Hydrologie d’Avignon; Université d’Avignon et pays du Vaucluse: Avignon, France, 2012. [Google Scholar]
  51. Piper, A.M. A Graphic Procedure in the Geochemical Interpretation of Water-Analyses. Am. Geophys. Union Trans. 1944, 25, 914–923. [Google Scholar] [CrossRef]
  52. Fetter, C.W. Applied Hydrogeology, 4th ed.; Lynch, P., Ed.; Prentice Hall: Upper Saddle River, NJ, USA, 2001. [Google Scholar]
  53. Romano, P.; Liotta, M. Using and abusing Giggenbach ternary Na-K-Mg diagram. Chem. Geol. 2020, 541, 119577. [Google Scholar] [CrossRef]
  54. Truesdell, A.H. Geochemical techniques in exploration, summary of section III. In Proceedings of the Second United Nations Symposium on the Development, Use of Geothermal Resources, San Francisco, CA, USA, 20 May 1975; pp. 3–29. [Google Scholar]
  55. Fournier, R.O. Chemical geothermometers and mixing models for geothermal systems. Geothermics 1977, 5, 41–50. [Google Scholar] [CrossRef]
  56. Michard, G. Gothermométres Chimiques. Bull. BRGM 1979, 2, 183–189. [Google Scholar]
  57. Arnòrsson, S.; Gunnlaugsson, E.; Svavarsson, H. The chemistry of geothermal waters in Iceland. III. Chemical geothermometry in geothermal investigations. Geochim.Cosmochim. Acta 1983, 47, 567–577. [Google Scholar] [CrossRef]
  58. Kruseman, G.P.; De Ridder, N.A.; Verweij, J.M. Analysis and Evaluation of Pumping Test Data, 2nd ed.; International institute for land reclamation and improvement: Wageningen, The Netherlands, 1994. [Google Scholar]
  59. Rorabaugh, M.J. Graphical and theoretical analysis of step-drawdown test of artesian well. Trans. Am. Soc. Civ. Eng. 1953, 79, 1–23. [Google Scholar]
  60. Jacob, C.E. Drawdown test to determine effective radius of artesian well. Trans. Am. Soc. Civ. Eng. 1947, 112, 1047–1064. [Google Scholar] [CrossRef]
  61. Bruin, J.; Hudson, H.E. Selected Methods for Pumping Test Analysis. In Illinois State Water Survey; State Ilinois University: Springfield, IL, USA, 1955. [Google Scholar]
  62. Fabbri, P. Transmissivity in the Geothermal Euganean Basin: A Geostatistical Analysis. Ground Water 1997, 35, 881–887. [Google Scholar] [CrossRef]
  63. Verbovšek, T. Estimation of transmissivity and hydraulic conductivity from specific capacity and specific capacity index in dolomite aquifers. J. Hydrol. Eng. 2008, 13, 817–823. [Google Scholar] [CrossRef]
  64. Diaferia, I.; Barchi, M.; Loddo, M.; Schiavone, D.; Siniscalchi, A. Detailed imaging of tectonic structures by multiscale earth resistivity tomographies: The Colfiorito normal faults (Central Italy). Geophys. Res. Lett. 2006, 33, L09305. [Google Scholar] [CrossRef]
  65. Pérez-Estay, N.; Molina-Piernas, E.; Roquer, T.; Aravena, D.; Araya Vargas, J.; Morata, D.; Arancibia, G.; Valdenegro, P.; García, K.; Elizalde, D. Shallow anatomy of hydrothermal systems controlled by the Liquiñe-Ofqui Fault System and the Andean Transverse Faults: Geophysical imaging of fluid pathways and practical implications for geothermal exploration. Geothermics 2022, 104, 102435. [Google Scholar] [CrossRef]
  66. Siniscalchi, A.; Tripaldi, S.; Neri, M.; Giammanco, S.; Piscitelli, S.; Balasco, M.; Behncke, B.; Magrì, C.; Naudet, V.; Rizzo, E. Insights into fluid circulation across the Pernicana Fault (Mt. Etna, Italy) and implications for flank instability. J. Volcanol. Geotherm. Res. 2010, 193, 137–142. [Google Scholar] [CrossRef]
  67. Briški, M.; Stroj, A.; Kosović, I.; Borović, S. Characterization of Aquifers in Metamorphic Rocks by Combined Use of Electrical Resistivity Tomography and Monitoring of Spring Hydrodynamics. Geosciences 2020, 10, 137. [Google Scholar] [CrossRef] [Green Version]
  68. Giustini, F.; Brilli, M.; Carlucci, G.; Ciotoli, G.; Gaudiosi, L.; Mancini, M.; Simionato, M. Geophysical and geochemical multi-method investigations for reconstructing subsurfaces, alluvial sedimentology, and structural geology (Tiber valley, Rome). Int. J. Earth. Sci. (Geol. Rundsch.) 2022, 112, 197–216. [Google Scholar] [CrossRef]
  69. Ward, S.H. Resistivity and induced polarization methods. In Geotechnical and Environmental Geophysics; Ward, S.H., Ed.; Society of Exploration Geophysicists: Tulsa, Ok, USA, 1990; Volume I, pp. 147–190. [Google Scholar]
  70. Sharma, P.V. Environmental and Engineering Geophysics; Cambridge University Press: Cambridge, UK, 1997. [Google Scholar]
  71. Reynolds, J.M. An Introduction to Applied and Environmental Geophysics, 2nd ed.; Wiley: New York, NY, USA, 2011. [Google Scholar]
  72. Loke, M.H. Tutorial: 2-D and 3-D Electrical Imaging Surveys; Geotomo Software: Penang, Malaysia, 2020; Available online: https://www.geotomosoft.com/downloads.php (accessed on 27 February 2020).
  73. Loke, M.H.; Barker, R.D. Rapid least-squares inversion of apparent resistivity pseudosections using a quasi-Newton method. Geophys. Prospect. 1996, 44, 131–152. [Google Scholar] [CrossRef]
  74. DeGroot-Hedlin, C.; Constable, S. Occam’s inversion to generate smooth, two-dimensional models from magnetotelluric data. Geophysics 1990, 55, 1613–1624. [Google Scholar] [CrossRef] [Green Version]
  75. Sasaki, Y. Resolution of resistivity tomography inferred from numerical simulation. Geophys.Prospect. 1992, 40, 453–464. [Google Scholar] [CrossRef]
  76. Ellis, R.G.; Oldenburg, D.W. Applied geophysical inversion. Geophys. J. Int. 1994, 116, 5–11. [Google Scholar] [CrossRef] [Green Version]
  77. Ellis, R.G.; Farquharson, C.G.; Oldenburg, D.W. Approximate inverse mapping inversion of the COPROD2 data. J. Geomagn. Geoelectr. 1993, 45, 1001–1012. [Google Scholar] [CrossRef]
  78. Milenić, D.; Krunić, O.Ž.; Milankovic, D. Thermomineral waters of inner Dinarides Karst. Acta Carsologica 2012, 41, 235–252. [Google Scholar] [CrossRef] [Green Version]
  79. Freeze, R.A.; Cherry, J.A. Groundwater; Prentice Hall Inc.: Englewood Cliffs, NJ, USA, 1979; Volume 7632, p. 604. [Google Scholar]
  80. Li, Z.; Huang, T.; Ma, B.; Long, Y.; Zhang, F.; Tian, J.; Li, Y.; Pang, Z. Baseline groundwater quality before shale gas development in Xishui, Southwest China: Analyses of hydrochemistry and multiple environmental isotopes (2H, 18O, 13C, 87Sr/86Sr, 11B, and Noble Gas Isotopes). Water 2020, 12, 1741. [Google Scholar] [CrossRef]
  81. Wang, Z.; Torres, M.; Paudel, P.; Hu, L.; Yang, G.; Chu, X. Assessing the karst groundwater quality and hydrogeochemical characteristics of a prominent dolomite aquifer in Guizhou, China. Water 2020, 12, 2584. [Google Scholar] [CrossRef]
  82. Patekar, M.; Bašić, M.; Pola, M.; Kosović, I.; Terzić, J.; Lucca, A.; Mittempergher, S.; Berio, L.; Borović, S. Multidisciplinary investigations of a karst aquifer for managed aquifer recharge applications on the island of Vis (Croatia). Acque Sotter. Ital. J. Groundw. 2022, 11, 37–48. [Google Scholar] [CrossRef]
  83. Frondini, F. Geochemistry of regional aquifer systems hosted by carbonate-evaporite formations in Umbria and southern Tuscany (central Italy). Appl. Geochem. 2008, 23, 2091–2104. [Google Scholar] [CrossRef]
  84. Hilberg, S.; Schneider, J.F. The Aquifer Characteristics of the Dolomite Formation a New Approach for Providing Drinking Water in the Northern Calcareous Alps Region in Germany and Austria. Water Resour. Manag. 2011, 25, 2705–2729. [Google Scholar] [CrossRef]
  85. Fellehner, M. Der Hauptdolomit als Grundwasserspeicher in den Nördlichen Kalkalpen. Ph.D. Thesis, Philipps-Universität, Marburg, Deutschland, 30 June 2004. [Google Scholar]
  86. Li, X.; Wu, P.; Han, Z.; Zha, X.; Ye, H.; Qin, Y. Effects of mining activities on evolution of water quality of karst waters in Midwestern Guizhou, China: Evidences from hydrochemistry and isotopic composition. Environ. Sci. Pollut. Res. 2018, 25, 1220–1230. [Google Scholar] [CrossRef]
  87. Sun, C.; Wang, S.; Chen, W. Hydrochemical Characteristics and the Relationship between Surface and Groundwater in a Typical ‘Mountain–Oasis’ Ecosystem in Central Asia. Sustainability 2022, 14, 7453. [Google Scholar] [CrossRef]
  88. Blasco, M.; Auqué, L.F.; Gimeno, M.J. Geochemical evolution of thermal waters in Carbonate—Evaporitic systems: The triggering effect of halite dissolution in the dedolomitisation and albitisation processes. J. Hydrol. 2019, 570, 623–636. [Google Scholar] [CrossRef] [Green Version]
  89. Blasco, M.; Gimeno, M.J.; Auqué, L.F. Low temperature geothermal systems in carbonate-evaporitic rocks: Mineral equilibria assumptions and geothermometrical calculations. Insights from the Arnedillo thermal waters (Spain). Sci. Total Environ. 2018, 615, 526–539. [Google Scholar] [CrossRef]
  90. Hiscock, K.M.; Bense, V.F. Hydrogeology: Principles and Practice, 2nd ed.; John Wiley & Sons Ltd: Hoboken, NY, USA, 2014. [Google Scholar]
  91. Halle, R. Kemizam i Obradba Vode [Water Chemistry and Treatment]; Faculty of Mining, Geology and Petroleum Engineering, University of Zagreb: Zagreb, Croatia, 2004. (In Croatian) [Google Scholar]
  92. Macenić, M.; Kurevija, T.; Medved, I. Novel geothermal gradient map of the Croatian part of the Pannonian Basin System based on data interpretation from 154 deep exploration wells. Renew. Sustain. Energy Rev. 2020, 132, 110069. [Google Scholar] [CrossRef]
  93. Domenico, P.A.; Schwartz, F.W. Physical and Chemical Hydrogeology; John Wiley & Sons: New York, NY, USA, 1990. [Google Scholar]
  94. Heasler, H.; Jaworowski, C.; Foley, D. Geothermal systems and monitoring hydrothermal features. In Geological Monitoring; Young, R., Norby, L., Eds.; Geological Society of America: Boulder, CO, USA, 2009; pp. 105–140. [Google Scholar] [CrossRef]
Figure 1. Geographical setting of the study area. The division between the major tectonic units of the External and Internal Dinarides (W and E, respectively) is simplified from [29,30,31]. Coordinate system: EPSG 3765.
Sustainability 15 05498 g001
Figure 2. Geological map of the study area modified from [34,35] with the positions of natural thermal springs and exploitation and exploratory wells in Topusko town.
Sustainability 15 05498 g002
Figure 3. Piper diagram of the examined samples.
Sustainability 15 05498 g003
Figure 4. Scatter plots of major ions. (a) Ca2+/(Ca2+ + Mg2+) vs. SO4/(SO4 + HCO3¯) diagram; (b) Ca2+/Mg2+ diagram with different Ca2+/Mg2+ ratios; (c) (Ca2+ + Mg2+)/(HCO3¯) diagram; (d) (Ca2+ + Mg2+)/(HCO3¯ + SO4).
Sustainability 15 05498 g004
Figure 5. Inverted resistivity profiles TOP-1, 2 and 3 and the locations of ERT profiles within the study area. TOP-2 and 3 share the same resistivity values displayed in the legend. Locations of natural thermal springs are also presented: B is Blatne kupelji spring, Bv is Bistro vrelo spring, and L is Livadski izvor spring.
Sustainability 15 05498 g005
Table 1. Physical and chemical parameters of sampled thermal waters.
NameDepthDateTpHCa2+Mg2+Na+K+HCO3SO42−ClTDS*SiO2
m°C-mg/L
Livadski izvor0190449.5-89.3919.7418.2712.69270.4108.1019.4058629.96
12/1988507.085.2017.5015.207.20244.489.2021.3052125.6
TEB-12435/1983667.287.1018.2023.309.30268.5103.3022.0058131.0
7/198364.57.6588.0018.2017.206.00240.0107.0021.2055030.0
9/1983657.688.0018.2024.004.00238.0110.0022.7055430.5
11/1983667.486.2019.4016.809.80262.2100.0020.0056632.0
2/1984657.395.9011.2818.1011.30268.495.6321.9456425.8
10/1985657.784.2017.4015.3010.60238.0104.222.5054229.5
TEB-21505/1983677.190.2017.6018.4011.10259.396.0022.3055324.0
7/1983667.190.2018.2022.0010.10265.4104.0021.5057930.0
9/1983677.486.0017.6022.006.00231.0105.7022.5054030.5
11/1983677.286.0018.2018.7011.10250.2102.8023.0056031.0
10/1985687.985.1017.4015.809.20244.1104.523.3054728.9
TEB-31635/198366788.2018.8018.307.80262.4100.4021.9055624.0
7/1983627.6586.2018.2017.006.00244.0100.8020.9053929.0
9/1983637.696.0018.8018.003.90286.896.5022.7058828.5
11/1983667.388.2017.6018.4010.00250.2108.6022.0056632.0
2/1984667.2585.8816.4924.5013.20268.494.4121.8556726.3
12/1988-7.288.2019.6012.8011.40228.898.7639.0056330.80
TEB-480.811/1985647.184.2016.3015.4215.60247.10100.4022.1054423.5
TP-5501978367.6584.1615.8014.0020.80268.083.1019.7054323.4
TP-4505/1983527.287.1018.2023.108.26280.6101.0021.6057823.6
7/1983527.6584.2015.8016.908.20232.088.5021.0050521.0
9/1983547.192.0017.0019.004.00259.390.0022.9054928.0
11/1983527.386.2016.8018.8011.60268.589.0022.6055626.5
TP-81705/1983587.1590.2018.2016.1011.40265.0107.8022.3057628.0
7/1983537.887.2017.0017.809.00238.0100.0020.9052824.0
9/198353790.2018.2018.0010.70259.0102.7022.1056628.0
11/1983547.494.2018.2015.7012.70268.5102.8023.0058129.0
2/1984487.387.3119.9624.6011.30268.4116.4020.7159226.9
Charge balance errors are ±2%. TDS* was calculated in Diagrammes software, V6.5 [50].
Table 2. Temperatures (°C) calculated by applying experimentally calibrated SiO2-quartz and SiO2-chalcedony geothermometers for the Topusko thermal water samples.
NameTruesdell (1976) [54]Fournier (1977) [55]Michard (1979) [56]Fournier (1977) [55]Arnòrsson et al. (1983) [57]
SiO2-QuartzSiO2-Chalcedony
Livadski izvor7676784548
TEB-17979784851
TEB-27878804649
TEB-37777784649
TEB-47070713841
Disclaimer/Publisher’s Note: The statements, opinions and data contained in all publications are solely those of the individual author(s) and contributor(s) and not of MDPI and/or the editor(s). MDPI and/or the editor(s) disclaim responsibility for any injury to people or property resulting from any ideas, methods, instructions or products referred to in the content.

