Article

The Development of Novel Ganoderic-Acid-Encapsulated Nanodispersions Using the Combination of Ultrasonic Cavitation and Solvent Evaporation through Response Surface Optimization

1
School of Energy and Chemical Engineering, Xiamen University Malaysia, Sepang 43900, Malaysia
2
Chemical Engineering Discipline, School of Engineering, Monash University Malaysia, Bandar Sunway 47500, Malaysia
3
Ganofarm R&D Sdn Bhd, Unit 01-01, Skypod Square, Persiaran Puchong Jaya, Puchong 47100, Malaysia
4
Department of Chemical and Environmental Engineering, University of Nottingham Ningbo China, Ningbo 315100, China
5
Whole Grain Food Engineering Research Center, College of Food Science and Technology, Nanjing Agricultural University, Nanjing 210095, China
6
Petroleum and Chemical Engineering, Faculty of Engineering, Universiti Teknologi Brunei, Bandar Seri Begawan BE1410, Brunei
*
Author to whom correspondence should be addressed.
These authors contributed equally to this work.
Sustainability 2023, 15(13), 9929; https://doi.org/10.3390/su15139929
Submission received: 4 April 2023 / Revised: 11 June 2023 / Accepted: 15 June 2023 / Published: 21 June 2023
(This article belongs to the Special Issue Innovative Detection Technology to Meet Food and Fuel Needs)

Abstract

:
Ganoderic Acid (GA), a major bioactive compound isolated from the East Asian medicinal mushroom Ganoderma tsugae, is traditionally believed to have significant medicinal properties. GA is poorly soluble in water, which poses several challenges in terms of its formulation. In this study, Ganoderma tsugae extracts obtained through ethanol extraction were encapsulated in nanodispersions via ultrasonic cavitation and solvent evaporation to increase their bioavailability. The preparation route was thoroughly analyzed using Response Surface Methodology (RSM) to determine the interactions between the variables. Based on the results, the Hydrophilic–Lipophilic Balance (HLB) and the evaporation temperature significantly influenced the resulting particle size. In the optimized nanodispersions, GA was incorporated into a hydrophobic core with a particle size no greater than 200 nm and a very narrow particle distribution (namely, a polydispersity index of 0.289). Due to the high negative zeta potential (−45.9 mV), a very slow particle growth rate of 0.239% over short-term storage (14 days) was achieved. In addition, the zeta average remained virtually unchanged for 14 days at room temperature in solutions at different pH levels. In summary, this paper provides the first-ever demonstration that ultrasound cavitation in conjunction with solvent evaporation can be used to generate GA nanodispersions.

1. Introduction

The medicinal fungi Ganoderma tsugae (Figure 1) has been a folk remedy in China, Japan, and other East Asian countries for centuries. In Shen Nong’s Herbal Classic, which was written as early as 100 B.C, Ganoderma is described as possessing a “vital energy”. Furthermore, modern research on Ganoderma has only increased in the Western hemisphere in recent years. In addition to polysaccharides and triterpenes/triterpenoids, Ganoderma contains amino acids, nucleosides, and other bioactive ingredients [1,2]. In addition to the main bioactive ingredients isolated from Ganoderma tsugae, ganoderic acids (GAs) have been demonstrated to be effective either in preventing or treating various life-threatening diseases, including hepatitis B [3], hypertension [4], tumors [1], inflammation [5,6], HIV [7], and cancer [8].
Due to GA’s extremely low solubility in water, its limited bioavailability restricts its application in vivo. Before administering GA, it is generally necessary to dissolve it in a solvent. It is not recommended that the drug be administered intravenously due to the severe pain induced during injection [9] and the possibility of hemolysis [10]. In recent years, new formulations have resulted in improvements in the bioavailability of GA. Nanocarriers have been developed to increase the absorption of hydrophobic compounds, which include nano-emulsions [11,12], polymeric nanoparticles [13], and liposomes [14,15]. Even so, there remains a great deal of uncertainty regarding the method of preparing GA for nanoformulation.
Solvent extraction can be used to isolate GAs from the fruiting bodies of Ganoderma. By using methanol as a solvent, GAs have been separated from Ganoderma lucidum spores, which inhibit HIV-1 protease [16] and exhibit cytotoxicity against Meth-A and LLC tumor cells [17]. Similarly, Chin et al. [17] have developed crude GA extraction techniques. The researchers studied the effects of four drying techniques, namely, freeze-drying, convective hot air drying, vacuum drying, and heat pump drying, on fruiting bodies weighing an average of 36 ± 0.1 g. Many of the active ingredients of Ganoderma lucidum can be preserved when vacuum-dried; however, the drying process takes longer than usual. Using a heat pump requires the shortest total drying time while achieving a relatively high concentration of GAs and water-soluble polysaccharides.
Tan and Nakajima [18,19] produced β-carotene nanodispersions via emulsification and evaporation while employing high-pressure homogenization; it was noted that the process conditions, such as the homogenization pressure and cycles, could greatly influence particle size and particle distribution. As a result of a high homogenization pressure, emulsification was achieved efficiently, and the resulting particles were smaller. Following this exploration, Tan and his group tested the synthesis of α-Tocopherol nanodispersions [20], Astaxanthin nanodispersions [21], and Phytosterol nanodispersions [22] using high-pressure homogenization. As an important aspect of solvent removal, the evaporator temperature influences the precipitation or recrystallization rate of hydrophobic drugs. Particle size and shape are significantly affected when the temperature gradient governs the precipitation or recrystallization rate. To overcome insolubility, other methods for producing nanodispersions that exhibit properties similar to those of solutions have been reported [23,24,25]. The complexity of the processing conditions and the inability to achieve long-term physical stability, however, limited their feasibility. In this context, a first-ever attempt has been made to examine the formulation of a GA nanodispersion, aiming to establish an efficient and reproducible method. There are several advantages to the proposed route over conventional protocols, including the possibility of reverse microemulsion template synthesis and conventional emulsification evaporation. In conventional emulsification methods, a toxic solvent (e.g., hexane or chloroform) is always used, which results in low yields when a nanoprecipitation-reverse microemulsion template synthesis method is used. Through nanoemulsification using ultrasonic cavitation, crude GA was encapsulated. GA nanodispersions can also be generated by evaporating the solvent at reduced pressure. When ensuring particle stability, it is important to consider the rheological behavior of a solid nanodispersion. There is a straightforward interaction between solid nanoparticles. The primary driving force behind agglomeration is the attraction and repulsion between particles. Other successful approaches include the use of electrostatic surfactants or freeze-drying as methods for stabilizing formulations.
A modified protocol was developed to prepare GA-loaded nanodispersions, as reported in the studies by Tan and Nakajima [18,19]. Using Response Surface Methodology (RSM), this process was then optimized. In several engineering applications, RSM has been demonstrated to be an effective optimization tool [26]. The optimization of processes involving more than three variables has not been reported, especially with respect to the preparation of drug-loaded nanoparticles. Consequently, a Central Composite Design (CCD) has been used to investigate how five control variables affect the physical characteristics of nanoformulations. A statistical experimental design was used to develop empirical models, which showed evidence of accuracy. The process was further optimized to obtain a formulation with desirable physical properties, e.g., regarding aspects such as particle size, polydispersity index, zeta potential, and physical stability, over two weeks. This formulation was characterized using scanning transmission electron microscopy (STEM) to confirm the particle morphology. A size distribution study was conducted to further investigate the effect of pH on the particle size of the nanodispersions.

2. Materials and Methods

2.1. Materials

Span 20 and Brij 56 were obtained from Merck (Darmstadt, Germany). Ethanol (99.5%) was acquired from Fisher Scientific (Fair Lawn, NJ, USA). GanoFarm Sdn. Bhd (Malaysia) provided crude GA isolated from raw Ganoderma tsugae fruiting bodies, which was used as received without further purification. Water was obtained from the Milli-Q water purification system (Millipore, MA, USA).

2.2. Preliminary Screening of Nanoemulsion Formulations

Using crude GA dissolved in ethanol, a solution of GA (1% wt/wt) was prepared and preserved in vials prior to formulation. In order to encapsulate GA in nano-vehicles, a study was conducted to determine the solubilization potential of the solution (1%) before its encapsulation. Following ultrasonic cavitation at room temperature, visual observations were made. The behavior of the emulsion phase was investigated by adding a predetermined mixture of water and surfactant (or oil and surfactant) to GA solution in vials. In order to determine the maximum level of solubilization of the surfactants, GA solution was titrated into a water–surfactant mixture (or oil–surfactant mixture), which was stopped once turbidity was observed. The formulations were then left at room temperature until equilibrium had been achieved.

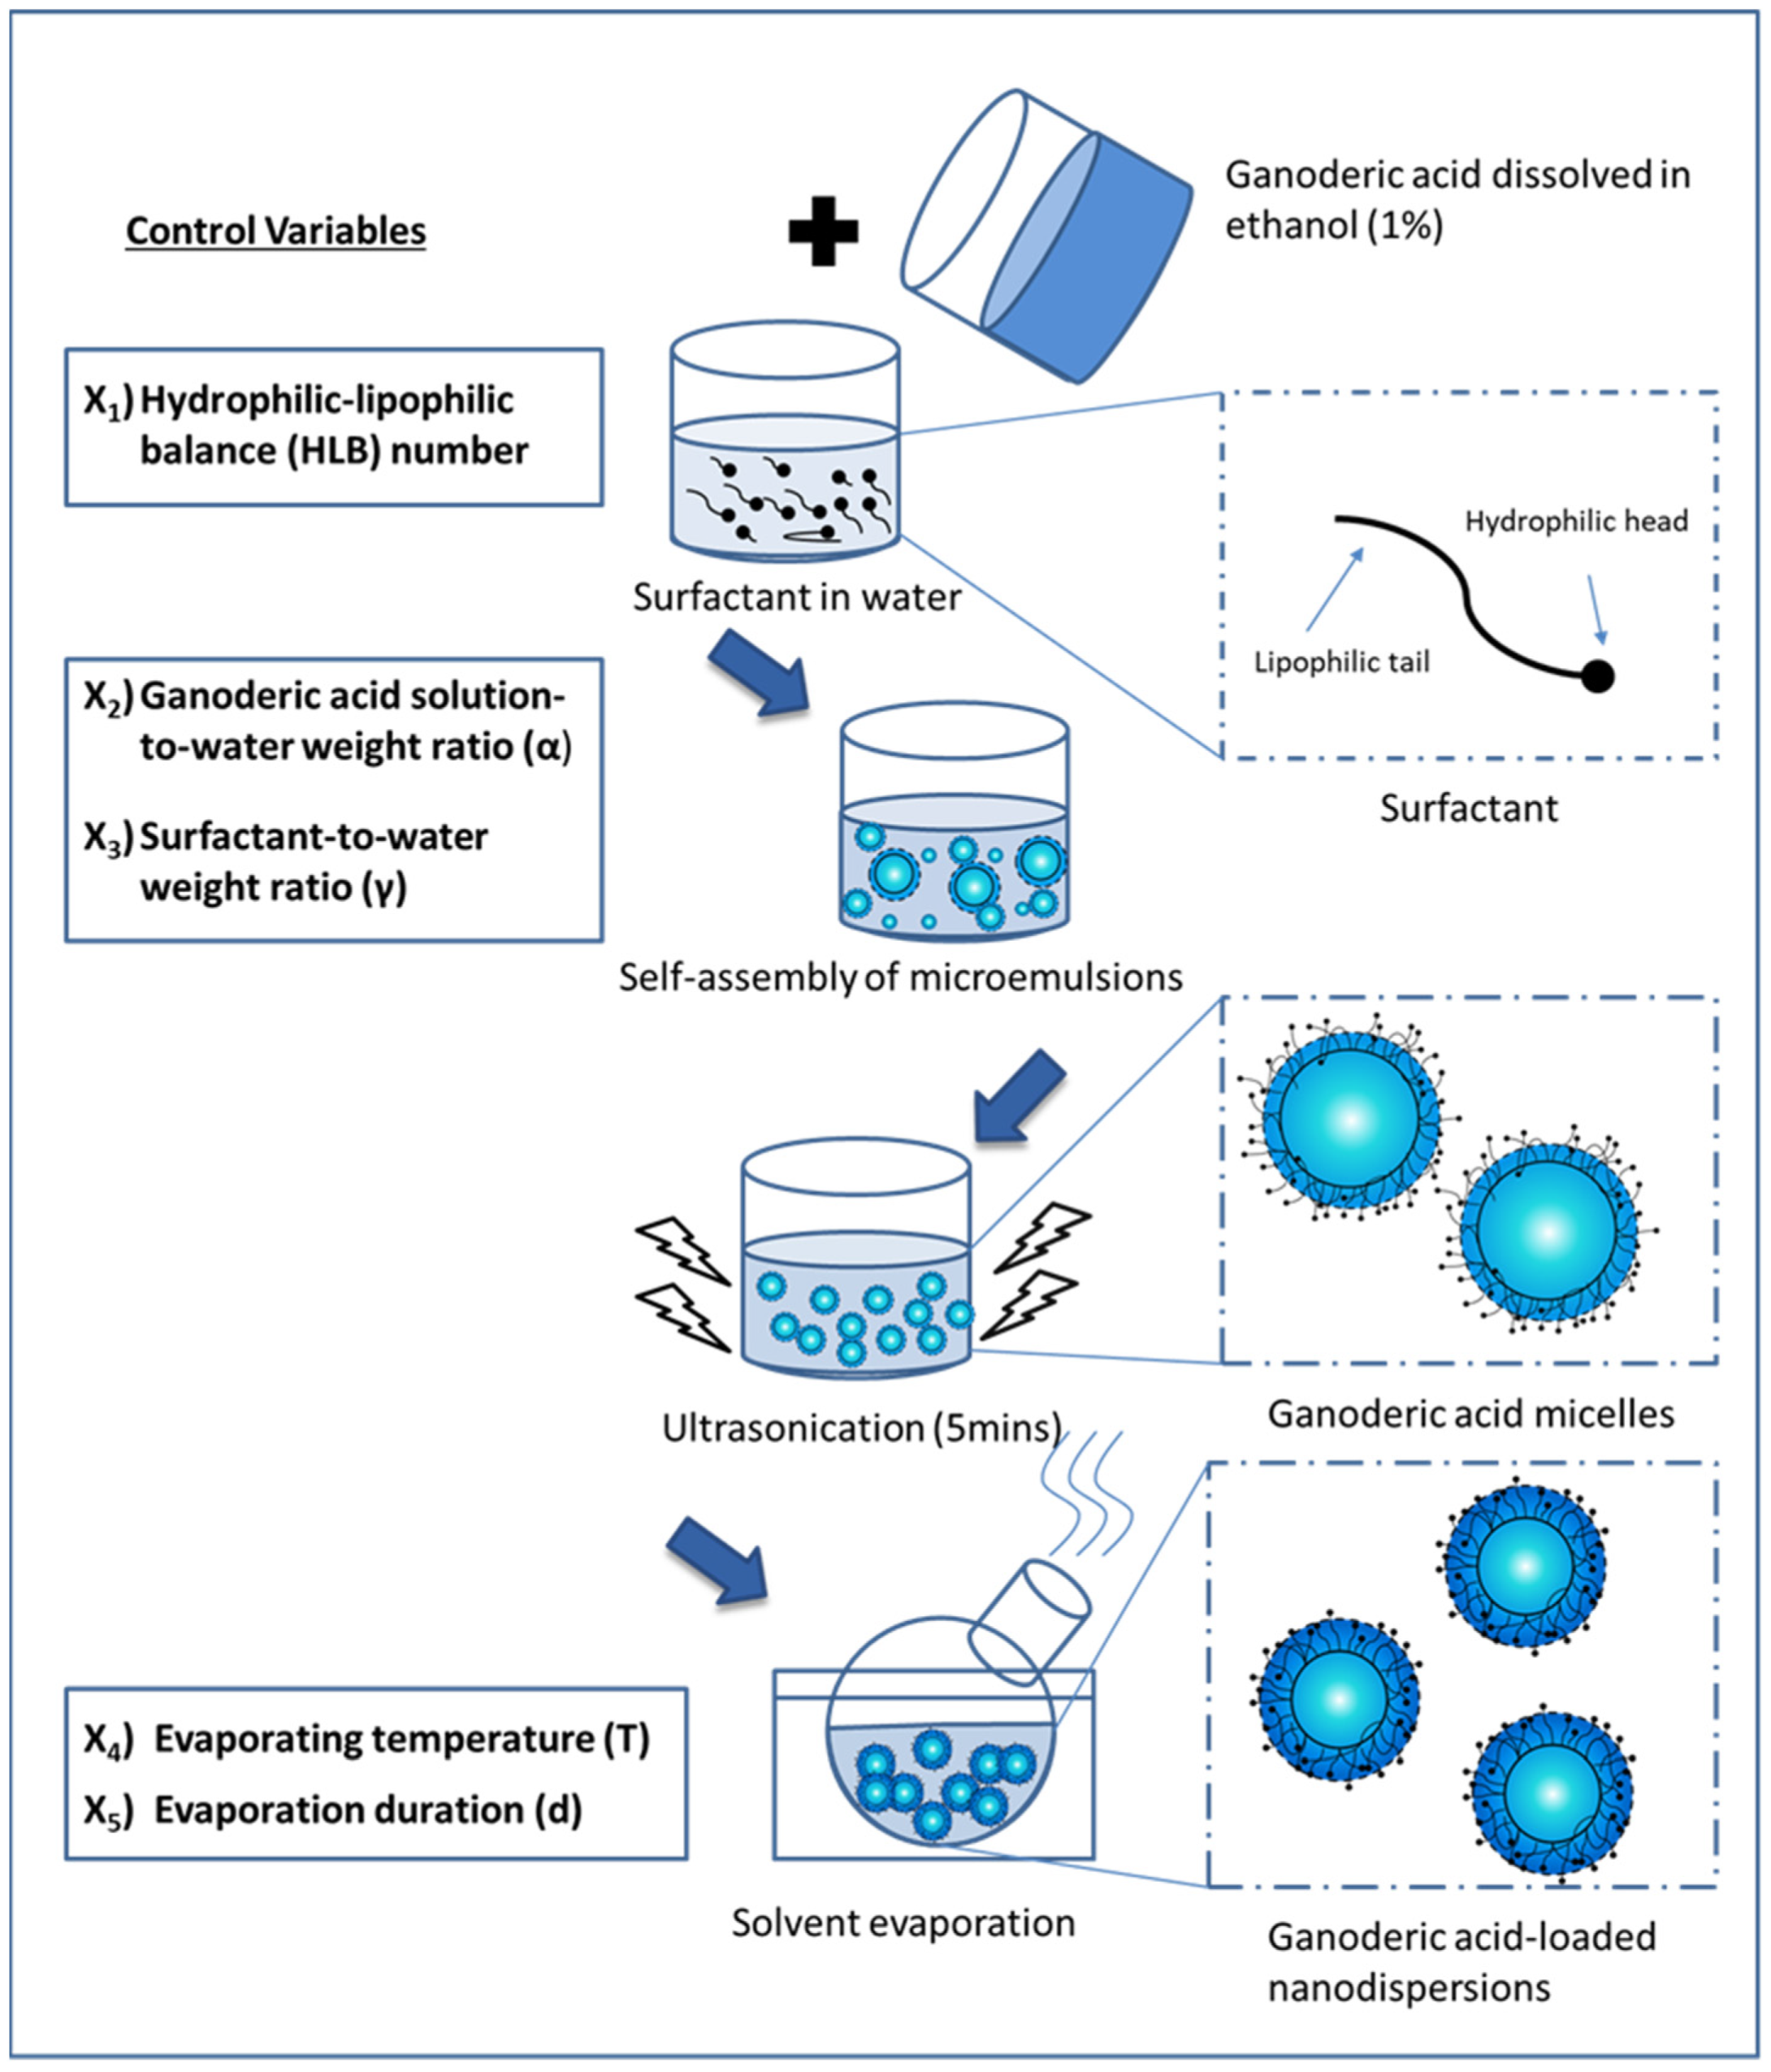
2.3. Preparation of GA Nanodispersion

As shown in Figure 2, GA-loaded nanodispersion formulations were prepared using ultrasonic cavitation and solvent evaporation techniques. The Response Surface Methodology (RSM) has been extensively used to study the influence of formulation composition and processing conditions on performance. The first step in our study was to extract GA of Ganoderma tsugae from its fruiting bodies using a modified isolation method described by Chin et al. [17]. The purified GA was redissolved using 1 mg/g of ethanol to produce GA-rich organic phase. Brij 56 and Span 20 were mixed accordingly to obtain the desired HLB. The surfactant mixture, GA solution, and water were combined in the following steps until an isotropic micellar system was achieved. In order to induce homogenization, ultrasound was applied for 5 min (38 kHz, Ultrasonic RMS 140 W, Guyson International Ltd., UK). The solvent was evaporated at reduced pressure (150 mbar) to remove the organic phase from the GA micelles. During the evaporation process, the temperature was maintained between 40 and 50 °C, and the evaporation time was maintained in a range between 10 to 30 min. The components of this process were required to be mixed to an accuracy of ±0.005 g.

2.4. Characterization of Nanodispersion: Size Distribution, Polydispersity Index, Zeta-Potential, and Stability Studies

A Malvern Zetasizer-Nano instrument (Malvern Instrument Inc.) was used to determine particle size, polydispersity index, and zeta potential of GA-loaded nanodispersions. After preparation, nanodispersions were characterized at room temperature without dilution. The physical stability of the formulations was examined over a given storage period. The prepared emulsions were sealed after instant measurement on the first day of preparation. Immediately following the preparation of the nanodispersions, 1 mL was withdrawn in order to monitor particle growth.

2.5. Experimental Design

An interactive relationship between the independent control variables was constructed by using a Central Composite Design (CCD) to approximate a quadratic model. A preliminary screening of product formulations was conducted, employing GA solution (1%), surfactant concentration, and the combination of two surfactants to determine the physical properties of the initial nano-emulsion. To study the synchronized effects of the two surfactants, the Hydrophilic–Lipophilic Balance (HLB) of the mixed surfactants was determined, which may be expressed as follows (Equation (1))
  N H L B ,   m i x = N H L B , S u r f   A W s u r f   A + N H L B , S u r f   B W s u r f   B
where NHLB,mix is the HLB number of the mixed surfactants, NHLB,SurfA is the HLB number of surfactant A, Wsurf A is the weight ratio of surfactant A to the total weight of the surfactants, NHLB,Surf B is the HLB number of surfactant B, and Wsurf B is the weight ratio of surfactant B to the total weight of the surfactants. A total of five independent variables, including the Hydrophilic–Lipophilic Balance number (X1, HLB), GA solution-to-water weight ratio (X2), surfactant-to-water weight ratio (X3), evaporation temperature (X4), and evaporation time (X5), were examined with respect to their interaction.
Table 1 summarizes the factors in an evenly spaced manner to achieve a three-level orthogonal design, where the codes for low, medium, and high are −1, 0, and +1, respectively. All 50 experiments designed using CCD, including five center point replications, were conducted randomly and in accordance with their design configurations. Analysis of Variance (ANOVA) was used to examine and validate the quadratic function generated via Design-Expert 8.0. Four response surface functions were developed: particle size (Y1), polydispersity index (Y2), zeta-potential (Y3), and percentage increase in zeta-average after 14 days of storage (Y4). The following is a generalized response function (Equation (2)) that can be used to describe these functions:
Y = β 0 + β i x i   + β i i x i 2 + β i i x i x j
where Y is the respective response, β0 is a constant, and βi, βij, and βii are linear, interaction, and quadratic coefficients, respectively. Based on the derived equation, a three-dimensional response surface was generated. Through process optimization, the smallest particle size and polydispersity index, the highest zeta potential, and the slowest particle growth were achieved after each permutation of the multi-response quadratic function.

2.6. Scanning-Transmission Electron Microscopy (STEM)

Field Emission-Scanning Electron Microscopy (FE-SEM) in STEM mode was used to examine the surface morphologies of the GA-loaded nanodispersions. A 50-mesh copper grid was placed with drops of the optimized formulation and allowed to dry naturally for 5 min at room temperature. In the STEM investigation, the nanodispersion was again left to stand in 3% Phosphotungstic Acid (PTA) for 5 min.

2.7. Statistical Analysis

Design Expert Software 8.0 was used to analyze the experimental data, and ANOVA was used to confirm the validity of the analysis. Various statistical parameters were compared to identify the most appropriate polynomial model, including lack of fit, predicted and adjusted multiple correlation coefficients, and coefficient of variation. The significance of the differences between independent variables was evaluated using ANOVA.

3. Results and Discussion

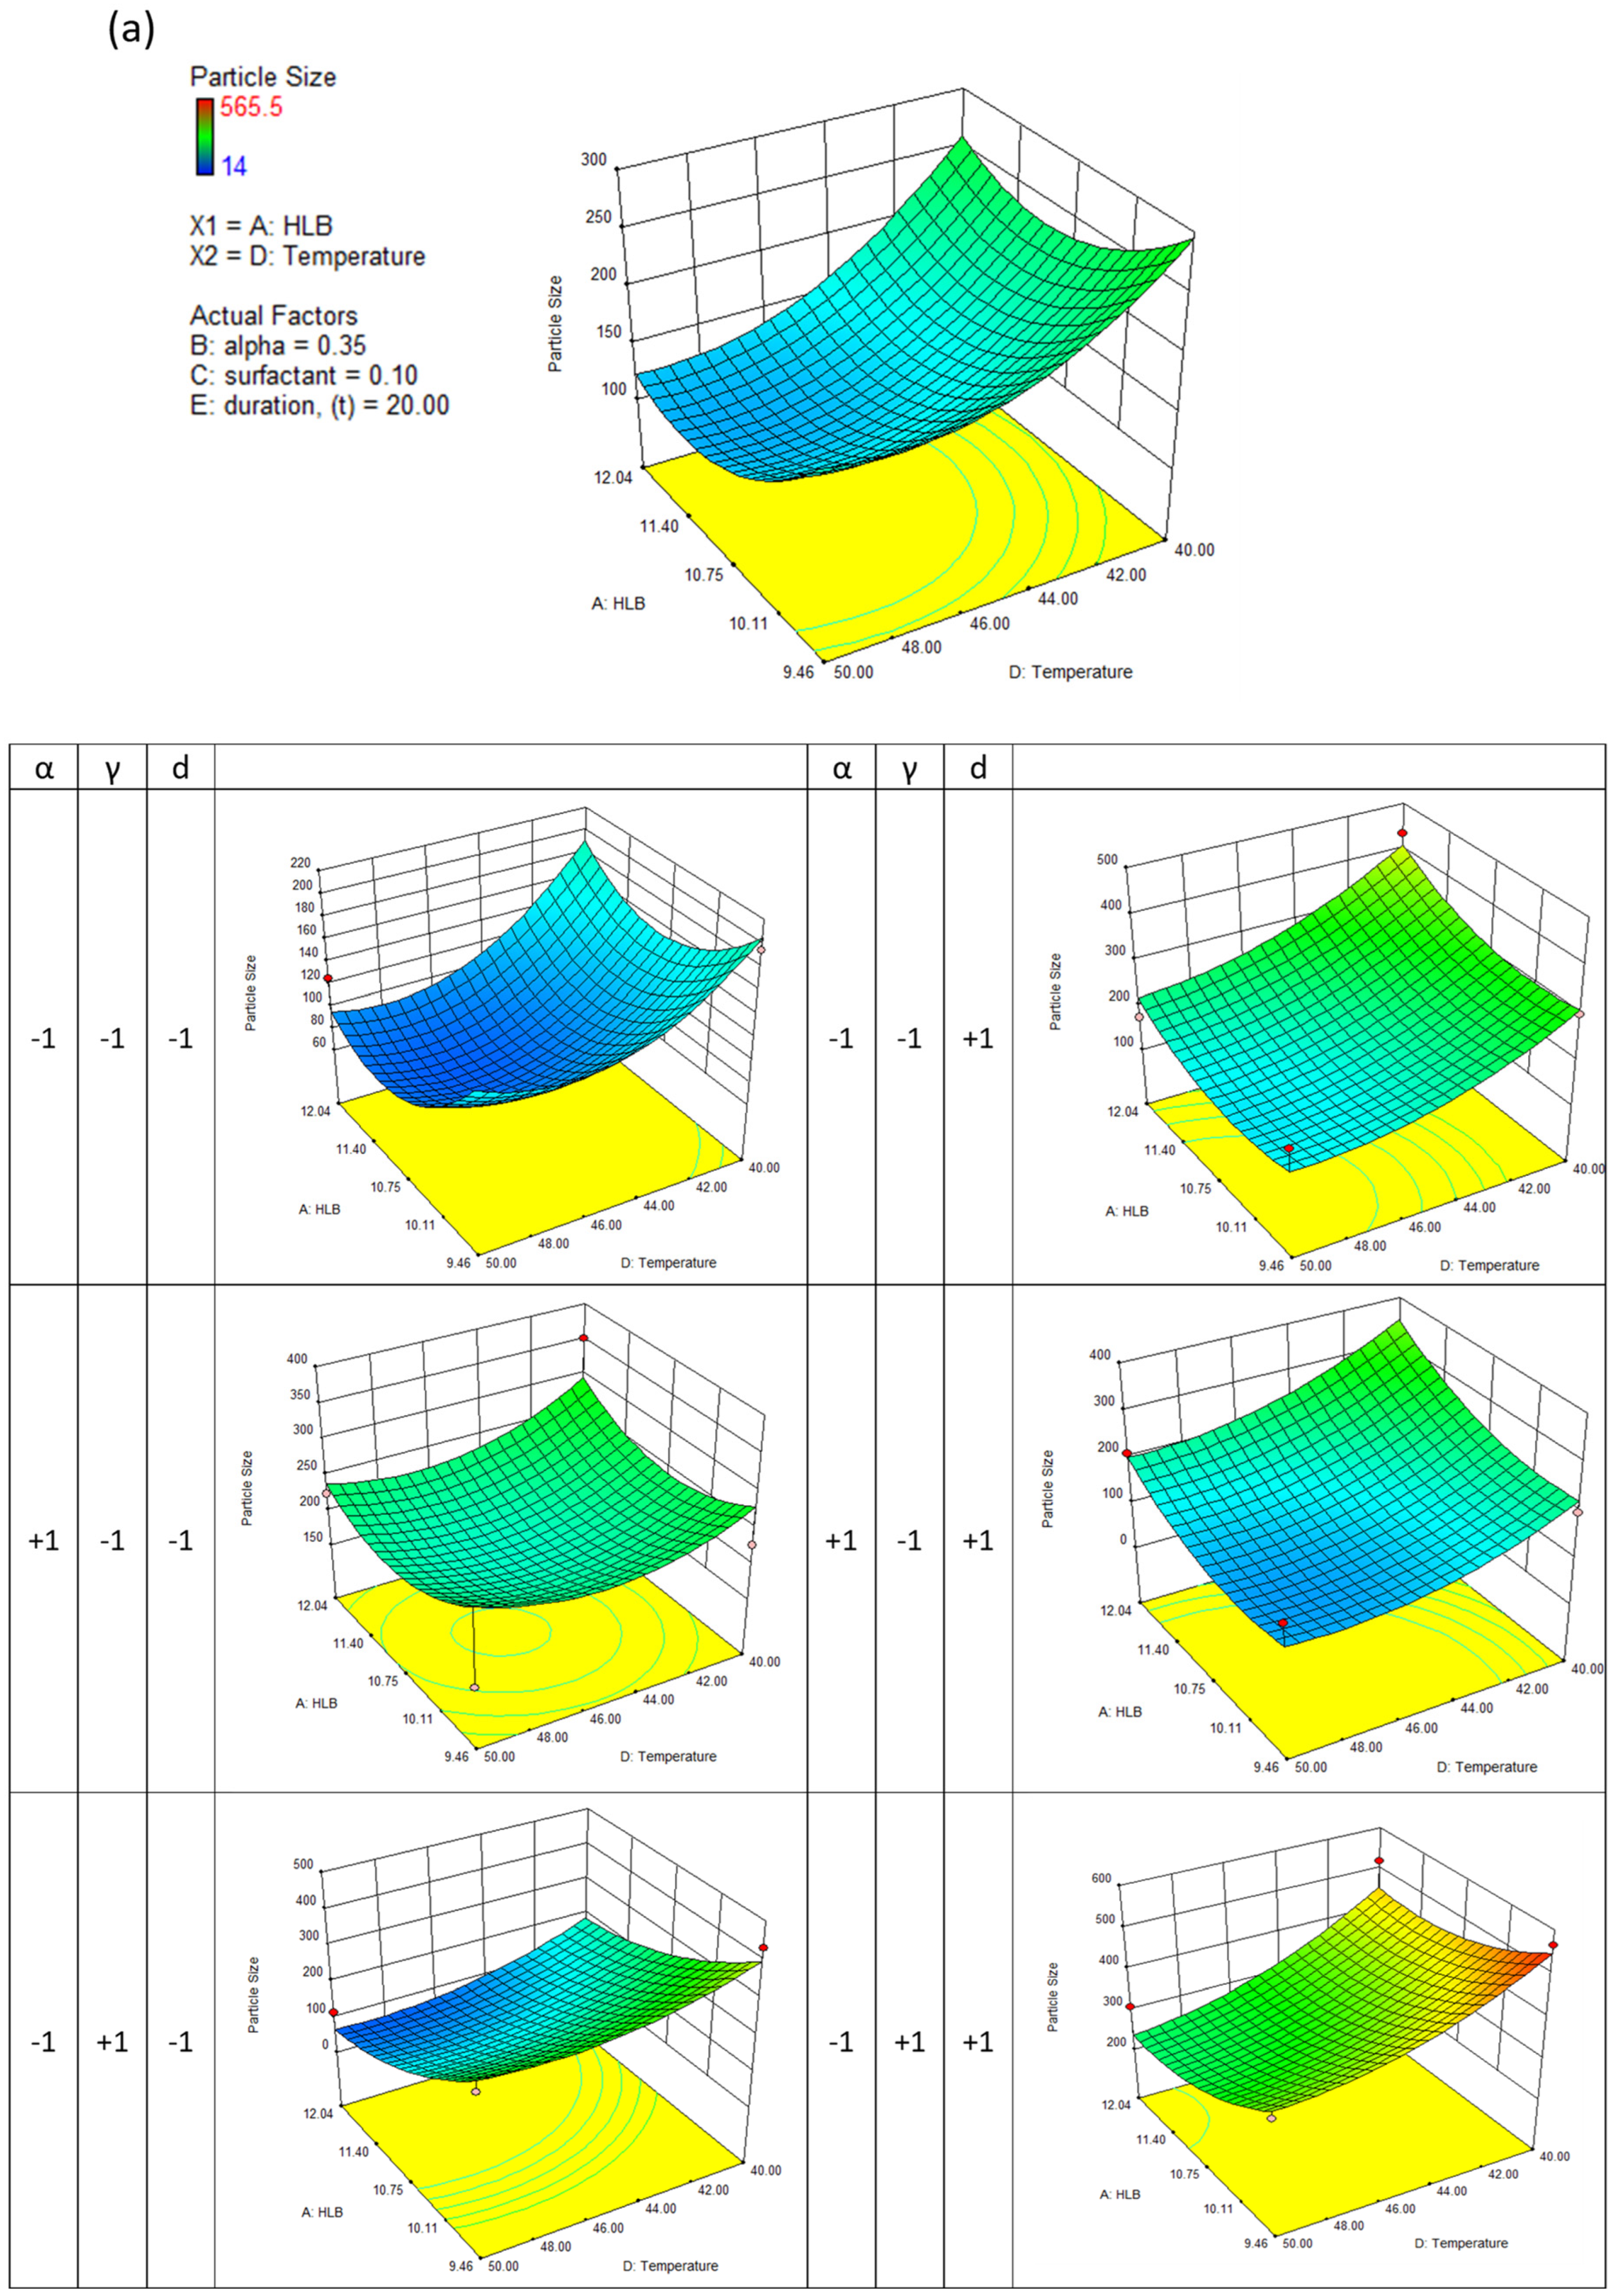
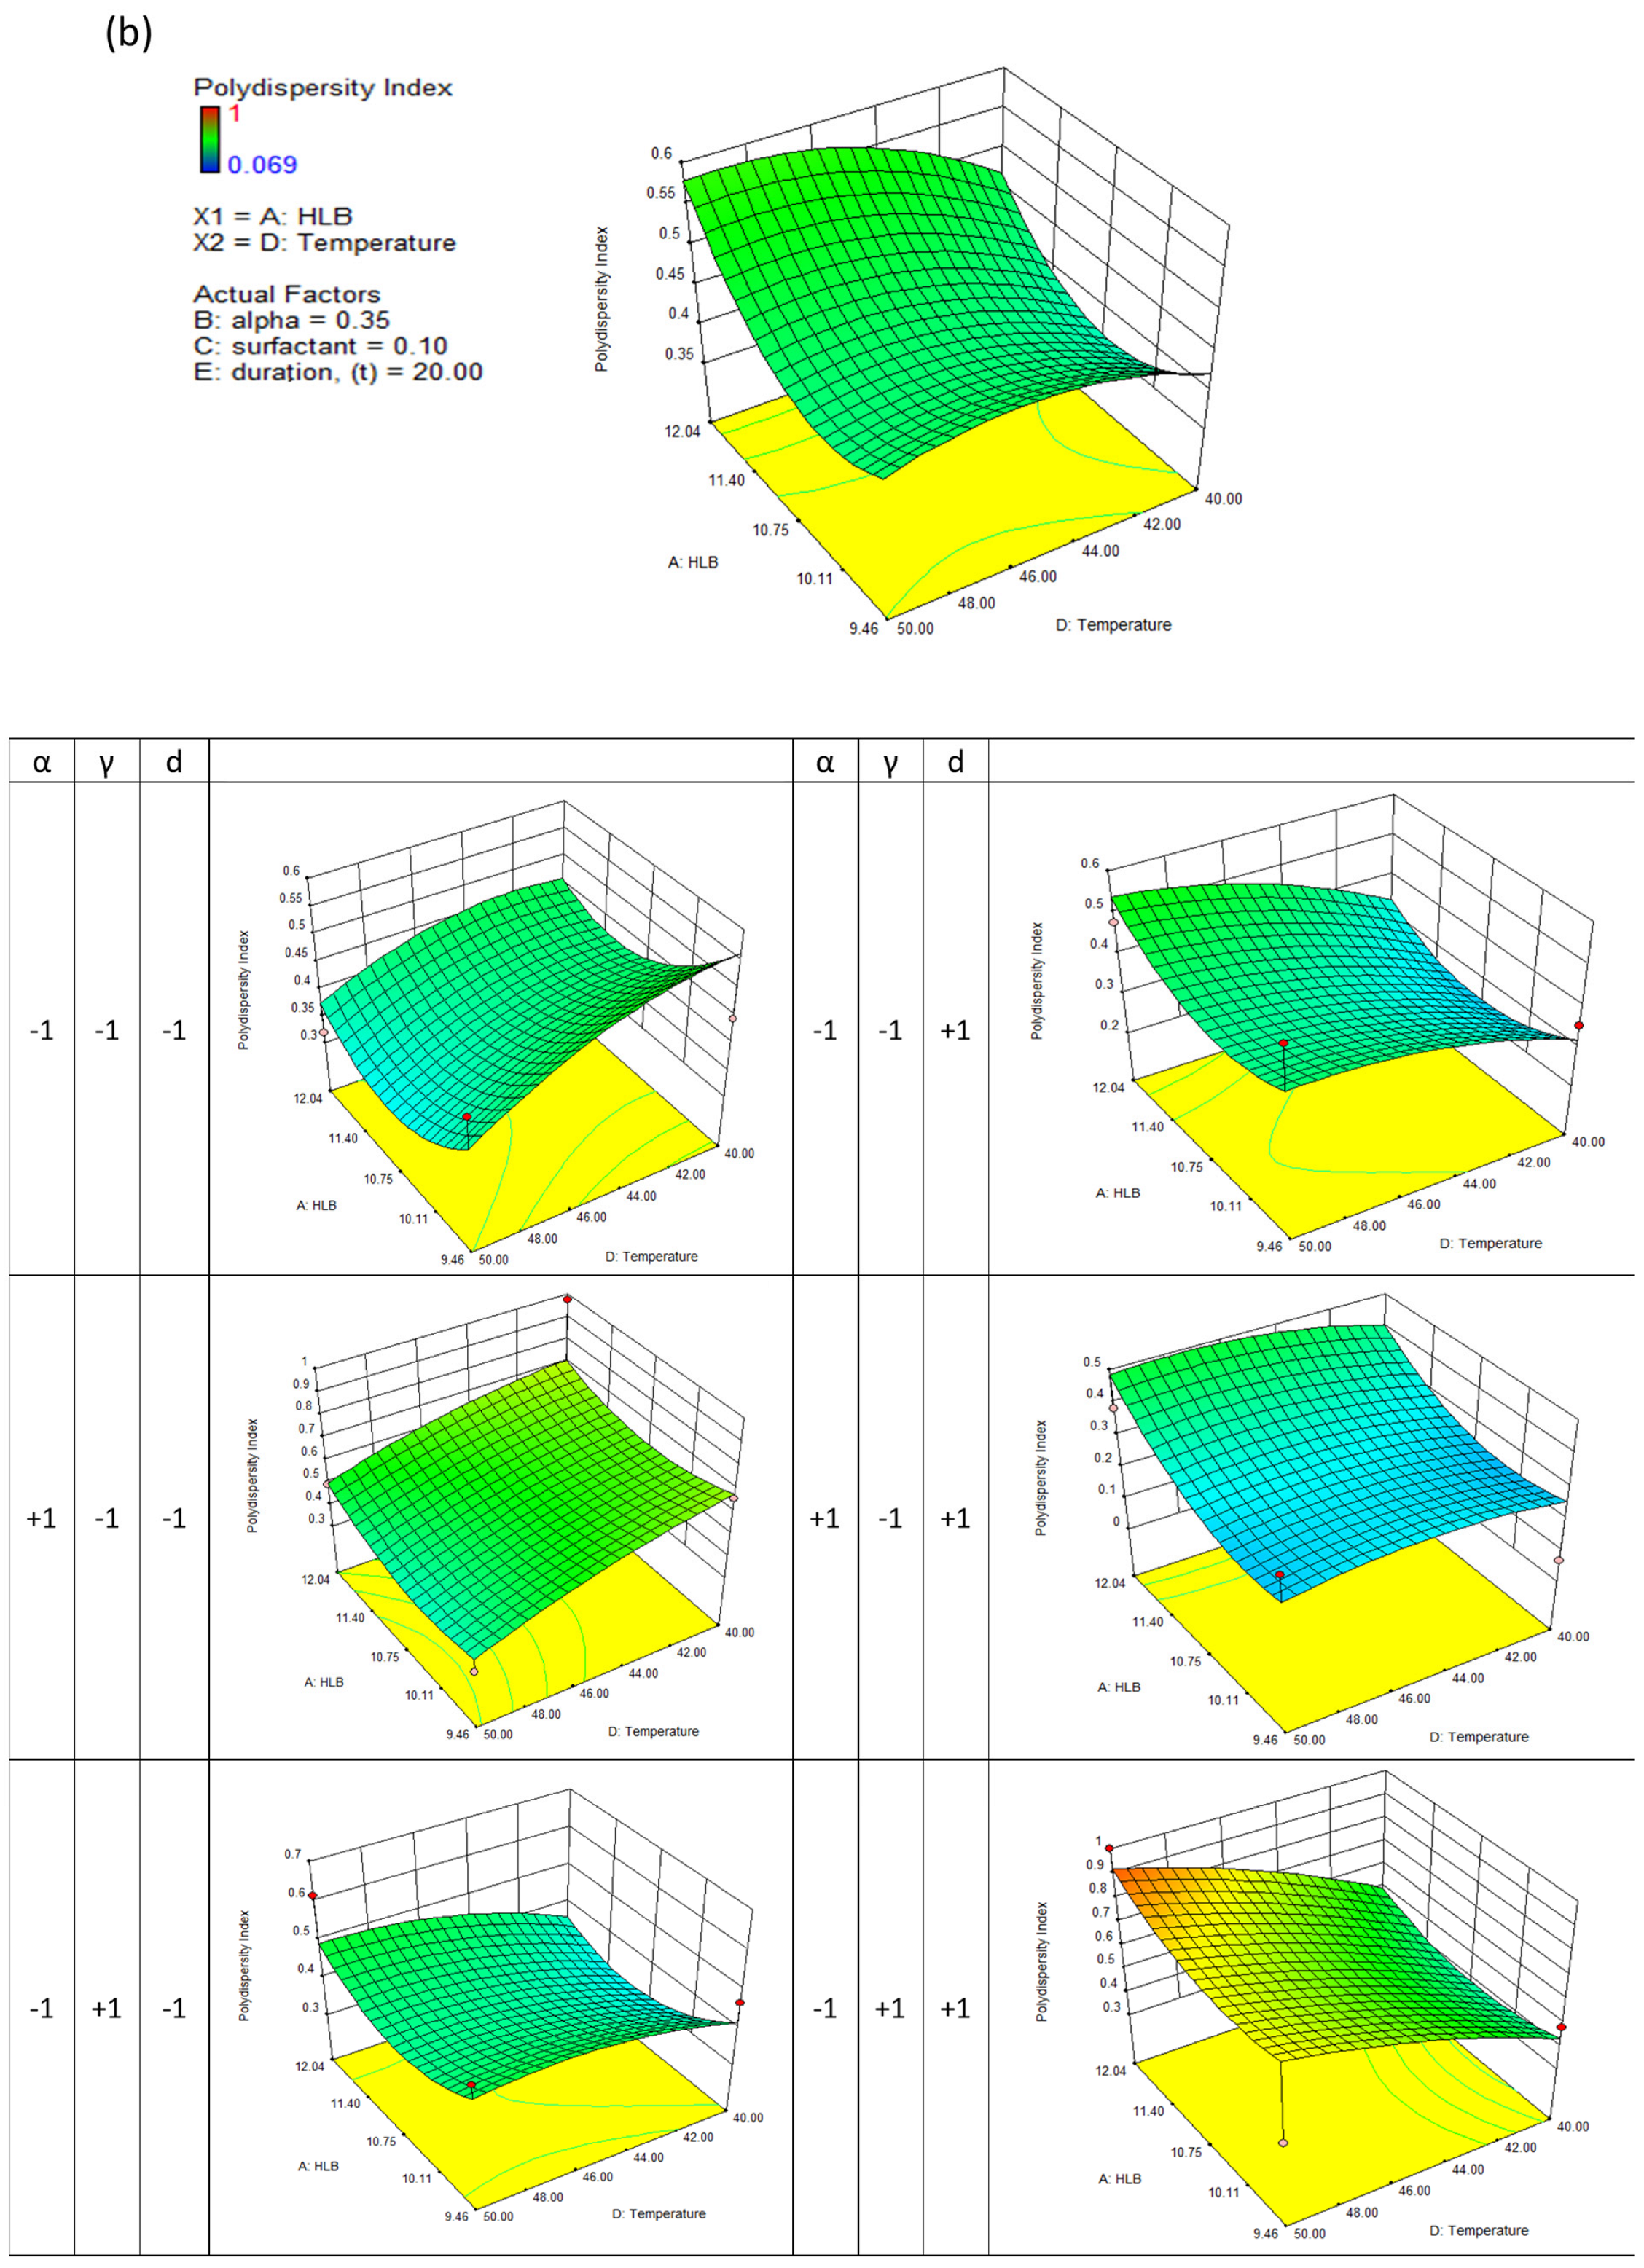
3.1. Development of 3D Surface Function Using Central Composite Design (CCD)

In Table 2, both the experimental and response surface methodology (RSM) results are presented with respect to the physical characteristics of the GA nanodispersion based on particle size (Y1), polydispersity index (Y2), zeta potential (Y3), and percentage increase in zeta average of the nanodispersion after two weeks of storage (Y4). The ANOVA results reveal that the findings of the quadratic model were statistically significant for four of the responses at a confidence level of 99%. As the approximating function suggests, the predicted values agree with the measured response data. For the responses of particle size (Y1), polydispersity index (Y2), zeta-potential (Y3), and percentage increase in zeta-average of the nanodispersion after two weeks of storage (Y4), the coefficients of determination (R2) were calculated to be 0.8822, 0.6583, 0.9652, and 0.7650, respectively. Generally, this results in a good match between the actual and predicted data. As illustrated in Figure 3a–d, the quadric surfaces illustrate the interaction between five independent variables. Consequently, a three-dimensional response surface was developed, which shows the combined effects of the two most important independent variables while maintaining the values of the other three control variables at their centers. In the following steps, eight other quadric surfaces were constructed by varying the two variables with the greatest influence.

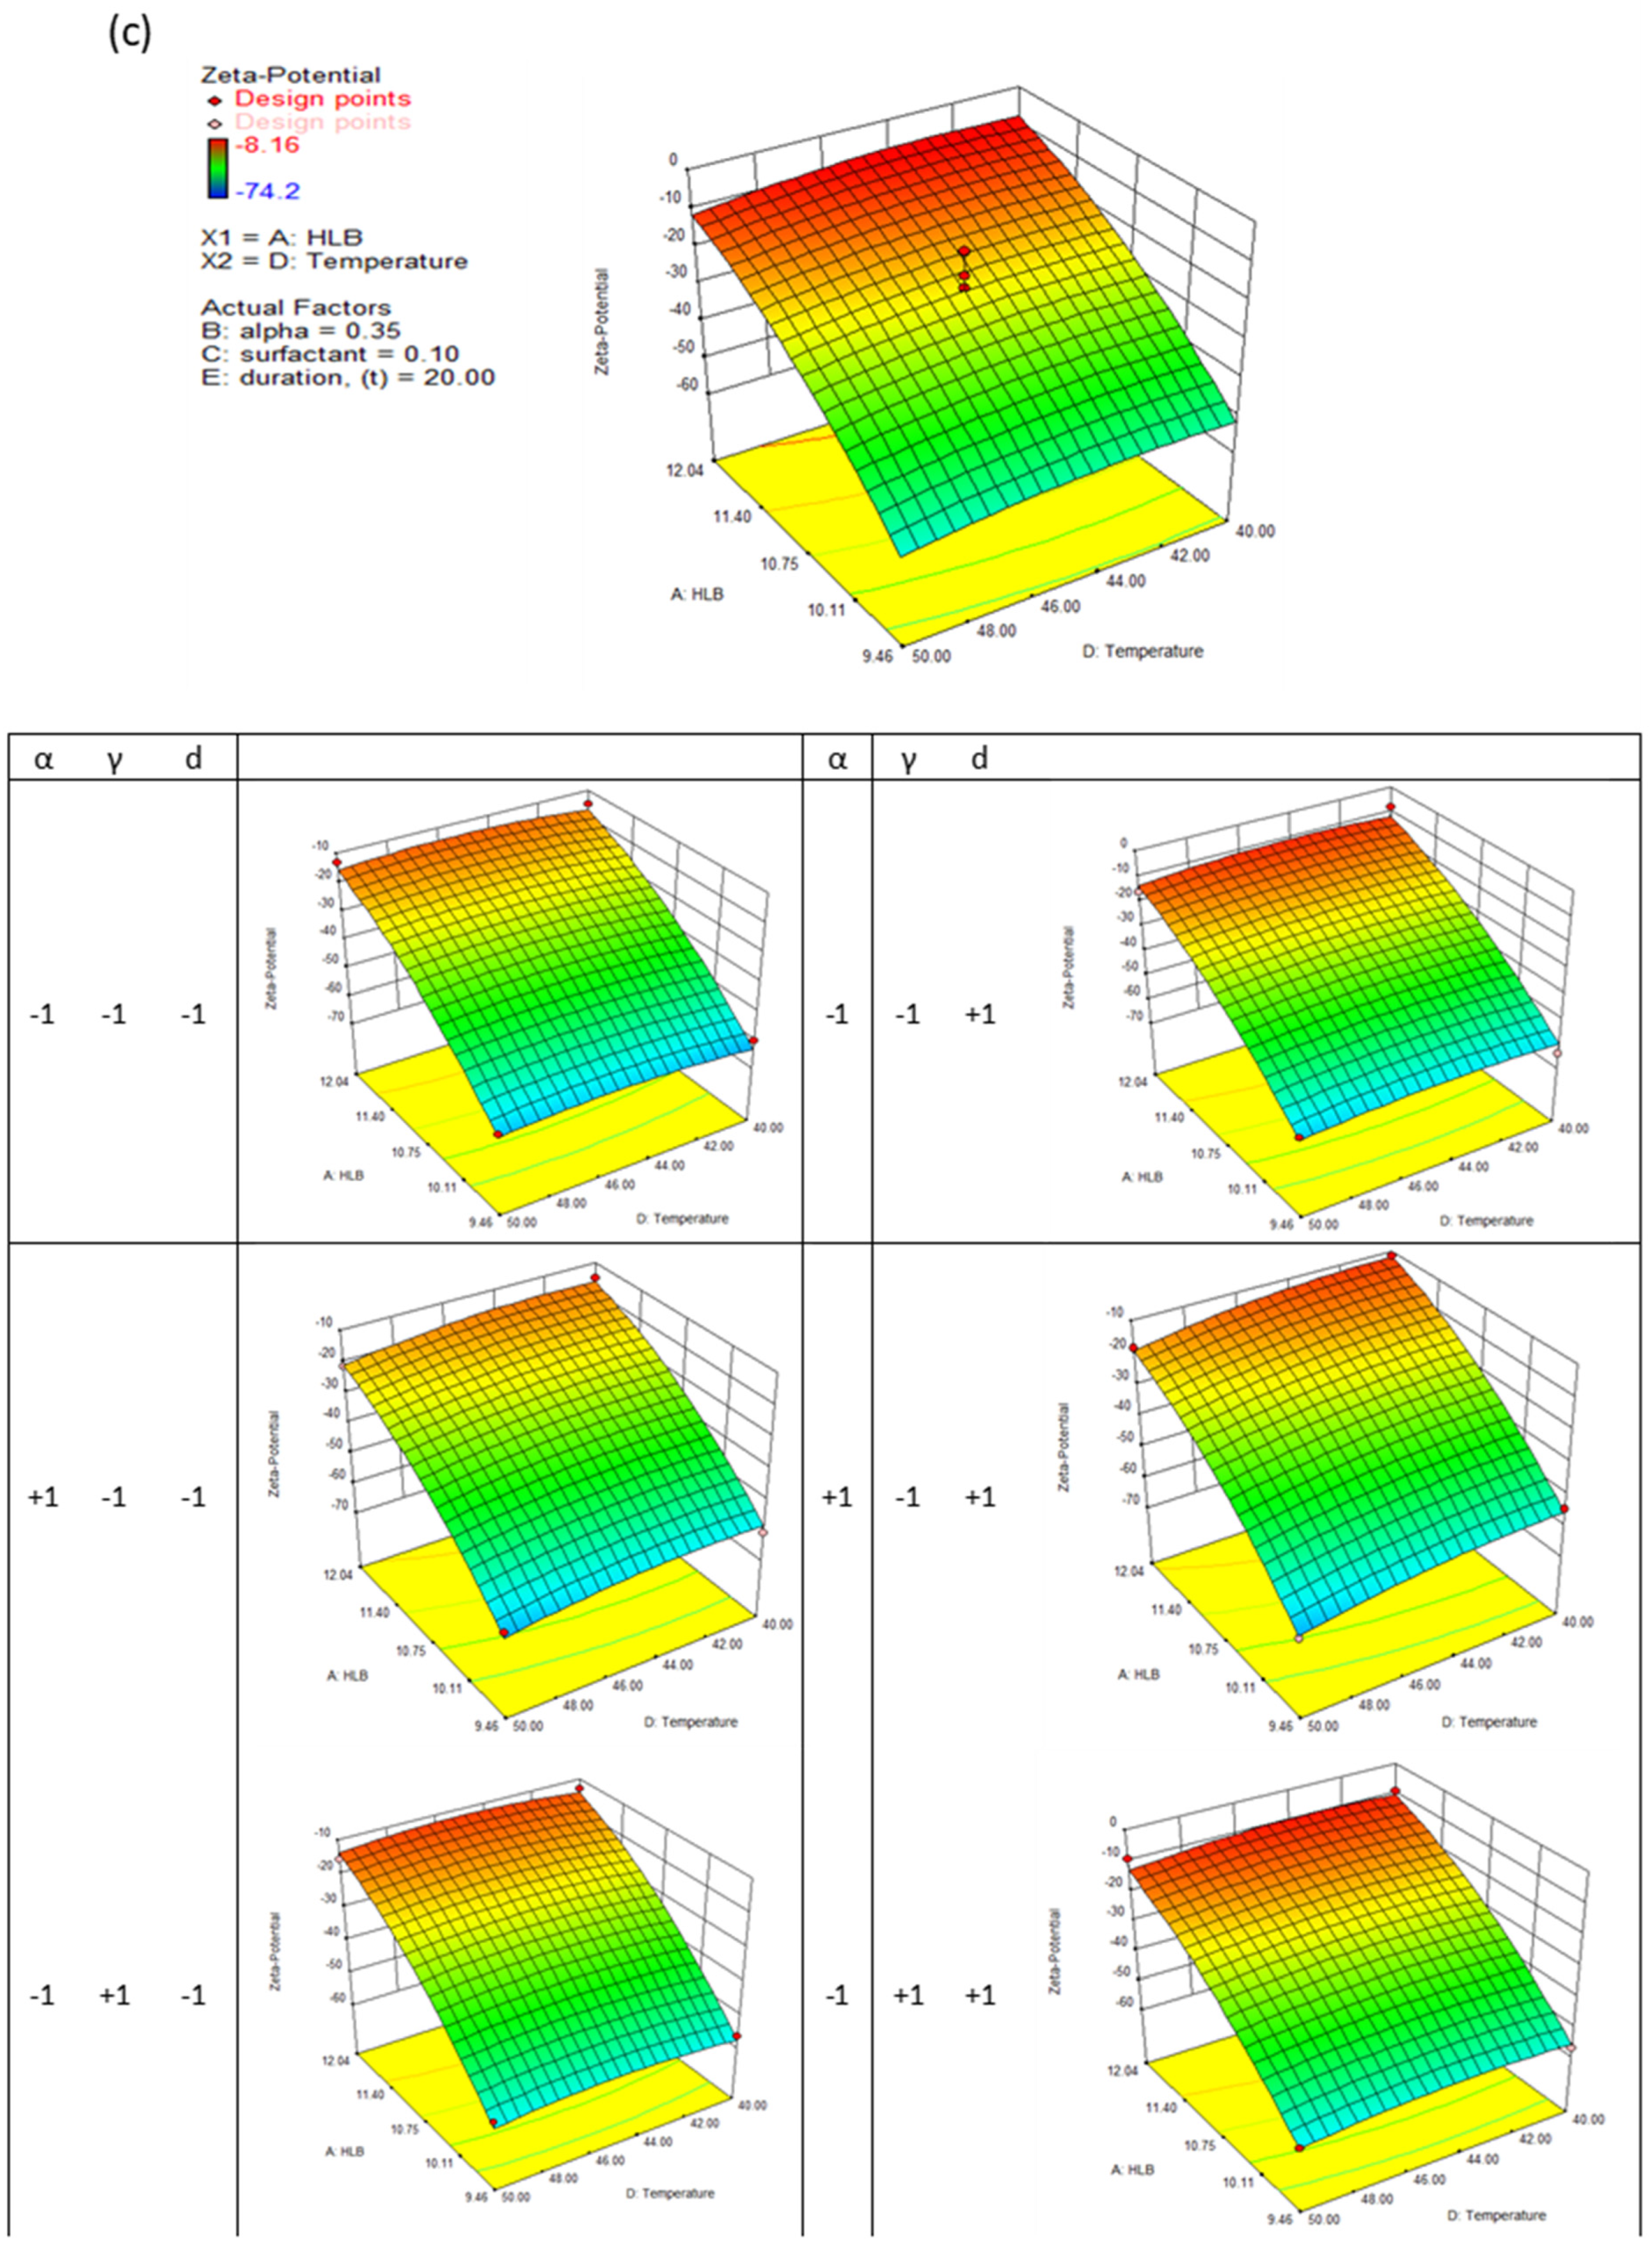
3.2. Effect of Control Variables on the Response

Gradient-driven solvent diffusion from the hydrophobic core of the micelles into the continuous aqueous phase governs GA’s nanodispersion in water. A surfactant stabilizes the organic solvent, resulting in drug-loaded micelles. However, the GA nanosphere crystallizes after the intensive removal of the organic solvent through evaporation at reduced pressure. A low ethanol concentration is acceptable for most pharmaceutical applications [27]. Ethanol was used in this study to deliver GA to the hydrophobic core. Since it can form azeotropes with water, excluding it from the formulation is generally not feasible. Based on the analysis of this study’s experimental data, it was found that increasing the organic phase in the micelles leads to the formation of larger micelles, resulting in smaller nanodispersions with narrow particle sizes. However, this rarely contributed to the growth of particles or charges on the nanodispersions’ surfaces after 14 days of storage. A mixture of surfactant molecules can control the early precipitation of GA by moving ethanol from the center of the primary nanodroplets. It is evident from these results that the choice of surfactant was statistically significant (p < 0.05); however, the concentration of the surfactant appears to play only a minor role in determining the physical characteristics of the particles. According to this study, the temperature gradient is the second-most influential factor. It is possible that the high evaporation temperature of 50 °C could result in a significant reduction in particle size as a result of the higher rate of solvent evaporation without affecting the formation of nanodispersions. The significance of each control variable in the formation of drug-loaded nanodispersions induced by chemical instability via solvent transport can thus be summarized in the following order: HLB number > evaporation temperature > GA (1%) concentration > surfactant concentration > evaporation duration.

3.3. Particle Size Distribution

Using nanodispersions, water-insoluble therapeutic substances can be effectively delivered [28]. The particle size of nanoparticles used for intravascular delivery should not exceed 1 µm in order to prevent capillaries with a diameter of 4–7 µm from becoming occluded. It is also necessary that the formulation be biocompatible, biodegradable, and sterile. Following the above protocol, GA-loaded nanodispersions have been prepared by evaporating the solvent intensively.
In this study, span 20 was selected due to its C12 alkyl chain and relatively high lipophilicity [29]. Brij 56 is effective as a solubilizer, detergent, and emulsifier [30]. Due to their non-ionic nature, Span 20 and Brij 56 are less likely to react with other components in a formulation and are more stable over a wide pH range [31]. In the selection of surfactants, the HLB is an often-used tool. Hydrophilicity and hydrophobicity can be measured empirically using the HLB [32]. A lower HLB value indicates that a surfactant is more lipophilic, that is, oil-soluble, and vice versa [32]. For W/O emulsion systems, an HLB range of 2–7 is ideal, while for O/W emulsion systems, an HLB range of 8–16 is ideal [32].
Figure 3a shows that a decrease in evaporation temperature results in the formation of nanodispersions with larger particles; a reduction in evaporation duration can also lead to larger particles, especially when the formulation’s HLB number is low. When the HLB number of the formulation is close to 12.04, a longer evaporating period does not significantly affect particle size. A lower HLB number may, however, result in a greater reduction in particle size. With a low surfactant concentration, increasing the HLB number generally results in smaller nanodispersions. This is particularly true for low concentrations of surfactant. According to the results of the particle size determination, the concentration of ethanol in the formulation had the least impact on particle size. Since ethanol diffusion is higher and solvent removal is satisfactory during evaporation, encapsulating more GA in the hydrophobic core is advantageous and does not significantly alter the nanocarrier volume.
Similar results were observed when the polydispersity index of the nanodispersions was considered. The polydispersity index describes how particle sizes are distributed within a medium [33]. Nanoparticulates with low polydispersity are, therefore, capable of ensuring a consistent drug loading at the target site. Thus, a significant decrease is observed in the ripening effect among small solid particles due to the reduction in the particle’s surface-active energy gradient. Several saddle-like surfaces can be seen in Figure 3b. A longer evaporation time led to nanodispersions with lower particle sizes and a higher polydispersity index. Surfactants facilitate the detachment of hydrophobic cores by attaching amphiphilic molecules to a particle’s surface. As the concentration of surfactant increases, the nanodispersion will remain steady; however, when a critical amount of surfactant aggregation is reached, micelles can no longer adsorb surfactant molecules, and the physical characteristics remain unchanged.

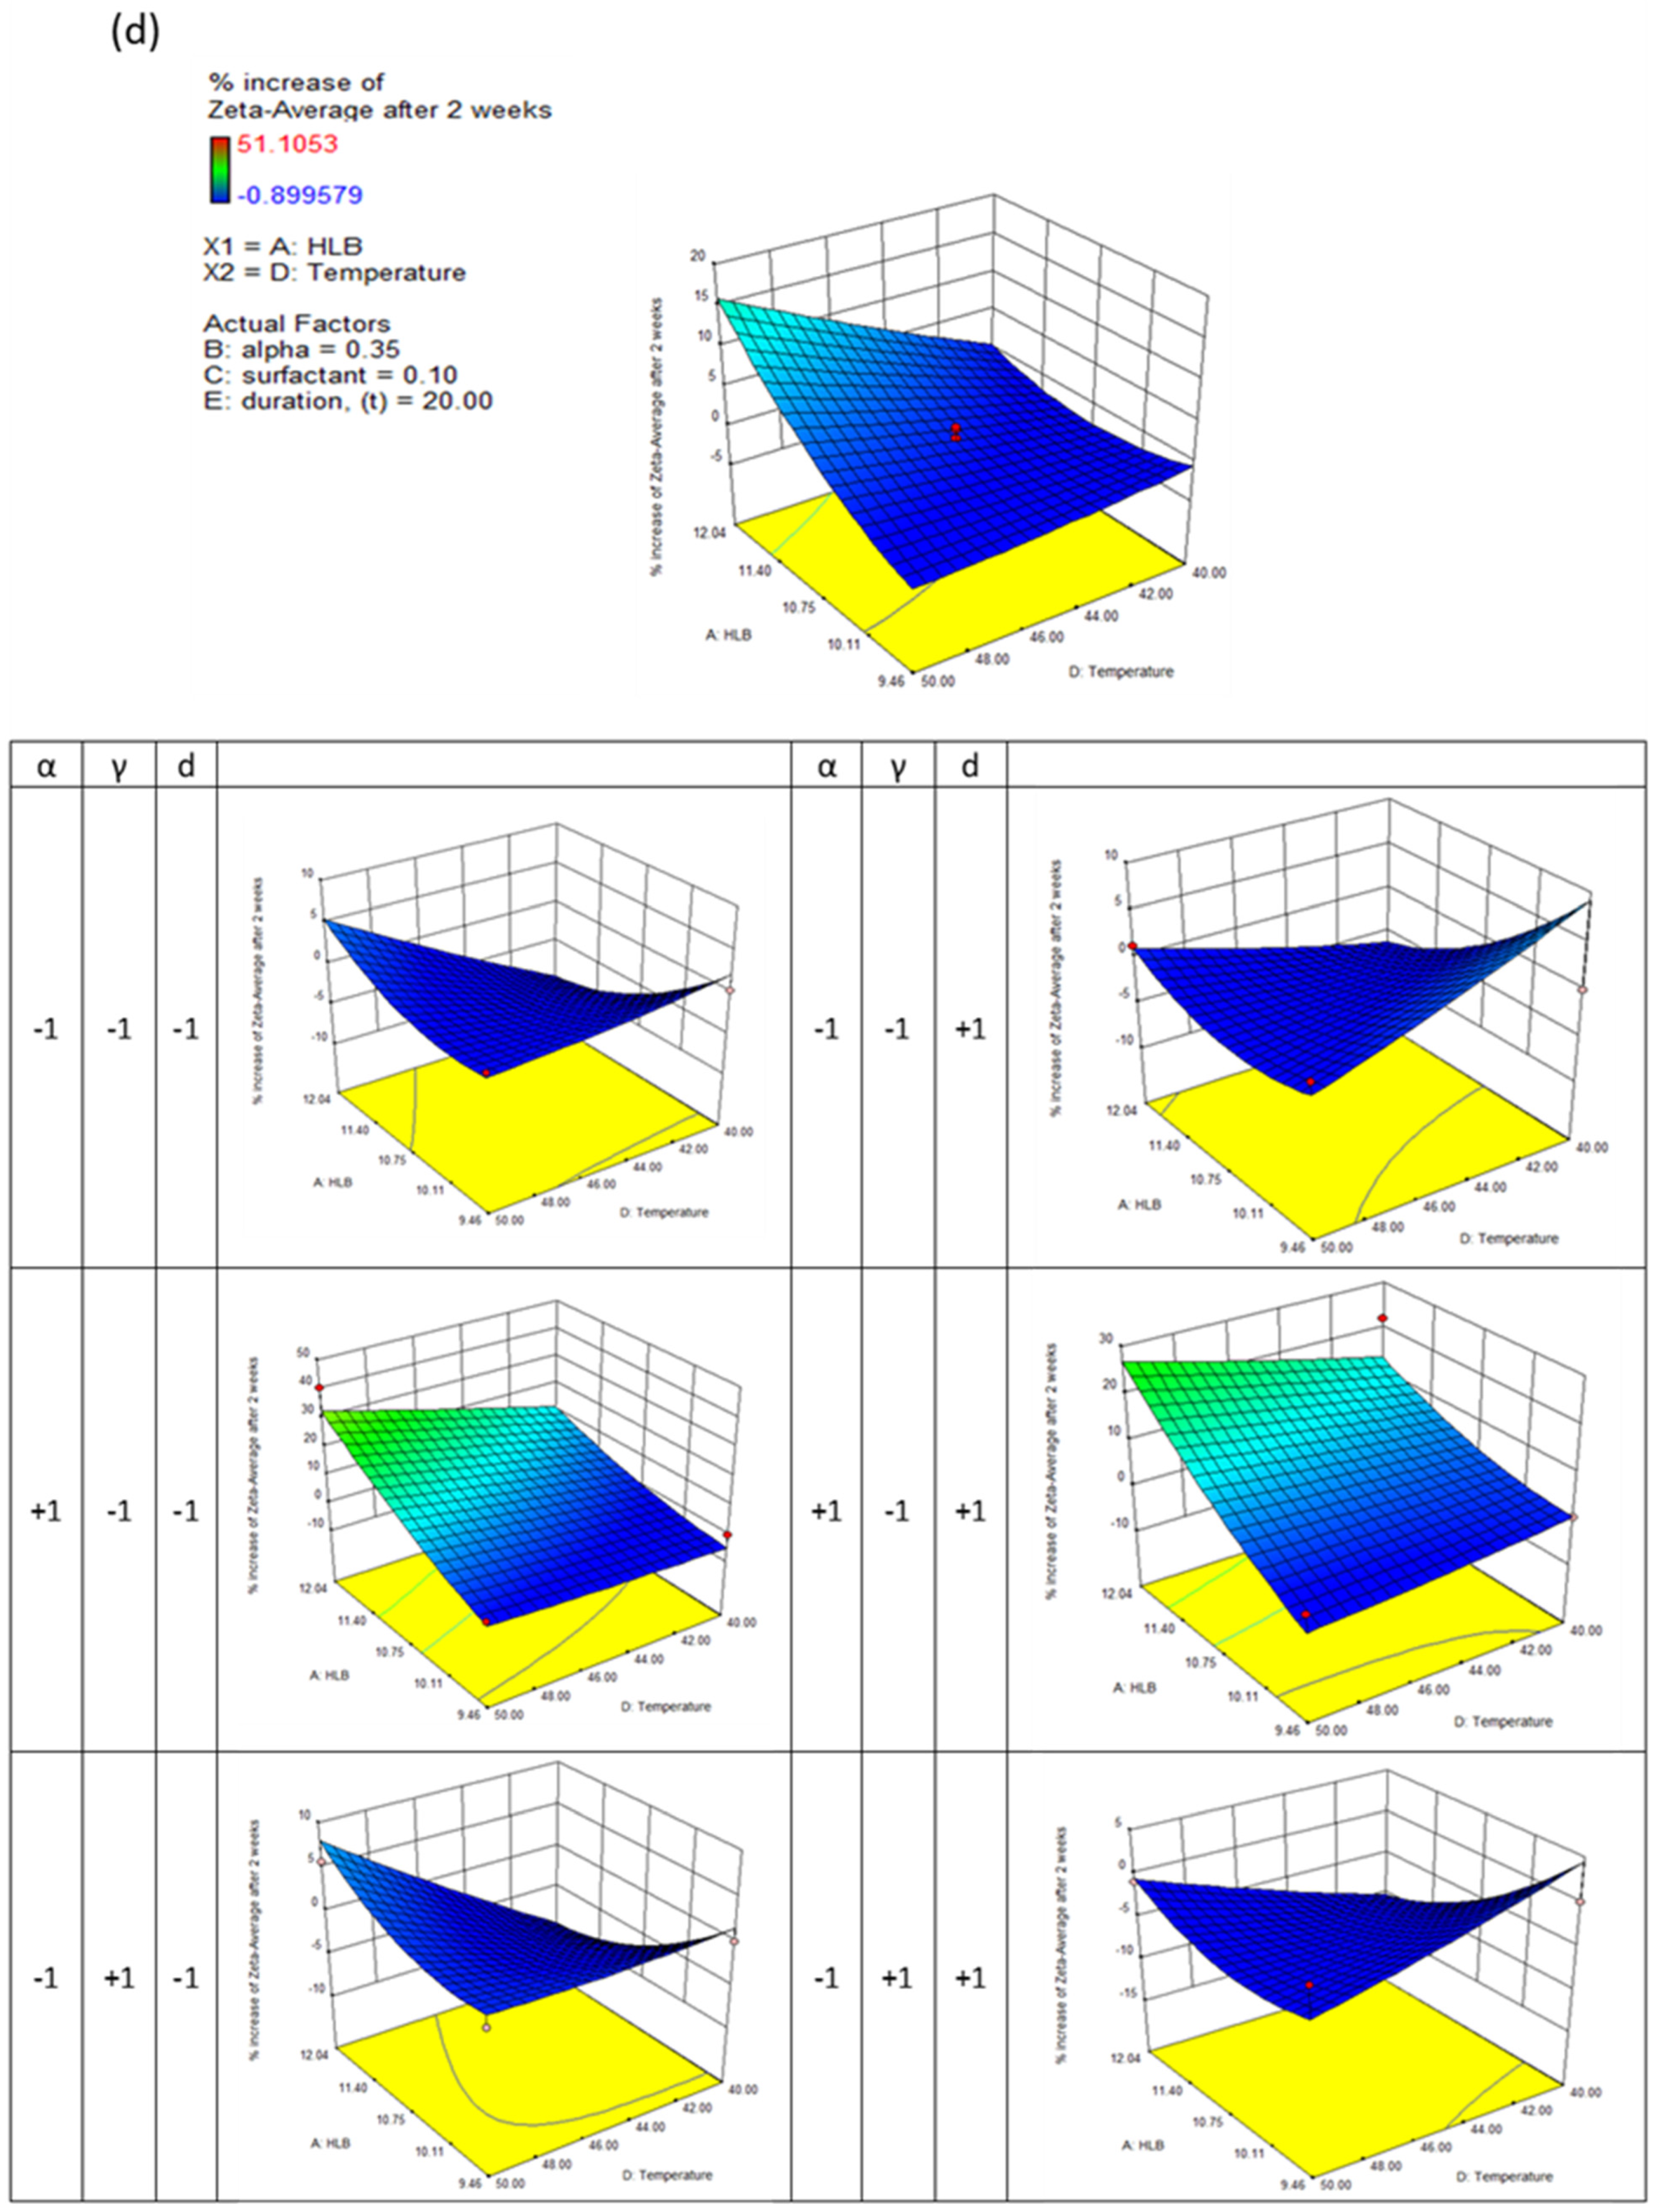
3.4. Physical Stability

Dispersions with a large surface area enhance dissolution rates and bioavailability. The findings reported in this study indicate that nanodispersions must be chemically or physically stabilized in order to ensure satisfactory drug delivery to the targeted area. The zeta potential is the electrokinetic potential on a particle’s surface. It profoundly impacts the attractive or repulsive force between particles and a colloid’s rheological behavior. Using response surface methodology, the linear terms of the HLB number (X1), surfactant concentration (X3), and evaporation temperature (X4), as well as quadratic terms of the HLB number and evaporation temperature (X4), were observed to be significantly associated with the nanodispersions’ zeta-potential, with p-values of 0.0001, 0.0031, 0.0256, 0.0001, and 0.0042, respectively.
From Figure 3c, it can be seen that the formulation’s HLB number significantly affects the zeta potential of the nanodispersions. As the HLB number of the formulation increases, the zeta potential of the formulation approaches zero. At zeta potentials below 40 mV, the particles aggregate and coalesce. A significant modification to the formulation composition and preparation conditions resulted in the control of growth of particles for two weeks. Particle growth increased by 15% when the HLB number and evaporation temperature were at their maximum. The nanodispersions prepared from micelles with a high ethanol content showed relatively higher particle growth rates; up to 30% particle growth was observed for formulations with higher HLB numbers and higher evaporation temperatures. In addition, the growth of the particles was not significantly affected by varying the surfactant concentration or the evaporation duration.

3.5. Optimization of GA-Loaded Nanodispersions
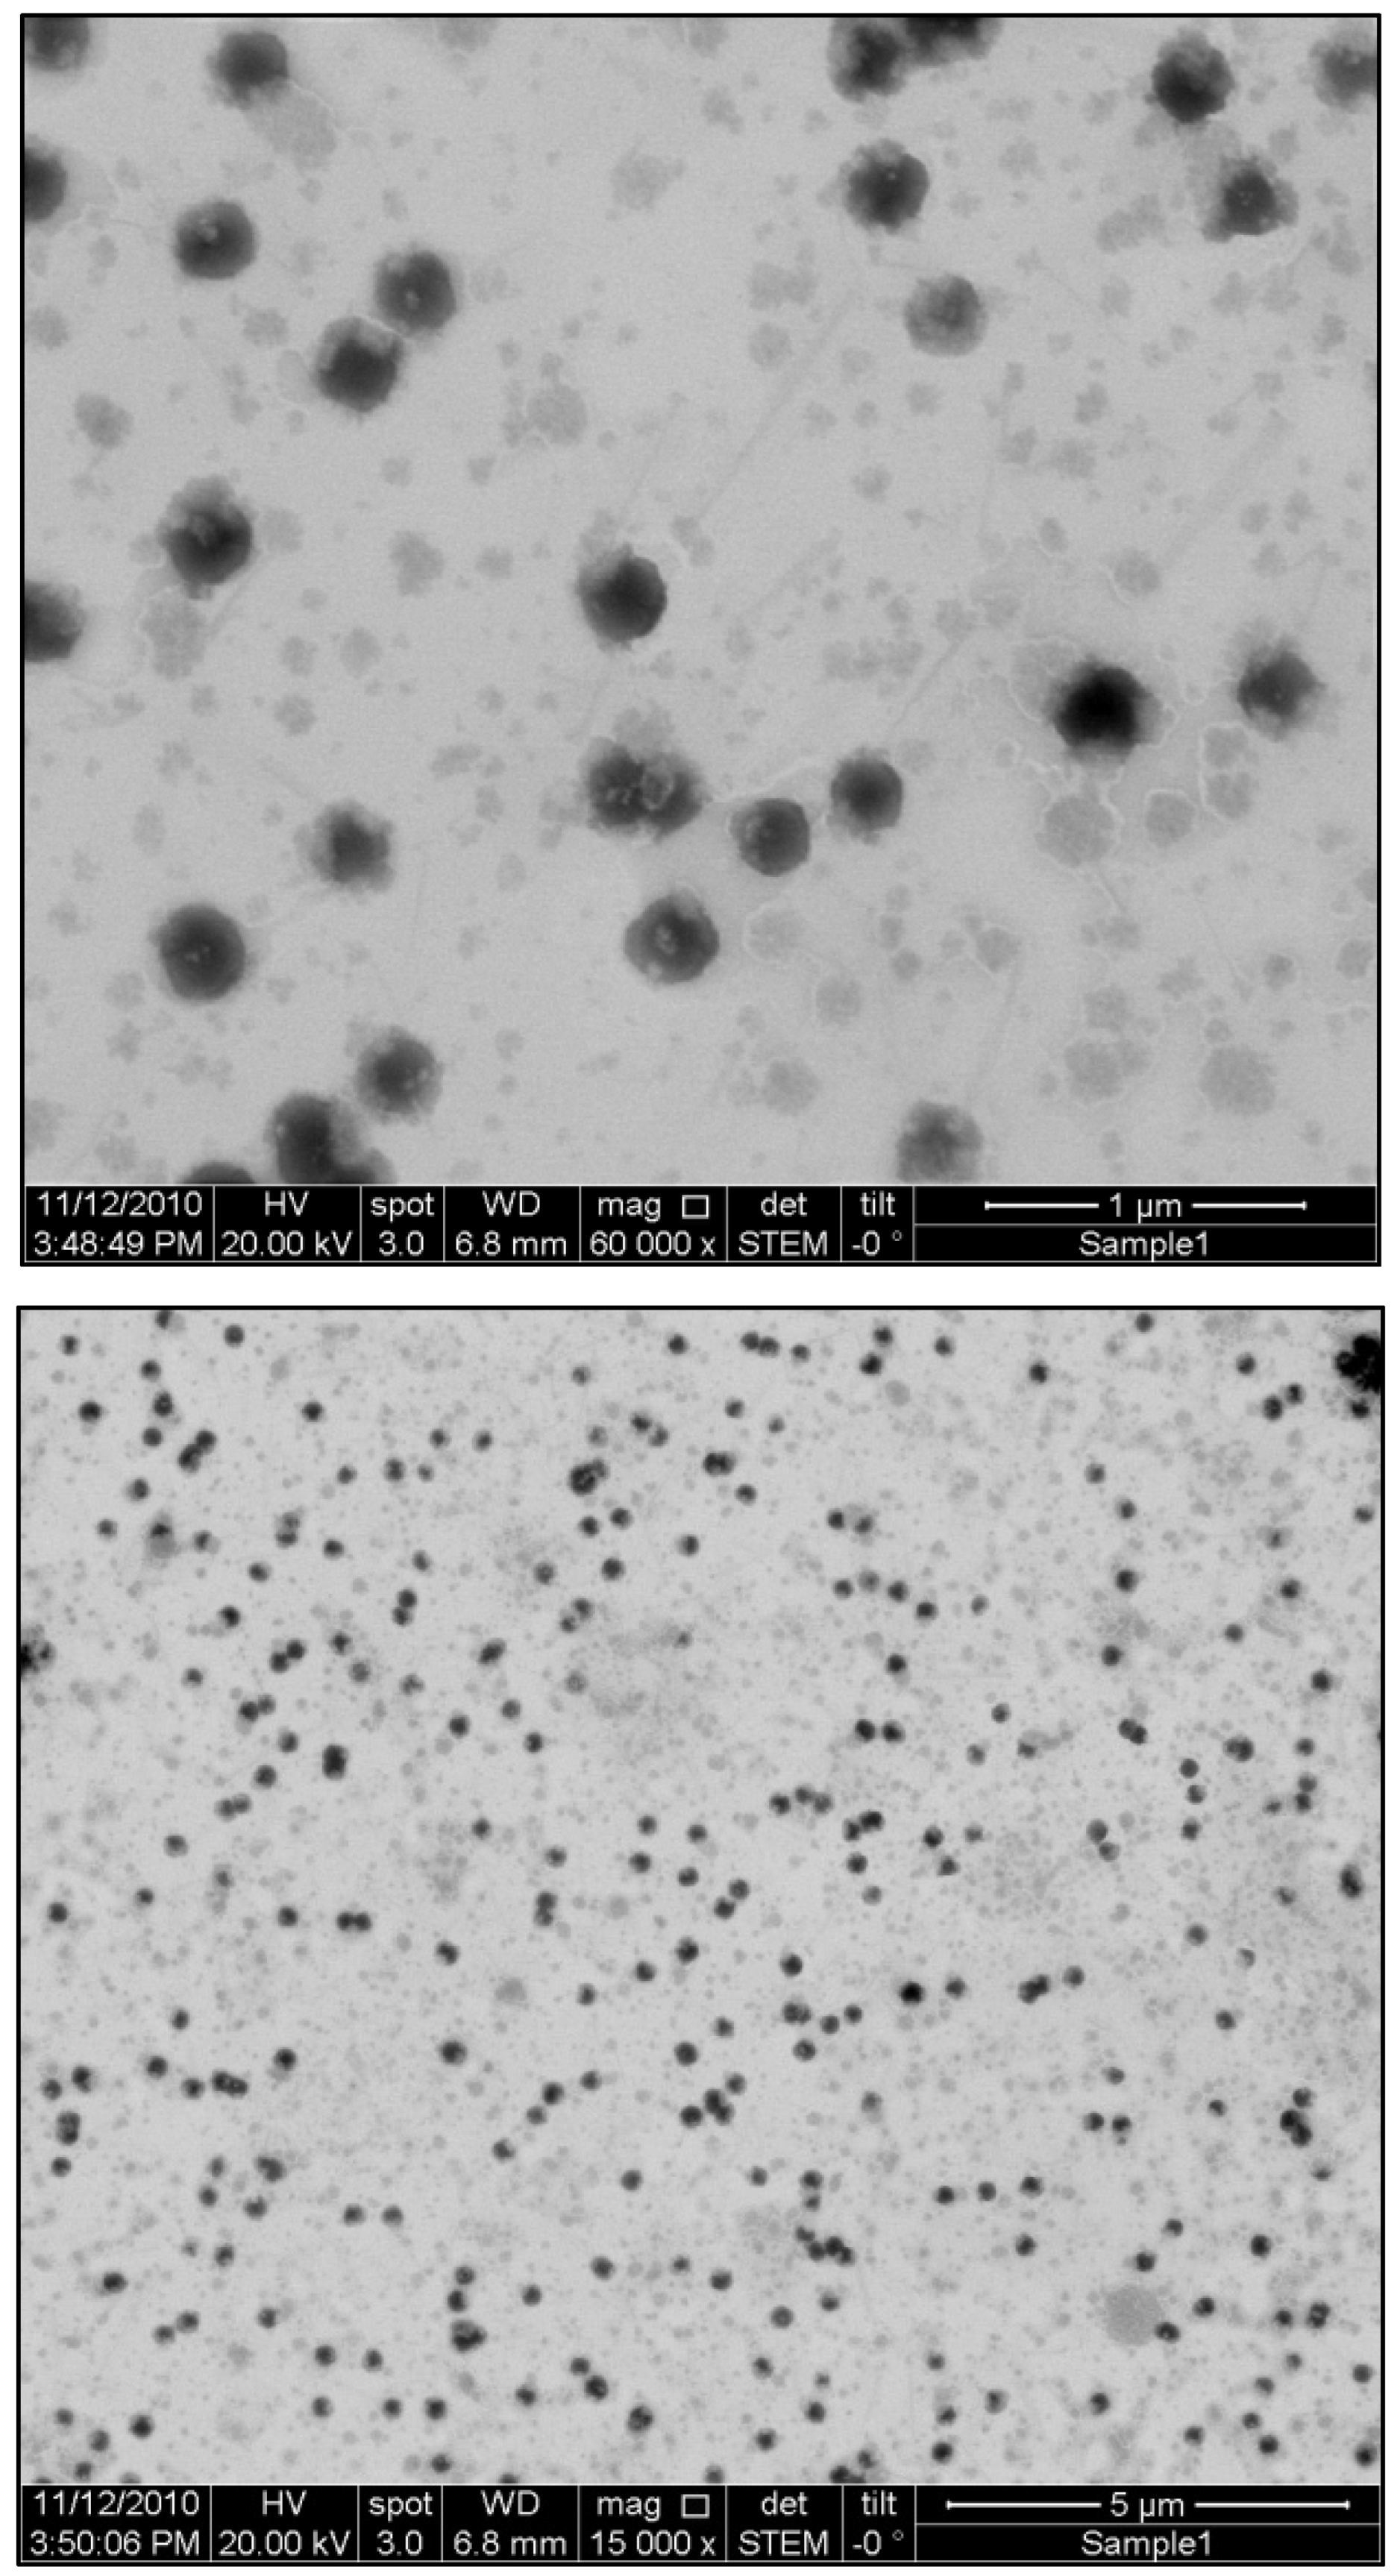
It is possible to describe a multi-objective optimization strategy as a strategy that transforms the predicted values of the response variables into a desirability value dj, where 0 ≤ di ≤ 1. dj represents the likelihood of a desirable outcome provided by the model, as shown in Equation (3), and an increasing di indicates a higher probability of desirable outcomes.
D e s i r a b i l i t y = d 1   × d 2   × × d k     1 / k
By referencing the simulation results, it was determined that the optimal solution in this study has a desirability of 0.624.
The particle sizes, polydispersity indices, zeta-potentials, and percentage increases in the zeta-average of the nanodispersions formulated with 5% surfactant (Brij 56 and Span 20 weighted between three and seven) and 50% GA solution were determined to be 126.01, 0.292, −51.11, and 0.2013, respectively, after two weeks of storage due to evaporation at 50 °C after 25 min. The proposed optimal solution was verified, as shown in Table 3, and was determined to be acceptable. Based on the repeated experiments, an excellent level of agreement has been found, as described in Equation (4). After two weeks of storage, high accuracy was achieved for the response variables of particle size, polydispersity index, zeta potential, and percentage increase in zeta average, which were 97.57%, 98.97%, 89.81%, and 81.27%, respectively.
A c c u r a c y   % = 100 % V a l u e p r e d i c t e d V a l u e E x p e r i m e n t a l V a l u e p r e d i c t e d × 100 %
In summary, a more desirable formulation can be achieved if (1) a mixture of Brij 56 and Span 20 is used in a weight ratio of 3:7, (2) the evaporation temperature employed is as high as possible, and (3) GA concentrations are maintained at a high level so that the drug loading can be maximized and hydrophobic cores can integrate better with stabilizer barriers. While evaporation duration and surfactant concentration are considered insignificant process variables, reducing evaporation duration and surfactant concentration could reduce energy consumption and formulation toxicity.

3.6. STEM Imaging

We examined the surface morphologies of the GA-loaded nanodispersions using Field Emission Scanning Electron Microscopy (FESEM) and Scanning-Transmission Electron Microscopy (STEM). Figure 4 illustrates the optimal formulation for the GA nanodispersion as suggested by RSM. An examination of the nanodispersion particles reveals that they are spherical, with a diameter no greater than 200 nm and a very narrow particle distribution. The Dynamic Light Scattering (DLS) results are consistent with those obtained from the previous particle size measurements.

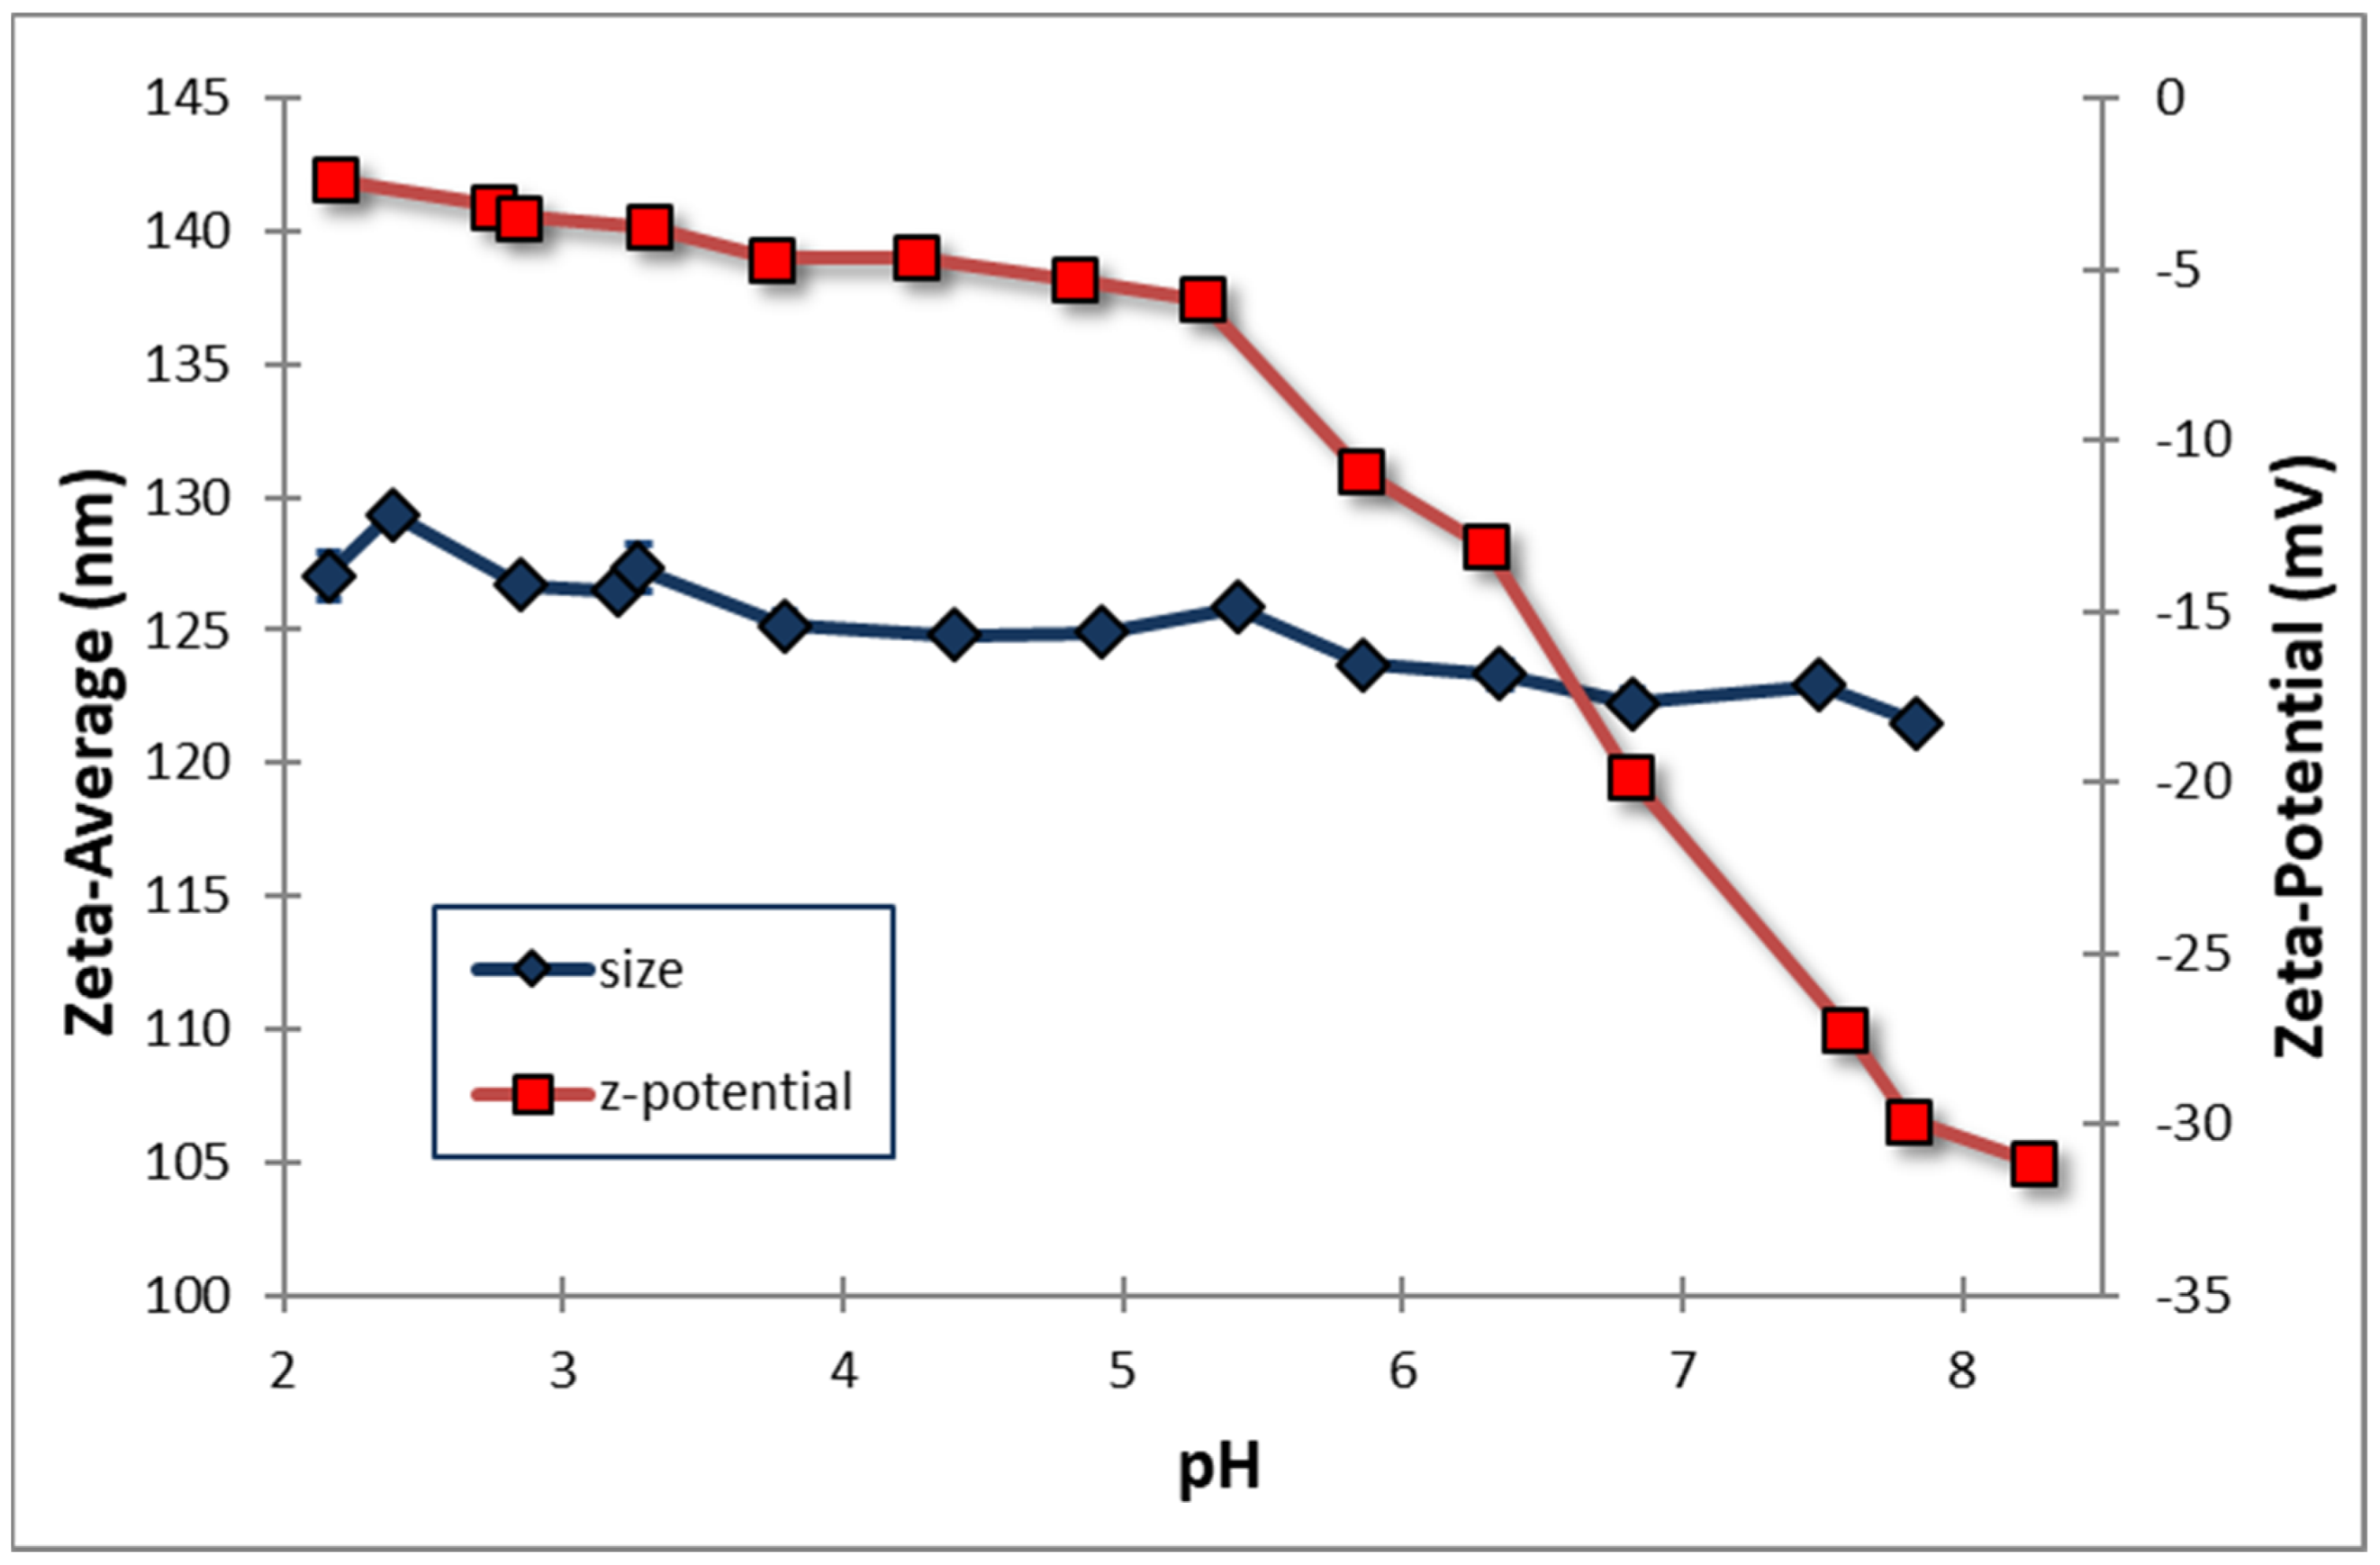
3.7. Effect of pH on Zeta Potential and Zeta Average of Particles

Figure 5 illustrates that pH significantly affects the zeta average and zeta potential of the particles in the nanodispersion formulations. Increasing the pH of the solution immediately decreased the particle’s zeta average; however, the degree of this reduction appears to be limited. As the pH of a solution changes from acid to alkaline, the zeta potential decreases; however, when the pH reaches 5, the zeta potential decreases abruptly. Dispersion behavior is determined by the zeta potential of particles, which is determined by their effective surface charge. Due to surface species or functional groups that cause particles to act as acids or bases, the effective surface charge can also be altered by varying the pH. Generally, the stability of particles is attributed to their negative charge [34]. As a result of the electrostatic repulsion between the particles, a higher energy barrier has been reported to prevent particles’ coalescence. In particular, GA-loaded nanodispersions exhibited a lower negative zeta potential (−3 mV to −31 mV) with a narrow particle size distribution. They demonstrated excellent stability with minimal aggregation under room temperature conditions.

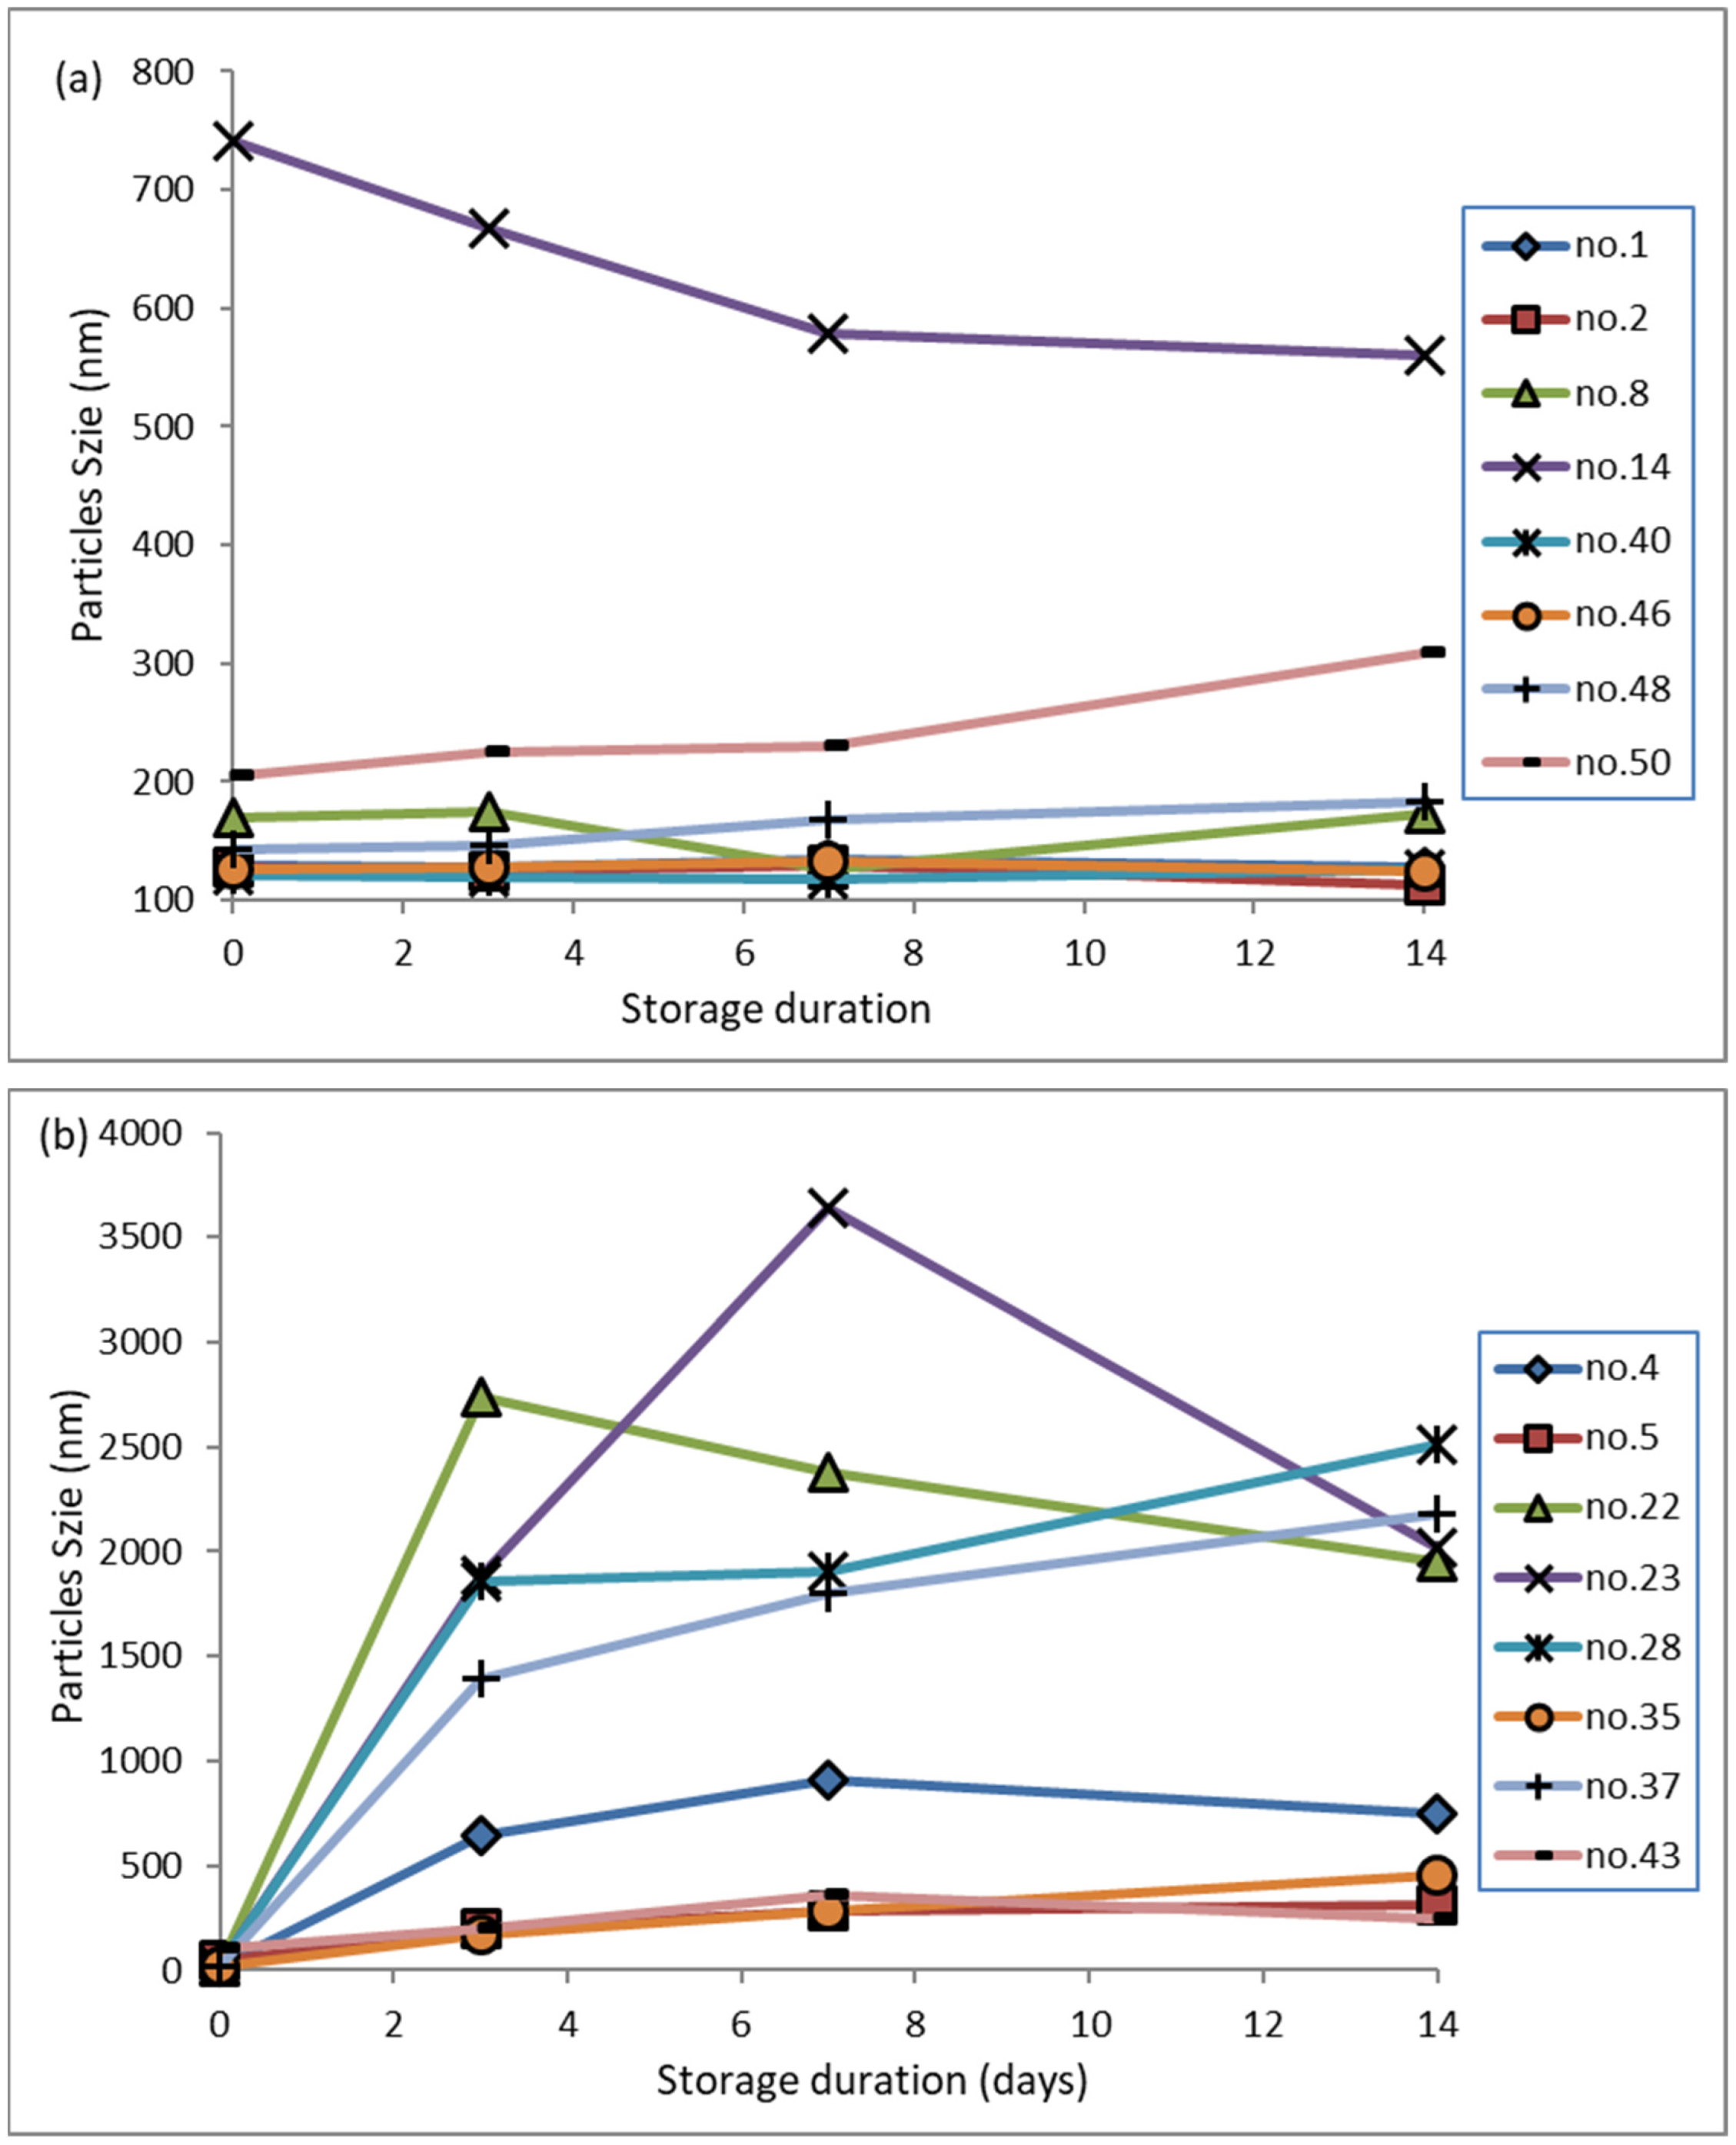
3.8. Stability during Storage for 14 Days

The physical stability of the nanodispersions was evaluated based on the particle size distribution over 14 days. Nanodispersions stabilized by surfactants with HLB numbers of 9.46 and 12.04 are shown in Figure 6a,b, respectively. A surfactant’s HLB number is a dominant factor influencing particle growth. A nanodispersion formulated with a surfactant with a low HLB number (9.46) can moderately control particle growth over 14 days. A nanodispersion generated using a surfactant with a higher HLB number (12.04) induces intense instability, resulting in exponential growth after three days. In addition, smaller particles have been demonstrated to have a superior ability to reduce particle growth. Brownian motion is more likely to occur when smaller particles are present; therefore, it is less likely that a group of smaller particles will adhere to each other. Some nanodispersions, however, showed a restrained particle growth rate (Figure 6a shows RSM runs 1, 8, 48, and 50). An increase in the evaporation temperature during solvent evaporation could have resulted in satisfactory ethanol removal. Due to the incomplete removal of residual ethanol from the hydrophobic core during evaporation, ethanol might have diffused from the hydrophobic core during storage and caused the nanodispersions to shrink.
Based on Figure 6b, it can be seen that the nanodispersions derived from micelles that contain a lower concentration of ethanol (organic core) are more prone to particle growth than other nanodispersions. A significant size increase was observed in RSM runs 22, 27, and 28, which was possibly due to a looser assembly of the drug’s hydrophobic core and stabilizer barrier, thereby causing the particles to grow up to 10 times larger over the first three days. An assembly of hydrophobic drug cores and stabilizer barriers can flow freely between particles because of the surface energy gradient of the smaller particles. As a result of this phenomenon, larger particles grow more rapidly. However, in this study, their growth rate decreased once the particles had grown beyond 1500 nm.

4. Conclusions

Ultrasound and solvent evaporation techniques have been employed to successfully produce nanodispersions of ganoderic acid (GA) for the first time. Our development of a quadratic response function enabled us to determine the process variables that most heavily induce smaller particle sizes, low polydispersity indices, high negative zeta potentials, and slow particle growth rates in nanodispersions. This method greatly enhances the oral bioavailability of poorly stable medicinal compounds such as GA examined in this study, which has remarkable antitumor and anti-inflammatory effects. Due to the nanoscale of the formulation, this drug can adsorb, penetrate, and be absorbed more effectively, thereby enhancing its therapeutic efficacy and reducing side effects. In summary, a good formulation should have a low concentration of surfactant and a high HLB. Higher evaporation temperatures facilitated the formation of nanodispersions with smaller particle sizes. The organic phase of a micellar system determines the stability of the corresponding particles. A spherical morphology was observed with a narrow particle size distribution in the optimized GA-loaded nanodispersions. The solution’s pH did not appear to affect the particle size distribution profiles. It is recommended that it would be beneficial to analyze the safety, efficacy, and performance of GA-loaded nanodispersions in vitro and in vivo in future studies.

Author Contributions

Data curation, original draft preparation, writing revisions, editing, and visualization, W.K.C. and K.W.T.; resources and review, P.G.C., C.H.P., Y.T. and S.Y.T.; supervision and project administration as well as review, S.M. All authors have read and agreed to the published version of the manuscript.

Funding

This research was conducted under the project “Novel Strategy of Ultrasonic Cavitation for the Generation of Nanoemulsions and Nanosuspensions in Pharmaceutical Preparations”. The financial assistance (Grant No. M0025.54.01) supported by the Ministry of Science, Technology, and Innovation (MOSTI) and the Xiamen University Malaysia Research Fund (XMUMRF/2022-C10/IENG/0048) is gratefully acknowledged by the authors. Special acknowledgement is expressed to the University of Nottingham as well as Andrew Yakin Sinit for his help in developing a distinct technique to capture the images of liquid nanodispersions with Field Emission Scanning Electron Microscopy (FESEM).

Institutional Review Board Statement

Not applicable.

Informed Consent Statement

Not applicable.

Data Availability Statement

Not applicable.

Conflicts of Interest

The authors declare no conflict of interest. The funders had no role in the study’s design; in the collection, analyses, or interpretation of data; in the writing of the manuscript, or in the decision to publish the results.

References

  1. Liang, C.; Tian, D.; Liu, Y.; Li, H.; Zhu, J.; Li, M.; Xin, M.; Xia, J. Review of the molecular mechanisms of Ganoderma lucidum triterpenoids: Ganoderic acids A, C2, D, F, DM, X and Y. Eur. J. Med. Chem. 2019, 174, 130–141. [Google Scholar] [CrossRef] [PubMed]
  2. Ren, A.; Shi, L.; Zhu, J.; Yu, H.; Jiang, A.; Zheng, H.; Zhao, M. Shedding light on the mechanisms underlying the environmental regulation of secondary metabolite ganoderic acid in Ganoderma lucidum using physiological and genetic methods. Fungal Genet. Biol. 2019, 128, 43–48. [Google Scholar] [CrossRef] [PubMed]
  3. Divya, M.; Aparna, C.; Mayank, R.; Singh, M.P. In-silico insights to identify the bioactive compounds of edible mushrooms as potential MMP9 inhibitor for Hepatitis-B. Res. J. Biotechnol. 2021, 16, 2. [Google Scholar]
  4. Meng, Y.; Ning, Q.; Liu, Y.; Pang, Y.; Ren, H.; Yang, T.; Li, H.; Li, S. Ganoderic Acid A suppresses the phenotypic modulation of pulmonary artery smooth muscle cells through the inactivation of PI3K/Akt pathway in pulmonary arterial hypertension. Food Sci. Technol. 2021, 42, e83221. [Google Scholar] [CrossRef]
  5. Shao, G.; He, J.; Meng, J.; Ma, A.; Geng, X.; Zhang, S.; Qiu, Z.; Lin, D.; Li, M.; Zhou, H.; et al. Ganoderic Acids Prevent Renal Ischemia Reperfusion Injury by Inhibiting Inflammation and Apoptosis. Int. J. Mol. Sci. 2021, 22, 10229. [Google Scholar] [CrossRef]
  6. Ryu, D.H.; Cho, J.Y.; Bin Sadiq, N.; Kim, J.-C.; Lee, B.; Hamayun, M.; Lee, T.S.; Kim, H.S.; Park, S.H.; Nho, C.W.; et al. Optimization of antioxidant, anti-diabetic, and anti-inflammatory activities and ganoderic acid content of differentially dried Ganoderma lucidum using response surface methodology. Food Chem. 2021, 335, 127645. [Google Scholar] [CrossRef]
  7. Cheng, P.G.; Teoh, T.C.; Rizman-Idid, M. Chemical Compounds and Computational Prediction of Their Inhibitory Effects on the HIV-1 gp120 Receptor by Lingzhi or Reishi Medicinal Mushroom, Ganoderma lucidum (Agaricomycetes), with Antler-Like Morphology of Fruiting Bodies. Int. J. Med. Mushrooms 2021, 23, 63–77. [Google Scholar] [CrossRef]
  8. Jia, Y.; Li, Y.; Shang, H.; Luo, Y.; Tian, Y. Ganoderic Acid A and Its Amide Derivatives as Potential Anti-Cancer Agents by Regulating the p53-MDM2 Pathway: Synthesis and Biological Evaluation. Molecules 2023, 28, 2374. [Google Scholar] [CrossRef]
  9. Akers, M.J. Excipient–Drug Interactions in Parenteral Formulations. J. Pharm. Sci. 2002, 91, 2283–2300. [Google Scholar] [CrossRef]
  10. Krzyzaniak, J.F.; Raymond, D.M.; Yalkowsky, S.H. Lysis of human red blood cells 2: Effect of contact time on cosolvent induced hemolysis. Int. J. Pharm. 1997, 152, 193–200. [Google Scholar] [CrossRef]
  11. Elzayat, A.; Adam-Cervera, I.; Álvarez-Bermúdez, O.; Muñoz-Espí, R. Nanoemulsions for synthesis of biomedical nanocarriers. Colloids Surf. B Biointerfaces 2021, 203, 111764. [Google Scholar] [CrossRef]
  12. Alshahrani, S.M. A judicious review on the applications of chemotherapeutic loaded nanoemulsions in cancer management. J. Drug Deliv. Sci. Technol. 2022, 68, 103085. [Google Scholar] [CrossRef]
  13. Madawi, E.A.; Al Jayoush, A.R.; Rawas-Qalaji, M.; Thu, H.E.; Khan, S.; Sohail, M.; Mahmood, A.; Hussain, Z. Polymeric Nanoparticles as Tunable Nanocarriers for Targeted Delivery of Drugs to Skin Tissues for Treatment of Topical Skin Diseases. Pharmaceutics 2023, 15, 657. [Google Scholar] [CrossRef]
  14. Lombardo, D.; Kiselev, M.A.J.P. Methods of liposomes preparation: Formation and control factors of versatile nanocarriers for biomedical and nanomedicine application. Pharmaceutics 2022, 14, 543. [Google Scholar] [CrossRef]
  15. Moulahoum, H.; Ghorbanizamani, F.; Zihnioglu, F.; Timur, S. Surface Biomodification of Liposomes and Polymersomes for Efficient Targeted Drug Delivery. Bioconjugate Chem. 2021, 32, 1491–1502. [Google Scholar] [CrossRef]
  16. Min, B.-S.; Nakamura, N.; Miyashiro, H.; Bae, K.-W.; Hattori, M. Triterpenes from the Spores of Ganoderma lucidum and Their Inhibitory Activity against HIV-1 Protease. Chem. Pharm. Bull. 1998, 46, 1607–1612. [Google Scholar] [CrossRef] [Green Version]
  17. Min, B.-S.; Gao, J.-J.; Nakamura, N.; Hattori, M. Triterpenes from the Spores of Ganoderma lucidum and Their Cytotoxicity against Meth-A and LLC Tumor Cells. Chem. Pharm. Bull. 2000, 48, 1026–1033. [Google Scholar] [CrossRef] [Green Version]
  18. Tan, C.P.; Nakajima, M. Effect of polyglycerol esters of fatty acids on physicochemical properties and stability of β-carotene nanodispersions prepared by emulsification/evaporation method. J. Sci. Food Agric. 2005, 85, 121–126. [Google Scholar] [CrossRef]
  19. Tan, C.P.; Nakajima, M. β-Carotene nanodispersions: Preparation, characterization and stability evaluation. Food Chem. 2005, 92, 661–671. [Google Scholar] [CrossRef]
  20. Cheong, J.N.; Tan, C.P.; Man, Y.B.C.; Misran, M. α-Tocopherol nanodispersions: Preparation, characterization and stability evaluation. J. Food Eng. 2008, 89, 204–209. [Google Scholar] [CrossRef]
  21. Anarjan, N.; Mirhosseini, H.; Baharin, B.S.; Tan, C.P. Effect of processing conditions on physicochemical properties of sodium caseinate-stabilized astaxanthin nanodispersions. LWT 2011, 44, 1658–1665. [Google Scholar] [CrossRef]
  22. Leong, W.F.; Man, Y.B.C.; Lai, O.M.; Long, K.; Nakajima, M.; Tan, C.P. Effect of sucrose fatty acid esters on the particle characteristics and flow properties of phytosterol nanodispersions. J. Food Eng. 2011, 104, 63–69. [Google Scholar] [CrossRef]
  23. Ribeiro, H.S.; Chu, B.-S.; Ichikawa, S.; Nakajima, M. Preparation of nanodispersions containing β-carotene by solvent displacement method. Food Hydrocoll. 2008, 22, 12–17. [Google Scholar] [CrossRef]
  24. Chakraborty, S.; Shukla, D.; Vuddanda, P.R.; Mishra, B.; Singh, S. Utilization of adsorption technique in the development of oral delivery system of lipid based nanoparticles. Colloids Surf. B Biointerfaces 2010, 81, 563–569. [Google Scholar] [CrossRef]
  25. Margulis-Goshen, K.; Netivi, H.D.; Major, D.T.; Gradzielski, M.; Raviv, U.; Magdassi, S. Formation of organic nanoparticles from volatile microemulsions. J. Colloid Interface Sci. 2010, 342, 283–292. [Google Scholar] [CrossRef]
  26. Bezerra, M.A.; Santelli, R.E.; Oliveira, E.P.; Villar, L.S.; Escaleira, L.A. Response surface methodology (RSM) as a tool for optimization in analytical chemistry. Talanta 2008, 76, 965–977. [Google Scholar] [CrossRef]
  27. Ali, H.S.; York, P.; Amani, A.; Blagden, N. Evaluation of a Nanodispersion Formulation Prepared through Microfluidic Reactors for Pulmonary Delivery of Budesonide Using Nebulizers. Iran. J. Pharm. Res. IJPR 2014, 13, 785–795. [Google Scholar]
  28. Singh, S.; Muthu, M.S. Preparation and characterization of nanoparticles containing an atypical antipsychotic agent. Nanomedicine 2007, 2, 233–240. [Google Scholar] [CrossRef]
  29. López, A.F.C.M.; Llinares, F.; Cortell, C.; Herraez, M. Comparative enhancer effects of Span (R) 20 with Tween (R) 20 and Azone (R) on the in vitro percutaneous penetration of compounds with different lipophilicities. Int. J. Pharm. 2000, 202, 133–140. [Google Scholar] [CrossRef]
  30. Azum, N.; Rub, M.A.; Asiri, A.M. Self-association and micro-environmental properties of sodium salt of ibuprofen with BRIJ-56 under the influence of aqueous/urea solution. J. Dispers. Sci. Technol. 2017, 38, 96–104. [Google Scholar] [CrossRef]
  31. Biruss, B.; Valenta, C. The advantage of polymer addition to a non-ionic oil in water microemulsion for the dermal delivery of progesterone. Int. J. Pharm. 2008, 349, 269–273. [Google Scholar] [CrossRef]
  32. Sivakumar, M.; Tang, S.Y.; Tan, K.W. Cavitation technology—A greener processing technique for the generation of pharmaceutical nanoemulsions. Ultrason. Sonochem. 2014, 21, 2069–2083. [Google Scholar] [CrossRef]
  33. Danaei, M.; Dehghankhold, M.; Ataei, S.; Hasanzadeh Davarani, F.; Javanmard, R.; Dokhani, A.; Khorasani, S.; Mozafari, M.R. Impact of Particle Size and Polydispersity Index on the Clinical Applications of Lipidic Nanocarrier Systems. Pharmaceutics 2018, 10, 57. [Google Scholar] [CrossRef] [Green Version]
  34. Samimi, S.; Maghsoudnia, N.; Baradaran Eftekhari, R.; Dorkoosh, F. Chapter 3—Lipid-Based Nanoparticles for Drug Delivery Systems. In Characterization and Biology of Nanomaterials for Drug Delivery; Mohapatra, S.S., Ranjan, S., Dasgupta, N., Kumar, R., Thomas, S., Eds.; Elsevier: Amsterdam, The Netherlands, 2019; pp. 47–76. [Google Scholar]
Figure 1. Matured Ganoderma obtained from GanoFarm Sdn. Bhd (Malaysia).
Sustainability 15 09929 g001
Figure 2. A method for preparing GA-loaded nanodispersions using ultrasonic cavitation and solvent evaporation. Various factors, including formulation composition and processing conditions, were extensively studied using Response Surface Methodology (RSM).
Sustainability 15 09929 g002
Figure 3. The 3D quadric surface suggested by the CCD design model for the following responses: (a) particle size, (b) polydispersity index, (c) zeta-potential, and (d) percentage increase in the zeta-average after 14 days of storage. “HLB” indicates the hydrophobic–lipophilic balance number of the formulation; “α” indicates the GA solution-to-water weight ratio; “γ” indicates the surfactant-to-water weight ratio; “T” indicates the evaporation temperature; and “d” indicates the duration of evaporation.
Sustainability 15 09929 g003aSustainability 15 09929 g003bSustainability 15 09929 g003cSustainability 15 09929 g003d
Figure 4. STEM images of the GA nanodispersion formulation obtained through RSM.
Sustainability 15 09929 g004
Figure 5. The effect of solution pH on the zeta average and zeta potential of the obtained GA nanodispersions.
Sustainability 15 09929 g005
Figure 6. Particle growth of the formulated GA nanodispersions from different RSM experiments (Table 2): (a) behavior when the formulation’s HLB value was controlled at 9.46, and (b) behavior the formulation’s HLB value was controlled at 12.04. Surfactant-to-water weight ratio (γ) was controlled at 0.05 in all the formulations. All measurements demonstrated a standard deviation of no more than 1.75 nm.
Sustainability 15 09929 g006
Table 1. Factor levels and their corresponding values.
Independent Variables−101
A: Hydrophilic–Lipophilic Balance (HLB) number9.4610.7512.04
B: GA-to-water weight ratio (α)0.20.350.5
C: Surfactant-to-water weight ratio (γ)0.050.10.15
D: Evaporation temperature (T)404550
E: Duration (d)102030
Table 2. A comparison between actual values obtained from RSM experiments and predicted values obtained from RSM simulations and the differences between them (residual).
Particle SizePolydispersity IndexZeta-Potential% Increase in Zeta-Average after 2 Weeks of Storage
ExpActualPredictedActualPredictedActualPredictedActualPredicted
No.ValueValueResidualValueValueResidualValueValueResidualValueValueResidual
1155.00264.69−109.690.330.39−0.06−61.10−62.991.89−0.01−1.461.45
2160.10112.6647.440.340.260.08−63.70−62.97−0.73−0.11−3.913.80
3176.03209.48−33.450.890.730.16−9.75−2.63−7.123.9915.32−11.34
4225.00239.47−14.470.500.50−0.01−21.20−20.90−0.3040.4832.727.77
5351.90295.7156.190.970.710.26−15.20−16.331.135.7511.40−5.65
6103.1036.8066.300.360.310.05−25.80−26.690.890.0214.83−14.81
7116.7066.7849.920.620.490.12−15.70−13.83−1.875.627.97−2.35
8300.80309.00−8.200.360.320.04−63.80−59.96−3.840.029.14−9.13
914.0031.43−17.430.760.670.09−17.10−14.65−2.4530.4027.622.78
10204.80150.3254.480.470.410.06−37.50−35.05−2.450.702.58−1.88
11138.10135.422.680.460.440.02−35.10−24.23−10.87−0.010.42−0.43
12233.40274.21−40.810.230.180.05−46.70−47.400.700.02−1.741.76
13565.50547.7417.760.490.440.05−57.10−55.83−1.270.074.43−4.36
14227.40279.35−51.950.660.68−0.02−60.80−58.26−2.54−0.24−4.894.65
15107.60190.84−83.240.520.460.06−34.20−30.25−3.950.09−10.0810.16
16355.00370.78−15.780.440.78−0.33−58.10−58.300.20−0.13−3.753.62
17287.30316.03−28.730.510.470.04−55.50−57.491.99−0.061.31−1.36
18186.00136.3649.640.300.37−0.08−40.70−34.05−6.650.024.33−4.30
1931.01106.22−75.210.300.41−0.11−9.45−9.550.10---
20132.50184.83−52.330.520.450.07−27.80−26.62−1.180.023.72−3.70
21308.10235.9972.111.000.920.08−9.22−12.933.71−0.90−0.53−0.37
22145.50191.22−45.720.390.46−0.07−14.90−17.012.11---
23209.80201.907.900.380.48−0.10−18.30−19.160.86---
24313.60283.8629.740.260.34−0.08−45.90−48.852.950.12−3.103.22
25135.10135.42−0.320.450.440.01−14.10−24.2310.131.820.421.39
26431.30397.1234.180.470.420.05−56.60−57.731.130.021.57−1.54
27170.60225.90−55.300.280.31−0.03−40.80−39.88−0.92−0.0710.26−10.33
28126.1096.0330.070.320.38−0.06−13.00−15.612.61---
29544.70503.2241.480.290.150.14−33.50−31.51−1.99−0.05−5.365.30
30235.00283.91−48.910.510.350.16−31.60−33.391.790.012.00−1.99
31313.50308.175.330.640.590.06−74.20−75.391.190.15−0.941.09
32168.50136.2032.300.350.39−0.04−56.90−55.84−1.070.10−3.873.97
33135.20135.42−0.220.450.440.01−14.30−24.239.930.030.42−0.39
3432.4722.509.970.270.42−0.15−8.16−15.126.9551.1137.6213.48
35316.50354.01−37.510.300.41−0.11−11.50−11.880.3822.0713.438.64
36136.50135.421.080.480.440.04−23.50−24.230.730.700.420.27
37435.50409.7925.710.300.34−0.04−8.23−12.123.89---
38229.30211.0218.280.310.37−0.06−8.29−6.37−1.92---
39131.80135.42−3.620.460.440.03−30.70−24.23−6.472.130.421.71
40204.30151.2753.030.460.400.06−60.80−61.901.100.04−0.450.49
41519.90454.5365.370.370.50−0.13−9.32−10.621.30---
42160.50189.45−28.950.320.36−0.04−13.00−14.231.23---
43173.90218.73−44.830.480.54−0.06−16.00−13.43−2.571.341.070.27
44129.40135.42−6.020.410.44−0.03−24.70−24.23−0.471.960.421.54
45134.40135.42−1.020.440.440.01−27.10−24.23−2.870.070.42−0.36
46208.80159.5249.280.550.440.11−60.30−61.441.14−0.02−1.401.37
47274.80241.7233.080.420.270.15−59.10−54.58−4.520.592.69−2.10
48194.70204.88−10.180.450.56−0.11−60.10−63.133.030.292.17−1.89
49120.70135.42−14.720.310.44−0.12−20.40−24.233.830.030.42−0.40
50198.47223.19−24.720.070.26−0.19−54.40−55.531.130.510.58−0.07
Table 3. RSM prediction accuracy.
Response VariablePredicted ValueExperimental ValueAccuracy (%)
Y1: Particle Size126.01129.0797.57%
Y2: Polydispersity Index0.2920.28998.97%
Y3: Zeta Potential−51.11−45.989.81%
Y4: % increase in Zeta Average after 2 weeks of storage0.20130.23981.27%
Disclaimer/Publisher’s Note: The statements, opinions and data contained in all publications are solely those of the individual author(s) and contributor(s) and not of MDPI and/or the editor(s). MDPI and/or the editor(s) disclaim responsibility for any injury to people or property resulting from any ideas, methods, instructions or products referred to in the content.

