
Optimum Design of an Electric Vehicle Charging Station Using a Renewable Power Generation System in South Korea

Abstract
:1. Introduction
2. Methodology
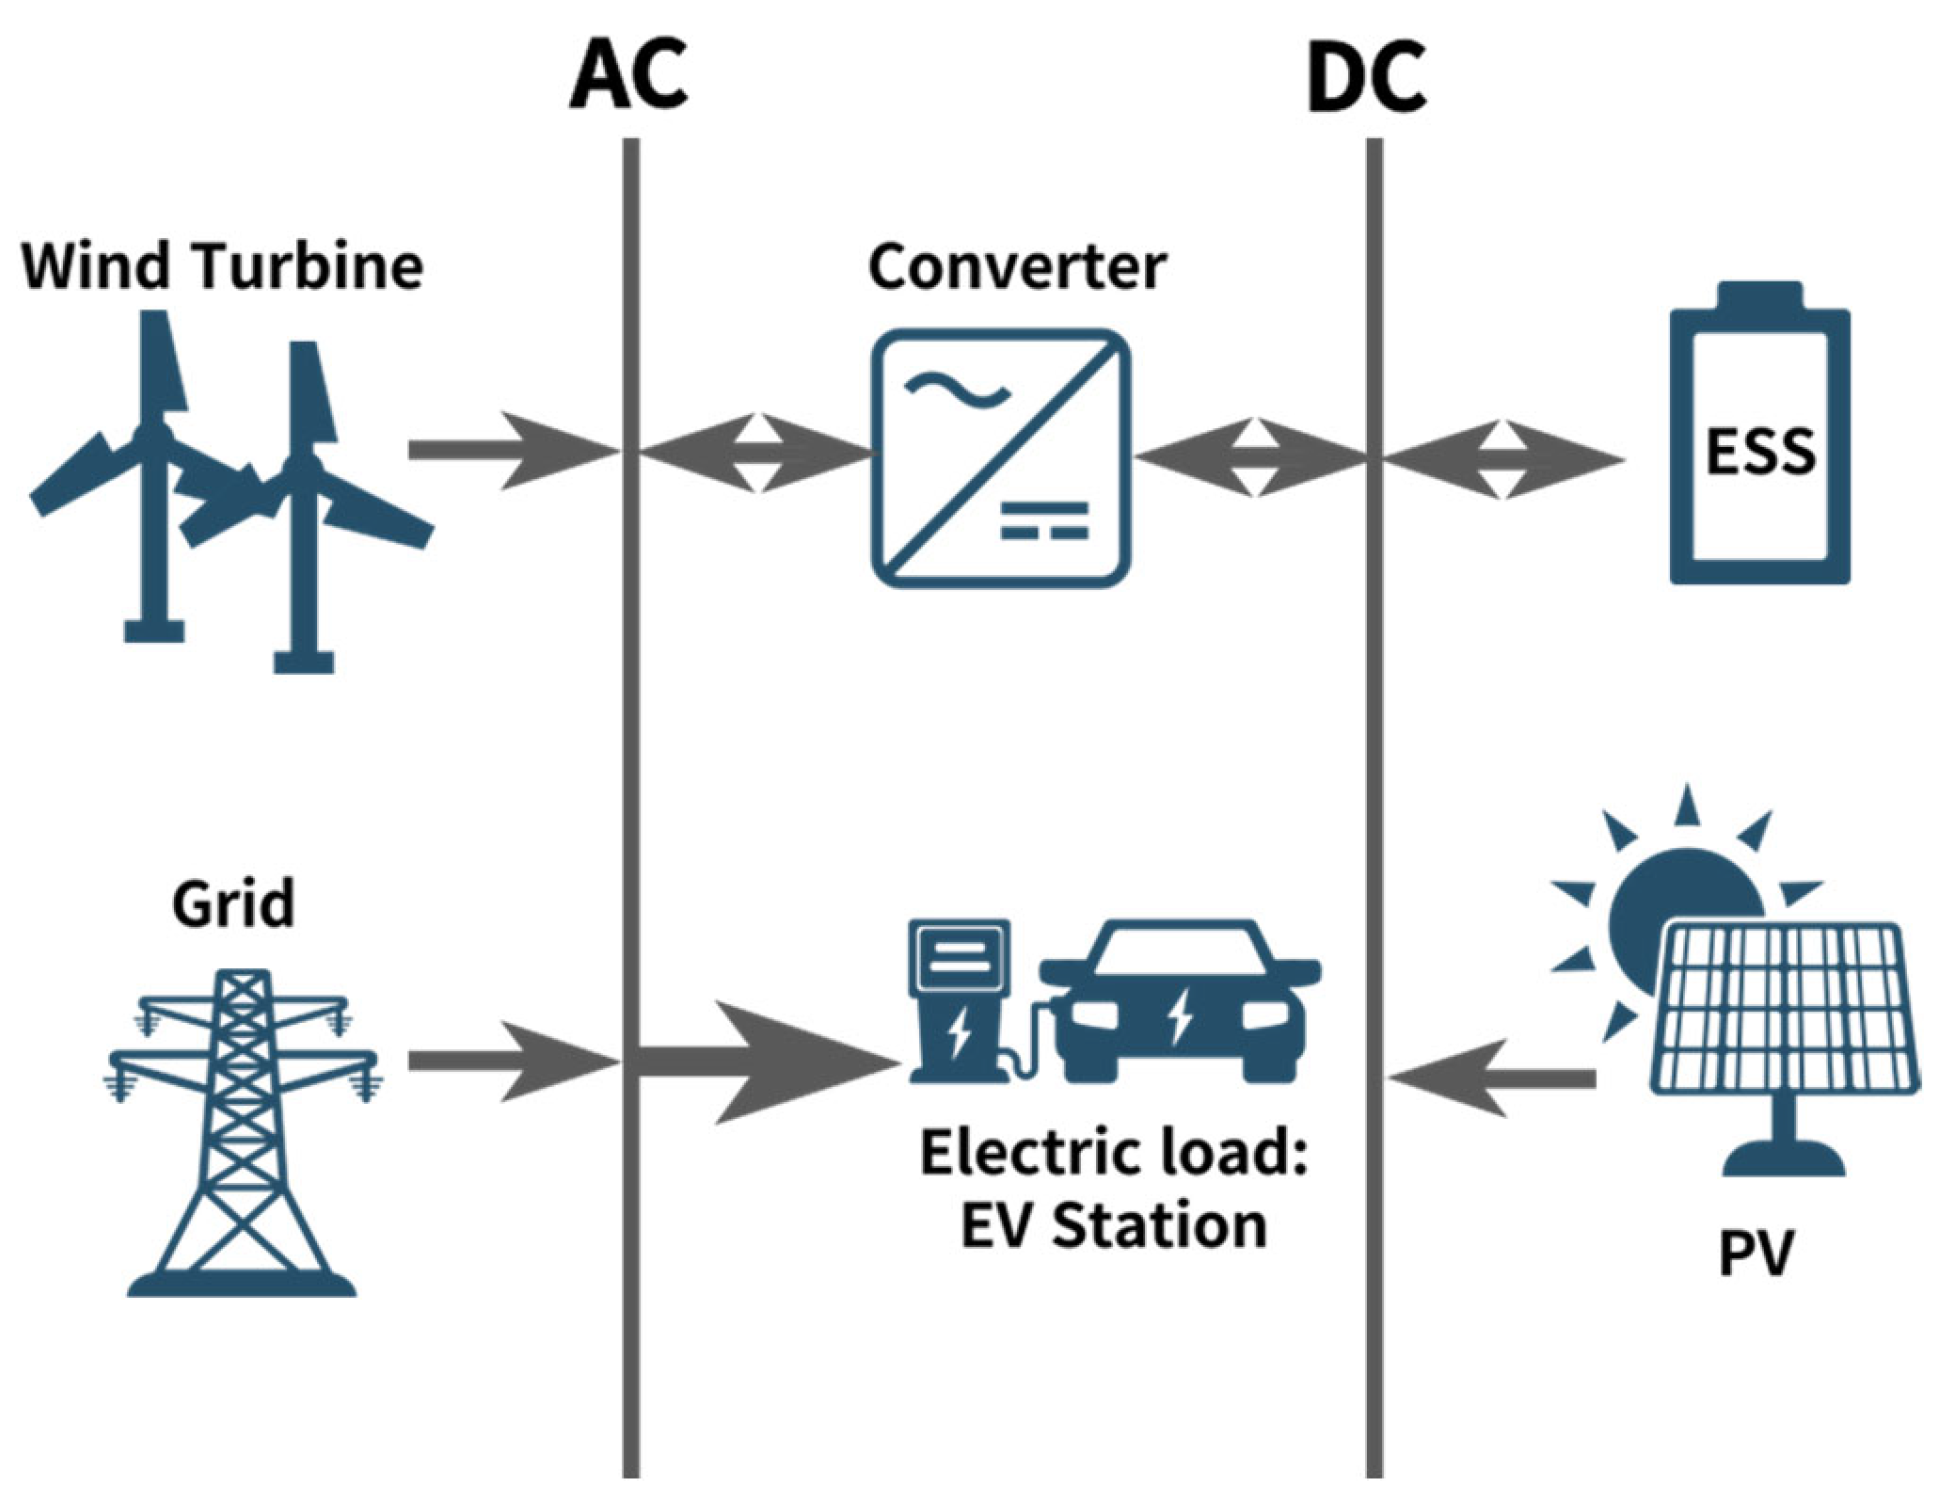
2.1. System Configuration
2.1.1. Solar PV Panels
2.1.2. Wind Turbine (WT)
2.1.3. Energy Storage System (ESS)
2.1.4. Connection to Utility Grid
2.2. Economic Evaluation
3. Case Study
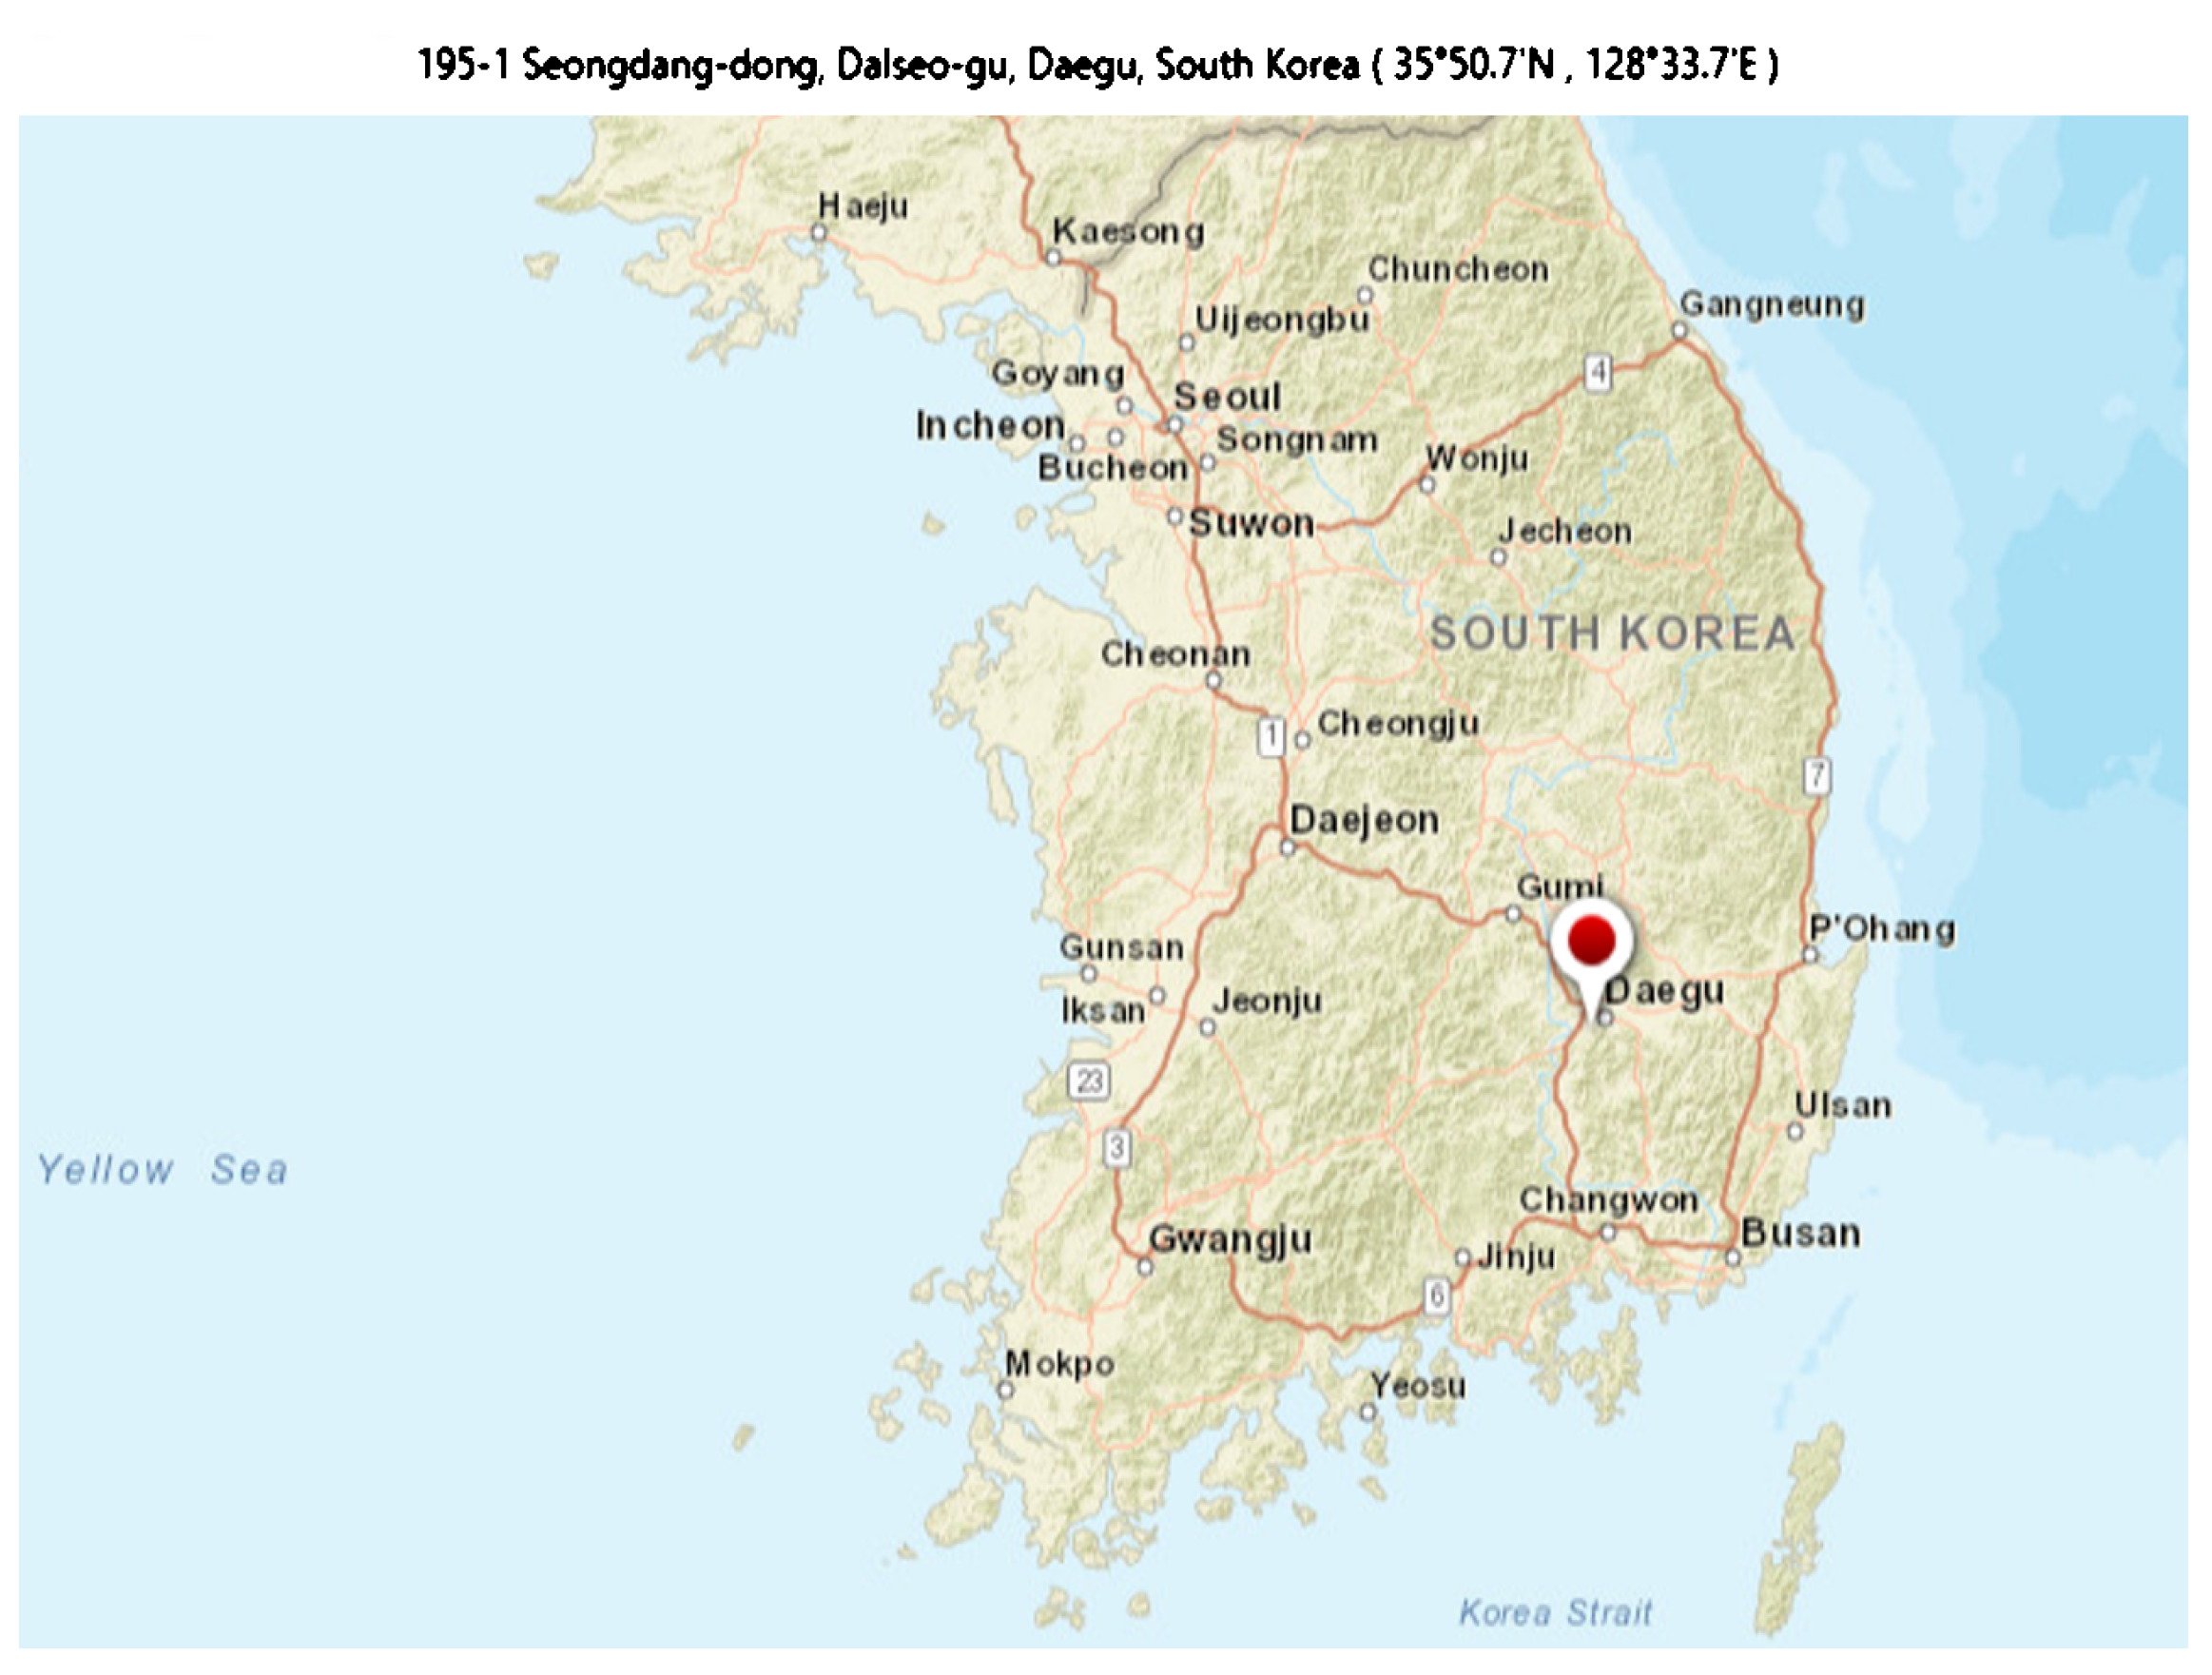
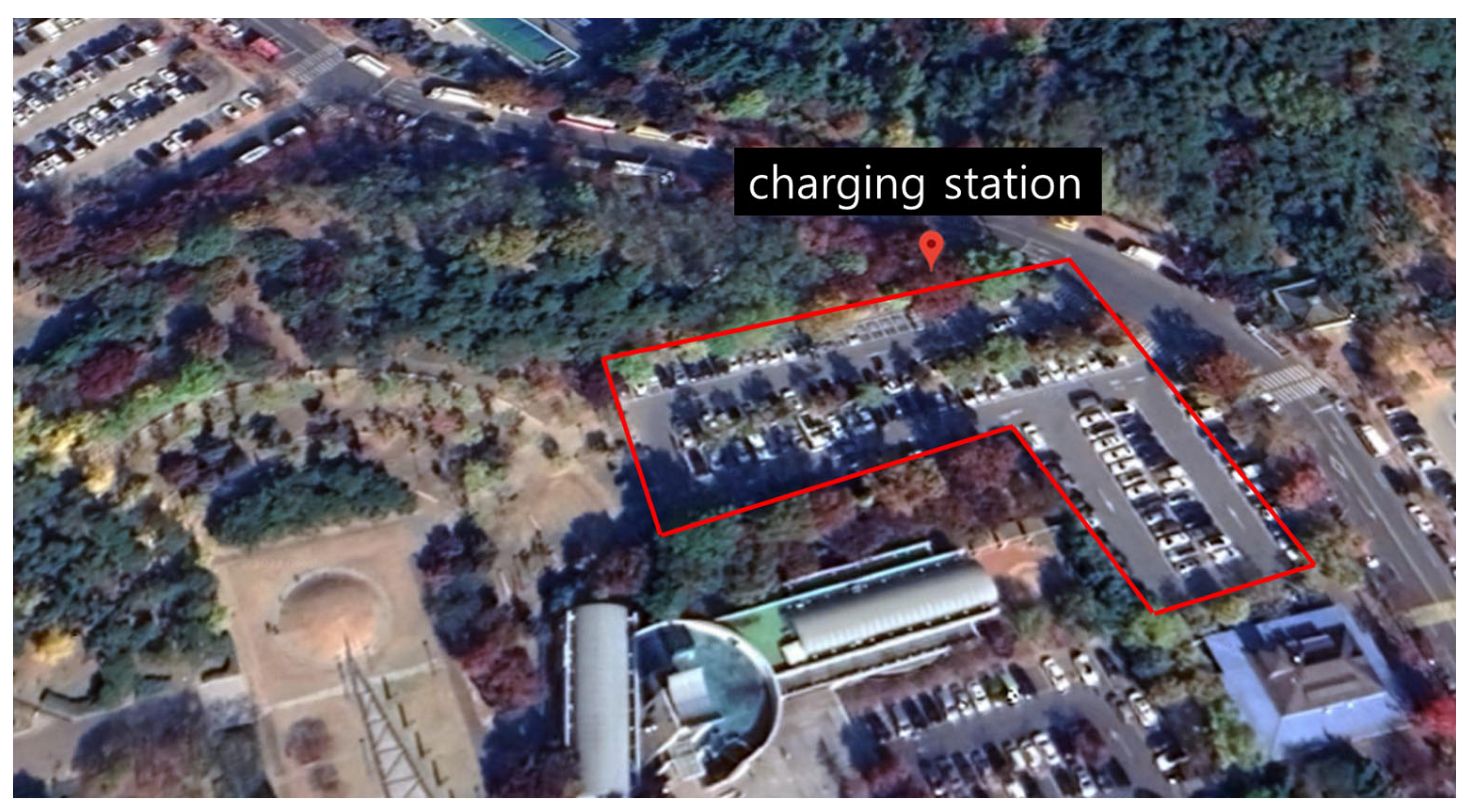
3.1. Selection of Charging Station Site
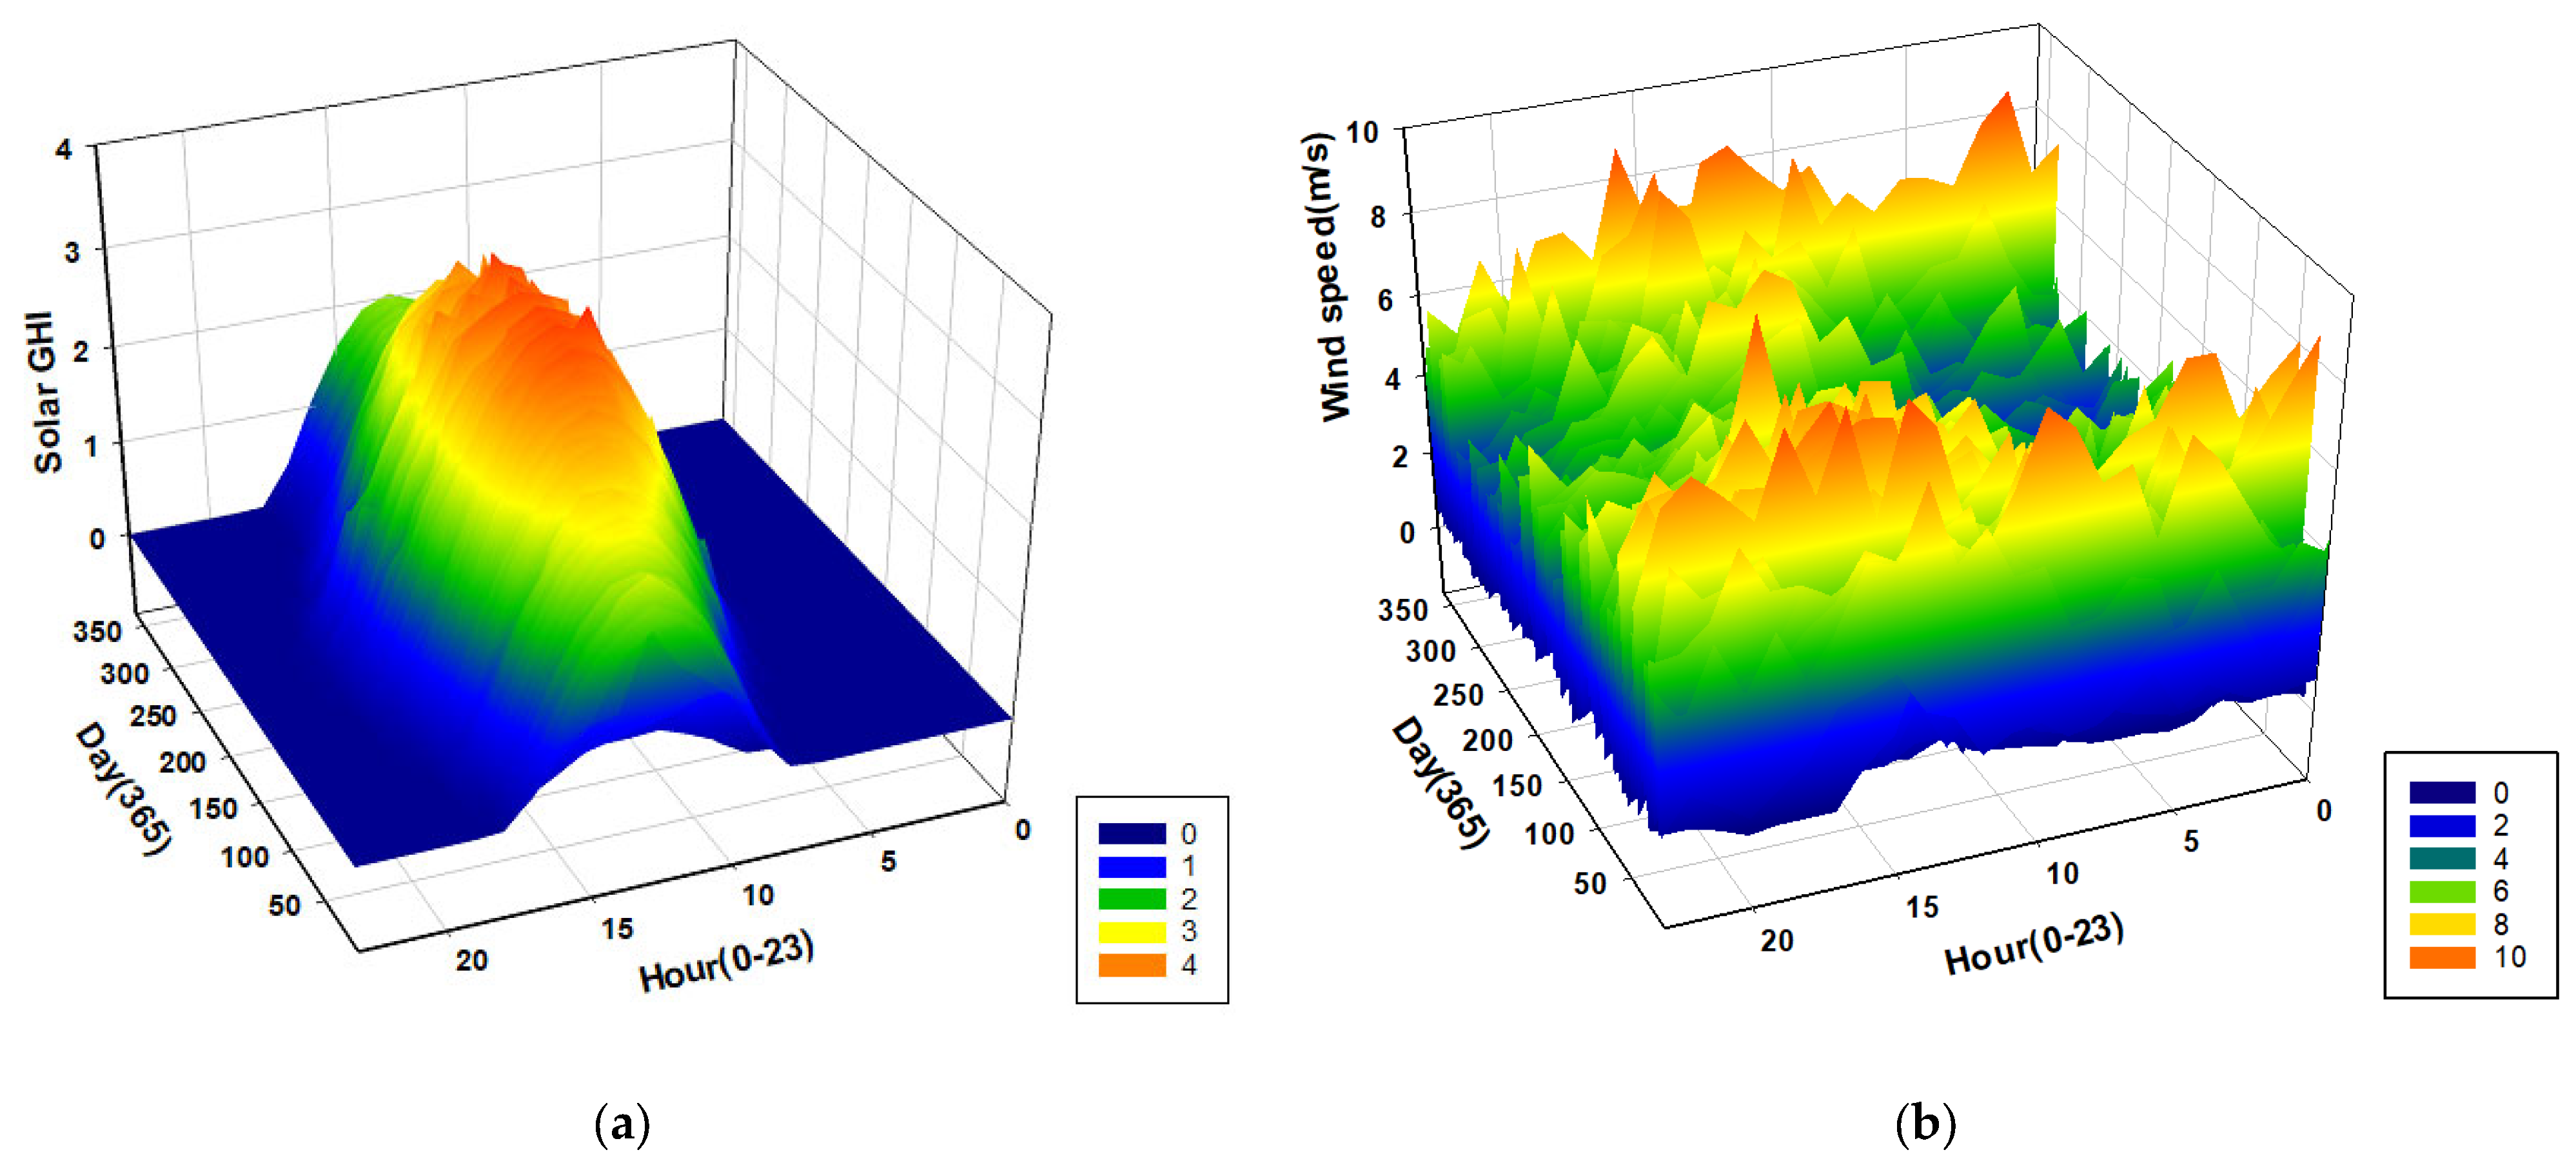
3.2. Meteorological Resources
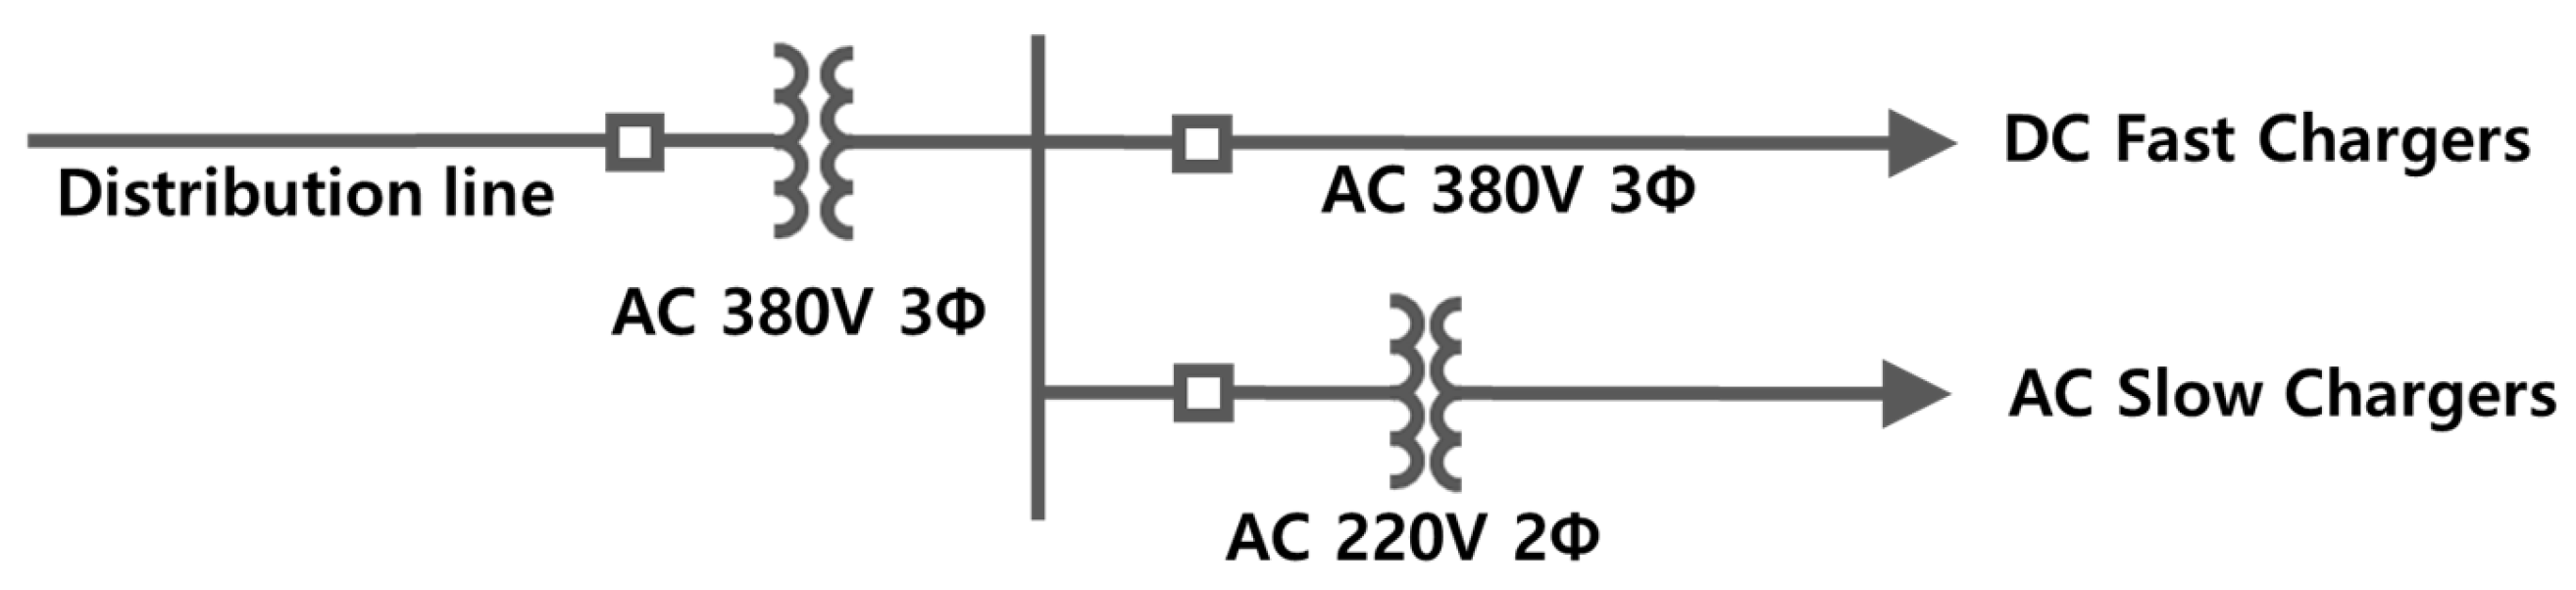
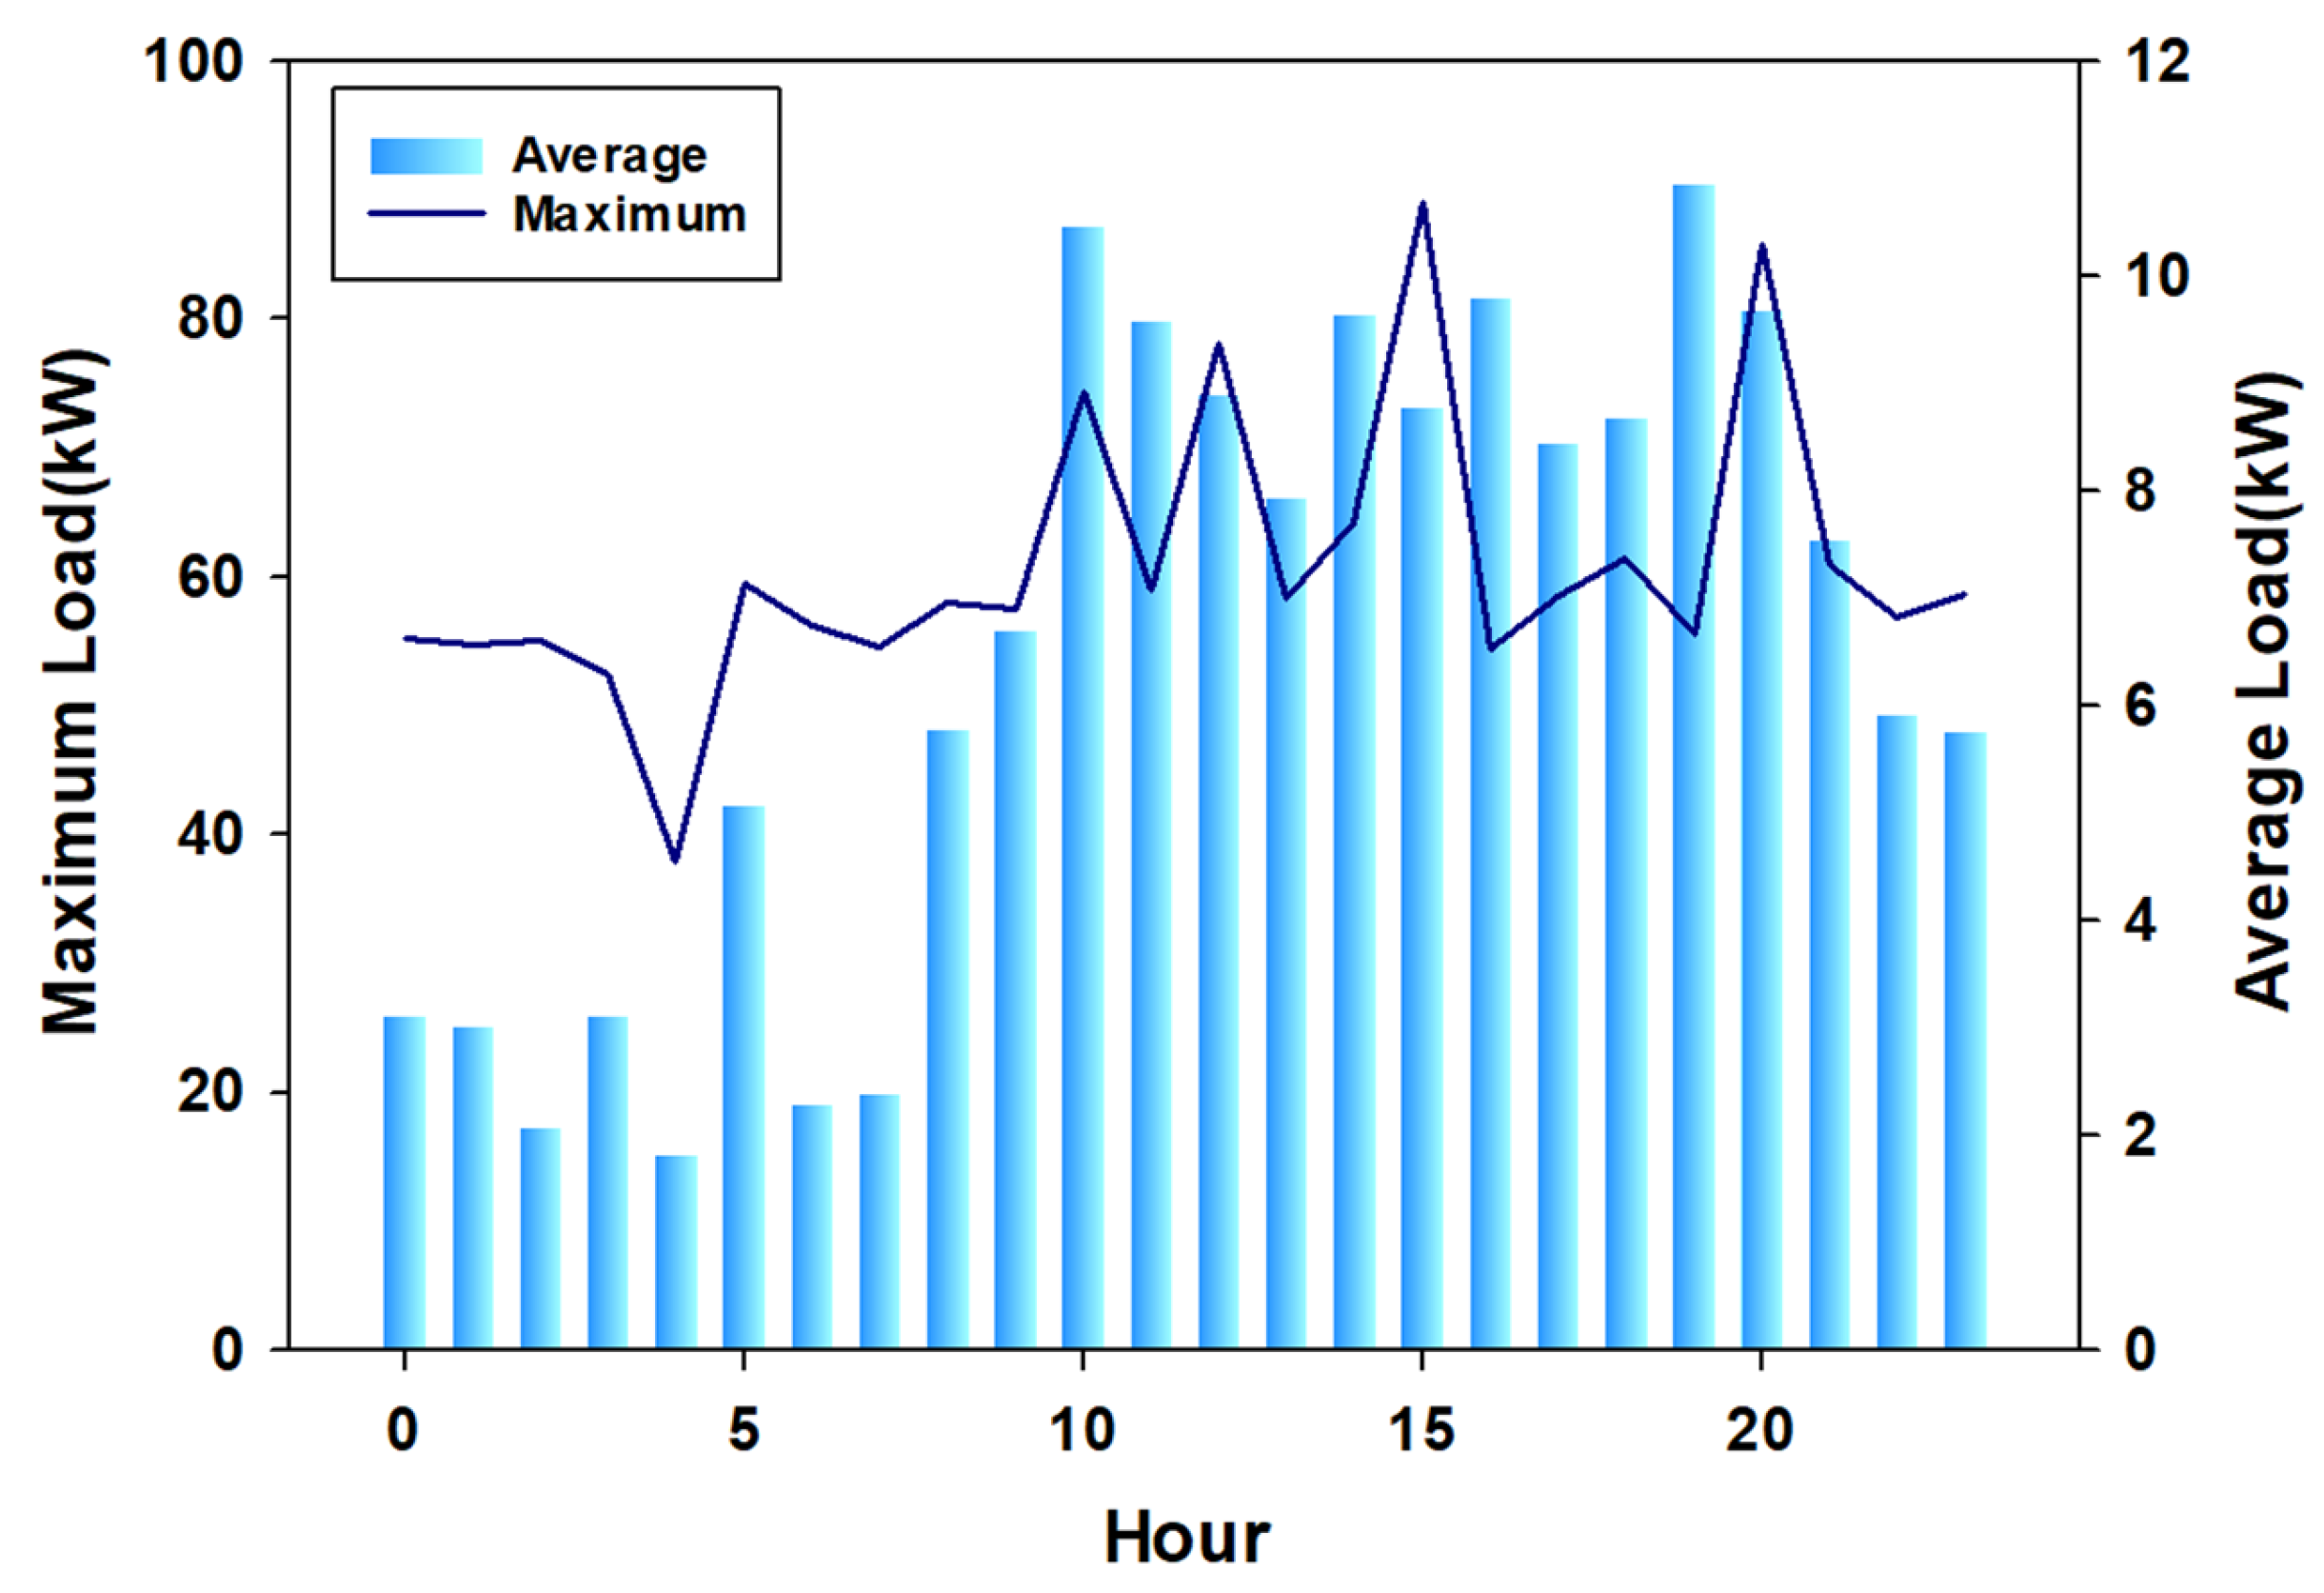
3.3. Load Demand
3.4. Utility Grid and Renewables
4. Results
4.1. Scenarios under Different REFs
4.2. Optimal Operation Strategy
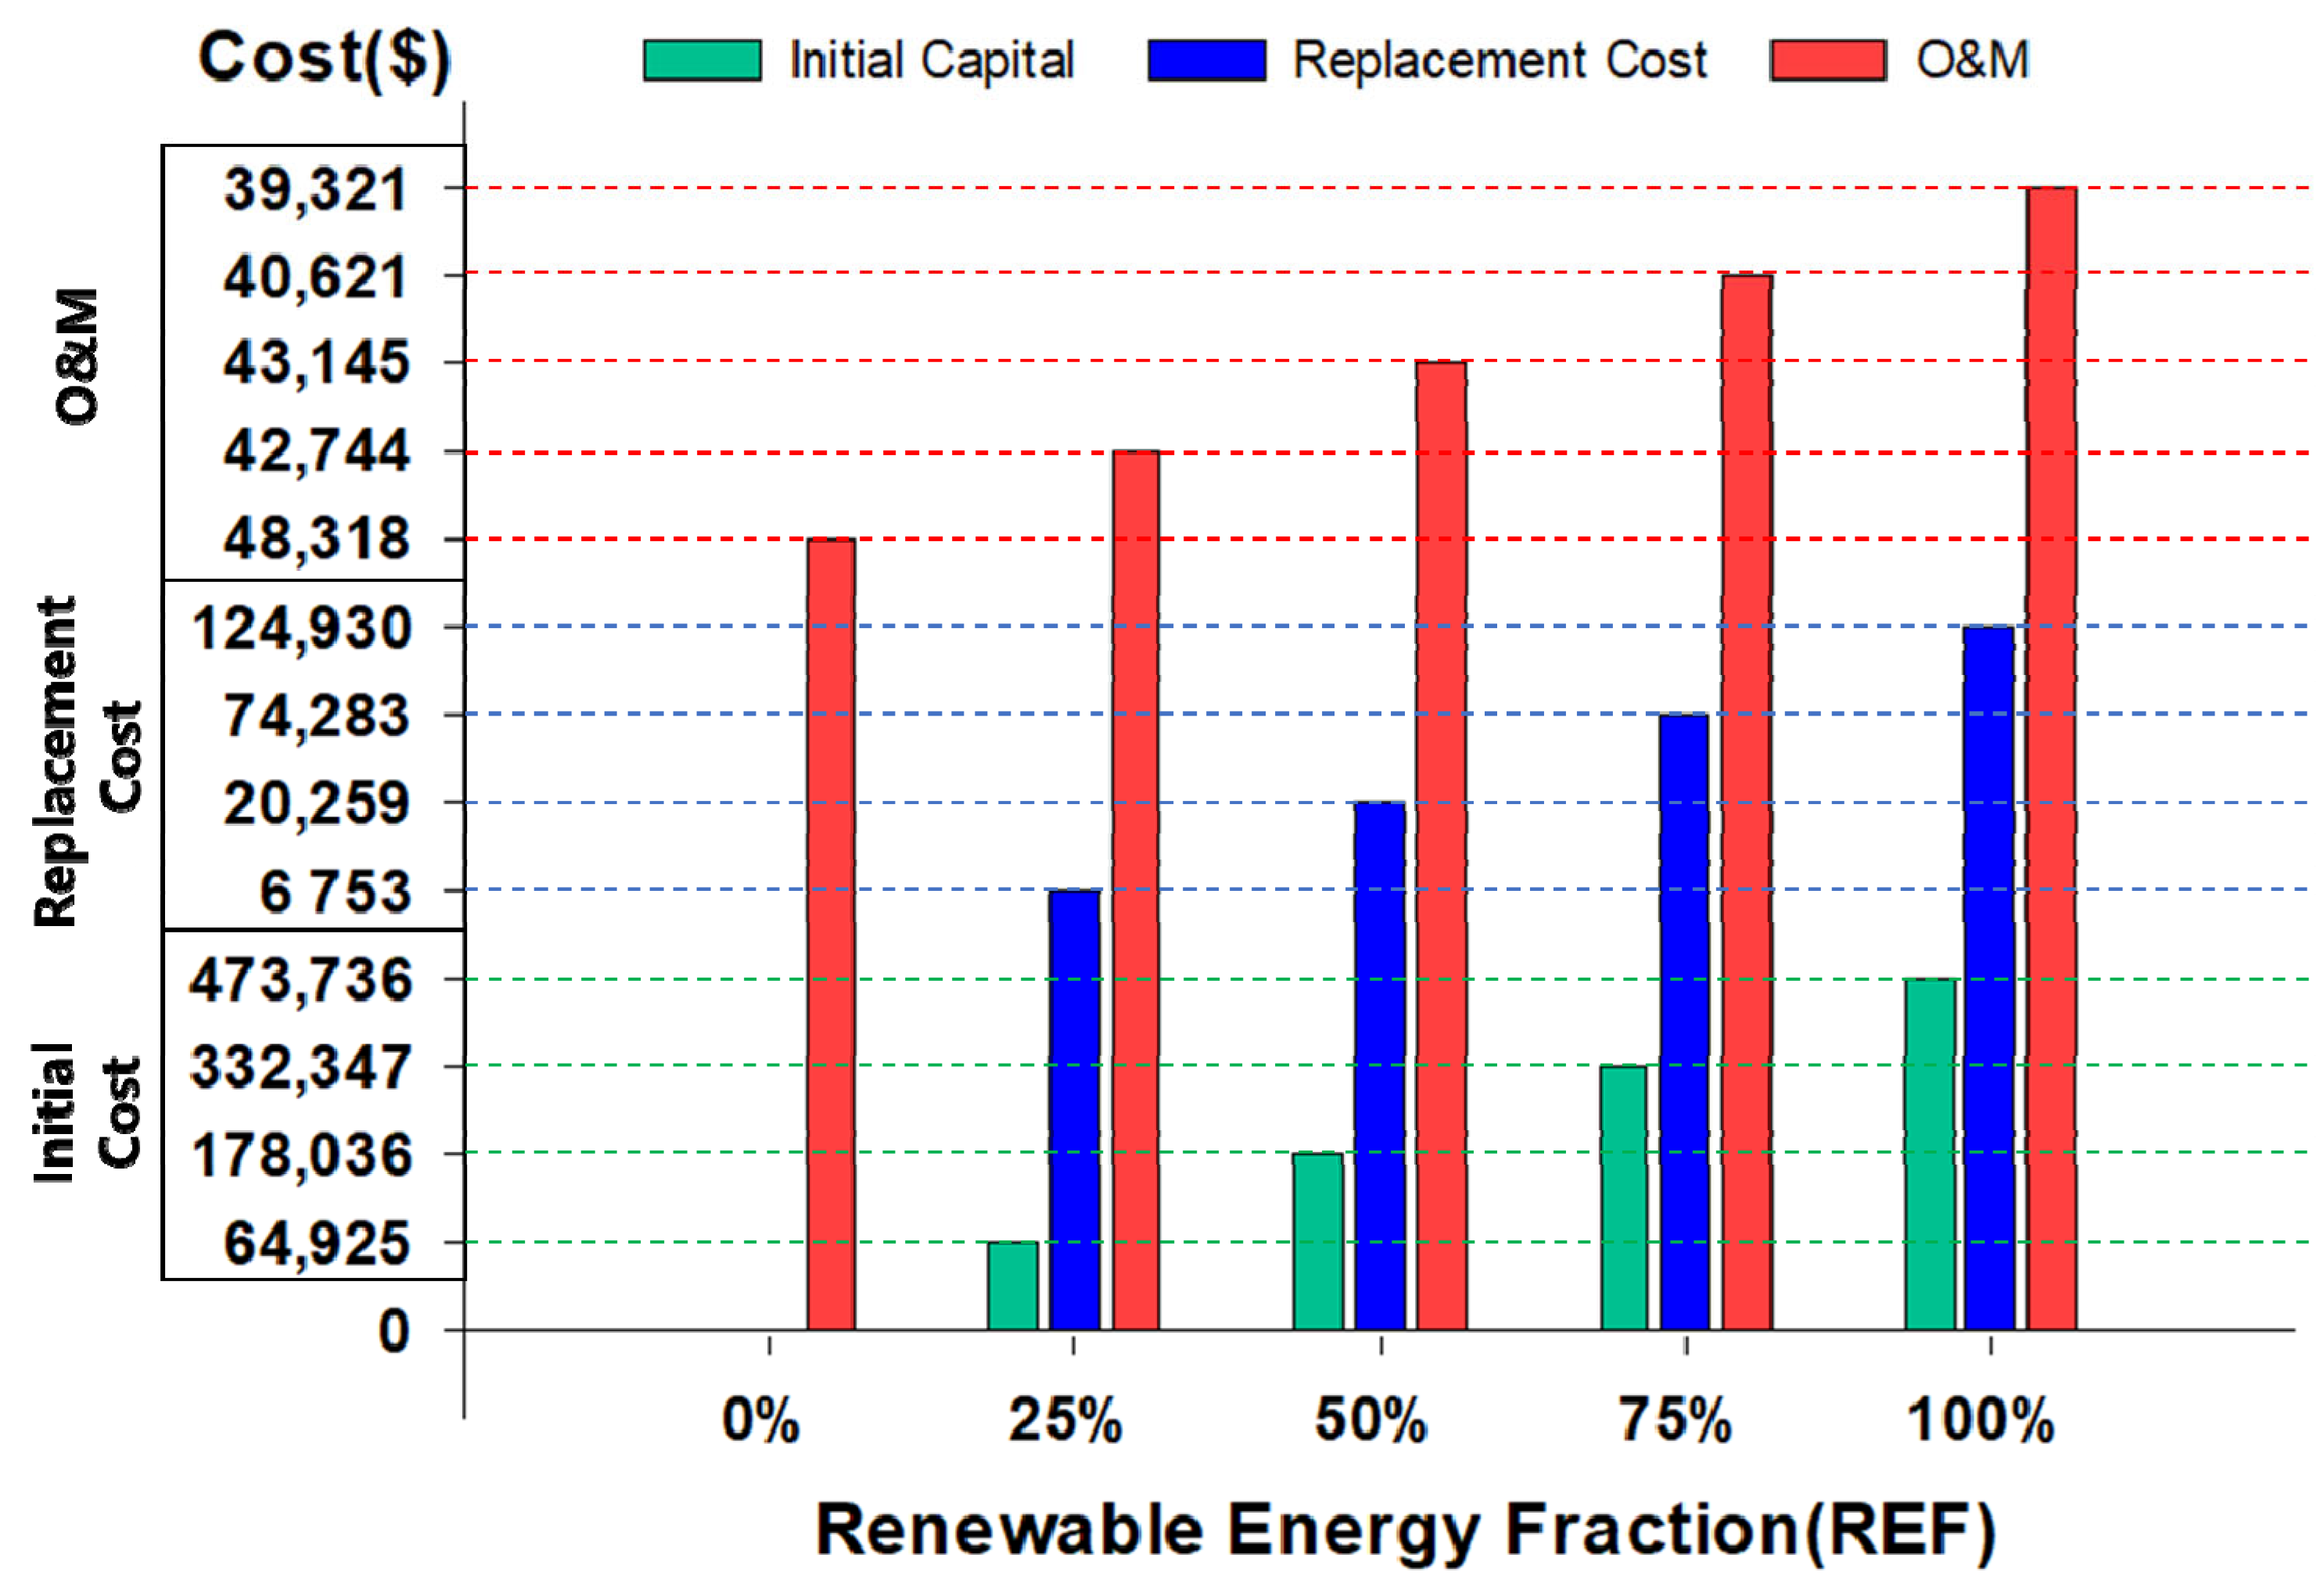
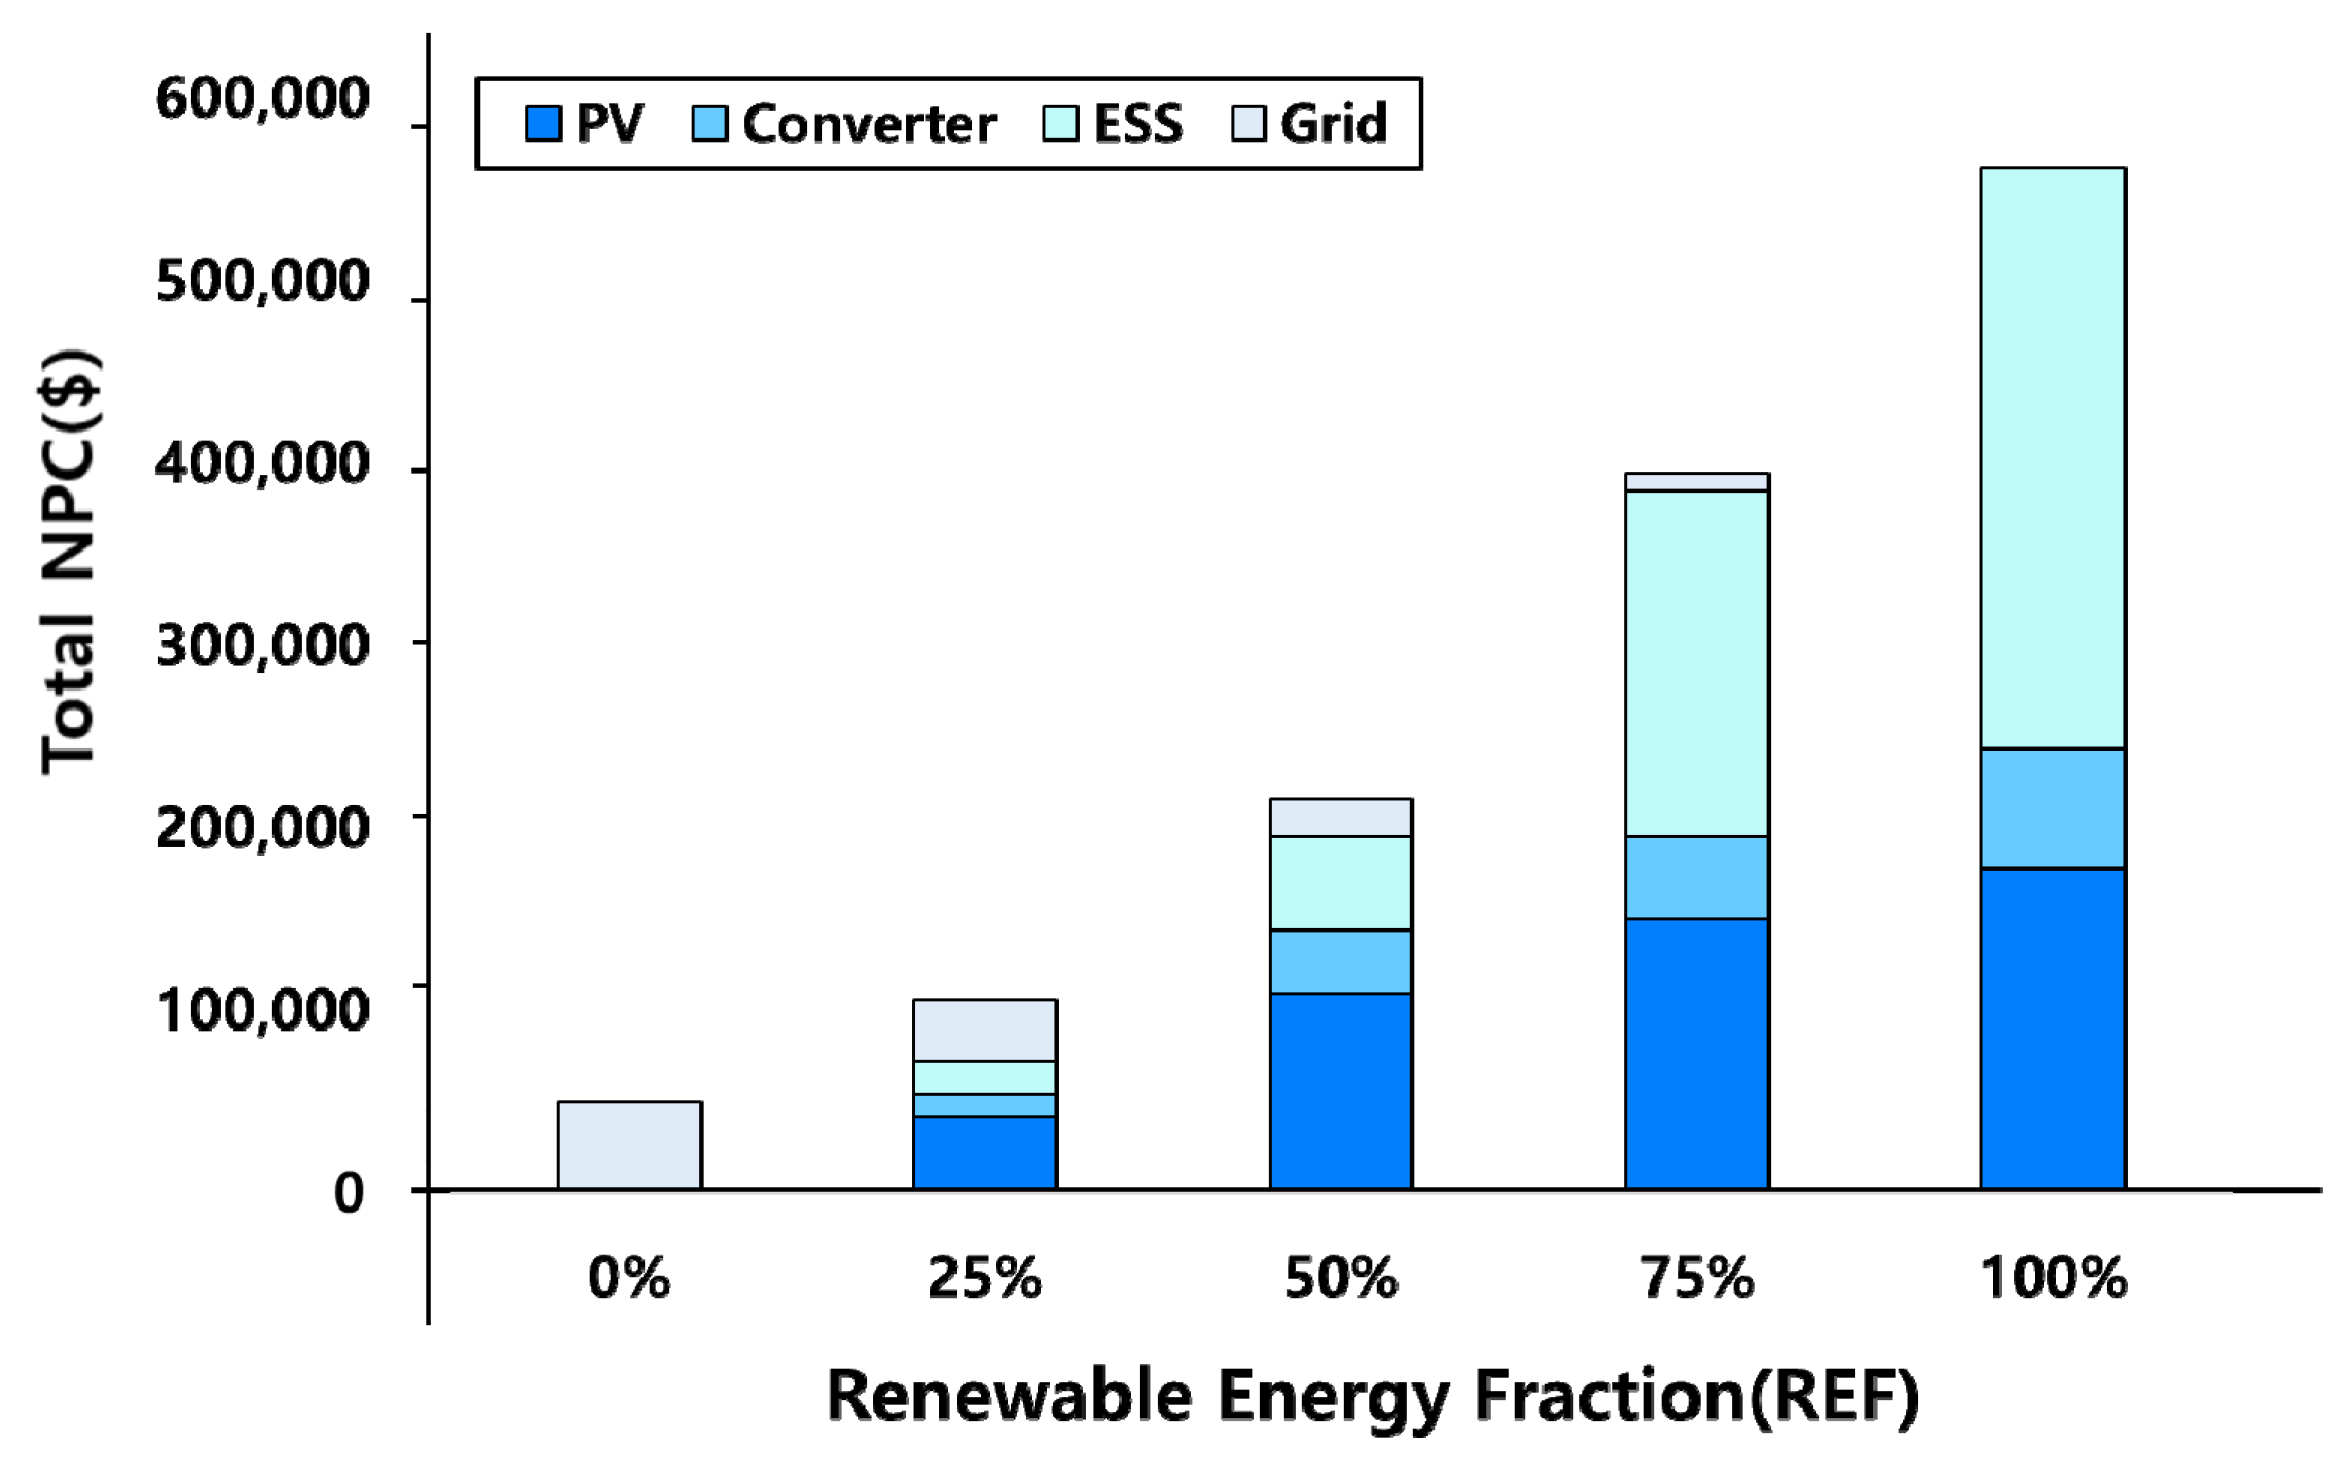
4.3. Economic Analysis
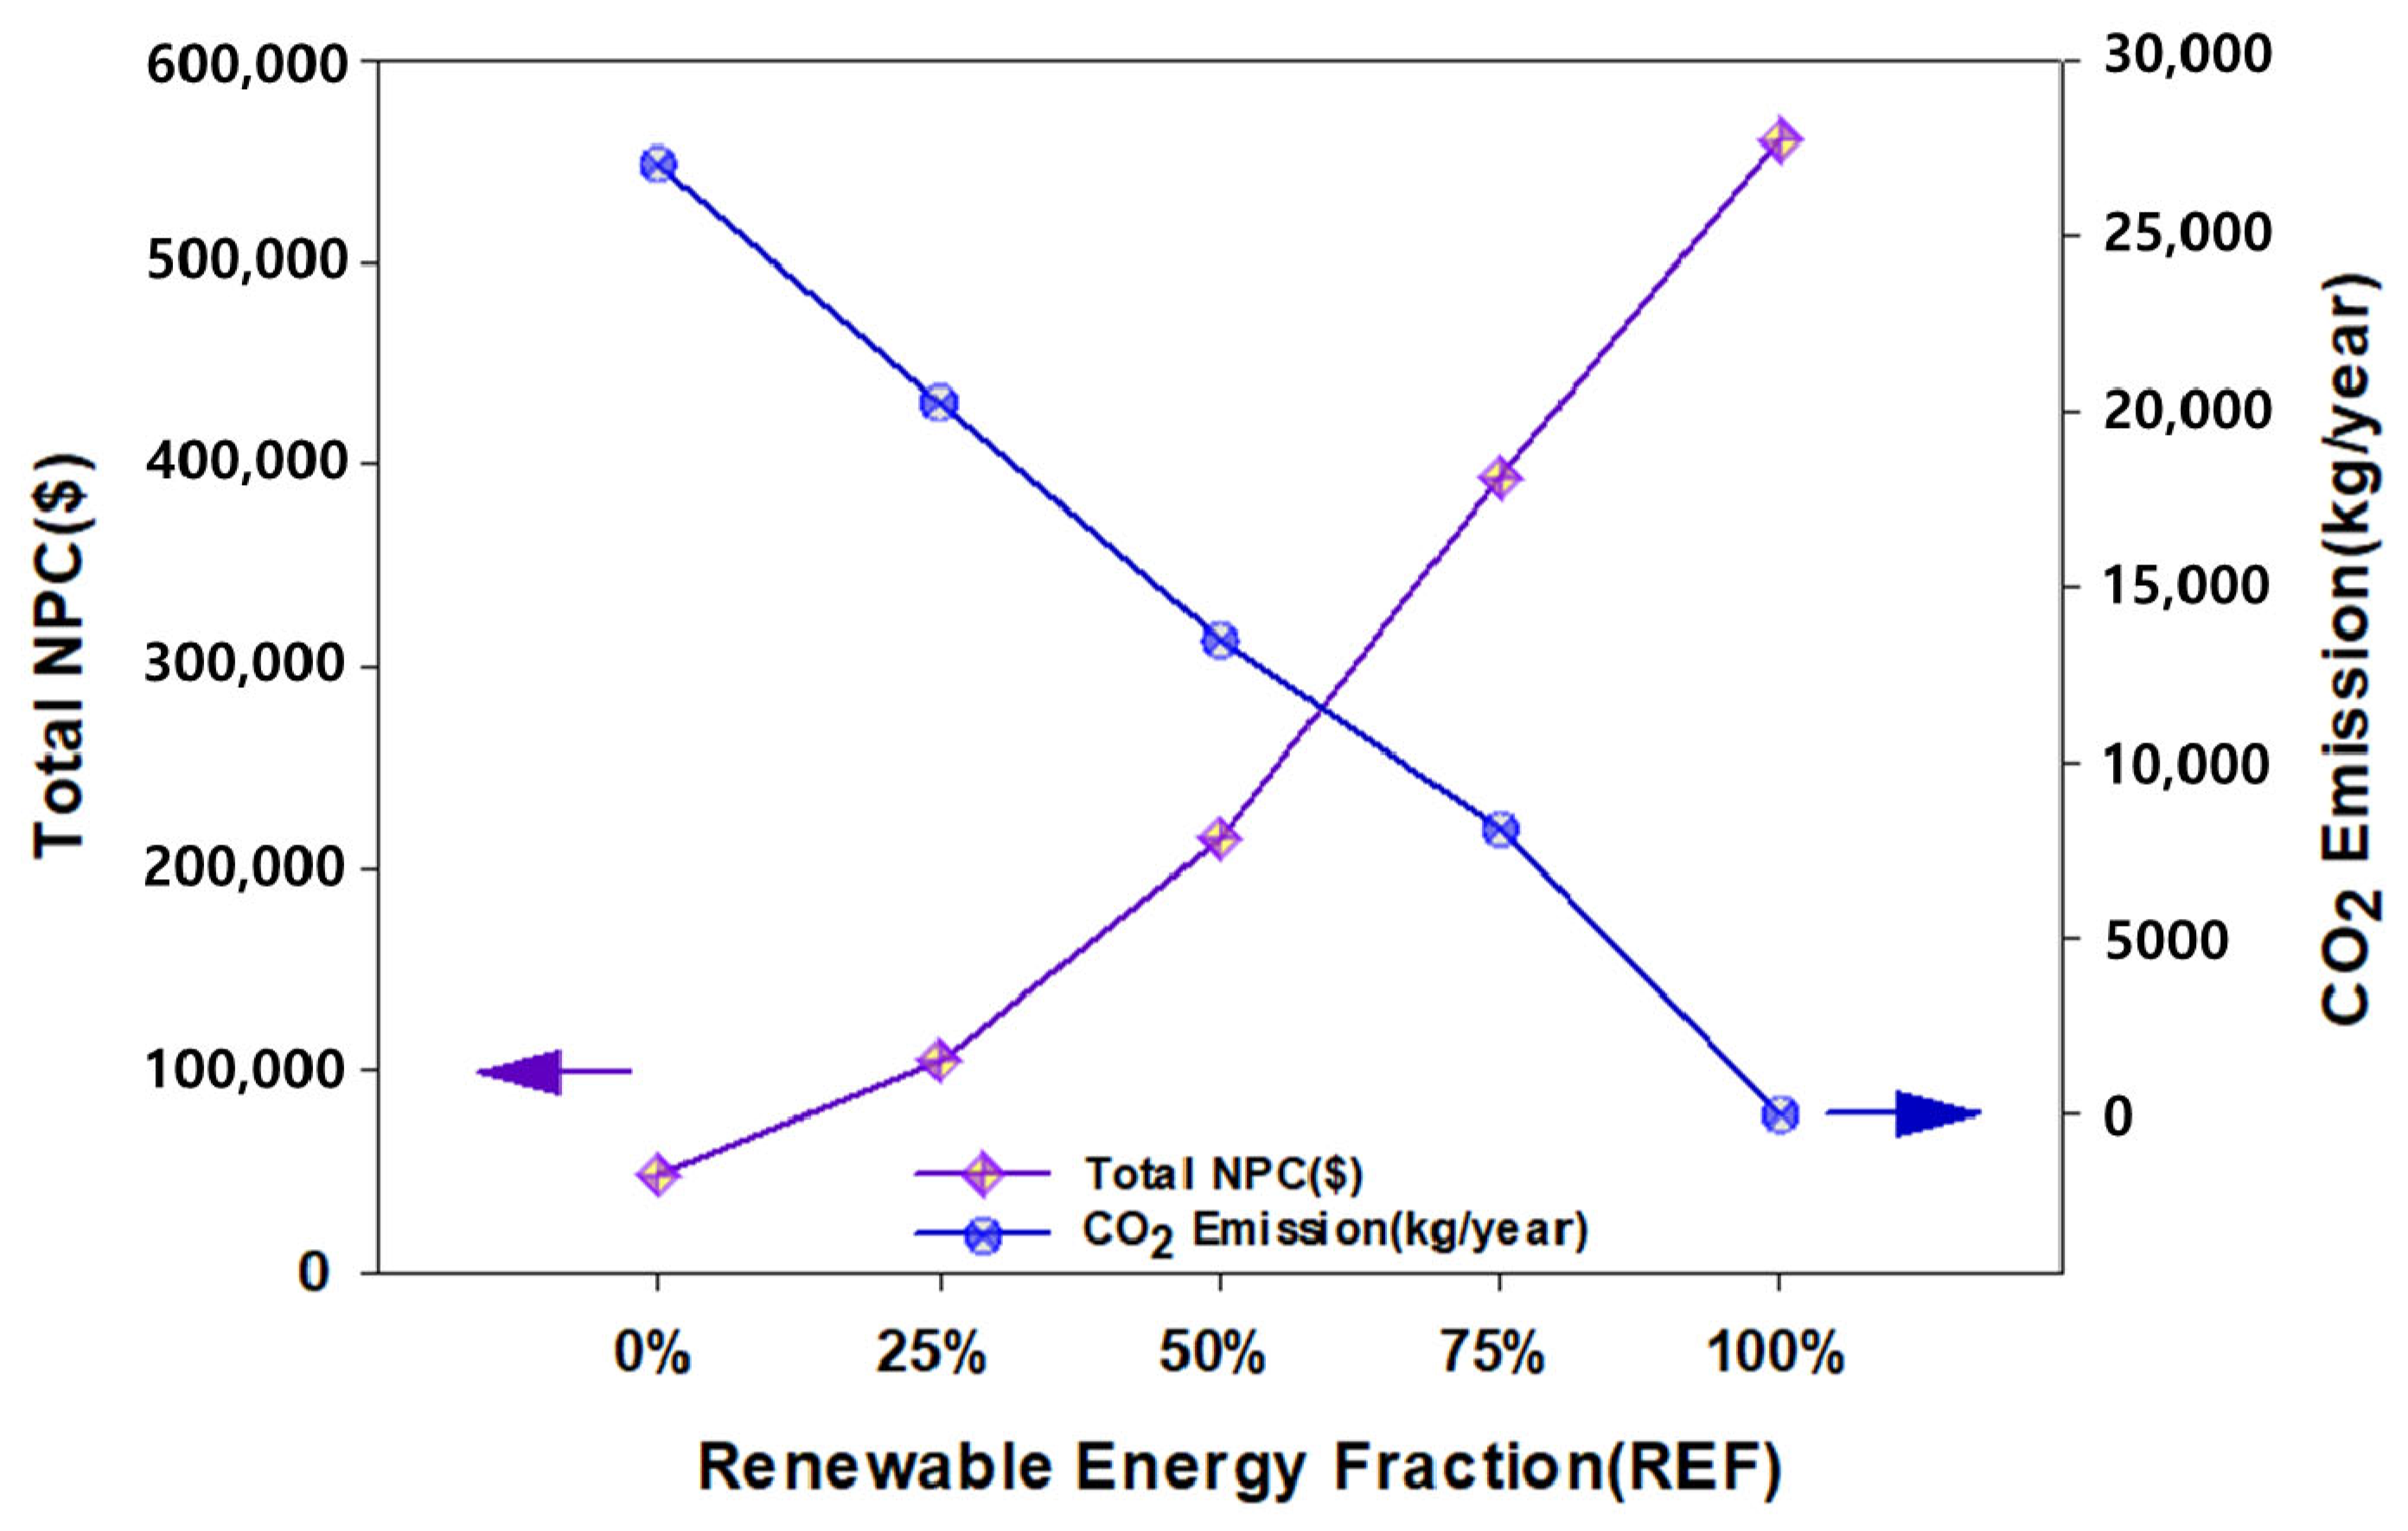
4.4. Correlation Analysis between Carbon Emissions and NPCs According to REF
5. Discussion
6. Conclusions
Author Contributions
Funding
Institutional Review Board Statement
Informed Consent Statement
Data Availability Statement
Conflicts of Interest
References
- Kwon, S.; Gil, H.; Baek, S.; Kim, H. Optimal Solution for a Renewable-Energy-Generation System at a Private Educational Institute in South Korea. Energies 2022, 15, 9430. [Google Scholar] [CrossRef]
- Ekren, O.; Hakan Canbaz, C.; Güvel, Ç.B. Sizing of a Solar-Wind Hybrid Electric Vehicle Charging Station by Using HOMER Software. J. Clean. Prod. 2021, 279, 123615. [Google Scholar] [CrossRef]
- Un-Noor, F.; Padmanaban, S.; Mihet-Popa, L.; Mollah, M.N.; Hossain, E. A Comprehensive Study of Key Electric Vehicle (EV) Components, Technologies, Challenges, Impacts, and Future Direction of Development. Energies 2017, 10, 1217. [Google Scholar] [CrossRef] [Green Version]
- Bodansky, D. The Paris Climate Change Agreement: A New Hope? Am. J. Int. Law 2016, 110, 288–319. [Google Scholar] [CrossRef] [Green Version]
- Ihm, J.; Chun, S.; Park, H. Optimal Scenarios of Renewables and Chargers for an Electric Vehicle Charging Station Using Public Data. In Proceedings of the SCEMS 2022—2022 IEEE 5th Student Conference on Electric Machines and Systems, Busan, Republic of Korea, 24–26 November 2022. [Google Scholar]
- Park, H.; Bae, S. Quantitative Assessment of Energy Supply Security: Korea Case Study. Sustainability 2021, 13, 1854. [Google Scholar] [CrossRef]
- McKenzie, K.A. Sun, Wind and Waves: Ev Fossil Fuel Use and Emissions on an Isolated, Oil-Dependent Hawaiian Island. World Electr. Veh. J. 2021, 12, 87. [Google Scholar] [CrossRef]
- Rahman, S.; Khan, I.A.; Khan, A.A.; Mallik, A.; Nadeem, M.F. Comprehensive Review & Impact Analysis of Integrating Projected Electric Vehicle Charging Load to the Existing Low Voltage Distribution System. Renew. Sustain. Energy Rev. 2022, 153, 111756. [Google Scholar] [CrossRef]
- Zhuang, Z.; Jin, T. Capacity Configuration and Control Strategy of EV Charging Station with Integrated Wind Power and Energy Storage Based on SSA. In Proceedings of the 5th IEEE Conference on Energy Internet and Energy System Integration: Energy Internet for Carbon Neutrality, EI2 2021, Taiyuan, China, 22–24 October 2021; pp. 4316–4322. [Google Scholar] [CrossRef]
- Zainab, F.; Naz, K.; Mehmood, K.K.; Basit, S.; Bukhari, A.; Wadood, A.; Khalid, H.A.; Park, H. An Optimal Joint Planning of DGs and Electric Vehicle Charging Stations in Grid-Connected and Islanded Microgrids. IET Renew. Power Gener. 2023, 17, 1623–1634. [Google Scholar] [CrossRef]
- Zhang, B.; Dehghanian, P.; Kezunovic, M. Optimal Allocation of PV Generation and Battery Storage for Enhanced Resilience. IEEE Trans. Smart Grid 2019, 10, 535–545. [Google Scholar] [CrossRef]
- Gong, L.; Cao, W.; Liu, K.; Yu, Y.; Zhao, J. Demand Responsive Charging Strategy of Electric Vehicles to Mitigate the Volatility of Renewable Energy Sources. Renew. Energy 2020, 156, 665–676. [Google Scholar] [CrossRef]
- Wu, Z.; Bhat, P.K.; Chen, B. Optimal Configuration of Extreme Fast Charging Stations Integrated with Energy Storage System and Photovoltaic Panels in Distribution Networks. Energies 2023, 16, 2385. [Google Scholar] [CrossRef]
- Korea Institute of Energy Research. Available online: https://www.kier.re.kr/eng (accessed on 28 April 2023).
- Erdinc, O.; Uzunoglu, M. Optimum Design of Hybrid Renewable Energy Systems: Overview of Different Approaches. Renew. Sustain. Energy Rev. 2012, 16, 1412–1425. [Google Scholar] [CrossRef]
- Saadatmand, M.; Gharehpetian, G.B.; Siano, P.; Alhelou, H.H. PMU-Based FOPID Controller of Large-Scale Wind-PV Farms for LFO Damping in Smart Grid. IEEE Access 2021, 9, 94953–94969. [Google Scholar] [CrossRef]
- Shivarama Krishna, K.; Sathish Kumar, K. A Review on Hybrid Renewable Energy Systems. Renew. Sustain. Energy Rev. 2015, 52, 907–916. [Google Scholar] [CrossRef]
- HOMER Pro—Microgrid Software for Designing Optimized Hybrid Microgrids. Available online: https://www.homerenergy.com/products/pro/index.html (accessed on 6 April 2023).
- Riayatsyah, T.M.I.; Geumpana, T.A.; Rizwanul Fattah, I.M.; Rizal, S.; Indra Mahlia, T.M. Techno-Economic Analysis and Optimisation of Campus Grid-Connected Hybrid Renewable Energy System Using HOMER Grid. Sustainability 2022, 14, 7735. [Google Scholar] [CrossRef]
- Al Essa, M.J.M. Energy Assessments of a Photovoltaic-Wind-Battery System for Residential Appliances in Iraq. J. Energy Storage 2023, 59, 106514. [Google Scholar] [CrossRef]
- Tiam Kapen, P.; Medjo Nouadje, B.A.; Chegnimonhan, V.; Tchuen, G.; Tchinda, R. Techno-Economic Feasibility of a PV/Battery/Fuel Cell/Electrolyzer/Biogas Hybrid System for Energy and Hydrogen Production in the Far North Region of Cameroon by Using HOMER Pro. Energy Strategy Rev. 2022, 44, 100988. [Google Scholar] [CrossRef]
- Rahmat, M.A.A.; Abd Hamid, A.S.; Lu, Y.; Ishak, M.A.A.; Suheel, S.Z.; Fazlizan, A.; Ibrahim, A. An Analysis of Renewable Energy Technology Integration Investments in Malaysia Using HOMER Pro. Sustainability 2022, 14, 13684. [Google Scholar] [CrossRef]
- Mas’Ud, A.A.; Al-Garni, H.Z. Optimum Configuration of a Renewable Energy System Using Multi-Year Parameters and Advanced Battery Storage Modules: A Case Study in Northern Saudi Arabia. Sustainability 2021, 13, 5123. [Google Scholar] [CrossRef]
- Muna, Y.B.; Kuo, C.C. Feasibility and Techno-Economic Analysis of Electric Vehicle Charging of PV/Wind/Diesel/Battery Hybrid Energy System with Different Battery Technology. Energies 2022, 15, 4364. [Google Scholar] [CrossRef]
- Al Wahedi, A.; Bicer, Y. Techno-Economic Optimization of Novel Stand-Alone Renewables-Based Electric Vehicle Charging Stations in Qatar. Energy 2022, 243, 123008. [Google Scholar] [CrossRef]
- Karmaker, A.K.; Ahmed, M.R.; Hossain, M.A.; Sikder, M.M. Feasibility Assessment & Design of Hybrid Renewable Energy Based Electric Vehicle Charging Station in Bangladesh. Sustain. Cities Soc. 2018, 39, 189–202. [Google Scholar] [CrossRef]
- Kim, J.H.; Moon, S.K.; Lee, B.S.; Seo, I.J.; Kim, C.H. Analysis and Pattern Deduction of Actual Electric Vehicle Charging Data. Trans. Korean Inst. Electr. Eng. 2018, 67, 1455–1462. [Google Scholar] [CrossRef]
- Arunachalam, R.K.; Chandrasekaran, K.; Rusu, E.; Ravichandran, N.; Fayek, H.H. Economic Feasibility of a Hybrid Microgrid System for a Distributed Substation. Sustainability 2023, 15, 3133. [Google Scholar] [CrossRef]
- Bansal, S.; Zong, Y.; You, S.; Mihet-Popa, L.; Xiao, J. Technical and Economic Analysis of One-Stop Charging Stations for Battery and Fuel Cell EV with Renewable Energy Sources. Energies 2020, 13, 2855. [Google Scholar] [CrossRef]
- Amini, S.; Bahramara, S.; Golpîra, H.; Francois, B.; Soares, J. Techno-Economic Analysis of Renewable-Energy-Based Micro-Grids Considering Incentive Policies. Energies 2022, 15, 8285. [Google Scholar] [CrossRef]
- KOSIS Korean Statistical Information Service. Available online: https://kosis.kr/eng/ (accessed on 6 April 2023).
- Korea Meteorological Administration. Available online: https://www.kma.go.kr/eng/index.jsp (accessed on 6 April 2023).
- KEPCO MAIN|KEPCO. Available online: https://home.kepco.co.kr/kepco/EN/main.do (accessed on 6 April 2023).
- Aziz, A.S.; Tajuddin, M.F.N.; Hussain, M.K.; Adzman, M.R.; Ghazali, N.H.; Ramli, M.A.M.; Khalil Zidane, T.E. A New Optimization Strategy for Wind/Diesel/Battery Hybrid Energy System. Energy 2022, 239, 122458. [Google Scholar] [CrossRef]


| Ref. | Authors | Year | Location | System Components | Facility for the Installation of the System | Considerations for Optimal System Design | ||
|---|---|---|---|---|---|---|---|---|
| Total NPC | Actual Load | CO2 | ||||||
| [1] | Kwon et al. | 2022 | Korea | Wind/Battery/Grid | University | Y | Y | N |
| [19] | Riayatsyah et al. | 2022 | Indonesia | PV/Wind/ Battery/Grid | University | Y | Y | N |
| [20] | Al Essa | 2023 | Iraq | PV/Wind/Battery | Household | Y | N | Y |
| [21] | Tiam Kapen et al. | 2022 | Cameroon | PV/Fuel-cell/Electrolyzer/Biogas | Household | Y | N | N |
| [22] | Rahmat et al. | 2022 | Malaysia | PV/Wind/Diesel/Battery/Grid | Household | Y | N | N |
| [23] | Mas’Ud et al. | 2021 | Saudi Arabia | PV/Wind/ Diesel/Battery | Household | Y | Y | N |
| [24] | Muna et al. | 2022 | Ethiopia | PV/Wind/ Diesel/Battery | EV charging station | Y | N | N |
| [25] | Al Wahedi et al. | 2022 | Qatar | PV/Wind/Electrolyzer/ Battery/Bio | EV charging station | Y | N | N |
| [26] | Karmaker et al. | 2018 | Bangladesh | PV/Battery/Bio | EV charging station | Y | Y | N |
| This paper | Ihm et al. | 2023 | Korea | PV/Wind/ Battery/Grid | EV charging station | Y | Y | Y |
| Month (1–12) | Solar Radiation ) | Clearness Index | Wind Speed (m/s) | Temperature |
|---|---|---|---|---|
| January | 2.281 | 0.573 | 2.533 | 0.467 |
| February | 3.691 | 0.588 | 2.699 | 4.816 |
| March | 4.385 | 0.540 | 2.417 | 10.201 |
| April | 5.713 | 0.577 | 2.907 | 14.503 |
| May | 5.360 | 0.483 | 2.456 | 18.282 |
| June | 5.508 | 0.477 | 2.227 | 23.211 |
| July | 5.457 | 0.483 | 2.177 | 26.899 |
| August | 4.062 | 0.394 | 1.633 | 25.700 |
| September | 3.729 | 0.428 | 2.051 | 22,067 |
| October | 3.817 | 0.560 | 1.569 | 16.477 |
| November | 2.967 | 0.567 | 1.980 | 9.510 |
| December | 3.051 | 0.674 | 2.362 | 3.136 |
| Charge of Electricity (USD /kWh) | |||
|---|---|---|---|
| Time Zone | Summer (Month: 6~8) | Spring/Fall (Month: 3~5, 9~10) | Winter (Month: 11~2) |
| Light load | 0.067 | 0.059 | 0.075 |
| Heavy load | 0.099 | 0.068 | 0.09 |
| Maximum load | 0.12 | 0.071 | 0.10 |
| PV | WT | ESS | Converter | |
|---|---|---|---|---|
| Rated Capacity | 1 (kW) | 3 (kW) | 13.2 (kWh) | 1 (kW) |
| Capital cost (USD ) | 1400 | 1800 | 6480 | 550 |
| Replacement cost (USD ) | 1400 | 1800 | 5980 | 450 |
| O&M (USD /year) | 20 | 180 | - | 15 |
| Lifetime | 25 | 20 | 10 | 15 |
| Reference | [18] | [34] | [24] | [18] |
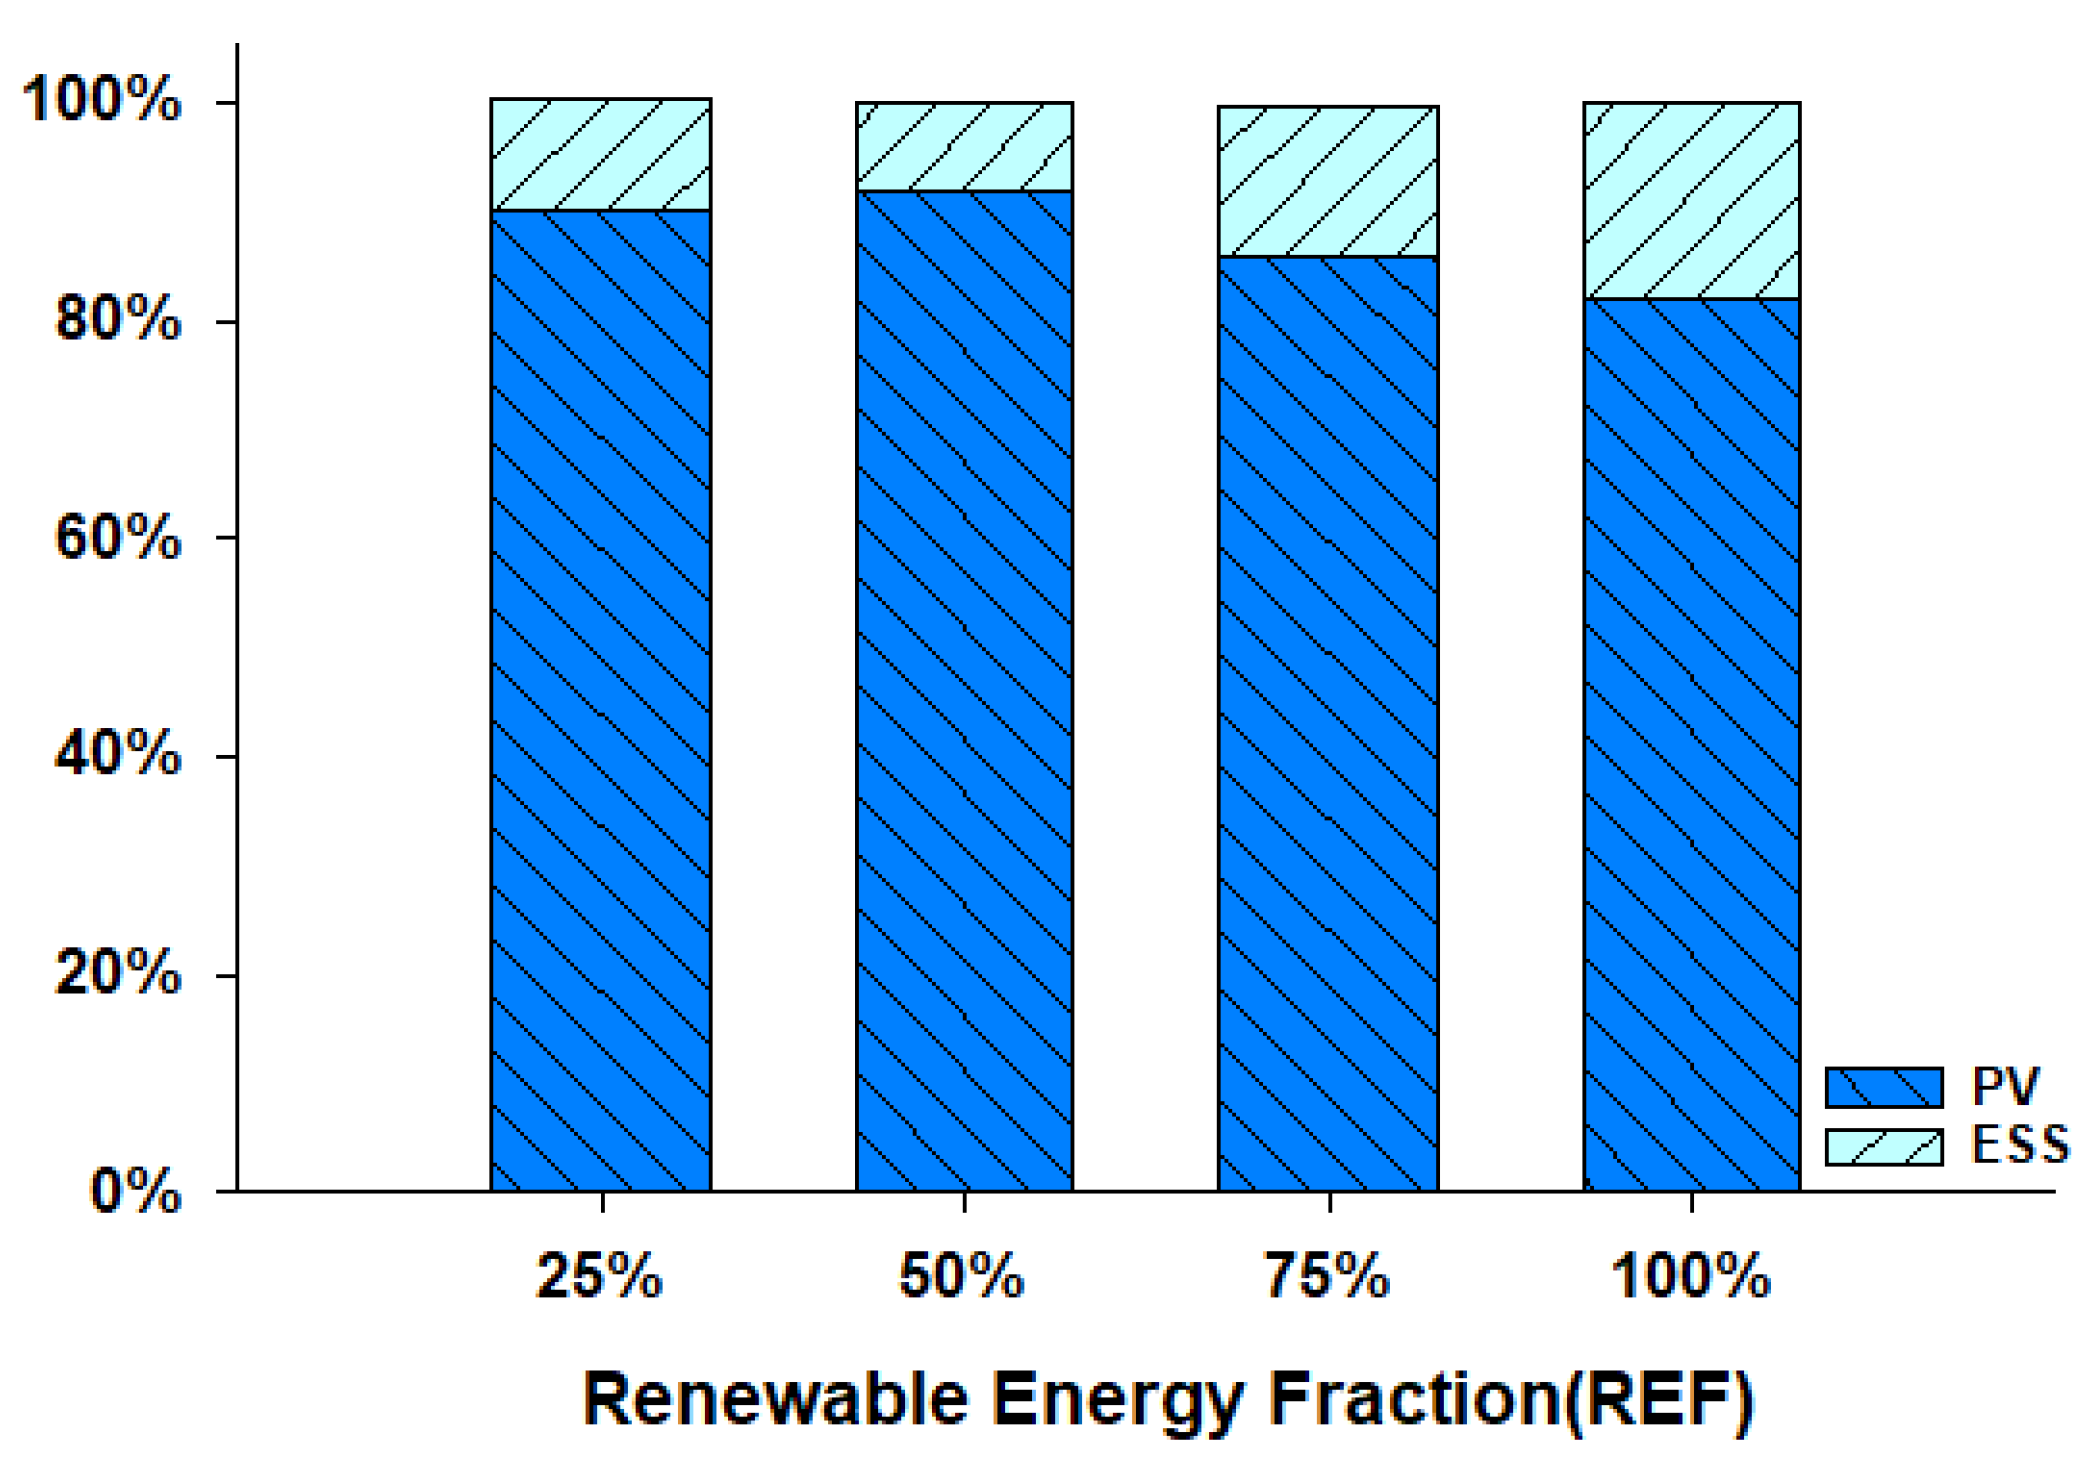
| Renewable Fraction (%) | Architecture | Cost | System | PV | Grid | |||
|---|---|---|---|---|---|---|---|---|
| PV (kW) | ESS (Quantity) | Converter (kW) | NPC (USD ) | Excess Electricity (kWh/Year) | CO2 (kg/Year) | Production (kWh/Year) | Energy Purchased (kW) | |
| 0 | 0 | 0 | 0 | USD 48,318 | 0 | 27,038 | 57,528 | |
| 25 | 30 | 2 | 18.1 | USD 104,756 | 22,946 | 20,277 | 38,593 | 43,143 |
| 50 | 80 | 6 | 49.4 | USD 214,821 | 71,639 | 13,514 | 102,914 | 28,753 |
| 75 | 110 | 22 | 65.1 | USD 393,207 | 93,194 | 6598 | 141,507 | 14,038 |
| 100 | 130 | 37 | 94.5 | USD 560,163 | 102,589 | 0 | 167,235 | 0 |
| Scenario | System Components | Excess Electricity | |||
|---|---|---|---|---|---|
| PV (kW) | WT (unit) | ESS (unit) | Percentage (%) | Power (kWh/Year) | |
| (a) PV + Grid | 30 | - | 2 | 28.1 | 22,946 |
| (b) PV + WT + Grid | 25 | 5 | 3 | 21.9 | 16,602 |
| (c) WT + Grid | - | 72 | 46 | 17.5 | 12,694 |
Disclaimer/Publisher’s Note: The statements, opinions and data contained in all publications are solely those of the individual author(s) and contributor(s) and not of MDPI and/or the editor(s). MDPI and/or the editor(s) disclaim responsibility for any injury to people or property resulting from any ideas, methods, instructions or products referred to in the content. |
© 2023 by the authors. Licensee MDPI, Basel, Switzerland. This article is an open access article distributed under the terms and conditions of the Creative Commons Attribution (CC BY) license (https://creativecommons.org/licenses/by/4.0/).
Share and Cite
Ihm, J.; Amghar, B.; Chun, S.; Park, H. Optimum Design of an Electric Vehicle Charging Station Using a Renewable Power Generation System in South Korea. Sustainability 2023, 15, 9931. https://doi.org/10.3390/su15139931
Ihm J, Amghar B, Chun S, Park H. Optimum Design of an Electric Vehicle Charging Station Using a Renewable Power Generation System in South Korea. Sustainability. 2023; 15(13):9931. https://doi.org/10.3390/su15139931
Chicago/Turabian StyleIhm, Jieun, Bilal Amghar, Sejin Chun, and Herie Park. 2023. "Optimum Design of an Electric Vehicle Charging Station Using a Renewable Power Generation System in South Korea" Sustainability 15, no. 13: 9931. https://doi.org/10.3390/su15139931