Article

Biogeographic Variability in Kernel Oil and Press Cake Content of Beauty Leaf Tree (Calophyllum inophyllum L.), as Determined by Chemical and Near-Infrared Spectroscopy Analysis

1
School of Health, Medical and Applied Sciences, Institute for Future Farming Systems | Centre for Intelligent Systems, Central Queensland University, Rockhampton, QLD 4701, Australia
2
Centre for Nutrition and Food Sciences, Queensland Alliance for Agriculture and Food Innovation (QAAFI), The University of Queensland, Brisbane, QLD 4072, Australia
*
Author to whom correspondence should be addressed.
Sustainability 2023, 15(6), 5529; https://doi.org/10.3390/su15065529
Submission received: 22 February 2023 / Revised: 15 March 2023 / Accepted: 19 March 2023 / Published: 21 March 2023
(This article belongs to the Special Issue Innovative Detection Technology to Meet Food and Fuel Needs)

Abstract

:
The aim of this study was to evaluate biogeographic variability in the fruit, kernel, kernel-oil and press-cake contents of 50 accessions of the beauty leaf tree (C. inophyllum L.) collected from 19 locations spanning 4000 km along the eastern and northern coasts of Australia (Northern Territory and Queensland). Mature fallen fruits of C. inophyllum were collected from individual trees and stored in a shed for over a year. The fruits were cracked open to extract the kernels, and the kernels were crushed to 5–10 mm. NIR spectra of crushed kernels were collected using FT–NIR. Results of this study showed large variation between individual trees and the provenances for oil, resin and cake contents. Most of the C. inophyllum genotypes were separated based on their NIR fingerprint using PCA and PLS-DA. It was concluded that NIR spectroscopy not only aids in the screening of large numbers of genotypes, but it also allows the preservation of the tested seeds for further propagation. This feature will have the greatest advantage in plant breeding and commercial cultivation, as only the seeds that contain high oil content could be sown to help establish plantations with high oil-production capacity. Overall, it was concluded that the differences between provenances for oil, resin and cake contents can be predicted using NIR spectra. Furthermore, NIR spectroscopy can be used as a tool to define provenance variations in the kernel oil content of the beauty leaf tree.

1. Introduction

Global energy consumption is increasing at an alarming rate, and this may lead to a world energy crisis if not addressed properly. For example, approximately 94% of Australia’s energy consumption is dependent on fossil fuels such as oil, natural gas, and coal [1]. Amongst these, oil (including LPG, crude oil and refined products) accounts for the largest share (39%) of energy consumption [1]. The global consumption of oil is rising by approximately 1.40 million barrels per day [2]. Hence, many countries have been considering other options to produce alternative renewable energy sources to cater for the growing energy demand [1,2,3].
Biofuel production from tree-borne oil seeds (TBOS) can be a good alternative and a potential renewable source of energy that not only helps to reduce the depletion of fossil fuels but also minimizes environmental pollution [3,4]. The beauty leaf tree (BLT; Calophyllum inophyllum L.) is one such TBOS species, whose kernels contain about 50–73% oil [5,6,7], and as a result it has been identified as an efficient alternative for regular diesel engines, as a blend with the so-called petrodiesel [8]. The physico-chemical properties of C. inophyllum kernel oil-derived biodiesel meets the ASTM (American Society for Testing and Materials) [9] 6751/SNI 04-7182-2006 standards [7,10,11,12,13]. Furthermore, it has been reported that Calophyllum trees can tolerate various environmental stresses such as acid soils, salinity, drought and a wide range of climate variations (e.g., temperature, rainfall) [6]. These features make BLT the most suitable species for producing biodiesel from degraded barren lands that are unsuitable for growing other food crops. The cultivation of BLT on degraded land would eventually help to avoid or minimize the fuel vs. food competition for land. The use of BLT as an oil source for diesel engine use has immense scope in fulfilling the growing global demands for energy resources. Despite all the benefits and the potentiality of C. inophyllum as an energy source, deliberate efforts on studying its cultivation, management, genetic improvement, and commercialization are still scarce.
Tree species that are widely distributed in a range of bio-geoclimatic conditions exhibit large variability in their morphology, physiology, anatomy, genetics, and productivity over generations [14,15]. Provenance studies are essential to assess the naturally existing genetic diversity of a species, as the selection and breeding of high-yielding genotypes are possible only after understanding the extent of variations existing among the genotypes [16]. This approach helps to describe the environmental and hereditary factors that modulate the phenotypic variation related to geographic seed sources [17]. The magnitude and nature of existing variability, and the heritability of desired traits will also determine the effectiveness of any tree improvement program [18,19]. Since BLT is a potential crop and feedstock for biodiesel production, studying the variation in seed oil content is very much an essential feature, and plays as a vital role in selecting superior genotypes [18,19]. There have been only limited studies on the systematic evaluation of the productivity and performance of BLT provenances for oil content in Australia. Hathurusingha and collaborators [20] evaluated and reported the natural variation in oil content in seeds of C. inophyllum. However, studies by these researchers were limited to only three provenances over a short distance within Australia [20]. Therefore, the range used in the study by Hathurusingha and collaborators [20] was not considered adequate to characterize C. inophyllum, as it is widely distributed across coastal regions of Queensland, Northern Territory and Western Australia (approximately 5000 km).
Therefore, a more extensive study including all possible provenances is needed to determine variability between individual trees and provenances across coastal regions of Australia. Thus, the aim of this study was to collect and screen 50 trees of C. inophyllum obtained from 19 different provenances for their kernel oil content and associated attributes. In addition, the use of near-infrared (NIR) spectroscopy was also evaluated as a rapid screening tool. The overall aim was to identify high-yielding BLT accessions within Australia with the view to using them in establishing plantations and tree improvement programs.

2. Materials and Methods

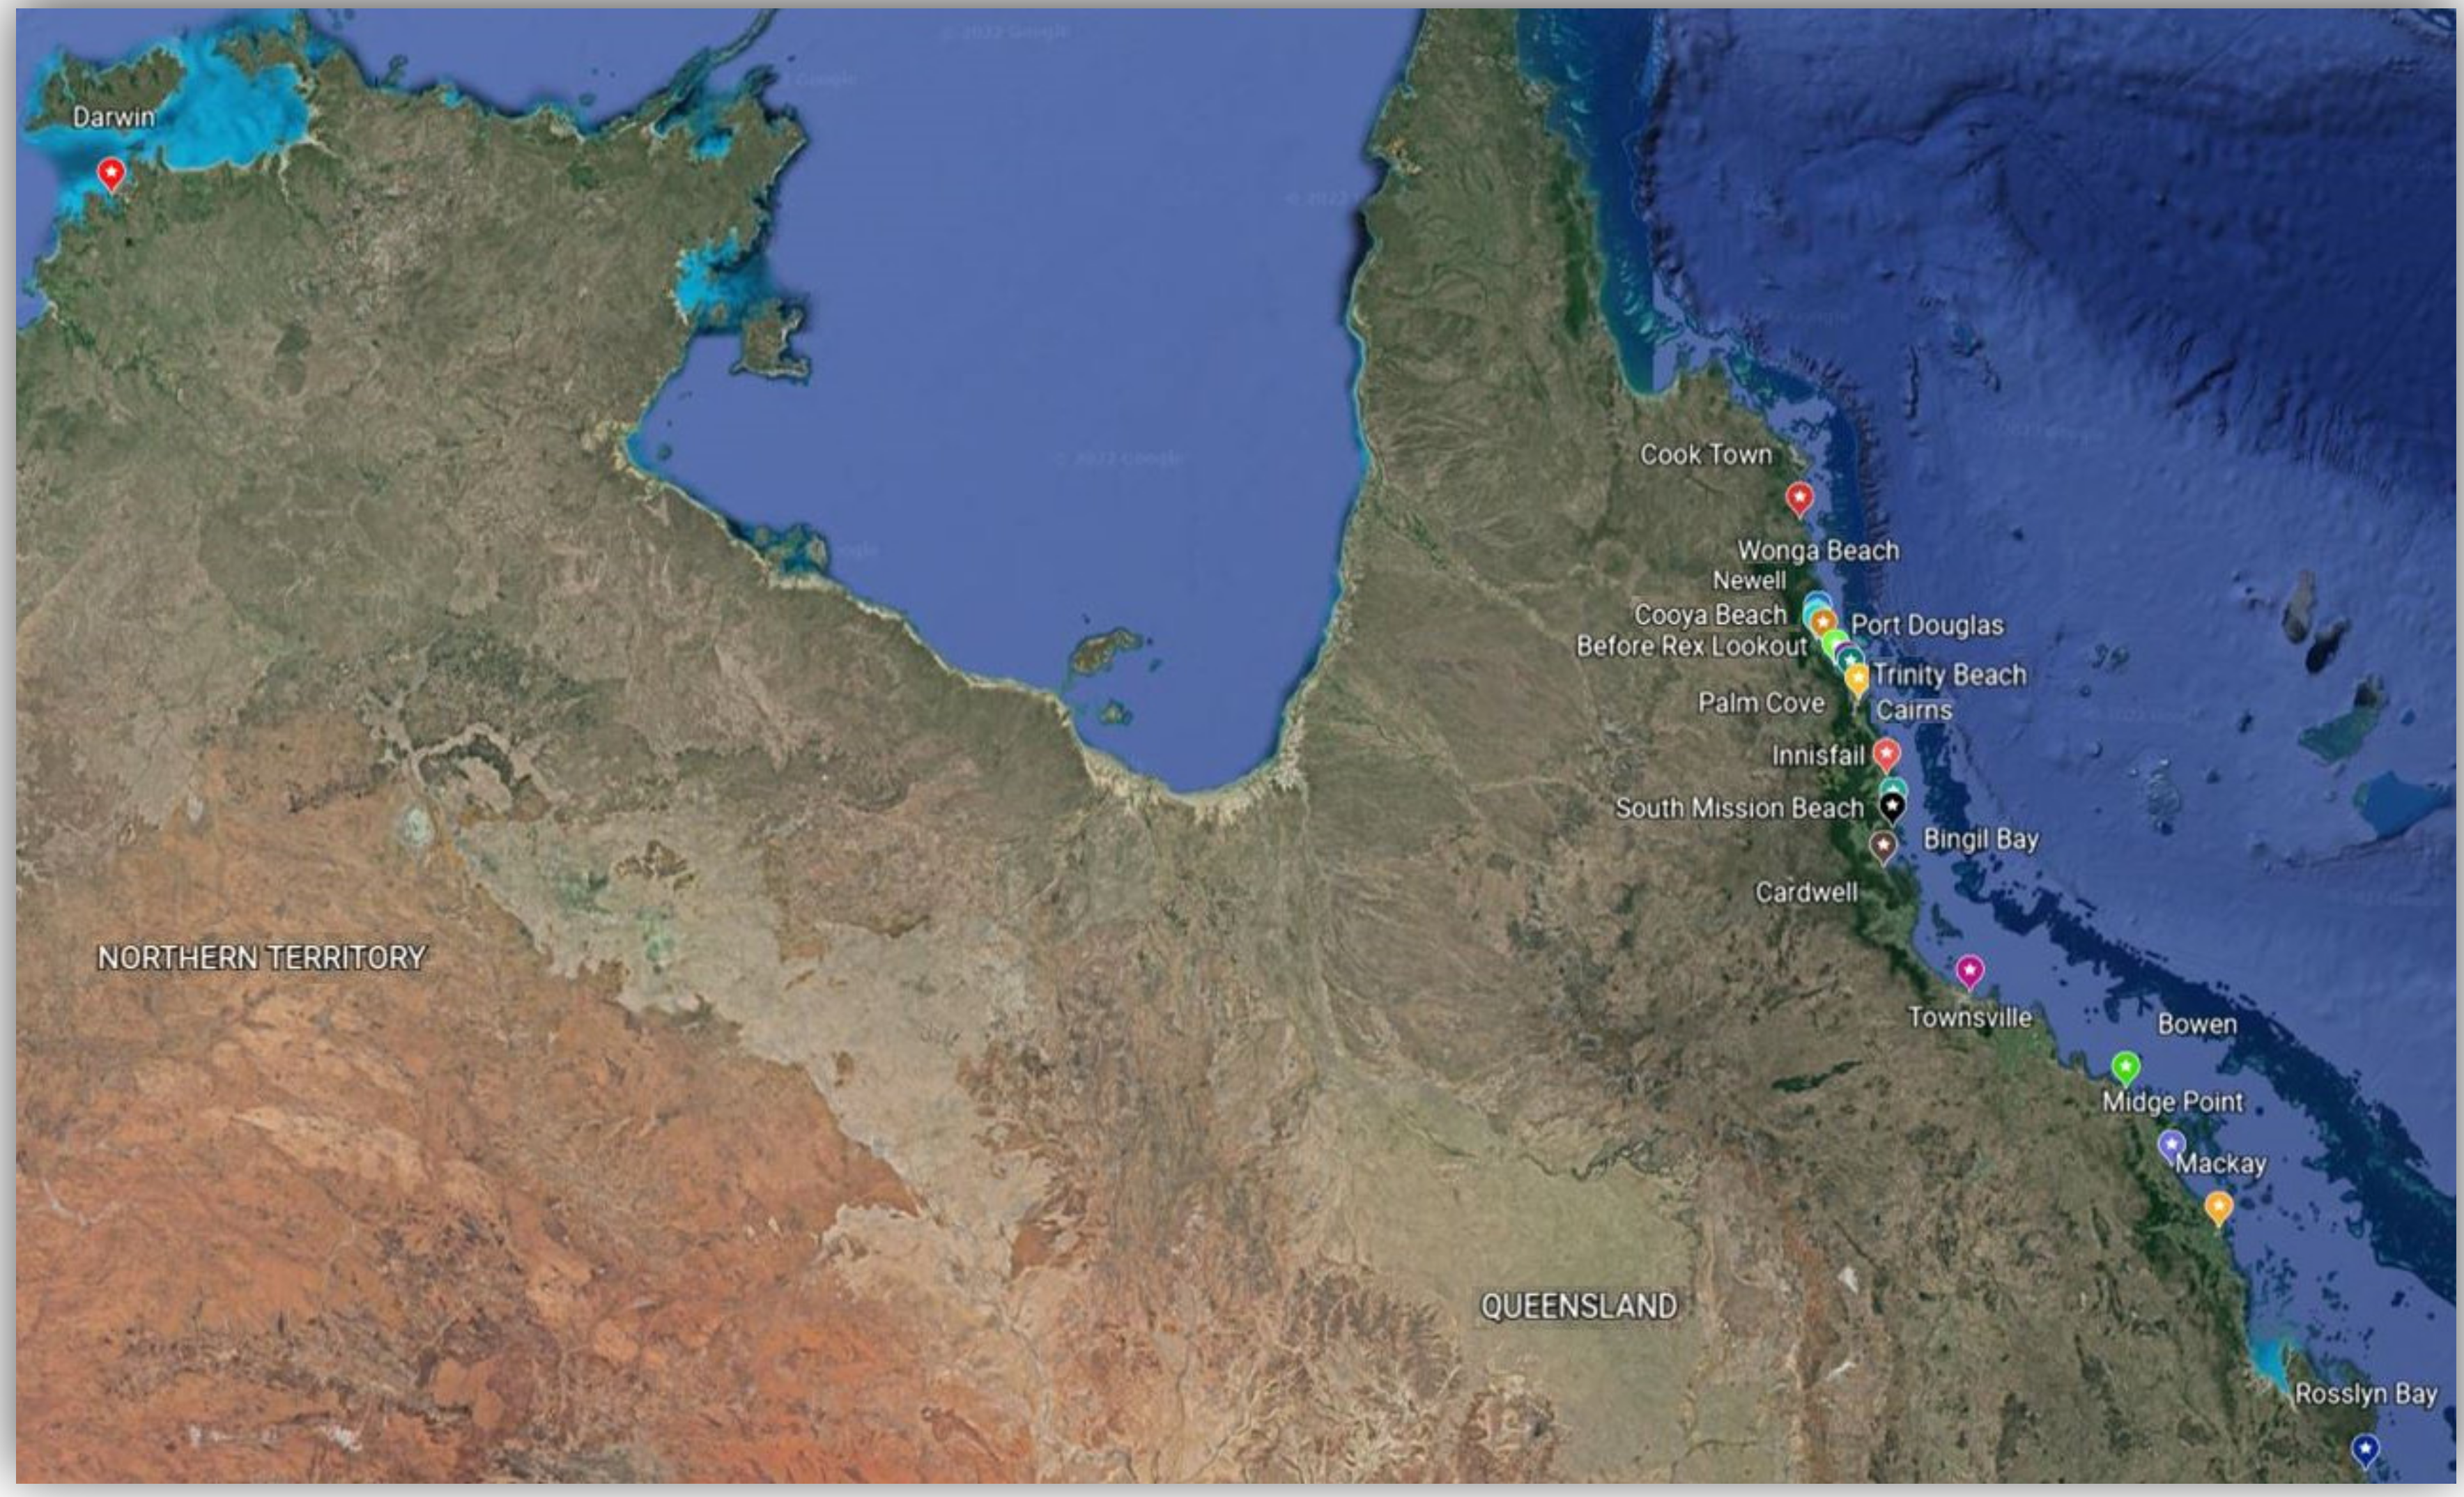
2.1. Study Sites and Seed Collection

Fruits of BLT were collected from 50 individual trees (accessions) found growing at 19 different locations in Queensland and Northern Territory, Australia. Of the total 50 accessions, 13 accessions belonged to the provenance Bowen, 9 accessions came from Darwin, 4 accessions were collected from Cardwell, 2 accessions each came from the provenances of Cairns, Innisfail, Rosslyn Bay, Port Douglas, Bingil Bay, Townsville, Rex Lookout, and South Mission Beach, and lastly, 1 accession came from each of Mackay, Wonga Beach, Palm Cove, Trinity Beach, Cooya Beach, Cook Town, Newell Beach, and Midge Point. The geographical distribution of the 19 provenances of BLT is shown in Figure 1. Fruits that had fallen naturally from the tree on maturity were handpicked from underneath the canopy of the selected trees. Proper care was taken to collect only the mature fruits that belonged to recent fruiting season (approx. 6 months old). The fruits were cleaned and dried soon after collection, placed in cotton bags, and stored in a cool, dry shed which had free ventilation.

2.2. Sample Preparation

The stored fruits were used for oil extraction after approximately one year of storage. The fruits were cracked open manually using a rubber-head hammer, and the separated kernels were collected. About 200 g of the kernels were procured from each accession. The kernels were then crushed into smaller particles (5–10 mm size) using a Nutribullet blender (Nutribullet Pro Plus 1200 W). As the kernels had lost moisture due to storage, the crushed kernels were dried in a forced dry oven for 24 h at 65–70 °C to maintain uniform moisture content amongst all accessions.

2.3. Reference Method for Oil Extraction

An electric-powered Komet oil press (IBG Monforts Oekotec GmbH & Co. KG, Mönchengladbach, Germany) was used to extract the oil from BLT kernels. Initially, the oil press barrel was pre-heated for 5–8 min by attaching the metal heating ring onto the shaft near the oil outlet. When the temperature of the heating ring went up to 250 °C, the shaft was heated to about 150 °C. Pre-heating was required for separating oil from the kernels. After 5–8 min of initial heating, the heating ring was removed, and the oil press was turned on. Approximately 100 g of oven-dried kernels from each accession were slowly fed into the hopper of the oil press to lead the kernels into the screw conveyor. The screw conveyor with its forward rotation motion squeezed the kernels at the end of the shaft leading to oozing of the oil through tiny pores. The press cake was expelled in the form of long strips. The initial temperature of the expelled oil reached 90–95 °C, while that of the expelled oil cake was recorded at 75–95 °C. After extracting the oil from each accession, proper care was taken to clean the inlet, screw conveyor and outlet parts of the oil press to prevent sample contamination. The extracted oil samples were then centrifuged for 30 min at 1000 rpm to separate the oil from the resin and the kernel residues. Following centrifugation, a white layer appeared between the oil and the kernel residue. All three components, viz., the oil, resin and the kernel residue were separated manually using pipettes, and their weights determined and expressed on dry-weight basis using the following formulas:
Oil content (%) = (weight of kernel oil extracted (g))/(dry weight of kernel used in the extraction (g)) × 100.
Kernel residue (%) = (weight of the residue (g))/(dry weight of kernel used in the extraction (g)) × 100.
Resin (%) = (weight of the resin (g))/(weight of kernel used in the extraction (g)) × 100.
Press cake content and the extraction loss were calculated as shown below.
Cake (%) = (weight of cake (g))/(dry weight of kernel used in the extraction (g)) × 100.
Loss (%) = (wt of kernel used − (wt of oil + wt of resin + wt of kernel residue + wt of cake))/(wt of kernel used in the extraction) × 100,
where wt denotes weight.
Since the resin was part of the oil, total oil content was determined by combining the oil and resin contents. Total oil content was determined using the formula:
Total oil (%) = oil (%) + resin (%) = (weight of oil (g) + weight of resin (g))/(dry weight of the kernel used in the extraction (g)) × 100.
Total oil yield was also expressed on fruit weight basis, as shown below.
Total oil % (fruit weight basis) = oil (%) + resin (%) = (weight of oil (g) + weight of resin (g))/(weight of kernel used in extraction (g) + weight of its shell (g)) × 100.
Similarly, the proportion of kernel to shell and kernel to fruit were determined on dry-weight basis, as follows:
Kernel to shell (%) = (weight of kernel (g))/(weight of its shell (g)) × 100.
Kernel to fruit (%) = (weight of kernel (g))/(weight of kernel (g) + weight of its shell (g)) × 100.

2.4. FT–NIR Spectral Acquisition

Crushed kernel samples were oven dried at 65 °C overnight, prior to loading them on to the FT–NIR sample cup. The samples were stored in a desiccator to minimize moisture absorption prior to analysis. A Nicolet Antaris II Near-IR Analyzer (Thermo Electron Corporation, Madison, WI, USA) equipped with a photodiode detector made of indium gallium arsenide (InGaAs) was used. During each scan, the kernel samples were placed in an auto-spinning sample cup combined with an integrating sphere, which allowed the NIR light to infiltrate and interact with the samples from the bottom. Each sample was repacked and rescanned three times to minimize the effect of sample size. Each recorded spectrum of the samples had an average of 32 scans at 8 cm−1 resolution. The spectral data were acquired in absorbance mode with a wavelength ranging from 4000 to 10,000 cm−1. The RESULT 3 SP8 Build 60 software (Thermo Fisher Scientific Inc., USA) was used for controlling the instrument and recording the FT–NIR spectra. After scanning the sample, the sample cup was cleaned with paper wipes (Kimwipes®, Kimberley-Clarks worldwide Inc., Roswell, GA, USA) and isopropyl alcohol to minimize sample contamination.

2.5. Spectral Data Processing and Chemometric Analysis

The FT–NIR data was exported in Excel format (*.xlsx) into The Unscrambler (version X, CAMO, Norway) for data analysis and pre-processing. The FT–NIR spectra was pre-processed using the Savitzky–Golay second derivative (21 smoothing points and second polynomial order) prior to spectra interpretation and chemometric analysis [21]. Principal component analysis (PCA) was used to analyse the data to identify clusters of accessions. Partial least squares discriminant analysis (PLS-DA) was performed to classify the provenances of C. inophyllum according to region, based on the NIR spectra of the kernel samples. The PLS-DA and PCA models were developed and validated using full cross validation (leave one out) [22,23,24]. The PLS-DA models were assessed using the coefficient of determination in cross validation (R2), the standard error in cross validation (SECV), the bias, and the slope [22,23,24].

3. Results and Discussion

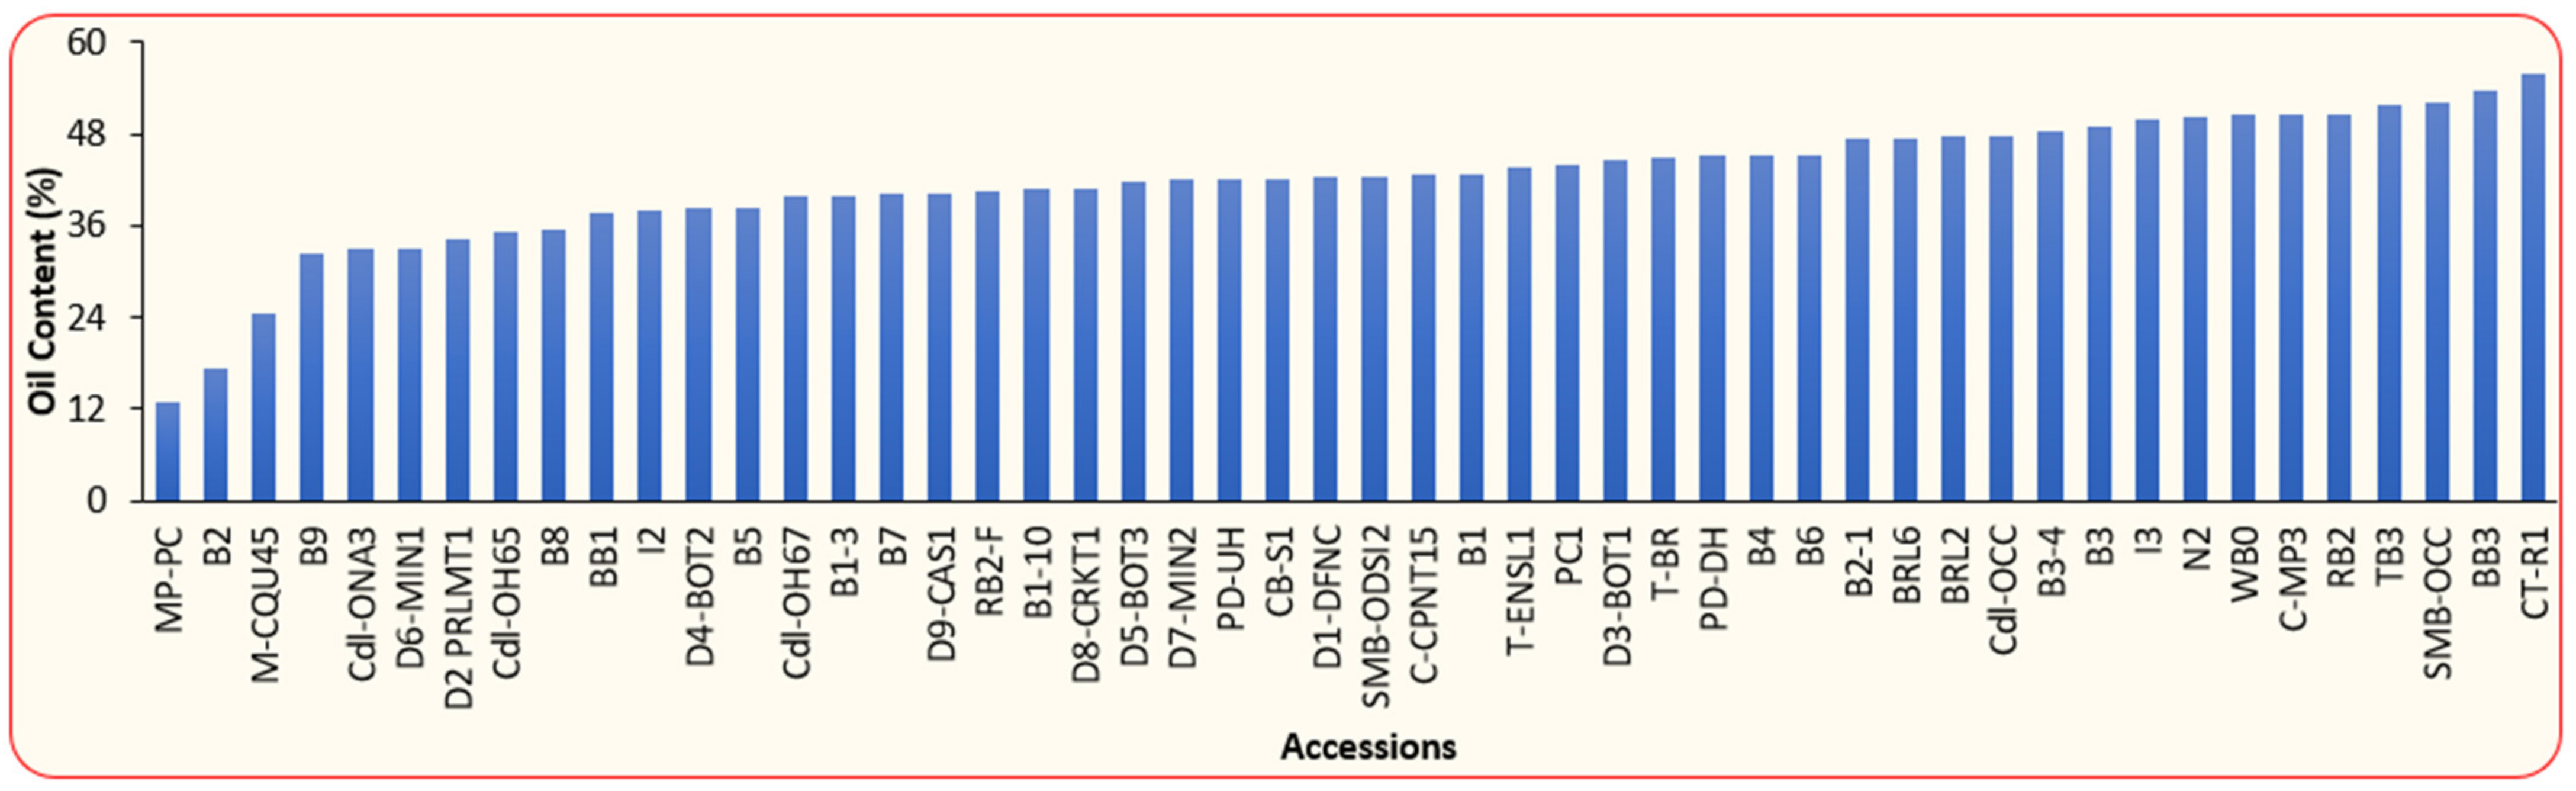
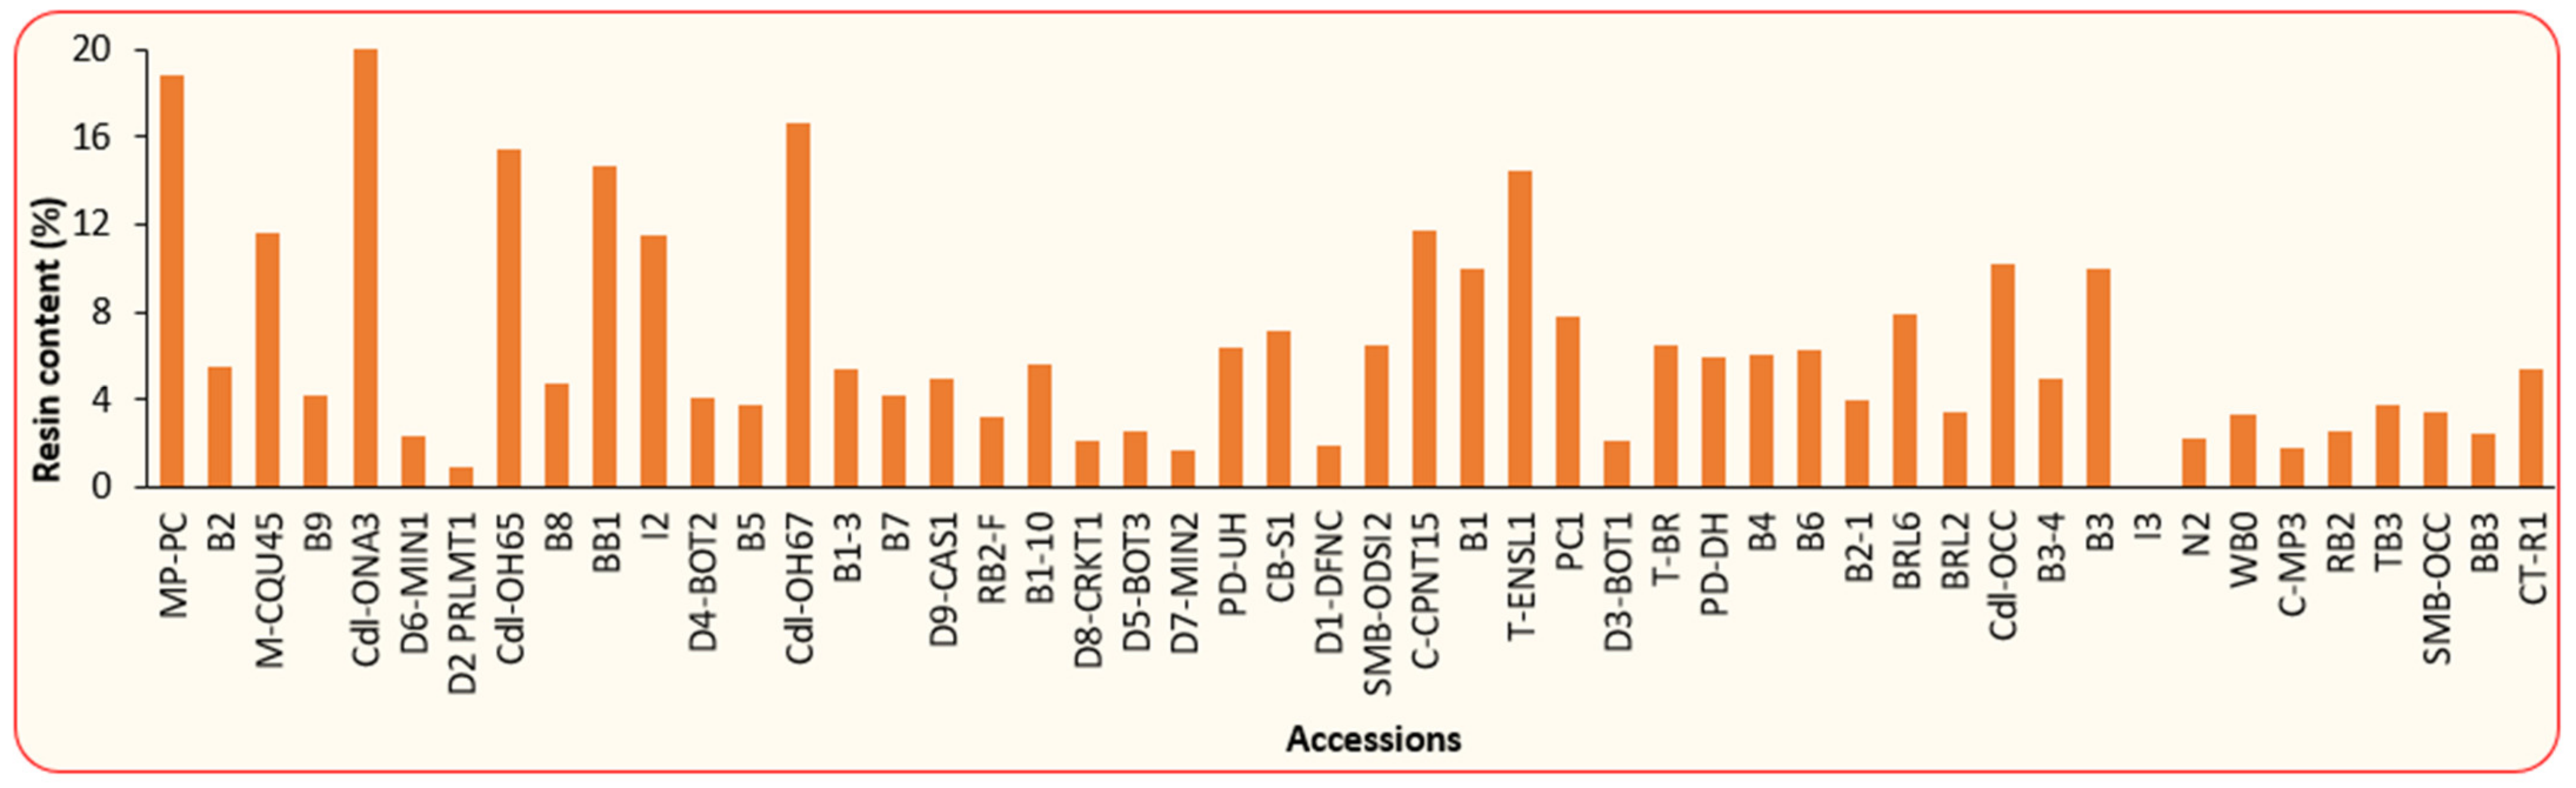
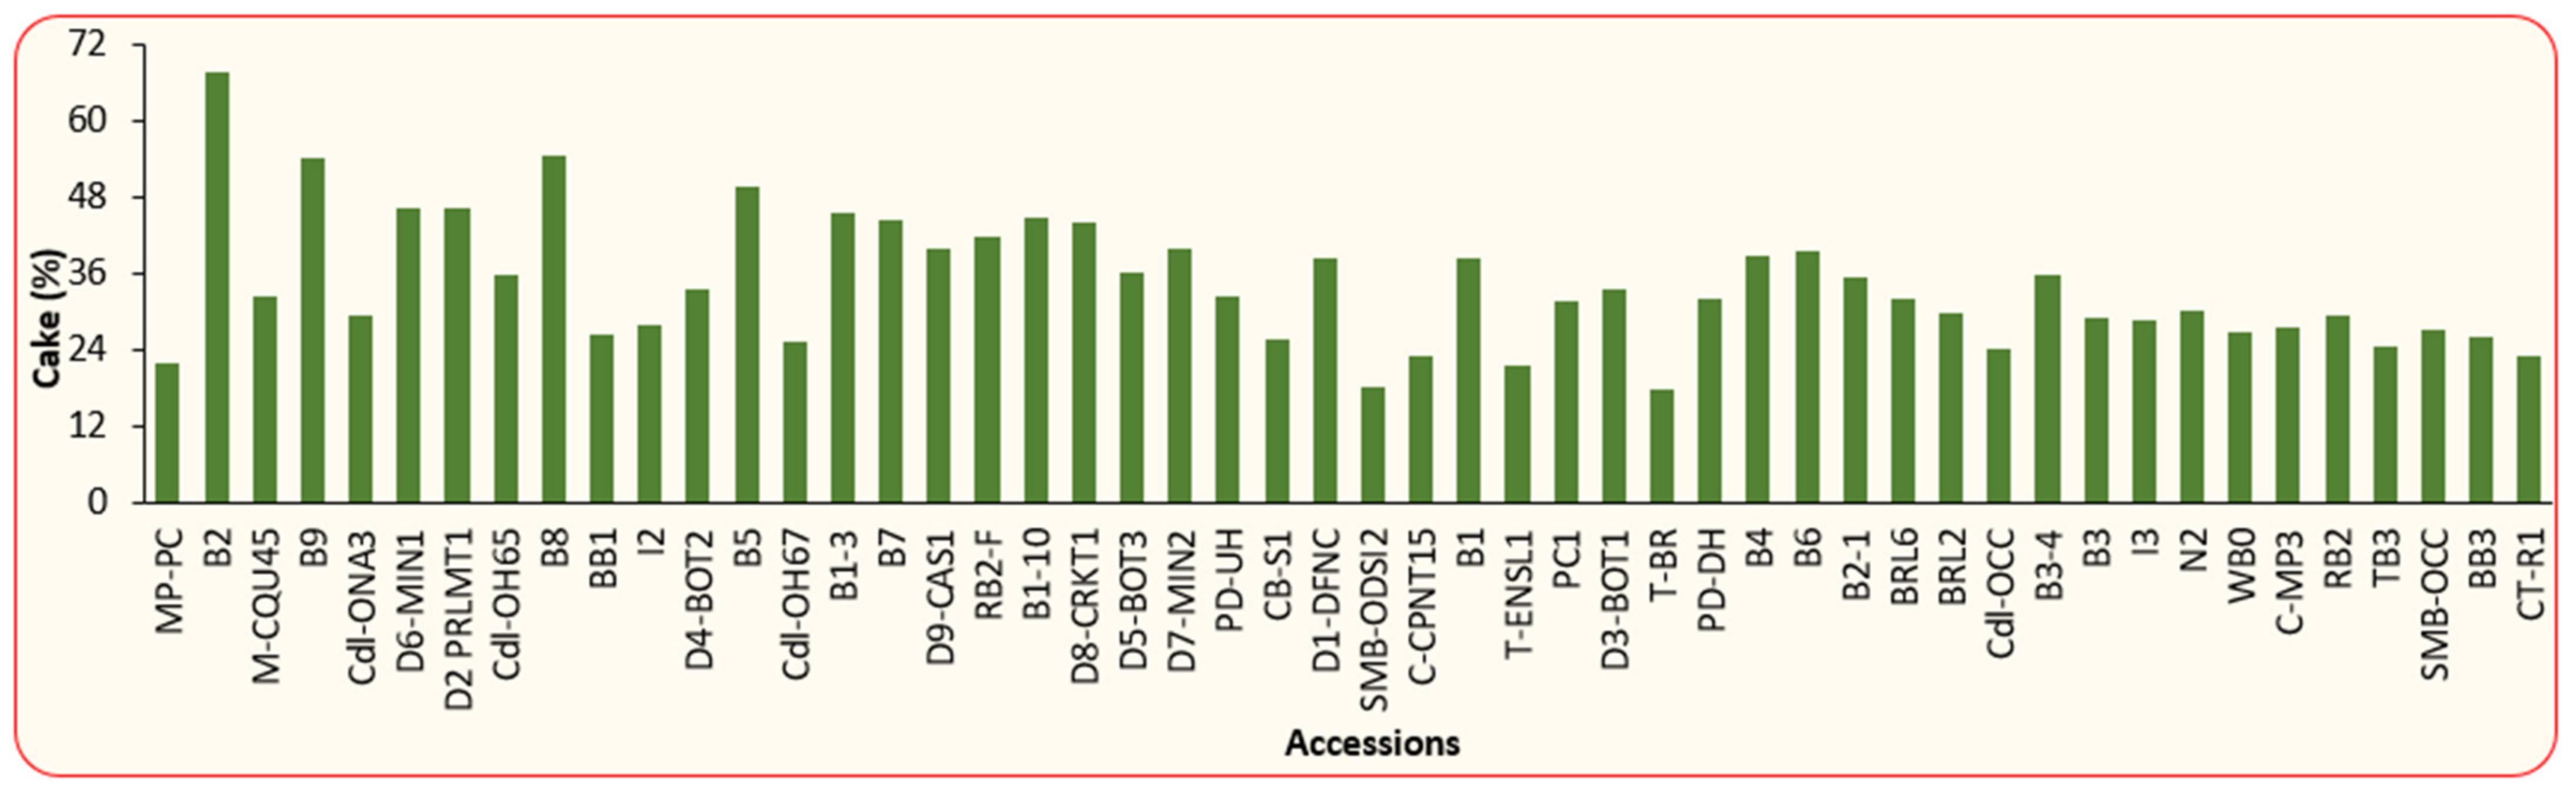
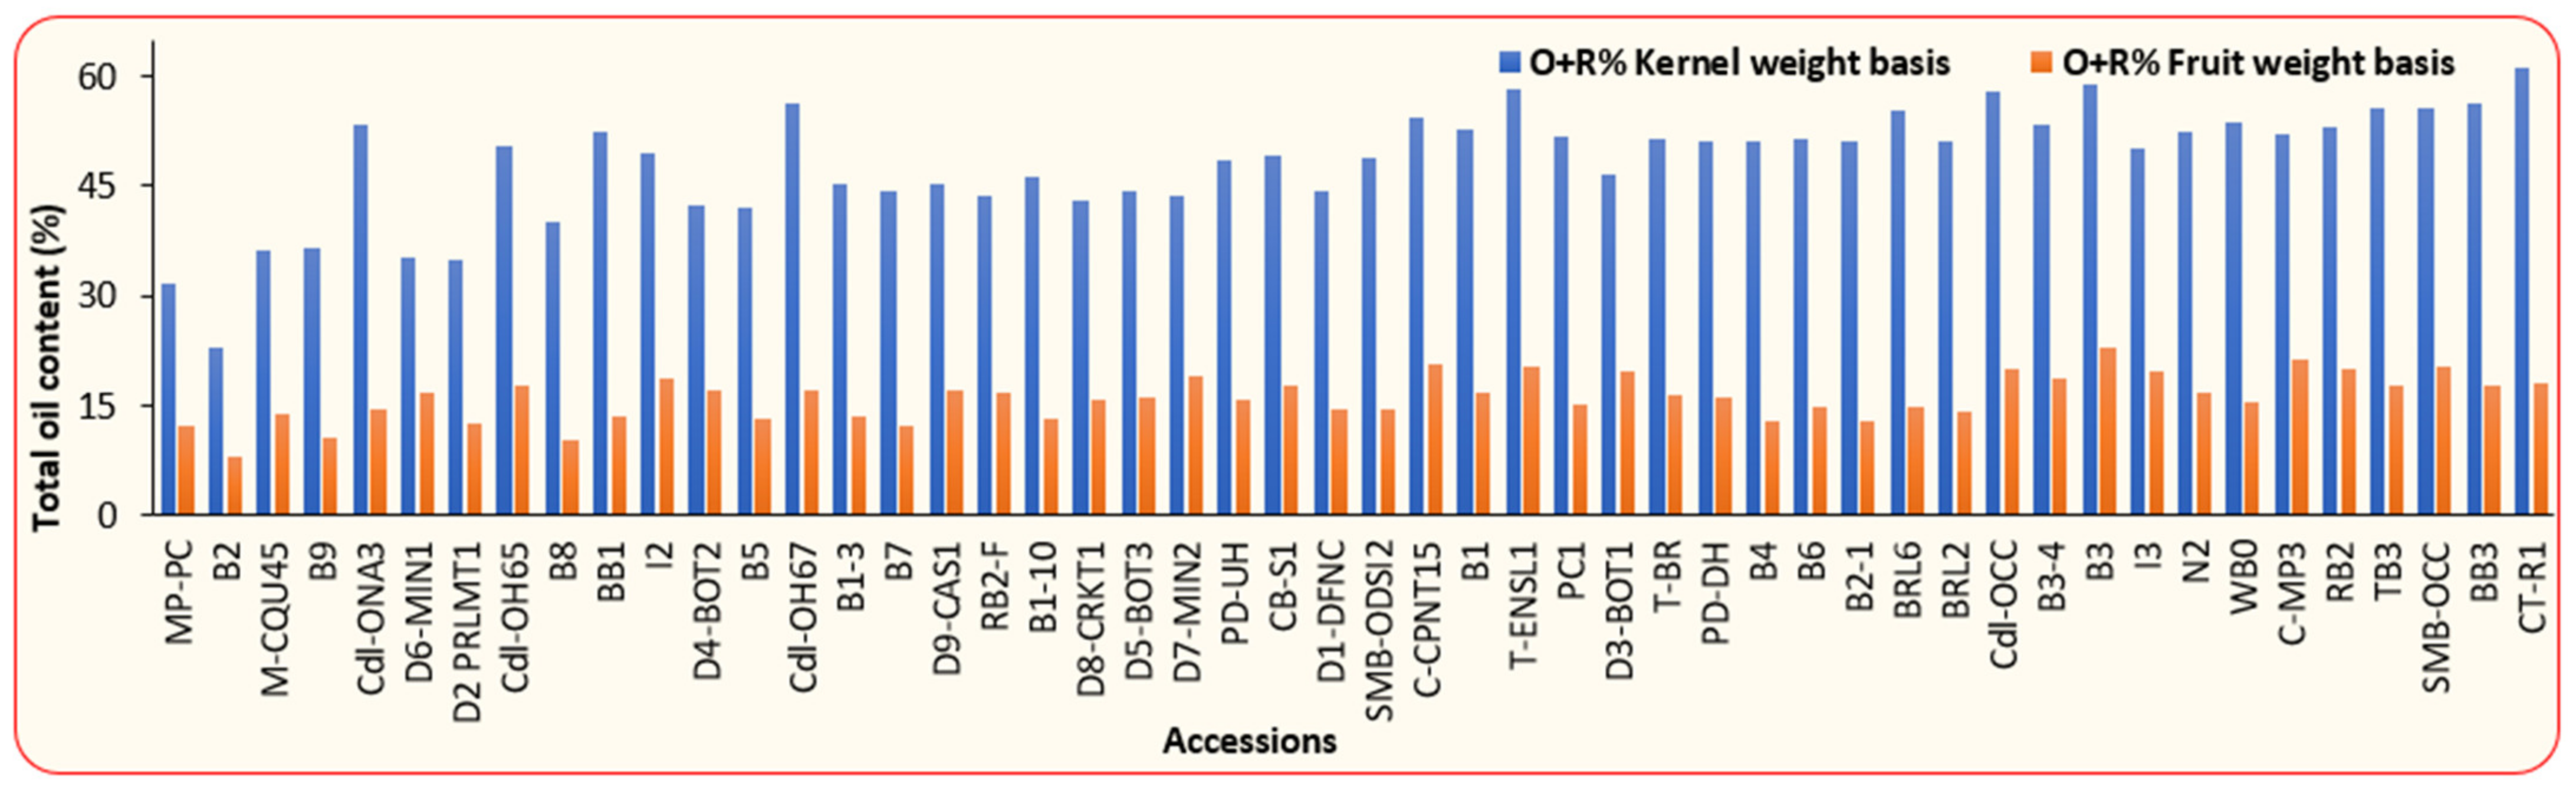
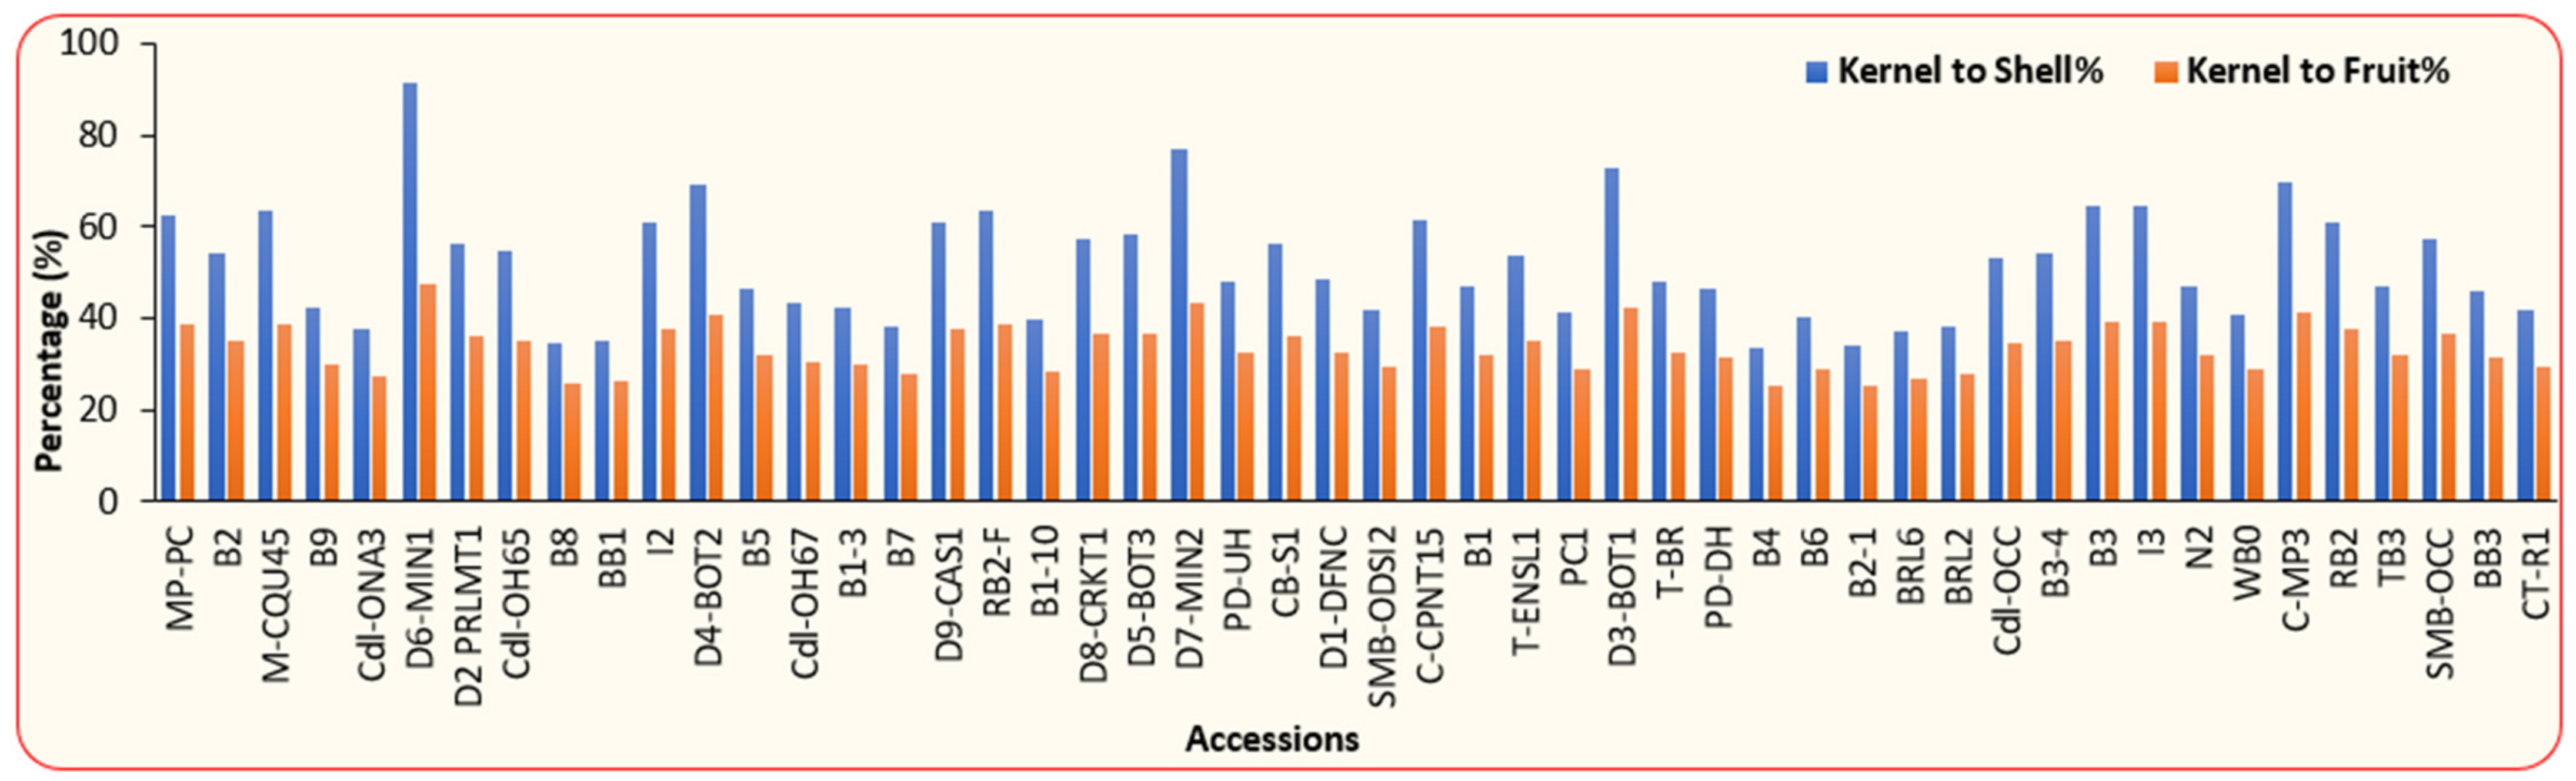
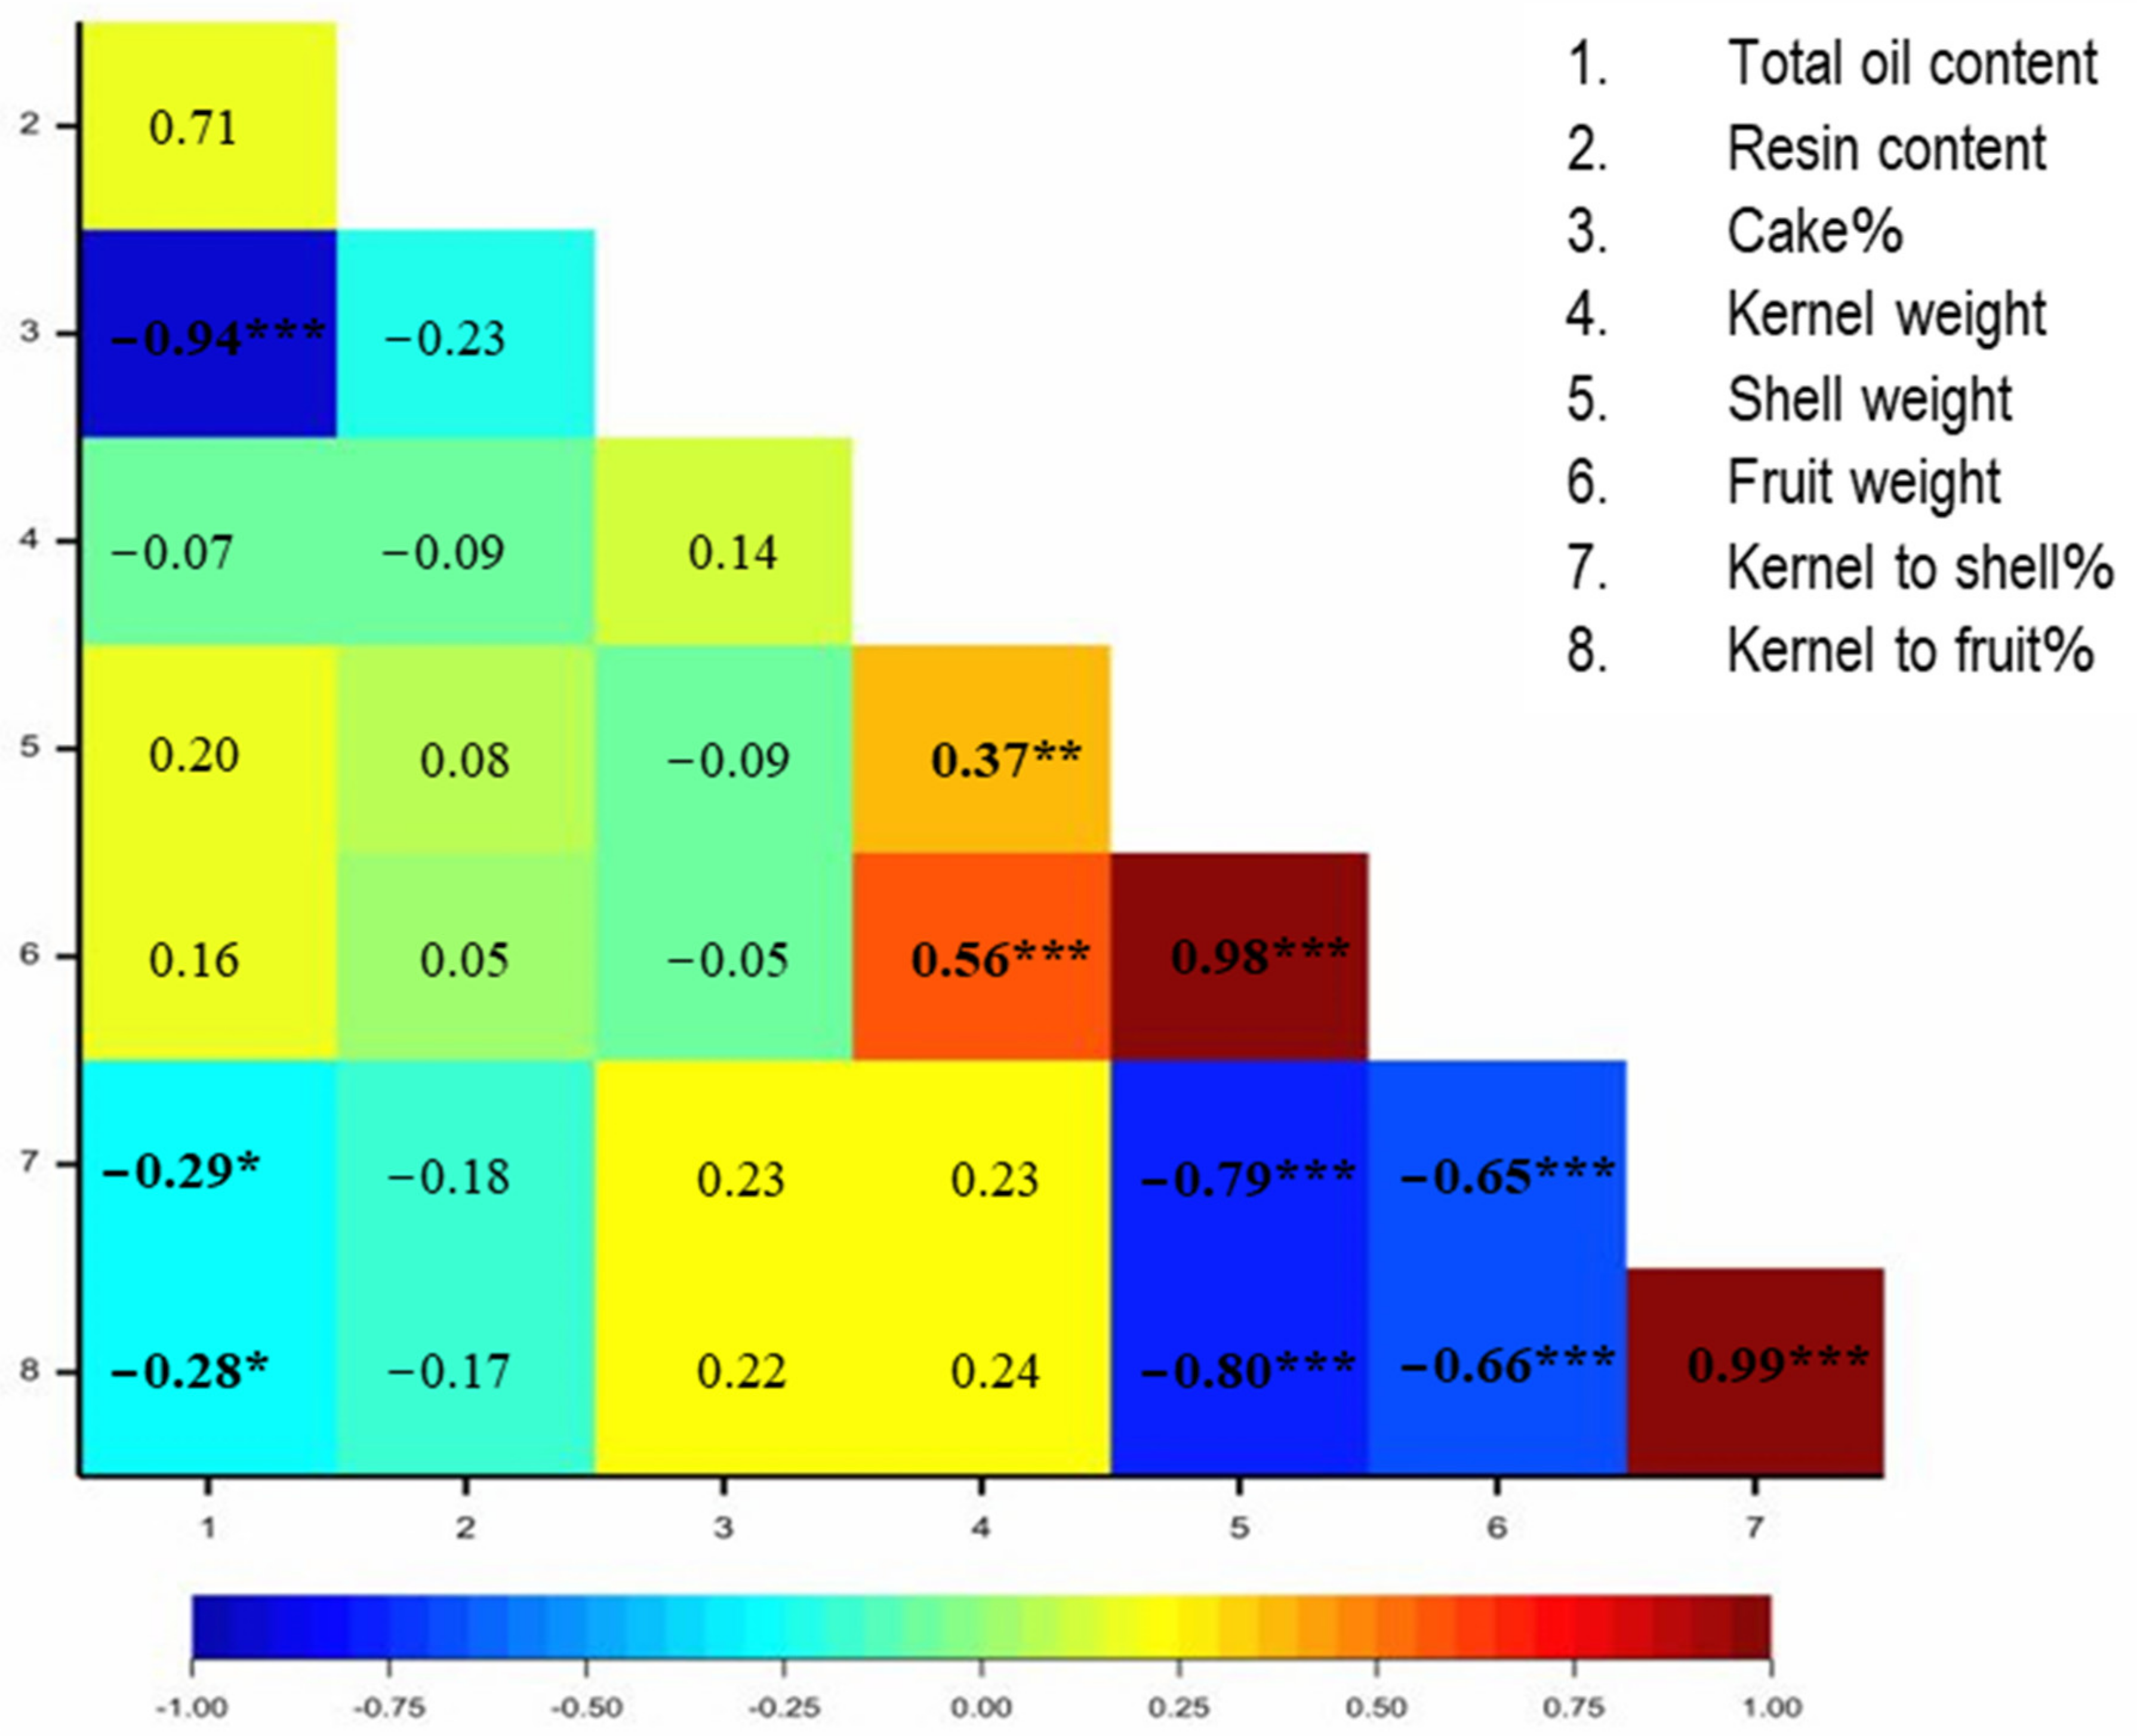
3.1. Physical and Chemical Properties of BLT Kernel Oil

Figure 2 shows the kernel oil content (without resin) of 50 accessions on kernel weight basis. The oil content ranged between 12.9% (MP-PC) to 55.9% (CT-R1) with a mean of 41.9%. The lowest oil content in MP-PC may be due to the presence of higher proportion of resin and increased evaporative loss during extraction. A layer of resin was observed between the oil and the residues following centrifugation. The resin content of the oil ranged between 0 and 20.4%. While no resin was found in accession I3, the accession Cdl-ONA3 exhibited the highest resin content (20.4%; Figure 3). Furthermore, the highest residue content was found in accession MP-PC (27.7%) and the lowest residue in B8 (2.7%).
The cake obtained as a by-product of the oil extraction process varied from 17.8 (T-BR) to 67.7% (B2), with an average of 34.1% (Figure 4). The higher proportion of cake in comparison to oil in accession B2 shows its low oil content. Recovery of oil using the mechanical extraction process is generally low, as reported by other authors [25]. Extraction losses ranged between 2.1% (Cdl-ONA3) and 18.6% (MP-PC), with an average of 5.2%.
Although the resin content was assessed separately, it was still a part of the oil. Thus, the total oil content was calculated as a combination of both the oil and the resin. Total oil content (oil% + resin%) on kernel weight basis varied from 22.9 to 61.3%, wherein the highest total oil content was displayed by the accession CT-R1 and the lowest by B2 (Figure 5). Based on the total oil content, the accessions were classified into three categories, defined as high, moderate and low oil content, as follows:
High oil content (>55%): CT-R1 (61.3%), B3 (59%), T-ENSL1 (58.1%), Cdl-OCC (57.9%), Cdl-OH67 (56.3%), BB3 (56.3%), SMB-OCC (55.6%), TB3 (55.5%), BRL6 (55.4%).
Moderate oil content (45–55%): C-CPNT15 (54.3%), WB0 (53.7%), B3–4 (53.4%), Cdl-ONA3 (53.4%), RB2 (53.1%), B1 (52.7%), N2 (52.4%), BB1 (52.3%), C-MP3 (52.2%), PC1 (51.7%), B6 (51.5%), T-BR (51.4%), B2-1 (51.3%), B4 (51.2%), PD-DH (51.1%), BRL2 (51%), Cdl-OH65 (50.6%), I3 (50%), I2 (49.4%), CB-S1 (49.3%), SMB-ODSI2 (48.9%), PD-UH (48.5%), D3-BOT1 (46.7%), B1-10 (46.3%), D9-CAS1 (45.3%), B1-3 (45.2%).
Low oil content (<45%): B7 (44.3%), D5-BOT3 (44.3%), D1-DFNC (44.3%), D7-MIN2 (43.7%), RB2-F (43.6%), D8-CRKT1 (43.1%), D4-BOT2 (42.3%), B5 (42.1%), B8 (40.1%) B9 (36.4%), M-CQU45 (36.1%), D6-MIN1 (35.3%), D2-PRLMT1 (35%), MP-PC (31.8%) and B2 (22.9%; Figure 5).
Similar conclusions were drawn by other authors, who reported large variation in the oil content of different Calophyllum inophyllum provenances, in the following ranges: 34.1–50.6% [26], 55–75% [11], 26.3–42.7% [7], 31.5–56.3% [20], 35.7–64.6% [27], 49.3–70.4% [28], 36.1–48.9% [29] and 61.8–79.7% [30].
Total oil content was also determined on fruit weight basis to account for variations due to changes in the husk proportions in the fruits. It ranged from 8.1% (B2) to 23.1% (B3), with a mean value of 16.2% (Figure 5). Interestingly, the accessions that recorded the highest and the lowest oil content on fruit weight basis belonged to the Bowen provenance. This demonstrates the importance of both inter- and intra-provenance variations in selecting superior genotypes. Although the accession CT-R1 showed the highest total oil content on kernel weight basis, it was the accession B3 that had the maximum total oil content on fruit weight basis. This may be due to the presence of a higher proportion of shell in CT-R1. It has been reported that the concentration of oil is determined by both the kernel weight, kernel size and density. Other genetic factors that can also explain these differences include the kernel-to-shell ratio (see Figure 6) [26,27,28,29,30].
Kernel-to-shell percentage ranged from 33.5 (B4) to 91.2% (D6-MIN1), whereas the kernel-to-fruit percentage varied between 25.1 (B4) and 47.7% (D6-MIN1; Figure 6). Both kernel-to-shell percentage and kernel-to-whole-fruit percentage were found to be high in accession D6-MIN1 and low in accession B4 (Figure 6). Although the accession D6-MIN1 showed the highest proportion of kernel, it was not reflected in its oil content, as the oil content was low in D6-MIN1 as compared to most other accessions. In contrast, the accession B4, which had the lowest proportion of kernel, showed a comparatively high kernel oil content when compared with many other accessions (Figure 2). This is because the oil content is not only determined by the kernel weight, but is also governed by its size, density and other factors, including the genetic makeup of the accession.
To delineate the causes of this variation in oil content among accessions, a correlation study was carried out, and the results are shown in Figure 7. Total oil content showed a strong negative correlation with the cake content (r = −0.94) and a weak negative correlation with kernel-to-shell % (r = −0.29) and kernel-to-fruit % (r = −0.28). Kernel weight had a strong positive correlation with fruit weight (r = 0.56) and a moderate positive correlation with shell weight (r = 0.37). Shell weight also had very strong positive correlation with fruit weight rather than kernel weight, and a strong negative correlation with kernel- to-shell % and kernel-to-fruit %. Furthermore, fruit weight was highly negatively correlated with kernel-to-shell % and kernel-to-fruit %. This indicated a minimal influence of the kernel on the overall weight of the fruit. In the present study, significant variation was recorded for kernel weights. Interestingly, it was also noted that some accessions, despite having larger kernels, exhibited much less oil content. In contrast, a few accessions that had smaller kernels showed a comparatively higher oil content. The enrichment of oil in smaller seeds and the degradation of certain components of seed such as soluble carbohydrates or protein during year-long storage might contribute to explaining the negative correlation between oil content and kernel size. Other studies also reported a similar effect when corn seeds (Zea mays) were stored for a long period of time [31,32]. These researchers suggested that longer periods of storage lead to seed ageing, which results in the depletion of soluble carbohydrates, thereby affecting the overall quality of the seeds. Simic and collaborators [33] also reported a negative correlation between storage longevity and oil content, which was evident from the decrease in oil content by 8.53% in sunflower, 2.19% in soybean, and 0.82% in maize samples. In a study conducted by Wu and collaborators [34], a statistically significant and negative correlation of oil content with seed weight, but a positive correlation of oil content with the width and thickness of the kernel was reported for Jatropha curcas. This research also highlighted the fact that the ratio between the width and thickness of kernel to seed showed a high and positive correlation (r = 0.92) with oil content [34]. These results indicated that the oil content per unit seed weight could be attributed to thickness and width of the kernel [34]. Wu and collaborators [34] also explained that the higher the width and thickness ratio of kernel to seed, the higher the percentage of seed space engrossed by the kernels, due to their width and thickness resulting in higher oil content. On the other hand, Reinert and collaborators [35] reported that the oil content of Silphium integrifolium had no significant correlation with kernel traits such as kernel width, kernel length, kernel area and kernel-area-to-wing-area ratio. Hence, the variation in oil content depends on various factors within the genotype as well as between the genotypes (species to species), among other factors [34,35].

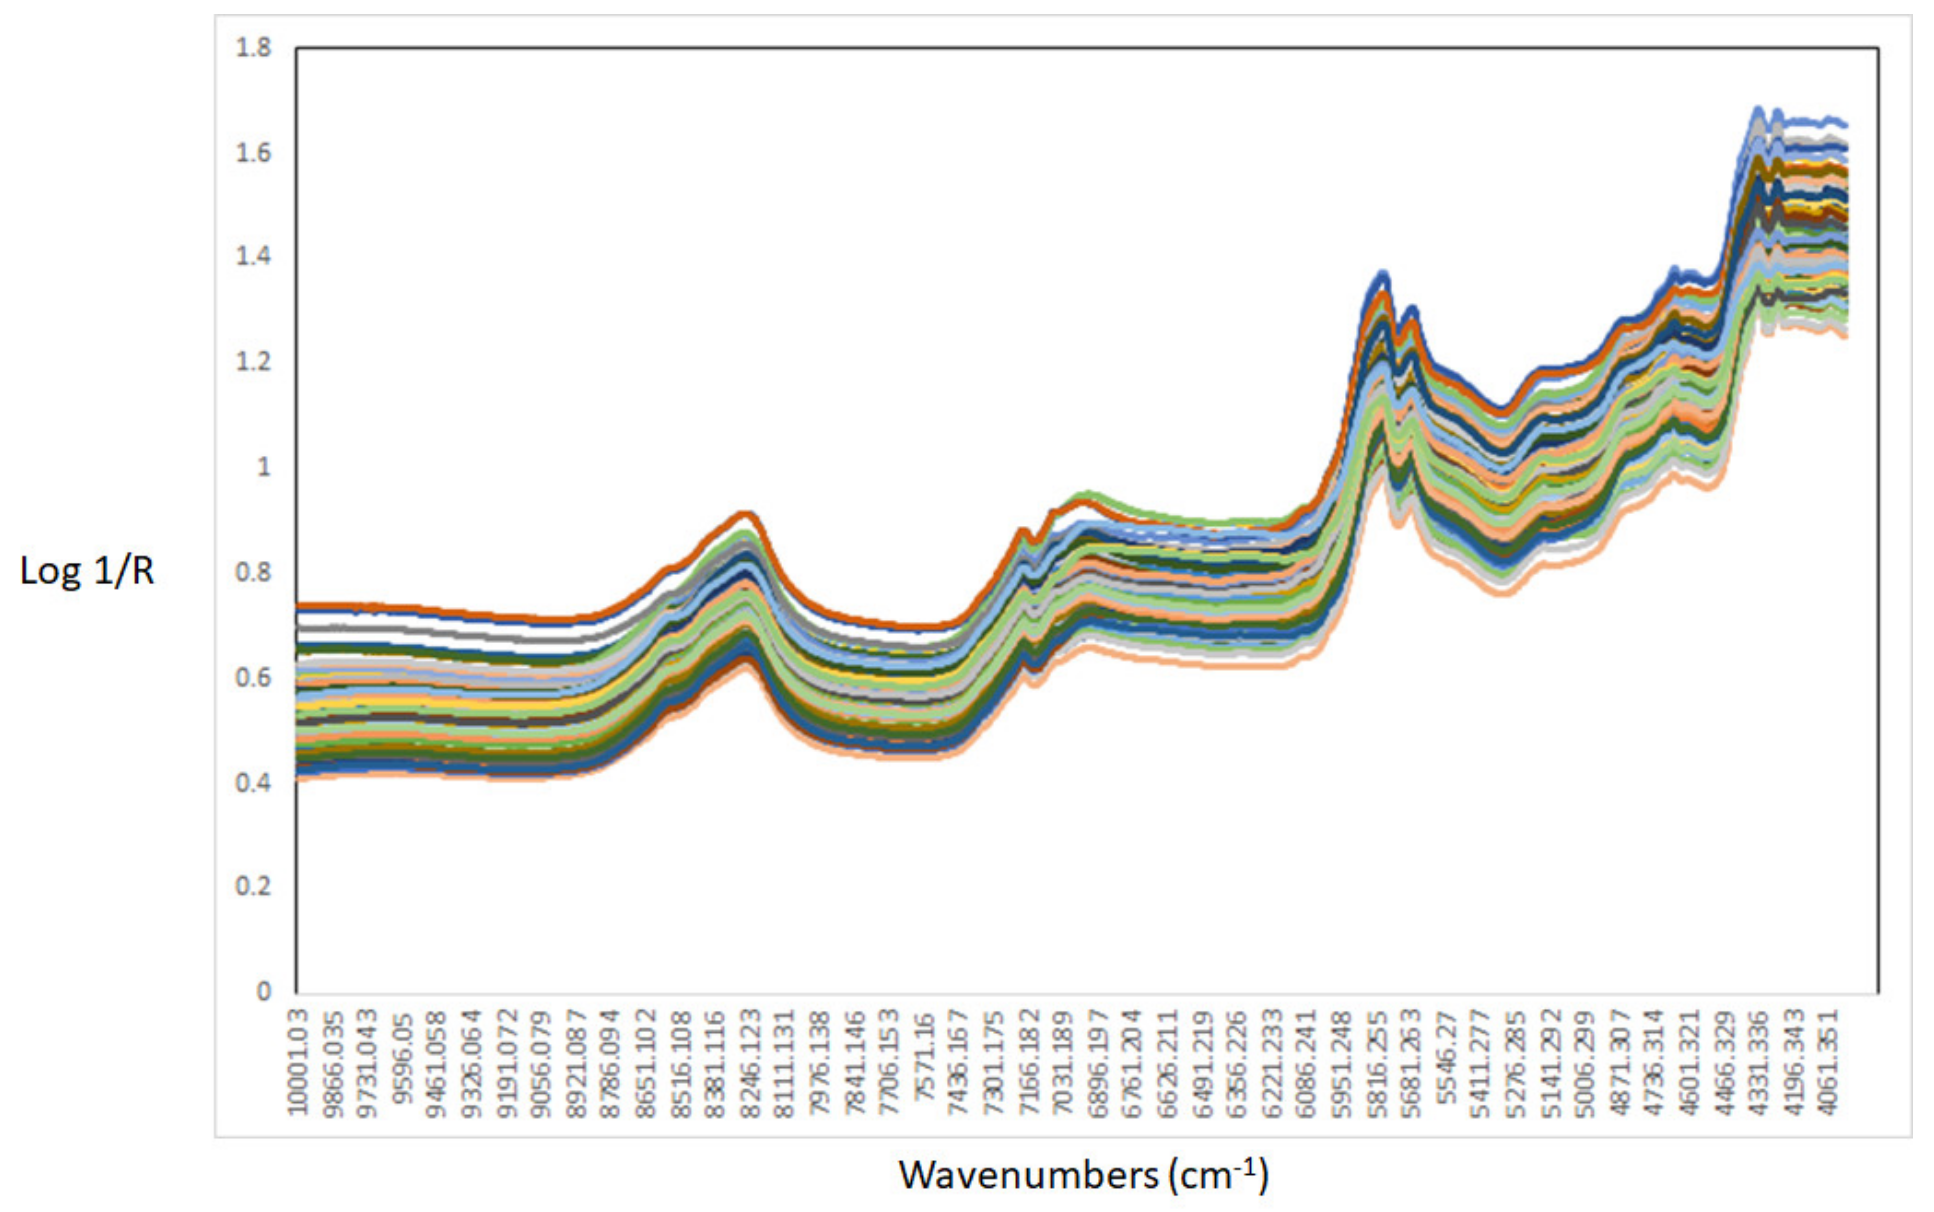
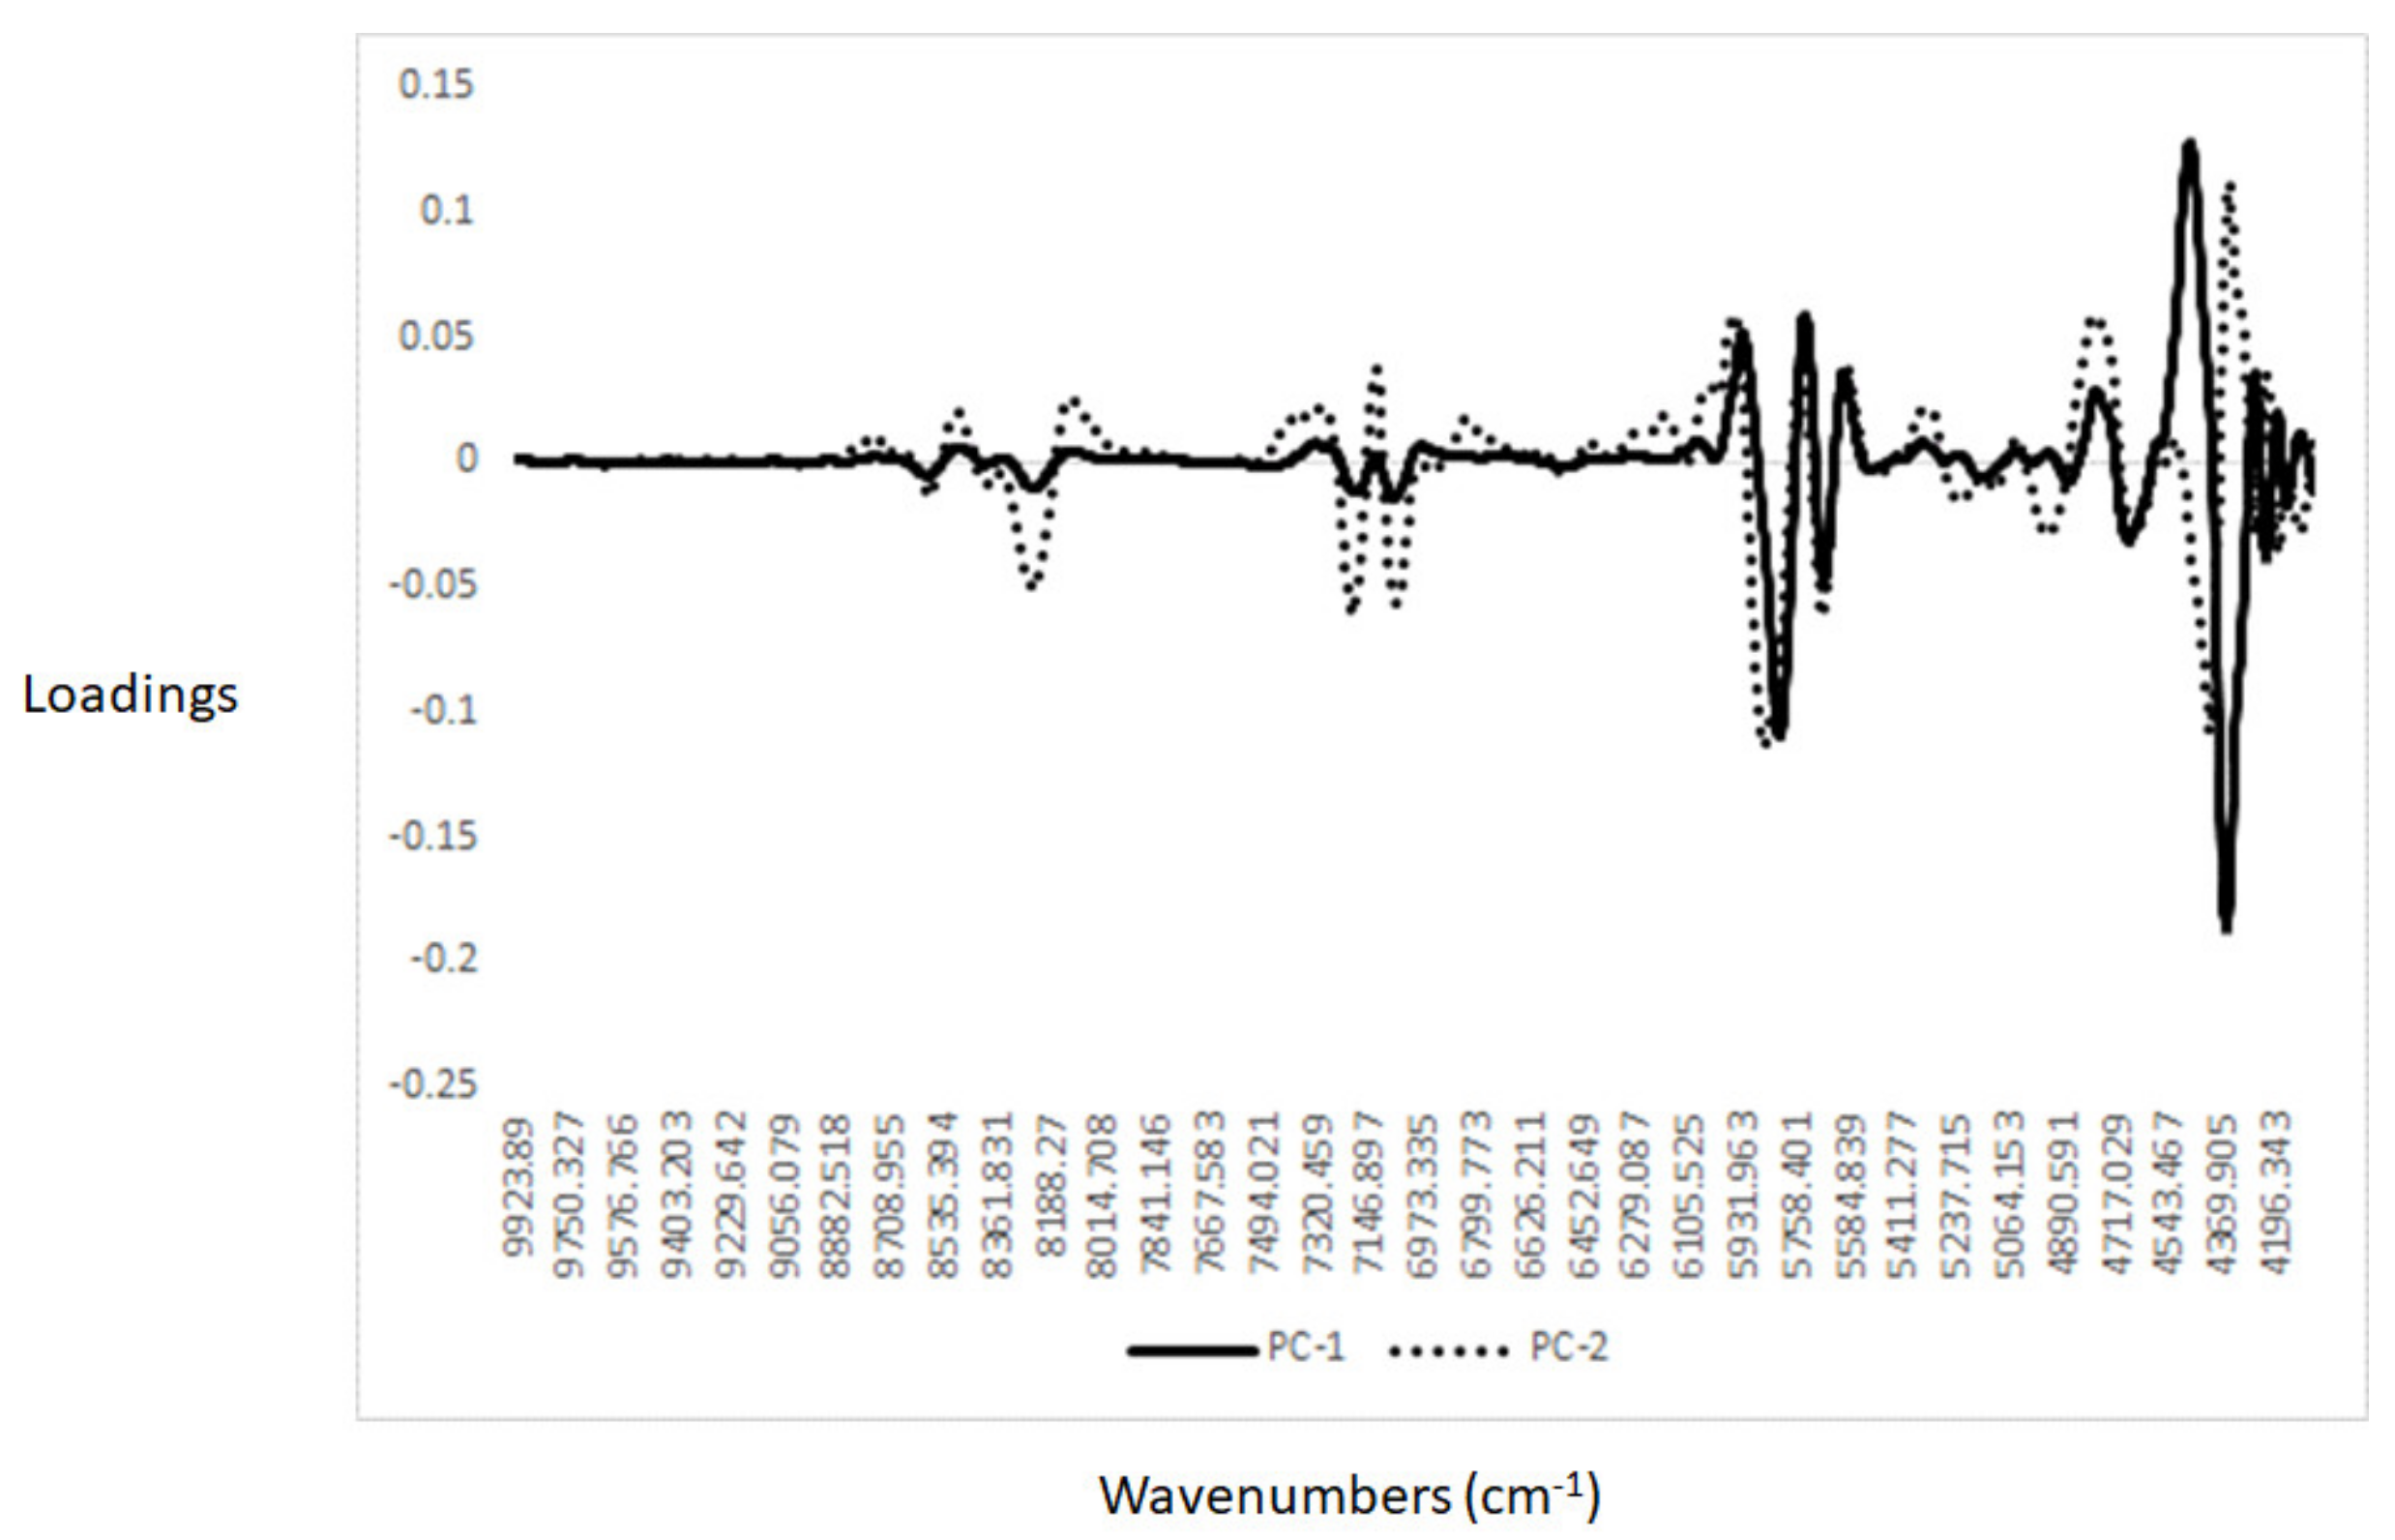
3.2. Near-Infrared Spectra Interpretation

Figure 8 shows the raw NIR spectra of the analysed kernels of C. inophyllum. The NIR spectra showed absorbance bands around 8265 cm−1 that associated with C-H2 groups; those around 7193 cm−1 associated with C-H methyl and C-H groups derived from aromatic compounds, at 7077 cm−1 they associated with C-H and O-H groups, and at 6969 cm−1 they associated with C-H and N-H groups (aromatic groups) [36]. Around 5800 cm−1 and 5677 cm−1 these bands are associated with C-H2 methylene groups [36]. The band at 5127 cm−1 is associated with C=O bonds corresponding to esters and acid groups. Around 4848 cm−1, this bond might be associated with N-H and amide groups, and at 4593 cm−1, this bond might be associated with both N-H and C=O combination tones, where those around 4339 cm−1 and 4209 cm−1 are associated with C-H combination tones and aromatic groups [36].

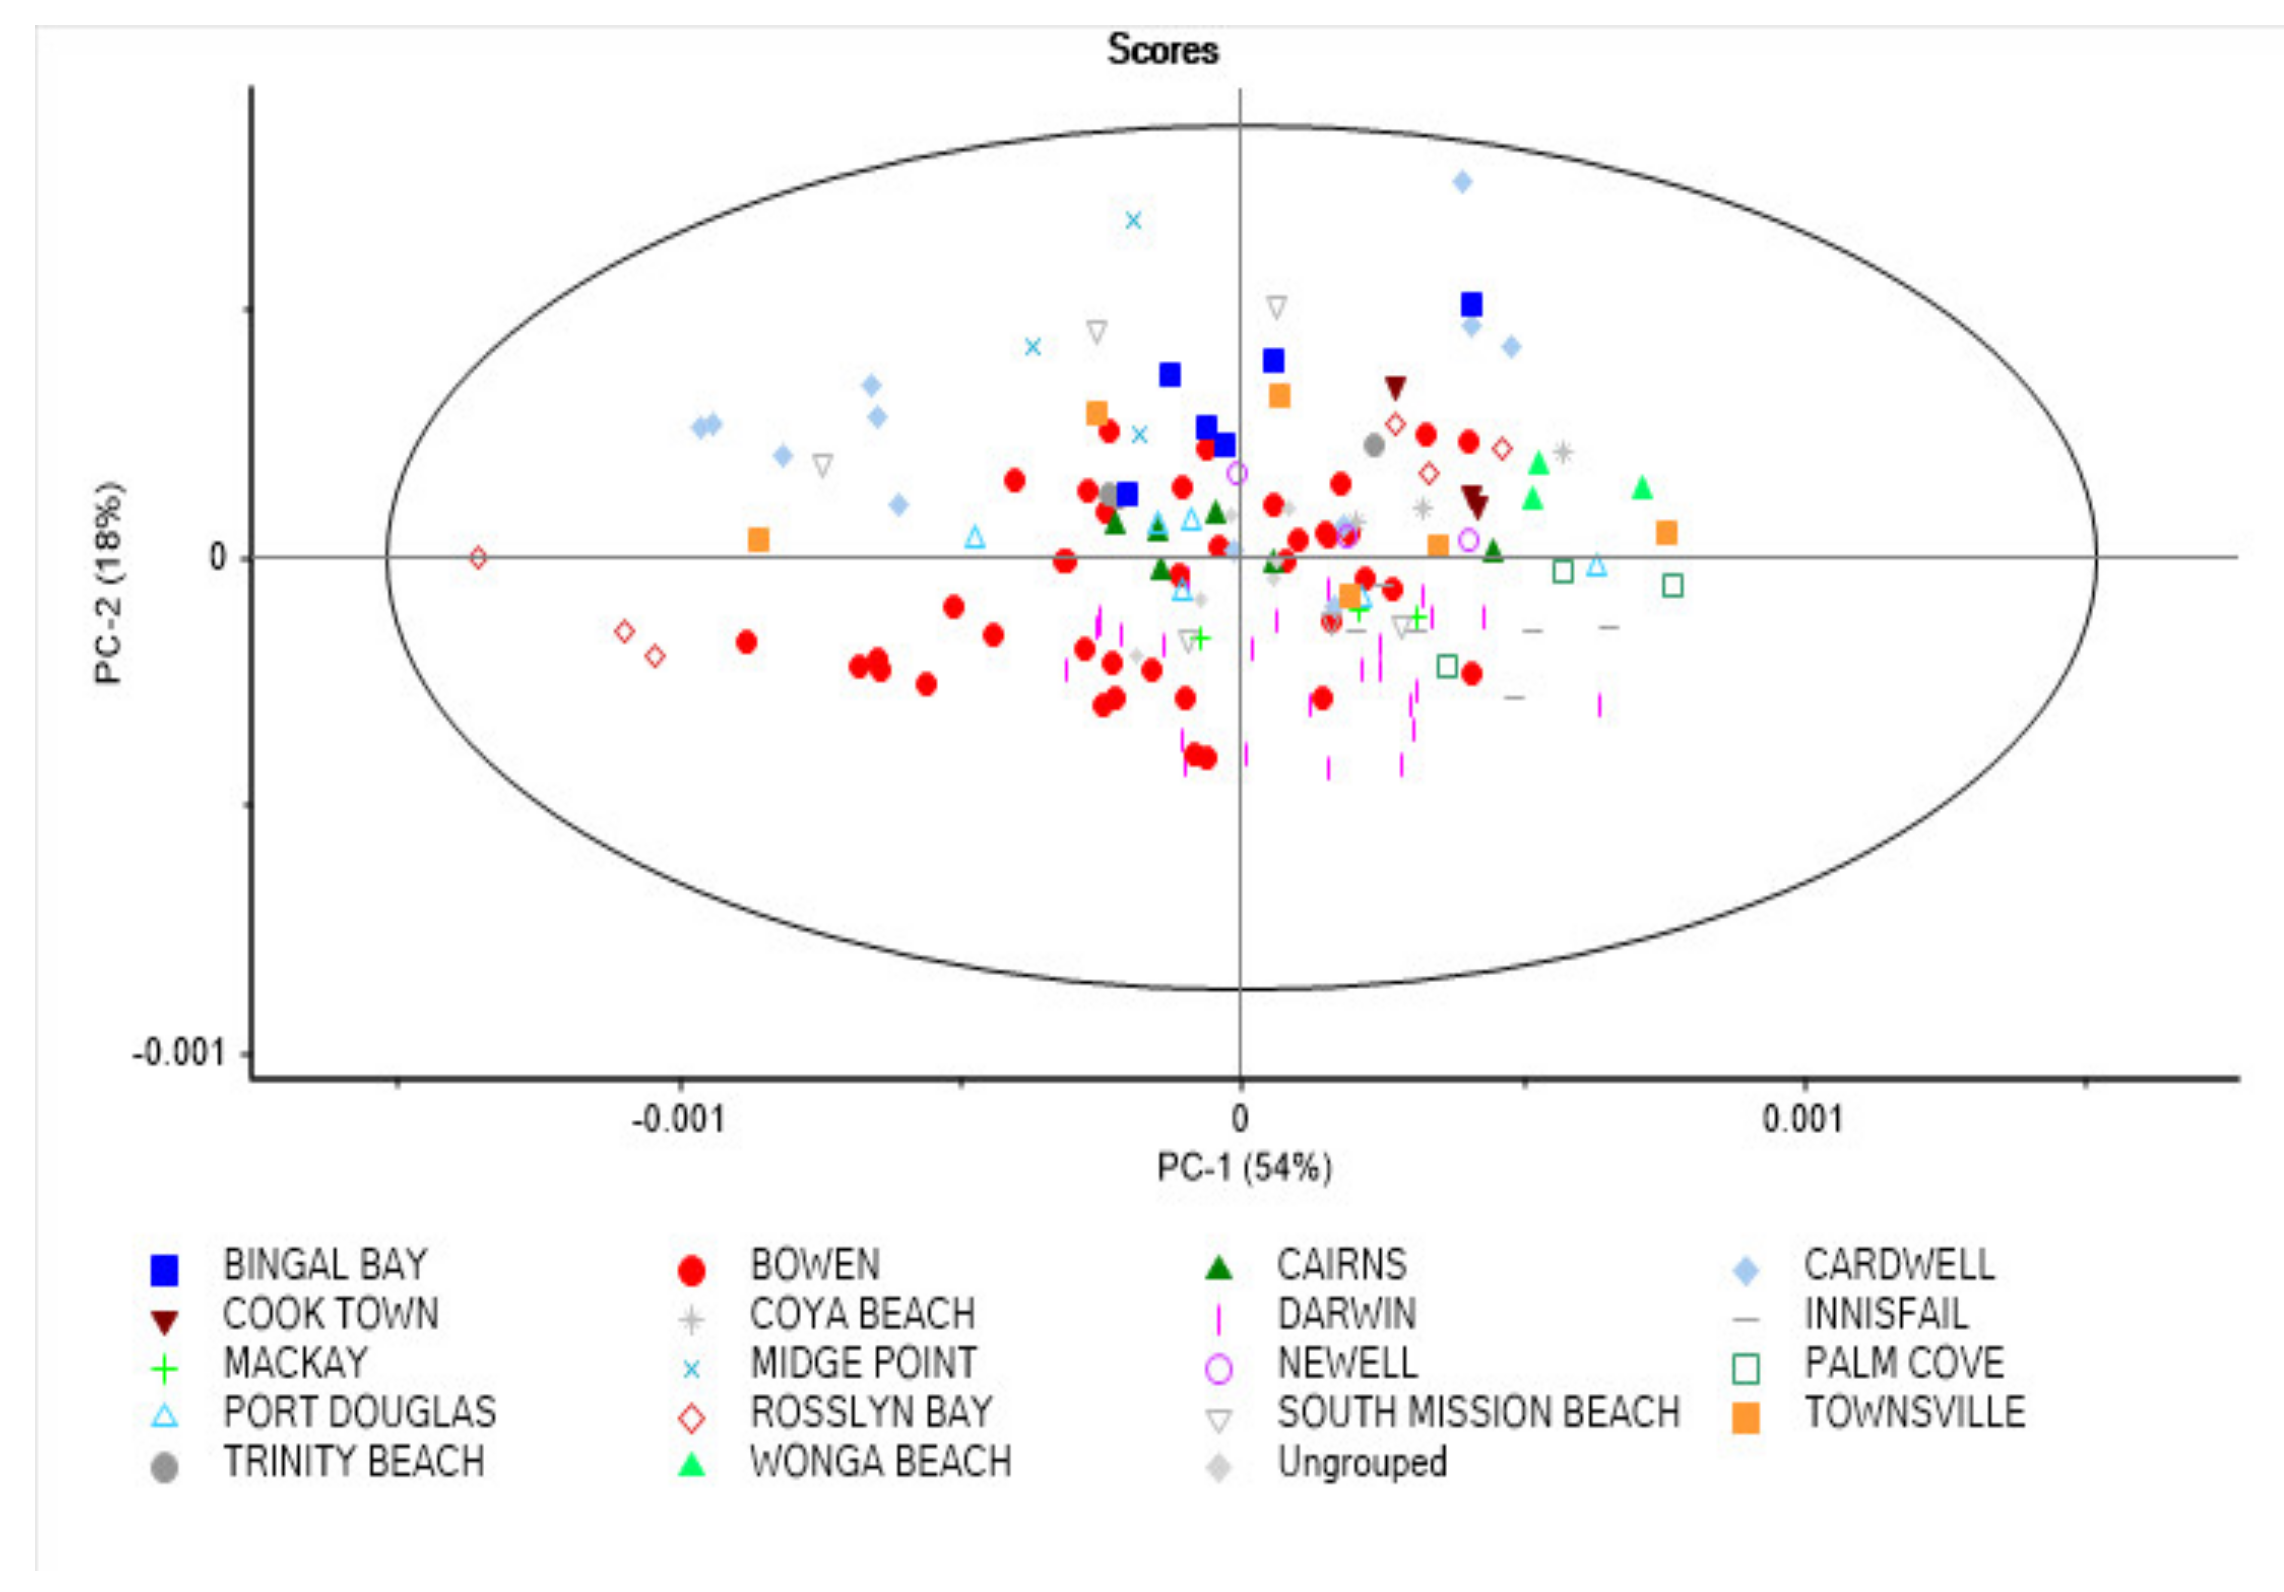
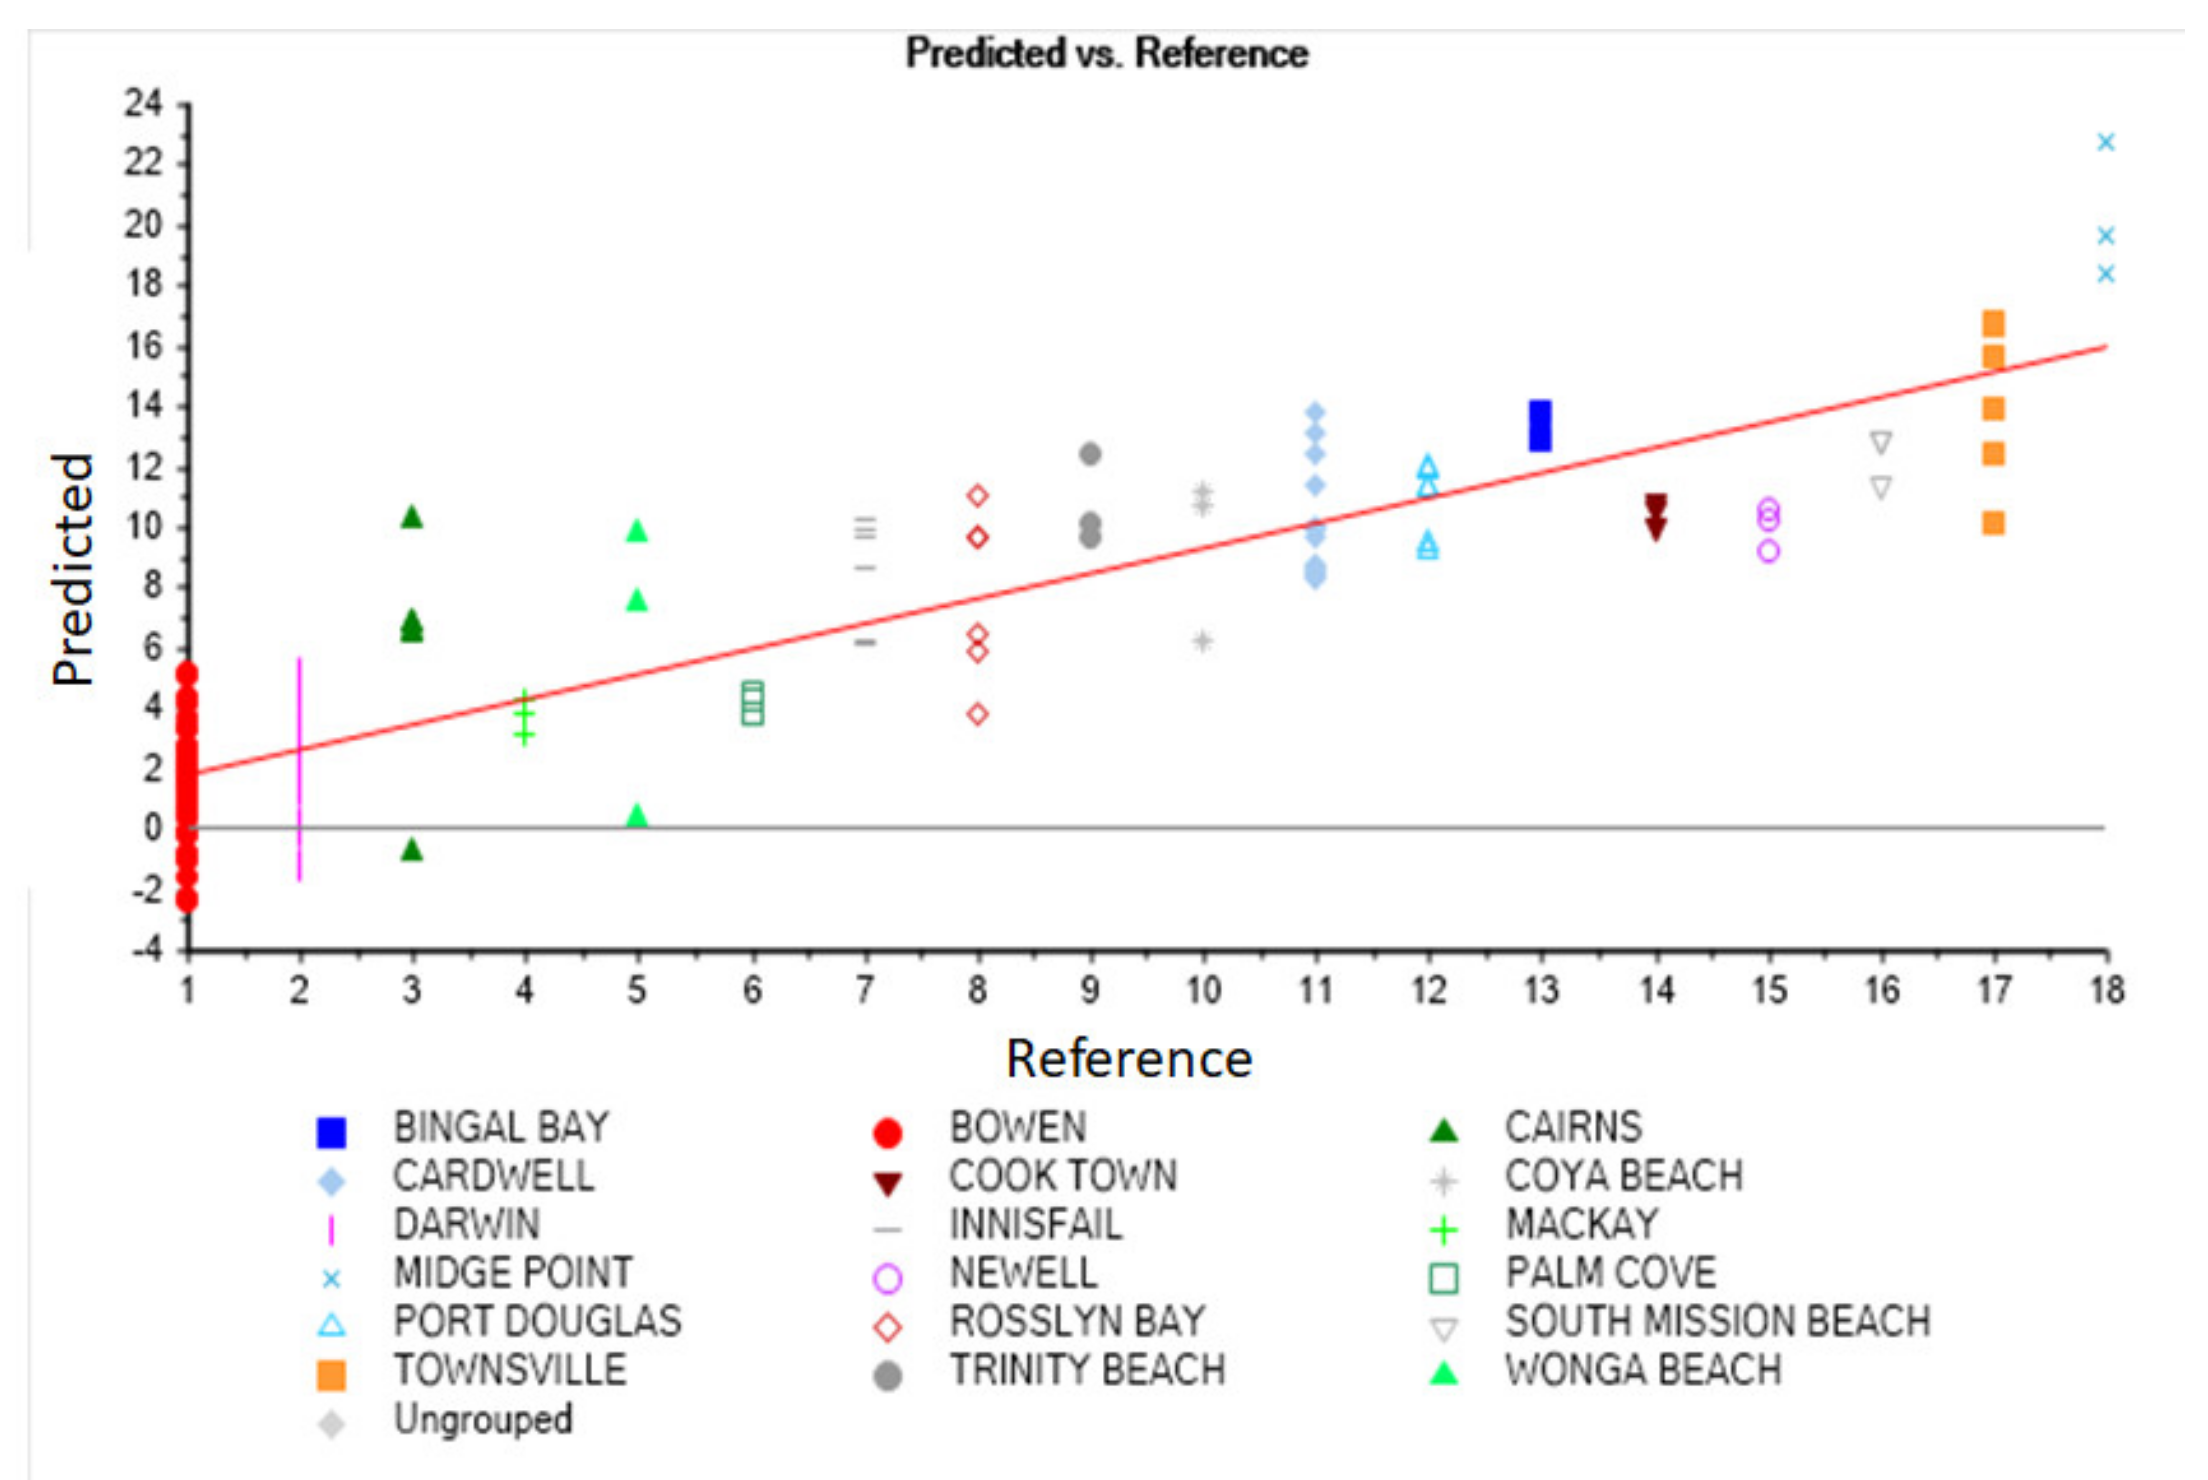
3.3. Principal Component and Discriminant Analysis

Both PCA and PLS-DA models were developed using the second derivative NIR spectra of the kernel samples. The PCA score plot and loadings derived from the PCA analysis are shown in Figure 9. A separation between samples could be observed as per locality or provenance. The first two principal components explain 72% of the variance (PC1:54%, PC2:18%) in the NIR spectra of the kernel samples analysed. It can also be observed that the kernel samples collected from Bowen, Darwin, Rosslyn Bay and Cardwell tend to cluster together. This might indicate that these accessions have similar chemical and spectral properties. In addition to PCA, a PLS-DA model was developed. The cross-validation statistics for the prediction of provenance based on the PLS-DA analysis of the NIR spectra gave a coefficient of determination (R2) of 0.83 and standard error in cross validation (SECV) of 2.3 (see Figure 10). It can be observed that some of the accessions predicted have high variability (e.g., Townville, Bowen, and Cairns) while other showed less variability (e.g., Palm cove, Mackay, Bingil Bay, Newell). This variation can be due not only to the geographical location but also to the genetic information. These results indicated and confirmed that the NIR spectra of the kernel samples have information that can be used to classify the C. inophyllum genotypes according to locality. Differences in provenance can be associated with the environmental conditions of the locality, and they can include differences in temperature, soil physical properties (e.g., clay and sand content), natural fertility (e.g., organic matter content), and moisture content, among other variables that will contribute to explain the observed variability in the NIR fingerprint of the kernel samples analysed. It was also observed that both PCA and PLS-DA loadings were similar. Figure 11 shows the PCA loadings, indicating that similar bands as described above explained the separation between kernel samples. Bands associated with C=O and CH2 groups are mainly related to the oil content of the kernel, and they contribute to explaining the differences between samples in relation to their provenance. The highest loadings were observed in PC2 around 8261 cm−1 associated with C-H2 groups, at 7212 cm−1 associated with C-H methyl and C-H groups derived from aromatic compounds, at 7070 cm−1 associated with C-H and O-H groups, and at 4948 cm−1 associated with C=O and O-H groups [36]. Additionally, a shift in the loadings was observed in PC2 around 5862 cm−1 and 4416 cm−1, associated with C-H3 and CHO groups, respectively [36].
The applicability of using PCA combined with spectroscopy to classify provenance based on the variation in the NIR fingerprint of the sample has been reported by Sandak and collaborators [37]. These authors demonstrated that it was possible to identify the provenance of Picea abies species based on both their NIR fingerprint and inherent variations in the chemical composition of the timber [37]. Similarly, Farhadi and collaborators [38] analysed the NIR spectra of Picea abies seed samples by combining PCA with orthogonal projection to latent structures discriminant analysis (OPLS-DA) to develop classification models to identify the provenance of the seeds (Sweden, Finland and Poland) [38]. These authors stated that, due to the high natural variation in the chemical composition of these seeds, the classification models were able to identify the provenance of the samples with an accuracy ranging between 95% and 99%, using an external and internal test set [38].

4. Conclusions

In this study, most of the BLT accessions were separated using PCA and PLS-DA, combined with NIR spectroscopy. The loadings derived from the PCA showed that specific wavenumbers were used by the model to separate the C. inophyllum kernel accessions. The results also demonstrated that the FT–NIR spectra can be used as a tool to select the provenances, as well as to identify the composition and quality of the kernel samples. In addition, FT–NIR spectroscopy can be used as an alternative tool to the current laboratory methods to estimate kernel oil, resin, or cake content. The establishment of such a non-destructive method of determining seed oil content will save resources in oil analysis. Most importantly, this technique can be used to screen genotypes for selecting cultivars that contain high oil content. Determining variations in kernel oil content as a function of genetic variability or agronomic practices (e.g., irrigation, fertilizer application) or selecting the best genotypes for plant breeding require testing of a large number of fruits. This testing can be costly, and often does not allow the tested seeds to be preserved for further propagation. Therefore, FT–NIR spectroscopy not only helps screen large number of genotypes economically, but also allows the preservation of the tested seeds for further propagation. This feature will have the greatest advantage in plant breeding and commercial cultivation, as only the seeds that contain high oil content could be selected and sown to help establish plantations with high oil-production capacity.

Author Contributions

R.S.: conduct of experiments, data collection and preparing draft; N.A.: formulating ideas, selection of genotypes, sourcing BLT fruits, writing and editing draft, administration; D.C.: data analysis, writing and editing draft. All authors have read and agreed to the published version of the manuscript.

Funding

This research received no external funding.

Institutional Review Board Statement

Not applicable.

Informed Consent Statement

Not applicable.

Data Availability Statement

Data are archived on CQU One drive.

Acknowledgments

We thank Pramod Shrestha for assistance with seed collection. RS is grateful to CQUniversity for the award of ‘International Excellence Scholarship’ and research support.

Conflicts of Interest

The authors declare no conflict of interest.

References

  1. Department of Industry, Science, Energy and Resources. Energy Consumption. 2020. Available online: https://www.energy.gov.au/data/energy-consumption (accessed on 10 May 2021).
  2. Anwar, M.; Rasul, M.G.; Ashwath, N. The synergistic effects of oxygenated additives on papaya biodiesel binary and ternary blends. Fuel 2019, 256, 115980. [Google Scholar] [CrossRef]
  3. Ginwal, H.; Rawat, P.S.; Srivastava, R.L. Seed source variation in growth performance and oil yield of Jatropha curcas Linn. in Central India. Silvae Genet. 2004, 53, 186–192. [Google Scholar] [CrossRef] [Green Version]
  4. Ayanoglu, A.; Aksoy, B. Biochar production from various biomass by different technologies: A review. Energy Educ. Sci. Technol. Part C 2015, 7, 29–48. [Google Scholar]
  5. Bhuiya, M.M.K.; Rasul, M.; Khan, M.; Ashwath, N.; Mofijur, M. Comparison of oil extraction between screw press and solvent (n-hexane) extraction technique from beauty leaf (Calophyllum inophyllum L.) feedstock. Ind. Crops Prod. 2020, 144, 112024. [Google Scholar] [CrossRef]
  6. Friday, J.; Okano, D. Calophyllum inophyllum (kamani) Species profiles for Pacific Island Agroforestry, Traditional Tree Initiative, Hawaii. 2006. Available online: http//traditionaltree.org (accessed on 1 August 2018).
  7. Hathurusingha, S.; Ashwath, N.; Subedi, P. Variation in oil content and fatty acid profile of Calophyllum inophyllum L. with fruit maturity and its implications on resultant biodiesel quality. Ind. Crops Prod. 2011, 33, 629–632. [Google Scholar] [CrossRef]
  8. Agarwal, A.K. Biofuels (alcohols and biodiesel) applications as fuels for internal combustion engines. Prog. Ener. Comb. Sci. 2007, 33, 233–271. [Google Scholar] [CrossRef]
  9. American Society for Testing Materials, USA. 2023. Available online: https://www.astm.org/products-services/standards-and-publications/standards/bos-standards.html?volume=5&year=2023 (accessed on 1 January 2023).
  10. Bhuiya, M.M.K.; Rasul, M.G.; Khan, M.M.K.; Ashwath, N.; Azad, A.K.; Hazrat, M.A. Prospects of 2nd generation biodiesel as a sustainable fuel–Part 2: Properties, performance and emission characteristics. Renew. Sustain. Energy Rev. 2016, 55, 1129–1146. [Google Scholar] [CrossRef]
  11. Chavan, S.B.; Kumbhar, R.R.; Deshmukh, R.B. Calophyllum inophyllum Linn (“honne”) oil, a source for biodiesel production. Res. J. Chem. Sci. 2013, 3, 24–31. [Google Scholar]
  12. Jahirul, M.I.; Brown, R.J.; Senadeera, W.; Ashwath, N.; Rasul, M.G.; Rahman, M.M.; Hossain, F.M.; Moghaddam, L.; Islam, M.A.; O’Hara, I.M. Physio-chemical assessment of beauty leaf (Calophyllum inophyllum) as second-generation biodiesel feedstock. Energy Rep. 2015, 1, 204–215. [Google Scholar] [CrossRef]
  13. Leksono, B.; Hendrati, R.L.; Windyarini, E.; Hasnah, T. Variation in biofuel potential of twelve Calophyllum inophyllum populations in Indonesia. Indones. J. For. Res. 2014, 1, 127–138. [Google Scholar]
  14. Antonovics, J. The effects of a heterogenous environment on the genetics of natural populations. Am. Sci. 1971, 59, 593–595. [Google Scholar]
  15. Nienstaedt, H. Adaptive Variation—Manifestations in Tree Species and Uses in Forest Management and Tree Improvement. In Proceedings of the 12th Lake States Forest Tree Improvement Conference, Kellogg Biological Station, MI, USA, 18–22 August 1975; pp. 11–23. [Google Scholar]
  16. Bhat, G.S.; Chauhan, P.S. Provenance variation in seed and seedling traits of Albizzia lebbek Benth. J. Tree Sci. 2002, 21, 52–57. [Google Scholar]
  17. Usman, M. Provenance Variation for Morphological Traits and Oil Content in Some Jatropha curcas L. Master’s Thesis, Ahmadu Bello University, Zaria, Nigeria, 2014. [Google Scholar]
  18. Golkar, P.; Arzani, A.; Rezaei, A.M. Genetic analysis of oil content and fatty acid composition in safflower (Carthamus tinctorius L.). J. Am. Oil Chem. Soc. 2011, 88, 975–982. [Google Scholar] [CrossRef]
  19. Yadav, S.; Suneja, P.; Hussain, Z.; Abraham, Z.; Mishra, S.K. Genetic variability and divergence studies in seed and oil parameters of mahua (Madhuca longifolia Koenig) J.F Macribide accessions. Biol. Bioenergy 2011, 35, 1773–1778. [Google Scholar] [CrossRef]
  20. Hathurusingha, S.; Ashwath, N.; Midmore, D. Provenance variations in seed-related characters and oil content of Calophyllum inophyllum L. in northern Australia and Sri Lanka. New For. 2011, 41, 89–94. [Google Scholar] [CrossRef]
  21. Saviztky, A.; Golay, M.J.E. Smoothing and differentiation of data by simplified least squares procedures. Anal. Chem. 1964, 36, 1627–1639. [Google Scholar] [CrossRef]
  22. Bureau, S.; Cozzolino, D.; Clark, C.J. Contributions of Fourier-transform mid infrared (FT-MIR) spectroscopy to the study of fruit and vegetables: A review. Post. Biol. Technol. 2019, 148, 1–14. [Google Scholar] [CrossRef]
  23. Naes, T.; Isaksson, T.; Fearn, T.; Davies, T. A User-Friendly Guide to Multivariate Calibration and Classification, 2nd ed.; NIR: Chichester, UK, 2002; Volume 6. [Google Scholar] [CrossRef]
  24. Williams, P.; Dardenne, P.; Flinn, P. Tutorial: Items to be include in a report on a near infrared spectroscopy project. J. Near Infrared Spectros. 2017, 25, 85–90. [Google Scholar] [CrossRef]
  25. Subroto, E.; Manurung, R.; Heeres, H.J.; Broekhuis, A.A. Optimization of mechanical oil extraction from Jatropha curcas L. kernel using response surface method. Ind. Crops Prod. 2015, 63, 294–302. [Google Scholar] [CrossRef]
  26. Amalia, K.I.; Cerny, M.; Vandenbossche, V.; Rigal, L.; Sablayrolles, C.; Vialle, C.; Suparno, O.; Ariono, D.; Evon, P. Direct Calophyllum oil extraction and resin separation with a binary solvent of n-hexane and methanol mixture. Fuel 2018, 221, 159–164. [Google Scholar] [CrossRef] [Green Version]
  27. Palinikumaran, B.; Parthiban, K.; Sekar, I.; Umarani, R.; Amirtham, D. Variability studies for seed and seedling traits in Undi (Calophyllum inophyllum L.) from different zones of South India. J. Plant Sci. Res. 2015, 2, 124. [Google Scholar]
  28. Sreekumar, R. Provenance Variation for Seed Traits, Germination, Seedling Vigour and Oil Content in Calophyllum inophyllum Linn. Master’s Thesis, Navsari Agricultural University, Navsari, India, 2016. [Google Scholar]
  29. Shamala, K.V.; Ramana, P. Provenance variation in seed oil yield from Calophyllum inophyllum grown in coastal Uttara Kannada and physico chemical characterization of oil. Int. J. Agric. Sci. Res. 2017, 7, 43–48. [Google Scholar]
  30. Shinde, P.P.; Rane, A.; Bhave, S.; Gunaga, R.; Narkhede, S. Variability and genotype selection in Calophyllum inophyllum for quality fruit yield in the central west coast of India. J. Tree Sci. 2012, 31, 8–14. [Google Scholar]
  31. Yuniarti, N.; Nurhasybi, N. Viability and Biochemical Content Changes in Seed Storage of Jabon Putih (Anthocephalus cadamba (Roxb) Miq.). J. Trop. For. Manag. 2015, 21, 92–98. [Google Scholar] [CrossRef] [Green Version]
  32. Bernal-Lugo, I.; Leopold, A.C. Changes in Soluble Carbohydrates during Seed Storage. Plant Physiol. 1992, 98, 1207–1210. [Google Scholar] [CrossRef] [PubMed] [Green Version]
  33. Šimić, B.; Popović, R.; Sudarić, A.; Rozman, V.; Kalinovic, I.; Cosic, J. Influence of Storage Condition on Seed Oil Content of Maize, Soybean and Sunflower. Agric. Conspec. Sci. (ACS) 2007, 72, 211–213. [Google Scholar]
  34. Wu, J.; Gao, S.; Tang, L.; Hou, P.; Gao, J.-H.; Chen, F. The traits, oil content and correlation studies of seed and kernel in Jatropha curcas L. Afr. J. Agric. Res. 2012, 7, 1487–1491. [Google Scholar]
  35. Reinert, S.; Tassel, D.L.V.; Schlautman, B.; Kane, N.C.; Hulke, B.S. Assessment of the biogeographical variation of seed size and seed oil traits in wild Silphium integrifolium Michx. Genotypes. Plant Genet. Resour. Charact. Util. 2019, 17, 427–436. [Google Scholar] [CrossRef]
  36. Workman, J.; Weyer, L. Practical Guide to Interpretive Near-Infrared Spectroscopy; CRC Press/Taylor and Francis Group: Boca Raton, FL, USA, 2008. [Google Scholar]
  37. Sandak, A.; Sandak, J.; Negri, M. Relationship between near-infrared (NIR) spectra and the geographical provenance of timber. Wood Sci. Technol. 2011, 45, 35–48. [Google Scholar] [CrossRef]
  38. Farhadi, M.; Tigabu, M.; Pietrzykowski, M.; Danusevičius, D.; Odén, P.C. Application of near infrared spectroscopy for authentication of Picea abies seed provenance. New For. 2017, 48, 629–642. [Google Scholar] [CrossRef]
Figure 1. Map depicting the geographical distribution of the nineteen provenances of C. inophyllum used in the study.
Sustainability 15 05529 g001
Figure 2. Variation in the kernel oil percentage (dry wt basis) amongst 50 accessions of C. inophyllum. (B—Bowen, BB—Bingil Bay, BRL—Before Rex Lookout, C—Cairns, CB—Cooya Beach, Cdl—Cardwell, CT—Cook Town, D—Darwin, I—Innisfail, M—Mackay, MP—Midge Point, N—Newell, PC—Palm Cove, PD—Port Douglas, RB—Rosslyn Bay, SMB—South Mission Beach, T—Townsville, TB—Trinity Beach, WB—Wonga Beach).
Sustainability 15 05529 g002
Figure 3. Variation in resin percentage (on kernel weight basis) among 50 accessions of C. inophyllum. Please see Figure 2 for x-axis-label description.
Sustainability 15 05529 g003
Figure 4. Variation in cake percentage on kernel weight basis among 50 accessions of C. inophyllum. Please see Figure 2 for x-axis-label description.
Sustainability 15 05529 g004
Figure 5. Variation in total oil content (oil% + resin%) based on kernel weight and fruit weight among 50 accessions of C. inophyllum. (O + R% denotes Oil% + Resin% i.e., total oil content; please see Figure 2 for x-axis-label description).
Sustainability 15 05529 g005
Figure 6. Variation in the proportion of kernel to shell and kernel to fruit amongst the 50 accessions of C. inophyllum. Please see Figure 2 for x-axis-label description.
Sustainability 15 05529 g006
Figure 7. Pearson’s correlation coefficients between kernel oil yield and its associated traits. The high and low intensity of colour (red for positive and blue for negative) represent strong and weak relationships, respectively, between a pair of traits. Values closer to one indicate a strong correlation, and a value closer to zero indicates a weaker correlation between the two traits. An asterisk denotes a significant correlation between the pair of traits. ***: p < 0.001, **: p < 0.01 and *: p < 0.05.
Sustainability 15 05529 g007
Figure 8. Near-infrared raw spectra of 50 kernel samples of C. inophyllum.
Sustainability 15 05529 g008
Figure 9. Score plots derived from the principal component analysis of C. inophyllum, analysed using near-infrared reflectance spectroscopy.
Sustainability 15 05529 g009
Figure 10. Predicted versus reference data of the kernel samples analysed using near-infrared reflectance spectroscopy.
Sustainability 15 05529 g010
Figure 11. Loadings derived from the principal component analysis of the kernel samples, analysed using near-infrared reflectance spectroscopy.
Sustainability 15 05529 g011
Disclaimer/Publisher’s Note: The statements, opinions and data contained in all publications are solely those of the individual author(s) and contributor(s) and not of MDPI and/or the editor(s). MDPI and/or the editor(s) disclaim responsibility for any injury to people or property resulting from any ideas, methods, instructions or products referred to in the content.

