Article

Pollution Reduction, Informatization and Sustainable Urban Development—Evidence from the Smart City Projects in China

1
Institute of Food and Strategic Reserves, Nanjing University of Finance and Economics, Nanjing 210023, China
2
School of Public Administration, Guangzhou University, Guangzhou 510006, China
3
Overseas Study Service Centre, Central China Normal University, Wuhan 430079, China
4
School of Information Technology, Deakin University, Geelong, VIC 3216, Australia
*
Author to whom correspondence should be addressed.
Sustainability 2023, 15(13), 10030; https://doi.org/10.3390/su151310030
Submission received: 1 May 2023 / Revised: 13 June 2023 / Accepted: 14 June 2023 / Published: 25 June 2023
(This article belongs to the Special Issue Green Economy, Resource Efficiency and Sustainable Development)

Abstract

:
China’s modernization endeavors to advance both material and spiritual civilization concomitantly; nevertheless, the nation presently faces a pressing issue of urban pollution. This research examines how the introduction of information technology has affected environmental pollution in Chinese cities. By utilizing a panel dataset consisting of 214 prefecture-level cities in China spanning from 2005 to 2017, we employed a time-varying DID model with smart city pilot projects serving as a quasi-natural experiment to assess the impact of informatization on environmental pollution. The establishment of smart cities has remarkably elevated the information quotient of urban areas. Additionally, the results indicate a significant reduction in pollution levels in urban areas as a result of informatization, which remained robust even after conducting a series of rigorous tests to ensure the reliability of the findings. Mechanism analysis shows that informatization of smart cities affects the environmental governance behavior of enterprises and governments. Consequently, the implementation of informatization in smart cities can effectively alleviate environmental pollution by means of both the technique effect and structure effect. This finding calls for the Chinese government to improve informatization by promoting smart city pilot projects to build sustainable cities.

1. Introduction

Large-scale, rapid urbanization has made great contributions to China’s economic growth, industrial upgrading, technological progress, social welfare and so on since the reform and opening up. However, it cannot be denied that environmental problems such as air and water pollution have continued to worsen and pose a growing threat to our ecosystem, restricting sustainable urban development in China with the surge of population density, great social and economic changes such as industrialization and resource utilization [1,2,3]. At present, China has prioritized energy restructuring as a crucial component of its environmental management strategy. Refs. [4,5] propose that developing nations should enhance the proportion of renewable energy sources and diminish their carbon dioxide emissions. How to look for a better model of urban development, which can enhance urban governance and address environmental pollution (EP), is necessary for sustainable development [6,7].
Urbanization is the spatial agglomeration of various resource elements in cities and is mainly manifested in the agglomeration of specific factors such as labor, capital and public resources. The deepening progress of modern information technologies (IT), including the Internet, big data and artificial intelligence, has brought about a paradigm shift towards knowledge-based and IT-driven economies, which have now taken center stage. IT has exhibited a profound influence on all fields of human economic and social life [8,9]. Simultaneously, production factors such as information, knowledge and technology, which require low resource input and generate minimal pollution output, are gaining an increasingly significant role in the urbanization process. Through its transformative influence on human social patterns and lifestyles, informatization has not only directly led to the reform of urban planning, construction and management but has also altered the social, economic and spatial structures of cities, thereby influencing their form and function.
Against this backdrop, it is following the wave of the IT revolution, making informatization and urbanization deeply integrated and exploring new urban development modes that are a good medicine to solve the above problems and enhance economic transformation and upgrading. Smart cities (SC) with information technology and informatization as the core carriers arise at historic moments, and benefit from the dramatic development of IT, the government’s policy support and the growing demand of cities [10]. Through further analysis, it was found that smart cities may optimize urban management mod and resource allocation and improve energy efficiency. It is also possible to optimize environmental monitoring and governance through big data technology, ultimately improving the environment.
Based on this, we cannot help thinking whether modern urbanization, along with informatization, is different from traditional urbanization with negative environmental effects caused by urban expansion and population agglomeration. Can informatization solve this dilemma of urbanization–environment pollution? If this is the case, what is the mechanism of that? Thoroughly addressing these questions will not only make a great contribution to a greater insight into the theoretical relationship between the urban development model based on informatization and environmental protection but also provide experience support for environmental governance under the in-depth development of urbanization at the practical level, which is of great significance to reform urban governance and achieve sustainable development.
The first piece of literature related to this paper concerns the process of urbanization and its impact on environmental pollution. Researchers have discussed the environmental implications of urban development in terms of urban-scale expansion [11], population agglomeration [12], human capital accumulation [13], citizen environmental awareness, cleaner production [14], local governance [15], spatial agglomeration [16] and so on. In general, the specific ideas can be roughly divided into two categories. The first idea is that there is a linear relationship between urbanization and environmental pollution. Some scholars have found that urbanization aggravates environmental pollution. Conversely, urbanization can exert a notable mitigating influence on environmental pollution [17]. Some studies aim to verify whether the classical EKC curve exists. Consequently, many scholars take different countries and regions as examples to empirically analyze this problem, such as [17,18]. In particular, Martinez and Maruotti demonstrated the existence of an inverted U-shaped link between urbanization and CO2 emissions in developing countries. The other scholars, however, believe that the sum of all nonlinear relations between urbanization and ecological environment elements should be considered, which is usually reflected by calculating various composite indexes [19,20].
Notwithstanding the theoretical advancements made by prior research, as presented above, there is an obvious loophole among those. Most of them are based on the traditional urban development pattern and confine the characteristics of urbanization to such dimensions as population agglomeration, industrialization and improvement of residents’ living standards, while ignoring the important feature of modern urbanization, urban informatization.
Reassuringly, this gap provides a breakthrough for this article exactly. Smart cities, as a typical example of urban informatization construction, use advanced ICTs, particularly environmental monitoring technology, to reform the planning, operation and management of cities. Accordingly, smart cities will improve the efficiency of urban resource allocation, enhance urban capability for sustainable development and provide material and technical support for environmental governance. Consequently, they conform to the call of modern times by discussing how modern urbanization affects the environment from the perspective of informatization.
Our paper also builds on another type of literature that explores how informatization impacts the ecological environment. Many works of literature have confirmed the importance of informatization in environmental governance [13]. The empirical results, however, are mixed. Some findings prove that it improves environmental quality, while other scholars argue that information technology has worsened the environment. More specifically, the former perspective posits that the advancement of information technology can incentivize enterprises to adopt production technologies that are more environmentally sustainable and promote the digital transformation of enterprises to reduce energy consumption. Lim and Lee demonstrate that information technology reduces pollution by making environmental regulation more efficient and restraining polluters. Using a sample of 44 African countries, [19] found that information technology has led to a reduction in CO2 emissions through both the substitution effect and the dematerialization effect. According to [11], the implementation of machine learning can exert a substantial influence on business efficiency, thereby elevating the technological capabilities of the enterprise while concurrently mitigating its environmental footprint. Similar studies have been conducted by [21,22].
Unlike the above, some researchers insist that IT increases the demand for products; many of these products are manufactured using energy-intensive methods and are consumed at a rapid pace. Of course, emissions have increased as a result. As an illustration, Sudworth reports that information technology usage is responsible for 2% of global CO2 emissions. Additionally, Xue and Liu also found that the compensation effect and rebound effect are two ways in which information technology can exacerbate environmental degradation. It is evident that there is no consensus among scholars regarding the environmental impact of informatization. These arguments provide great ideas and theoretical support for us. Significantly, they mostly use simple analysis methods such as OLS and lack an analytical framework with policy experiments. As a result, the reliability of its findings is questionable, as they are susceptible to endogenous issues such as bidirectional causality and selective bias. To some extent, this may be a possible reason for the debate as well. Solving this problem is also one of the main tasks of this paper.
With the practice upsurge of smart city pilot (SCP) projects in various countries, smart cities, as a new model of urban development and social governance in the information age, have become the research hotspot of scholars. Some of them analyzed the connotation, characteristics, development status, risks and challenges of smart cities from the qualitative perspective [12,15,22], and others have evaluated the social and economic performance of smart cities empirically, such as green economy, urban innovation and so on. However, there are few studies on the impact of smart cities on environmental pollution. Ref. [22] studied smart cities in the US. Their study shows that there is no strong evidence that SCP projects promote the sustainable development of cities in the US. Nevertheless, Ref. [20] found that applying IT to electric bikes reduced carbon emissions in Portugal. So, what about China? That is the question this paper tries to answer.
Against the backdrop of China’s pursuit of high-quality economic growth, particularly under the constraint of the “double carbon” targets, the establishment of resource-efficient and eco-friendly smart cities has gained widespread recognition [23]. Enabled by digitalization and intelligence, such cities offer a viable means to affect a green and low-carbon transformation and reshape urban society. By mitigating urban environmental pollution, smart cities have the potential to create mutually beneficial economic outcomes. Briefly, based on the achievements and shortcomings of previous studies, we employed a timing-varying DID model to assess the environmental impact of informatization by treating SCP projects in China as a quasi-natural experiment for modern urbanization. Our panel data analysis of 214 prefecture-level cities revealed that SCP projects were effective in significantly reducing urban SO2 emissions. That is to say, informatization has significantly reduced EP. In addition, we also found that informatization affects the macro-economy and adjusts the behavior of enterprises and governments, thus improving the environment through the technique effect and the structure effect.
This paper’s marginal contributions can be summarized in the following three aspects: (1) We start with informatization, a feature that cannot be neglected with urbanization and break through the mind-frame of the traditional urban development mode. Unlike previous studies, the paper keeps pace with the times with the deep integration of informatization and urbanization. (2) In contrast to the literature that primarily focuses on the adverse impact of urbanization on environmental quality, this paper takes a novel approach by exploring the positive effects of urbanization through the lens of informatization. (3) There are few studies that specifically analyze the impact of informatization on environmental performance. This paper takes a creative approach by constructing and verifying the mechanism through which informatization influences environmental performance.

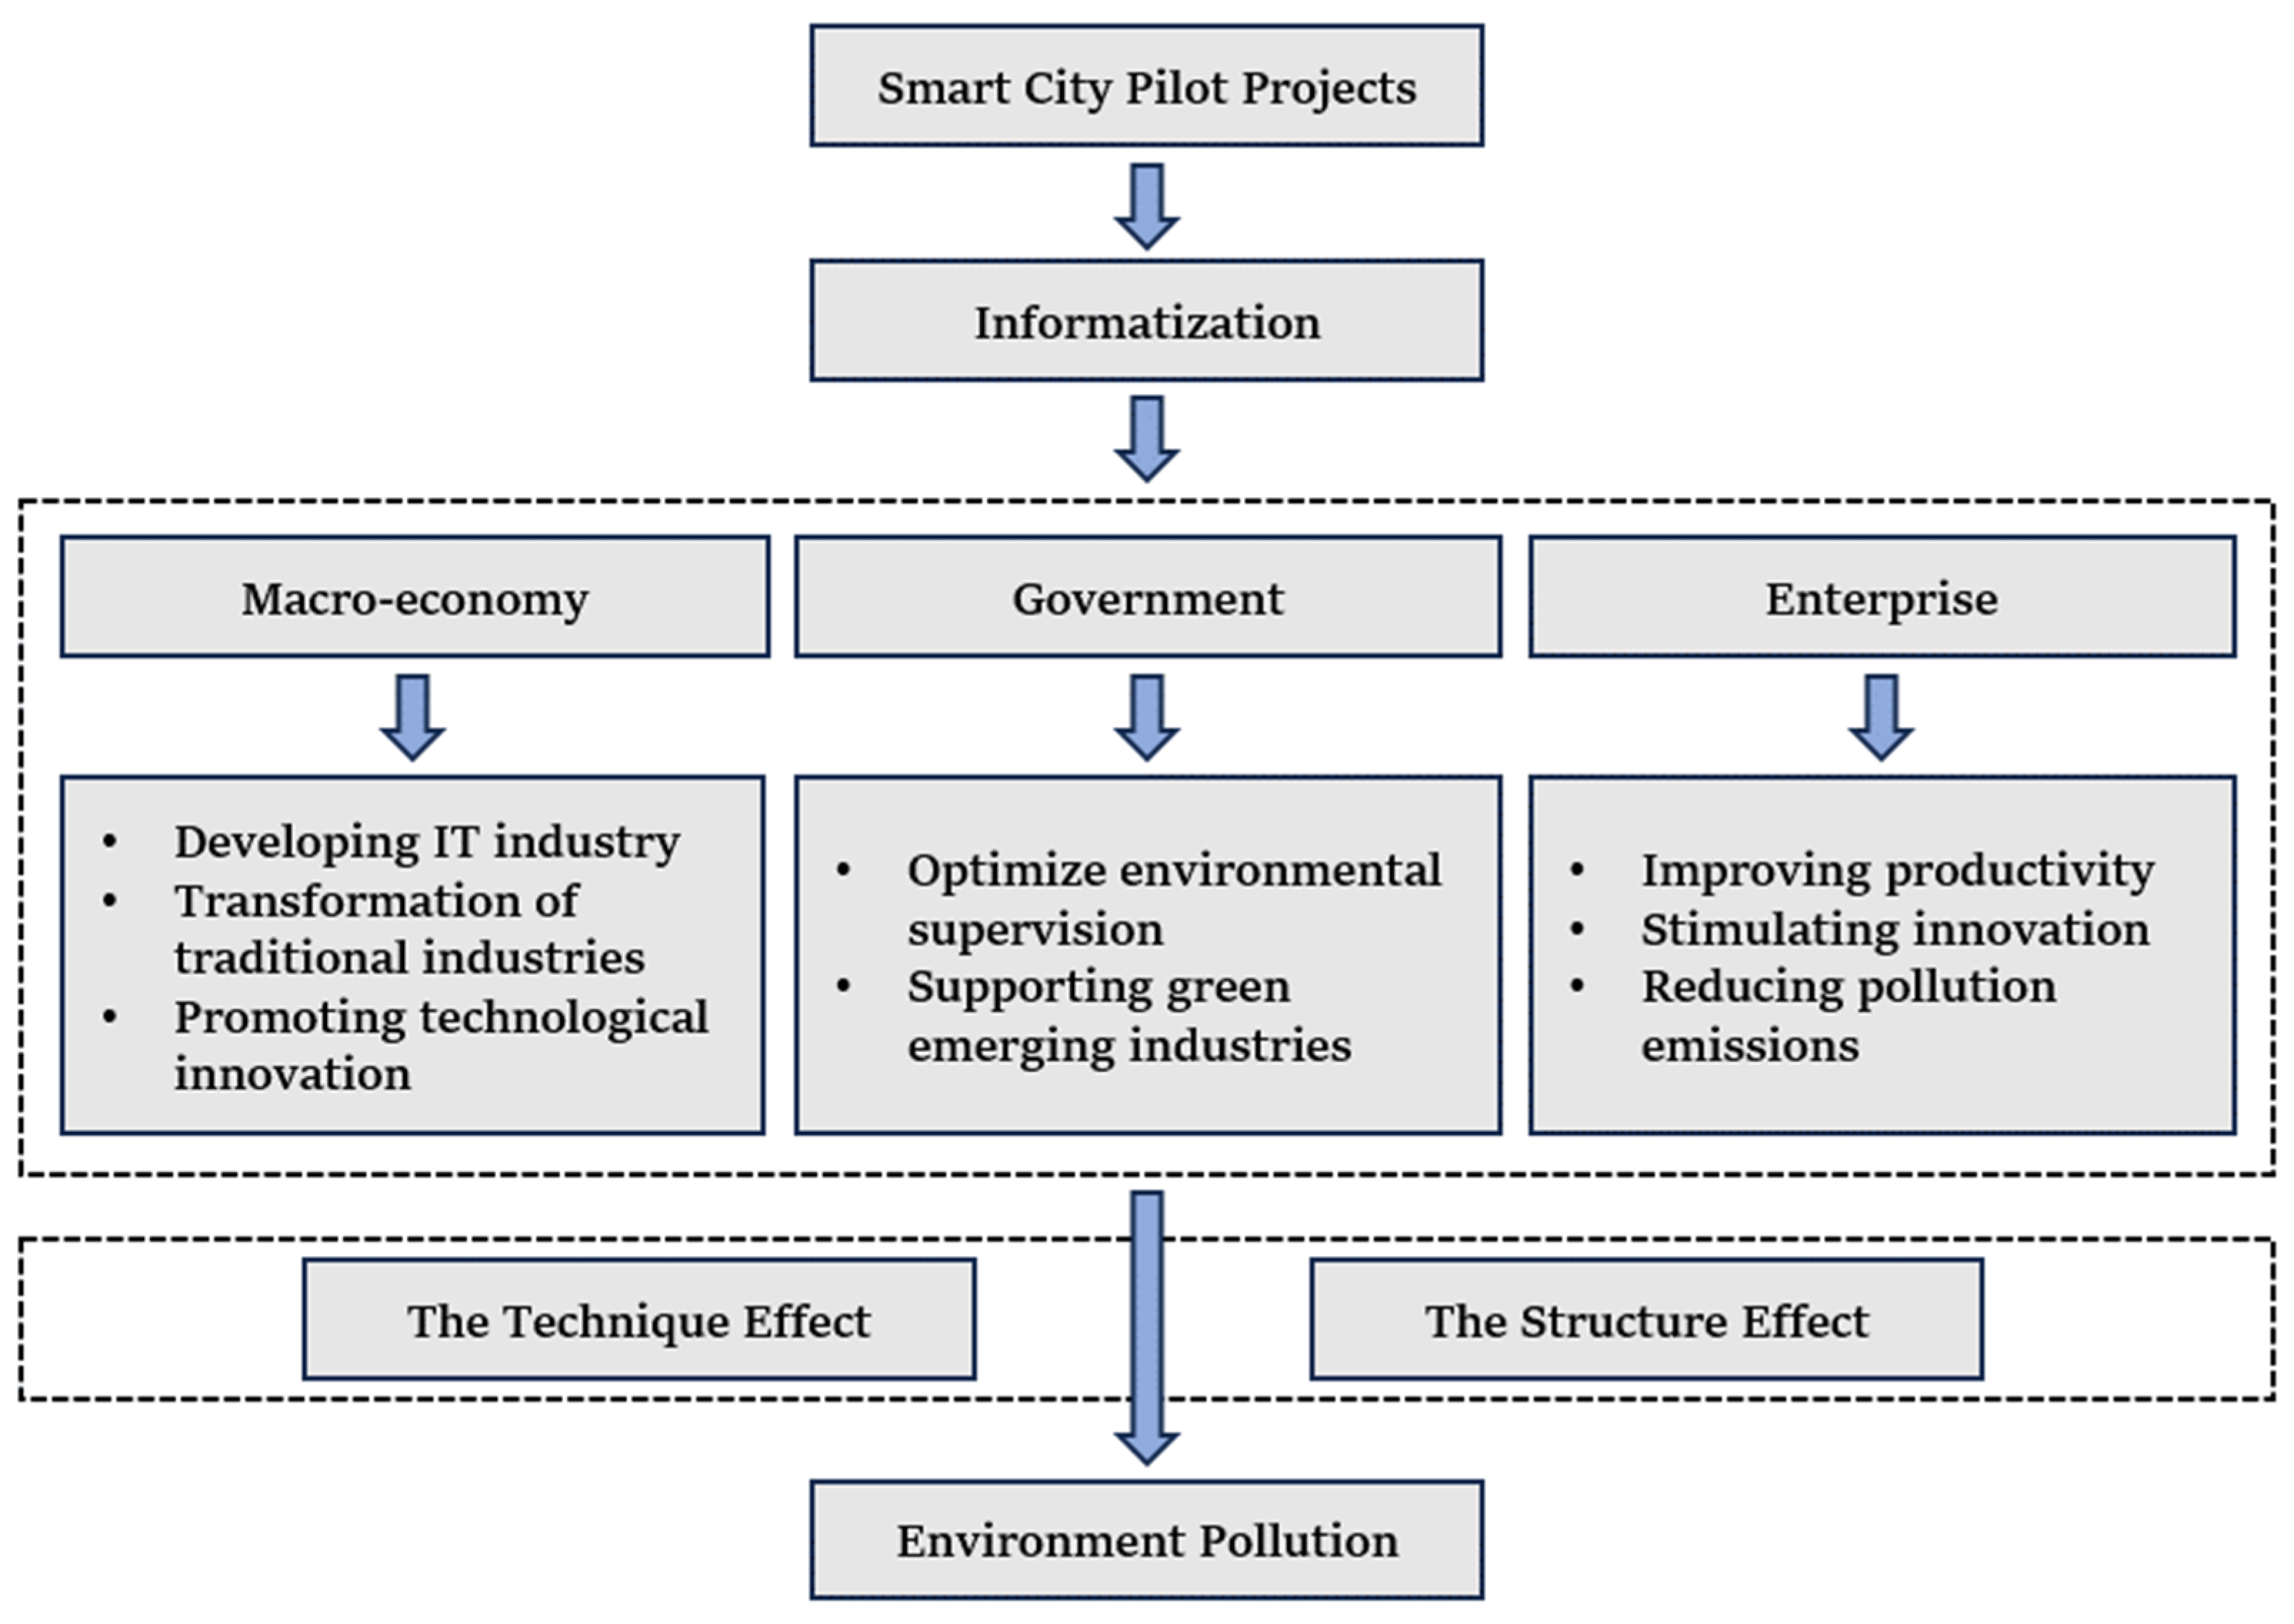
2. Theoretical Concept

2.1. Background of Smart City

Driven by the rapid development of information technology and increasingly serious urban diseases, China has issued numerous policy documents aimed at advancing the development of smart cities. In December 2012, MOHURD released an official document setting up the first batch of 90 pilot smart cities. Subsequently, the second batch (103) and the third batch (97) of smart city trials were set up in 2013 and 2015, involving a total of 290 counties and cities. Consequently, SCP projects are a national strategic decision depending on the central government, and a city cannot predict whether it will be listed as the pilot of a smart city, nor can it intervene in the government’s decision. Inspiringly, this presents a unique opportunity for this paper to treat the SCP projects as a quasi-natural experiment and utilize time-varying DID methodology to assess the environmental performance of smart cities.
Obviously, it is prudent and reliable to regard the construction of a smart city, an in-depth extension and integrated application of IT, as the impact of informatization in the process of urbanization. In 2014, the National New Urbanization Plan (2014–2020) outlined six key areas for building smart cities: the establishment of a broadband information network, the incorporation of informatization into planning and management, the development of intelligent infrastructure, the enhancement of public service convenience, the modernization of industrial development and the refinement of social governance. The first three of them are closely related to informatization, which provides compelling evidence and endorsement for this paper’s characterization of smart cities as a product of the impact of informatization. Further proof is that, according to research issued by the Forward-looking Industry Research Institute, the size of China’s smart city market is approximately CNY 4 trillion, among which IT investment takes up a large proportion. In 2016, IT investment in China’s smart cities reached CNY 302.5 billion. Additionally, the investment scale is expected to reach CNY 1234.1 billion in 2021. The data presented above demonstrate that the progress of smart cities can substantially enhance the level of urban informatization through significant investments in informatization construction. In order to be rigorous, empirical tests will be carried out later to further prove this point.

2.2. Research Hypothesis

This paper adopts Grossman and Krueger’s research achievement on the environmental performance of economic growth. As stated by Grossman and Krueger, the scale effect refers to the deterioration of environmental quality caused by the expansion of the economy when the economic structure and technical level are certain, and there are no environmental regulations. The structural effect means that economic development brings about changes in industrial structure by promoting the specialization of labor. Specifically, the curtailment of energy-intensive and pollution-heavy industries will result in a reduction in environmental pollution (EP). The technique effect refers to the fact that economic growth will have two impacts on the environment by promoting technological advances.

2.2.1. The Technique Effect

The technique effect with SCP projects is manifested primarily in the direct drive of city innovation ability. First, SCP projects are undoubtedly the deep expansion and integrated application of information technology. Particularly, IT, represented by the Internet and big data technology, is developing vigorously in smart cities. This optimizes the allocation of urban innovation resources and expands the scope and depth of advanced technology and knowledge dissemination [24]. Thus, it reduces the transaction costs, agency costs and cognitive differences of innovation. As underlined, the impact of informatization is reflected in the establishment of a highly efficient and unlimited open innovation network. Therefore, actors of innovation can easily learn knowledge and acquire ideas to enhance the innovation ability [9]. Moreover, the extensive application of IT in various fields has produced remarkable results in gathering high-end talents, high-tech enterprises, R&D and other elements of innovation. Thus, innovation cooperation is on the rise among universities, enterprises and research institutions, with the open sharing of scientific and technological resources and the convenient supply of innovation services.
Through the advancement and application of clean production technology, as well as the implementation of energy conservation and emissions reduction measures, technological innovation improves the efficiency of work and eventually reduces EP [25].
Secondly, informatization can also make everything smarter and more efficient through the new digital urban management model. This is to say, SC makes it possible to precisely acquire the dynamics of city operations in all directions and in real-time to build an “urban brain” with massive urban operation data for analysis and processing. The upgrade of polluters’ sewerage systems benefits from the rapid development and application of big data so that polluters can collect all kinds of resource information, such as air, water and energy. This enables the polluter to control the energy consumption in production intelligently and automatically, thus reducing possible ecological damage. Briefly, by optimizing the production and management mode of enterprises, IT can improve their resource utilization efficiency and reduce the emission of pollutants.
As one of the key points of SC, the construction of a smart government greatly improves the government’s monitoring and governance and management level through efficient service, real-time data and timely response. On the one hand, the government is a defender of public environmental rights, and SC has effectively improved its environmental supervision and efficiency of environmental governance. In particular, as the owner of the largest data resource, the government can directly access the continuous real-time dynamic environmental data of cities. Based on the massive environmental data and intelligent analysis technology, this approach enables effective management of urban environmental quality, real-time monitoring of significant pollution sources, environmental impact assessments and early detection of environmental issues, resulting in significant improvements in the efficiency and accuracy of environmental governance. Therefore, the government can formulate evidential and scientific environmental regulations and carry out efficient emergency treatment of pollution accidents, etc., so as to prevent urban EP in advance and effectively control it, which brings positive effects to the urban environment. However, under the traditional management mode, governments struggle to regulate polluters’ illegal emissions and energy consumption due to backward technology. On the other hand, informatization can realize efficient government service, timely response and scientific decision-making, improving the governance ability greatly. The informatization of smart cities has facilitated the creation of a favorable institutional environment for urban innovation by the government while also enhancing the technical capabilities of micro-level entities, such as enterprises, through improved access to information and resources.
This study puts forward a hypothesis, namely Hypothesis H1, which posits that informatization, as exemplified by the SCP project, will lead to a decrease in pollutant emissions and mitigate urban environmental pollution (EP) through the influence of technological advancements.

2.2.2. The Structure Effect

From a macroeconomic perspective, the role of smart cities in upgrading the industrial structure can be interpreted from two levels: the rapid growth of the information industry and its integration with traditional industries. Under the traditional urban development mode, the physical factors of production, such as land, labor and capital, are the main motivation for urban development. However, in the information age, SCs rely on emerging elements such as knowledge, information and technology to realize urbanization and greatly drive the flourishing of emerging industries, including IOT, cloud computing, AI, the next generation of Internet and the new information technology. The information technology sector exhibits numerous favorable attributes, including cost-effective transmission, high incremental income and economies of scale, as well as a high value-add of products, low energy consumption and emissions, advanced technological features, significant input–output benefits and streamlined resource allocation efficiency, effectively aligning with the goals of environmentally sustainable and resource-conserving progress.
The rapid growth of the information industry has promoted the development of producer services such as information services, technology, software and business services. An industrial chain of IT has been formed with the development of SC, making the industrial structure more service oriented. Additionally, the popularization of SC boosts the integrated development of information technology and traditional industries such as transportation, communication, energy, environmental protection, medical treatment and logistics, improves the operating efficiency of traditional industries and drives its upgrading partly [26]. In brief, through the two approaches above, informatization will guide the transformation and upgrading of urban industrial structure from resource and labor-intensive industries to technology-intensive and capital-intensive industries with high energy utilization rates and low pollution. Accordingly, this relatively reduces the rate of energy consumption and pollution emissions to improve the environment.
SC also upgrade the industrial structure and alleviate EP by influencing micro subjects. SC emphasize information, technology and innovation. For enterprises, this will greatly squeeze out the living space of enterprises with high energy consumption, low-tech and low-threshold, and even eliminate inefficient, polluting industries and outdated capacity of enterprises, while it brings opportunities for the technology-based ones. Based on the “demonstration effect” and “Anti-driving Mechanism”, companies in traditional industries will abandon outdated production models and product structures and replace them with more efficient and greener ones. This is to say, for enterprises, SC has realized the transformation of traditional production mode. More importantly, IT has penetrated into the production, sales and service aspects of enterprises, which has promoted more enterprises to turn service-oriented, as evidenced by the rise of the e-commerce industry. Such a shift in enterprises means less energy consumption and pollutant emission.
As a top designer, as well as the main executor and manager of smart city construction, the government also plays a decisive role in this process. To be specific, by giving strong support to emerging industries such as IOT and ITS and the clean-technology industry with low pollution and low emission, the government promotes the upgrading of product technology and industrial structure optimization, eventually improving the urban environment.
As a result, we propose Hypothesis 2, which asserts that smart city (SC) initiatives can foster the transformation and upgrading of conventional industries, enhance the proportion of environmentally friendly emerging industries and thereby mitigate pollutant emissions by means of structural optimization (Figure 1).

3. Methodology and Data

3.1. Econometric Model and Variables

The OLS method was used in previous studies to compare the differences of EP in different regions before and after the pilot to evaluate the environmental performance of SCP projects. However, besides smart city pilot policies, economic growth, industrial structure and other factors will change the urban environment during this period. In addition, other environmental regulations implemented in the same period may also affect the environment, which will interfere with the evaluation results of smart city pilot policies.
To avoid the endogeneity above, with regarding SCP projects as a quasi-natural experiment, the paper uses the time-varying DID to take three successive batches of smart city pilot cities as research samples. We establish a baseline time-varying DID model as follows to investigate the impact of the SCP projects on EP in China:
P o l l u t i o n i t = α 0 + α 1 S C P i t + j = 1 N b j X i t + C i t y i + Y e a r t + ε i t ,
where i represents the city, t represents the year, P o l l u t i o n i t denotes environmental pollution condition of city i in year t a n d   S C P i t represents the policy dummy variable to stand for informatization as one if SCP projects have been established by time t in city i and zero otherwise. Variable Xit is a set of variables that may affect the environment on environmental pollution. Variables C i t y i and Y e a r t denote city and year fixed effects, respectively; ε i t represents random disturbances; α 1 is the focus of this paper. The core estimated coefficient of interest is that, for S C P i t , the policy dummy variable is incorporated into the model. We use the annual SO2 emissions of prefecture-level cities to reflect EP. We also calculate SO2 emissions per capita as a supplement to ensure that the results are credible.
By drawing upon relevant literature, this study adopts a rigorous methodology to effectively control for the impact of diverse variables that influence the environmental conditions of prefecture-level cities, thereby ensuring that our findings are not confounded by the inherent heterogeneity of these urban areas, including economic performance ( G D P i t ), Fiscal spending ( F S i t ), level of urbanization ( U r i t ), industrial structure ( I n d u s i t ) and opening degree ( O p e n i t ). More specifically, G D P i t is defined as per capita GDP; F S i t is defined as the proportion of local government fiscal spending to GDP; U r i t , the methodology for measuring this variable, involves computing the ratio of individuals employed in non-agricultural sectors to the total population. I n d u s i t is defined as the ratio of the contribution of the tertiary industry to the overall value added by the secondary industry; O p e n i t is defined as the proportion of the combined value of exports and imports to the gross domestic product (GDP) of a given region or country.

3.2. Data and Sample Selection

In order to examine the correlation between informatization and environmental pollution in the context of urbanization, we establish our study sample by focusing on Chinese cities at the prefecture level, spanning the time period from 2006 to 2017. In our study, we designate the pilot cities as the experimental group, while the non-pilot cities are regarded as the control group. We find that some smart cities are counties or part of a prefecture-level city, and if they are defined as one of the treatment groups, the estimates will be overestimated as we construct our sample based on prefecture-level cities. Thus, those special pilot cities are removed considering this unequal administrative hierarchy.
The dataset utilized is from the China City Statistical Yearbook. In instances where data were missing for certain prefecture-level cities in specific years, we employed an interpolation methodology to supplement the data. To mitigate the potential impact of outliers, primary continuous variables were winsorized at the 1% threshold. Our final analysis was based on a sample comprising 3210 observations collected from 214 prefecture-level cities throughout China, spanning from 2006 to 2017. A comprehensive overview of the descriptive statistics pertaining to this dataset can be referenced in Table 1.

4. Empirical Results and Discussion

4.1. Results from Time-Varying DID Regression

The estimated parameters of Equation (1) using a two-way fixed effect model are shown in Table 2. There is no control variable added with columns 1 and 2, and columns 3 and 4 are added for comparison. Table 2 shows that building smart cities significantly exerts a negative impact on SO2, both total and per capita, regardless of whether control variables are added. On average, the SCP projects lead to declines in SO2 total emission and per capita by approximately 20.7% and 21.1%, respectively. Hence, informatization significantly reduces the EP of cities. This result is very different from the conclusions of [22].

4.2. Robustness Test

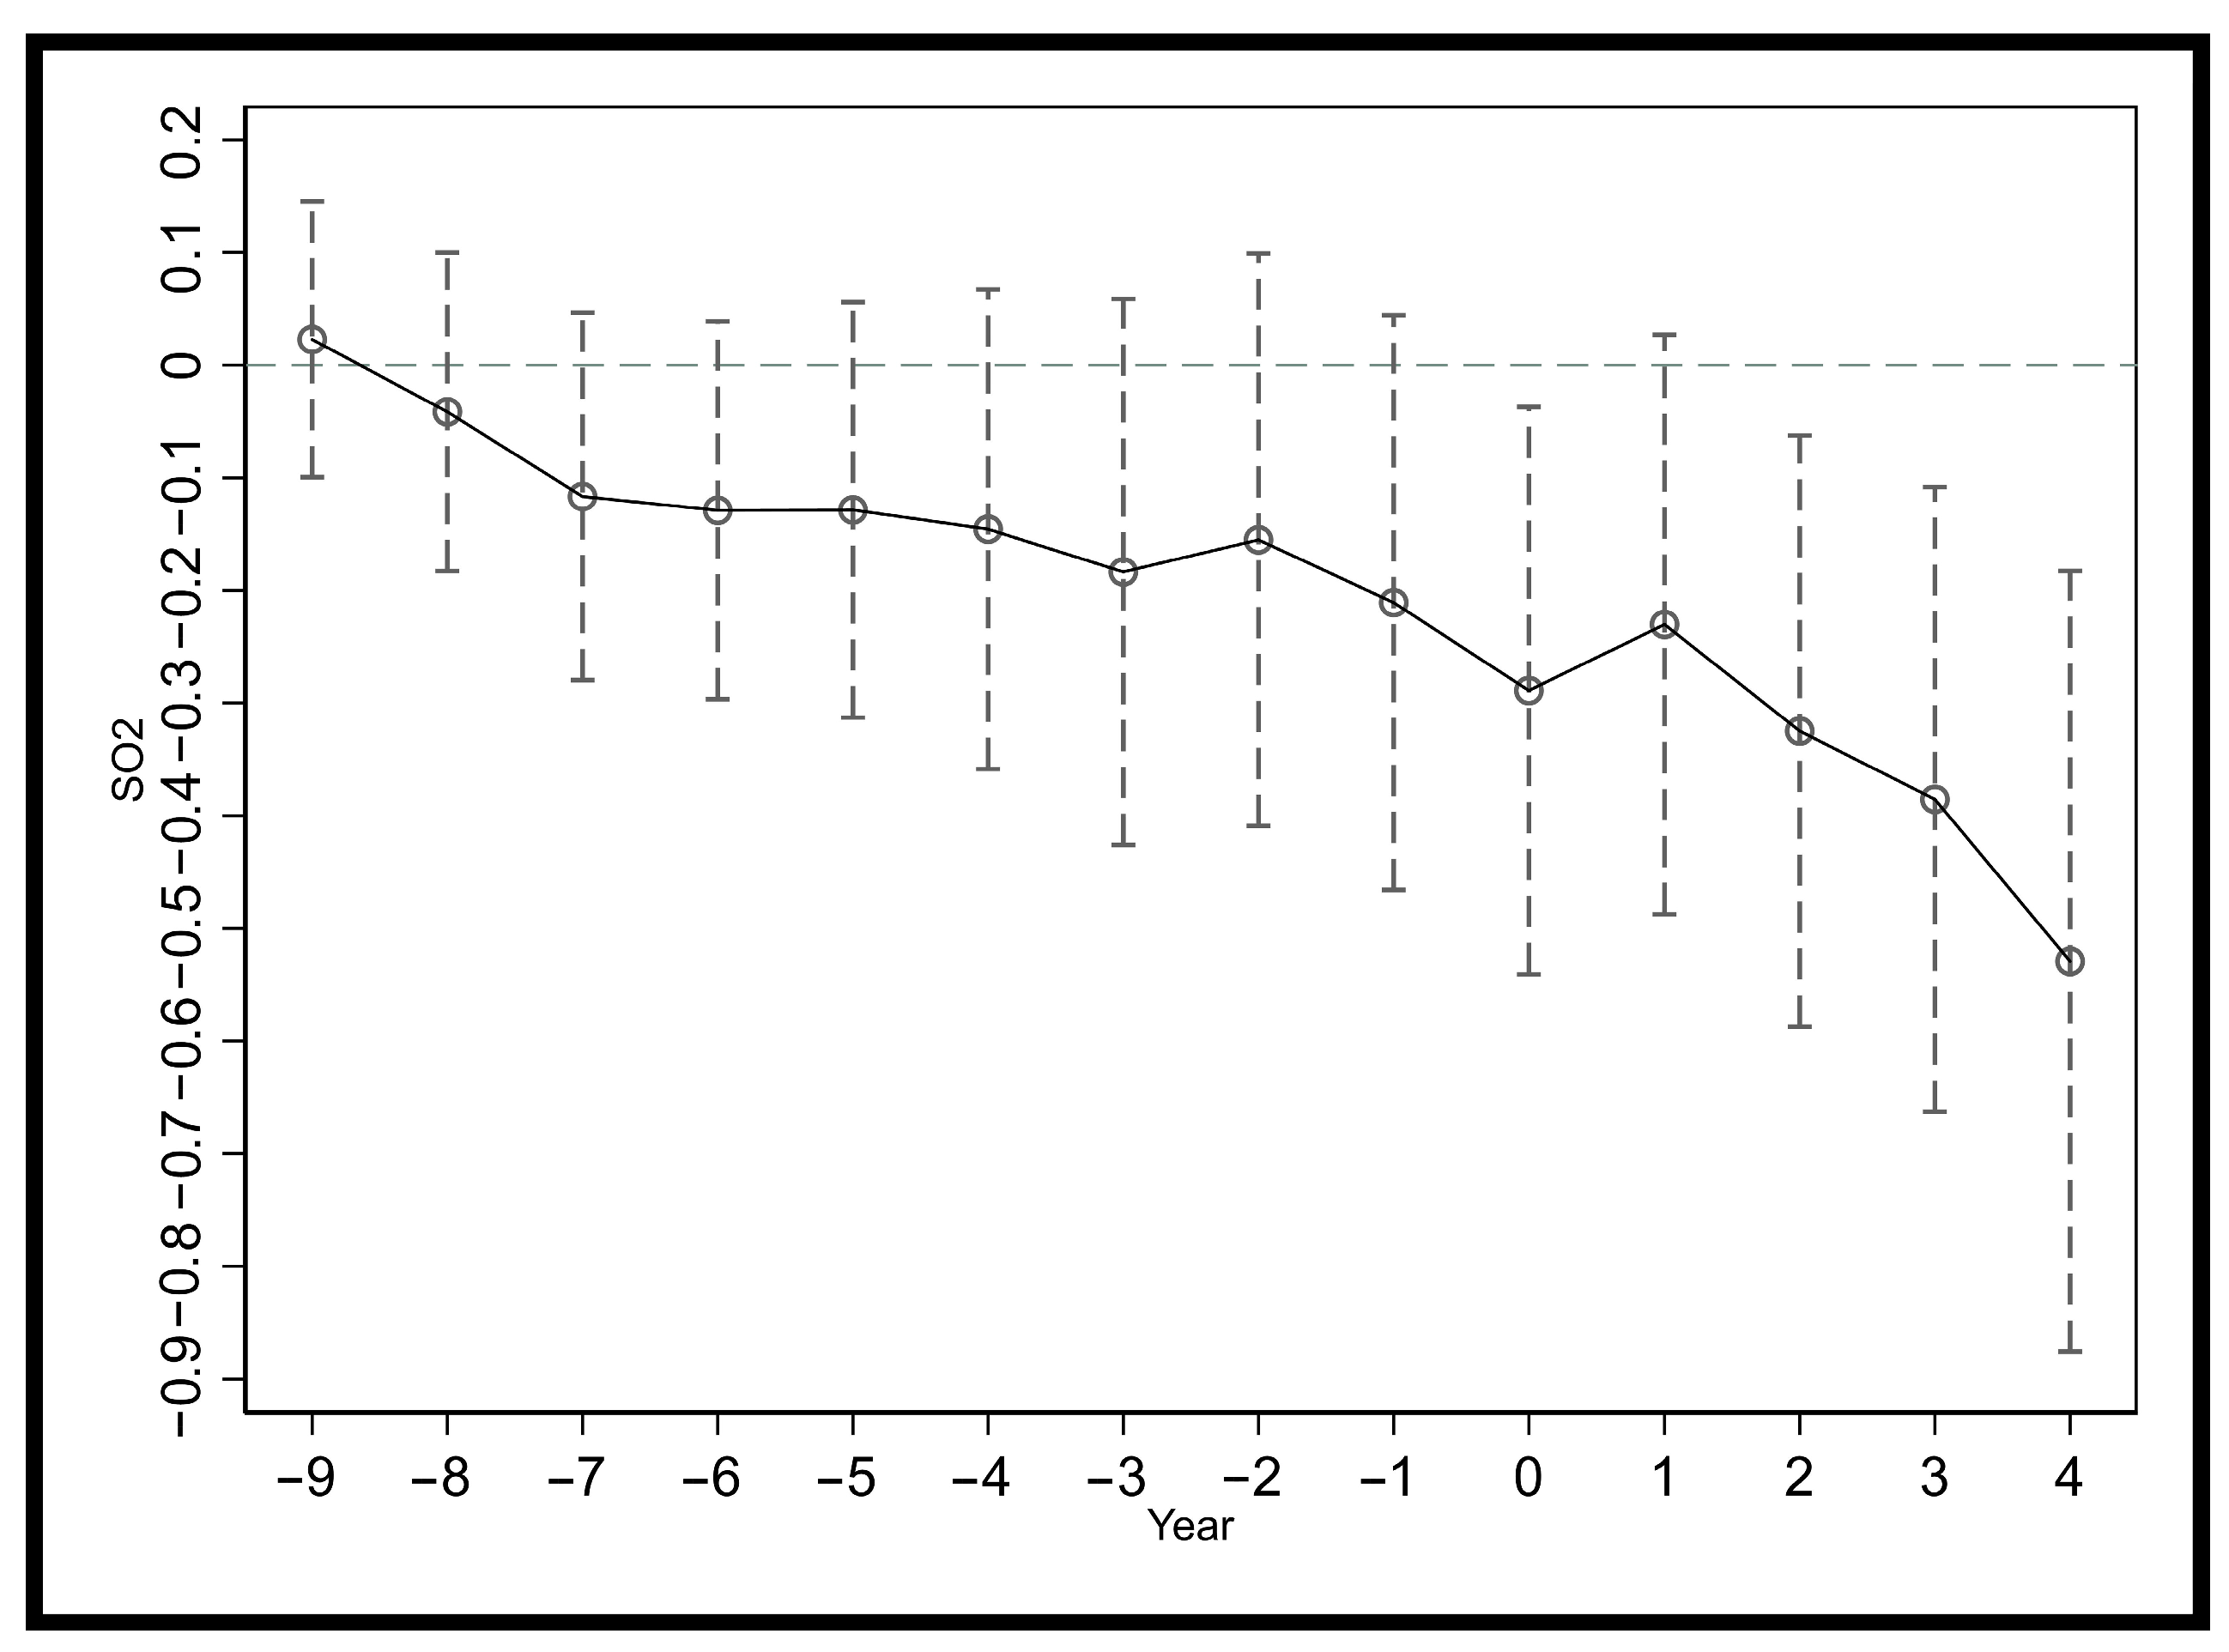
4.2.1. Parallel Trend Assumption
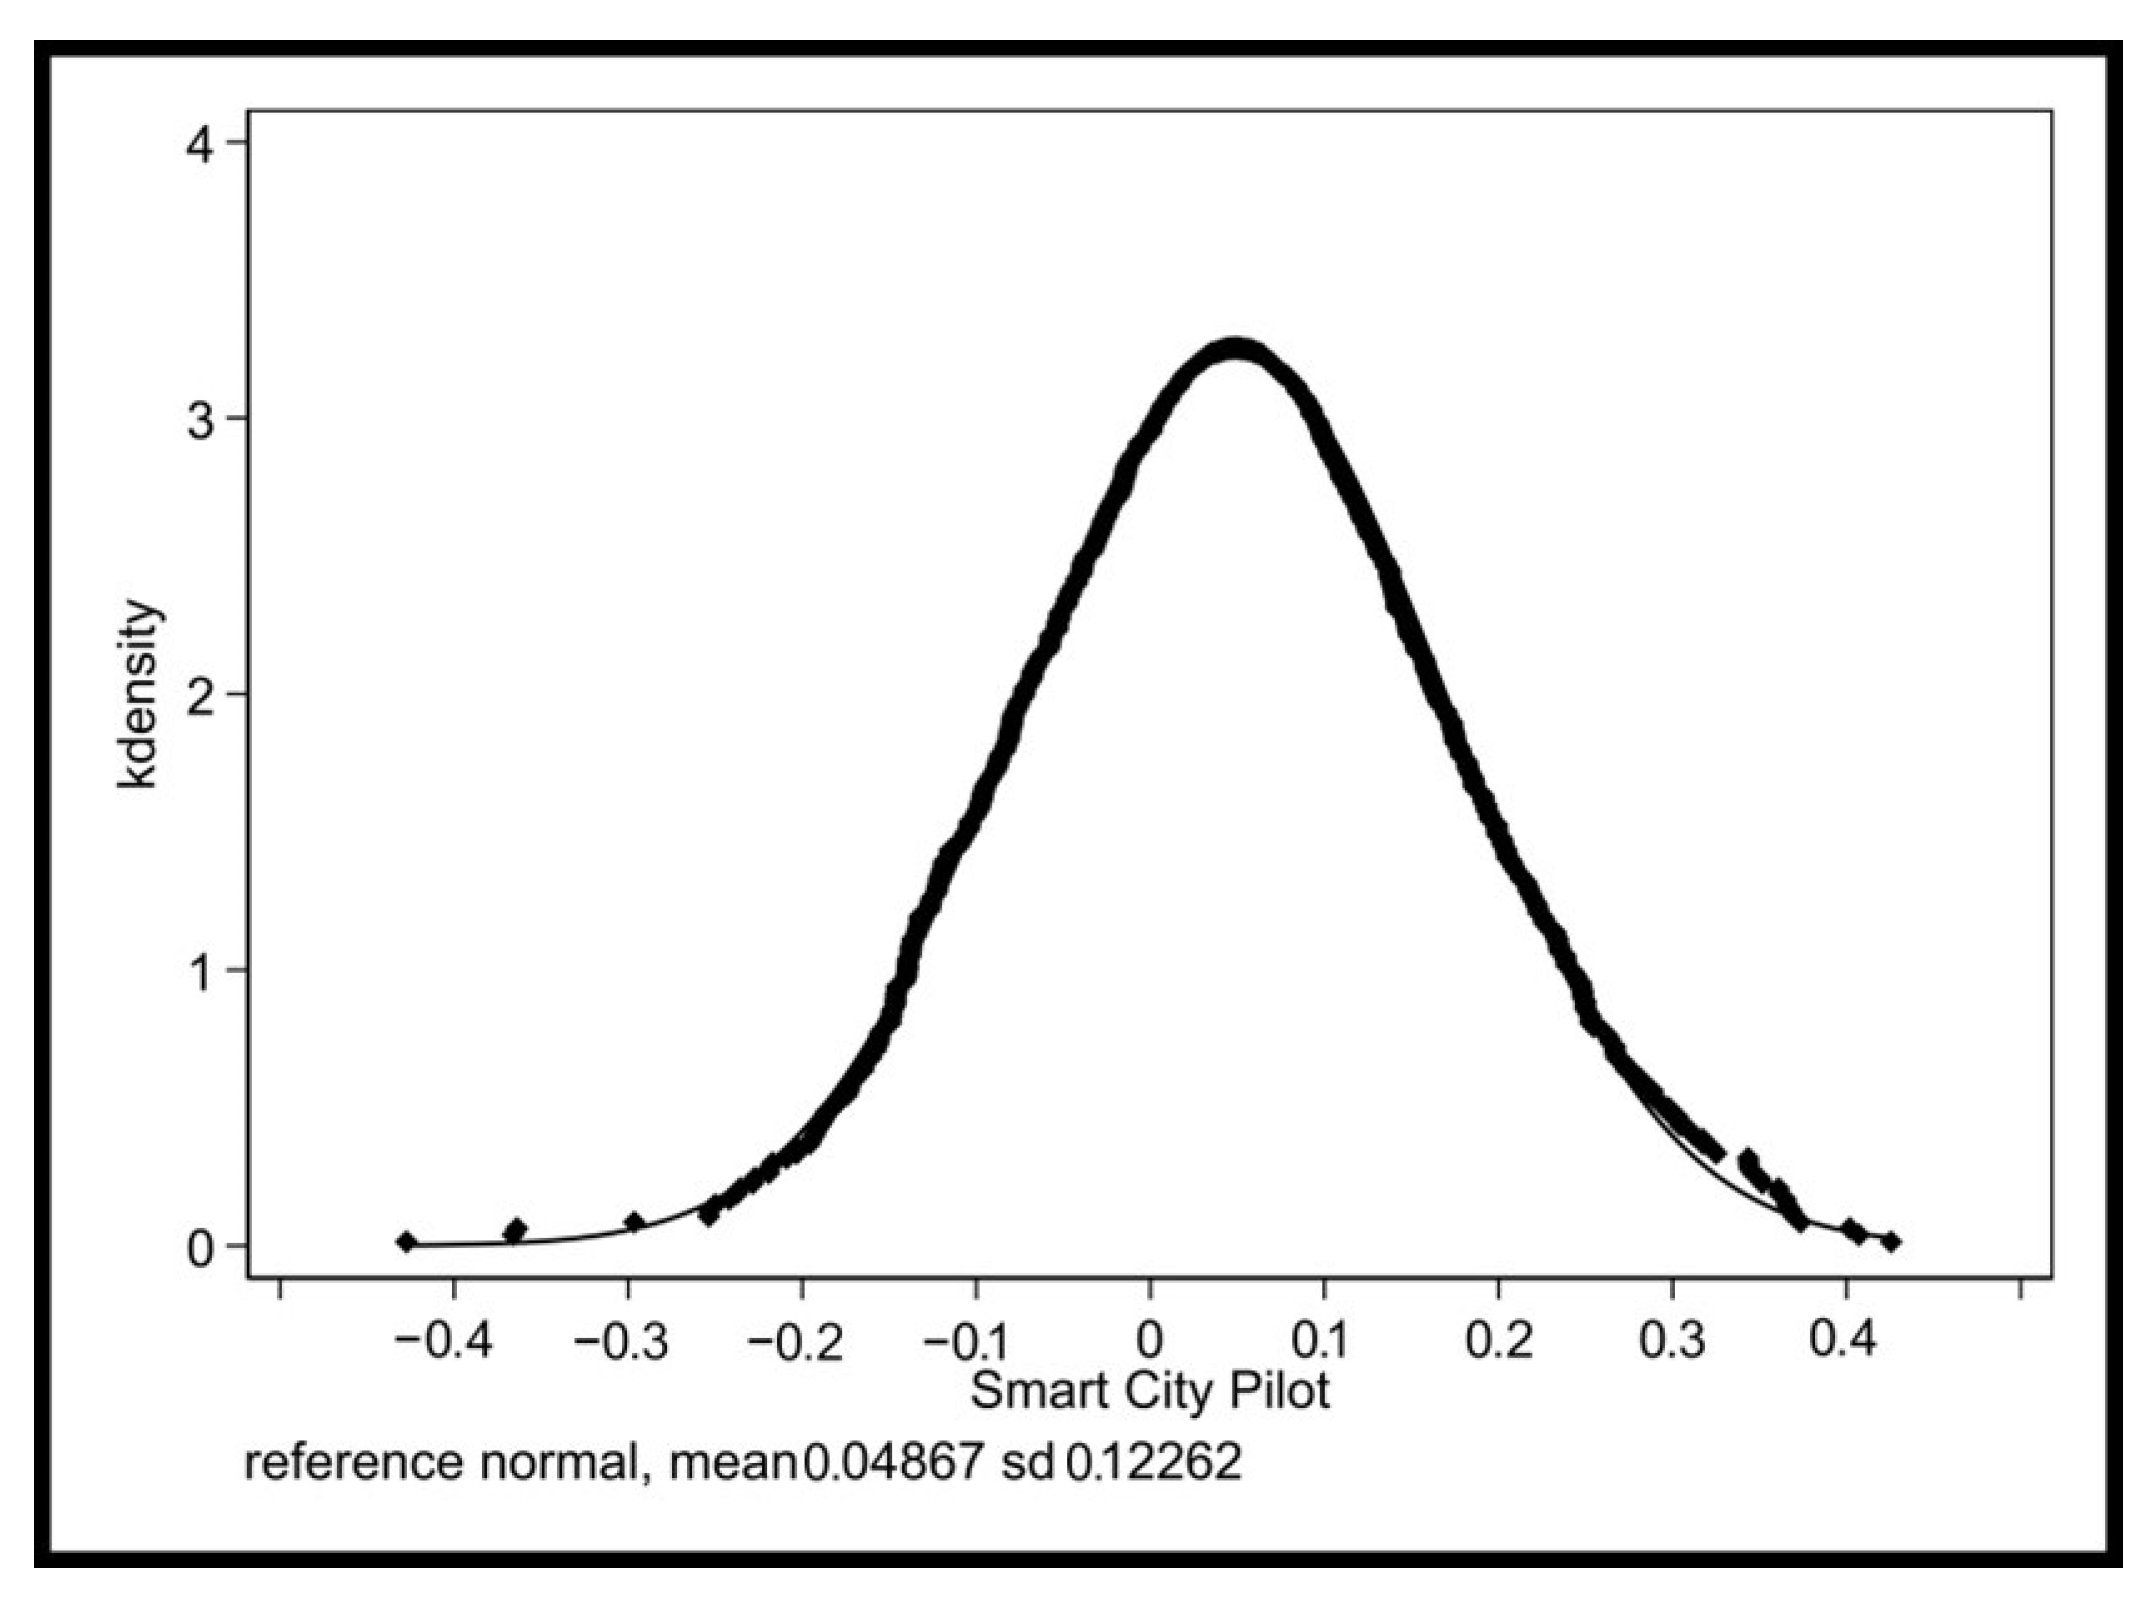
For this study, the reliability of the above-mentioned conclusion is dependent on the hypothesis that before the influence of smart cities, urban SO2 emissions had the same trend.
As stated by [27], we use event analysis to test the parallel trend hypothesis in natural experimental situations. As shown in Figure 2, the core coefficient is significantly different from 0 after 2013 but not before 2013, which confirms that there is no significant difference between the treatment group and the control group before the pilot. Not only does this prove that the common trend hypothesis is correct but provides preliminary evidence of the significant effects of the SCP projects.

4.2.2. Placebo Test

Thus, in order to mitigate potential estimation biases resulting from unobservable factors that could impact the reduction of SO2 emissions in smart cities, we employ a placebo test. Specifically, we first randomly select a corresponding number of samples as the actual pilot cities that year to be the treatment group cities and the others as the control group. Then, we re-estimate Equation (1) according to the new sample and repeat this random progress 1000 times to the mean of coefficients α1 [13,28]. If the result above of Equation (1) is robust, then the mean of these 1000 coefficients will be equal to or close to 0 and not systematically different from 0.
Figure 3 depicts the density distributions of 1000 bootstrap estimates. After such a placebo test, we found that the mean of virtual α1 was 0.0489, very close to 0, and the coefficients were approximately normally distributed around 0. These findings validate the strength and reliability of our primary results.

5. Mechanism Analysis

5.1. The Perspective of Macro-Economy

According to the previous analysis, the path of the smart city affecting EP can be summarized as “smart city construction-improvement of urban information level-technical effect and structural effect-EP”, if we look at it from a macroeconomic perspective. To verify the existence of this mechanism with empirical methods, although we have argued this through rigorous logic, we need to prove whether the construction of a smart city will significantly improve urban informatization. Thus, following previous studies [29], we utilize the number of Internet users in cities as a proxy variable to capture the level of information technology adoption within a city and perform a Difference-in-Differences (DID) regression analysis. To perform the analysis, we have constructed a DID model. If the regression results demonstrate a significant negative effect, as expected, we can conclude that the smart city project has had a positive impact on the level of urban information. As shown in column 1 of Table 3, the coefficient of SCPit is significantly negative at the 10% level, indicating clear evidence of the positive impact of the Smart City Project on improving the informatization of urban areas.
Based on the research presented in this paper, we include information level, innovation capacity and industrial structure as common analysis indicators of macroeconomics. The construction of smart cities, which involves leveraging modern science and technology, integrating information resources for urban development and promoting the development of new models, is closely linked to innovation. However, as the focus of this study is on pollution, we analyze the level of sulfur dioxide emissions.
Now we need to ascertain if there exists a statistically significant relationship between urban informatization and either technological innovation or industrial structure. Specifically, to serve as a measure of the degree of technological innovation in our study, we introduce the variable Innov, which is defined as the natural logarithm of patents per capita within a given city. To examine the potential impact of industrial structure on our results, we introduced the variable “Indus”, which is defined as the ratio of the output value of the tertiary industry to that of the secondary industry. The impact of informatization on both technological innovation and industrial structure is reported in columns 1 and 2 of Table 3, respectively. The results show that the improvement of informatization level by 1% will promote technological innovation by 10.06% and the optimization of the industrial structure by 2.19%, respectively.
So far, our logic has been preliminarily validated. However, we want to make the validation of this article more rigorous. All the above samples are grouped according to the level of technological innovation and industrial structure, and regressed, respectively. The results are shown in columns 4 to 7 of Table 3. Columns 4 and 5 show that the coefficient of SCit at the level of high-tech innovation was significantly negative, while the core coefficient was not significant in the other group. That is to say, the improvement of technological innovation makes the environmental effect of SCP become significant. This conclusion is also valid in the industrial structure, which again verifies the rationality of the logic of our paper. Hence, one can make a justifiable inference that the attenuation of environmental contamination through the implementation of informatization measures is realized by enhancing technological innovation and optimizing industrial structure.

5.2. The Perspective of Government

As the implementation subject of smart city pilot policies, local governments have played a decisive role in the construction of smart cities, such as stimulating the development of the information industry and optimizing the supervision and governance of the environment using big data and other ITs. The construction of smart cities requires supervision and support from government departments, and relevant construction justifications have been issued by the government, which propose the development of new industrial ecosystems closely related to smart cities, economic growth and industrial upgrading. In order to modernize the city’s governance system and improve its governance capacity, the government must play a guiding role and accelerate the empowerment of data and technology. This section will focus on analyzing the behavior changes of local governments due to economic innovation, economic structure and other changes in their attention under the construction of smart cities.
Referring to [24], in order to quantify the adjustment of the government’s behavior after the implementation of SCP projects, we used the word frequency analysis method on government work reports. Government work reports are regarded as an accurate reflection of the government’s focus and direction of work, mainly reflected in the following two aspects: first of all, government work reports are presented annually by the government at the local people’s congress and political consultative conference. Through this analysis, we are able to gain valuable insights into the government’s efforts and achievements in meeting basic economic indicators over the past year. Second, pressure from the public and superiors will provide an incentive for the government to do its best to deliver on the promises made in the reports.

5.3. The Perspective of Enterprise

To examine the mechanism at the dimension of enterprise, we introduce tech to proxy the effect of SCP projects on the technological innovation of enterprises, defined as the number of high-tech enterprises entering. Corporate pollution and environmental pollutants typically consist of sulphur dioxide and carbon dioxide. Therefore, in line with the macroeconomic perspective, we measure environmental pollution by examining sulphur dioxide emissions. As our analysis focuses on the enterprise perspective, we assume that the presence of a greater number of high-tech enterprises in a region is indicative of a higher level of information technology and greater intelligence in the region. High-tech enterprises serve as a barometer of the overall technological level of a region in a particular context. Table 4 presents the estimated results of model (6), and we find that SCP significantly increased the number of high-tech enterprises entering at the 1% level. To some extent, the increase in high-tech enterprises means that the technological level of the whole market has improved. A robust culture of innovation and a high level of technological advancement in the market provide a wealth of technical knowledge that firms can emulate and learn from. By doing so, firms can reduce the cost of innovation and stimulate their own drive for innovation. Therefore, enterprises are more likely to adopt low-input, high-efficiency clean production modes to reduce energy consumption. More effective technologies of pollution control are available to reduce pollutant emissions. Further, we grouped the samples according to the number of high-tech enterprises entering and made a regression again. The results are shown in Table 4. Obviously, in the group with fewer high-tech enterprises, the emission reduction effect of SCP is not significant. However, for the other group, the reduction effect of SCP was significantly positive at the 1% level, and the coefficient was much larger than the baseline regression. When there is a high number of high-technology firms, competition between them becomes more intense. This leads to two outcomes. Firstly, firms strive to improve their green market competitiveness by enhancing their technology and developing green products. Secondly, in order to enhance their competitive advantage through improved reputation, firms focus on reducing their pollutant emissions and building a reputation as a green and sustainable company.
Thus, it is conceivable that through the development of smart cities and the shift towards technology-oriented enterprises, there may be an enhancement in production efficiency and environmental protection capabilities, ultimately leading to an amelioration of environmental quality.

6. Conclusions and Policy Implications

The principal findings of this study can be summarized as follows: (1) the construction of a smart city has significantly improved the information level of the city. (2) Information has significantly reduced the EP of cities, which is still true after a series of robustness tests. More specifically, it leads to declines in SO2 total emission and per capita by approximately 20.7% and 21.1%, respectively. (3) Mechanism analysis shows that informatization affects the macro-economy and adjusts the behavior of enterprises and governments, thus relieving EP through the technique effect and structure effect.
The results of our findings have profound policy implications. Firstly, given the positive impact of urban informatization construction on environmental pollution, the government should not only incorporate green technology but also promote further informatization construction and adopt a smart city strategy to achieve sustainable urban development. It is essential to increase public awareness and provide support for the construction of green smart cities. The government should encourage the transformation of first- and second-tier cities with high levels of economic and rapid development into smart cities. This will drive other cities to follow suit and embrace the shift towards information technology and continuous high-tech development. The government can promote city informatization through a combination of financial support, policy regulation and practical guidance.
Secondly, the importance of promoting technological innovation cannot be overstated. It is also crucial to optimize the industrial structure and encourage low-energy consumption industries. CTS plays a significant role in increasing firms’ green output and the proportion of green patents [4]. The government should increase its support for ICT and green innovation technologies and incentivize companies that contribute to the Internet of Things, cloud computing and smart environmental protection. Rewarding companies on a merit basis would help to further motivate and drive innovation.
Lastly, it is crucial to establish an integrated platform that brings together government, industry, academia, research and application for smart cities. This can be achieved through collaboration between relevant government departments, universities, research institutes and IT companies. The establishment of R&D centers and related industrial support bases would facilitate the development and implementation of innovative solutions that can drive the creation of smart cities.
In conclusion, our study provides valuable insights for policymakers who are concerned about the sustainable development of cities to make informed and strategic decisions.

Author Contributions

Conceptualization, X.H.; methodology, X.H. and W.W.; software, H.H.; validation, J.R.; formal analysis, J.R.; investigation, J.R.; resources, J.R.; data curation, H.H.; writing—original draft preparation, X.H. and W.W.; writing—review and editing, H.H. and J.R.; visualization, H.H. and J.R.; supervision, X.H. and W.W.; project administration, W.W.; funding acquisition, W.W. All authors have read and agreed to the published version of the manuscript.

Funding

This research received no external funding.

Institutional Review Board Statement

Not applicable.

Informed Consent Statement

Not applicable.

Data Availability Statement

The data presented in this study are available on request from the corresponding author.

Conflicts of Interest

The authors declare no conflict of interest.

References

  1. Hu, H.; Qi, S.; Chen, Y. Using green technology for a better tomorrow: How enterprises and government utilize the carbon trading system and incentive policies. China Econ. Rev. 2023, 78, 101933. [Google Scholar] [CrossRef]
  2. Shen, L.; Shuai, C.; Jiao, L.; Tan, Y.; Song, X. Dynamic sustainability performance during urbanization process between BRICS countries. Habitat Int. 2017, 60, 19–33. [Google Scholar] [CrossRef]
  3. Ding, Y.; Zhang, M.; Chen, S.; Wang, W.; Nie, R. The environmental Kuznets curve for PM2.5 pollution in Beijing-Tianjin-Hebei region of China: A spatial panel data approach. J. Clean. Prod. 2019, 220, 984–994. [Google Scholar] [CrossRef]
  4. He, B.; Zhao, D.; Zhu, J.; Darko, A.; Gou, Z. Promoting and implementing urban sustainability in china: An integration of sustainable initiatives at different urban scales. Habitat Int. 2018, 82, 83–93. [Google Scholar] [CrossRef]
  5. Hu, H.; Xie, N.; Fang, D.; Zhang, X. The role of renewable energy consumption and commercial services trade in carbon dioxide reduction: Evidence from 25 developing countries. Appl. Energy 2018, 211, 1229–1244. [Google Scholar] [CrossRef]
  6. Paulin, A. Informating Smart Cities Governance? Let Us First Understand the Atoms! J. Knowl. Econ. 2016, 7, 329–343. [Google Scholar] [CrossRef] [Green Version]
  7. Yin, Y.; Olsson, A.R.; Håkansson, M. The role of local governance and environmental policy integration in Swedish and Chinese eco-city development. J. Clean. Prod. 2016, 134, 78–86. [Google Scholar] [CrossRef]
  8. Wang, Z.; Deng, Y.; Zhou, S.; Wu, Z. Achieving sustainable development goal 9: A study of enterprise resource optimization based on artificial intelligence algorithms. Resour. Policy 2023, 80, 103212. [Google Scholar] [CrossRef]
  9. Gravemeijer, K.; Stephan, M.; Julie, C.; Lin, F.; Ohtani, M. What mathematics education may prepare students for the society of the future? Int. J. Sci. Math. Educ. 2017, 15, 105–123. [Google Scholar] [CrossRef] [Green Version]
  10. Neirotti, P.; De Marco, A.; Cagliano, C.; Mangano, G.; Scorrano, F. Current trends in Smart City initiatives: Some stylised facts. Cities 2014, 38, 25–36. [Google Scholar] [CrossRef] [Green Version]
  11. He, J.; Wang, S.; Liu, Y.; Ma, H.; Liu, Q. Examining the relationship between urbanization and the eco-environment using a coupling analysis: Case study of Shanghai, China. Ecol. Indic. 2017, 77, 185–193. [Google Scholar] [CrossRef]
  12. Yigitcanlar, T.; Kamruzzaman, M.; Buys, L.; Ioppolo, G.; Sabatini-Marques, J.; da Costa, E.M.; Hyo, J.; Yun, J. Understanding ‘smart cities’: Intertwining development drivers with desired outcomes in a multidimensional framework. Cities 2018, 81, 145–160. [Google Scholar] [CrossRef]
  13. Zhang, Q.; Yu, Z.; Kong, D. The real effect of legal institutions: Environmental courts and firm environmental protection expenditure. J. Environ. Econ. Manag. 2019, 98, 102254. [Google Scholar] [CrossRef]
  14. Wu, K.-J.; Liao, C.-J.; Tseng, M.-L.; Lim, M.K.; Hu, J.; Tan, K. Toward sustainability: Using big data to explore the decisive attributes of supply chain risks and uncertainties. J. Clean. Prod. 2017, 142, 663–676. [Google Scholar] [CrossRef]
  15. Hasija, S.; Shen, Z.M.; Teo, C. Smart city operations: Modeling challenges and opportunities. Manuf. Serv. Oper. Manag. 2020, 22, 203–213. [Google Scholar] [CrossRef] [Green Version]
  16. Liu, X.; Sun, T.; Feng, Q. Dynamic spatial spillover effect of urbanization on environmental pollution in China considering the inertia characteristics of environmental pollution. Sustain. Cities Soc. 2020, 53, 101903. [Google Scholar] [CrossRef]
  17. Gu, F. Exploring the Application and Optimization Strategy of the LMBP Algorithm in Supply Chain Performance Evaluation. Comput. Intell. Neurosci. 2022, 7977335, 7. [Google Scholar] [CrossRef]
  18. Wang, Y.; Hu, H.; Dai, W.; Burns, K. Evaluation of industrial green development and industrial green competitiveness: Evidence from Chinese urban agglomerations. Ecol. Indic. 2021, 124, 107371. [Google Scholar] [CrossRef]
  19. Asongu, S.A. ICT, openness and CO2, emissions in Africa. Environ. Sci. Pollut. Res. 2018, 25, 9351–9359. [Google Scholar] [CrossRef] [Green Version]
  20. Arsenio, E.; Dias, J.V.; Lopes, S.A.; Pereira, H.I. Assessing the market potential of electric bicycles and ICT for low carbon school travel: A case study in the smart city of ÁGUEDA. Eur. Transp. Res. Rev. 2018, 10, 1–9. [Google Scholar] [CrossRef] [Green Version]
  21. Salahuddin, M.; Alam, K.; Ozturk, I. The effects of Internet usage and economic growth on CO2 emissions in OECD countries: A panel investigation. Renew. Sustain. Energy Rev. 2016, 62, 1226–1235. [Google Scholar] [CrossRef]
  22. Yigitcanlar, T.; Kamruzzaman, M. Does smart city policy lead to sustainability of cities? Land Use Policy 2018, 73, 49–58. [Google Scholar] [CrossRef]
  23. Wang, Z.; Liang, F.; Li, C.; Xiong, W.; Chen, Y.; Xie, F. Does China’s low-carbon city pilot policy promote green development? Evidence from the digital industry. J. Innov. Knowl. 2023, 8, 100339. [Google Scholar] [CrossRef]
  24. Chen, Z.; Kahn, M.E.; Liu, Y.; Wang, Z. The consequences of spatially differentiated water pollution regulation in china. J. Environ. Econ. Manag. 2018, 88, 468–485. [Google Scholar] [CrossRef]
  25. Ravinesh, R.; Peter, K.; Stauvermann, J.; Samitas, A. The effects of ICT⁎ on output per worker: A study of the Chinese economy. Telecommun. Policy 2016, 40, 102–115. [Google Scholar]
  26. Hu, H.; Xu, J.; Liu, M.; Lim, M.K. Vaccine supply chain management: An intelligent system utilizing blockchain, IoT and machine learning. J. Bus. Res. 2023, 156, 113480. [Google Scholar] [CrossRef]
  27. Wang, Z.; Zhang, S.; Zhao, Y.; Chen, C.; Dong, X. Risk prediction and credibility detection of network public opinion using blockchain technology. Technol. Forecast. Soc. Change 2023, 187, 122177. [Google Scholar] [CrossRef]
  28. Li, P.; Lu, Y.; Wang, J. Does flattening government improve economic performance? evidence from china. J. Dev. Econ. 2016, 123, 18–37. [Google Scholar] [CrossRef]
  29. Ozcan, B.; Apergis, N. The impact of internet use on air pollution: Evidence from emerging countries. Environ. Sci. Pollut. Res. Int. 2017, 25, 4174–4189. [Google Scholar] [CrossRef]
Figure 1. The structure of the article.
Sustainability 15 10030 g001
Figure 2. The parallel trend hypothesis test—Comparison of coefficients.
Sustainability 15 10030 g002
Figure 3. Placebo test.
Sustainability 15 10030 g003
Table 1. Descriptive statistics.
Panel A: All SamplesPanel B: Treatment GroupPanel C: Control Group
VariableObsMeanSdObsMeanSdObsMeanSd
SO2321048.3243.81135056.5348.65186042.3738.88
SO2(per) 32100.470.6413500.510.6718600.440.61
FS32100.160.0713500.150.0718600.170.08
Ur32100.370.2113500.400.2118600.360.20
Indus32100.810.3013500.790.3018600.820.31
Open32100.080.1013500.080.1018600.080.10
GDP 32109.820.7313509.960.7518609.710.69
The abbreviations stand for: Fiscal spending ( F S i t ), level of urbanization ( U r i t ), industrial structure ( I n d u s i t ), opening degree ( O p e n i t ), G D P i t is defined as per capita GDP.
Table 2. Baseline regression results.
SO2
VariableTotalPer CapitalTotalPer Capital
SCP(1)(2)(3)(4)
−0.204 ***−0.225 ***−0.207 ***−0.211 ***
Control variable(0.066)(0.075)(0.068)(0.077)
Time fixed effect YY
City fixed effectYYYY
NYYYY
correlation
(R root 2)
3210321032103210
Variable0.32120.38120.32430.3857
Notes: Standard errors clustered at the city level are reported in parentheses, and *** denotes statistical significance at the level of 1%.
Table 3. The perspective of macro-economy.
(1)(2)(3)(4)(5)(6)(7)
InforInnovIndusSO2
Low-Level InnovHigh-Level InnovLow-Level IndusHigh-Level Indust
SCP0.0579 * −0.0988−0.1724 ***−0.1059−0.2610 **
(0.033) (0.172)(0.066)(0.076)(0.109)
Infor 0.1006 *0.0219 *
(0.056)(0.012)
ControlsYYYYYYY
Time fixed effectYYYYYYY
City fixed effectYYYYYYY
N3210321032101605160516051605
correlation (R root 2)0.82660.70970.46040.24290.47990.36090.2989
Notes: Standard errors clustered at the city level are reported in parentheses; ***, ** and * denote statistical significance at the levels of 1%, 5% and 10%, respectively.
Table 4. The perspective of enterprise.
(1)(2)(3)(4)(5)(6)(7)
SmartInnovationStructureSO2
Low-Level
Innovation
High-Level
Innovation
Low-Level
Structure
High-Level
Structure
SCP7.1487 ***0.3787 *3.6387 ***−0.1774 **−0.3146 ***−0.1862 **−0.2164 ***
(0.432)(0.204)(0.551)(0.073)(0.108)(0.086)(0.080)
ControlsYYYYYYY
Time fixed effectYYYYYYY
City fixed effectYYYYYYY
N280028002800216163915331267
R20.25360.00290.04240.33910.47270.27140.4477
SCP7.1487 ***0.3787 *3.6387 ***−0.1774 **−0.3146 ***−0.1862 **−0.2164 ***
Notes: Standard errors clustered at the city level are reported in parentheses; ***, ** and * denote statistical significance at the levels of 1%, 5% and 10%, respectively.
Disclaimer/Publisher’s Note: The statements, opinions and data contained in all publications are solely those of the individual author(s) and contributor(s) and not of MDPI and/or the editor(s). MDPI and/or the editor(s) disclaim responsibility for any injury to people or property resulting from any ideas, methods, instructions or products referred to in the content.

