1. Introduction
As a result of rapid urbanization over the past 40 years, 60% of China’s population now resides in urban areas. At the same time, China is fast becoming an elderly society. These increases are driving the need for China to create inclusive and environmentally sound communities for people of all ages. The 14th Five-Year Plan aims to improve the general well-being of the people, promote high-quality development, and help achieve the overall goals of the plan by integrating health and aging issues into urban planning and design. This plan will create a new platform for cities to efficiently meet the aging society’s many challenges. The aging of the population and old-age care are vital problems that have needed to be actively addressed during the process of building a sustainable city in recent years. The aging problem has posed great challenges to urban planning and city building. For example, many residential buildings lack elevators for the elderly, neighborhoods lack activity and rest areas for the elderly, and transportation hubs and route planning do not take the needs of the elderly into account, all of which reduce the elderly’s ease of use and independence. A key component of green city planning is addressing issues of public health. Socially vulnerable groups include the elderly, who tend to be in poor health and have limited financial resources. This is especially true of those seniors who fall into one or more of the “special groups”, such as those who have lost a spouse or partner, are disabled, live alone, or have no children. Improving the health of the elderly and providing for their care is a symbol of urban development and a key component of a sustainable city. In light of this factor, sustainable city plans should account for the needs of an aging population. Urbanization is the continuous expansion of urban production and rapid growth of the urban population [
1]. Poor living environments, traffic congestion, employment difficulties, ecological degradation, environmental problems, and diminishing natural resources accompany urbanization and aging in China [
2]. The best way to solve these problems is to build sustainable cities.
Because of the limitations of conventional approaches, this research employs Synthetic Control Methods (SCM) to evaluate the impact of healthy city pilot programs on policy [
3]. SCM can assess the effectiveness of policy implementation by comparing the differences between the treatment group and the synthetic group before and after policy implementation. This comparison is made by selecting specific predictor variables from existing data as elements of the synthetic assessment variables and by weighting the predictor variables of each sample in the control group. The strategy relies on the data-driven determination of synthetic control units, eliminating estimation bias due to subjective selection and policy endogeneity and yielding trustworthy evaluation results [
4].
The mechanism of a healthy urbanization dynamics mechanism is a complex and dynamic system. The structure of urbanization dynamics varies across areas, historical epochs, and developmental levels. Establishing an index system to quantify the dynamic mechanism of healthy urbanization helps accelerate the process of healthy urbanization and studying both its overall characteristics and quantitative correlations [
5]. The country needs an effective and appropriate indicator system to guide China’s urban growth toward healthy and orderly urbanization. This system requires a thorough assessment of the dynamic mechanism of healthy urbanization in China [
6].
This work examines the progress made in urban health by using the level of sustainable city development as its focal point of investigation. Urban health is a comprehensive conceptt involving complex content and many fields. While there are different approaches to measuring the level of sustainable cities at the macro and micro levels, the components included are broadly the same, including environmental, cultural, health, and social. Therefore, this work compares urban areas with varying degrees of sustainable development. Further, the composite control approach examines how a sustainable city pilot strategy impacts sustainable urban growth. Finally, the theory of power mechanism concludes by organizing the law of action of the power elements on the simulated health index.
2. Literature Review
Research on sustainable cities has been ongoing in China since 2000, and the extant literature covers two main perspectives. Some scholars have learned from the experience of developed countries in Europe and the United States and summarized the current state of sustainable city development in China, offering improvements and new directions. Zhang et al. [
7] analyzed the mechanism of sustainable cities and the social environment for developing sustainable cities in China. In light of the current state of China’s public health system, He et al. [
8] outlined the two phases of sustainable city development in China and offered recommendations for developing sustainable cities. Yan et al. [
9] reviewed the evolution of sustainable cities in Europe and anticipated their construction in China from the perspectives of aging, urban planning, and social factors. Zhou et al. [
10] dissected the Canadian sustainable city movement and presented a reference framework for constructing sustainable cities in China using Toronto as an illustrative case study. Healthy cities are not only limited to public health. The Chinese government’s promotion of sustainable cities has expanded beyond the original goal of increasing inhabitants’ physical health to include enhancing the urban environment, social security, and people’s material and spiritual well-being [
11].
Most scholars agree on a common concept and set of dynamic mechanisms for power. The literature on dynamic mechanisms typically uses a systems viewpoint to dissect the subject under research to fully understand these interrelationships. Chassang and Kapon used Bayesian networks to construct a set of incentive mechanisms that adapt to quasi-linear dynamic environments. They gave examples of dynamic mechanisms compatible with different machine elements in complex systems [
12]. Streule et al. [
1] argue that system theory should be integrated into studying dynamic mechanisms. The coupling effects of reciprocal support, connection, and restriction among various aspects of the management system distinguish dynamic mechanisms from basic incentive theory [
13]. The complex system of the production team was modeled using hyper-networks by Kan et al. [
13] The simulation experiments proved that the internal atmosphere of the team is a significant factor in determining its learning effectiveness [
14].
Three main aspects set this work apart from the existing body of research. First, this work employs a synthetic control approach rather than the conventional methods, such as the Difference in Difference (DID) method, for evaluating the policy effects of a sustainable city. When faced with this issue, traditional approaches often fail. Second, the current assessment index system of China’s sustainable cities is combined with the official accounting criteria of the World Health Organization to optimize the structure of the index system. Third, the system dynamics simulation method is introduced into domestic research on sustainable cities.
3. Materials and Methods
3.1. Concept, Development, and Evaluation Model of a Sustainable City
In light of the rapidly aging population, the government has prioritized strengthening the old-age security sector by promoting the development of in-home care, acknowledging the significance of community and institutional support, and establishing a comprehensive network of old-age services in both urban and rural areas [
15]. Many cities have adopted different service delivery models since the introduction of community aging to effectively address the growing difficulties associated with aging and the issue of home care for the elderly. These models aim to meet the needs of different communities by providing high-quality care at a reasonable cost [
16].
China has not yet achieved commonwealth but has become an aging society, which has slowed the development of home care for the elderly in urban areas. Thus, the government has assumed the initiative to foster the growth of this sector by nurturing a robust market and coordinating efforts from all stakeholders to meet the needs of the country’s growing elderly population [
17]. Our government disseminates its ideas about community home care for the elderly to all stakeholders through the urban community home care for the elderly policy and related deployments of work. Since the soundness of the urban community home care for the elderly policy directly affects the healthy growth of the urban community home care for the elderly industry, it is critical to examine it in depth [
18].
By prioritising human health in all its facets, from urban design, building, and management, and by ensuring sustainable living and working for the general public, a city can become sustainable as a whole and contribute to the growth of human civilization [
19].
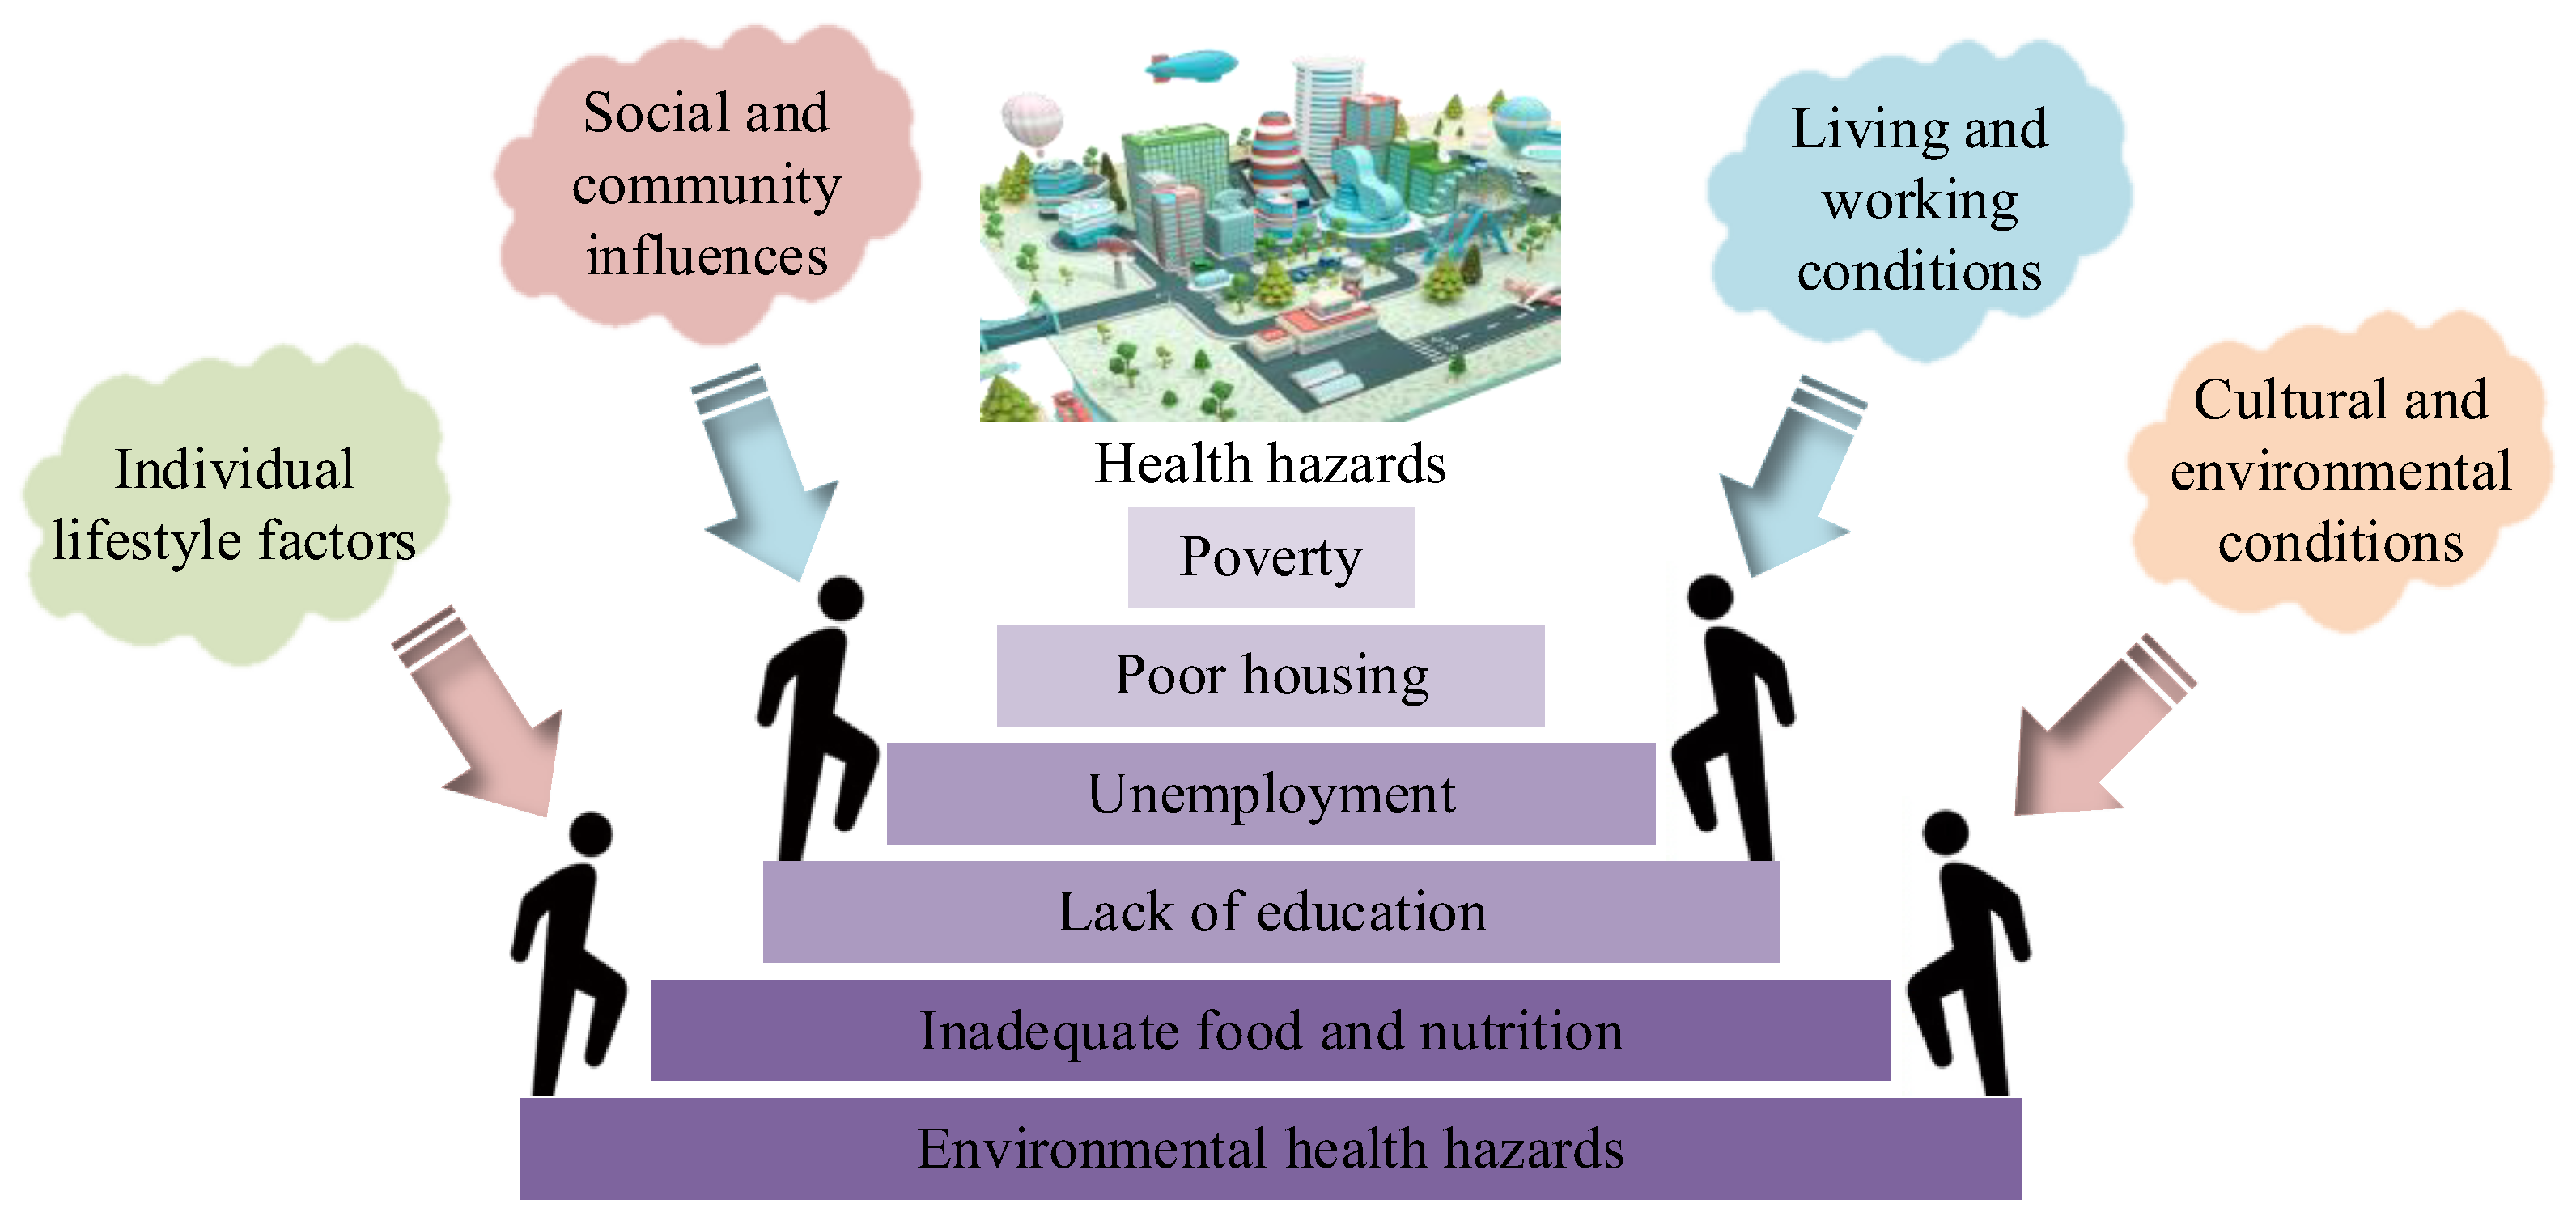
Figure 1 displays a sustainable city’s key elements and gradients [
20].
Improved community-based health promotion in urban areas is a primary implementation goal of sustainable cities [
21]. When it comes to public health, the sustainable city project is on the rise because it rejects a “top-down” approach in favor of a community-based “bottom-up” method [
22].
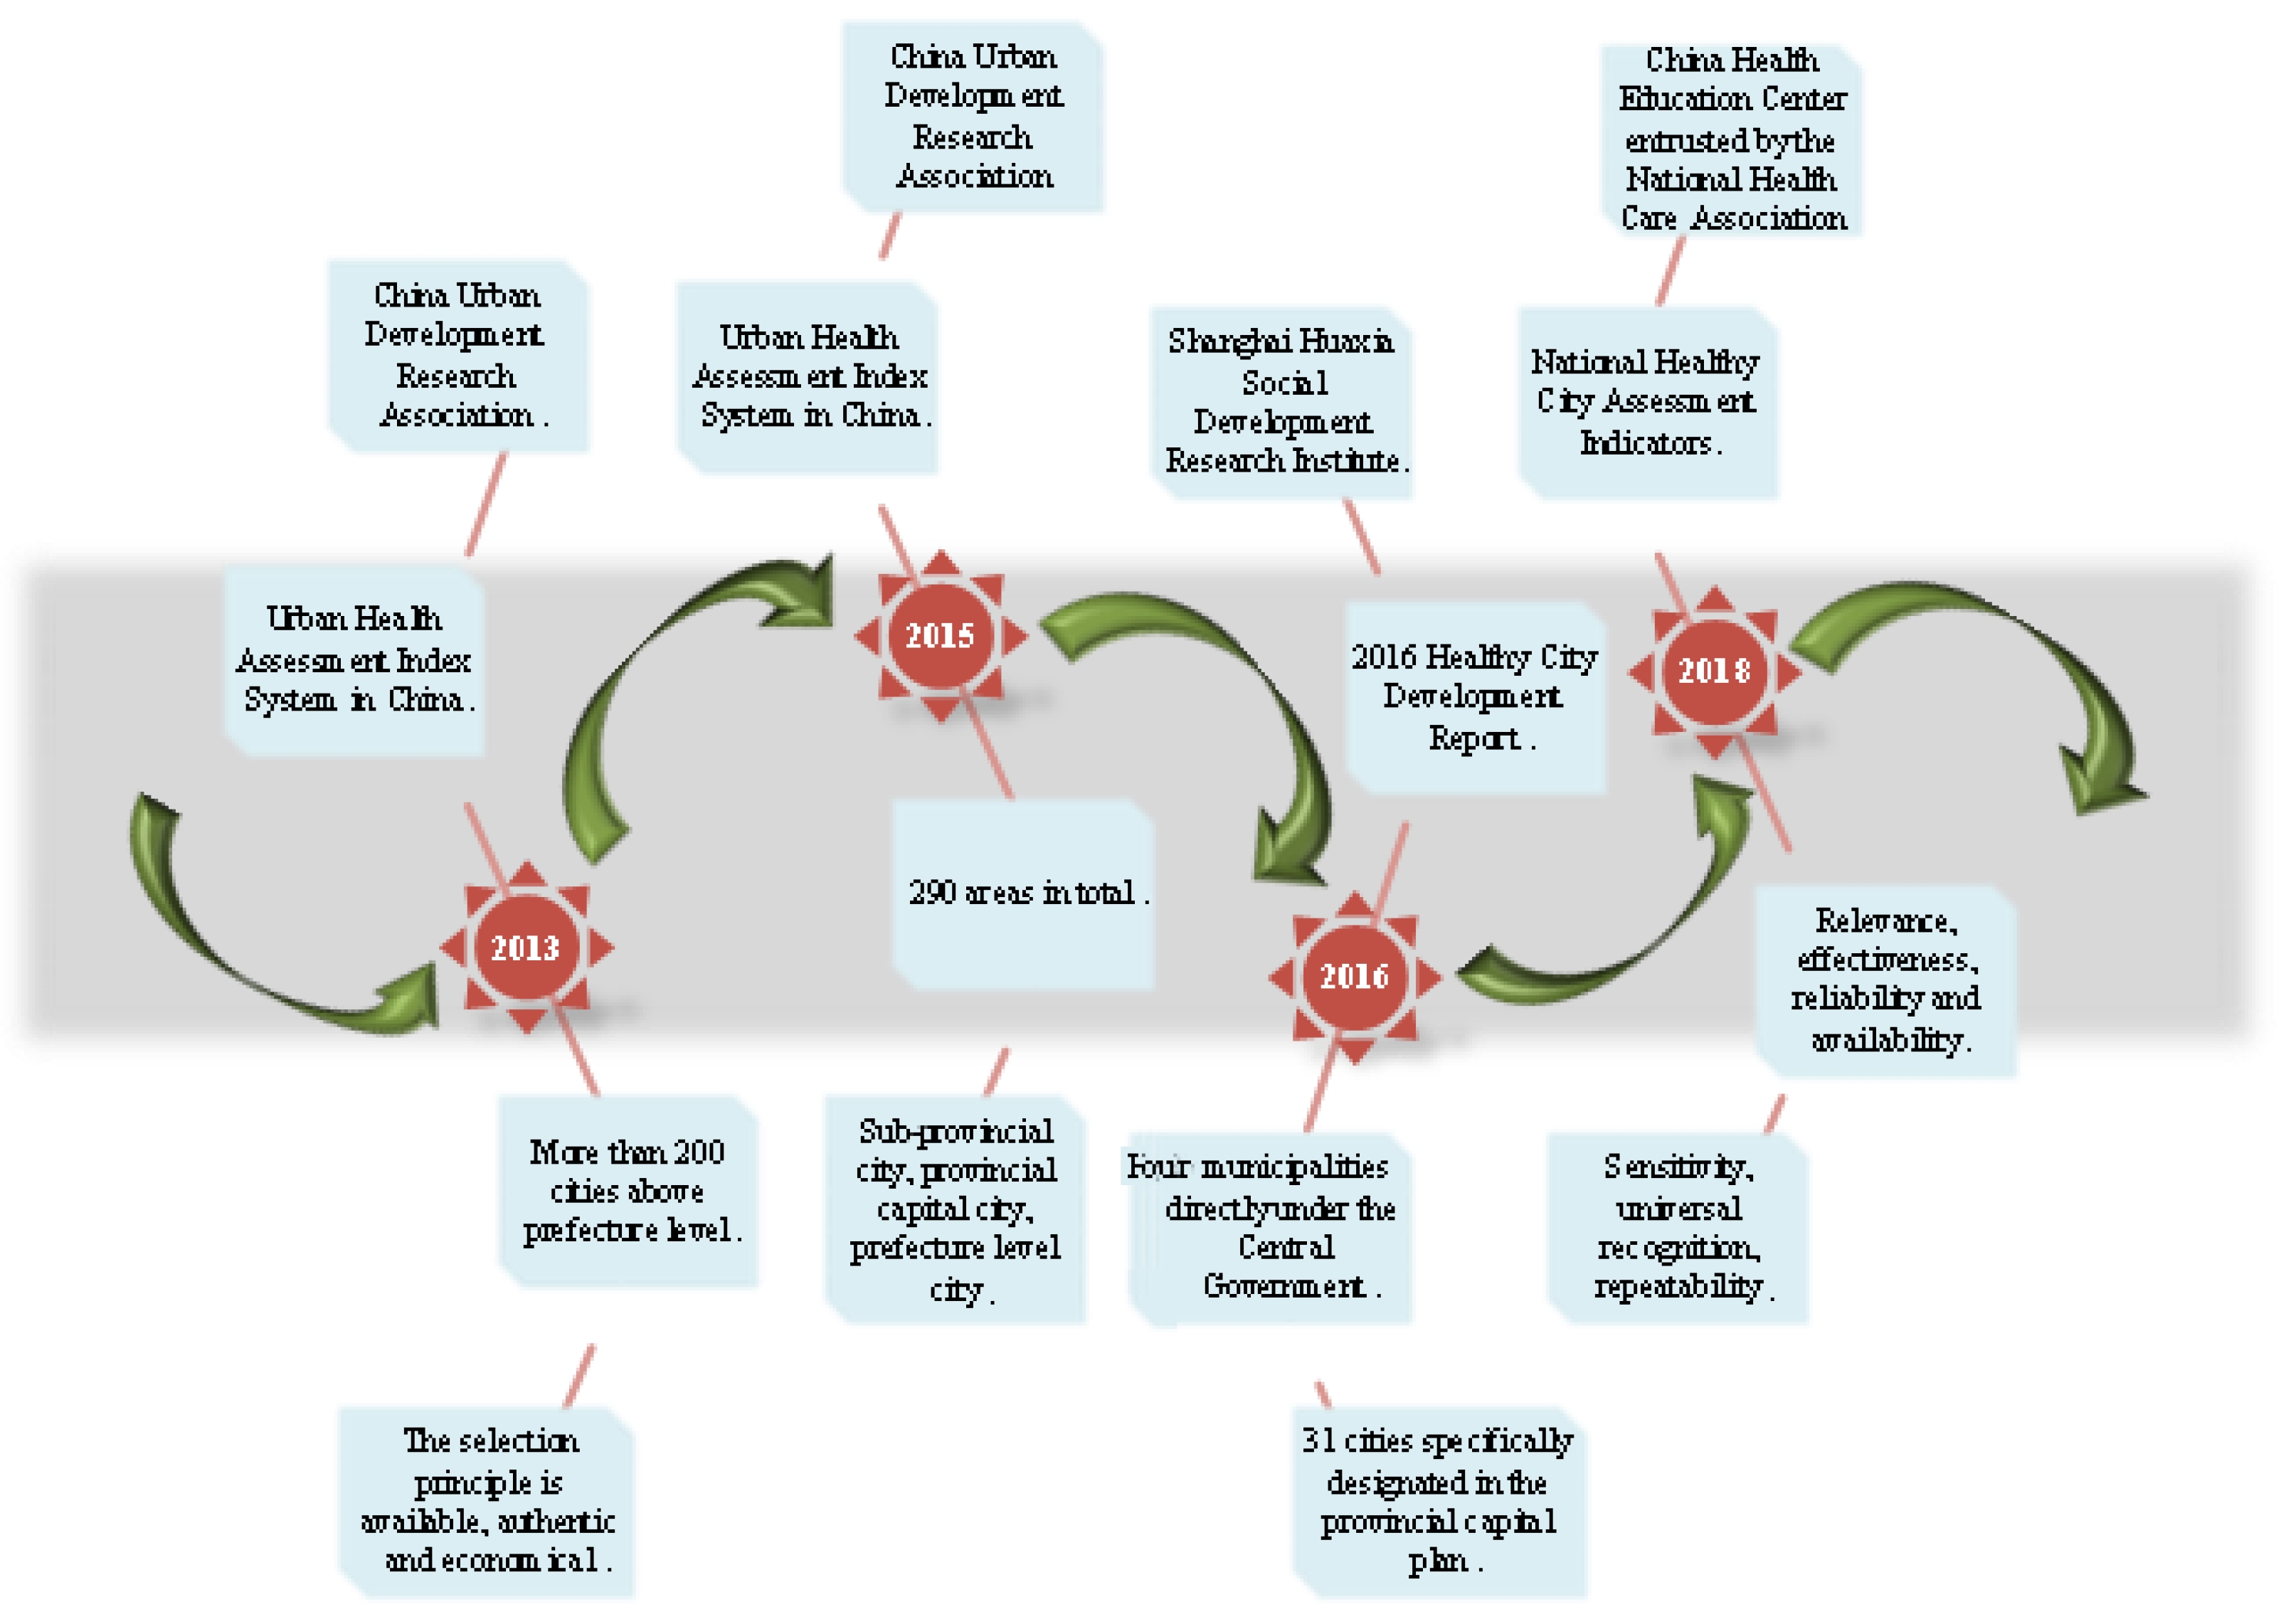
Figure 2 displays the development process of China’s sustainable city index system.
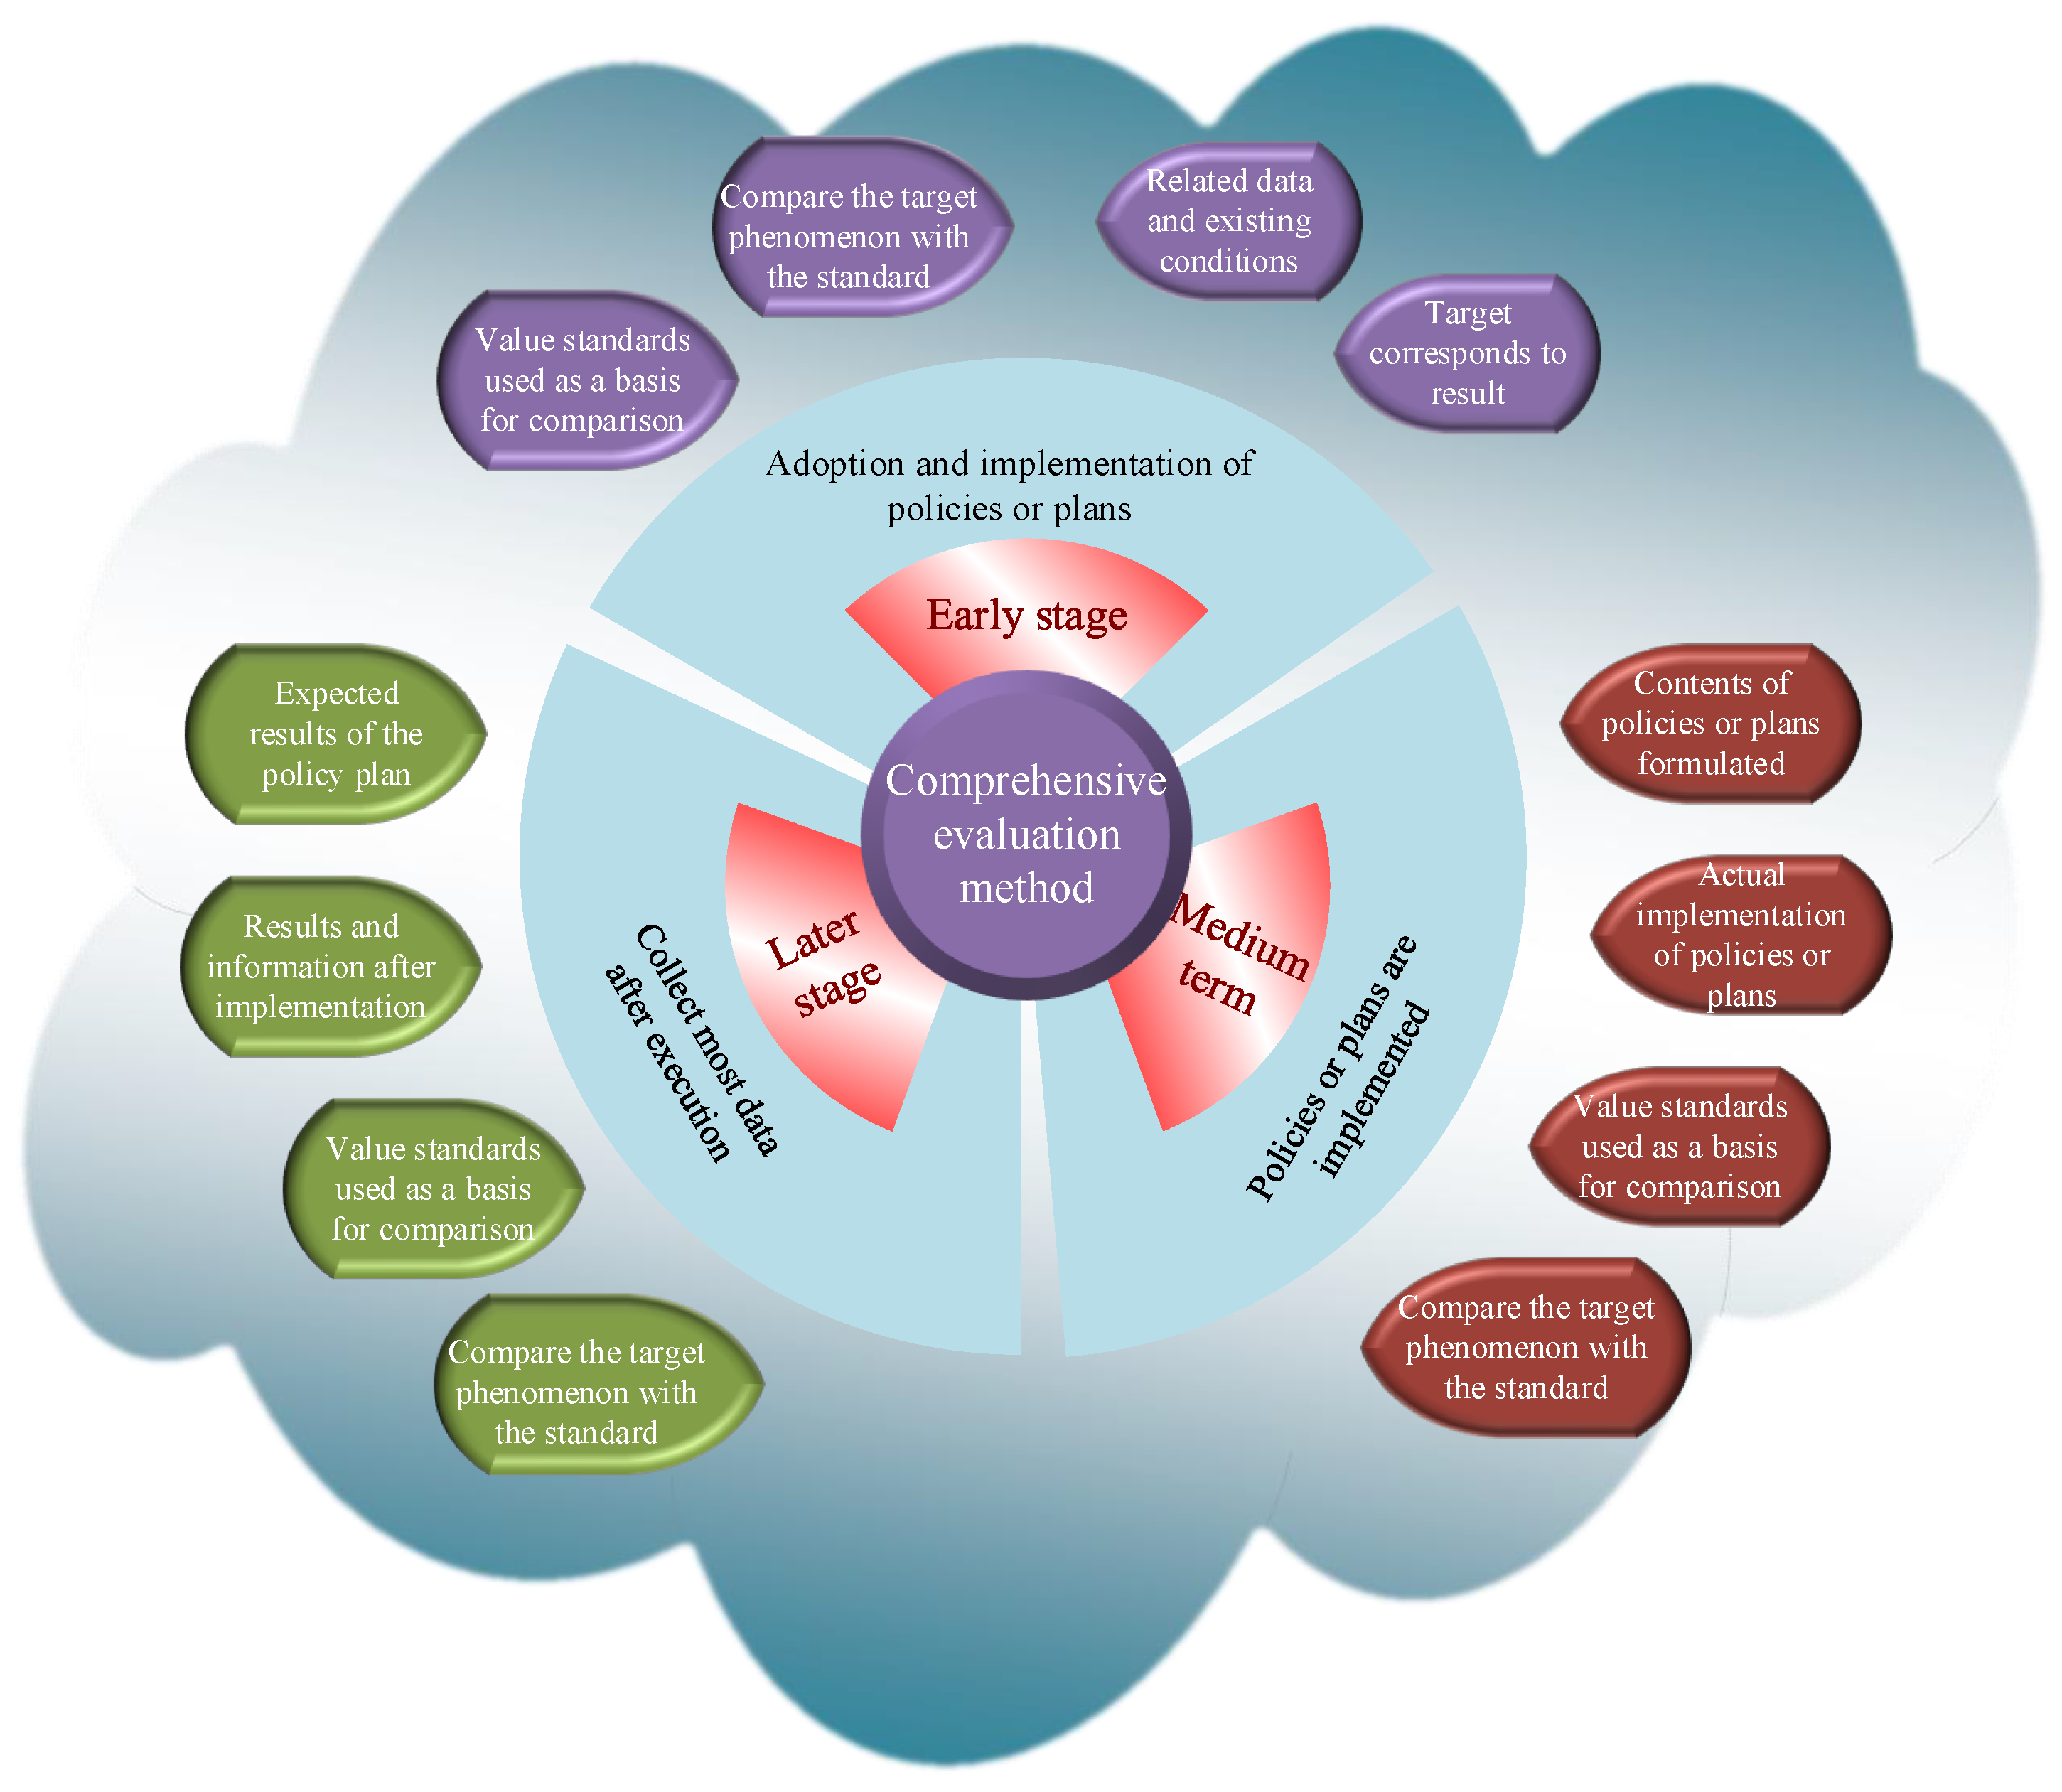
The comprehensive policy model is a framework for assessing the efficacy of a policy by analyzing its inputs, processing, and outcomes objectively and qualitatively [
23]. Evaluating the success or failure of a policy is a lengthy process that begins with planning, formulation, and implementation [
24]. To objectively assess the evolutionary process and the contributing elements, it is necessary to analyze each of the three stages from input to output of the policy rather than to look at the policy’s effects in isolation [
25].
Figure 3 illustrates this three-stage evaluation method.
This work uses the composite control method for the policy analysis model to assess the results of policies following the aforementioned criteria. The DID method serves as the basis for this enhanced approach, which is utilized frequently in the evaluation of both policies and projects. The policy is appropriate for all groups since it does not intervene before something happens and interferes with only one group after it has already occurred [
26]. Standard terminology designates the group that does not get the intervention as the “control group,” while those who do receive it are referred to as the “treatment group” [
27]. The causal effect of the policy intervention on affected individuals is expressed in Equation (1).
In Equation (1), denotes the average result of the treatment group after the event; refers to the unobservable counterfactual result; stands for a dummy variable, indicating the treatment status. When , indicates that the individual receives treatment; when , means that the individual does not receive treatment.
3.2. Design of the Evaluation of the Intervention Effect of China’s Sustainable City Policy
The Chinese cities of Jinan, Dalian, Changchun, Suzhou, Hangzhou, etc., all became “pilot sustainable cities” by the end of 2016 [
28]. The pilot cities serve as the treatment group for the randomized trial; other cities not affected by the policy are used as the control group. This group uses the predictor variables to synthesize the “counterfactual” results of the treatment group, i.e., the situation of the assessed variables without the implementation of the pilot policy [
29]. The efficacy of the policy can be judged by comparing the difference between the actual results of the evaluation variables and the synthetic results, which can be achieved by calculating the standard error of the difference between the two.
According to the composite control method, it is assumed that there are
observation samples of cities. The first city is a pilot city; the remaining
are unsustainable cities which are used to synthesize pilot cities. The period of observation is
period. The pilot policy of sustainable cities is implemented at
.
denotes the composite index of sustainable cities at moment t when city i is not in the pilot policy intervention, and
indicates the result observed when it is in the policy intervention. Equation (2) describes the policy effect of sustainable cities.
For the pilot cities, the results of
after the policy in
period cannot be directly observed. Here, the factor model is used to estimate the “counterfactual” sustainable city composite index:
where
represents the time trend, that is, the time-fixed effect affecting all cities;
signifies a control variable that is not affected by the sustainable city pilot policy;
refers to a
-dimensional unknown parameter vector;
denotes a
-dimensional unobservable common factor vector;
indicates an
-dimensional unobservable city fixed effect;
stands for the unobservable short-term impact of each city, and its mean value is 0. Let the
-dimensional weight vector
satisfy
and
. Each vector
represents a synthetic control group consisting of non-pilot cities, i.e.,
weights of the control group cities [
30]. Equation (4) indicates the weighted result of the outcome variable of each city in the control group.
Suppose there exists a weight vector
. Then:
If
is not singular, there is Equation (6).
During the policy intervention period,
is used as an unbiased estimate of
. Then, the estimated value of the sustainable city pilot policy effect is written as Equation (7).
The synthetic control weight vector required in the above estimation can be calculated according to the Synth function in the Synth package in R software.
3.3. Dynamic Elements and Dynamic Model Construction of Sustainable City Development
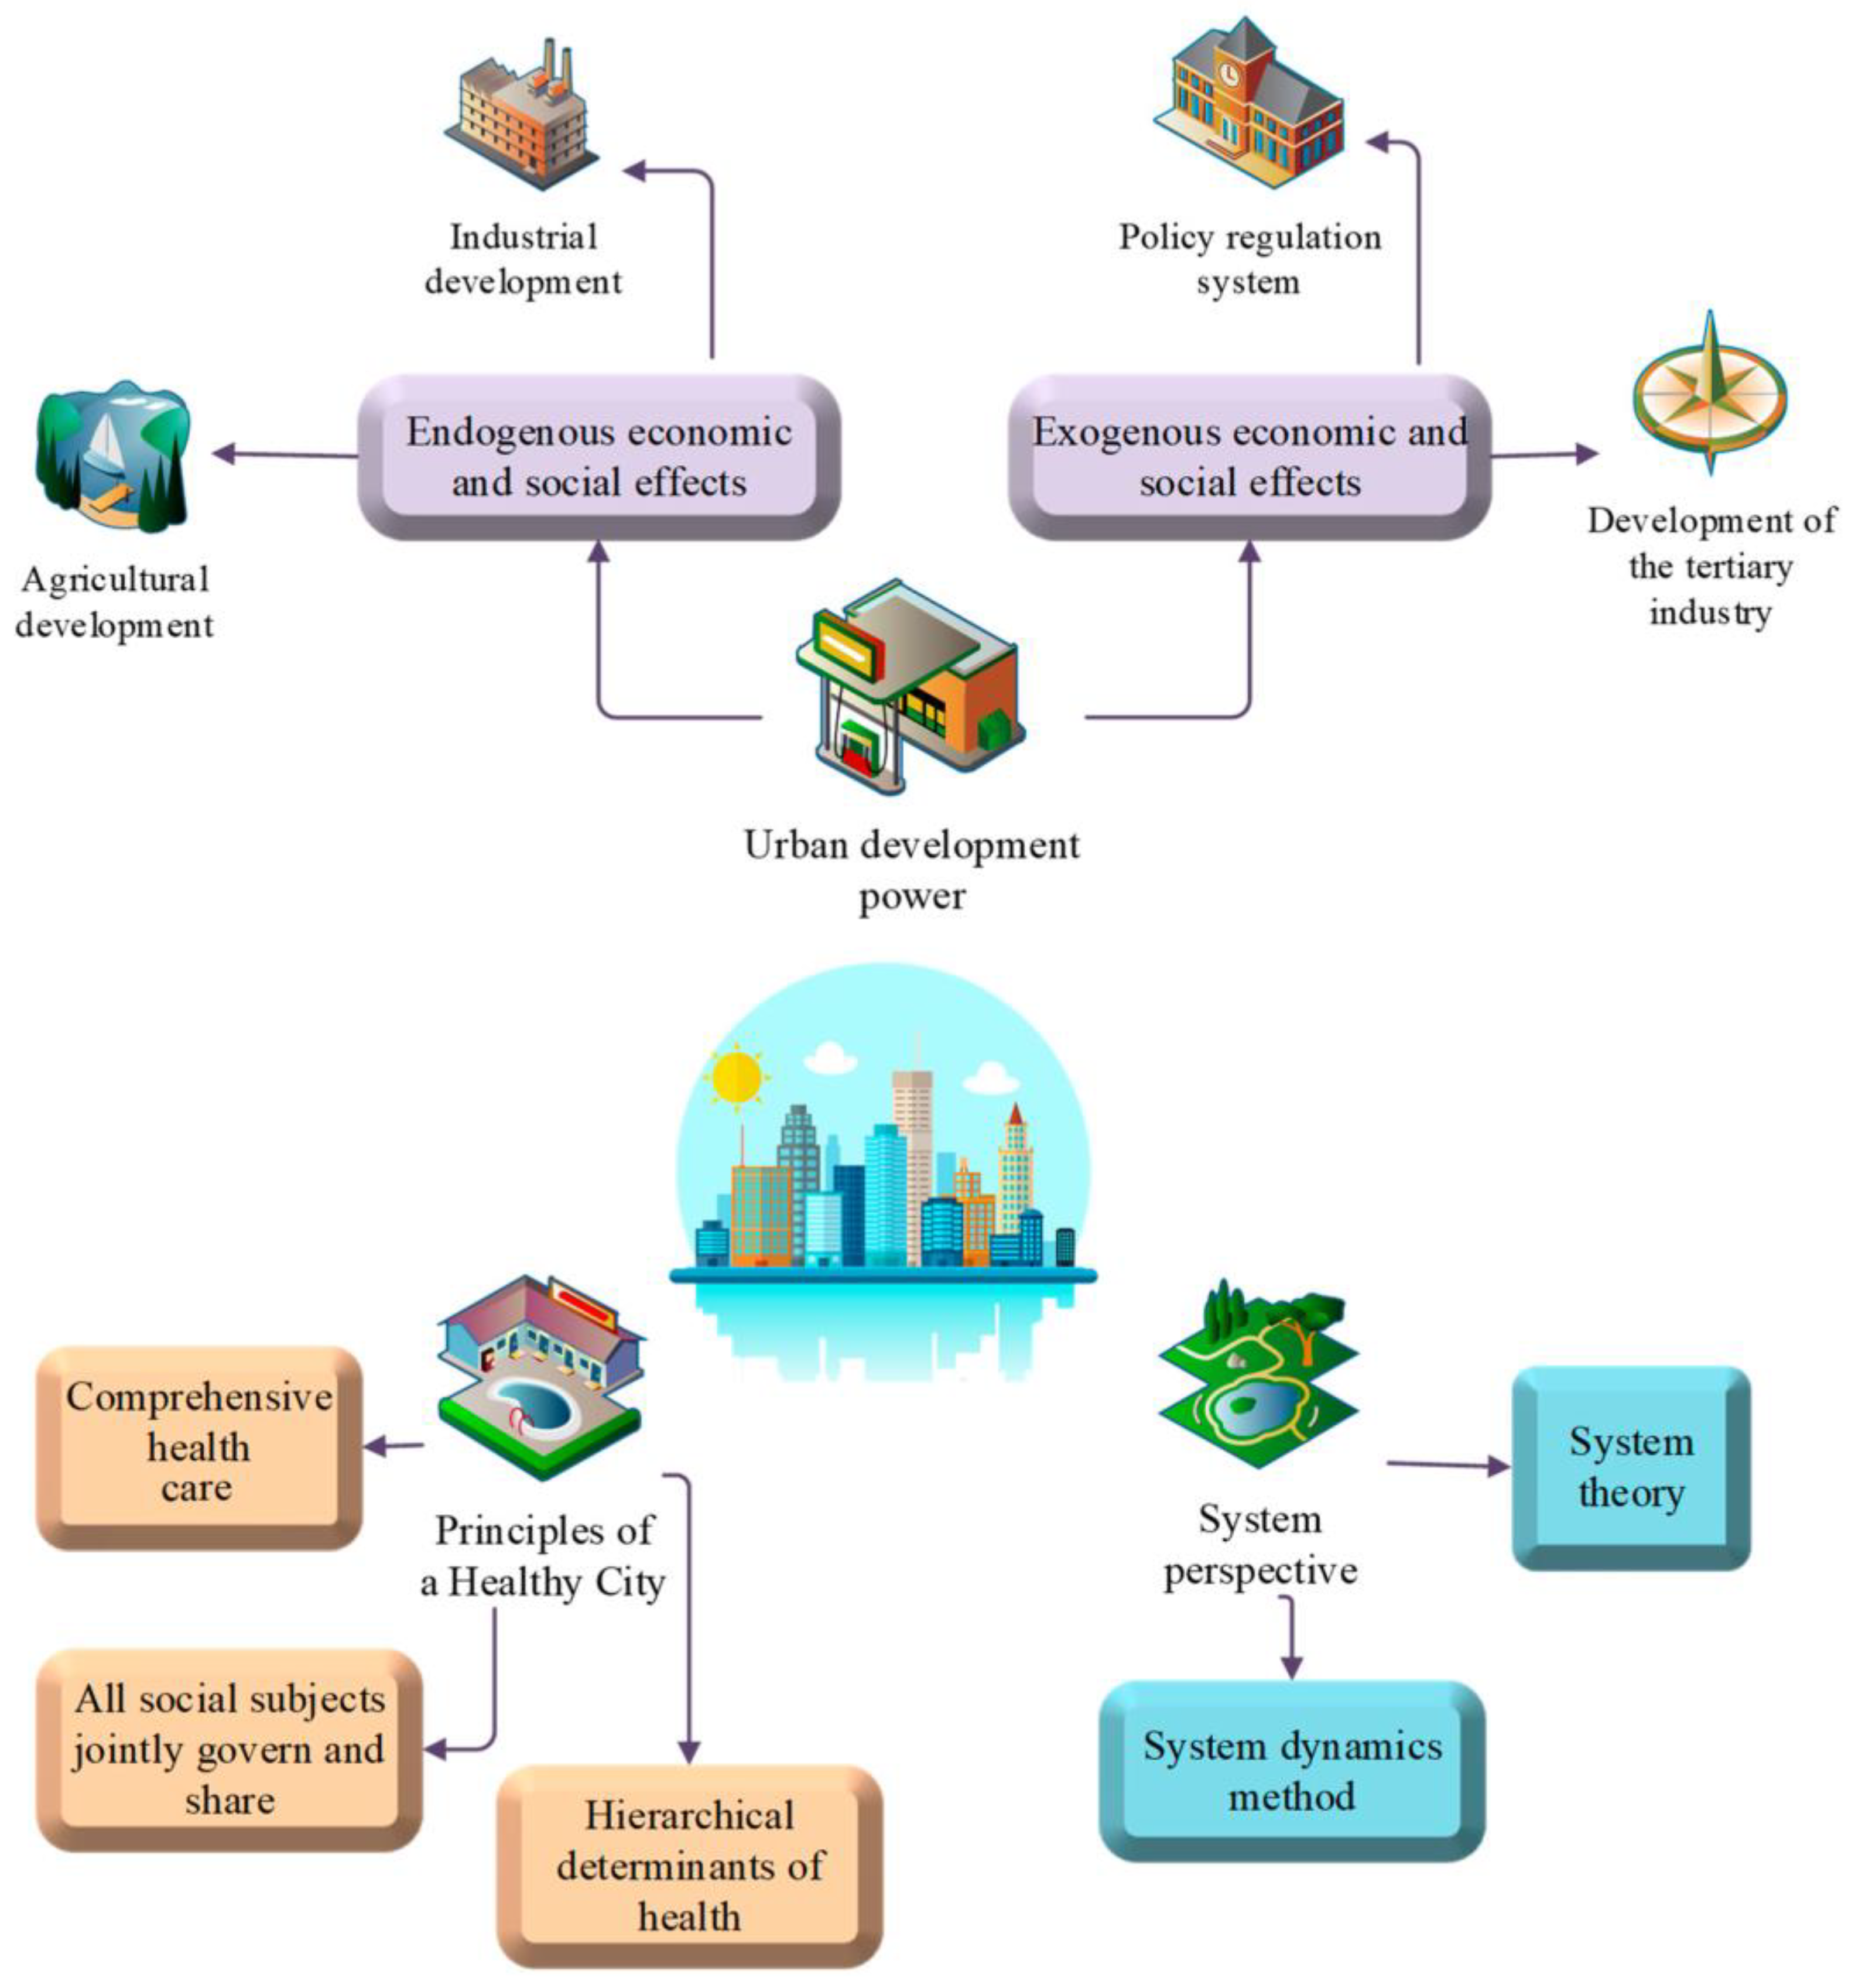
As a result of their complexity and flux, urban settings lend themselves to the rich implications of urban health and the idea of health determinants [
31]. Therefore, systematic thinking generally solves the practical problems encountered during the construction of sustainable cities.
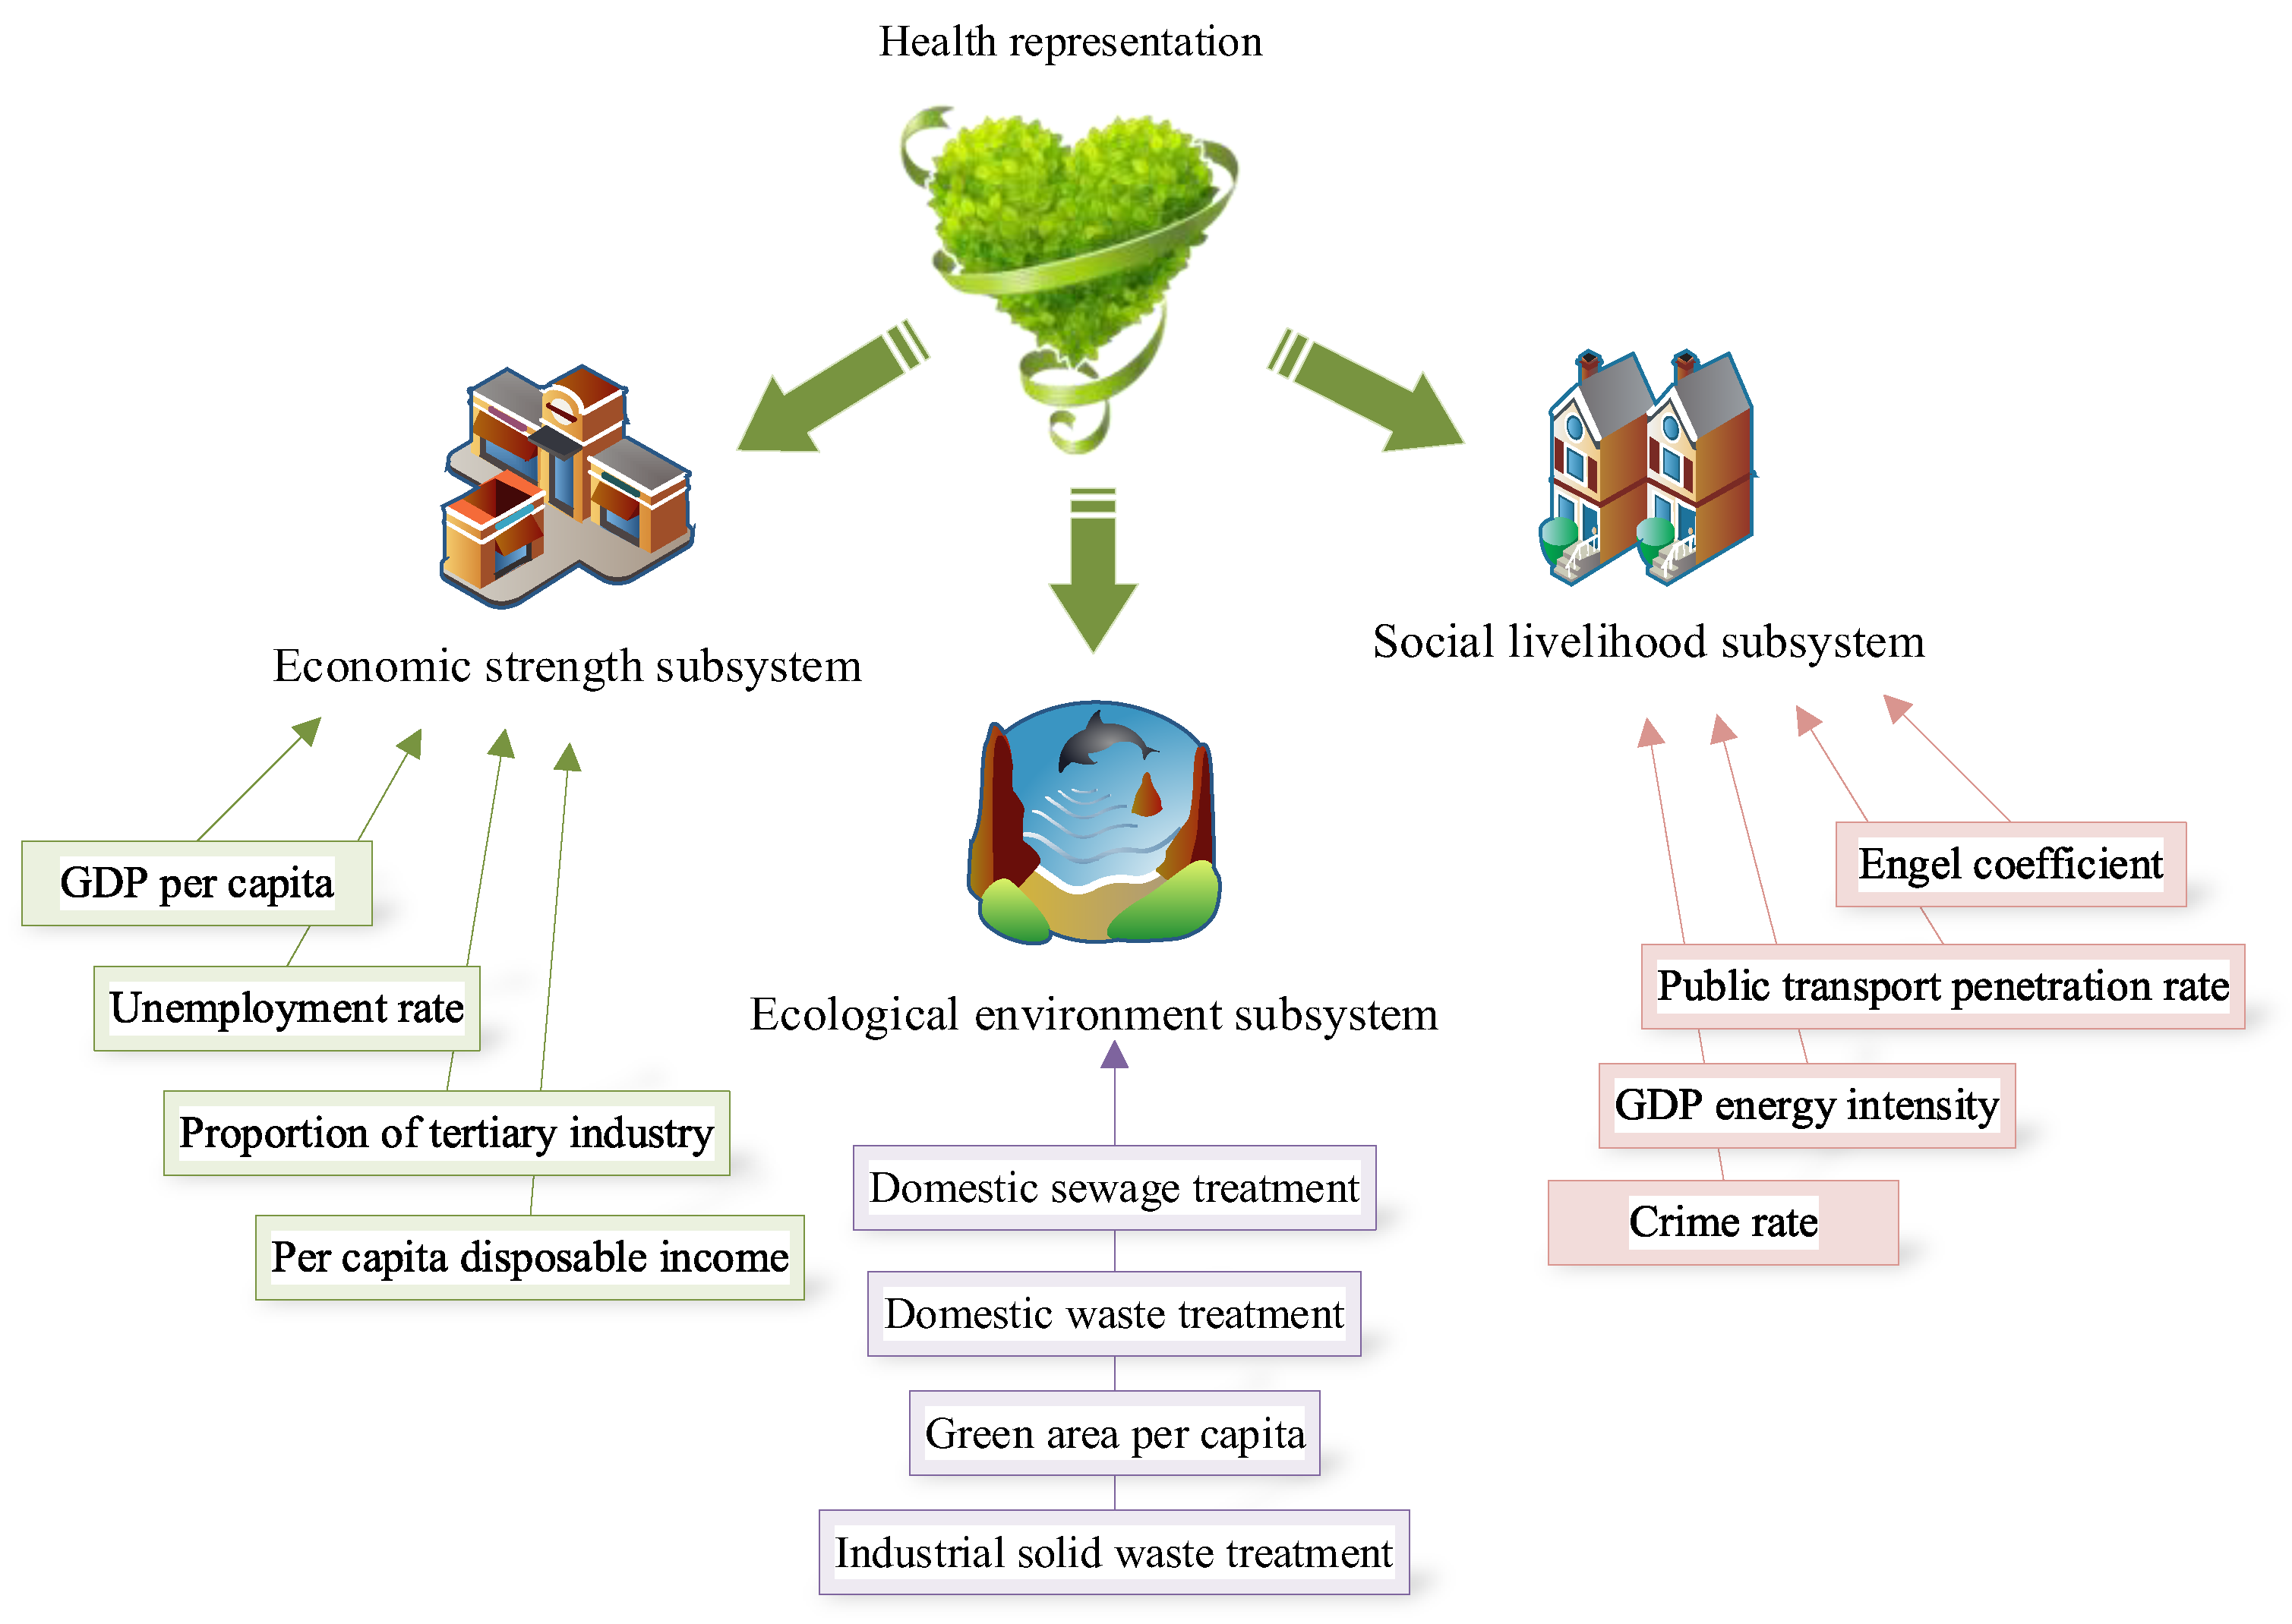
Figure 4 illustrates the theoretical framework for the dynamic mechanism of sustainable cities.
The sustainable city movement is driven by health promotion theory, and the intervention methods of sustainable cities directly affect the determinants of health at different levels [
32]. As shown in
Figure 5, this work divides the urban health system into three functional levels to identify its dynamic mechanism: economic, human settlement, and ecological elements.
The action law of the kinetic factor can be obtained by simulating the level of each stage independently and comparing the results. Adjusting the kinetic factor requires setting several orderly change sub-orders [
33]. Assume that the government has a specific overall input capacity. The two options are to (1) use 35% of the input strength from one aspect and evenly distribute that percentage over the other five aspects, or (2) use 5% of the input strength from each of the other five aspects to support the input to the adjustment variable [
34].
Table 1 lists the set simulation scheme.
After outputting the results under different schemes, comparing the comprehensive health levels of cities expressed in different results is necessary. Following the normalization of the model’s output index data, the comprehensive healthcare system determines the health status of each subsystem using the system index determined via the entropy weight approach [
35]. The procedures for the calculations are as follows.
The data are positively normalized to obtain the initial evaluation matrix, where denotes the year to be evaluated, refers to the evaluation index, and stands for the value of the evaluation index in the jth item in the ith year.
Calculate the share
of data for year
i under the
jth indicator in the sum of data for all years of the indicator.
Solve the information entropy
for the
jth index value.
In Equation (9),
k =
, ln represents the natural logarithm, and 0 ≤
≤ 1.
Calculate the weight
of each indicator
.
Calculate the evaluation score of the
ith year. In other words, the following comprehensive city health assessment model is developed based on the entropy weight method.
In Equation (12),
represents the comprehensive health city index of the sample in the
ith year. If
yi is high, then urban health in that year is outstanding [
36,
37].
4. Result and Discussion
4.1. Result
4.1.1. Synthetic Weight Distribution of Pilot Cities
This work uses the comprehensive score of sustainable cities as an evaluation variable to measure the effect of the pilot policy. This section uses the non-pilot cities as a control group, and the six pilot cities announced at the end of 2016 as the treatment group.
Table 2 lists the weights that contribute to the total score for healthy cities using the synthetic control method.
The pilot cities are divided into three categories according to their characteristics and environments. Beijing is a first-tier developed city; Jiangsu, Zhejiang, and Shandong are second-tier coastal cities; Sichuan and Xinjiang are underdeveloped cities.
4.1.2. Trend Analysis of the Synthetic Value of Pilot Cities
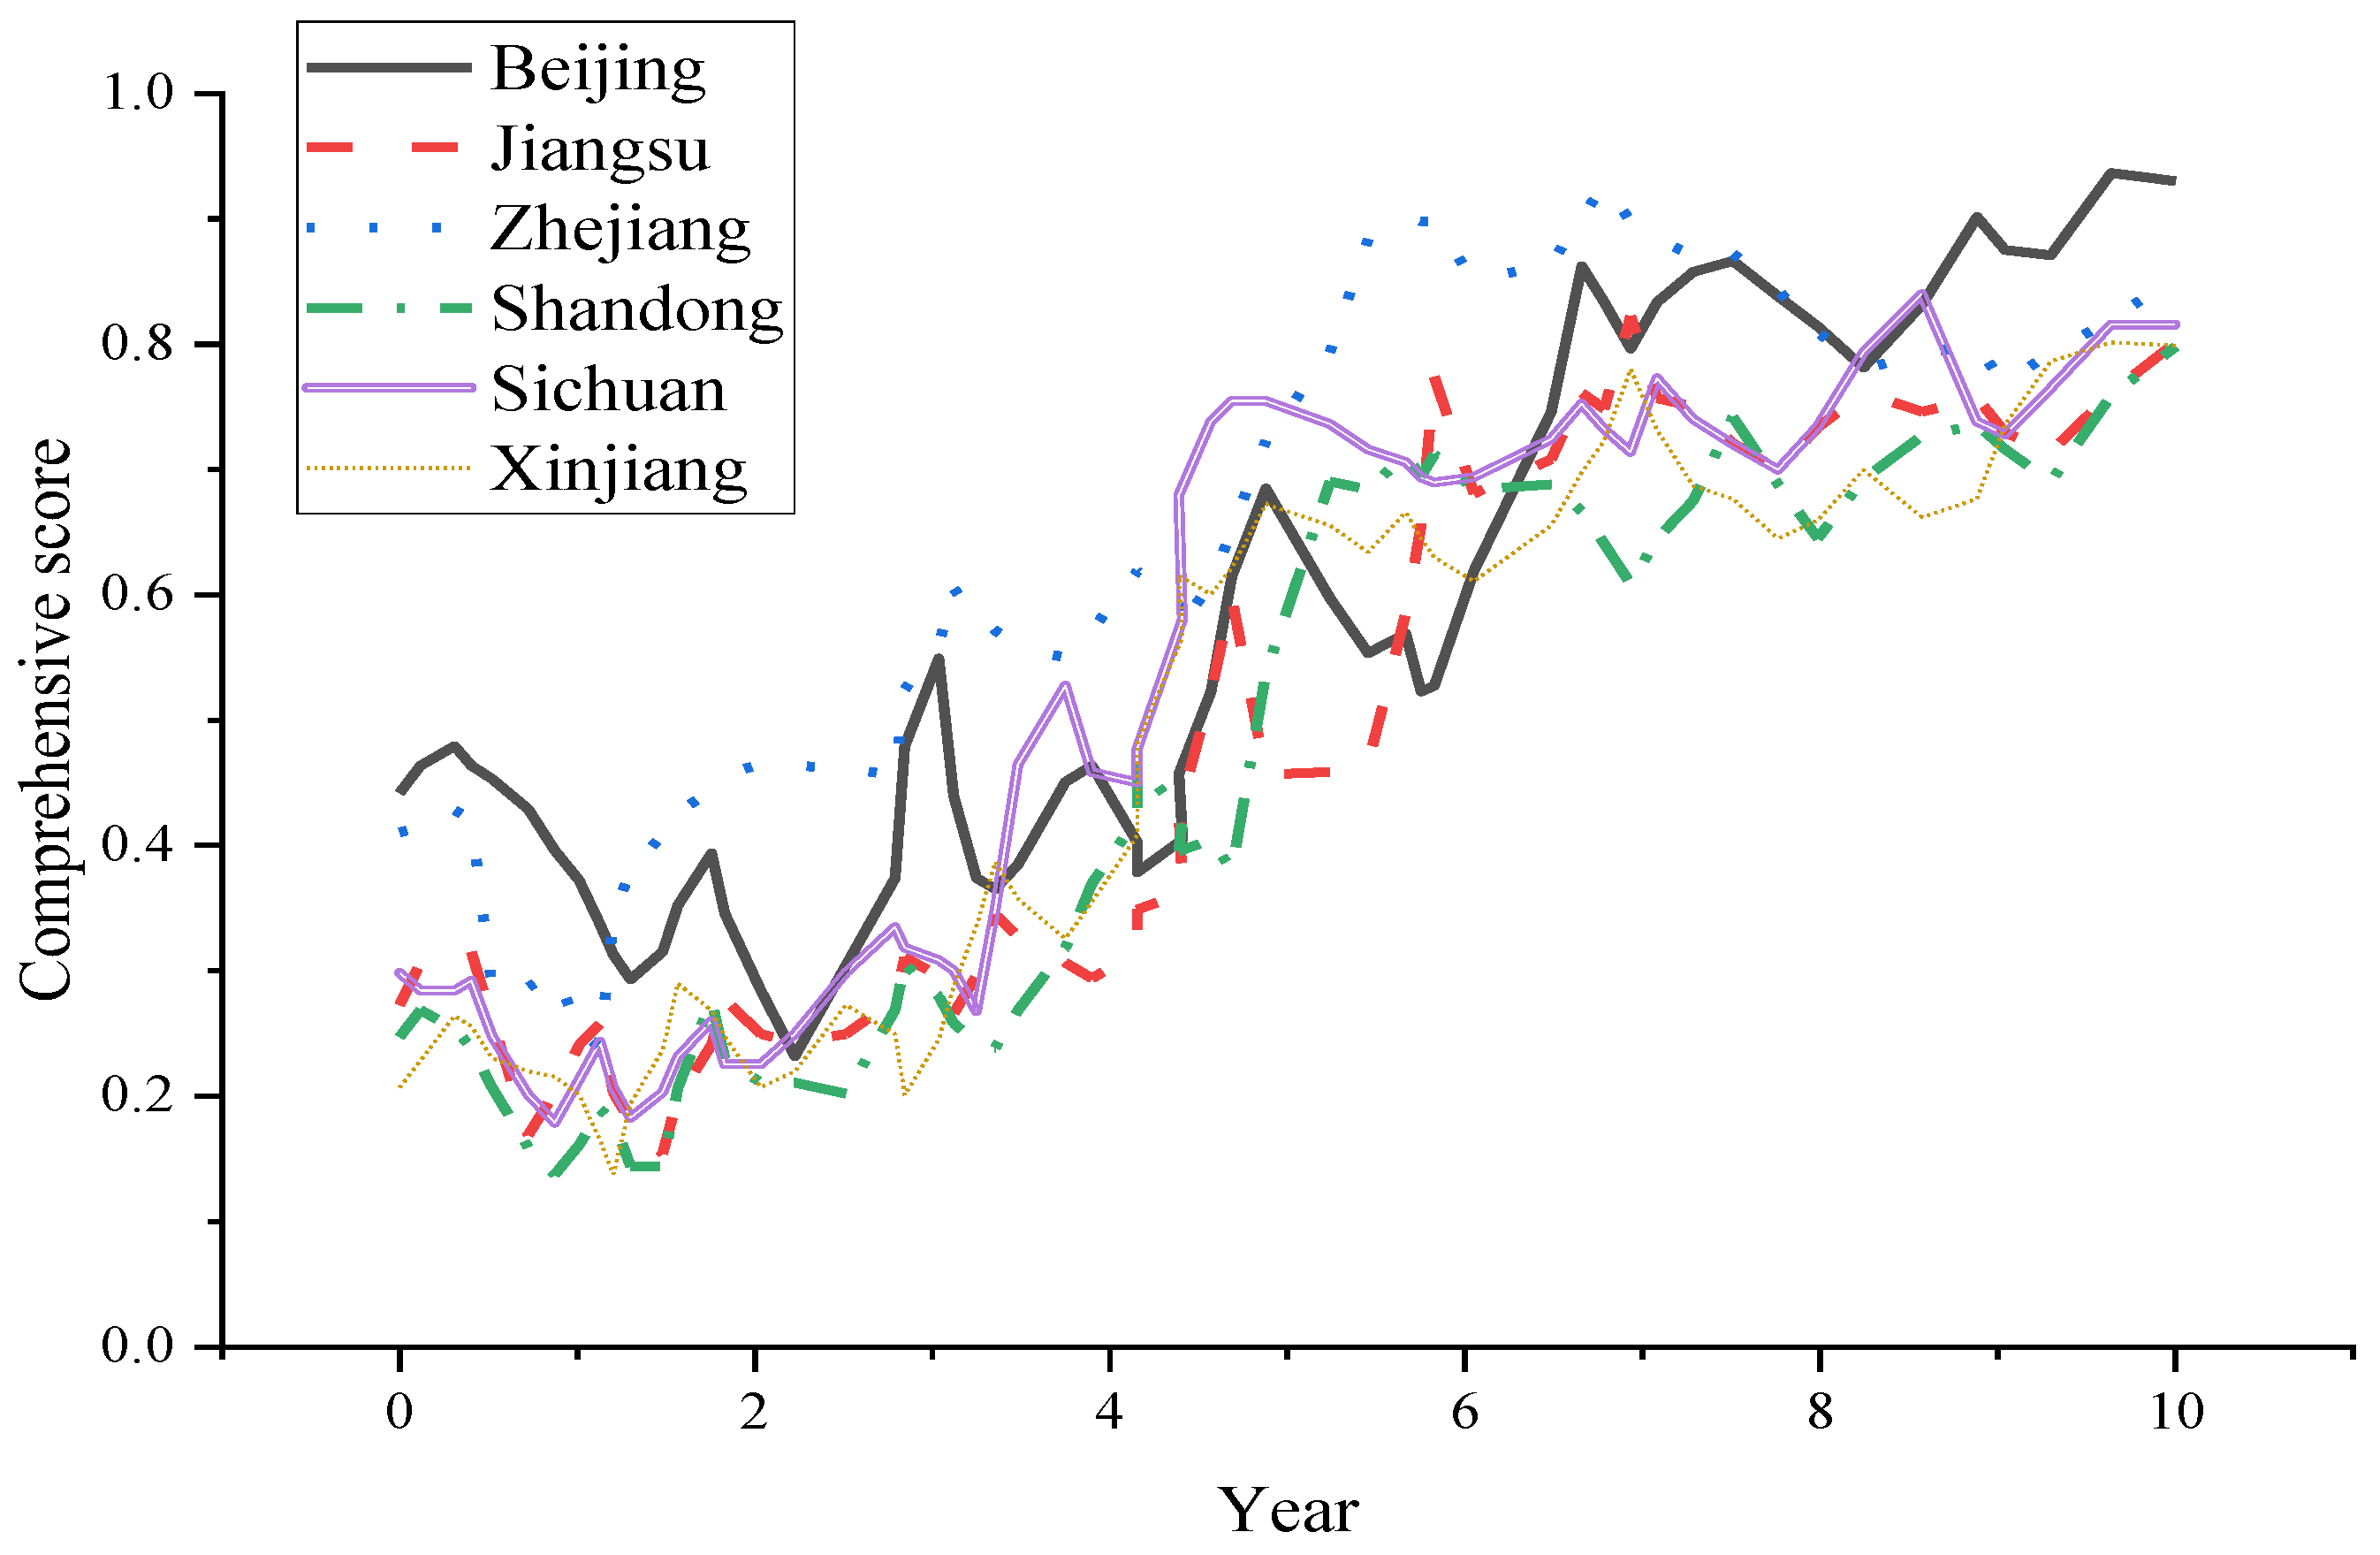
Figure 6 presents the changing trend of the synthetic value of the comprehensive score of the pilot cities over time.
Figure 6 suggests the combination of non-pilot cities can be a good fit for the characteristics of the pilot cities before the policy. The policy has proven highly favorable to the growth of the pilot cities. In addition, the composite values of Beijing, Zhejiang, and Jiangsu were divorced in 2016; those of Sichuan and Xinjiang were divorced in 2017; Shandong had a positive influence early on in the policy’s rollout but a negative impact later on.
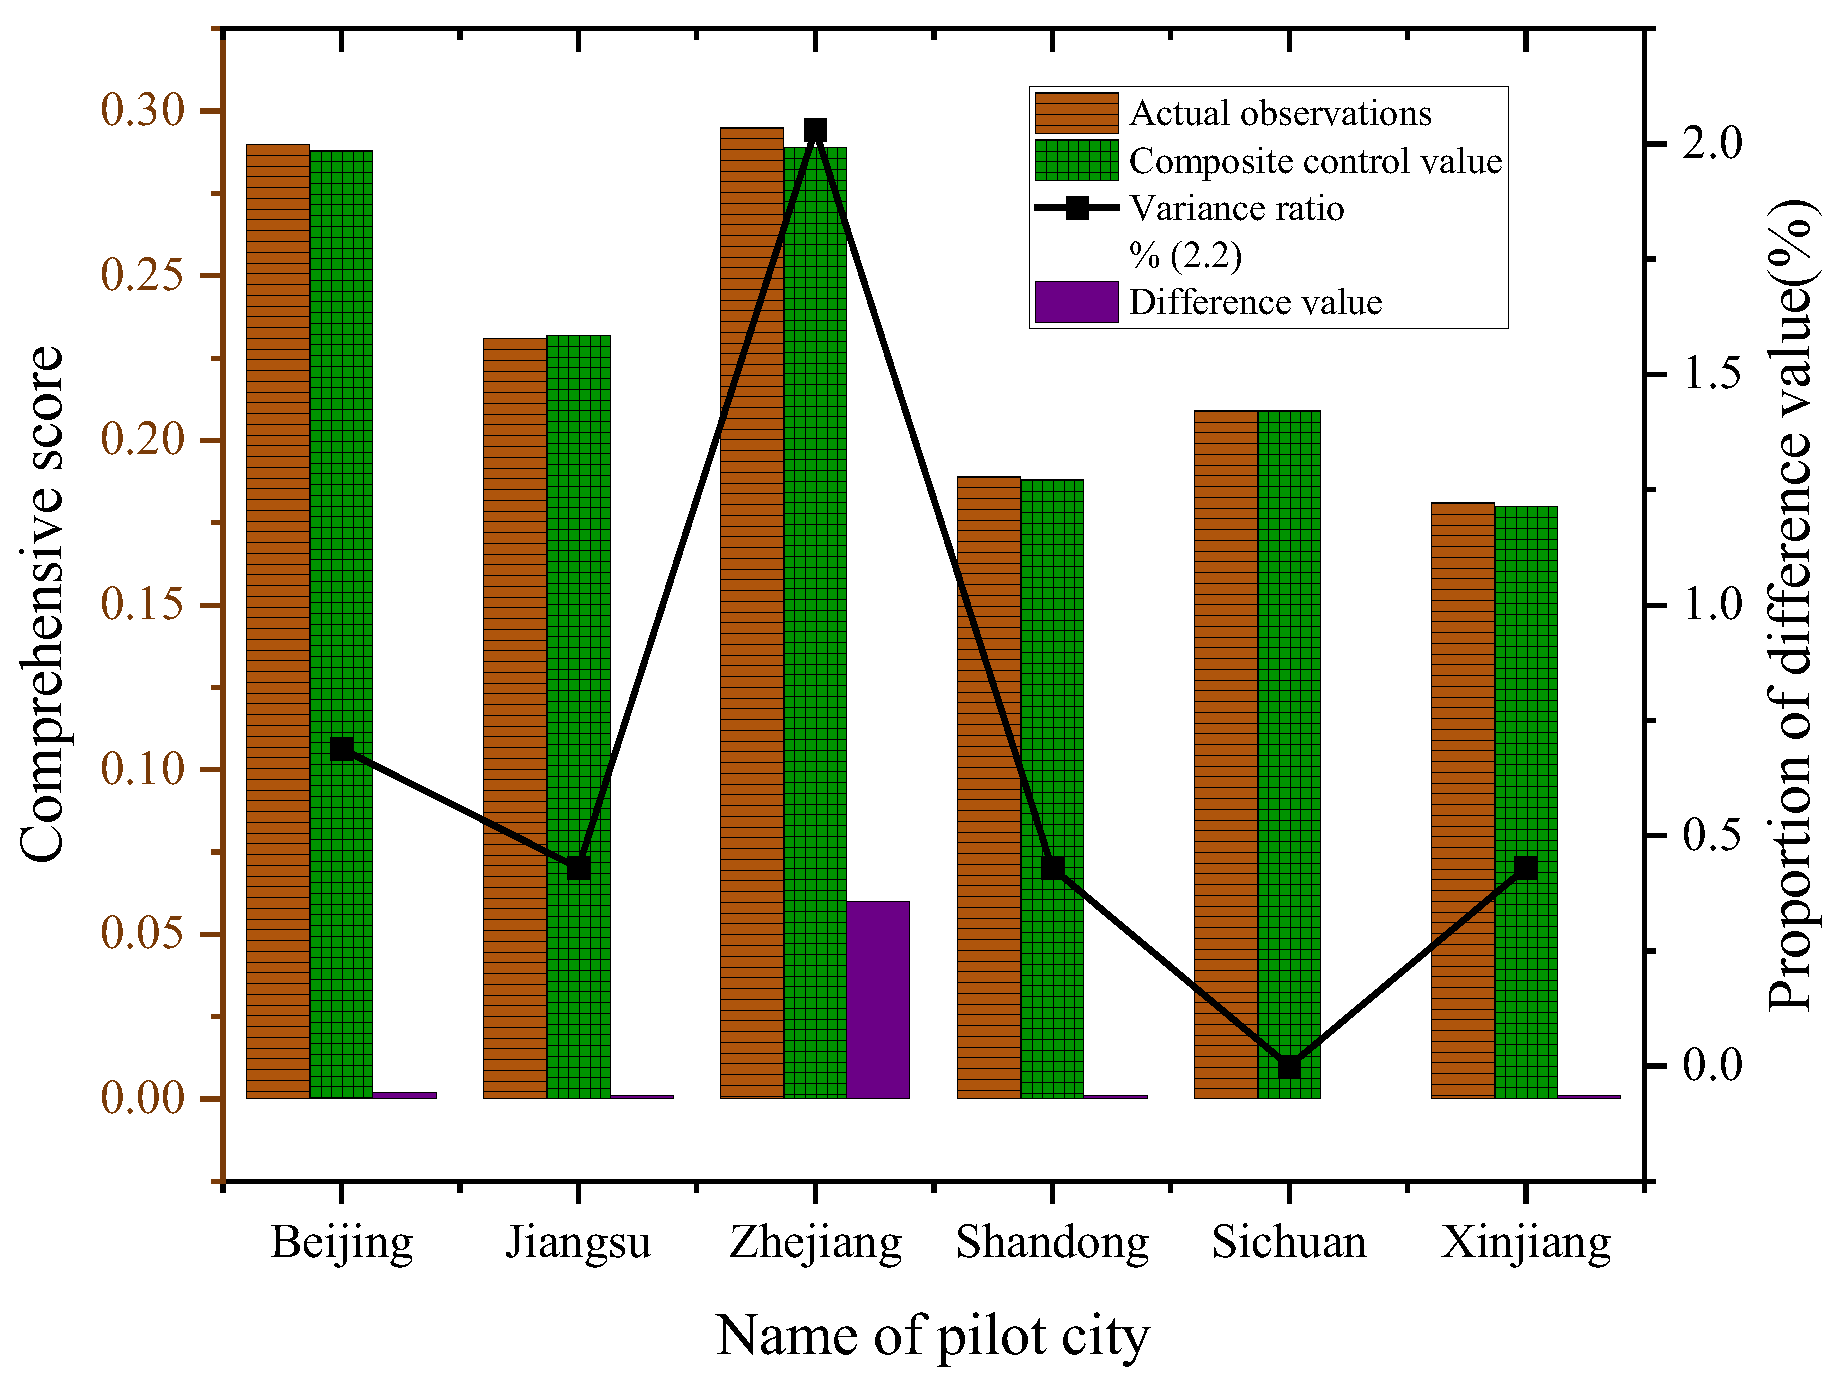
Figure 7 provides the difference between the observed value and the composite value of the comprehensive score of the pilot cities.
Figure 7 compares the actual value and the synthetic control estimated value of the comprehensive score of the six pilot cities before implementing the sustainable city pilot program in 2017. Throughout all pilot cities, it is clear that the observed value and the synthetic control value are very close. Minimal dissimilarity rates indicate that the produced synthetic control unit is very close to the actual overall pilot city before the pilot. Further tests on the composite results are required to verify the robustness of the predicted results via the Propensity Score Matching-Difference in Difference (PSM-DID) method after using the composite control approach to evaluate the policy effect. Below is a basic description of the estimation procedures used in the PSM-DID. (1) Propensity scores are computed using treatment variables and covariates. (2) All possible matches in the control group are found for each individual in the treatment group. (3) The pre- and post-treatment shifts in the outcome variable are determined for each person in the treatment group. (4) Before and after alterations are determined for every control subject paired with a treatment group subject. (5) The instructions are used to perform propensity score kernel matching or local linear regression matching. One benefit is that the PSM-DID method can account for differences between groups that are not directly visible but are stable over time.
The pilot cities serve as a control group, while secondary indicators in the remaining 226 cities are employed as matching variables. The Logit model is utilized to estimate the propensity score. The control group is selected based on the PSM method of kernel matching.
Table 3 shows the net policy effect of the two groups of pilot cities through the PSM-DID method.
Table 3 shows the PSM-DID estimation results of the impact of the sustainable city pilot policy on the comprehensive index. The difference between the experimental and control groups was 0.133 before the pilot and 0.077 after the pilot. The difference became larger after the implementation of the sustainable city policy. The estimated result of the DID is 0.015; that is, the policy effect of the sustainable city pilot is 0.015. Estimated outcomes are uniformly favorable and statistically significant, demonstrating the function of the sustainable city pilot strategy in fostering the development of sustainable cities.
4.1.3. Comparison of Dynamic Simulation Results of the Urban Health System
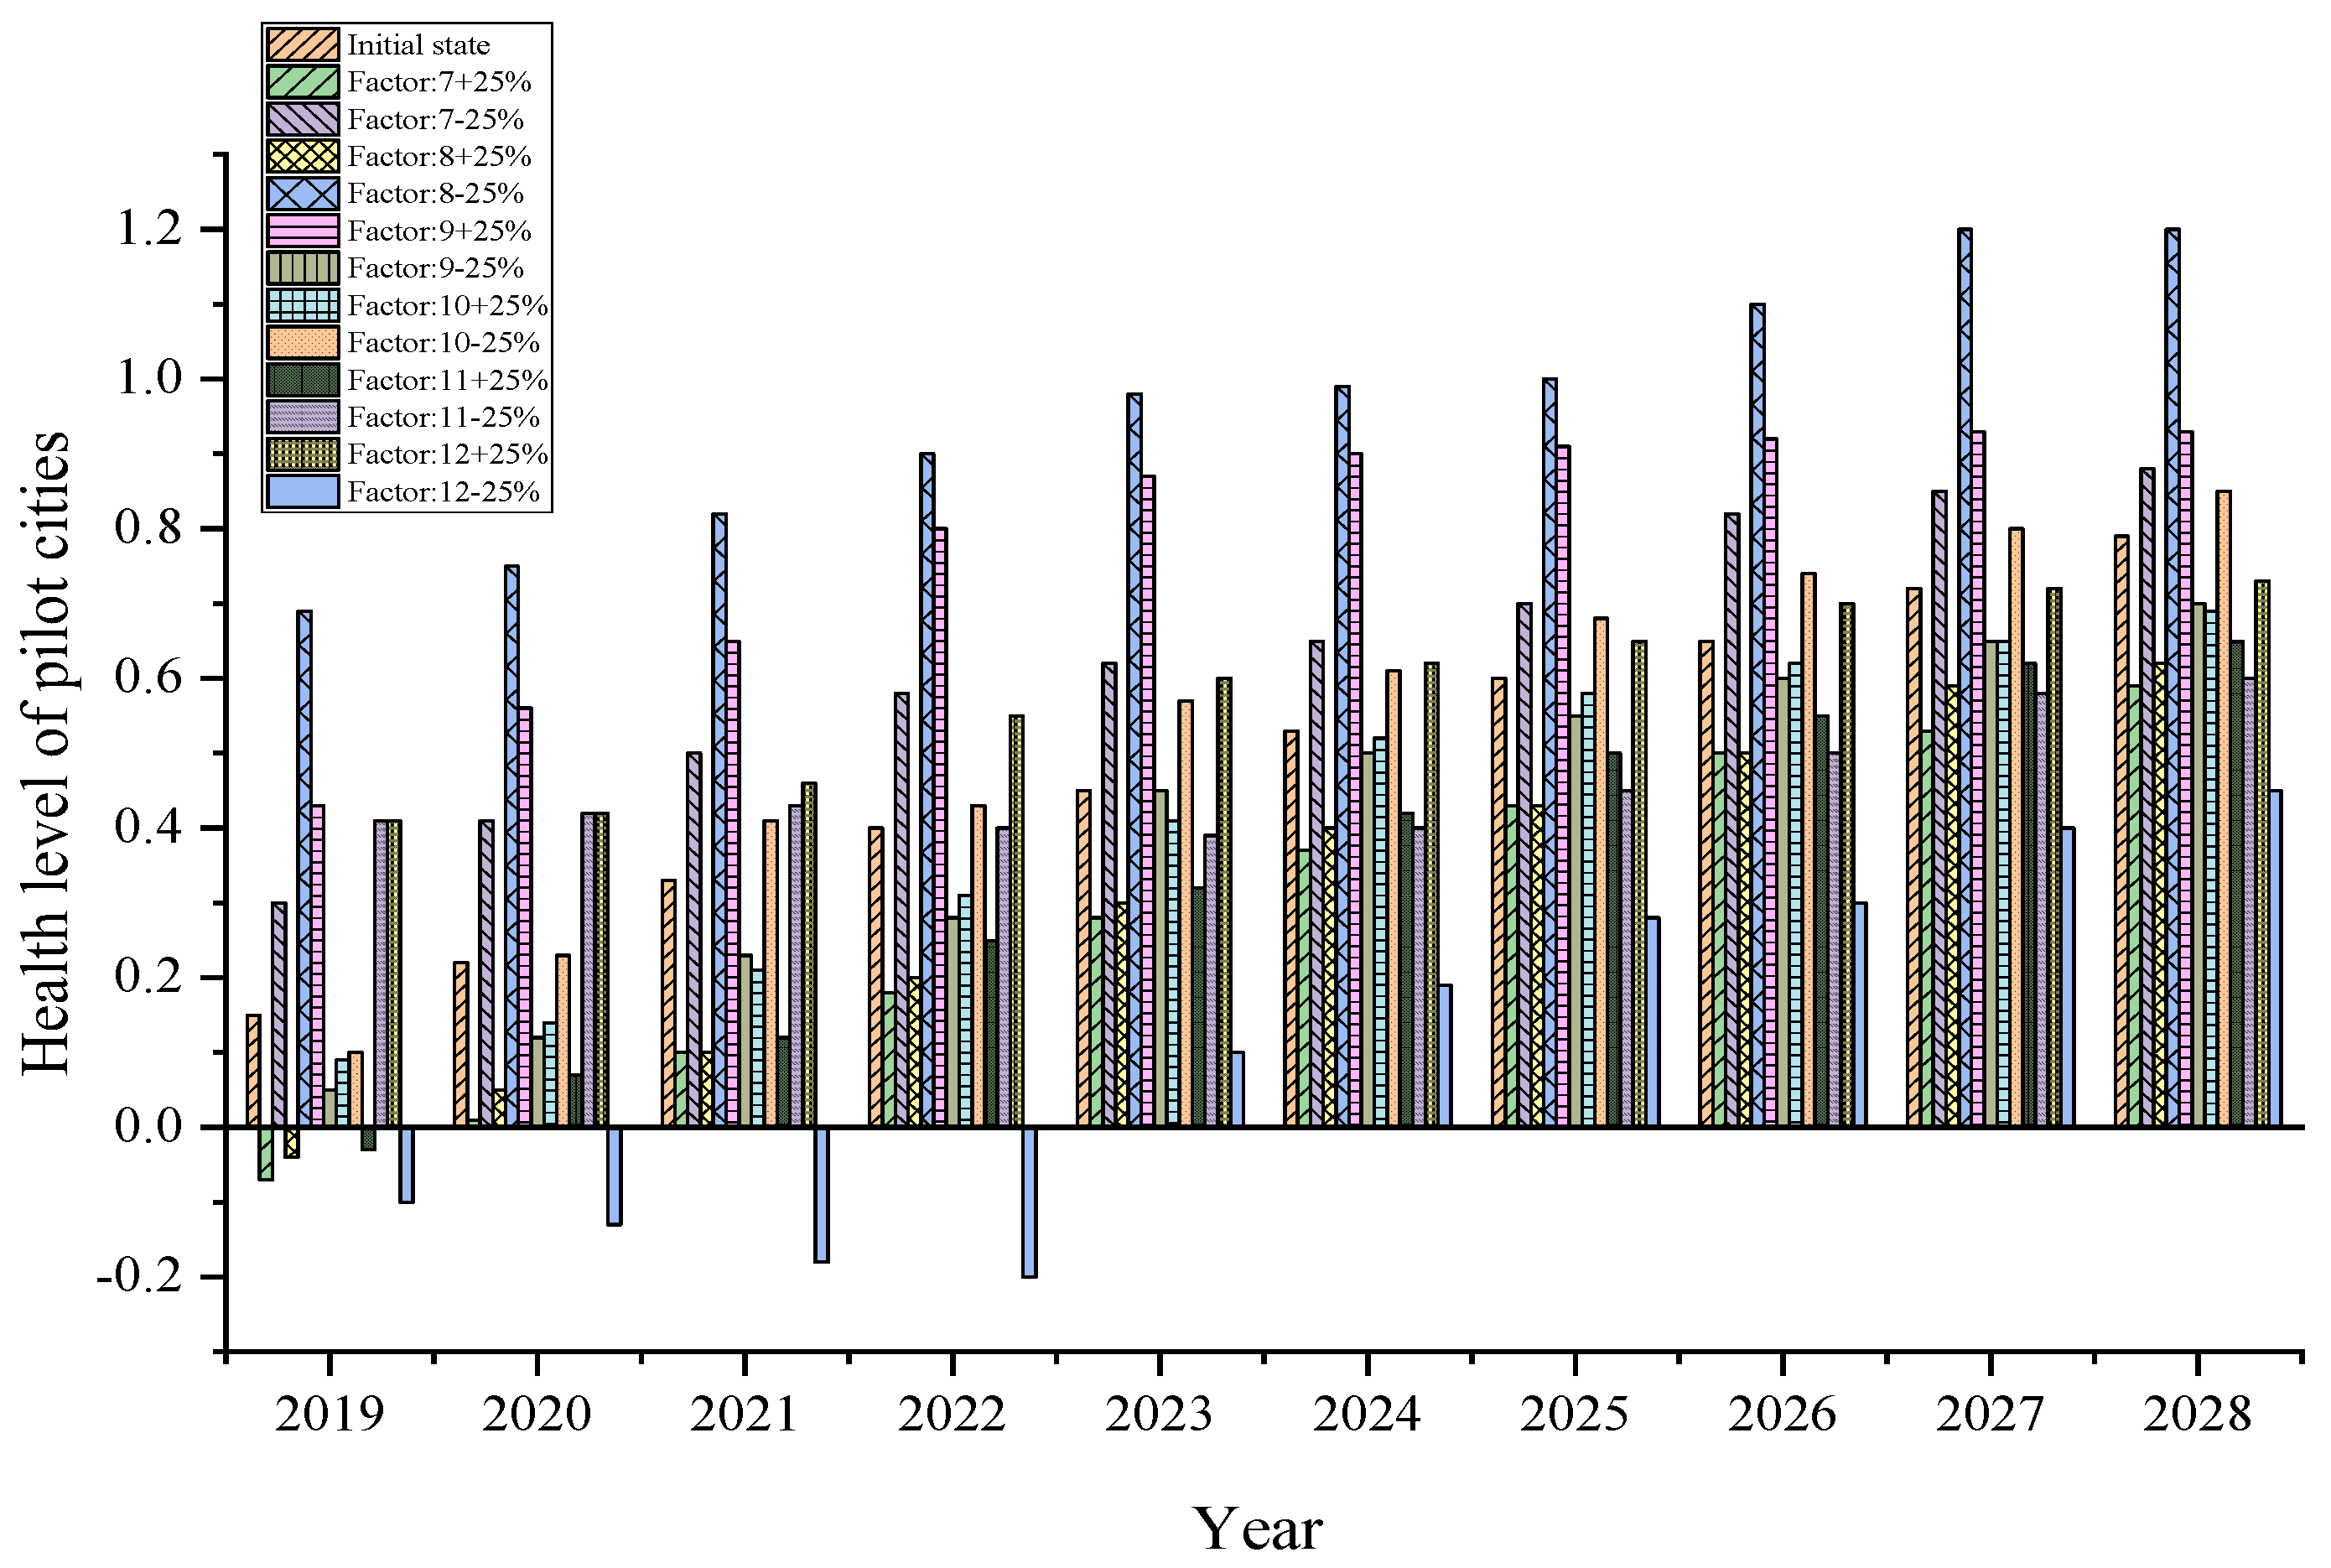
This work uses a 10-year simulation period beginning in 2019, with years as the unit of time and once per year as the change step frequency. Output results using 2019 data from pilot cities are shown in
Figure 8 to illustrate the overall state of each subsystem’s health.
Adjusting the factor parameters uniformly improves the system’s state as a whole and its constituent parts. Increasing inputs are reflected in an upward trend in city health, but the rate of change remains constant. In the medium term, a high degree of urban health can be achieved by focused investment in infrastructure. The ideal option in the long term is the starting momentum state.
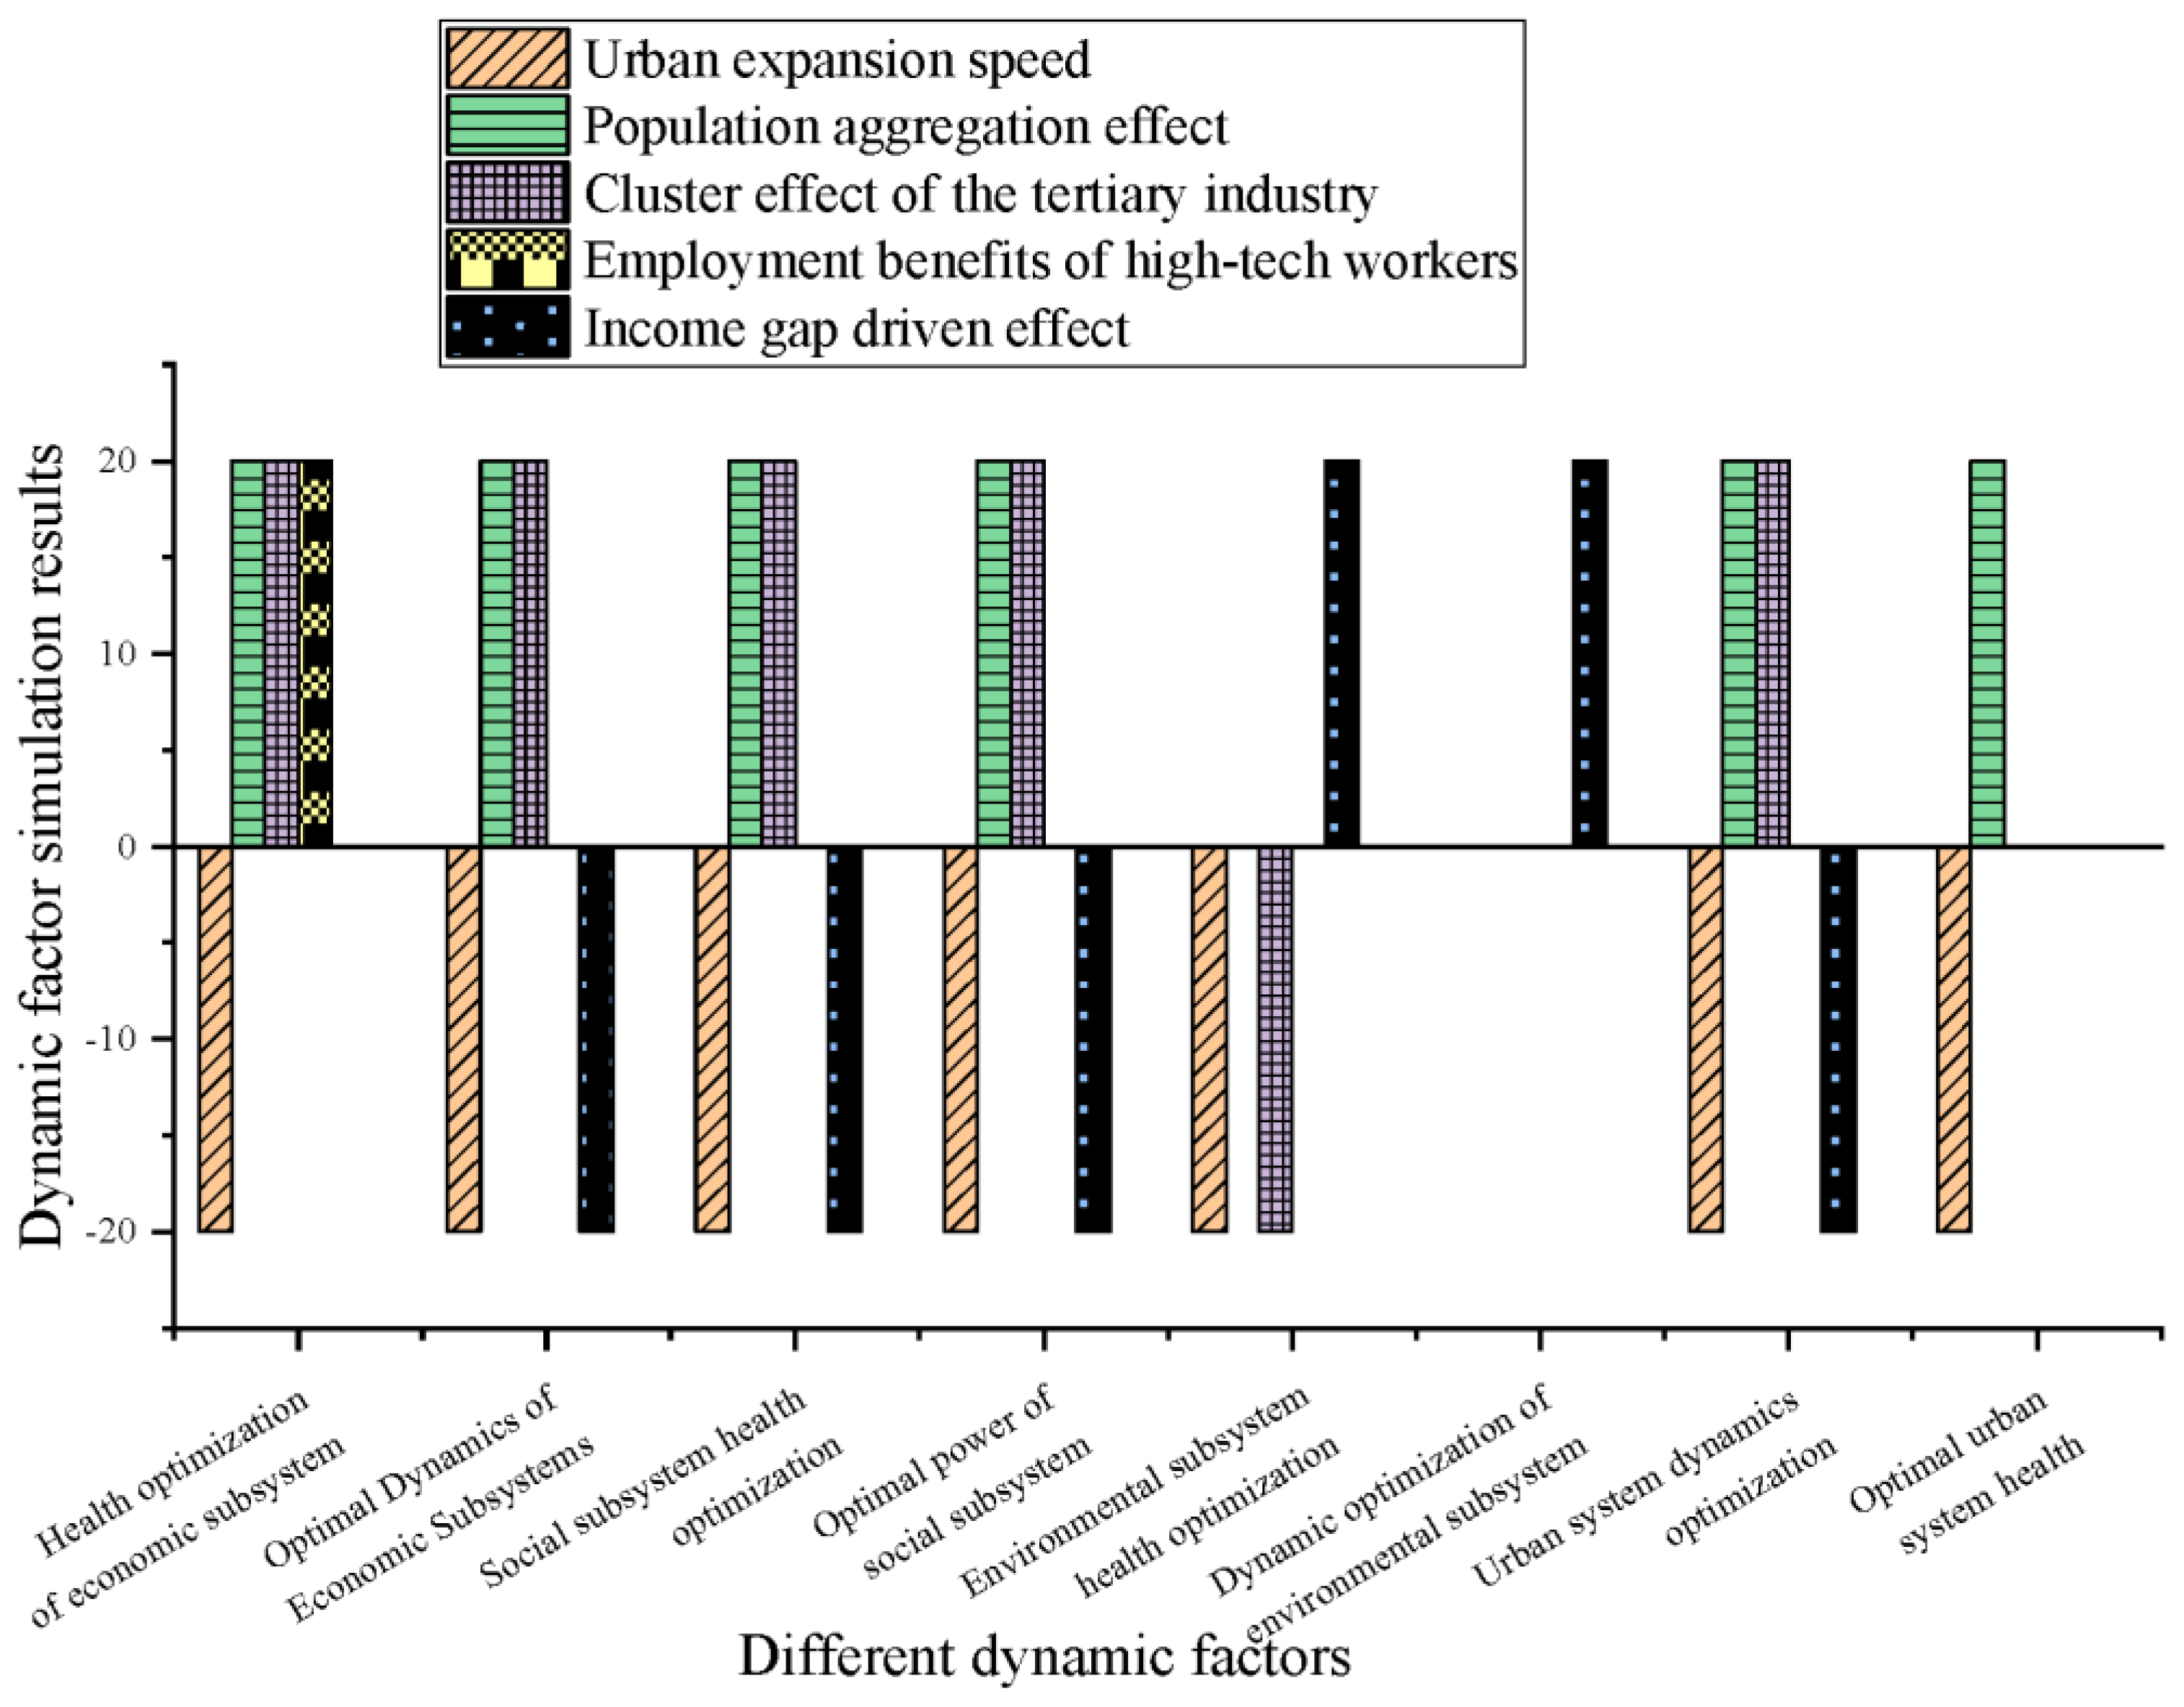
Figure 9 summarizes the optimal solution information of the simulation results of the power control scheme based on the above information.
Among the dynamic factors, the adjustment of the contradiction between the employment benefits of high-skilled laborers and the income gap has almost no impact on the health level of the urban system. Therefore, it can be considered that neither is part of the dynamic factors of the urban health system. The rapid growth of cities, which has an adverse impact on urban sustainability, is one cause of people’s reluctance to embrace city life. The key symptom of this reluctance is the slowing of the rate of improvement in the economic and social sectors. Both the population agglomeration effect and the tertiary industry agglomeration effect play a favorable role in urban health. In addition, the linkage between the income gap and the urbanization rate creates a complex mechanism for promoting urban health. It can enhance the momentum of the development of the environmental subsystem while attenuating the acceleration of the sustainable operation of the social and economic subsystems.
4.2. Discussion
This work constructs a composite index system for sustainable cities with four levels of indicators that can support the reliability of subjective health-level data. A general rising trend is evident in the health composite index. Comprehensive index results suggest the sustainable city pilot strategy has helped advance sustainable city building. The pilot cities’ absolute index score and relative ranking have increased substantially. In addition, results demonstrate that a synthetic control policy can help bring about sustainable development in the pilot cities. These findings align with the relevant literature and the national setting in China [
38,
39].
In addition, researchers represented by Yuan et al. have emphasized the importance of population and industrial agglomeration to cities within the scope of regional economics. The authors proposed encouraging population agglomeration in cities [
40,
41]. However, they failed to adequately show how the dynamic law of rural population agglomeration to cities works. The income difference between cities and the countryside is often cited as the primary reason why more people in rural areas are moving to cities. The results reported here underline the significance of agglomeration beyond the realm of economics. A city’s general welfare can be enhanced with a sufficient concentration of tertiary industry, population, and resources. The increased influence of income disparity on the acceleration of urbanization is not necessarily beneficial to city growth, as this work shows, and its effect on cities is complicated.
Although the research above has all suggested actionable remedies for improving healthy city construction and has seen some success, no substantially mature theory has yet been created regarding technical support. In light of these studies, this work suggests a preliminary investigation into the feasibility of implementing a healthy city strategy by integrating synthetic control approach with the dynamics mechanism theory. The findings show that healthy city pilot programs help build healthier communities.
5. Conclusions
The effort to create a sustainable city was launched by the World Health Organization and has since gained widespread attention and funding. This work analyzes the trends of the pilot cities over time in different dimensions to reflect the individual differences between the pilot cities. Moreover, the composite control method is adopted to evaluate the policy effects of China’s sustainable city pilots. Finally, the dynamics of urban system development and its mode of action are summarized, and the validity and rationality of the results of urban health issues are argued. Several regions have benefited, to differing degrees, from the healthy pilot cities policy’s emphasis on community health and sustainable development. In addition, the pilot cities’ observed and synthetic control values are very close. Zhejiang has a variable rate of 2%, Beijing has a rate of 0.54%, and the rate in the other regions is close to zero. The robustness tests yield estimates that are all positive and statistically highly significant. Moreover, positive variables that contribute to urban health include population concentration as well as the concentration of service industries. In light of the data synthesis presented here, this work provides a set of management suggestions for effective interventions in China’s urban and senior citizen security policies. First, it is essential to clarify and examine the policy framework for healthy urban community home care for the elderly along three dimensions: activity stages, activity subjects, and policy tools. Second, structural equation modeling should be employed to examine the system of research hypotheses regarding the impact of healthy urban community home care policy on the utilization of services by the aged. Finally, it is critical to summarize the influence of different policy interventions on the optimum route of usage behavior by placing a premium on coefficients and initial enhancement rates, using dynamic simulation to model their effects.
However, there are some issues with this effort. First, the logical relationship between indicators should be further clarified. Second, there may be insufficient data to gauge success reliably. Third, the structure of the summarized system dynamics model is based on the existing literature, the results are derived from statistical methods, and there is a particular subjectivity in the generalization process. Subsequent studies will employ well-suited analysis tools to match the system dynamics modeling effort.
Author Contributions
Conceptualization, R.T., Z.W. and B.L.; methodology, R.T., Z.W. and B.L.; software, X.G.; validation, X.G.; formal analysis, J.Z.; investigation, J.Z.; resources, Z.W. and F.X.; data curation, B.L.; writing—original draft preparation, R.T., Z.W. and B.L.; writing—review and editing, Z.W. and F.X.; visualization, R.T.; supervision, R.T. and Z.W.; project administration, Z.W.; funding acquisition, B.L. All authors have read and agreed to the published version of the manuscript.
Funding
This research was funded by the China National Social Science Foundation Project “Research on the Construction of Old-age Security System for Urban Losing-single-child Families from the Perspective of Policy Network”, grant number 17BGL154.
Institutional Review Board Statement
Not applicable.
Informed Consent Statement
Not applicable.
Data Availability Statement
The data presented in this study are available on request from the corresponding author.
Conflicts of Interest
The authors declare no conflict of interest.
References
- Streule, M.; Karaman, O.; Sawyer, L.; Schmid, C. Popular urbanization: Conceptualizing urbanization processes beyond informality. Int. J. Urban Reg. Res. 2020, 44, 652–672. [Google Scholar] [CrossRef]
- Chen, M.; Ye, C.; Lu, D.; Sui, Y.; Guo, S. Cognition and construction of the theoretical connotations of new urbanization with Chinese characteristics. J. Geogr. Sci. 2019, 29, 1681–1698. [Google Scholar] [CrossRef] [Green Version]
- Wang, Z.; Deng, Y.; Zhou, S.; Wu, Z. Achieving sustainable development goal 9: A study of enterprise resource optimization based on artificial intelligence algorithms. Resour. Policy 2023, 80, 103212. [Google Scholar] [CrossRef]
- Wang, Z.; Zhang, S.; Zhao, Y.; Chen, C.; Dong, X. Risk prediction and credibility detection of network public opinion using blockchain technology. Technol. Forecast. Soc. Chang. 2023, 187, 122177. [Google Scholar] [CrossRef]
- Wang, Z.; Lu, J.; Li, M.; Yang, S.; Wang, Y.; Cheng, X. Edge computing and blockchain in enterprise performance and venture capital management. Comput. Intell. Neurosci. 2022, 2022, 2914936. [Google Scholar] [CrossRef]
- Wang, Z.; Liang, F.; Li, C.; Xiong, W.; Chen, Y.; Xie, F. Does China’s low-carbon city pilot policy promote green development? Evidence from the digital industry. J. Innov. Knowl. 2023, 8, 100339. [Google Scholar] [CrossRef]
- Zhang, X.; Liu, S.; Chen, X.; Wang, L.; Gao, B.; Zhu, Q. Health information privacy concerns, antecedents, and information disclosure intention in online health communities. Inf. Manag. 2018, 55, 482–493. [Google Scholar] [CrossRef]
- He, B.J.; Zhao, D.X.; Zhu, J.; Darko, A.; Gou, Z.H. Promoting and implementing urban sustainability in China: An integration of sustainable initiatives at different urban scales. Habitat Int. 2018, 82, 83–93. [Google Scholar] [CrossRef]
- Yan, D.; Wu, S.; Zhou, S.; Li, F.; Wang, Y. Sustainable city development for Chinese cities under dramatic imbalance: Evidence from 258 cities. Sustain. Cities Soc. 2021, 74, 103157. [Google Scholar] [CrossRef]
- Zhou, H.; He, S.; Cai, Y.; Wang, M.; Su, S. Social inequalities in neighborhood visual walkability: Using street view imagery and deep learning technologies to facilitate Sustainable city planning. Sustain. Cities Soc. 2019, 50, 101605. [Google Scholar] [CrossRef]
- Capolongo, S.; Rebecchi, A.; Buffoli, M.; Appolloni, L.; Signorelli, C.; Fara, G.M.; D’Alessandro, D. COVID-19 and cities: From urban health strategies to the pandemic challenge. A decalogue of public health opportunities. Acta Bio Med. Atenei Parm. 2020, 91, 13. [Google Scholar]
- Badcock, P.B.; Friston, K.J.; Ramstead, M.J. The hierarchically mechanistic mind: A free-energy formulation of the human psyche. Phys. Life Rev. 2019, 31, 104–121. [Google Scholar] [CrossRef] [PubMed]
- Kan, S.; Lv, W.; Guo, F. Dynamic learning super network modeling of a complex product system based on multi-organization cooperation. Mod. Phys. Lett. B 2018, 32, 1850375. [Google Scholar] [CrossRef]
- Yang, J.; Siri, J.G.; Remais, J.V.; Cheng, Q.; Zhang, H.; Chan, K.K.Y.; Sun, Z.; Zhao, Y.; Cong, N.; Li, X.; et al. The Tsinghua–Lancet Commission on Sustainable Cities in China: Unlocking the Power of Cities for a Sustainable China. Lancet 2018, 391, 2140–2184. [Google Scholar] [CrossRef] [PubMed] [Green Version]
- Shao, M.; Chen, J.; Ma, C. Research on the relationship between chinese elderly health status, social security, and depression. Int. J. Environ. Res. Public Health 2022, 19, 7496. [Google Scholar] [CrossRef] [PubMed]
- Li, L.; Yu, L. The Influence of Pension Mode on the Mental Health of Older Adults—Evidence from Older Adults in China. Int. J. Environ. Res. Public Health 2022, 19, 119. [Google Scholar] [CrossRef]
- Zhang, Y.; Jiang, T.; Sun, J.; Fu, Z.; Yu, Y. Sustainable development of urbanization: From the perspective of social security and social attitude for migration. Sustainability 2022, 14, 10777. [Google Scholar] [CrossRef]
- Li, J.; Yuan, B. Health insurances and the health-related work capacity of retirement-aged workers: A comparative investigation. J. Occup. Environ. Med. 2022, 64, e155–e164. [Google Scholar] [CrossRef]
- Shah, K.; Chaudhari, G.; Kamrai, D.; Lail, A.; Patel, R.S. How essential is to focus on physician’s health and burnout in coronavirus (COVID-19) pandemic? Cureus 2020, 12, e7538. [Google Scholar] [CrossRef] [Green Version]
- Li, Z.; Wang, F.; Kang, T.; Wang, C.; Chen, X.; Miao, Z.; Zhang, L.; Ye, Y.; Zhang, H. Exploring differentiated impacts of socioeconomic factors and urban forms on city-level CO2 emissions in China: Spatial heterogeneity and varying importance levels. Sustain. Cities Soc. 2022, 84, 104028. [Google Scholar] [CrossRef]
- Saha, S.; Cohen, B.B.; Nagy, J.; McPHERSON, M.E.; Phillips, R. Well-Being in the Nation: A Living Library of Measures to Drive Multi-Sector Population Health Improvement and Address Social Determinants. Milbank Q. 2020, 98, 641. [Google Scholar] [CrossRef]
- Post, C.; Sarala, R.; Gatrell, C.; Prescott, J.E. Advancing theory with review articles. J. Manag. Stud. 2020, 57, 351–376. [Google Scholar] [CrossRef] [Green Version]
- Gilbert, N.; Ahrweiler, P.; Barbrook-Johnson, P.; Narasimhan, K.P.; Wilkinson, H. Computational modelling of public policy: Reflections on practice. J. Artif. Soc. Soc. Simul. 2018, 21, 14. [Google Scholar] [CrossRef] [Green Version]
- FitzGerald, C.; O’Malley, E.; Broin, D.Ó. Policy success/policy failure: A framework for understanding policy choices. Administration 2019, 67, 1–24. [Google Scholar] [CrossRef] [Green Version]
- Pigott, T.D.; Polanin, J.R. Methodological guidance paper: High-quality meta-analysis in a systematic review. Rev. Educ. Res. 2020, 90, 24–46. [Google Scholar] [CrossRef] [Green Version]
- Abaluck, J.; Kwong, L.H.; Styczynski, A.; Haque, A.; Kabir, M.A.; Bates-Jeffery, E.; Crawford, E.; Benjamin-Chun, J.; Raihan, S.; Rahman, S.; et al. Impact of community masking on COVID-19: A cluster-randomized trial in Bangladesh. Science 2022, 375, eabi9069. [Google Scholar] [CrossRef] [PubMed]
- Yue, W.; Qiu, S.; Xu, H.; Xu, L.; Zhang, L. Polycentric urban development and urban thermal environment: A case of Hangzhou, China. Landsc. Urban Plan. 2019, 189, 58–70. [Google Scholar] [CrossRef]
- Javidan, N.; Kavian, A.; Pourghasemi, H.R.; Conoscenti, C.; Jafarian, Z.; Rodrigo-Comino, J. Evaluation of multi-hazard map produced using MaxEnt machine learning technique. Sci. Rep. 2021, 11, 1–20. [Google Scholar] [CrossRef]
- Cole, M.A.; Elliott, R.J.; Liu, B. The impact of the Wuhan Covid-19 lockdown on air pollution and health: A machine learning and augmented synthetic control approach. Environ. Resour. Econ. 2020, 76, 553–580. [Google Scholar] [CrossRef]
- Adams, E.A.; Stoler, J.; Adams, Y. Water insecurity and urban poverty in the Global South: Implications for health and human biology. Am. J. Hum. Biol. 2020, 32, e23368. [Google Scholar] [CrossRef]
- Crane, M.; Lloyd, S.; Haines, A.; Ding, D.; Hutchinson, E.; Belesova, K.; Davies, M.; Osrin, D.; Zimmermann, N.; Capon, A.; et al. Transforming cities for sustainability: A health perspective. Environ. Int. 2021, 147, 106366. [Google Scholar] [CrossRef]
- Zhang, J.; Deng, T.; Jiang, H.; Chen, H.; Qin, S.; Ding, G. Bi-level dynamic scheduling architecture based on service unit digital twin agents. J. Manuf. Syst. 2021, 60, 59–79. [Google Scholar] [CrossRef]
- Xu, H.; Ma, C.; Lian, J.; Xu, K.; Chaima, E. Urban flooding risk assessment based on an integrated k-means cluster algorithm and improved entropy weight method in the region of Haikou, China. J. Hydrol. 2018, 563, 975–986. [Google Scholar] [CrossRef]
- Nordhaus, W. Climate change: The ultimate challenge for economics. Am. Econ. Rev. 2019, 109, 1991–2014. [Google Scholar] [CrossRef]
- Wei, X.; Wang, J.; Wu, S.; Xin, X.; Wang, Z.; Liu, W. Comprehensive evaluation model for water environment carrying capacity based on VPOSRM framework: A case study in Wuhan, China. Sustain. Cities Soc. 2019, 50, 101640. [Google Scholar] [CrossRef]
- Zheng, J.Y.; Lv, W.G.; Shen, J.; Sun, M. Study on the Impact of the Sustainable Cities Pilot Policy on Industrial Structure Upgrading: Quasi-Experimental Evidence from China. Sustainability 2022, 14, 13588. [Google Scholar] [CrossRef]
- Hu, H.; Xu, J.; Liu, M.; Lim, M.K. Vaccine supply chain management: An intelligent system utilizing blockchain, IoT and machine learning. J. Bus. Res. 2023, 156, 113480. [Google Scholar] [CrossRef]
- Wang, Y.; Pei, R.; Gu, X.; Liu, B.; Liu, L. Has the Sustainable city pilot policy improved urban health development performance in China? Evidence from a quasi-natural experiment. Sustain. Cities Soc. 2023, 88, 104268. [Google Scholar] [CrossRef]
- Hu, H.; Xie, N.; Fang, D.; Zhang, X. The role of renewable energy consumption and commercial services trade in carbon dioxide reduction: Evidence from 25 developing countries. Appl. Energy 2018, 211, 1229–1244. [Google Scholar] [CrossRef]
- Yuan, H.; Feng, Y.; Lee, C.C.; Cen, Y. How does manufacturing agglomeration affect green economic efficiency? Energy Econ. 2020, 92, 104944. [Google Scholar] [CrossRef]
- Hu, H.; Qi, S.; Chen, Y. Using green technology for a better tomorrow: How enterprises and government utilize the carbon trading system and incentive policies. China Econ. Rev. 2023, 78, 101933. [Google Scholar] [CrossRef]
| Disclaimer/Publisher’s Note: The statements, opinions and data contained in all publications are solely those of the individual author(s) and contributor(s) and not of MDPI and/or the editor(s). MDPI and/or the editor(s) disclaim responsibility for any injury to people or property resulting from any ideas, methods, instructions or products referred to in the content. |
© 2023 by the authors. Licensee MDPI, Basel, Switzerland. This article is an open access article distributed under the terms and conditions of the Creative Commons Attribution (CC BY) license (https://creativecommons.org/licenses/by/4.0/).


