1. Introduction
Organic waste management is a major global challenge. The total amount of municipal solid waste (MSW) produced worldwide is estimated to be over 1.3 billion metric tons. It has also been estimated that 1.1 billion metric tons of food, which is about one-third of all food produced, are lost each year, with residential homes being the primary source of food loss in the food supply chain [
1]. In Asia, about 26.2–43.5% of the total MSW consists of food waste [
2]. MSW is frequently disposed of in landfills, where it undergoes aerobic and anaerobic processes that release harmful methane gas into the atmosphere. Methane gas is 23 times more potent and contributes more to global warming than carbon dioxide [
3]. The collection, transportation, and disposal of a significant amount of MSW in landfills are also serious environmental concerns as these facilities are often located far from urban areas or waste-producing locations.
Incineration is another method of managing waste [
4]. Electricity can be generated through the incineration of waste, thereby recycling the waste for useful purposes. Despite having the potential for reducing carbon dioxide emissions by about 2 million tons annually in comparison to electricity generation from coal, waste incineration still poses a negative impact on the ecosystem [
5]. Naturally, the negative consequences of MSW and the absence of effective waste management strategies are limiting the potential growth of urban cities [
6].
Composting and recycling are deemed effective methods of managing waste. They impact the environment less as they emit less greenhouse gas emissions than conventional waste management methods, including landfilling and incineration, and are therefore considered sustainable waste management methods [
7]. Verma et al. [
8] state that recycling and composting generate net greenhouse gas emissions of −1917.18 kg CO
2.eq/t and −781.05 kg CO
2.eq/t, respectively, with the negative value indicating net savings of emissions. In contrast, incineration and landfilling produced net greenhouse gas emissions of about 696.14 kg CO
2.eq/t, which is considerably greater than both recycling and composting.
Indeed, as one of the Sustainable Development Goals (SDG), responsible consumption and production has included reducing waste production through recycling and composting of biodegradable organic waste [
9] as one of its strategies. Recycling and composting have emerged as economical and effective waste management techniques. In the literature, researchers have designed devices to effectively identify wastes, including glass, cardboard, paper, and plastics, for segregation and further recycling [
10]. However, not all waste can be recycled, and this includes food waste, which comprises 50% of the global MSW [
11]. On the other hand, composting can be used as a management technique for food waste and can be seen as an effective waste management method, with the least detrimental impact on the environment and human health.
To shorten the composting process, improve compost quality and minimize effort, different methods of composting have been proposed. Some common conventional composting methods include windrow, bin, and in-vessel composting. Windrow composting stacks different types of compost in long, narrow piles or windrows and requires frequent manual stirring to re-establish porosity and aerate air into the pile. With the various types of composting material and turning equipment that may be used, the size and shape of a windrow composter may differ. Generally, windrow composting takes between 3 and 9 weeks to complete, depending on the compost material, turning intervals, and intended use of the compost. Another popular method for composting is by using a bin composter. It is an easy-to-use, low-maintenance technology that may be carried out with commonly available equipment, including wooden bins, used storage bins, or any other appropriate containers. Bin composting which relies only on natural aeration may be slow; as such, forced aeration is frequently introduced to the composting process. Commonly, bin composting may be completed in 6 to 8 weeks, with regular shovel turns and frequent watering to ensure that the compost material has an adequate moisture content. In-vessel composting is yet another method of composting, intended to shorten the composting process as well as minimise manual labour. Shredded organic wastes are mixed inside a container or vessel—commonly, a rotating drum to facilitate the mixing and aeration of the composting materials [
12,
13]. Using the rotating drum, in-vessel composting is able to create a warm, humid environment with a high concentration of oxygen and plenty of organic material that can promote the growth of aerobic microorganisms and increases the rate of composting of organic waste [
14]. It is more space-efficient, provides better control, and has a faster process as compared to windrow and bin composting [
15].
As the world has shifted towards a more modernized urban setting with increased awareness of the importance of composting for greater sustainability, consumers have demanded a more efficient and effective manner of composting their organic wastes. This emanates in demand for a shorter composting period, minimal human interventions, and smaller-sized composting devices to fit into the demand and space requirements of an urban setting. Electrical composting has been suggested as an alternative by replicating the composting process that would have occurred naturally but with a faster completion time. This is made possible by accelerating the mesophilic and thermophilic phases of the composting process. Typically, an electrical composter employs a three-phase cycle including drying, grinding, and cooling. The organic wastes are first dried to reduce moisture content. They are then broken down into smaller powder-sized particles to increase their surface area, followed by turning and aerating the ground organic wastes to provide optimum conditions for the mesophilic and thermophilic phases to take place. The processed organic wastes are then cooled to give a semi-cured compost. However, compost products from an electrical composter may not be mature enough to be immediately used as a soil fertilizer. Irrespective, the manufacturer-claimed faster composting time has generated a lot of public interest.
Composting may be categorised into anaerobic and aerobic composting. Anaerobic composting occurs in the absence of oxygen, whereas aerobic composting requires the presence of oxygen, with both composting techniques involving the breakdown of organic material. The end-product of anaerobic composting is biogas, a mixture of gases primarily made of methane and carbon dioxide, as well as a non-stabilized digestate. Due to the plentiful emission of methane as one of its products, anaerobic composting is deemed less effective than aerobic composting. On the other hand, the end-product of aerobic composting is compost, an organic soil fertilizer enriched with soil nutrients [
16]. When performed correctly, aerobic composting is faster than anaerobic composting and has a relatively less negative impact on the environment.
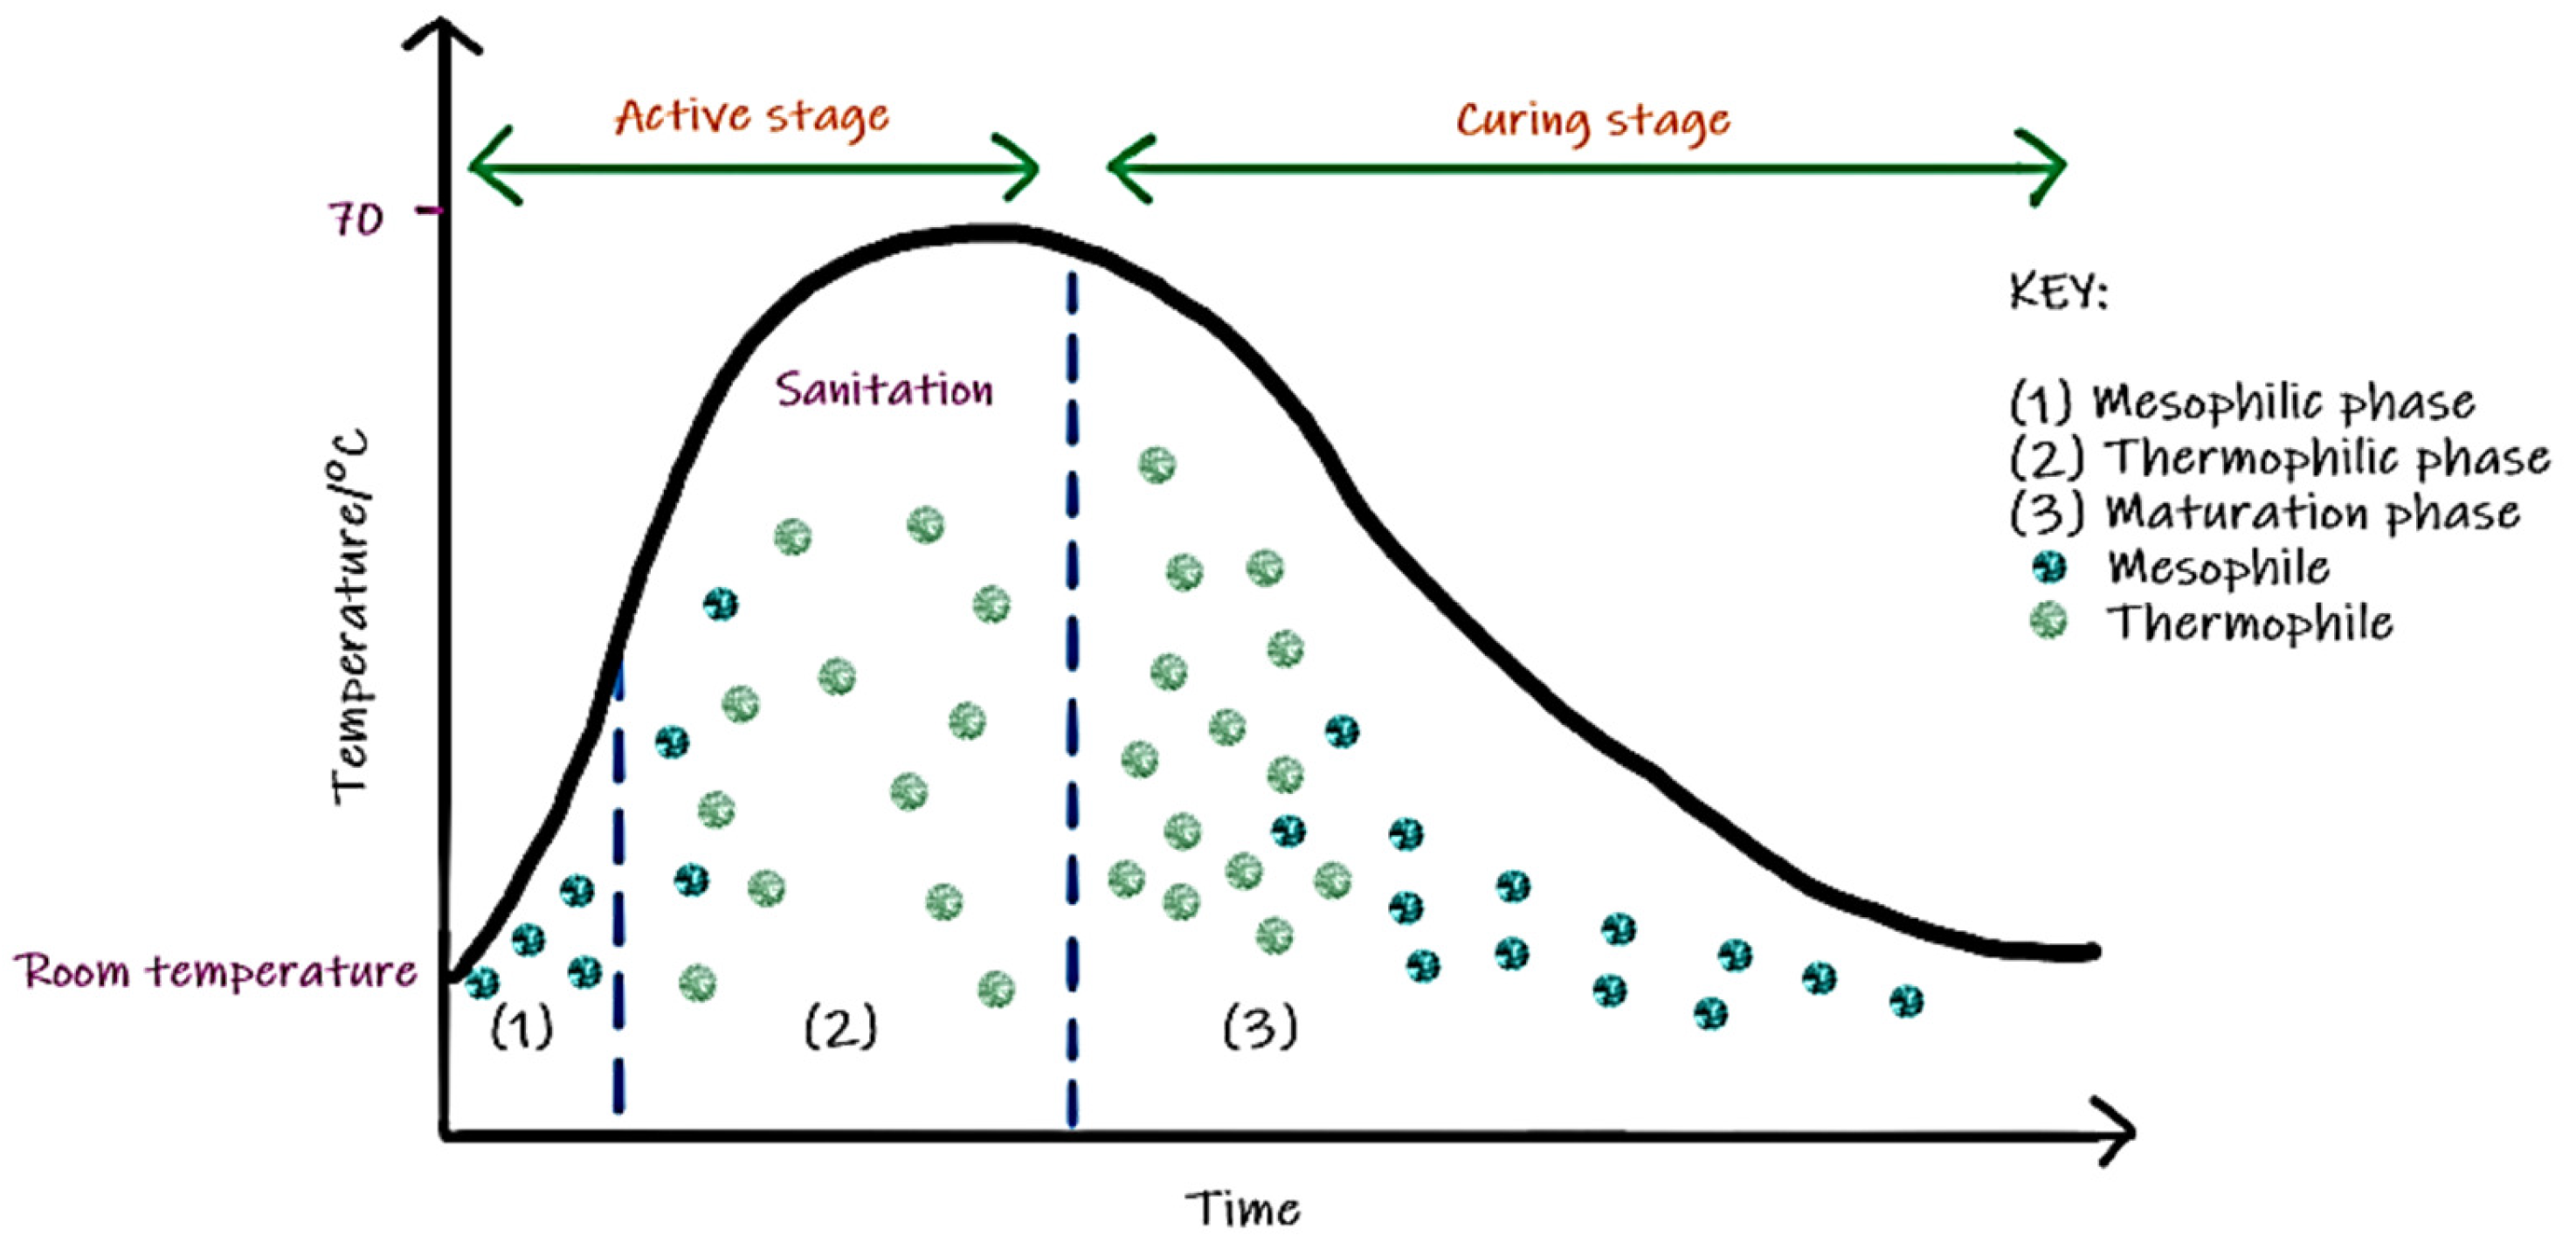
In aerobic composting, the composting pile undergoes three different phases: the mesophilic, thermophilic, and maturation phases [
17] as shown in
Figure 1. During the mesophilic phase, which occurs at room temperature of below 40 °C, microorganisms present in the organic waste break down the amino acids for growth and reproduction, causing an increase in temperature above their survival range. They are then replaced by thermophiles in the thermophilic phase. During this phase, the temperature in the pile can rise up to 70 °C [
18], potentially destroying pathogens and weeds and sanitizing the organic waste pile. To ensure optimum aerobic conditions, the compost pile needs to be regularly turned and aerated, to ensure the balance of oxygen and moisture within the compost pile. However, after a period of time during the decomposition process, the resources within the compost pile are reduced, causing a drop in temperature [
19]. At this point, mesophiles again become more prominent within the composting pile over the thermophiles. This is when the maturation phase occurs [
9], eventually turning the compost pile into matured compost used for soil applications. Collectively, the mesophilic and thermophilic phases are referred to as the active stage, whilst the maturation phase is referred to as the curing stage.
The fundamental elements of an aerobic composting process are the existence of microbes and nutrients, as well as the presence of favourable environmental conditions for microbial activities. Important parameters for an optimum composting process include pH, temperature, particle size, oxygen concentration, moisture of the compost pile, and the initial carbon-to-nitrogen ratio content of the organic waste [
20].
Composting is essentially a biodegradation process, and the aerobes thrive in surroundings with a pH of between moderate and semi-high; therefore, the concentration of hydrogen ions in the compost has an impact on the composting process [
21]. The generation and breakdown of acid during composting, which produces carbon dioxide and heat, determine the pH of the finished product. When the rates of acid generation and acid breakdown are identical, the pH is at its lowest [
22]. The presence of organic acid in compost, which comes from the deterioration of organic materials, including monosaccharides and starch, is what causes the modest pH reduction in the mesophilic phase. In the meantime, the thermophile microorganisms in the thermophilic phase break down proteins, which release ammonia, thereby raising the pH. When the composting phase switches from the mesophilic to the thermophilic phase, the pH of the compost will rise and become more alkaline. The ideal pH range is between 5.5 and 8, as bacteria grow more quickly at neutral pH levels, whereas fungi grow more quickly at slightly acidic pH levels. However, excessively acidic or alkaline pH conditions may have an impact on the breakdown process [
23].
Temperature between 45 and 55 °C promotes the fastest rate of organic matter decomposition [
21]. As the temperature fluctuates during the composting process, mesophiles and thermophiles interchangeably dominate. Mesophiles take over the decomposition at the start of the composting process. After some time, the compost pile increases in temperature due to the aerobic respiration of the microbes which can reach up to 70 °C. The population of thermophiles increases and mesophiles decrease with an increase in the temperature of the composting pile. At higher temperatures, sterilization occurs where the temperature is capable of killing unwanted pathogens and weeds. There are numerous ways of keeping the compost from heating up excessively during the composting process. Regulating the size of the compost particle and turning the compost for aeration can be performed to attain the correct temperature range. When the organic particles are decomposed completely, the temperature of the pile will slowly decrease and eventually reaches room temperature during curing, indicating the compost is stabilizing and maturing.
The majority of aerobic decomposition occurs on the topmost layer of biodegradable material, where aerobic microorganisms consume a thin oxygen film that is present on the surface of the organic particles for aerobic decomposition, leaving the inside of the particles in anaerobic conditions. Waste material size of approximately 1 to 2 inches in diameter is ideal for compost particle size. Since this particle size offers a better surface-to-volume ratio where microorganisms can obtain enough oxygen, it can accelerate decomposition and increase microbial activity. Although the rate of compost decomposition will increase as particle size decreases, very small particles may impede oxygen movement within the pile, resulting in a reduction in the rate of decomposition. Additionally, the small particle size will retain too much moisture, reducing the air-filled pore space and possibly slowing the decomposition rate [
24]. On the other hand, although large particle sizes can provide enough oxygen for composting, there is less surface area for microbial activity. The ideal porosity range for composting heaps is between 35% and 50%, which allows air to pass through the hydrophilic layer and into the porous compost pile, giving the microorganisms on the particle surface access to air [
25,
26]. Porosity less than 35% may lead to anaerobic composting with the formation of disagreeable odours, while porosity greater than 50% will result in energy loss, hence slowing down the composting process.
The pore space between the organic particles in the compost pile serves as the medium via which microorganisms in the pile decompose organic matter. To keep the compost pile in an aerobic state, there must be a minimum of 5% oxygen in the pore space [
27]. As the activity of the microbes in the compost pile grows, more oxygen will be consumed. Composting materials need to maintain a moisture level of between 40% and 60% for proper decomposition. High levels of moisture will cause the pore spaces to fill with water, lowering the oxygen content and restricting oxygen transport, which will lead to anaerobic growth and an unpleasant odour [
27]. Low moisture content, on the other hand, results in a slowdown and eventual hibernation of microbial activity [
28]. Because of this, composting is normally carried out at moisture percentages between 50% and 55% [
19]. The moisture content of the compost reduces as the composting process goes on. Turning the compost pile is the most typical way to aerate the pile and control moisture.
One of the key parameters influencing the composting process is the ratio of carbon-to-nitrogen (C/N). The microbial community uses carbon as an energy source, while nitrogen is necessary for synthesizing proteins, amino acids, and nucleic acids [
29]. Aerobes require a higher C/N ratio because more energy is required for their higher rate of decomposition. Anaerobic digestion only requires a C/N ratio of 20 to 30, but a greater C/N ratio of 25 to 35 is normally required for aerobic composting [
30]. In the majority of situations, the optimal C/N ratio for the oxidation of carbon and the growth of microorganisms is 30:1. Higher C/N ratios, starting from 40:1, cause slower degradation as the excessive carbon and insufficient nitrogen result in slower growth of aerobic microbes. On the other hand, C/N ratios below the recommended level result in under-utilisation of nitrogen, with the extra nitrogen released into the environment as ammonia or nitrous oxide, which can cause odour issues. In more recent research, composting with a low C/N ratio of 15 was carried out satisfactorily. However, a bulking agent may be needed to modify the initial C/N ratio when decomposing a pile with a lower C/N ratio [
31].
The C/N ratio often increases throughout the thermophilic phase before progressively declining [
32]. The degree of disintegration affects the final C/N ratio of a compost pile; a lower degree of disintegration yields a higher final C/N ratio value, which may result in the presence of aromatic carbon in the compost pile. On the other hand, a higher degree of disintegration due to microorganisms consuming the organic compounds will result in a lower final C/N ratio, with two-thirds of the total carbon content being released as carbon dioxide. To evaluate the stability and maturity of the final compost, either the increase in total nitrogen content or reduction in total carbon content should be analysed over the composting process. The C/N ratio can give an overview of compost stability [
33]. A C/N ratio close to 12 is frequently regarded to indicate a fully mature compost, whereas a final C/N ratio of less than 20 indicates compost with acceptable maturity. Researchers have found that balancing the initial C/N ratio to produce good-quality compost is still a big challenge in the field. Consequently, this study focuses on and investigates the effect of the C/N ratio specifically for kitchen waste that has been processed using a commercial electrical composter.
Table 1 shows the summary of the recommended range of the individual composting parameters in different composting phases.
Conventional and electrical methods of composting differ and may require different optimum C/N ratios of kitchen waste to produce optimum compost. Analysis of the quality of compost produced using conventional composting methods is prevalent in the literature. However, limited studies have been conducted on composting using home electrical composters, which has been gaining popularity, especially in urban areas. This is despite the limited amount of scientific literature on the topic. Mortula et al. [
6] investigate suitable C/N ratios of organic wastes whilst Vóbérková et al. [
34] investigate the compost maturity of food wastes through the pH, conductivity, and C/N ratio of the compost from electrical composters. None has addressed the specific quality of compost, particularly in terms of its suitability for planting. As such, this work aims to investigate the quality of compost products produced by a commercial electrical composter by varying the initial C/N ratios. This is to determine the most appropriate proportions for composting using an electrical composter. It is envisaged that the findings from this paper would assist in producing a more ready-to-be-used compost from an electrical composter.
The outline of the paper is as follows. The methodology of the studies is given in
Section 3, with results and discussions given in
Section 4.
Section 5 concludes the paper.
2. Methodology
This paper studies the effectiveness of compost products from a commercially off-the-shelf electrical composter in terms of seed germination. The methodology adopted in this paper comprises five main steps: sample preparation, processing samples in an electric composter, curing, compost maturity test via seed germination, and, finally, analysis of results, as depicted in
Figure 2 below.
2.1. Preparation of Samples
In the first step, the samples were prepared using a mixture of carbon-rich and nitrogen-rich kitchen wastes in six different initial C/N ratios: 10:1, 15:1, 20:1, 25:1, 30:1, and 35:1. Three types of carbon-rich kitchen waste were utilized in this study: cereals, bread, and raw noodles, whereas spinach was chosen as the nitrogen-rich kitchen waste. The selection of carbon-rich and nitrogen-rich kitchen waste types employed in this study is based on the most commonly found food waste in kitchen households. It is imperative to carefully carry out the selection of the kitchen waste types used in this study in order to resemble the actual composition of food wastes generated from households. In addition, this study employed more carbon-rich than nitrogen-rich food types due to the initial C/N ratio requirement, which requires a higher carbon proportion.
The selected kitchen wastes were then mixed according to the calculated proportion to achieve different initial C/N ratios for each mixture. The initial C/N ratio can be obtained by dividing the total carbon content by the total nitrogen content, with 100 g used as its basis for the selected kitchen waste.
Table 2 shows the percentage of carbon and nitrogen contents of each kitchen waste used in the experiment. The carbon and nitrogen contents of the selected kitchen waste are obtained from the packaging of the food sample used shown in
Table 2. These different wastes are used to prepare six different waste mixtures with different initial C/N ratios following Equation (1) based on Mortula et al. [
6].
Table 3 shows the summary of the cumulative C/N ratio for cereals, noodles, bread, and spinach waste used in this experiment.
The initial C/N ratio is calculated by dividing the total carbon contents by the total nitrogen contents for each kitchen waste type. RXY represents the percentage content of X in food wastes Y, where subscript X can either be carbon (C) or nitrogen (N), and subscript Y can either be Cereals (C), Noodles (N), Bread (B), or Spinach (S). PY represents the proportion of each type of kitchen waste used.
2.2. Composting Setup
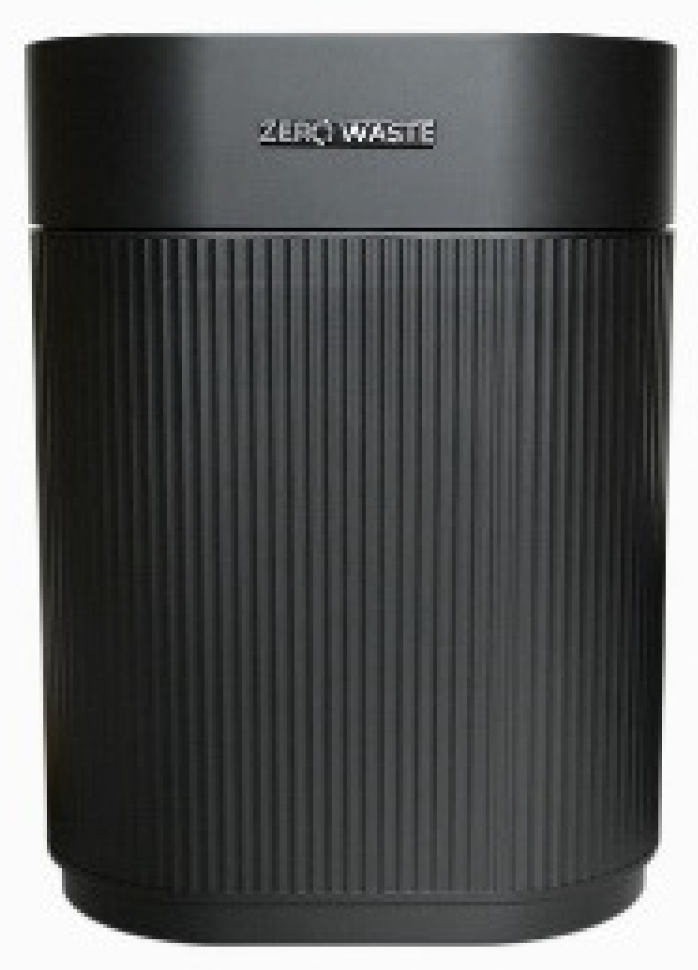
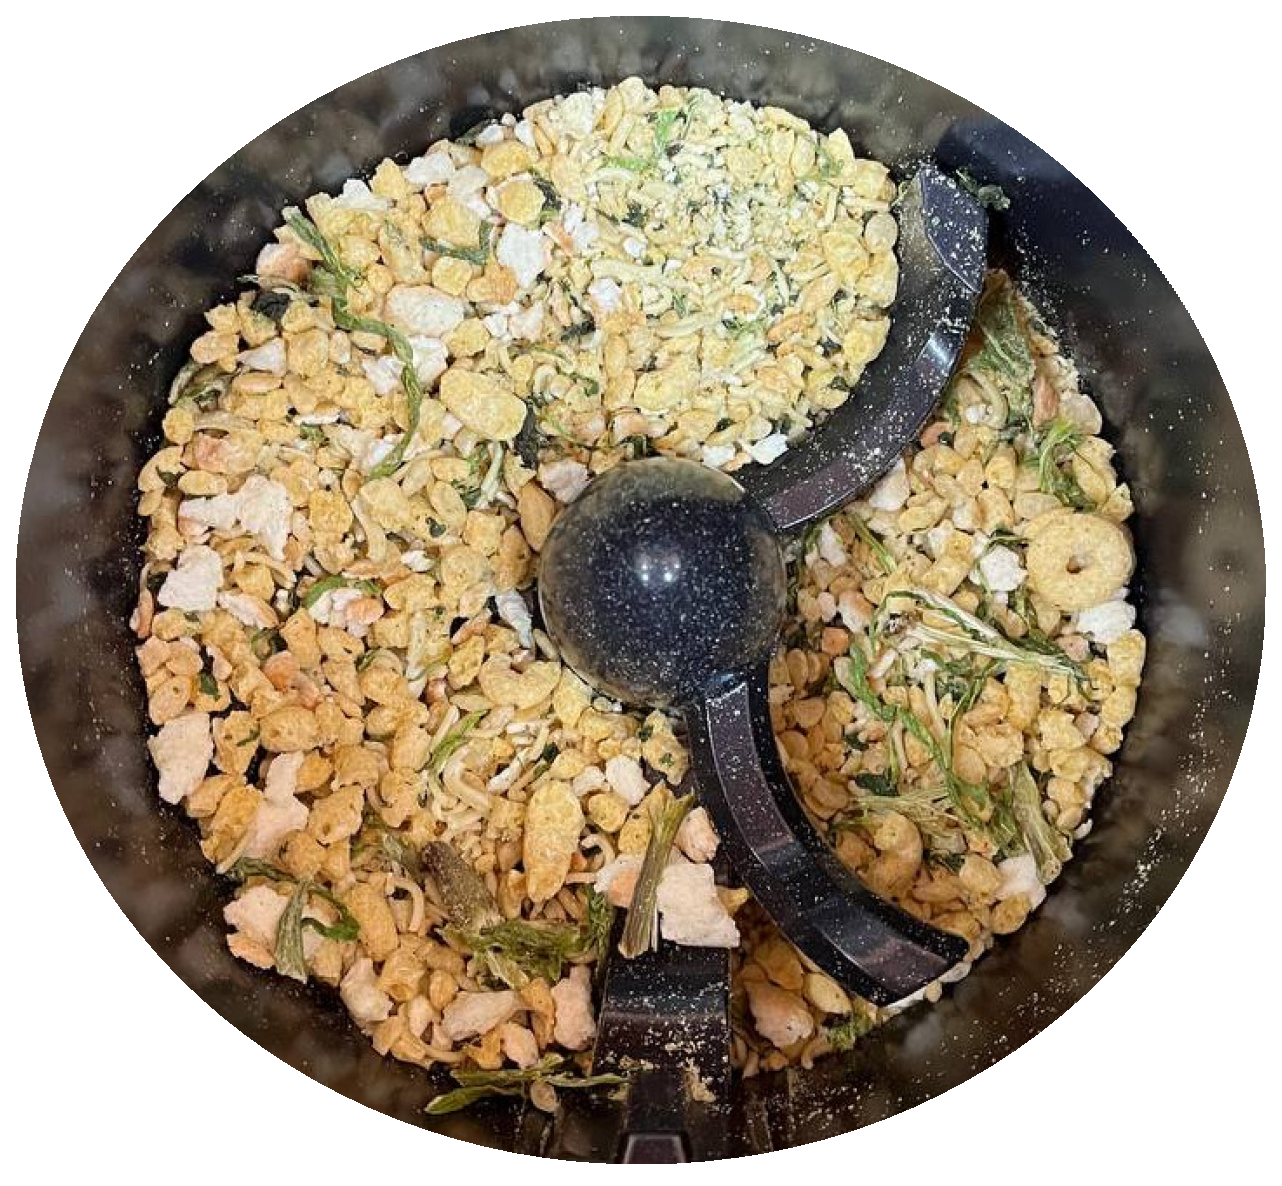
Upon mixing, the mixture of wastes was fed and processed by the commercially off-the-shelf electrical composter, Zero Waste Eco Bin shown in
Figure 3, to produce an end-product which is referred to as processed kitchen waste. This composter was chosen due to its simple, easy-to-use, and safe operations. From a single chamber, the composter is able to process the kitchen waste in a relatively short time, with up to 2 litres of samples by volume. This is made possible due to the accelerated thermophilic and mesophilic phases. The composting mixture is subjected to a three-phase cycle; drying, grinding and cooling, after which it undergoes sterilization with the aid of ultraviolet-c to kill unwanted pathogens. The composter maintains a temperature below 70 °C while continuously aerating the composting material during drying and grinding. The cooling mode returns the composting material to room temperature for safe handling. This is all performed with just a click of a button. In addition, the interior design of the composter prevents the possibility of material build-up and from sticking to the surface of the chamber. The composter is also equipped with an activated carbon filter to remove unwanted odours. The cycle also conveniently ends automatically once the process has been completed.
The mixture was first crushed into smaller pieces prior to loading into the composter to enable a more effective and efficient process of drying, grinding, cooling, and sterilizing the mixture of kitchen waste. Upon the completion of this procedure, a total of 6 samples of processed kitchen waste were produced and labelled, with initial C/N ratios of 10, 15, 20, 25, 30, and 35. This paper implicitly refers to some parts of the experiment from Mortula et al. [
6] on the different proportions of waste.
Every C/N ratio sample was then divided into two equal parts of 65 g each, with one part mixed with 10 parts of loamy soil by volume and the other part left on its own (without the addition of loamy soil). In total, there were 12 sub-samples: 2 sub-samples (with and without soil) for every C/N ratio. The 12 sub-samples were then allowed to cure for a period of 30 days, which were 3 extra days from the 4 weeks minimum, as per instruction in the manual of the electrical composter. This requirement for a curing period is a limitation of the electrical composter, whereby the composting products are not fully matured yet and still require an additional period of curing to be ready for use.
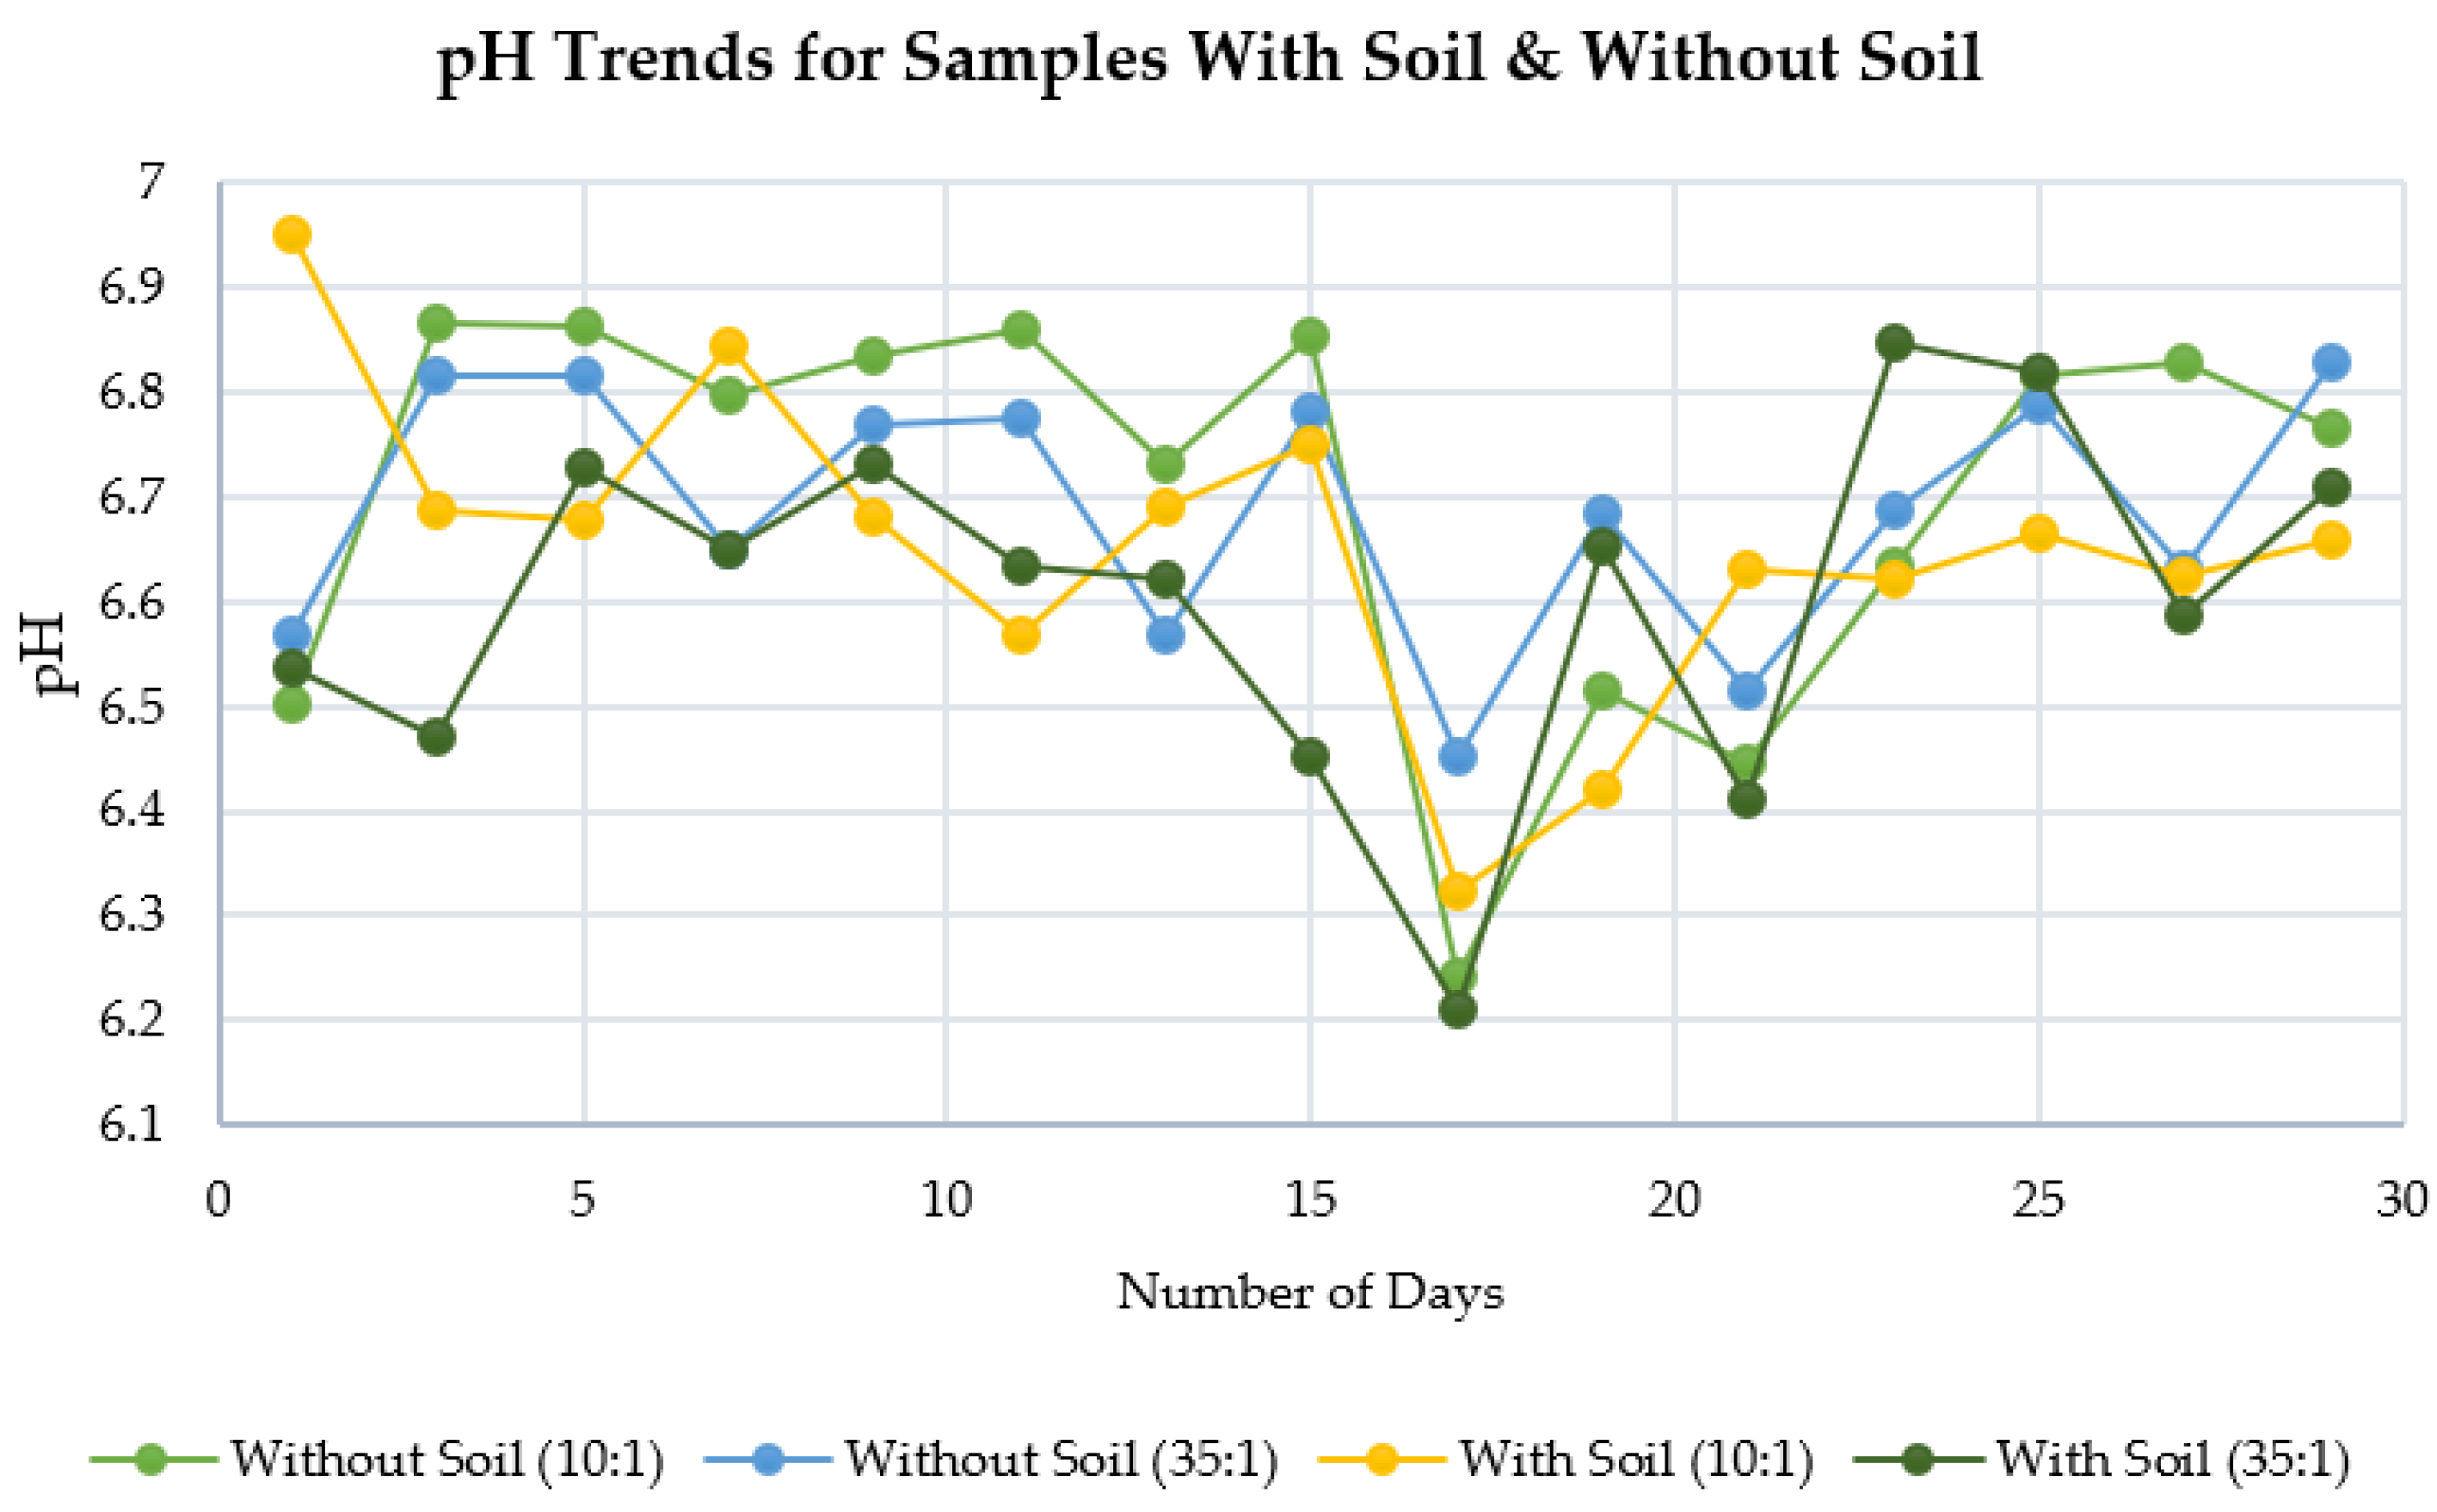
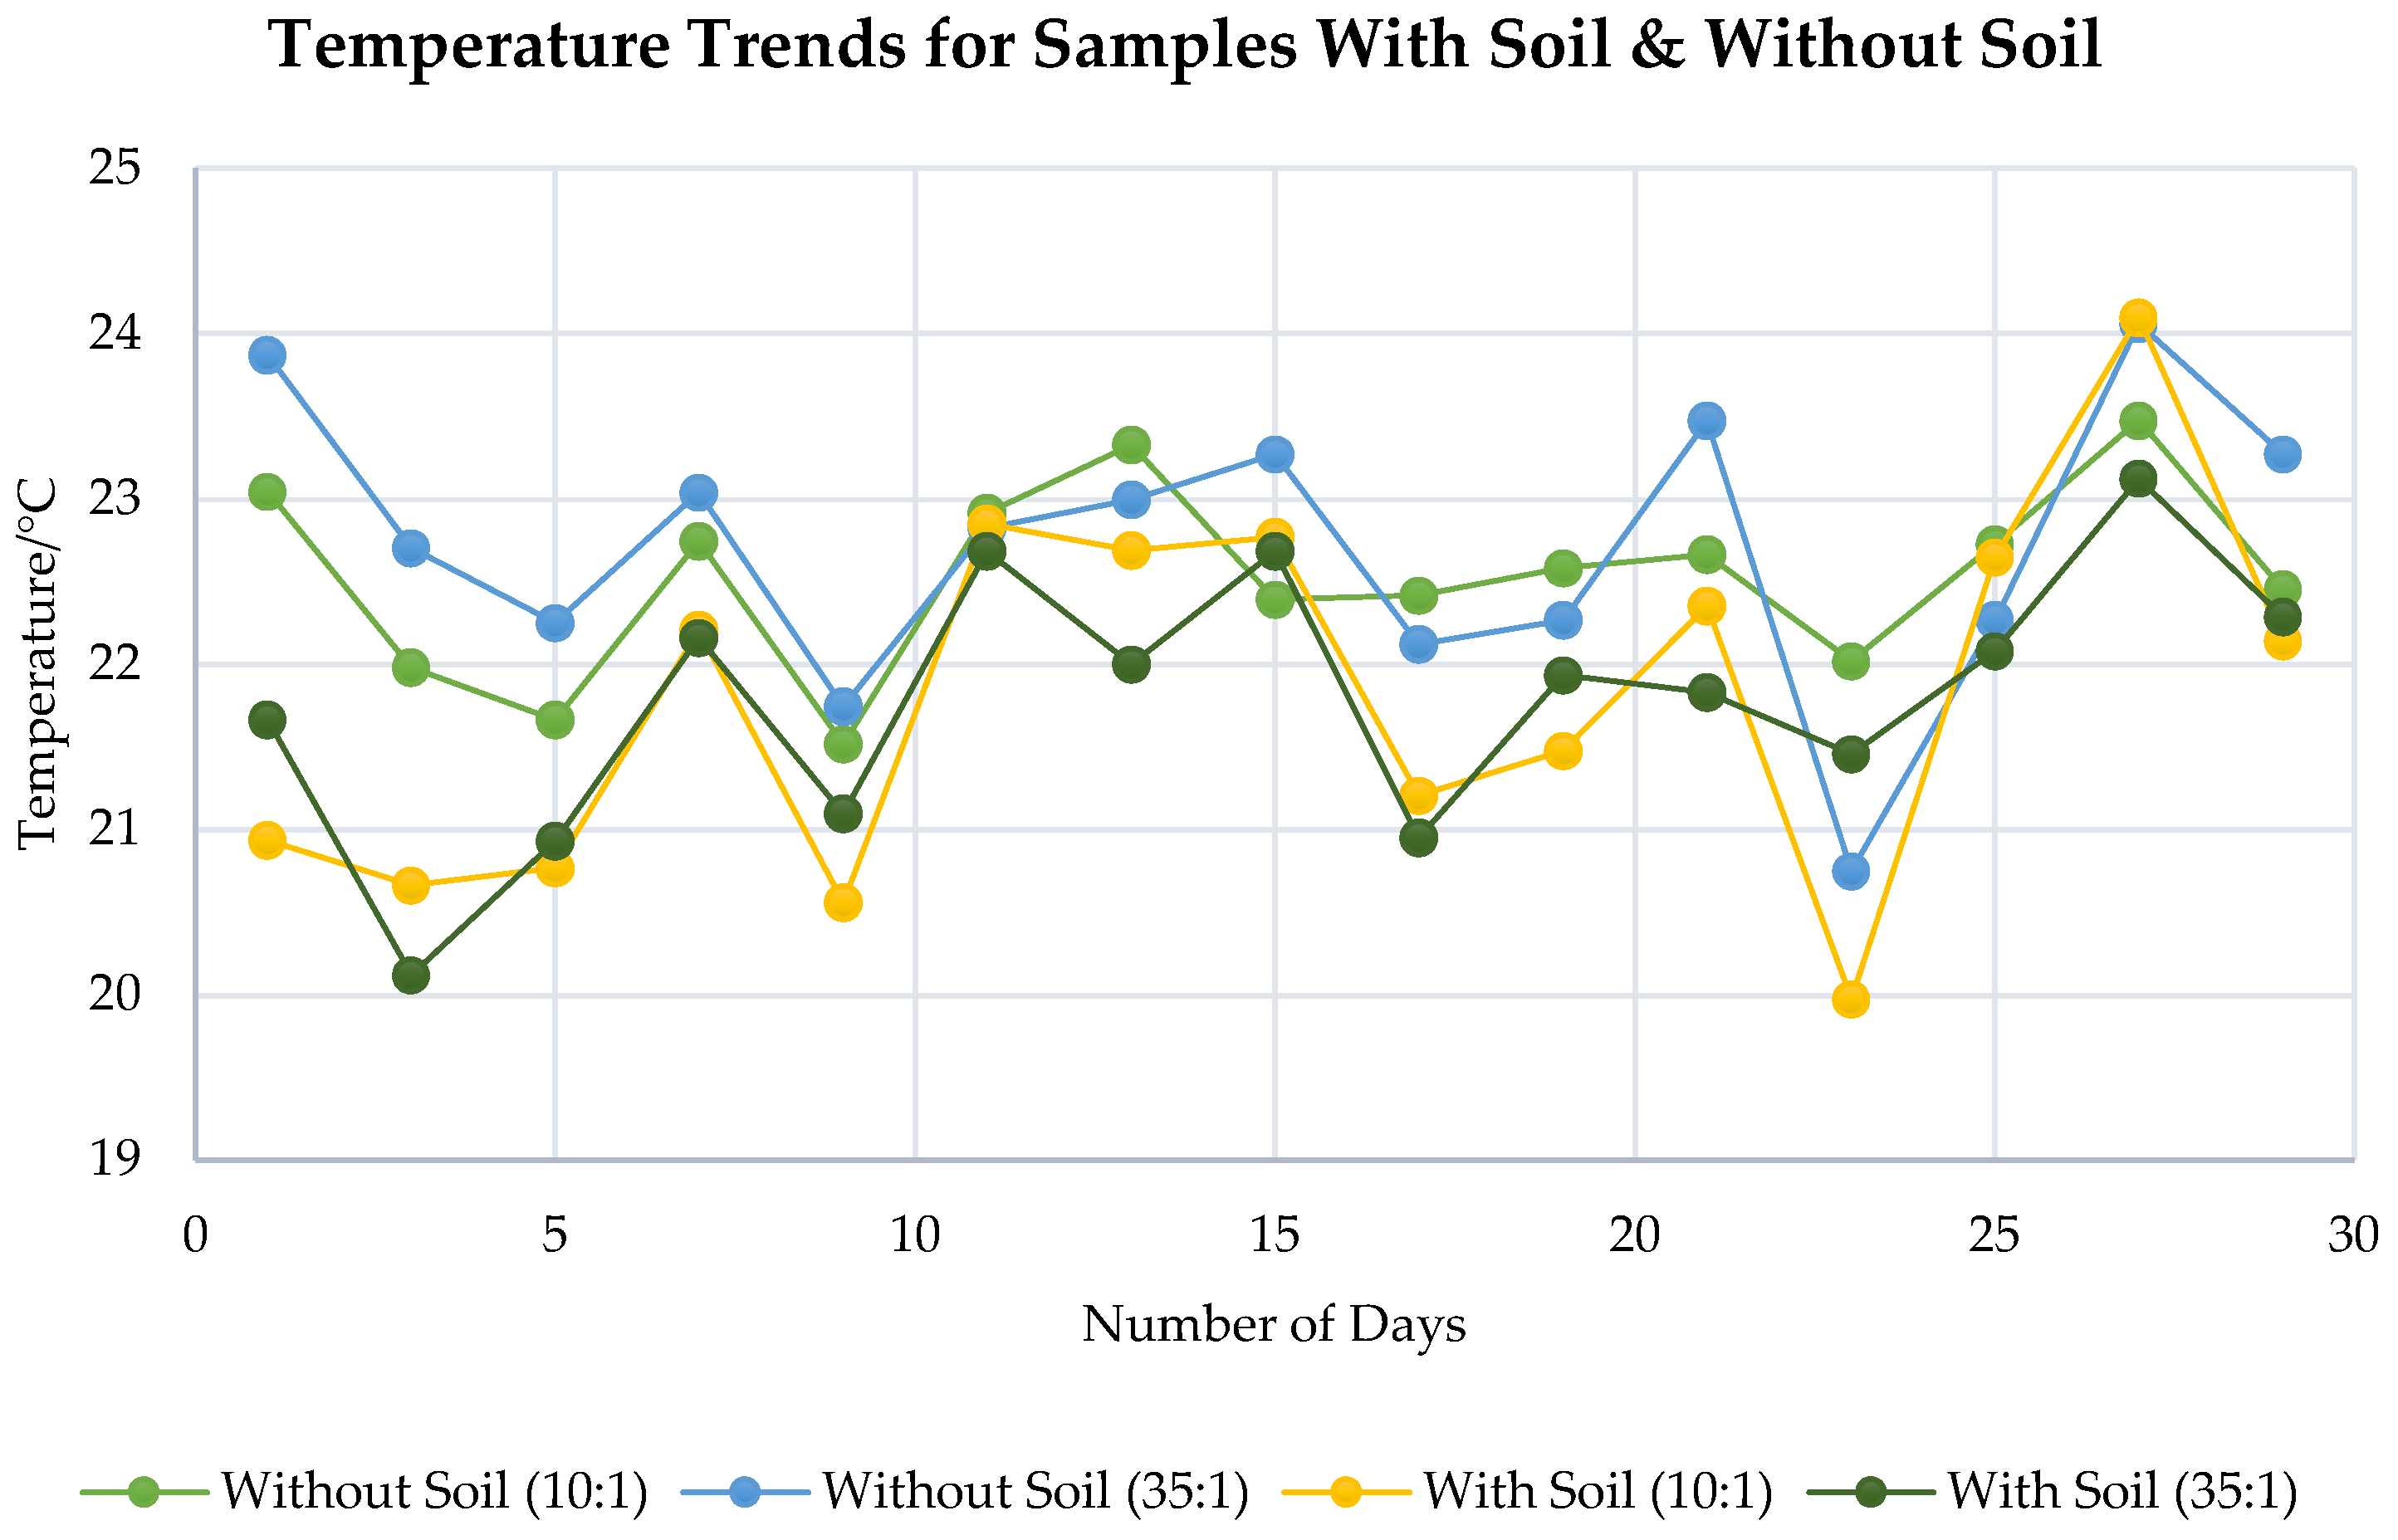
During the curing period, temperature and pH readings of the sub-samples were recorded every 2 days using DS18B20 Temperature Sensor and JXCT Soil Integrated Sensor, respectively, with the sub-samples turned once every week for aeration. The moisture of the samples was measured using a moisture sensor to confirm a moisture level of between 40% to 60%. Two cured sub-samples (with and without soil) for each of the 6 different C/N ratios, giving a total of 12 cured sub-samples, were produced from this step.
2.3. Compost Maturity Test
The fourth step involves using the two types of cured sub-samples of the six different C/N ratios from the previous step for seed germination purposes. Mung beans were used for the seed germination test as they can be easily procured and have a relatively fast germination rate. Cured sub-samples that had been mixed with loamy soil were used directly for seed germination. On the other hand, cured sub-samples without soil were pre-processed further before being used for seed germination purposes. Each of the cured sub-samples without soils was mixed with deionized water in a ratio of 1:2.5 (
w/
v) and then shaken well using a lab shaker for 1 h to allow proper mixing. The mixtures were then centrifuged at 10,000 revolutions per minute, twice for 15 min and 5 min, respectively, to collect the supernatant. The collected supernatants of compost extracts were then used for seed germination purposes. These procedures are referred from the studies by Milon et al. [
35] and Barral et al. [
36].
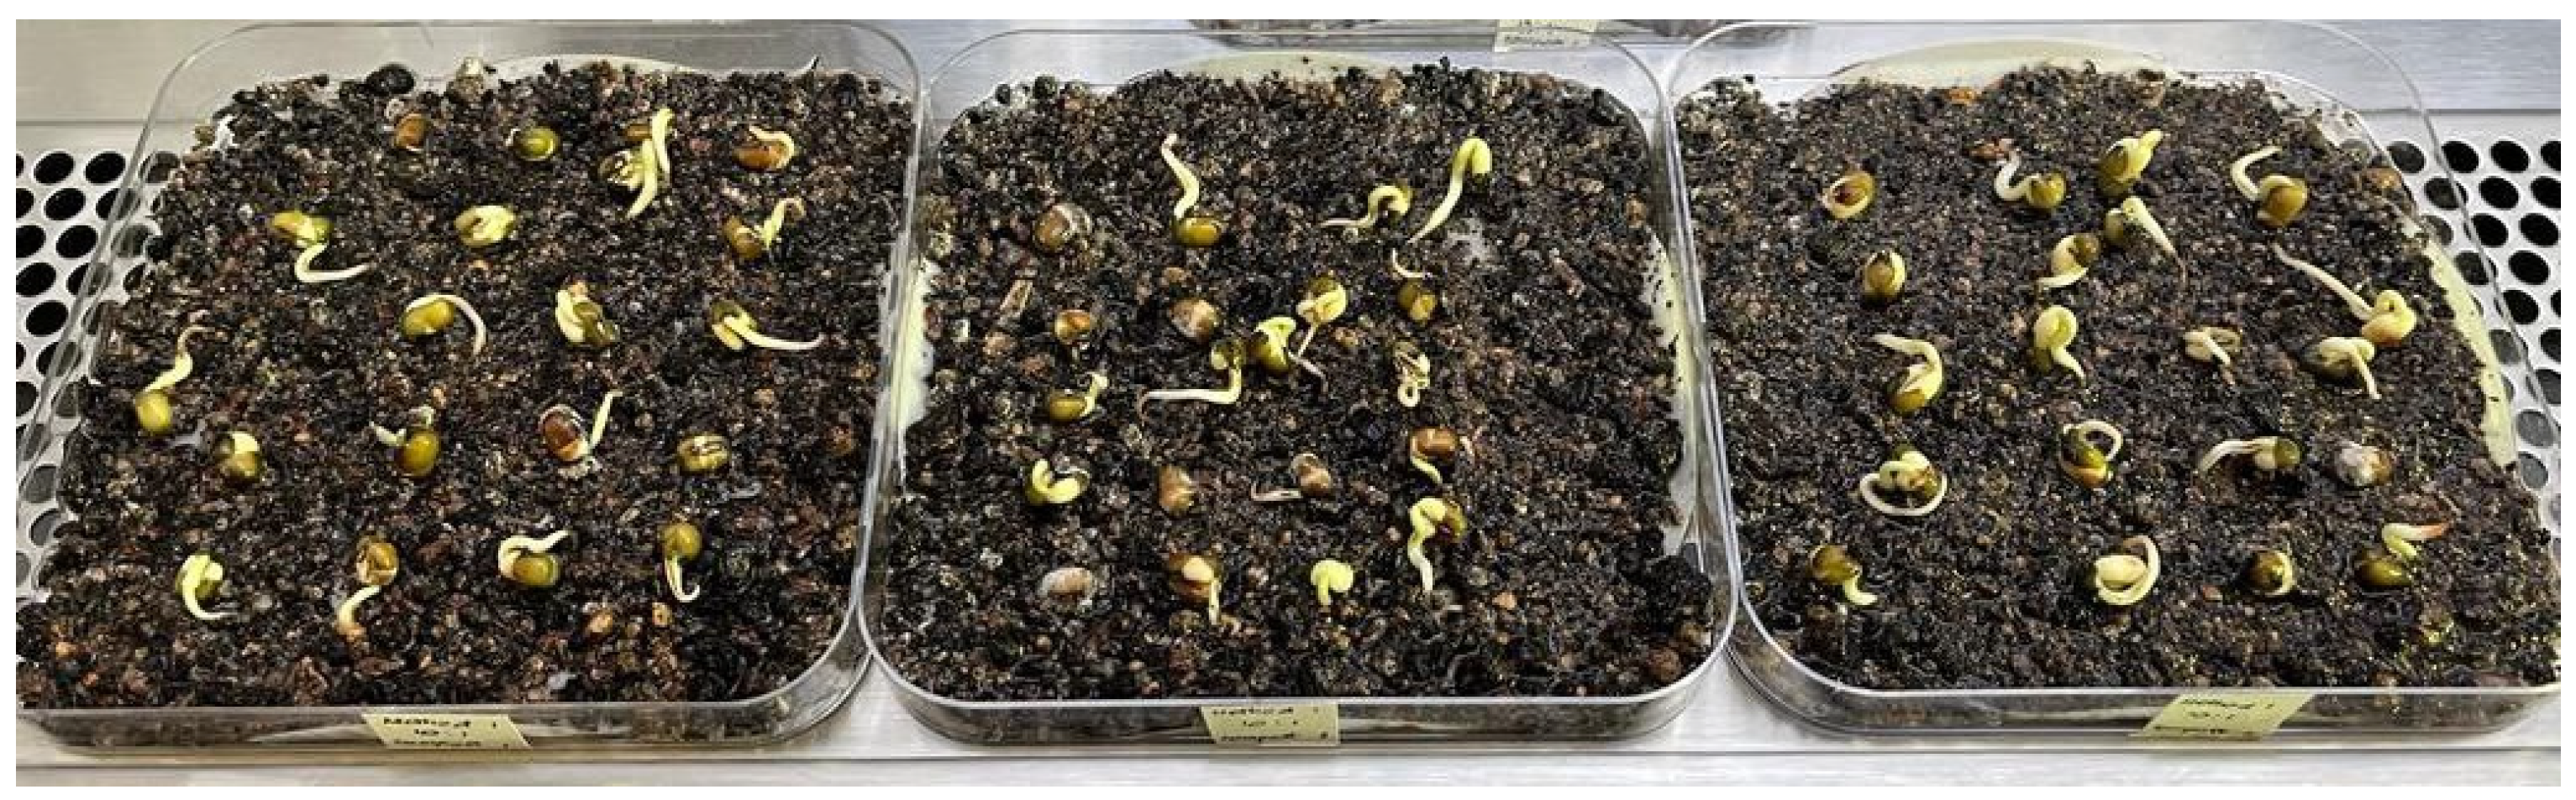
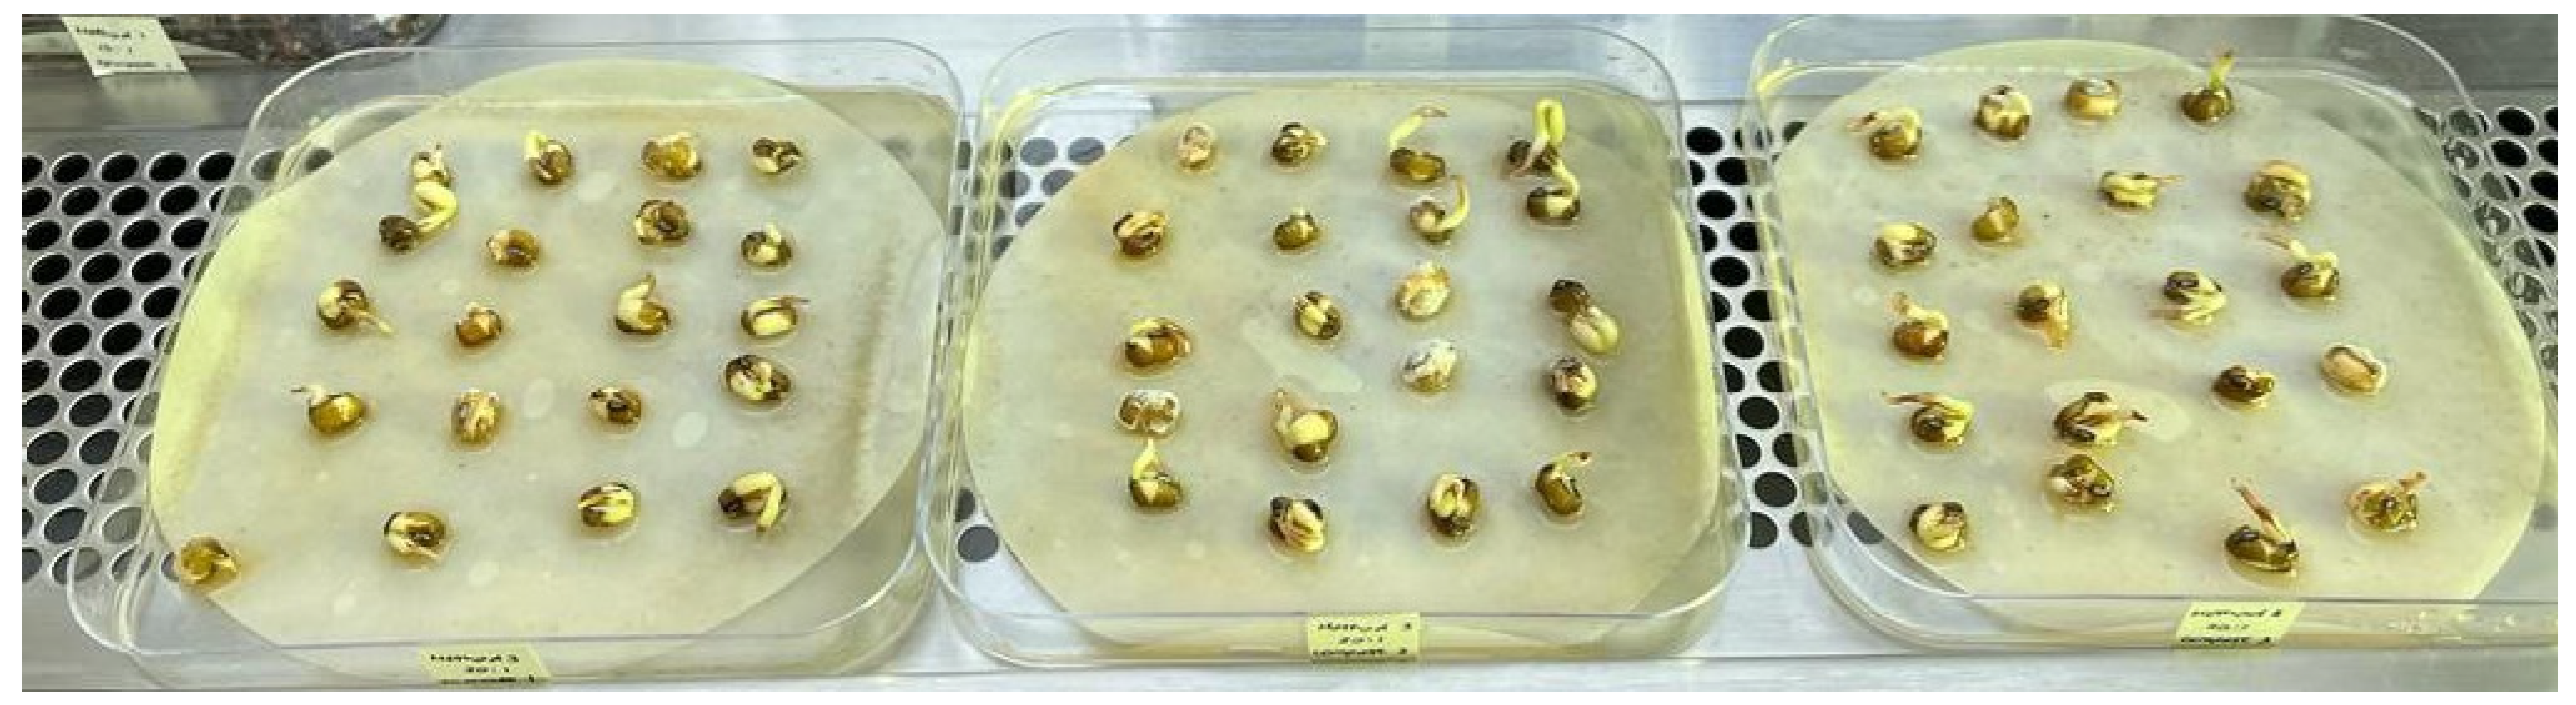
Each of the sub-samples with soils was spread out thinly on 3 Petri dishes before arranging 20 mung beans on each of the Petri dishes to allow germination. For sub-samples without soil, the collected compost extracts for the different C/N ratios were poured on 3 Petri dishes, lined with filter paper, before the 20 mung beans were arranged on each of the Petri dishes to allow germination. Each sub-sample was replicated 3 times to reduce possible errors in the experiment. Seed germination was allowed for a total of 9 days. During the germination period, each Petri dish was regularly moistened with deionized water as necessary.
2.4. Procedures for Results Analyses
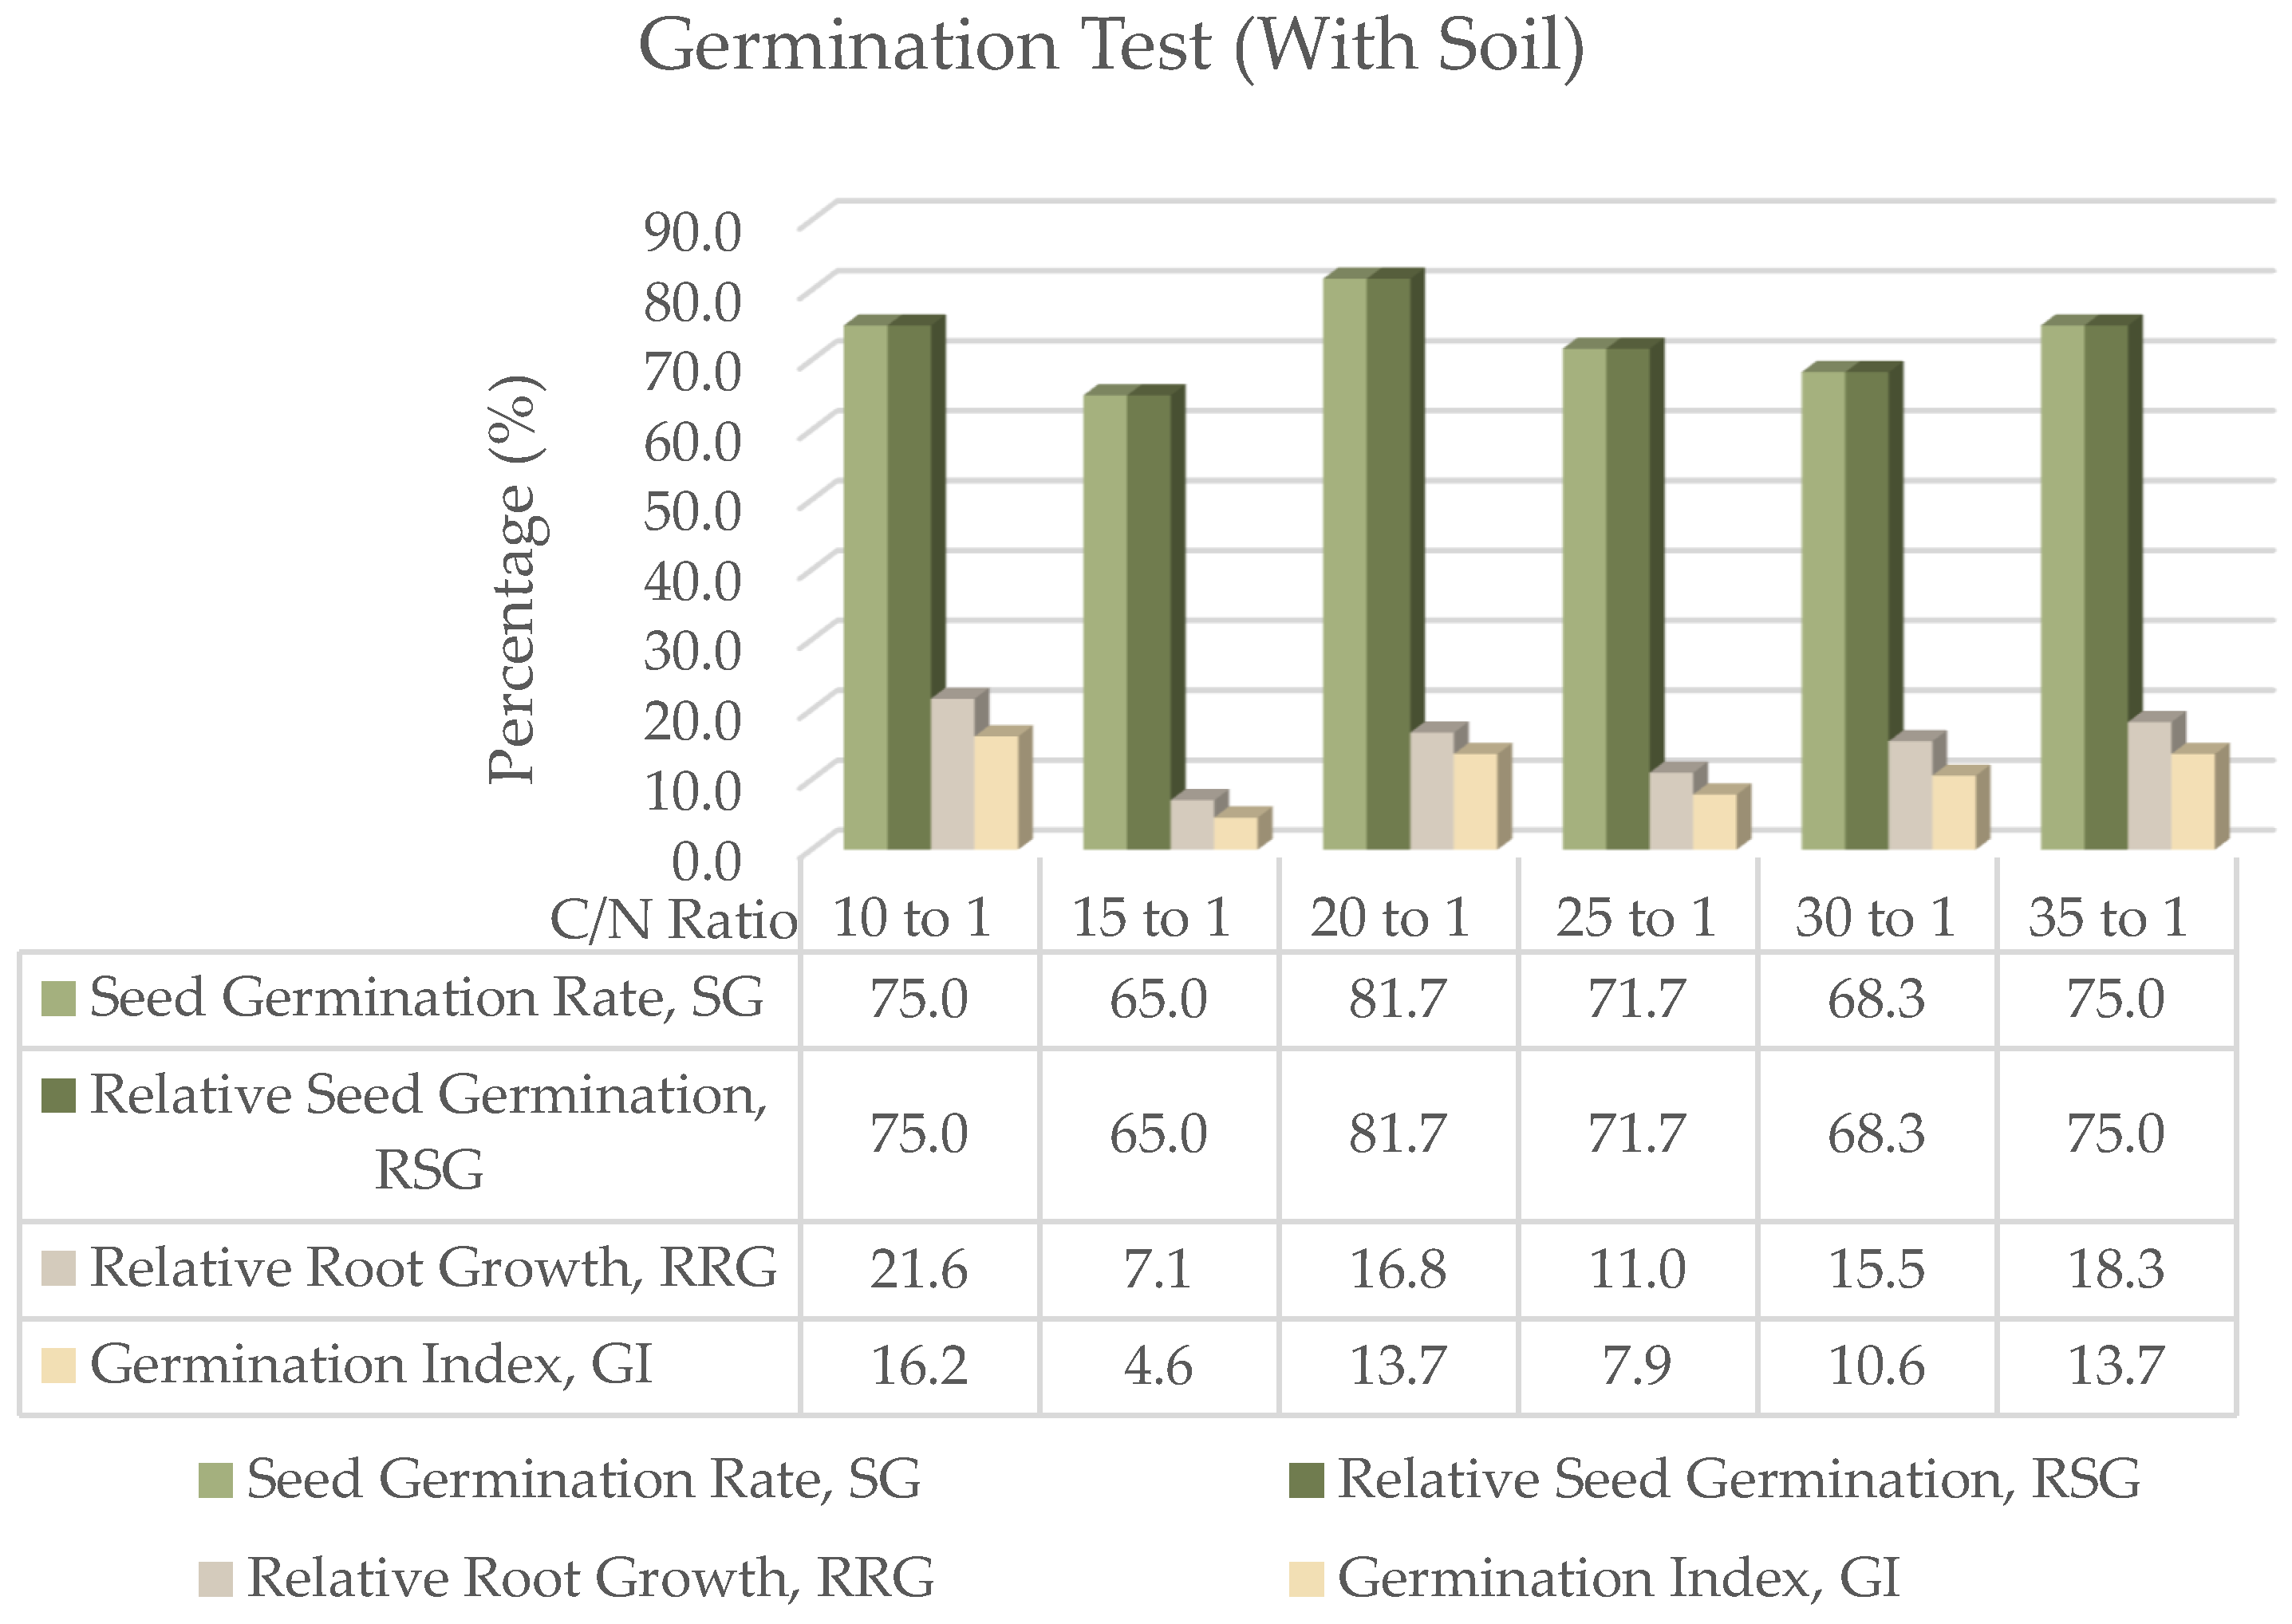
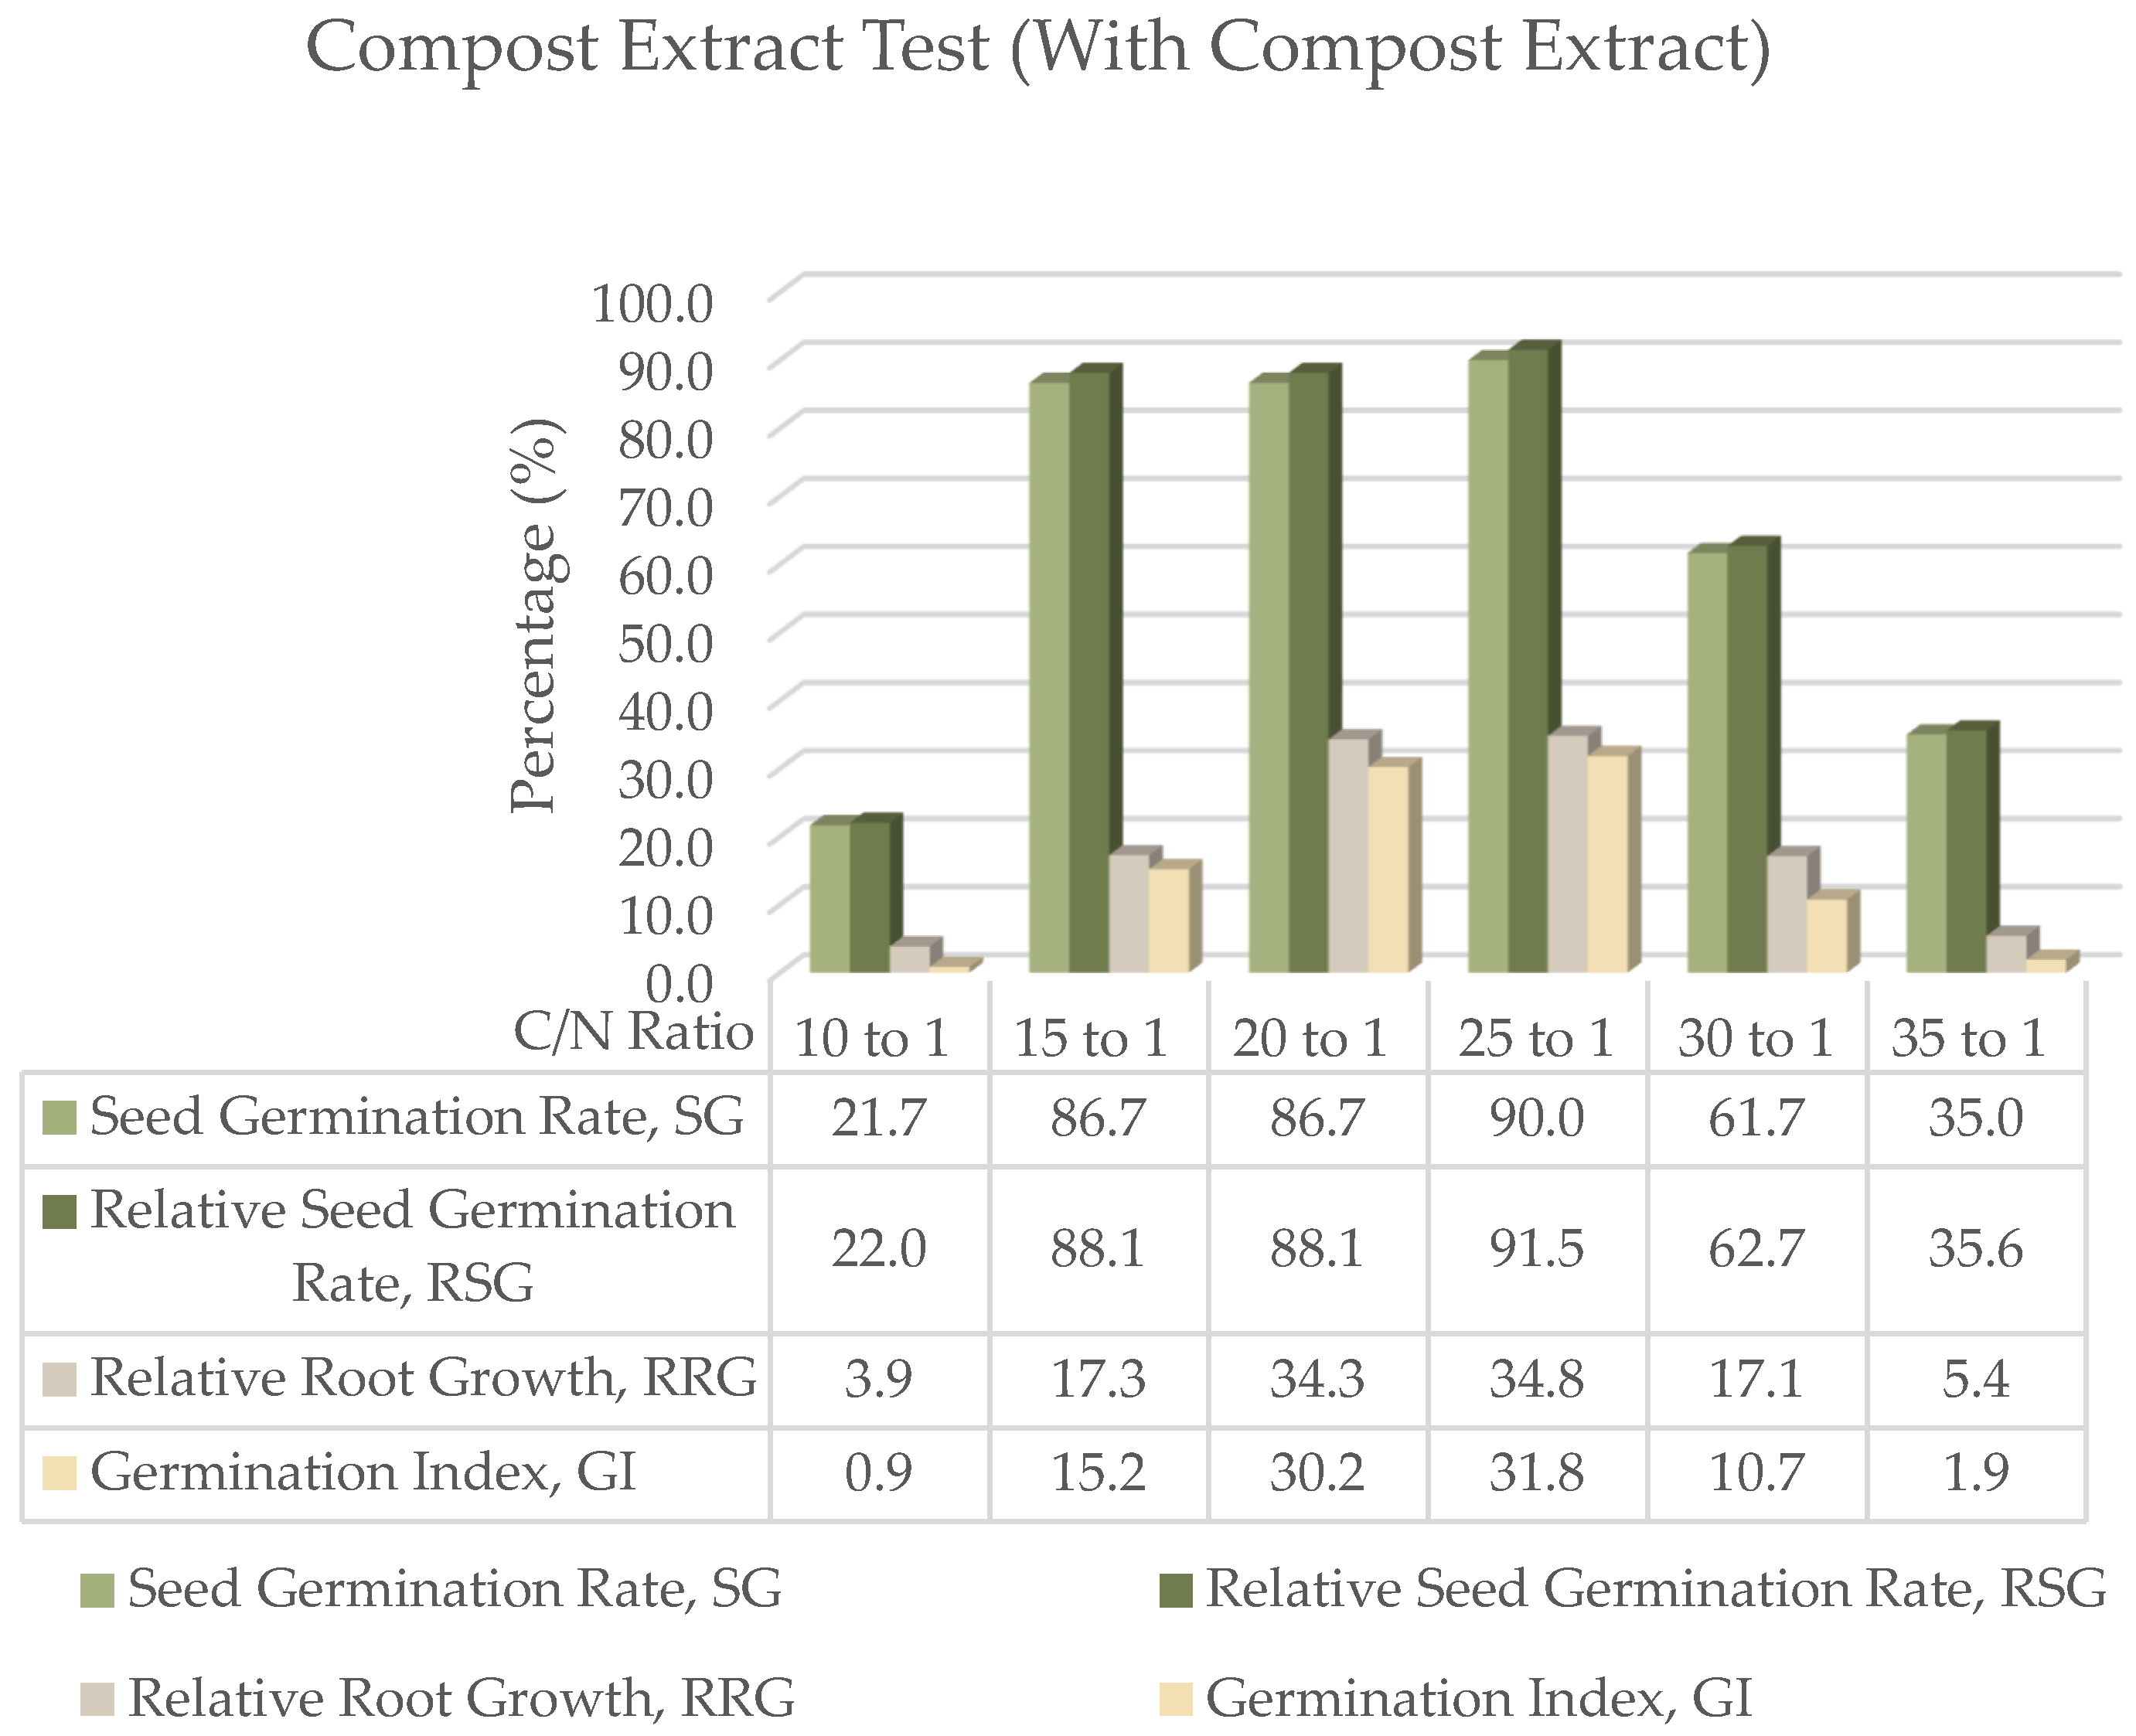
After a nine-day period of seed germination, the seeds were taken out from each Petri dish. Deionized water was added to the control setup experiment for seed germination. This is applicable to both samples with and without soil. The grown roots from each seed and the number of germinated seeds for the different sub-samples were recorded for further analysis. The length of the root was measured using a digital Vernier Caliper between the end of the shoot and the root in millimetres. Seed germination (SG) expresses the percentage of germinated seeds for each sub-sample to the total number of seeds, as given in Equation (2). This is further normalized with respect to the number of seeds germinated in the control experiment, using Equation (3) to give Relative Seed Germination (RSG). To quantify the root length growth, the mean root length of all sub-samples was calculated and normalized against the mean root length in the control experiment using Equation (4).
A good performance measure must consider both the number of germinated seeds as well as the growth of the roots. Germination index (GI), which considers both seed germination and the elongation of the seedlings’ roots, is a more practical and stronger indicator for evaluating the maturity of a compost via seed and seedling development [
37]. GI for each sub-sample can be calculated as follows.
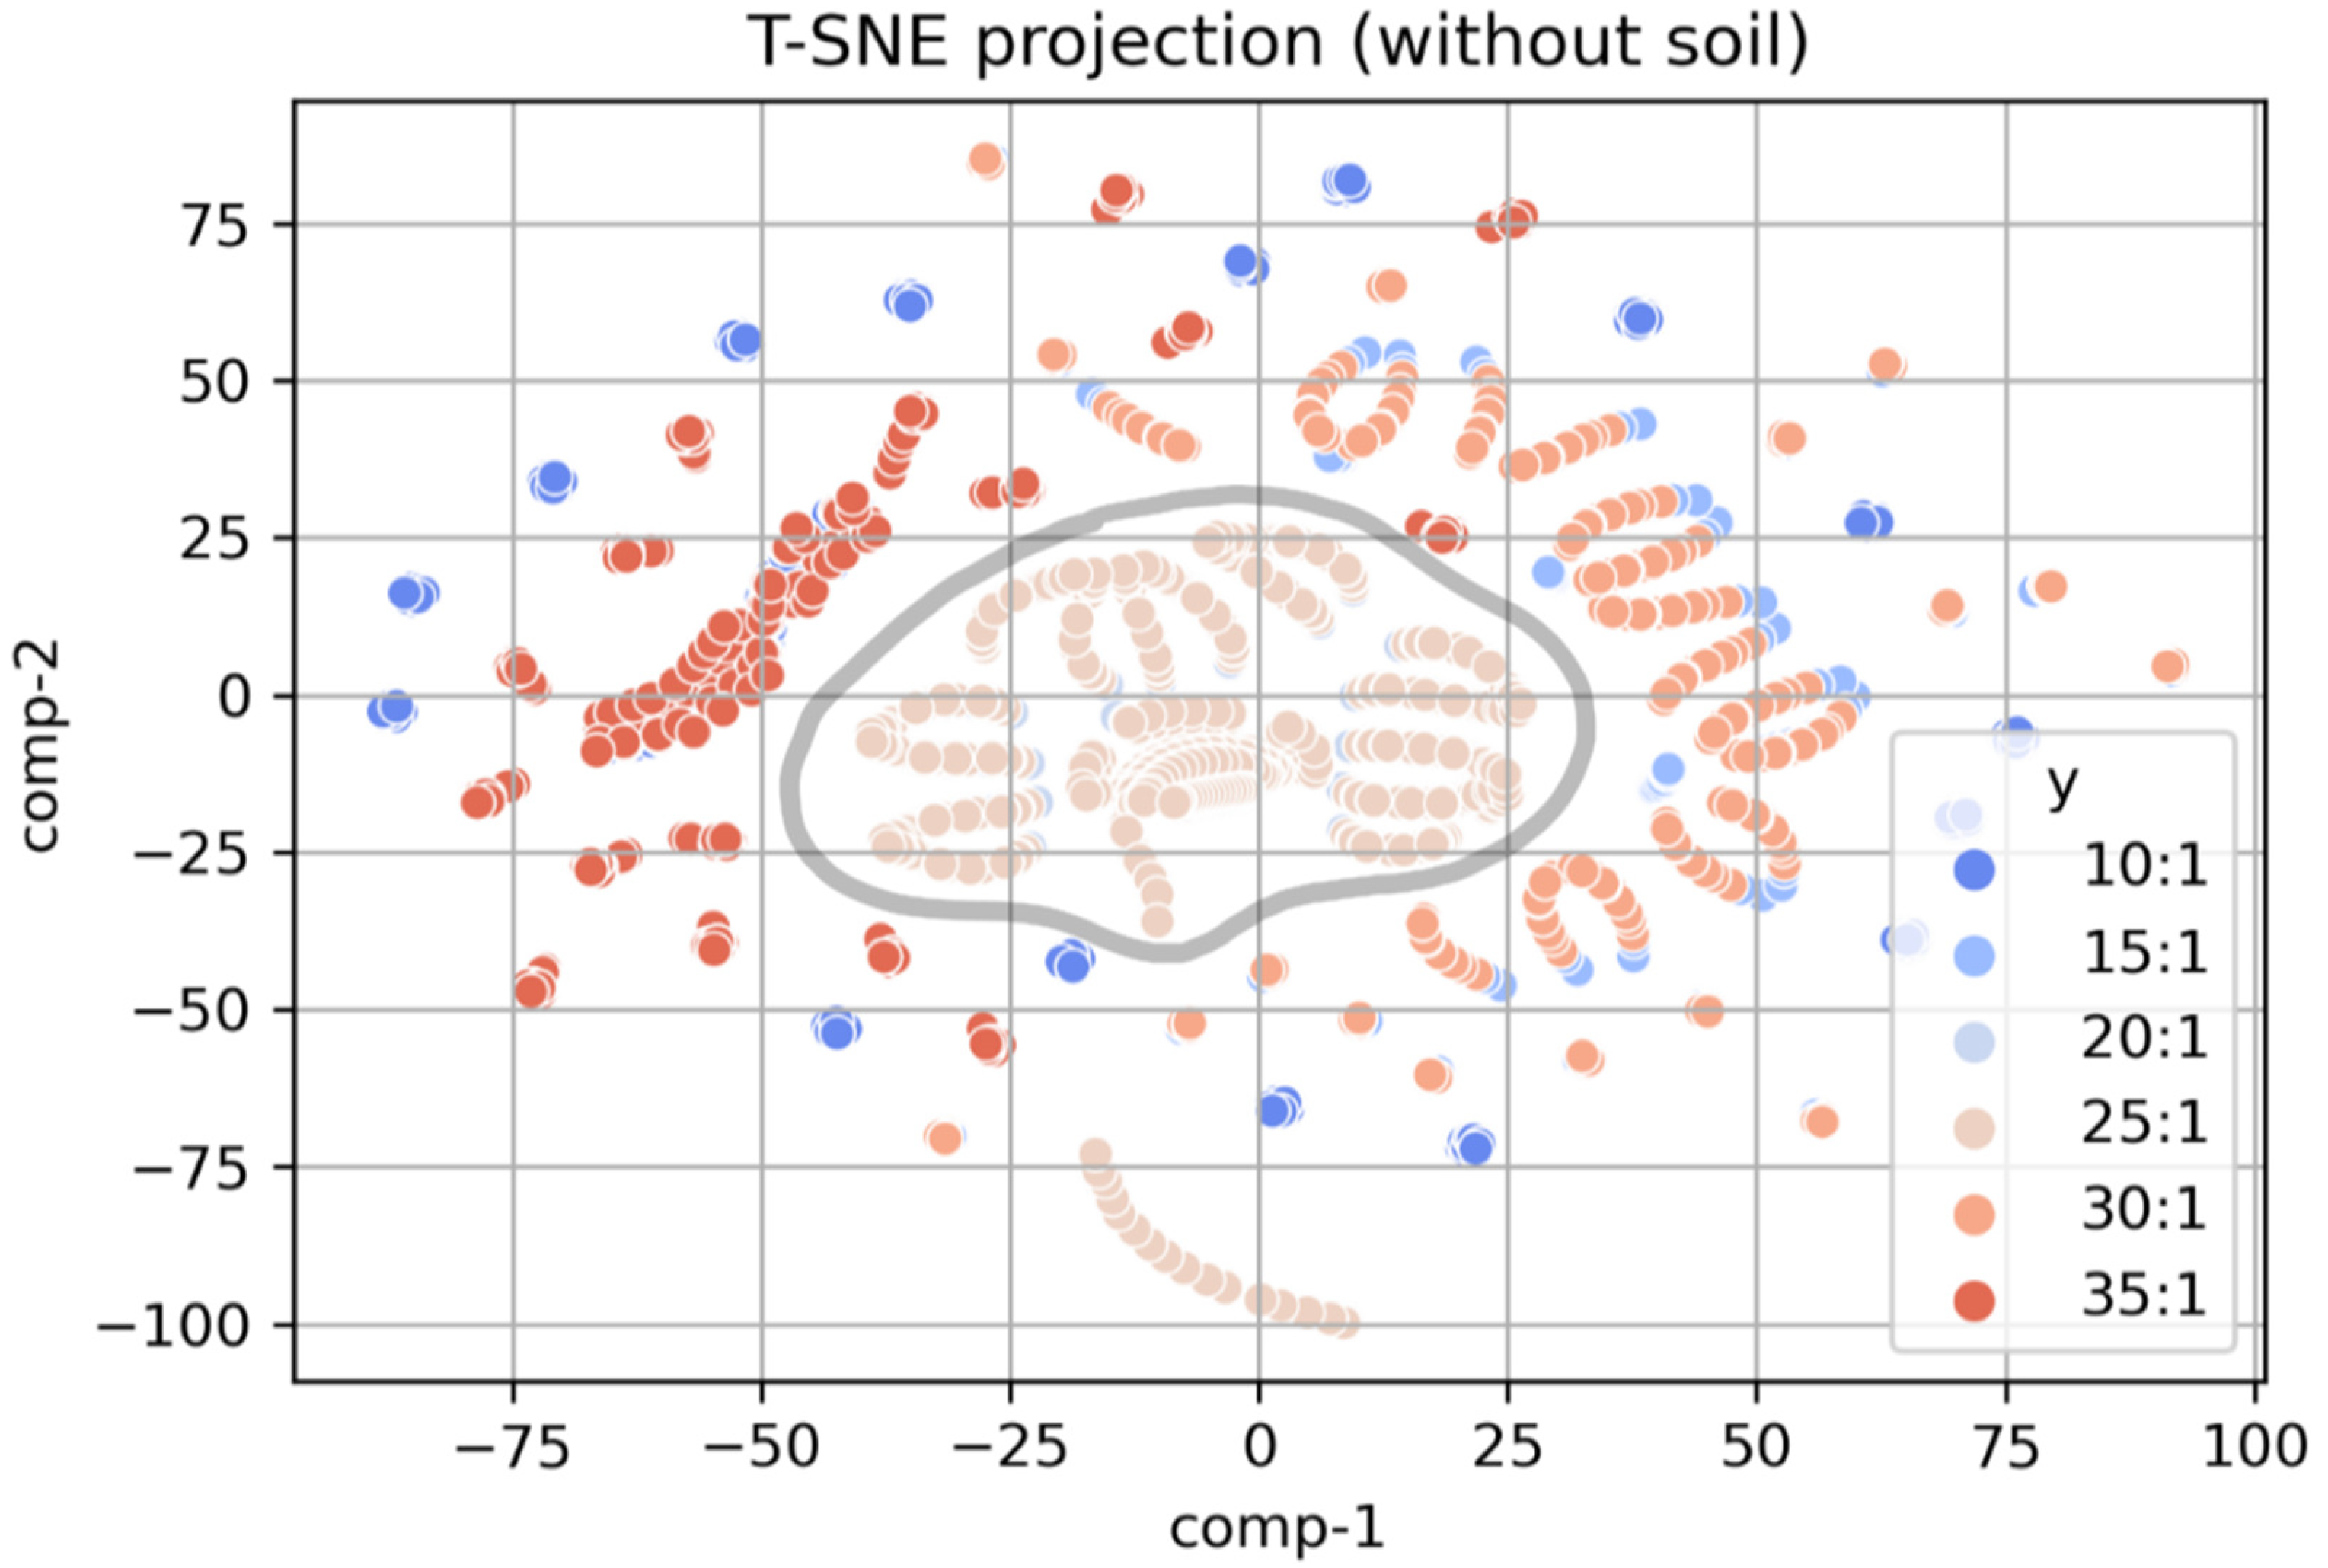
The calculated values of SG, RSG, RRG, and GI were plotted for both samples, with and without soil for direct comparison. Additionally, the collected data was further analysed by considering the six variables including the C/N ratio, day of curing, pH, the temperature of the samples, and the calculated GI and RG. The data included GI and RG as strong indicators for evaluating compost maturity.
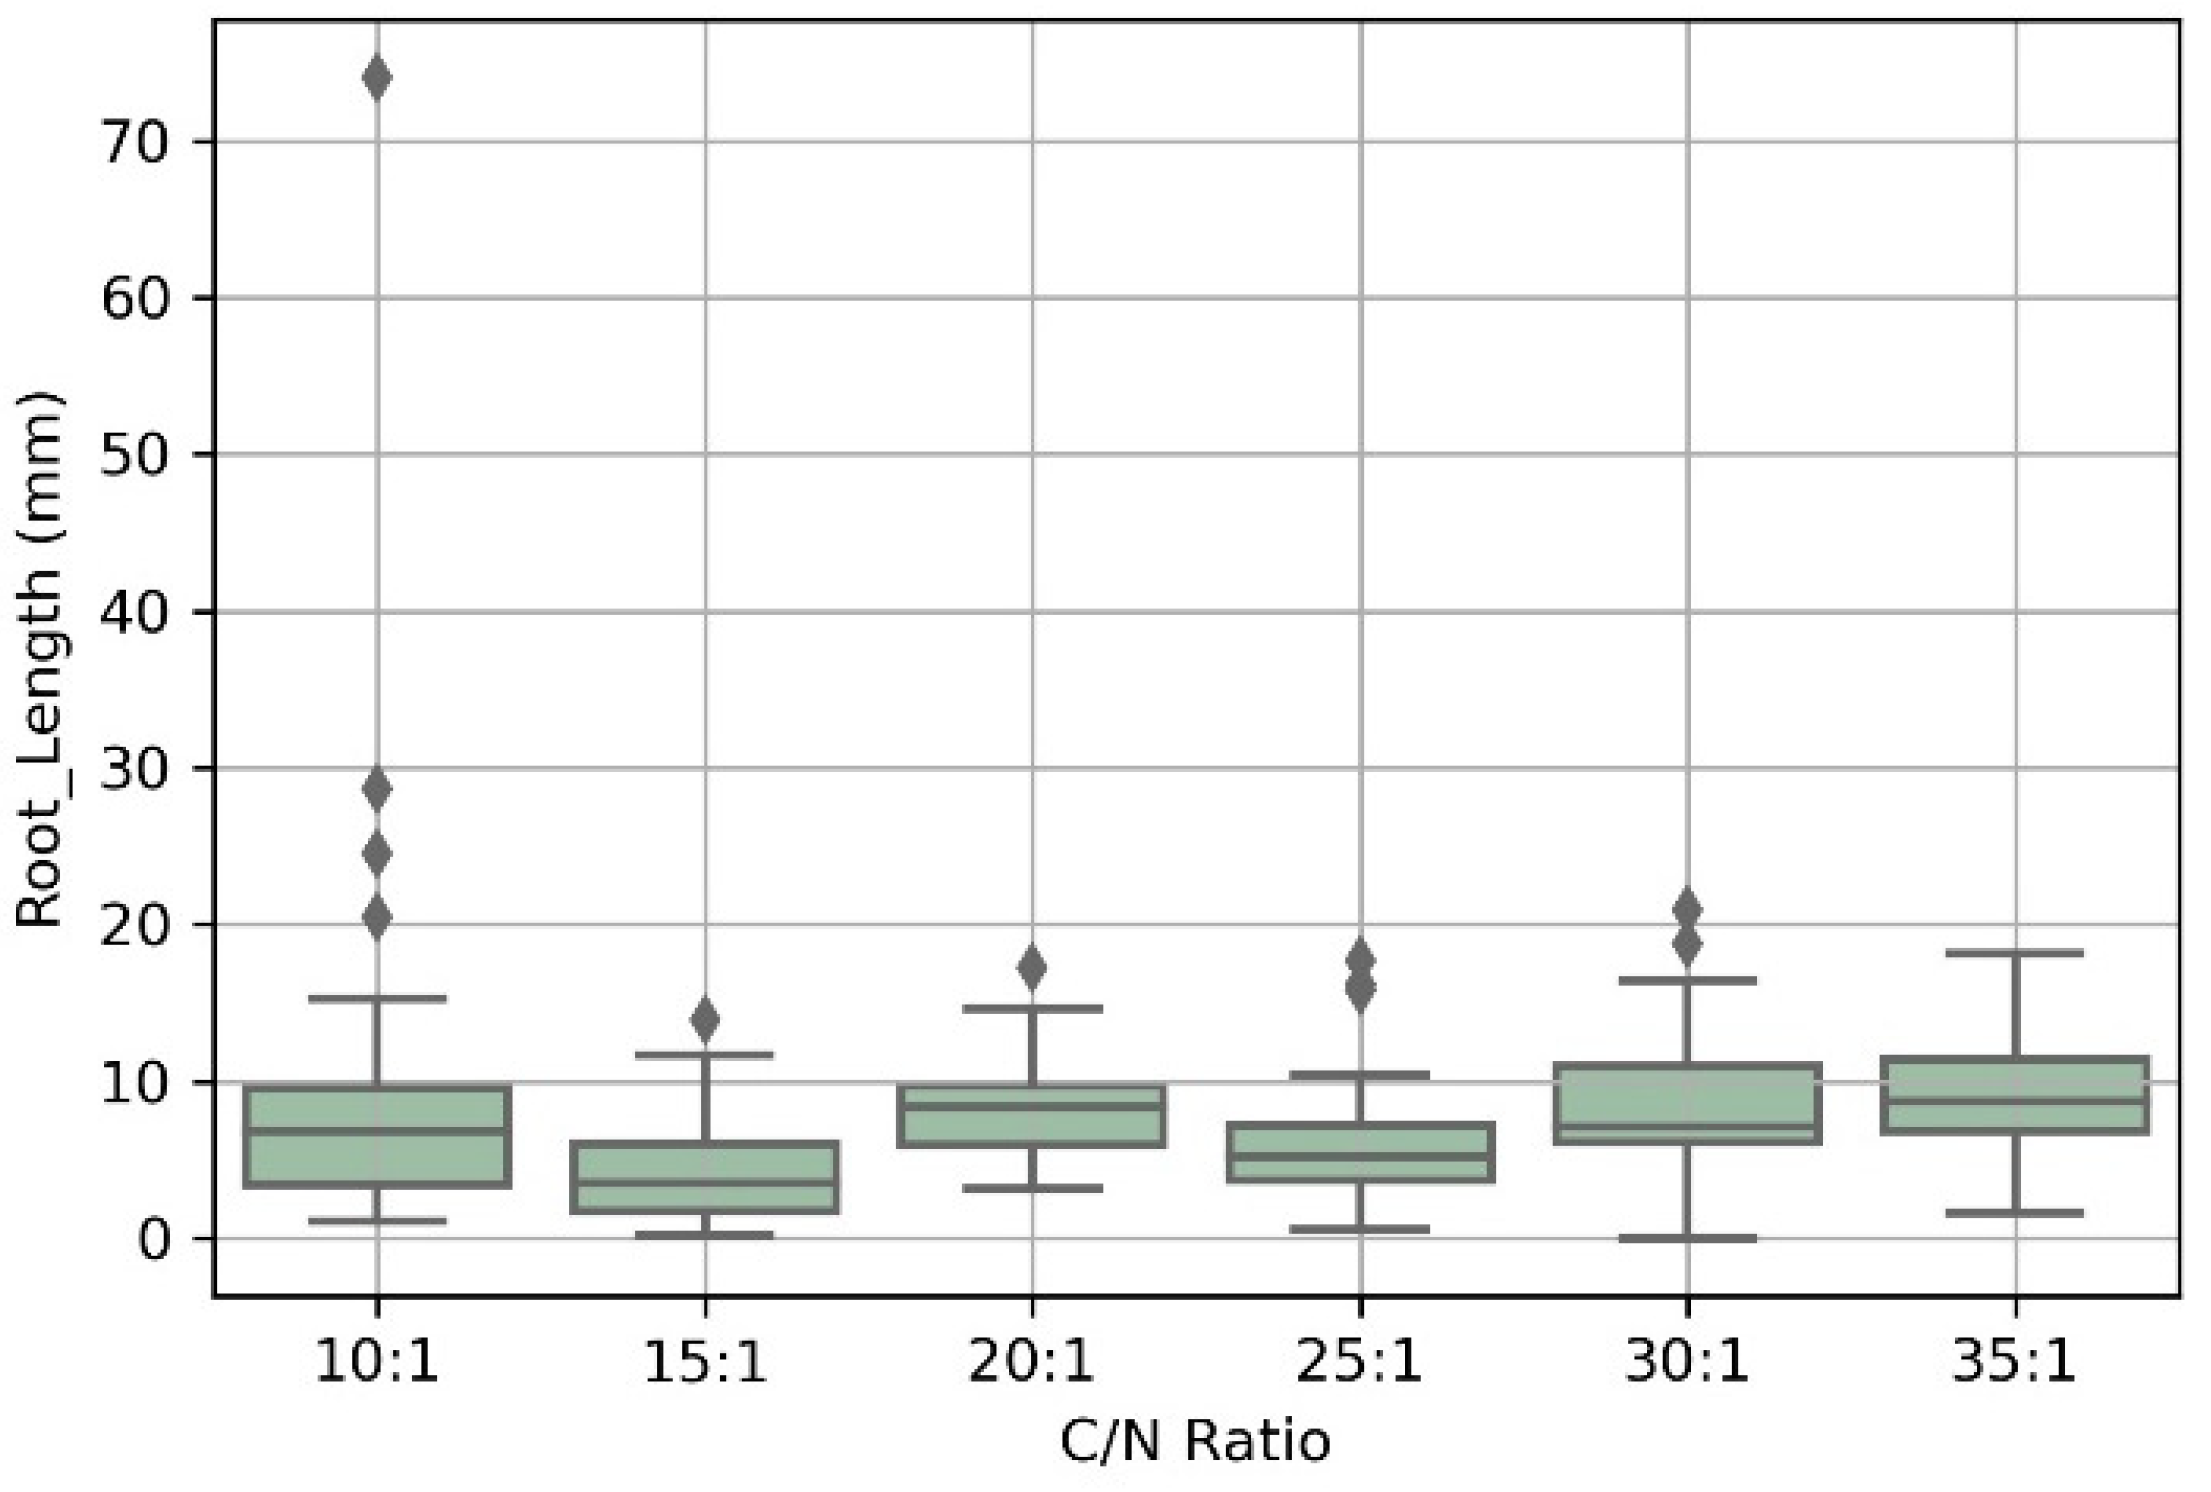
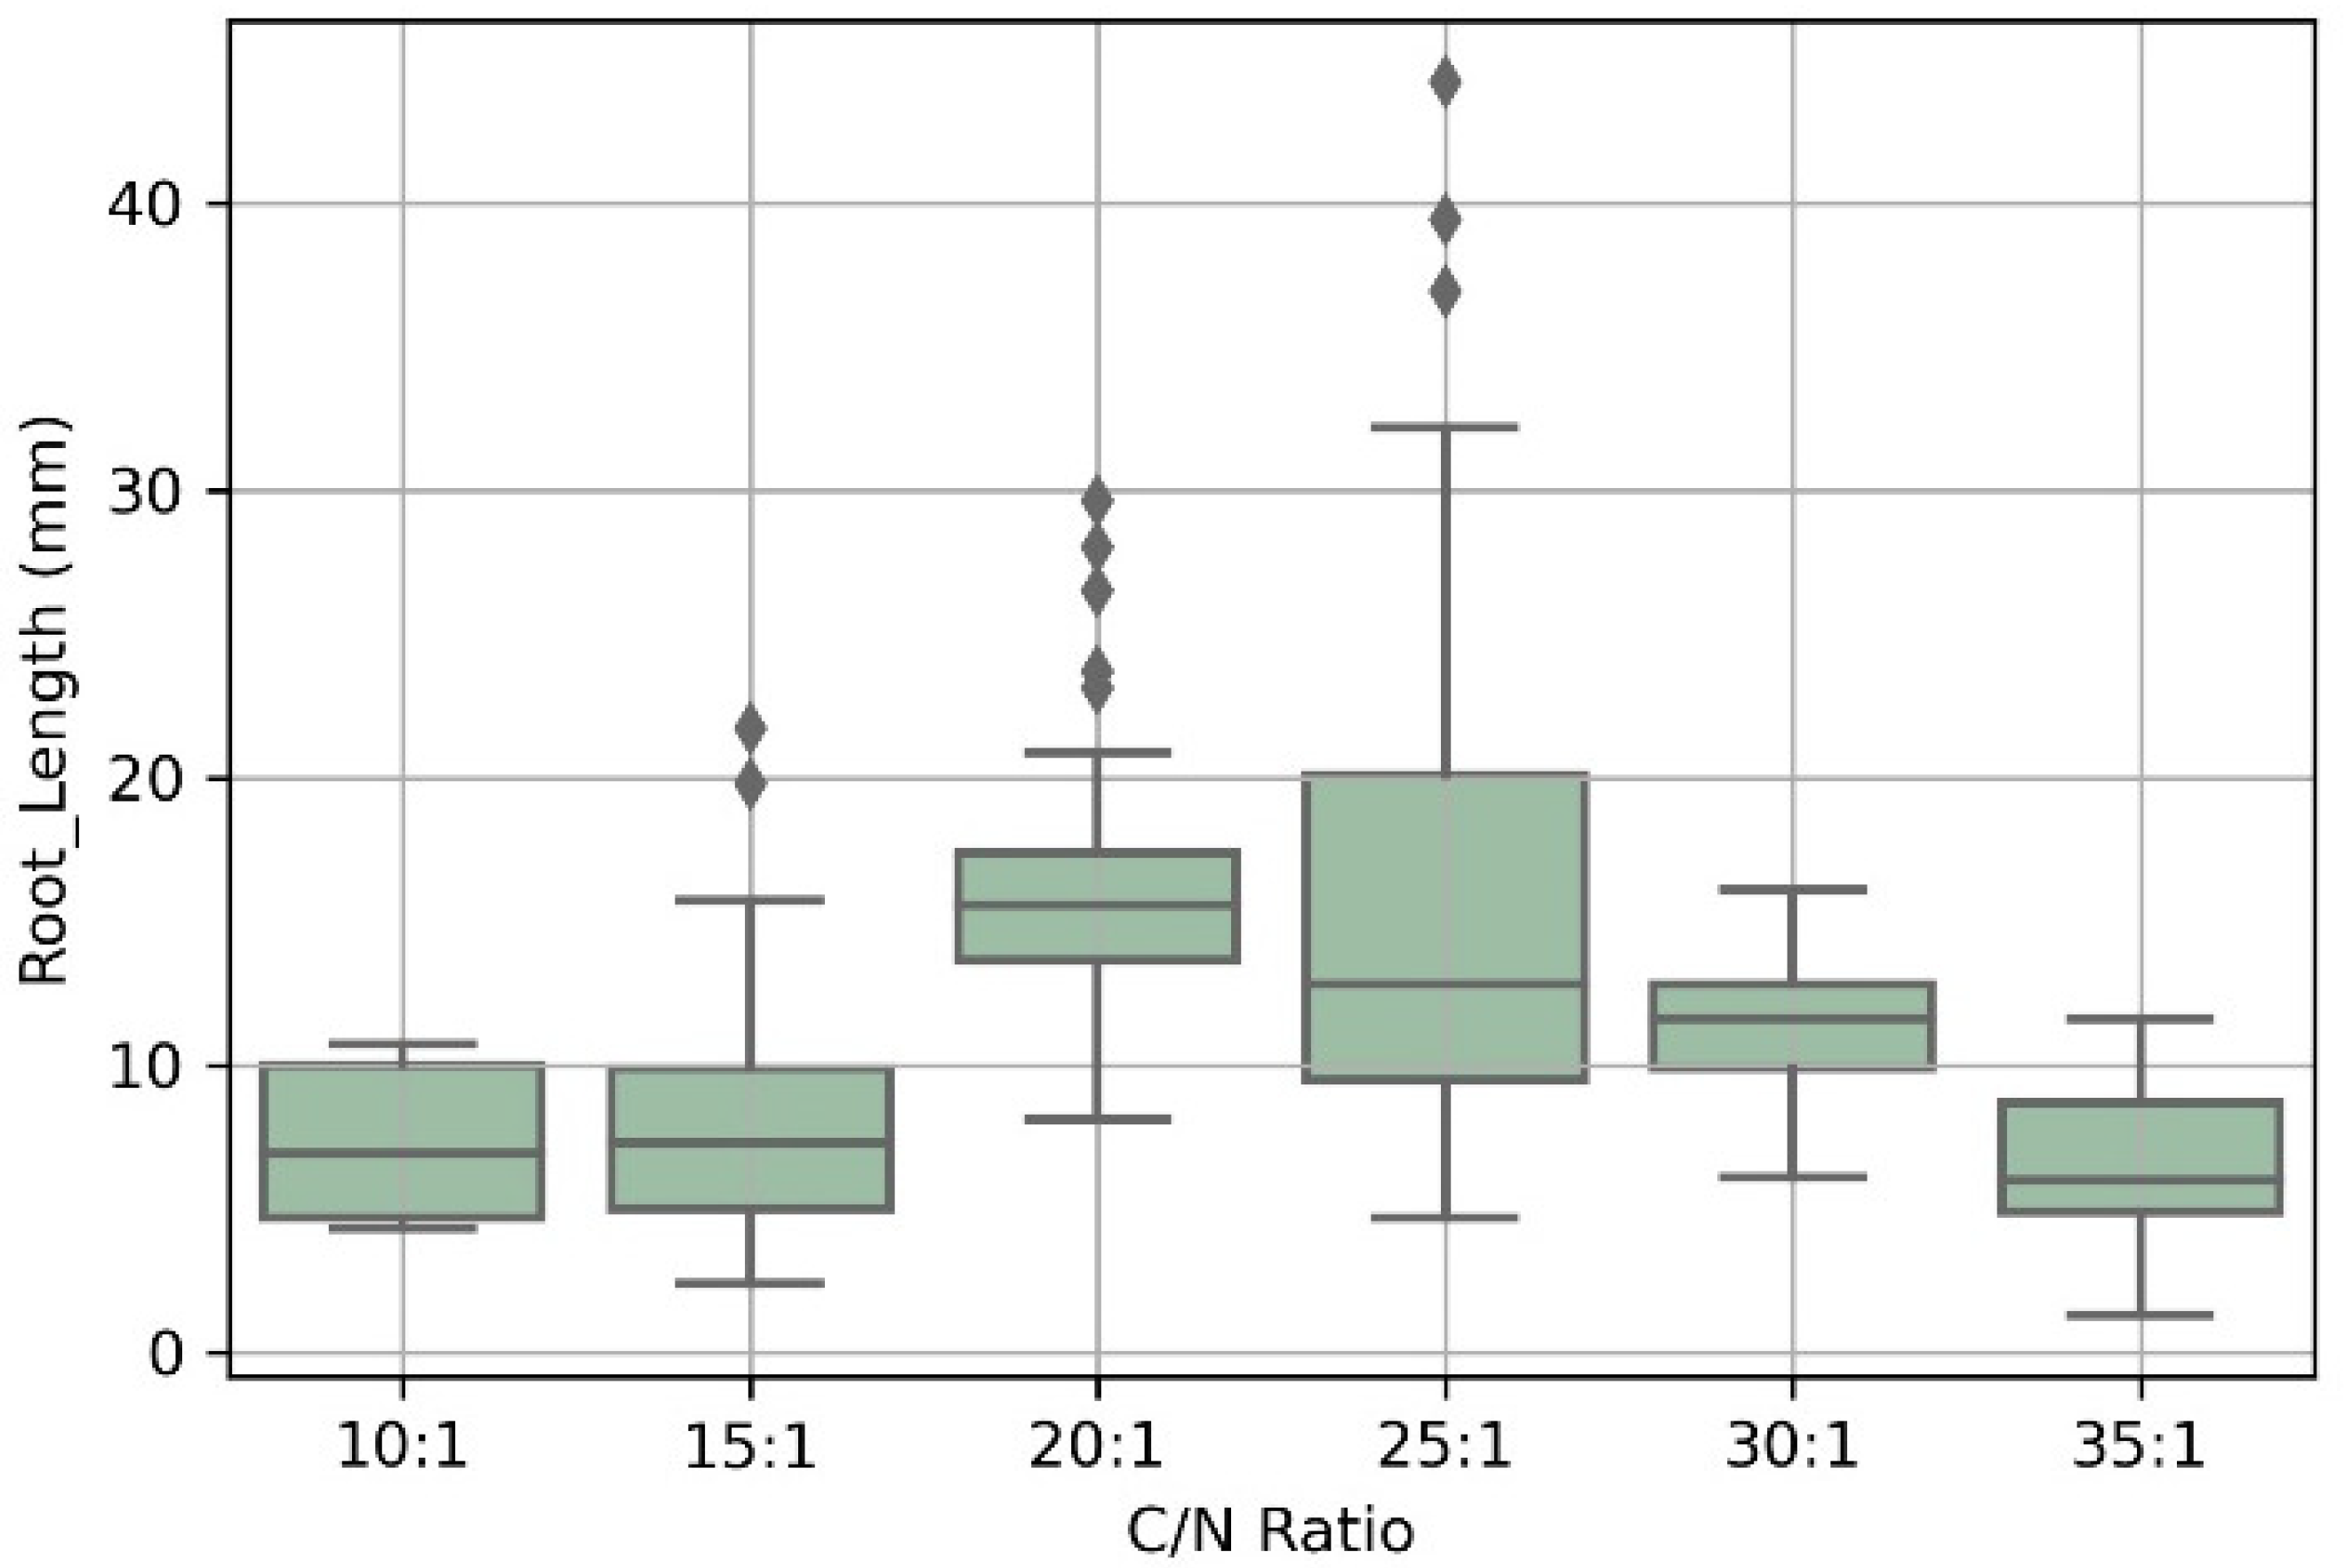
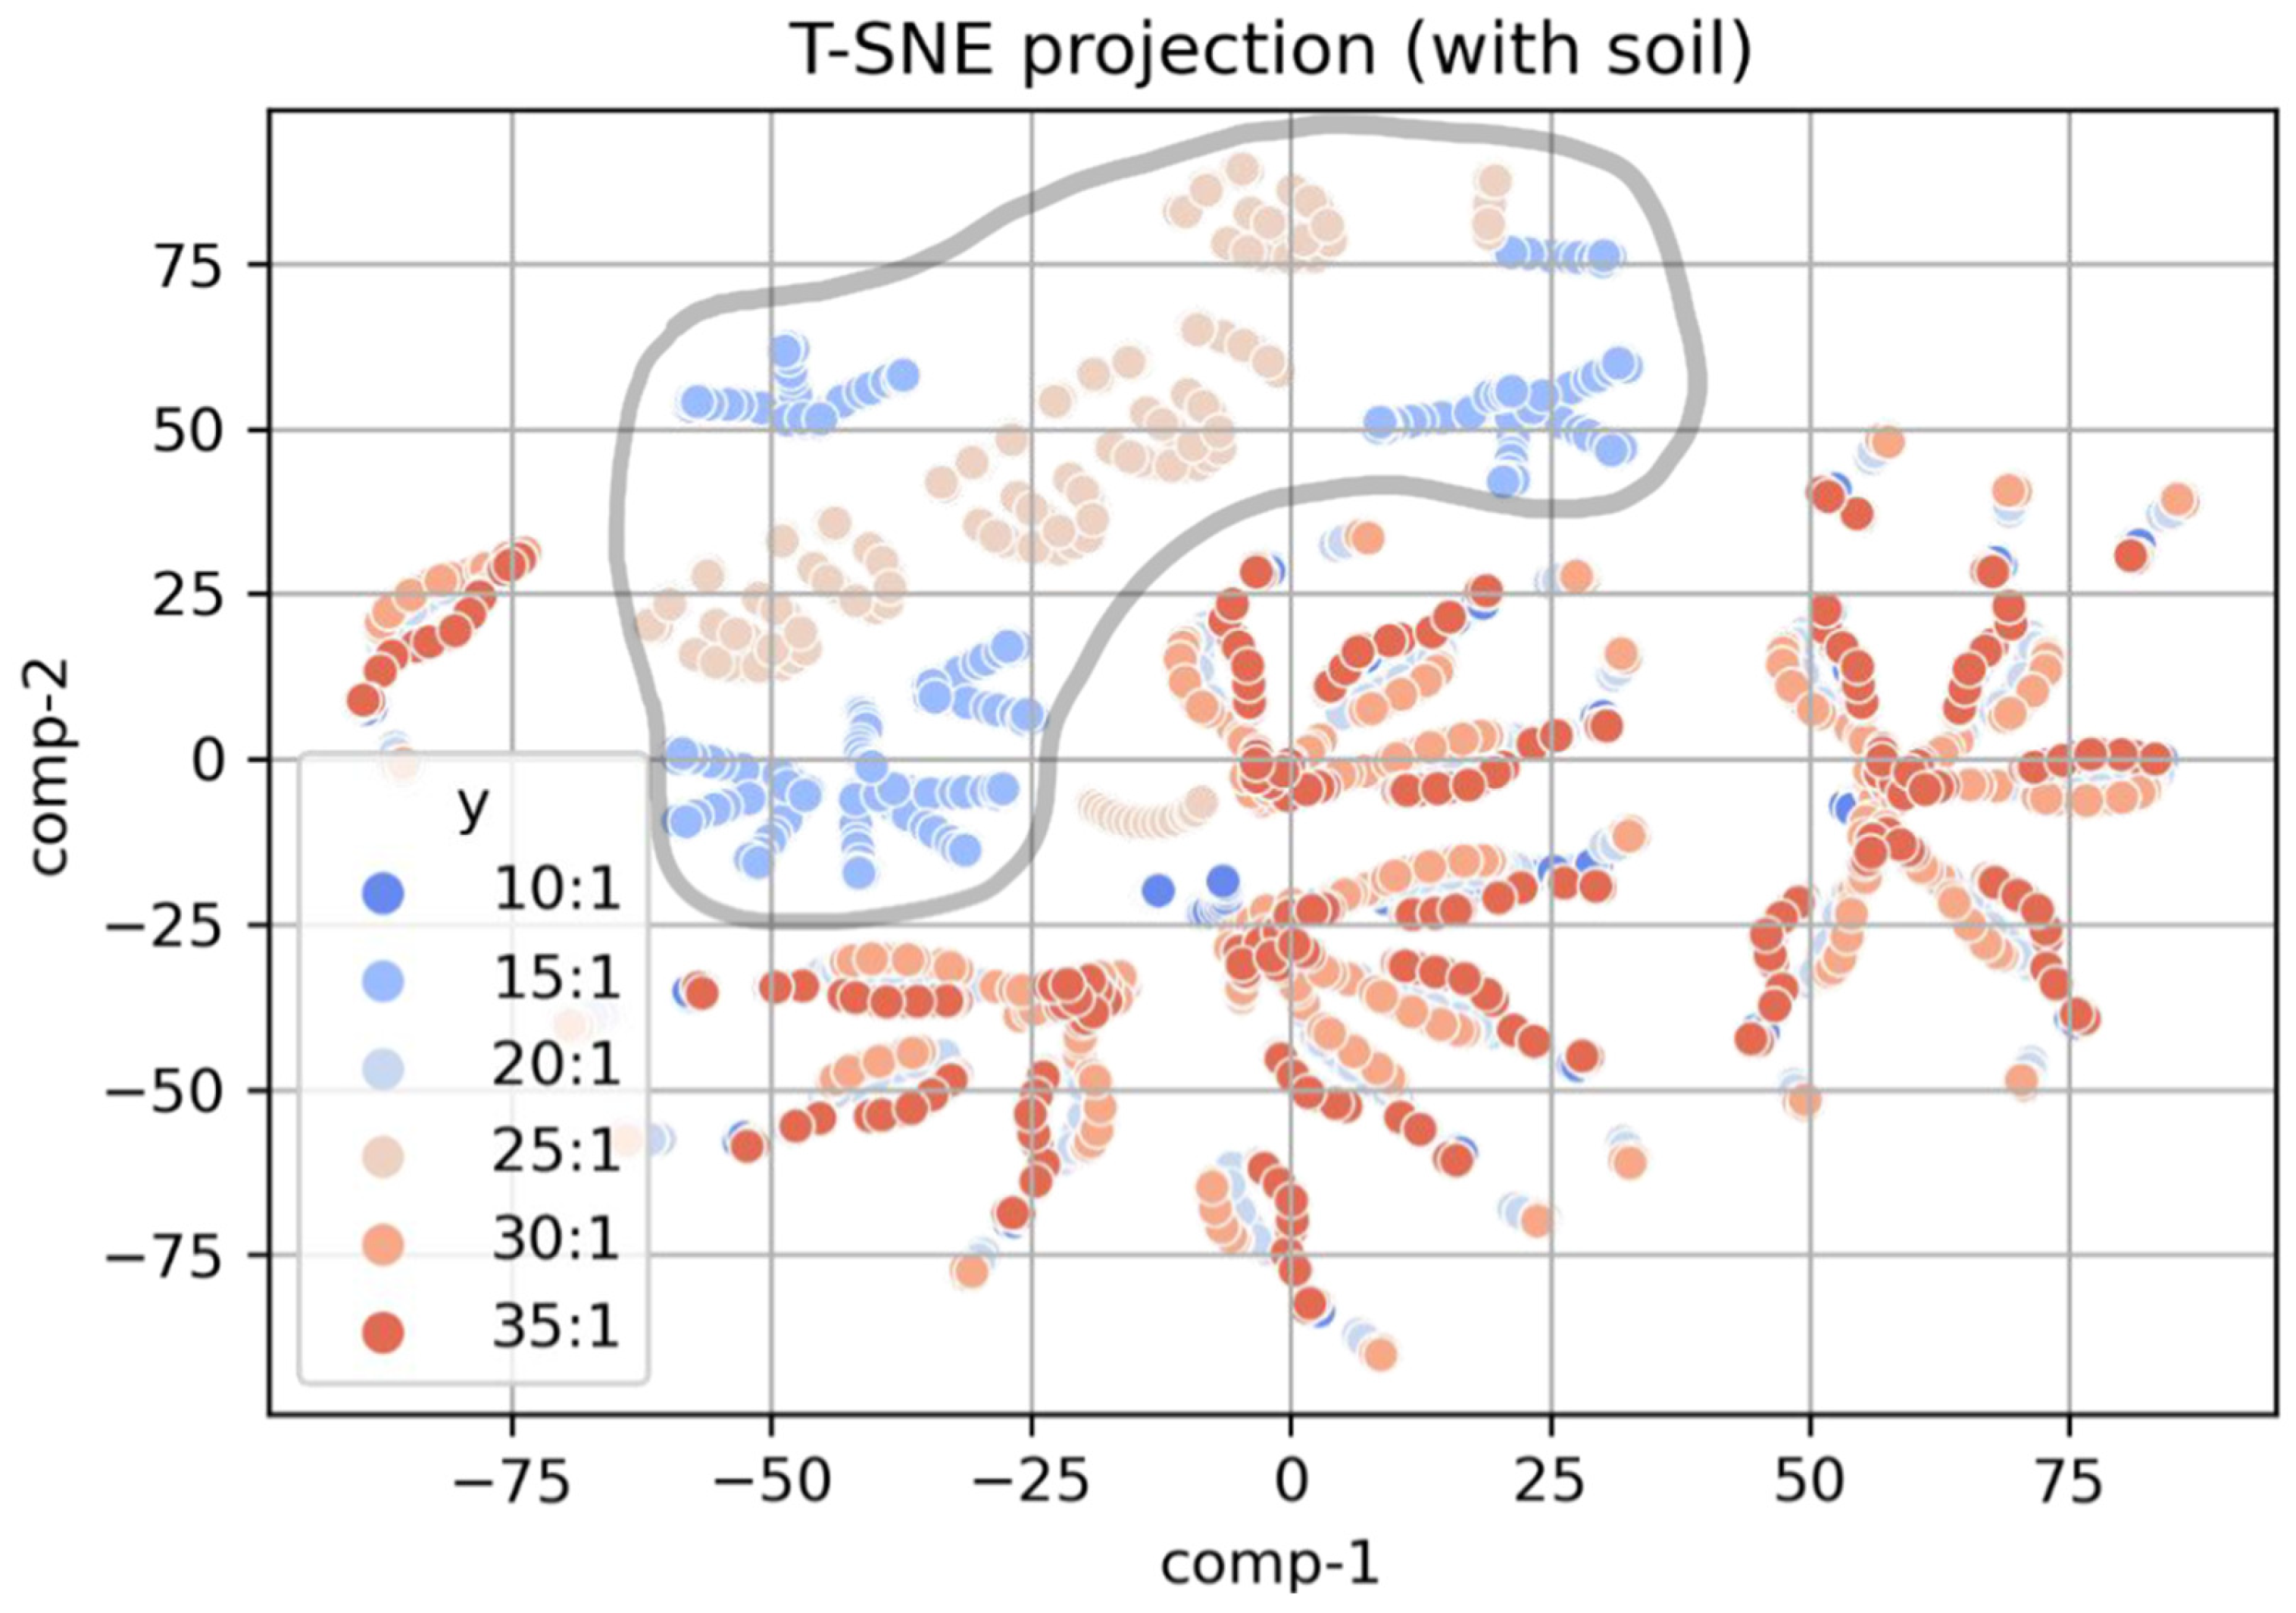
Analysis was performed using Python libraries to run statistical tests and to better visualize the outputs from the experiment. Two statistical methods were considered: box plot and T-distributed Stochastic Neighbour Embedding (T-SNE). Box plot [
38] shows the summaries of root growth for each C/N ratio in terms of its minimum/maximum values, lower quartile, upper quartile, interquartile, and median value. On the other hand, T-SNE assists in visualizing multi-dimensional data to find meaningful patterns and clusters [
39].


