Article

Factors Influencing Consumers’ Continuous Purchase Intentions on TikTok: An Examination from the Uses and Gratifications (U&G) Theory Perspective

Department of Business Administration, Graduate School, Dankook University, 152 Jukjeon-ro, Suji-gu, Yongin-si 16890, Gyeonggi-do, Republic of Korea
*
Author to whom correspondence should be addressed.
Sustainability 2023, 15(13), 10028; https://doi.org/10.3390/su151310028
Submission received: 18 April 2023 / Revised: 18 June 2023 / Accepted: 21 June 2023 / Published: 25 June 2023
(This article belongs to the Special Issue Social Media and Sustainable Consumer Behaviour)

Abstract

:
After the COVID-19 pandemic, traditional online shopping with pictures and videos has been transformed into livestreaming shopping. Various apps for livestreaming shopping have gained popularity, and TikTok livestreaming (TTL) accounts for more than half of livestreaming shopping in China. Therefore, consumers’ ability to continue shopping is the core factor for the sustainable development of TTL. The purpose of this study was to explore what kinds of gratifications affect the continuous purchase intentions of TTL consumers and to examine the moderating effect of education level. We collected data from 234 TTL consumers in China and then used a structural equation model to analyze, while SPSS23.0 and AMOS24.0 were applied to evaluate and empirically test the research hypotheses. This study confirmed the significant impact of four kinds of satisfaction on consumers’ continuous shopping intentions and also confirmed the differences among consumers with different levels of education. This provides theoretical support for the sustainable development of e-commerce in the future and the maximization of income from live shopping.

1. Introduction

Human society has been experiencing the fourth industrial revolution (4IR), contributing to dramatic changes in the ways people shop at present [1]. Thanks to today’s information and current communication technologies, consumers have access to shopping via a range of social media and websites [2,3]. Therefore, it further promotes the development of livestream shopping, which gradually becomes an important means for merchants to improve their sales performance [4].
Livestream shopping, or simply live shopping, is a marketing tactic in which a host, generally an influencer or celebrity, uses a live video to advertise a product. With the help of likable, current online personalities, livestream shopping promotes and sells products via influencer streams on social media platforms. It has elements of infomercials, variety shows, and group chats [5]. Many social media platforms have started livestream shopping, such as Facebook [6], TikTok [7], and Instagram [8].
This study focuses on the most popular social media, TikTok (Douyin or “抖音” in Chinese). It was first launched in China in 2016 and has since taken the world by storm [9]. After the outbreak of COVID-19, China implemented lockdown policies in response to the pandemic, which temporarily brought physical and economic mobility to a standstill. However, the popularity of TTL not only provides real-time information for people who stay indoors [10] but also plays an important role in the sustainable economic development of China [11].
As a new way of online shopping, livestream shopping attracts more consumers than traditional online shopping. Since the streamer in the livestream is a major feature of live shopping, many researchers from the aspect of the live streamer explored the impact on purchase intention [4,5,12] and continuous purchase intention [13].
Livestream shopping is a combination of social media and online shopping, and the development of social media is closely related to the uses and gratifications (U&G) theory [14]. In recent years, the U&G theory has proved the feasibility of the effect of satisfaction generated by using various social media apps on behavioral motivation [15,16,17,18,19]. On TikTok, as a shopping social media software, the most direct expression of users’ satisfaction is continuous use or purchase [20,21]. Therefore, a reasonable way to analyze TTL consumers’ continuous purchase intention is based on the U&G theory.
Although some researchers have adopted this method, they only take utilitarian and hedonic gratification into consideration [22,23]. It is not very comprehensive to analyze these two kinds of gratification only. TikTok users can publicly articulate wanting to have connections with other users and share their comments or likes [19]. Thus, according to the characteristics of TTL, this study must increase the gratification of TTL consumers in terms of content and society.
Meanwhile, according to the China 2022 TikTok report [9], both men and women, young and old, are enthusiastic about the short video app. But there is a bipolar difference when buying; those who are willing to buy will keep buying, and those who are not willing to buy will not try it once. Based on previous studies, different levels of education lend to different ways of individual knowledge, ways of thinking, and consumption behavior [24,25]. In the field of e-commerce, consumer education proved to be important [26]. With the improvement of professional education levels, the tendency to use online shopping is also on the rise [27]. Research as early as 2001 has shown that the acceptance population of e-commerce at that time was mainly young people with good IT education [28]. This evidence indicates a strong correlation between education levels and consumers’ online shopping intentions and behaviors. However, remarkably little consideration has been given to the impact of different education levels on specific differences in shopping intentions. Whether consumers of TTL will also have such differences, this study proposes the hypothesis of the moderating effect of education level.
Therefore, based on the U&G theory, we developed a research model first, discussed how four kinds of gratification affect continuous purchase intention, and finally took education level as a regulating variable to analyze its differences. The literature review is first presented in Section 2, and the research model and hypotheses are elaborated in Section 3. The research methods are explained in Section 4, and the data analysis and results are described in Section 5. The discussions are focused on Section 6, and the implications and limitations are explained in Section 7.

2. Literature Review

2.1. Livestream Shopping and TikTok

Livestream shopping is an emerging trend in Internet shopping; consumers can enter a livestream platform via social media apps and then shop directly. This method has a more immersive shopping experience than the traditional online shopping method of adding to a shopping cart [29]. Livestream shopping includes e-commerce, social networking, and entertainment [30]. As witnessed on social media, video apps have grown at an exponential rate, changing the way companies are conducting business online [31]. Meanwhile, the form of “livestreaming + shopping” is also rapidly heating up around the world. Consumers would like a more convenient, interactive, and entertaining purchasing experience from high-quality livestream shopping [5]. Moreover, for livestreaming e-commerce, most studies focus on impulse buying [32] and the celebrity economy [5], but few studies analyze the motivation of consumers’ continuous behavior from the perspective of their satisfaction.
TikTok seems to be in vogue and even has changed our lives, especially after the COVID-19 outbreak. For instance, even some healthcare workers have turned to TikTok to spread information to the public [33]. At present, research on TikTok has spread all over various fields. TikTok has facilitated research in psychology [34], privacy [35], scientific public engagement [36], and the online spreading of hate [37]. As Mou [7] argued, TikTok is one of the top and emerging social media platforms that is being adopted by marketers to reach and engage with their target audience. Shopping via livestreaming has become the primary method of shopping [38]. In 2021, TTL sold 450 thousand books a day, and the sales of China’s time-honored brands increased by 647% year on year [11], and the popularity of live shopping is unprecedented.

2.2. U&G Theory of Social Media

The origin of U&G is from research in radio communication [39]. Early researchers’ studies on U&G were descriptive [40,41]. By the 1970s, U&G’s research was focused on finding gratification. The U&G theory provides a theoretical framework for media researchers to study how users use traditional or new media and puts forward five types of needs that mass media satisfy, namely cognitive, emotional, personal integration, social integration, and stress release [42]. In recent years, with the rapid growth of computers and networks driving the rise of mass media, the importance of the U&G theory has been revealed. Ruggiero [14] emphasized that any consideration of mass communication theory’s future direction must take the U&G theory into account.
With the emergence of smartphones, more researchers on the U&G theory have focused on the motivation of mobile phone use [43]. At the same time, various social media apps related to smartphones, for example, Facebook, Instagram, Twitter, WeChat, TikTok, and so on [15,16,17,18,19], have also become a broad research direction for researchers. Table 1 provides a summary of the gratifications obtained by researchers for current social media with a large number of users in the world. Therefore, it is reasonable and feasible in the TTL context to use the U&G theory in this study.

2.3. Consumers’ Continuous Purchase Intention

Users’ satisfaction with the information system will be directly reflected in the continuous use of the information system [20], while consumers’ satisfaction with e-commerce will be reflected in the continuous purchase intention [21]. A study in Pakistan has demonstrated that social media use and browsing can significantly affect sustainable purchase intentions [46]. Customers who use social media may not initially have a strong desire to buy, but after viewing social media material or engaging in social media interactions, they will have continuous purchase intention [47,48]. In previous studies, many factors were observed to affect the customer’s intention of different items. For example, streamers’ characteristics [4,12], perceived value [47,49,50], and online information search [51]. Concurrently, the influence of human emotional factors such as the different types of trust [26,52,53,54], enjoyment [50], and perceptual curiosity [53] has also been shown to correlate with shopping behavior and willingness.

2.4. The Role of Education Level in Online Shopping

Education level is an aspect of demographic difference. Studies have shown that highly educated users are more receptive to new things, such as mobile health apps [55]. Meanwhile, they are also more likely to use social media [56]. Few studies have shown that differences in education level have different effects on shopping behaviors or intentions, but there is some evidence to support these differences. People who know more about online shopping will trust and go shopping more online [26]. Li et al. [57] argued that a higher proportion of better-educated consumers fall into the frequent online buyer category. Consumers with better education are more likely to choose online shopping rather than offline shopping [24]. Millan and Howard [58] also suggested that there is a connection between education and shopping enjoyment. Previous research showed that different levels of education could influence customers’ online shopping intentions or behaviors. More details on the relevant aspects between education level and online shopping are shown in Table 2.

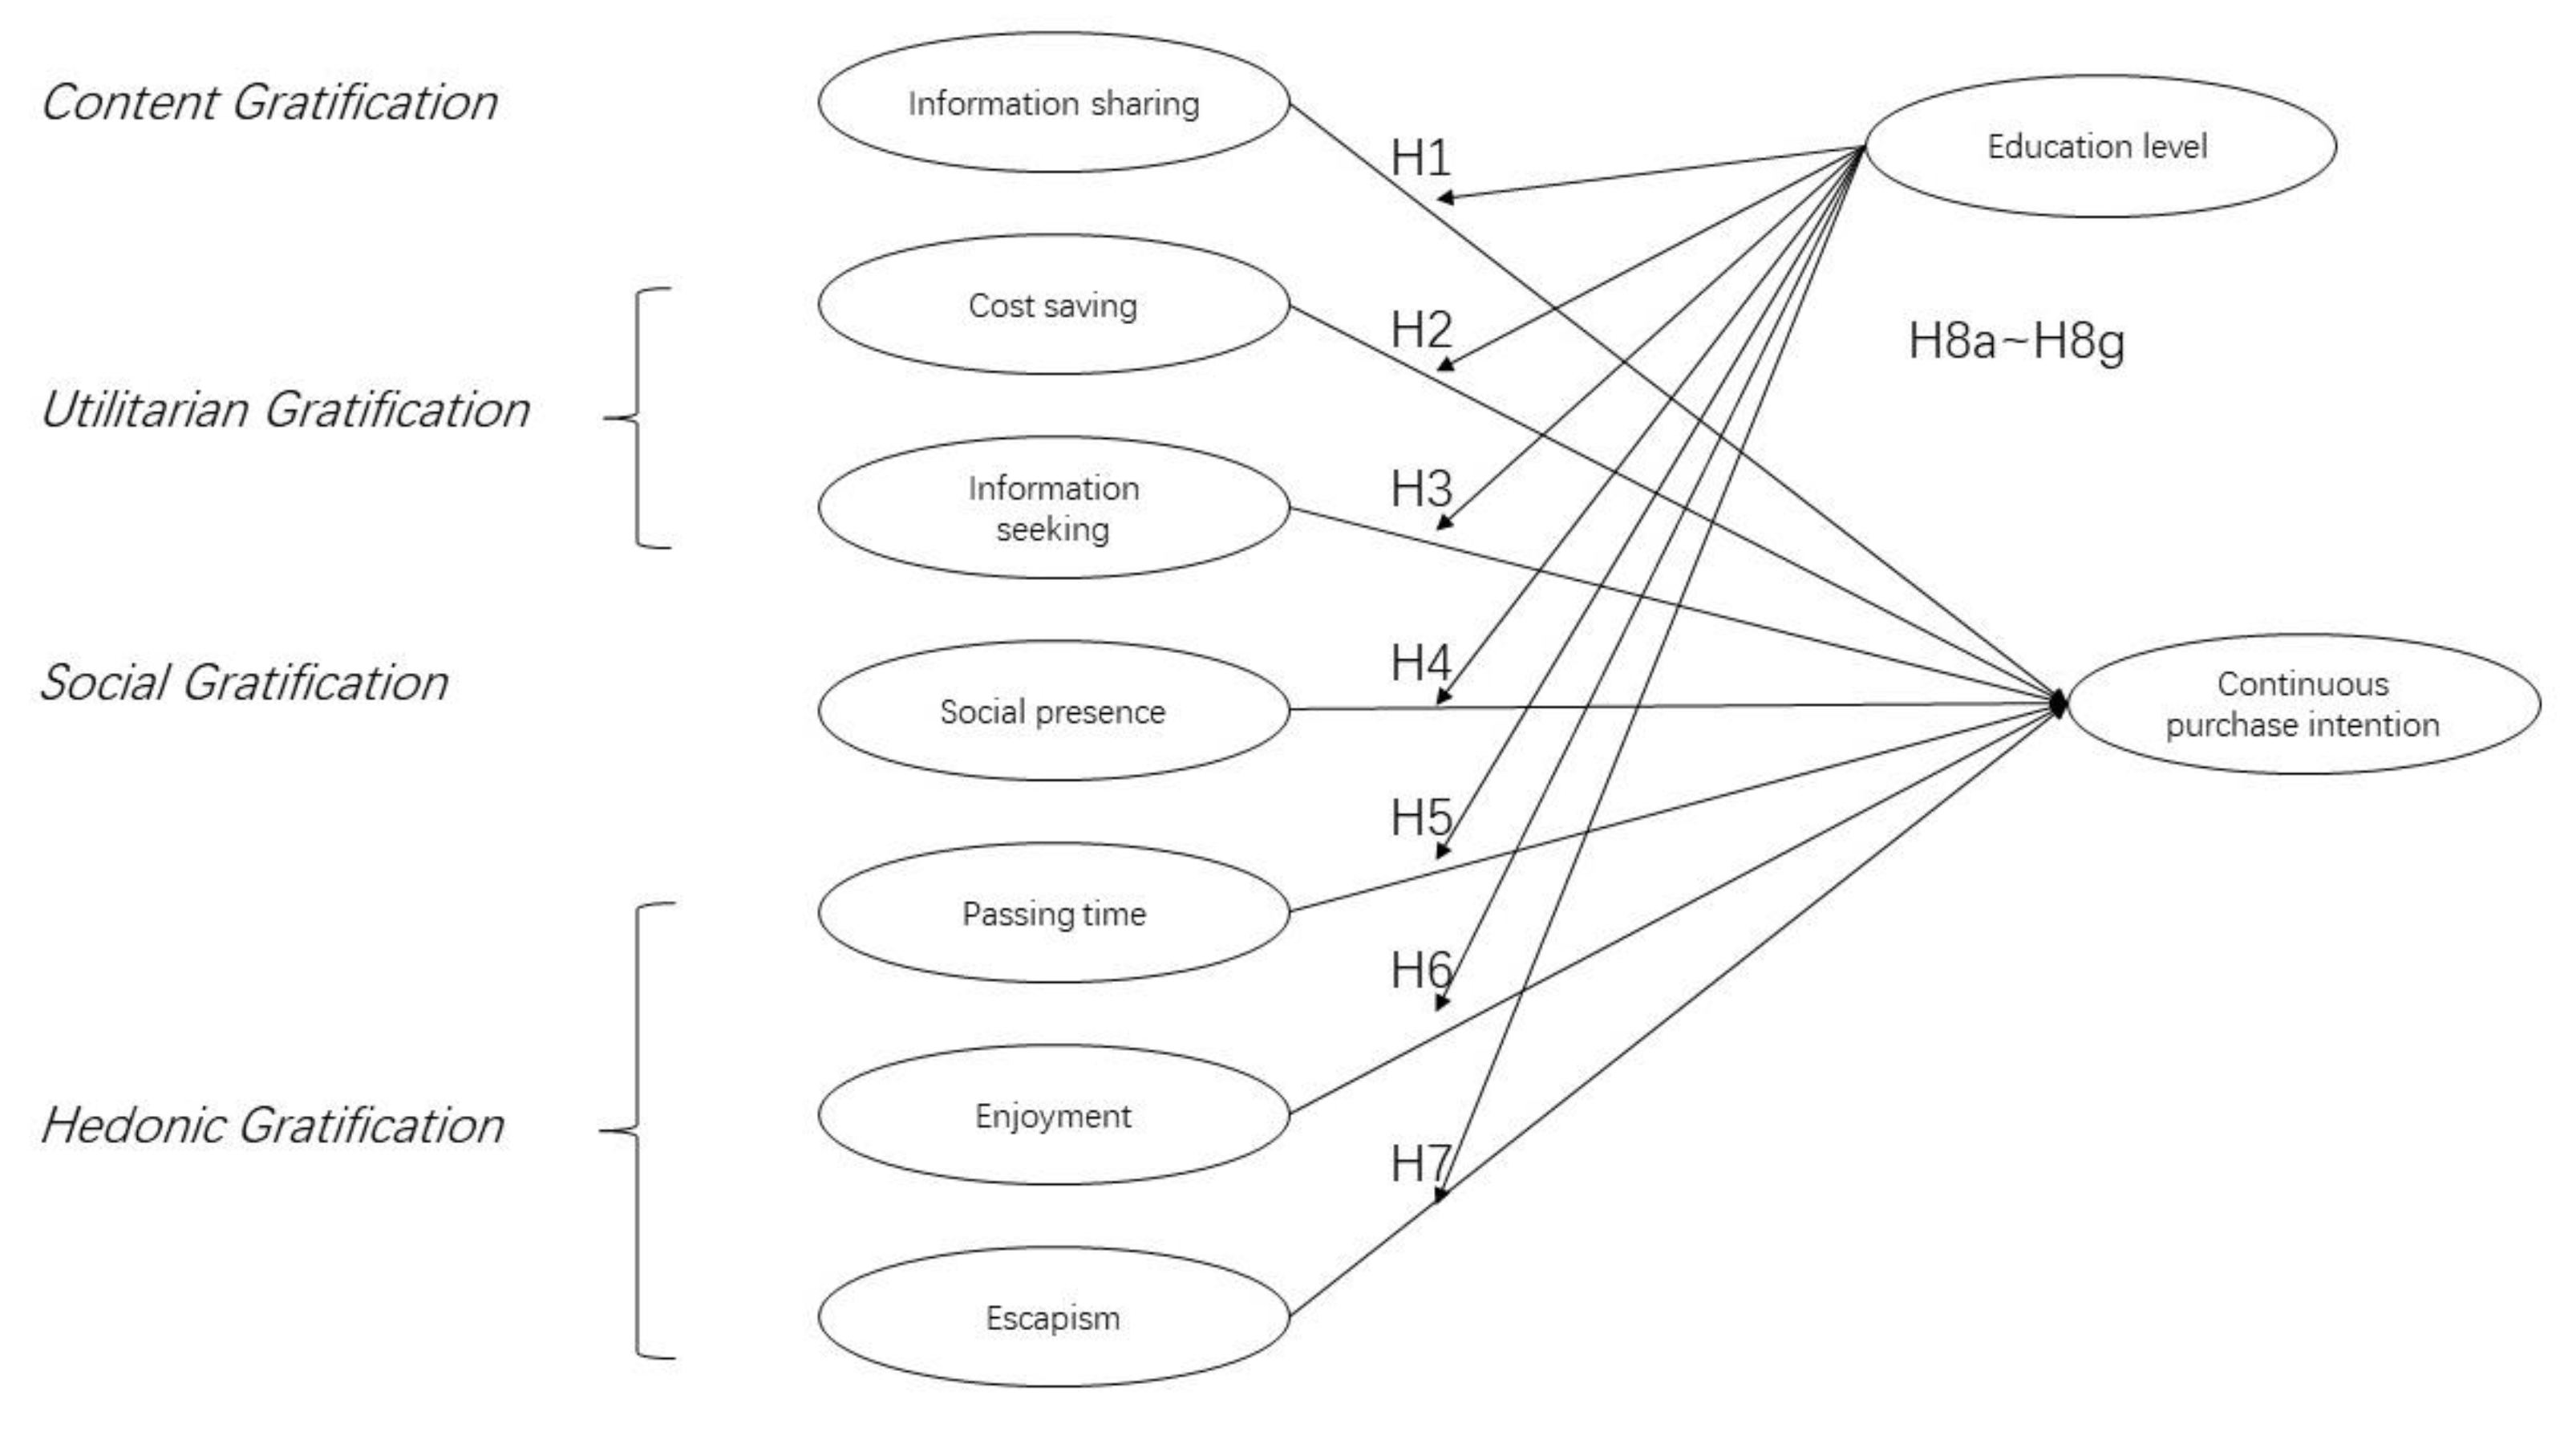
3. Research Hypothesis and Model

3.1. Research Hypothesis

In previous studies on social media, gratifications are mainly divided into the following five dimensions: content gratification [15,44], utilitarian gratification [18,22,23], social gratification [15,62,63], technological gratification [44], and hedonic gratification [19,64,65].

3.1.1. Content Gratification

Content gratification is derived from the use of mediated messages for their direct, substantive, intrinsic value for the receiver [66], and it plays an important role in influencing social media behavior from dimensions such as information sharing, self-documentation, and self-expression in recent years [15,16,44,67]. Content gratification is linked to the information itself [66,68]. Knowledge or information sharing can have an impact on people’s intentions because, with knowledge about products and services, people can make decisions wisely [69]. The more shared and exchanged consumption-related information is, the better social business websites will be developed [70,71]. When consumers watch the live-shopping channels, they can share product information with friends or share some shopping discount pieces of information via private social media to obtain more “Likes” and then motivate them to continue shopping. Thus, the following hypothesis was put forward.
Hypothesis 1 (H1). 
Information sharing significantly affects TTL consumers’ continuous purchase intention.

3.1.2. Utilitarian Gratification

Utilitarian gratification is related to the consumers’ benefit from specific goals and tasks [72]. The utilitarian motive of consumers is the determining factor of their purchase intention [22,23]. Previous researchers generalized utilitarian gratification from different dimensions to different social media, mainly including information seeking, access to new news, work efficiency, cost saving, and self-presentation [19,22,67]. According to Babin et al. [73], utilitarian shopping motivations are task oriented, rational, and cognitive. The convenience or utilitarian orientation of online shopping leads Internet shoppers to website features that save search costs to pursue their utilitarian outcomes during shopping [57], such as saving money [74] and obtaining a lot of information about stores and products [75]. To et al. [22] demonstrated that consumer intention to seek and purchase is influenced by utilitarian motives. Therefore, hypotheses are outlined as follows.
Hypothesis 2 (H2). 
Cost saving significantly affects TTL consumers’ continuous purchase intention.
Hypothesis 3 (H3). 
Information seeking significantly affects TTL consumers’ continuous purchase intention.

3.1.3. Social Gratification

Stafford et al. [76] defined social gratification as a term for maintaining social relationships, and it is also the result of satisfying the social motivation to maintain or start a relationship via social media [44,77]. Liu et al. [44] also emphasized that social gratification is an outcome of the fulfillment of social engagement. As an emerging social media platform, TikTok has implications not only for meeting people’s social needs but also for carrying out e-commerce via the software; even the TTL streamer’s introduction may produce the illusion of offline shopping. When audiences are watching the livestream, social presence induces a more authentic consumer-viewing experience [78], trust, enjoyment, and perceived usefulness [79]; this, in turn, increases consumers’ continuous purchase intentions [13]. Thus, the following hypothesis was suggested.
Hypothesis 4 (H4). 
Social presence significantly affects TTL consumers’ continuous purchase intention.

3.1.4. Hedonic Gratification

Hedonic gratification is related to the fulfillment of hedonic expectations [80], and it has been proven by many studies to be a crucial factor in determining users’ behavior in using social media [15,16,18,72]. Xu et al. [81] believed that consumers shop online not only to buy goods but also to meet the needs of experience and emotion. There has been research showing that hedonic value and consumers’ willingness to continue to purchase would have a significant causal relationship with livestreaming e-commerce [13]. Therefore, it shows that online consumers, similar to offline consumers, also pursue pleasure and gratification. Studies show that shopping behaviors or intentions are means to pass time [82], enjoyment [62,83], and escapism [62,84]. The hypotheses are outlined as follows.
Hypothesis 5 (H5). 
Passing time significantly affects TTL consumers’ continuous purchase intention.
Hypothesis 6 (H6). 
Enjoyment significantly affects TTL consumers’ continuous purchase intention.
Hypothesis 7 (H7). 
Escapism significantly affects TTL consumers’ continuous purchase intention.
Technological gratifications are the fulfillment of the use of social media as a technically innovative system platform [44]. However, this study is based on the consumer’s perspective, and there is no significant relationship between the level of technological innovation and consumers; thus, technological gratification was not applicable to this study.

3.2. Education Level

In addition, previous studies have shown that education level is an influential factor in shopping intentions or behaviors [60,61]. Kee and Wan [59] proposed that consumers with higher education are in favor of online shopping because it can provide more favorable prices. As we discussed above, previous research has shed light on consumers’ perceptions and attitudes towards shopping variation caused by education level. The background of this study is in social media with shopping via the TikTok platform, and we speculated that the impact of gratification generated by watching TTL programs on continuous purchase intention will vary with the level of education. Therefore, the following hypothesis was formulated.
Hypothesis 8 (H8). 
The effect of information sharing (H8a), cost saving (H8b), information seeking (H8c), social presence (H8d), passing time (H8e), enjoyment (H8f), and escapism (H8g) on continuous purchase intention is larger for high-educated than for low-educated individuals.

4. Research Methods

4.1. Research Model

According to our previous discussion, we identified four main gratification categories of TikTok consumers in livestreaming shopping in this study. Table 3 shows the definitions of gratification in TTL shopping, and Figure 1 depicts the research model.

4.2. Construct Measurement

The research model was made up of eight constructs, including perceived information sharing (IS), cost saving (CS), information seeking (ISE), social presence (SP), passing time (PT), enjoyment (EN), escapism (ES), and continuous purchase intention (CPI). Multiple-item measures were used to assess all of the components. All of the measurement items were adapted from previous research and then tweaked to meet the TTL shopping research scenario.
All items were measured with a seven-point Likert scale, ranging from “strongly disagree (1)” to “strongly agree (7)”. In addition, a screening question that the first question of this questionnaire is to ask whether participants have ever had a TikTok live-shopping experience. If the answer was “no”, this questionnaire ended directly. Some multiple-choice questions were used to ask about gender and other demographic factors. The final items are listed in Table 4.

4.3. Sample and Data Collection

We made online questionnaires and collected data on Wenjuanxing (www.wjx.cn), which is the Chinese largest online questionnaire platform. Following the snowball sampling technique, firstly, we published the questionnaire on the platform. The first 50 people who answered the complete questions were able to receive a reward of CNY 2 (USD 0.3) per person, and they were required to distribute the links to their relatives and friends. For this, respondents could obtain a reward of CNY 1 (USD 0.15) per person. To complement this approach, we also disseminated survey links on social media channels such as WeChat and QQ.
The survey time of the study was from 5 February 2022 to 25 February 2022. We collected a total of 656 questionnaires. At the beginning of the questionnaire, TikTok live shopping (TTL) was explained in detail, and then, “Have you ever shopped on TTL?” was the first selection question of the questionnaire, 332 questionnaires with no TTL shopping experience were excluded. Through assessing the questionnaires with answer times of less than 1 min, and for which all of the answer options were consistent, we finally obtained 234 valid questionnaires.
The results revealed that in the full sample (see Table 5), just over half of the sample (51.3%) were females and 48.7% were males. Among the respondents, 8.1% of them were below 20 years old, while those aged from 20 to 40 accounted for 48.3%, from 41 to 60 comprised 38.5%, and 5.1% of them were above 60 years old; this showed that people in their 20s and 30s are the backbone of online shopping. These data were also in line with the ASKCI [90] data report that indicated that Chinese Internet users born between 1980 and 1995 had the highest online shopping utilization rate. For education, the highest educational level of respondents was junior and senior high school (46.6%), followed by college and university (32.5%), then below junior high school (12.4%), and finally a Master’s degree or above (8.5%). There are four types of higher education institutions in China: regular higher education institutions, independent institutions, higher vocational colleges, and adult higher education institutions [91]. Therefore, the scope of higher education in China is basically summarized as college and above education. In this study, in order to better determine the impact of different levels of education on continuous purchase intention, the education levels of college and university and master’s degree or above were positioned as high educated, while those high school or below were defined as low educated. This classification had no discriminatory meaning for all groups of people. Regarding purchase frequency, most consumers bought once or twice a month (45.7%), 35.5% bought once a week, 8.5% shopped more than twice a week, and 6.4% shopped once every half a year or longer. The demographic information of the sample was in line with the 48th China statistical report on Internet development [92]; thus, the sample could be considered representative of the TTL viewers in China.

5. Data Analysis and Results

The data analysis of this study was divided into three steps. First, SPSS 23.0 and AMOS 24.0 were used for confirmatory factor analysis, the reliability and validity of the test model, common method bias, multicollinearity, and descriptive analysis of the data. Second, the technique of structural equation modeling (SEM) was employed in order to make an analysis of the research model and test the hypothesis via AMOS 24.0. Third, multi-group SEM in AMOS 24.0 was used to examine the moderating effect of differing education levels and to test the hypothesis.

5.1. Evaluation Measurement Model

First, Table 4 shows that most factor loadings were above 0.70; only two-factor loadings were lower than 0.7 but above 0.60; this demonstrated adequate item reliability. Then, we checked the reliability, convergence validity, and discriminant validity of the structure in our proposed model. In terms of reliability, the compound reliability (CR) of all constructs and Cronbach’s Alpha (α) were both numerically higher than 0.7 (see Table 6). Convergent validity was checked using Average Variance Explained (AVE); the scores, which ranged from 0.503 to 0.633, were numerically greater than the value of 0.50, meaning that this study had good convergence validity [93,94,95,96]. In terms of discriminant validity, the square root of AVE should exceed the diagonal elements of the correlation matrix in its highest correlation with different structural items (see Table 7) [95]. Therefore, as a result of the above tests, it was proven that our scale had good reliability, validity, and discriminative validity.
For the fitness index, a confirmatory factor analysis was conducted to test the adequacy of the measurement model. We ran the data and the results of the analysis demonstrated a satisfactory fit (X2/df = 1.245; p = 0.009 < 0.05; GFI = 0.914; AGFI = 0.888; IFI = 0.977; TLI = 0.971; CFI = 0.976; RMSEA = 0.032) [97,98,99].
If the data are collected using the same tools/questionnaires/methods (online surveys) for various variables, there may be a common method bias [100]. Harman’s one-factor method was used to detect the CMB [101]. In this study, Harman’s one-factor method was performed using SPSS 23.0. The results demonstrated that the items explained 67.6% of the total variance and that the largest factor explained 20.1% of the variance, which was lower than 40%. Thus, this indicated that there was no serious CMB in this study. We also test the risk of multicollinearity, and all the variable inflation factor (VIF) values are below 3.027, which indicates that there are no major multicollinearity problems [102].

5.2. Research Model and Hypotheses Testing

Figure 2 manifests the results of the structural model with the overall explanatory power, the results of the path coefficients, and the corresponding levels of significance. All factors significantly affected the CPI: IS (β = 0.204; p < 0.001), CS (β = 0.179; p < 0.01), ISE (β = 0.133; p < 0.05), SP (β = 0.374; p < 0.001), PT (β = 0.260; p < 0.01), EN (β = 0.403; p < 0.001), and ES (β = 0.289; p < 0.001). The model explained 72 percent of the variance of the TTL consumers’ continuous purchase intention, indicating that it had good explanatory power. Thus, H1, H2, H3, H4, H5, H6 and H7 were supported.

5.3. Multi-Group Analysis on AMOS 24.0

The researchers used the main steps proposed by Awang [103] to conduct a multi-group analysis, in order to investigate the moderating effect of different education levels on the purchasing intentions of TTL consumers. The moderation effect was examined in the overall model by applying chi-square (X2) values of the measurement residuals and the unconstrained model (ΔX2: 660.266 − 521.143 = 139.123). The chi-square difference was statistically significant (see Table 8), indicating that differing levels of education had a moderating effect on the overall structural model.
As illustrated in Table 9, comparing the critical ratios of parameters between the two groups, there were two pathways with education level having a moderating effect (see Figure 3 and Figure 4). First, from SP to CPI (z score: 2.447 **, p < 0.05), in the high-educated group (β = 0.73 ***, p < 0.001), the effect of social presence on continuous purchase intention was much stronger than in the low-educated group (β = 0.37 *, p < 0.05). Second, in the path from EN to CPI (z score: 2.011 *, p < 0.05), the effect of enjoyment on continuous purchase intention was considerably stronger in the high-education group (β = 0.57 **, p < 0.01) than in the low-education group (β = 0.56 **, p < 0.01). In conclusion, education level was found to have a moderating effect on SP and EN to CPI, while there was no significant difference between models with high-educated and low-educated individuals in the path of IS, CS, ISE, PT, and ES to CPI. Therefore, hypotheses H8d and H8f were supported.

6. Discussion

6.1. Gratifications and Continuous Purchase Intention

The aim of this study was to explore the influencing factors of TikTok on livestream consumers’ continuous purchase intentions. The results show that four types of gratification affect continuous purchase intention in livestream shopping: content gratification (information sharing), utilitarian gratification (cost saving and information seeking), social gratification (social presence), and hedonic gratification (passing time, enjoyment, and escapism).
Firstly, our results are consistent with previous findings that hedonic gratification has a significant impact on the attitudes and behaviors of users or consumers [18,62,84]. Enjoyment has the largest path coefficient (H6 was supported), so it is the most influential factor in this study. Previous studies also found that when consumers experience a high level of enjoyment (e.g., their favorite brands or stars), they will be more willing to buy [83,104]. It is well known that people take it for granted that TTL is mainly for entertainment. Moreover, passing time (H5 was supported) and escapism (H7 was supported) also play an important role in TTL consumers’ continuous purchase intentions. When consumers feel bored or under pressure, they are more willing to turn on their favorite live programs to temporarily forget their troubles, thus arousing stronger continuous purchase intentions. However, thanks to improvements in Internet technology, livestream shopping websites should be able to provide Internet shoppers with a more welcoming and thorough online shopping experience as well as more fun.
Secondly, this study investigates the extent to which the dimension of social gratification influences consumers’ persistent purchase intentions. The results from our SEM model show that social presence is the second most influential factor (H4 was supported) after enjoyment. It fully shows that it plays a pivotal role in exploring the factors of consumer willingness, and the findings of the social presence match those observed in earlier studies [78,79,105]. Social presence authenticates the consumer-viewing experience, which, in turn, impacts consumers’ search, subscribing, and purchase intentions [78]. For example, if the streamer recommends a lipstick, demonstrates it on their lips, and explains their feeling, the user’s empathic concern would be aroused, it signifies the user’s ability to emotionally connect with the streamer’s experience and creates a practical feeling of personal involvement. The consumers’ social presence is satisfied, which stimulates their shopping desire.
Thirdly, utilitarian factors have always been the focus of social media and e-commerce research [18,22,23,65]. Consumers browsing and shopping on the Internet tend to be practical and are motivated by utilitarian purposes [22]. When watching the TTL shopping program, consumers will always have a stronger shopping impulse to buy cheaper items than usual in the supermarket, and the importance of cost saving (H2 was supported) is also fully demonstrated in this study. On WeChat and Facebook, people obtain useful and helpful information that turns into their “like” behavior [18,65]. TTL viewers can obtain some information about relevant products, understand the goods, or use methods of more detail, and inspire them to shop on the TTL again. The gratification of consumers’ information seeking will be reflected in their continuous purchase intention, and the significant impact effect (H3 was supported) has also been proved.
Lastly, the dimension of consumers’ content gratification is reflected in their satisfaction with information sharing [66]. Information sharing is highly common in social media. Facebook users share information about topics they are interested in with more like-minded strangers by joining group chats [15]. Microbloggers share topics, trends, news, information, and other materials with people in their social networks [44]. In this study, the positive impact of TTL information sharing (H1 was supported) on consumers’ continuous purchase intention should not be underestimated. In daily life, TTL consumers are always willing to tell their close friends what they want to buy before shopping, sometimes for advice and sometimes to share pleasure.

6.2. The Role of Education Level in Continuous Purchase Intention

This study found that social presence and enjoyment gratification in the high-educated group was significantly stronger than in the low-educated group, and the results align with prior studies [27,28,57,106]. IT education significantly affects the initial willingness of Singaporeans to online shopping [28]. Further IT education also predicts higher education levels, so it can be inferred that consumers with higher education levels will shop online more frequently [27,57]. Researchers have demonstrated that high-educated and low-educated consumers have different shopping needs [106]. High-educated consumers are more inclined to meet their personal needs via social interaction, and buying a specific product or service can bring social identity and belonging, so they are also more susceptible to the social presence of goods and services. Apart from this, high-educated people might always keep an eye on their spiritual happiness needs, they view their lives as more meaningful and experience more positive emotions [58,107]. Therefore, high-educated consumers tend to be more likely to buy something again when they find something entertaining, pleasurable, or funny.

7. Implications and limitations

7.1. Implications for Research and Practice

The results of this study have an impact, both academically and in terms of management. This study contributes to the existing literature in several ways. First of all, previous studies on livestreaming shopping mainly investigated the influence of platform characteristics and celebrity economy on consumers’ intentions. This study, from the perspective of consumers, identified internal factors that influence continuous purchase intention, to expand this research direction. Secondly, e-commerce is mostly focused on research on the level of utilitarianism doctrine, and social media is always associated with hedonism and utilitarianism. However, this research focused on the phenomenon of shopping with social media by examining how each met different weights of different dimensions and consumers’ continuous purchase intention to expand the research direction; the empirical results showed that the influence of each gratification dimension in the hypothesis on continuous purchase intention had statistical significance. Thirdly, although it has been confirmed in previous literature that there is a difference in educational level associated with consumer intention or behaviors, most of the studies were very general and did not carefully study in which dimensions significant differences in educational level existed. This study underpins this research field based on the specific background of TTL, and the research results deepen our understanding of the gratification structure of different educational levels in live shopping.
From the perspective of management, these findings provide practical significance for managers and developers to promote sales and improve services. The results bring home the issue of continuous purchase intentions that are especially affected by enjoyment and social presence. Therefore, developers of platforms can design functions to help users know more about product details, and managers can formulate interesting participation schemes before livestreams to meet users’ needs in order to attract more users to shop again and again. Moreover, developers should exert themselves to satisfy the users’ different gratifications by adopting different strategies for users on the basis of education level. If consumers are pushed to the shopping channel by a precise algorithm, it will also keep them from choosing the platform.

7.2. Limitations and Suggestions for Further Research

This study recognizes limitations that were manifested in sampling choices and by extending the variables examined. Firstly, we only surveyed 234 consumers in the Chinese Mainland market. To obtain better universality and deeper findings, future research should investigate a bigger sample in more countries. Secondly, this study mainly focused on the gratification of motivating consumers’ continuous purchase intention but did not consider the influence of other factors (e.g., impulse buying and vanity). Future research should combine these factors with the U&G theory to fully understand the influencing factors of continuous purchase intention. Thirdly, this study only emphasizes the moderating effect of different educational levels of consumers, and the educational level of streamers seems to be related to consumers’ purchasing behaviors. Future studies may also consider the effect of this difference in educational level on the two-way communication app; however, gender, age, income level, and other demographic information could also be explored as directions for comparison to enrich the empirical body of research; therefore, further research will be carried out in this category.

Author Contributions

Conceptualization, J.W. and J.I.O.; methodology, J.W. and J.I.O.; software, J.W.; formal analysis, J.W.; investigation, J.W.; resources, J.I.O.; data curation, J.W.; writing—original draft preparation, J.W.; writing—review and editing, J.I.O. All authors have read and agreed to the published version of the manuscript.

Funding

This research received no external funding.

Informed Consent Statement

Not applicable.

Data Availability Statement

Not applicable.

Acknowledgments

The authors readily acknowledge the assistance of Shuaixing Fang and Dandan Zhang in the data collection and coding of all questions in the survey.

Conflicts of Interest

The authors declare no conflict of interest.

References

  1. Ayuni, R.F. The Online Shopping Habits and E-Loyalty of Gen Z as Natives in the Digital Era. J. Indones. Econ. Bus. 2019, 34, 168. [Google Scholar] [CrossRef]
  2. Nadeem, W.; Andreini, D.; Salo, J.; Laukkanen, T. Engaging Consumers Online through Websites and Social Media: A Gender Study of Italian Generation Y Clothing Consumers. Int. J. Inf. Manag. 2015, 35, 432–442. [Google Scholar] [CrossRef]
  3. Zhang, Y.; Trusov, M.; Stephen, A.T.; Jamal, Z. Online Shopping and Social Media: Friends or Foes? J. Mark. 2017, 81, 24–41. [Google Scholar] [CrossRef]
  4. Zhu, L.; Li, H.; Nie, K.; Gu, C. How Do Anchors’ Characteristics Influence Consumers’ Behavioural Intention in Livestream Shopping? A Moderated Chain-Mediation Explanatory Model. Front. Psychol. 2021, 12, 730636. [Google Scholar] [CrossRef]
  5. Meng, L.M.; Duan, S.; Zhao, Y.; Lü, K.; Chen, S. The Impact of Online Celebrity in Livestreaming E-Commerce on Purchase Intention from the Perspective of Emotional Contagion. J. Retail. Consum. Serv. 2021, 63, 102733. [Google Scholar] [CrossRef]
  6. San Lim, Y.; Ng, T.H.; Mohamad, W.N.; Lim, C.E. Facebook Live-streaming: How it affect the purchase intention of generation y in malaysia? J. Bus. Manag. Account. 2022, 12, 25–49. [Google Scholar]
  7. Mou, J.B. Study on Social Media Marketing Campaign Strategy—TikTok and Instagram. Ph.D. Thesis, Massachusetts Institute of Technology, Cambridge, MA, USA, 2020. [Google Scholar]
  8. Saputra, G.G.; Fadhilah, F. The Influence of Live Streaming Shopping on Purchase Decisions through Customer Engagement on Instagram Social Media. Bp. Int. Res. Crit. Inst. J. BIRCI J. 2022, 5, 12126–12137. [Google Scholar] [CrossRef]
  9. TikTok. TikTok Revenue and Usage Statistics (2022). Available online: https://www.businessofapps.com/data/tik-tok-statistics/ (accessed on 20 July 2022).
  10. Chen, Q.; Min, C.; Zhang, W.; Ma, X.; Evans, R. Factors Driving Citizen Engagement with Government TikTok Accounts During the COVID-19 Pandemic: Model Development and Analysis. J. Med. Internet Res. 2021, 23, e21463. [Google Scholar] [CrossRef]
  11. 2021 TikTok Data Report. Available online: https://view.inews.qq.com/k/20220111A0AWP600?web_channel=wap&openApp=false (accessed on 20 July 2022).
  12. Wang, W.; Huang, M.; Zheng, S.; Lin, L.; Wang, L. The Impact of Broadcasters on Consumer’s Intention to Follow Livestream Brand Community. Front. Psychol. 2021, 12, 810883. [Google Scholar] [CrossRef]
  13. Wu, Y.; Huang, H. Influence of Perceived Value on Consumers’ Continuous Purchase Intention in Live-Streaming E-Commerce—Mediated by Consumer Trust. Sustainability 2023, 15, 4432. [Google Scholar] [CrossRef]
  14. Ruggiero, T.E. Uses and Gratifications Theory in the 21st Century. Mass Commun. Soc. 2000, 3, 3–37. [Google Scholar] [CrossRef] [Green Version]
  15. Smock, A.D.; Ellison, N.B.; Lampe, C.; Wohn, D.Y. Facebook as a Toolkit: A Uses and Gratification Approach to Unbundling Feature Use. Comput. Hum. Behav. 2011, 27, 2322–2329. [Google Scholar] [CrossRef]
  16. Muhammad, F.M. Instagram Effects as Social Media toward Adolescence and Young Adult Users: Uses and Gratification Approach. In Proceedings of the International Conference of Communication Science Research (ICCSR 2018), Surabaya, Indonesia, 24–25 July 2018; Atlantis Press: Surabaya, Indonesia, 2018. [Google Scholar]
  17. Chen, G.M. Tweet This: A Uses and Gratifications Perspective on How Active Twitter Use Gratifies a Need to Connect with Others. Comput. Hum. Behav. 2011, 27, 755–762. [Google Scholar] [CrossRef]
  18. Gan, C. Understanding WeChat Users’ Liking Behavior: An Empirical Study in China. Comput. Hum. Behav. 2017, 68, 30–39. [Google Scholar] [CrossRef]
  19. Scherr, S.; Wang, K. Explaining the Success of Social Media with Gratification Niches: Motivations behind Daytime, Nighttime, and Active Use of TikTok in China. Comput. Hum. Behav. 2021, 124, 106893. [Google Scholar] [CrossRef]
  20. Bhattacherjee, A. Understanding Information Systems Continuance: An Expectation-Confirmation Model. MIS Q. 2001, 25, 351–370. [Google Scholar] [CrossRef]
  21. Chen, J.; Xu, W. A Study on the Impact of Customer Engagement on Continued Purchase Intention for Online Video Websites VIP Service. In Proceedings of the Thirteenth International Conference on Management Science and Engineering Management, Catharines, ON, Canada, 5–8 August 2019; Springer: Cham, Switzerland, 2020; pp. 668–682. [Google Scholar]
  22. To, P.-L.; Liao, C.; Lin, T.-H. Shopping Motivations on Internet: A Study Based on Utilitarian and Hedonic Value. Technovation 2007, 27, 774–787. [Google Scholar] [CrossRef]
  23. Cai, J.; Wohn, D.Y.; Mittal, A.; Sureshbabu, D. Utilitarian and Hedonic Motivations for Live Streaming Shopping. In Proceedings of the 2018 ACM International Conference on Interactive Experiences for TV and Online Video, Seoul, Republic of Korea, 26–28 June 2018; Association for Computing Machinery: New York, NY, USA, 2018; pp. 81–88. [Google Scholar]
  24. Swinyard, W.R.; Smith, S.M. Why People (Don’t) Shop Online: A Lifestyle Study of the Internet Consumer. Psychol. Mark. 2003, 20, 567–597. [Google Scholar] [CrossRef]
  25. Bagchi, K.; Adam, M. A Longitudinal Study of a Business Model of On-Line Shopping Behavior Using a Latent Growth Curve Approach. In Proceedings of the 10th Americas Conference on Information Systems, AMCIS 2004, New York, NY, USA, 6–8 August 2004. [Google Scholar]
  26. Wang, C.-C.; Chen, C.-A.; Jiang, J.-C. The Impact of Knowledge and Trust on E-Consumers’ Online Shopping Activities: An Empirical Study. J. Comput. 2009, 4, 11–18. [Google Scholar] [CrossRef]
  27. Akman, I.; Rehan, M. Online Purchase Behaviour among Professionals: A Socio-Demographic Perspective for Turkey. Econ. Res. Ekon. Istraživanja 2014, 27, 689–699. [Google Scholar] [CrossRef] [Green Version]
  28. Liao, Z.; Cheung, M.T. Internet-Based e-Shopping and Consumer Attitudes: An Empirical Study. Inf. Manag. 2001, 38, 299–306. [Google Scholar] [CrossRef] [Green Version]
  29. Geyser, W. A Comprehensive Guide to Live Stream Shopping. Available online: https://influencermarketinghub.com/live-stream-shopping/ (accessed on 20 October 2022).
  30. Liu, Z. The Impact of the Legitimacy of Livestream Shopping on Consumers’ Willingness to Buy; Atlantis Press: Amsterdam, The Netherlands, 2022; pp. 432–440. [Google Scholar]
  31. Todd, P.R.; Melancon, J. Gender Differences in Perceptions of Trolling in Livestream Video Broadcasting. Cyberpsychol. Behav. Soc. Netw. 2019, 22, 472–476. [Google Scholar] [CrossRef] [PubMed]
  32. Lee, C.-H.; Chen, C.-W. Impulse Buying Behaviors in Live Streaming Commerce Based on the Stimulus-Organism-Response Framework. Information 2021, 12, 241. [Google Scholar] [CrossRef]
  33. Basch, C.H.; Hillyer, G.C.; Jaime, C. COVID-19 on TikTok: Harnessing an Emerging Social Media Platform to Convey Important Public Health Messages. Int. J. Adolesc. Med. Health 2022, 34, 367–369. [Google Scholar] [CrossRef]
  34. Montag, C.; Yang, H.; Elhai, J.D. On the Psychology of TikTok Use: A First Glimpse From Empirical Findings. Front. Public Health 2021, 9, 641673. [Google Scholar] [CrossRef]
  35. De Leyn, T.; De Wolf, R.; Vanden Abeele, M.; De Marez, L. In-between Child’s Play and Teenage Pop Culture: Tweens, TikTok & Privacy. J. Youth Stud. 2022, 25, 1108–1125. [Google Scholar] [CrossRef]
  36. Hayes, C.; Stott, K.; Lamb, K.J.; Hurst, G.A. “Making Every Second Count”: Utilizing TikTok and Systems Thinking to Facilitate Scientific Public Engagement and Contextualization of Chemistry at Home. J. Chem. Educ. 2020, 97, 3858–3866. [Google Scholar] [CrossRef]
  37. Weimann, G.; Masri, N. Research Note: Spreading Hate on TikTok. Stud. Confl. Terror. 2020, 46, 752–765. [Google Scholar] [CrossRef]
  38. Ma, J.; Yu, S. The Future Development of E-Commerce in Tiktok; Atlantis Press: Amsterdam, The Netherlands, 2021; pp. 241–246. [Google Scholar]
  39. Lazarsfeld, P.F. Radio and the Printed Page; An Introduction to the Study of Radio and Its Role in the Communication of Ideas; Duell, Sloan, & Pearce: Oxford, UK, 1940; p. 354. [Google Scholar]
  40. Berelson, B. What “Missing the Newspaper” Means. Commun. Res. 1949, 1948–1949, 111–129. [Google Scholar]
  41. Herzog, H. Professor Quiz: A Gratification Study. Radio Print. Page 1940, 64–93. [Google Scholar]
  42. Katz, E.; Blumler, J.G. The Uses of Mass Communications: Current Perspectives on Gratifications Research; Sage Publications: Thousand Oaks, CA, USA, 1974; ISBN 978-0-8039-0340-1. [Google Scholar]
  43. Leung, L.; Wei, R. More Than Just Talk on the Move: Uses and Gratifications of the Cellular Phone. J. Mass Commun. Q. 2000, 77, 308–320. [Google Scholar] [CrossRef]
  44. Liu, I.L.B.; Cheung, C.M.K.; Lee, M.K.O. User Satisfaction with Microblogging: Information Dissemination versus Social Networking: User Satisfaction with Microblogging. J. Assoc. Inf. Sci. Technol. 2016, 67, 56–70. [Google Scholar] [CrossRef]
  45. Wibowo, N.C.; Suryanto, T.L.M.; Faroqi, A.; Hadiwiyanti, R. Understanding the Dominant Factors towards the Intention to Use Youtube Continuously in Indonesia. In Proceedings of the International Conference on Science and Technology (ICST 2018), Bali, Indonesia, 18–19 October 2018; Atlantis Press: Bali, Indonesia, 2018. [Google Scholar]
  46. Zafar, A.U.; Shen, J.; Ashfaq, M.; Shahzad, M. Social Media and Sustainable Purchasing Attitude: Role of Trust in Social Media and Environmental Effectiveness. J. Retail. Consum. Serv. 2021, 63, 102751. [Google Scholar] [CrossRef]
  47. Hewei, T.; Youngsook, L. Factors Affecting Continuous Purchase Intention of Fashion Products on Social E-Commerce: SOR Model and the Mediating Effect. Entertain. Comput. 2022, 41, 100474. [Google Scholar] [CrossRef]
  48. Park, D.-H.; Lee, J.; Han, I. The Effect of On-Line Consumer Reviews on Consumer Purchasing Intention: The Moderating Role of Involvement. Int. J. Electron. Commer. 2007, 11, 125–148. [Google Scholar] [CrossRef]
  49. Wang, C.; Teo, T.S.H.; Liu, L. Perceived Value and Continuance Intention in Mobile Government Service in China. Telemat. Inform. 2020, 48, 101348. [Google Scholar] [CrossRef]
  50. Hamari, J.; Hanner, N.; Koivisto, J. “Why Pay Premium in Freemium Services?” A Study on Perceived Value, Continued Use and Purchase Intentions in Free-to-Play Games. Int. J. Inf. Manag. 2020, 51, 102040. [Google Scholar] [CrossRef]
  51. Watchravesringkan, K.; Shim, S. Information Search and Shopping Intentions Through Internet for Apparel Products. Cloth. Text. Res. J. 2003, 21, 1–7. [Google Scholar] [CrossRef]
  52. Raman, P. Understanding Female Consumers’ Intention to Shop Online: The Role of Trust, Convenience and Customer Service. Asia Pac. J. Mark. Logist. 2019, 31, 1138–1160. [Google Scholar] [CrossRef]
  53. Koo, D.-M.; Ju, S.-H. The Interactional Effects of Atmospherics and Perceptual Curiosity on Emotions and Online Shopping Intention. Comput. Hum. Behav. 2010, 26, 377–388. [Google Scholar] [CrossRef]
  54. Zhao, J.-D.; Huang, J.-S.; Su, S. The Effects of Trust on Consumers’ Continuous Purchase Intentions in C2C Social Commerce: A Trust Transfer Perspective. J. Retail. Consum. Serv. 2019, 50, 42–49. [Google Scholar] [CrossRef]
  55. Bol, N.; Helberger, N.; Weert, J.C.M. Differences in Mobile Health App Use: A Source of New Digital Inequalities? Inf. Soc. 2018, 3, 183–193. [Google Scholar] [CrossRef] [Green Version]
  56. Matassi, M.; Mitchelstein, E.; Boczkowski, P. Social Media Repertoires: Social Structure and Platform Use. Inf. Soc. 2022, 38, 133–146. [Google Scholar] [CrossRef]
  57. Li, H.; Kuo, C.; Rusell, M.G. The Impact of Perceived Channel Utilities, Shopping Orientations, and Demographics on the Consumer’s Online Buying Behavior. J. Comput. Mediat. Commun. 1999, 5, JCMC521. [Google Scholar] [CrossRef]
  58. Millan, E.S.; Howard, E. Shopping for Pleasure? Shopping Experiences of Hungarian Consumers. Int. J. Retail Distrib. Manag. 2007, 35, 474–487. [Google Scholar] [CrossRef]
  59. Kee, H.; Wan, D. Internet Shopping Behavior among Singaporeans: Gender and Educational Issues. In Proceedings of the Fourth International Conference on Electronic Business, Beijing, China, 5–9 December 2004. [Google Scholar]
  60. Hui, T.-K.; Wan, D. Factors Affecting Internet Shopping Behaviour in Singapore: Gender and Educational Issues. Int. J. Consum. Stud. 2007, 31, 310–316. [Google Scholar] [CrossRef]
  61. Clemes, M.D.; Gan, C.; Zhang, J. An Empirical Analysis of Online Shopping Adoption in Beijing, China. J. Retail. Consum. Serv. 2014, 21, 364–375. [Google Scholar] [CrossRef]
  62. Li, H.; Liu, Y.; Xu, X.; Heikkilä, J.; van der Heijden, H. Modeling Hedonic Is Continuance through the Uses and Gratifications Theory: An Empirical Study in Online Games. Comput. Hum. Behav. 2015, 48, 261–272. [Google Scholar] [CrossRef]
  63. Cheung, C.M.K.; Chiu, P.-Y.; Lee, M.K.O. Online Social Networks: Why Do Students Use Facebook? Comput. Hum. Behav. 2011, 27, 1337–1343. [Google Scholar] [CrossRef]
  64. Alhabash, S.; Chiang, Y.; Huang, K. MAM & U&G in Taiwan: Differences in the Uses and Gratifications of Facebook as a Function of Motivational Reactivity. Comput. Hum. Behav. 2014, 35, 423–430. [Google Scholar] [CrossRef]
  65. Lee, S.-Y.; Hansen, S.S.; Lee, J.K. What Makes Us Click “like” on Facebook? Examining Psychological, Technological, and Motivational Factors on Virtual Endorsement. Comput. Commun. 2016, 73, 332–341. [Google Scholar] [CrossRef]
  66. Cutler, N.E.; Danowski, J.A. Process Gratification in Aging Cohorts. J. Q. 1980, 57, 269–276. [Google Scholar] [CrossRef]
  67. Huang, R.; Kim, H.; Kim, J. Social Capital in QQ China: Impacts on Virtual Engagement of Information Seeking, Interaction Sharing, Knowledge Creating, and Purchasing Intention. J. Mark. Manag. 2013, 29, 292–316. [Google Scholar] [CrossRef]
  68. Stafford, M.R.; Stafford, T.F. Mechanical Commercial Avoidance: A Uses and Gratifications Perspective. J. Curr. Issues Res. Advert. 1996, 18, 27–38. [Google Scholar] [CrossRef]
  69. Ghahtarani, A.; Sheikhmohammady, M.; Rostami, M. The Impact of Social Capital and Social Interaction on Customers’ Purchase Intention, Considering Knowledge Sharing in Social Commerce Context. J. Innov. Knowl. 2020, 5, 191–199. [Google Scholar] [CrossRef]
  70. Liu, L.; Yin, C.; Yang, J. Understanding User Intention to Share Information in Online Social Shopping Communities: The Moderating Effect of Community Equity. In Proceedings of the 19th Pacific Asia Conference on Information Systems (PACIS 2014), Chengdu, China, 24–28 June 2014. [Google Scholar]
  71. Robert, L.P.; Dennis, A.R.; Ahuja, M.K. Social Capital and Knowledge Integration in Digitally Enabled Teams. Inf. Syst. Res. 2008, 19, 314–334. [Google Scholar] [CrossRef]
  72. Stoel, L.; Wickliffe, V.; Lee, K.H. Attribute Beliefs and Spending as Antecedents to Shopping Value. J. Bus. Res. 2004, 57, 1067–1073. [Google Scholar] [CrossRef]
  73. Babin, B.J.; Darden, W.R.; Griffin, M. Work and/or Fun: Measuring Hedonic and Utilitarian Shopping Value. J. Consum. Res. 1994, 20, 644–656. [Google Scholar] [CrossRef]
  74. Keeney, R.L. The Value of Internet Commerce to the Customer. Manag. Sci. 1999, 45, 533–542. [Google Scholar] [CrossRef]
  75. Bakos, J.Y. Reducing Buyer Search Costs: Implications for Electronic Marketplaces. Manag. Sci. 1997, 43, 1676–1692. [Google Scholar] [CrossRef] [Green Version]
  76. Stafford, T.F.; Stafford, M.R.; Schkade, L.L. Determining Uses and Gratifications for the Internet. Decis. Sci. 2004, 35, 259–288. [Google Scholar] [CrossRef]
  77. Ellison, N.B.; Steinfield, C.; Lampe, C. The Benefits of Facebook “Friends:” Social Capital and College Students’ Use of Online Social Network Sites. J. Comput. Mediat. Commun. 2007, 12, 1143–1168. [Google Scholar] [CrossRef] [Green Version]
  78. Ang, T.; Wei, S.; Anaza, N.A. Livestreaming vs Pre-Recorded: How Social Viewing Strategies Impact Consumers’ Viewing Experiences and Behavioral Intentions. Eur. J. Mark. 2018, 52, 2075–2104. [Google Scholar] [CrossRef]
  79. Hassanein, K.; Head, M. Manipulating Perceived Social Presence through the Web Interface and Its Impact on Attitude towards Online Shopping. Int. J. Hum. Comput. Stud. 2007, 65, 689–708. [Google Scholar] [CrossRef]
  80. Gan, C.; Wang, W. Uses and Gratifications of Social Media: A Comparison of Microblog and WeChat. J. Syst. Inf. Technol. 2015, 17, 351–363. [Google Scholar] [CrossRef]
  81. Xu, X.; Wang, L.; Zhao, K. Exploring Determinants of Consumers’ Platform Usage in “Double Eleven” Shopping Carnival in China: Cognition and Emotion from an Integrated Perspective. Sustainability 2020, 12, 2790. [Google Scholar] [CrossRef] [Green Version]
  82. Matthews, H.; Taylor, M.; Percy-Smith, B.; Limb, M. The Unacceptable Flaneur: The Shopping Mall as a Teenage Hangout. Childhood 2000, 7, 279–294. [Google Scholar] [CrossRef]
  83. Kim, C.; Hwang, J.S.; Cho, J. Relationships among Mobile Fashion Shopping Characteristics, Perceived Usefulness, Perceived Enjoyment, and Purchase Intention-Mediating Effect of Ease of Use. J. Korean Soc. Cloth. Text. 2015, 39, 161–174. [Google Scholar] [CrossRef]
  84. Dharmesti, M.; Dharmesti, T.R.S.; Kuhne, S.; Thaichon, P. Understanding Online Shopping Behaviours and Purchase Intentions amongst Millennials. Young Consum. 2019, 22, 152–167. [Google Scholar] [CrossRef] [Green Version]
  85. Trammell, K.D. Celebrity Blogs: Investigation in the Persuasive Nature of Two-Way Communication Regarding Politics; University of Florida: Gainesville, FL, USA, 2004. [Google Scholar]
  86. Sismeiro, C.; Bucklin, R.E. Modeling Purchase Behavior at an E-Commerce Web Site: A Task-Completion Approach. J. Mark. Res. 2004, 41, 306–323. [Google Scholar] [CrossRef] [Green Version]
  87. Althaus, S.L.; Tewksbury, D. Patterns of Internet and Traditional News Media Use in a Networked Community. Polit. Commun. 2000, 17, 21–45. [Google Scholar] [CrossRef]
  88. Ryan, R.M.; Deci, E.L. Intrinsic and Extrinsic Motivations: Classic Definitions and New Directions. Contemp. Educ. Psychol. 2000, 25, 54–67. [Google Scholar] [CrossRef]
  89. Xu, C.; Ryan, S.; Prybutok, V.; Wen, C. It Is Not for Fun: An Examination of Social Network Site Usage. Inf. Manag. 2012, 49, 210–217. [Google Scholar] [CrossRef] [Green Version]
  90. ASKCI. Analysis of Online Shopping User Scale and User Group Portrait in China in 2022. Available online: https://baijiahao.baidu.com/s?id=1729017161751018870&wfr=spider&for=pc (accessed on 20 September 2022).
  91. McCormick, A.C.; Borden, V.M.H. Higher Education Institutions, Types and Classifications Of. In Encyclopedia of International Higher Education Systems and Institutions; Springer: Dordrecht, The Netherlands, 2017; pp. 1–9. [Google Scholar]
  92. CNNIC. The 48th Statistical Report on Internet Development in China; China Internet Network Information Center (CNNIC): Beijing, China, 2022. [Google Scholar]
  93. Bagozzi, R.P.; Yi, Y. On the Evaluation of Structural Equation Models. J. Acad. Mark. Sci. 1988, 16, 74–94. [Google Scholar] [CrossRef]
  94. Urbach, N.; Ahlemann, F. Structural Equation Modeling in Information Systems Research Using Partial Least Squares. J. Inf. Technol. Theory Appl. JITTA 2010, 11, 2. [Google Scholar]
  95. Fornell, C.; Larcker, D.F. Structural Equation Models with Unobservable Variables and Measurement Error: Algebra and Statistics. J. Mark. Res. 1981, 18, 382–388. [Google Scholar] [CrossRef]
  96. Kline, T. Psychological Testing: A Practical Approach to Design and Evaluation; SAGE: Newcastle upon Tyne, UK, 2005; ISBN 978-1-4129-0544-2. [Google Scholar]
  97. Bentler, P.M. Comparative Fit Indexes in Structural Models. Psychol. Bull. 1990, 107, 238–246. [Google Scholar] [CrossRef]
  98. Hu, L.; Bentler, P.M. Cutoff Criteria for Fit Indexes in Covariance Structure Analysis: Conventional Criteria versus New Alternatives. Struct. Equ. Model. Multidiscip. J. 1999, 6, 1–55. [Google Scholar] [CrossRef]
  99. Byrne, B.M. Structural Equation Modeling with AMOS, EQS, and LISREL: Comparative Approaches to Testing for the Factorial Validity of a Measuring Instrument. Int. J. Test. 2009, 1, 55–86. [Google Scholar] [CrossRef]
  100. Podsakoff, P.M.; MacKenzie, S.B.; Podsakoff, N.P. Sources of Method Bias in Social Science Research and Recommendations on How to Control It. Annu. Rev. Psychol. 2012, 63, 539–569. [Google Scholar] [CrossRef] [Green Version]
  101. Podsakoff, N.P. Common Method Biases in Behavioral Research: A Critical Review of the Literature and Recommended Remedies. J. Appl. Psychol. 2003, 885, 10–1037. [Google Scholar] [CrossRef] [PubMed]
  102. Cenfetelli, R.T.; Bassellier, G. Interpretation of Formative Measurement in Information Systems Research. MIS Q. 2009, 33, 689–707. [Google Scholar] [CrossRef]
  103. Awang, Z. Research Methodology and Data Analysis Second Edition; UiTM Press: Shah Alam, Selangor, 2012; ISBN 978-967-363-422-4. [Google Scholar]
  104. Grewal, D.; Baker, J.; Levy, M.; Voss, G.B. The Effects of Wait Expectations and Store Atmosphere Evaluations on Patronage Intentions in Service-Intensive Retail Stores. J. Retail. 2003, 79, 259–268. [Google Scholar] [CrossRef]
  105. Gefen, D.; Straub, D. Managing User Trust in B2C E-Services. E-Serv. J. 2003, 2, 7–24. [Google Scholar] [CrossRef]
  106. Verhoef, P.C.; Langerak, F. Possible Determinants of Consumers’ Adoption of Electronic Grocery Shopping in the Netherlands. J. Retail. Consum. Serv. 2001, 8, 275–285. [Google Scholar] [CrossRef]
  107. Nikolaev, B. Does Higher Education Increase Hedonic and Eudaimonic Happiness? J. Happiness Stud. 2018, 19, 483–504. [Google Scholar] [CrossRef] [Green Version]
Figure 1. The research model.
Sustainability 15 10028 g001
Figure 2. Full sample path estimate (N = 234). (***: p < 0.001; **: p < 0.01; *: p < 0.05).
Sustainability 15 10028 g002
Figure 3. Low educated (N = 138). (***: p < 0.001; **: p < 0.01; *: p < 0.05; n.s.: not significant).
Sustainability 15 10028 g003
Figure 4. High educated (N = 96). (***: p < 0.001; **: p < 0.01; *: p < 0.05; n.s.: not significant).
Sustainability 15 10028 g004
Table 1. Social media summary of the gratifications.
Social MediaResearch MethodsKeywords of Motives/GratificationsStudy
Facebookonline surveyrelaxing entertainment, information sharing, escapist, companionship, professional advancement, social interaction, passing time, and meeting new people[15]
Twitteronline surveyconnecting with other people[17]
Instagramcontent analysisself-expression, surveillance of others, and entertainment[16]
Microbloggingonline surveyinformation sharing, self-documentation, self-expression convenience, medium appeal, and social presence[44]
YouTubeonline surveyinformation sharing, passing time, enjoyment, media appeal[45]
WeChatonline surveyenjoyment, social support, and information seeking[18]
TikTok (Douyin)online surveysocially rewarding self-presentation, trendiness, escapist addiction, and novelty[19]
Table 2. Literature review on the role of education level in online shopping.
Research ContextResearch MethodsResearch Findings Study
attitudes toward online shoppingrandom sampling surveyWith increasing levels of education, the perception of the Internet as giving better cost-saving prices and grows.[59]
Internet shopping behaviorrandom sampling surveyHighly educated believe that online shopping provides better cost-saving prices.[60]
online purchase behavioronline survey; interviewProfessionals’ online purchase behavior and their educational level have a strong correlation.[27]
online shoppingrandom sampling survey by mailOnline shoppers are better educated and have a greater level of computer literacy than non-shoppers.[24]
online shopping adoptionconvenience sampling approach on a face-to-face basisHigher education levels and online shopping adoption have a positive association.[61]
online shopping behaviorsecondary analysis; interviewOver time, an online shopper’s level of education will have a positive impact on their online purchasing behavior.[25]
internet-based e-shoppingonline survey; interviewsThe findings imply that the more computer and IT-educated people are, the more they would be willing to e-shop on the Internet[28]
Table 3. List of research constructs in the research model.
GratificationsCommentsDimensionDefinitionStudy
Content GratificationBy sharing the TTL useful information with friends, they may receive more attention and be more motivated to make the next purchase.Information sharingThe extent to which consumers share interesting information about events, trends, music, and so on.[44,85]
Utilitarian GratificationTTL consumers are more likely to stimulate their shopping motivation when utilitarian results are satisfied.Cost savingThe extent to which consumers use it to save product costs and browsing costs.[60]
Information seekingThe extent to which the activity of using it refers to browsing product information in a virtual context.[86]
Social GratificationTTL makes consumers seem to be involved in it, and through this illusion, consumers are even more motivated to buy.Social presenceThe degree to which a consumer’s psychological sensation of physically connecting and forming a personal connection with others is achieved by it.[62]
Hedonic GratificationConsumers may be more likely to buy goods that bring them happiness while enjoying themselves with TTL.Passing timeThe extent to which consumers use it can enrich their free time.[87]
EnjoymentThe extent to which the activity of using it is perceived to be enjoyable.[88]
EscapismThe extent to which consumers avoid the real world to forget the different pressures and worries of one’s real life.[89]
Table 4. The list of questionnaires.
GratificationConstructItemMeasurementReferences
Content gratificationInformation sharingIS1I can provide information[44]
IS2I can share information that is useful to other people
IS3I can present information on my interests
Utilitarian gratificationCost saving CS1I can save money[22]
CS2I can spend less when I go shopping
CS3It can offer me the competitive price
Information seekingISE1I can obtain useful information[18]
ISE2I can obtain helpful information
Social gratificationSocial presenceSP1There is a sense of human contact in it[63]
SP2There is a sense of personalness in it
SP3SP4There is a sense of sociability in itThere are all kinds of emotions in it
Hedonic gratificationPassing time PT1It is just a habit, just something I do[44]
PT2It helps me pass time when I am bored
EnjoymentEN1I can feel entertained[18]
EN2I can feel pleasure
EN3I can feel fun
EscapismES1I can get a break from what I am doing[19]
ES2When I do not want to work or study
ES3I can forget unpleasant things from work, school, or life
Continuous purchase intention CPI1I am willing to shop from the TTL[20,21]
CPI2I prefer to shop from TTL rather than other apps
CPI3I am willing to recommend TTL
Table 5. Respondents’ demographic information.
MeasureItemsFrequencyPercentage (%)
GenderMale11448.7
Female12051.3
AgeBelow 20198.1
20–4011348.3
41–609038.5
Above 60125.1
Education levelBelow junior middle school2912.4
Junior middle school and senior high school10946.6
College and university7632.5
Master’s degree or above208.5
FrequencyMore than twice a week2912.4
Once a week8335.5
Once or twice a month10745.7
Once every half a year or longer156.4
Table 6. Confirmatory factor analysis results.
ItemsFactor LoadingVIFαC.RAVE
IS30.757 2.0170.835 0.822 0.606
IS20.814 2.232
IS10.764 2.089
CS30.720 1.7720.756 0.751 0.503
CS20.631 1.570
CS10.769 1.763
ISE20.698 1.7080.717 0.712 0.553
ISE10.787 1.636
SP40.736 2.1380.819 0.833 0.556
SP30.729 1.809
SP20.710 2.000
SP10.805 1.919
PT20.790 1.8930.747 0.754 0.605
PT10.765 1.947
EN30.729 2.3680.854 0.825 0.612
EN20.832 2.558
EN10.782 2.329
ES30.649 2.1030.808 0.775 0.537
ES20.794 2.117
ES10.747 1.941
CPI30.794 2.5310.856 0.855 0.663
CPI20.866 3.027
CPI10.780 2.529
Table 7. Discriminant validity and correlation matrix.
AVEESENPTSPISECSISCPI
ES0.5370.733
EN0.6120.5080.782
PT0.605−0.047−0.0930.778
SP0.556−0.003−0.1490.6570.748
ISE0.553−0.0580.1550.0190.1170.744
CS0.503−0.085−0.0670.1440.120−0.1900.709
IS0.6060.0000.027−0.014−0.027−0.032−0.2600.778
CPI0.6630.4430.4690.4640.4990.1810.1280.1460.814
Note: Bold-faced diagonal elements are the square roots of AVEs. The off-diagonal elements are the correlations between constructs.
Table 8. Moderation with chi-square (X2) significance.
ModelCFIIFIGFIRMSEANPARCMIN (X2)DFPCMIN/DF
Unconstrained0.9360.9390.8510.035148521.1434040.0001.290
Measurement residuals0.9000.9020.8180.04174660.2664780.0001.381
Chi-square (X2) significance−0.036−0.037−0.0330.006 139.123740.0001.880
Table 9. Critical ratios for differences between parameters.
Hypothesis HISCSISESPPTENESSupport?
L →CPI
H8aIS→CPI−1.921−1.816−0.339−3.4430.584−2.851−1.927NO
H8bCS−0.946−1.2260.227−2.8020.934−2.507−1.342NO
H8cISE−2.121−1.937−0.491−3.5530.478−2.918−2.046NO
H8dSP−0.453−0.8710.608−2.447 *1.217−2.286−0.991YES
H8ePT−0.490−0.9020.609−2.4991.226−2.311−1.023NO
H8fEN0.195−0.4091.195−2.0431.679−2.011 *−0.538YES
H8gES−0.124−0.6270.878−2.2091.426−2.133−0.749NO
*: z score > 1.96, significant at 5% (p < 0.05).
Disclaimer/Publisher’s Note: The statements, opinions and data contained in all publications are solely those of the individual author(s) and contributor(s) and not of MDPI and/or the editor(s). MDPI and/or the editor(s) disclaim responsibility for any injury to people or property resulting from any ideas, methods, instructions or products referred to in the content.

