Article

Long-Term Field Observation of the Power Generation and System Temperature of a Roof-Integrated Photovoltaic System in South Korea

1
School of Chemical Engineering, Yeungnam University, 280 Daehak-ro, Gyeongsan 38541, Gyeongbuk, Republic of Korea
2
Roser Roofing System, 43, Nae-Ri-19, Ammyang-myeon, Gyeongsan 38539, Gyeongbuk, Republic of Korea
*
Author to whom correspondence should be addressed.
These authors contributed equally to this work.
Sustainability 2023, 15(12), 9493; https://doi.org/10.3390/su15129493
Submission received: 26 April 2023 / Revised: 8 June 2023 / Accepted: 9 June 2023 / Published: 13 June 2023

Abstract

:
A miniature house roof-integrated photovoltaic (PV) system in South Korea was monitored for 2.5 years. System performance was evaluated through power generation, solar irradiance, and system temperature. The comparison of each month’s power generation and solar irradiance revealed a parallel correlation over the entire observation period. The internal module temperature was almost always higher than the roof rear and module rear temperatures by 1–2 and 1–5 °C, respectively, while the temperature behind the PV modules was the lowest among the three temperatures, showing that the installation of PV modules as a roofing system does not affect the temperature of the roofing system. The system temperatures affected the power conversion efficiency; a maximum of 11.42% was achieved when the system temperatures were the lowest, and a minimum of 5.24% was achieved when the system temperatures were the highest. Hence, half of the anticipated generated power was lost due to the temperature fluctuation. Overall, installing PV modules as an entire roofing system is possible with this configuration due to the minimum effect on the roof temperature. However, PV system temperature control is essential for maintaining the power generation performance of the PV modules.

1. Introduction

The energy issue is among the top contemporary global crises [1]. Renewable and clean sources of energy need to be capitalized given the aggravated global security issues as of February 2022 and the electricity demand rising by 5.9% to 1400 terawatt hours (TWh), complemented by 14.6 gigatons of CO2 emissions from burning fossil fuels for electricity and heat production [1,2]. Photovoltaic (PV) systems, which utilize a renewable energy source in the form of sunlight, experienced increased capacity and market size. The PV module market increased to 310 gigawatts (GW) in 2022 [3], with the PV module production capacity by the end of 2021 being over 470 gigawatt-peak (GWp) [4]. PV systems covered over 5% of the global electricity generation in 2021, reducing annual CO2 emissions by as much as 1100 megatons during the year [5].
Continuous improvements in the PV system application method are required to further boost the use of PV systems in the future. A few strategies have been implemented to diversify the PV system applications, such as vertically installed PV [6], agriphotovoltaics [7], floating photovoltaics [8], building-applied photovoltaics (BAPVs) [9], and building-integrated photovoltaics (BIPVs) [10]. Using a PV system as an intrinsic part of a building, a BIPV system takes part in the building structure while generating power [10,11]. In BIPVs, PV systems mainly serve as façades and/or roofing systems for buildings [10,11,12]. In a façade system, PV modules can serve as curtains, glazing, or spandrel panels; in a BIPV roofing system, PV modules can serve as roofing tiles, shingles, standing seams, or skylights [11]. The long-term cost offset is beneficial by replacing one functional component of a building with a working PV system [13]. The BIPV roofing system is viable for use over residential houses, as there are many areas with passively functioning roofs that PV systems can replace to create hundreds of GWp [14]. Due to these advantages, BIPV implementation has been widespread in recent years [10,14]. The policies of several countries have played a major role in promoting BIPV implementation. A few examples include tax-free self-consumption of BIPV power in France [15] and Japan [16], incentives for BIPV installation in China [17], and BIPV installation subsidies in Korea [18]. Government aid has directly contributed to the rapid growth of the number of BIPV installations, with Grand View Research forecasting that the global BIPV market will increase from USD 19.82 billion in 2022 to USD 88.38 billion in 2030 [19]. More studies are required to complement this growing industry and understand the factors contributing to system performance.
Several factors affect the performance of PV modules, namely PV module manufacturing design, cell technology type, solar irradiance, wind direction and speed, mounting configuration, and temperature [20,21,22]. Appropriate mounting configuration can limit PV module degradation, as shown by Jordan et al., who studied the performance of aluminum back surface field (Al-BSF)–based PV modules installed in Las Vegas, USA, with different mounting configurations [23]. The authors reported reduced heat transfer into the modules with a lower amount of metal roof and increased heat transfer with a rack-mounting configuration, leading to a lower PV module degradation rate. Manufacturing design effects due to insulations behind the PV modules were studied by Gok et al., who evaluated the performance of glass/back-sheet- and glass/glass-based crystalline silicon (c-Si) PV modules installed in two different mounting configurations in Canobbio, Switzerland [24]. The authors reported that higher operating temperatures significantly impacted the glass/back-sheet module, with the performance loss rate (PLR) varying from 0.01%/year for ventilation to −0.42%/year for insulation. Conversely, the glass/glass module displayed an unexpected opposite trend, with the PLR varying from −0.10%/year for ventilation to 0.26%/year for insulation. IV measurements revealed that the reduced performance of the glass/back-sheet module originated from the deterioration of the fill factor through increased resistance, whereas the rise in the short-circuit current (Isc) was the primary driver of the insulated glass/glass module performance improvement. Kumar et al. studied different cell technology types, focusing on three different types of PV technologies: crystalline silicon (c-Si), copper indium selenide (CIS), and cadmium telluride (CdTe) modules, as BIPVs and BAPVs in Malaysia [21]. The energy-generating performance was different among the three technologies, with the c-Si, CIS, and CdTe modules generating peaks of 4240, 4280, and 4490 kWh, respectively. Singh et al. reported on the performance of high-efficiency heterojunctions with intrinsic thin-layer (HIT)-technology-based PV modules depending on different climatic conditions [25]. The authors showed that HIT technology-based PV modules were more efficient at cold partition temperatures. The impacts of urban heat islands (UHIs) and urban air pollution on BIPV energy efficiency have been extensively studied. For instance, Wang et al. reported that the UHI and solar radiation absorption caused by smog could reduce the overall PV energy generation in urban locations by more than 10% compared to that in rural locations [26]. The effects of the tilt angle and wind speed were studied by Dabaghzadeh et al., who studied the convective cooling of a PV system by modeling different tilt angles and wind speeds [27]. The authors observed the lowest temperature for a tilt angle of 45°, aided by optimal convective cooling, irrespective of the wind speed.
BIPV research has mainly focused on temperature, power generation, and the correlation between the two parameters. Kumar et al. reported on different temperature and performance losses for different PV module types, with the c-Si BIPV exhibiting 13.6% reduced performance, the CIS system exhibiting 12.8% reduced performance, and the CdTe system exhibiting 8.8% reduced power generation efficiency [21]. Poulek et al. compared the temperature of BIPV modules to that of PV modules with conventional configurations and its relation to energy production [28]. The authors used a modeling approach to compare BIPV modules with free-standing PV modules in four different climates while conducting a field study in Prague, Czech Republic. The field study indicated that the temperature of the BIPV modules was higher by more than 5 °C compared to that of the conventionally installed PV modules. At the same time, a difference of 3–5% in energy production due to the increased module temperature was evident. Using their model, the authors observed that climate differences from cold to hot temperatures had a negligible effect on the BIPV performance degradation; however, the PV module degradation in area with very hot temperatures was rapid. Kim et al. studied BIPV module temperatures with different insulations by conducting a field study on a miniature house with a tilted BIPV roofing system in Daejeon, South Korea [29]. The locations of the insulation were different: One system had insulation behind the PV modules (i.e., a warm roofing system), while another system had insulation behind the ceiling (i.e., a cold roofing system). The comparison of the two systems showed that the BIPV power generation of the cold roofing system was 7% higher than that of the cold roofing system. D’Orazio et al. analyzed different BIPV configurations in Ancona, Italy [30]. The authors compared rack-mounted high-ventilated, moderate-ventilated, and non-ventilated BIPV systems to see the effect of natural ventilation with the addition of air gaps. Rack-mounted PV modules exhibited the lowest PV module and air-back temperatures. In contrast, non-ventilated BIPVs exhibited the highest temperatures. The authors found that an air gap of 0.04 m between the PV modules and the roof was sufficient to create a difference of less than 3% in annual power generation prowess. Kaplanis et al. conducted a modeling study of the aging effect of BIPV and BAPV systems [31]. PV module aging was predicted to increase the PV module temperature relative to the case of the reference modules. Given the expected increase in PV module temperature when installed in a BIPV system compared to the case of a conventional installation, the aging effect might become more prominent.
Several studies have focused on decreasing the PV module temperature in BIPV systems. Mittelman et al. modeled a cooling channel in an attempt to increase the performance of PV modules in BIPVs and observed that adding 0.02–0.20 m air space between the PV modules and the roof can decrease their temperature by 10–20 °C and thus increase their energy-generating performance by 1–2% [32]. Other attempts to decrease the PV module temperature incorporated phase change materials (PCMs). Karthikeyan et al. studied the effect of a non-contact composite PCM on the optimal PCM thickness and observed that the optimum PCM thickness was 2.5 cm, yielding an average of 6.7 °C PV module temperature reduction [32]. Hasan et al. studied five different PCMs to decrease the BIPV module temperature [33]. The authors used CaCl2 as PCM and achieved an 18 °C lower BIPV module temperature for 30 min. In a more extended observation of 5 h, a 10 °C temperature reduction was maintained.
Considering the findings of previous studies on BIPV and PV modules in general, the issue of system temperature and power in BIPVs will persist with the growth of the BIPV industry, especially concerning how temperature affects the PV performance or the building [10]. Several short-term studies on the effect of BIPV module temperature on module performance—involving either modeling or field investigations—have been conducted [21,28,29,30,31,32,33]; however, only a few studies have reported on the effect of PV modules installed on top of roof tile systems and how the temperature of the roof tiles with attached PV modules compares to that under roof tiles without attached PV modules. The specific weather and climate of the regions where BIPVs are installed are also important for comparison. While temperature-reducing efforts have been generally fruitful, there are several associated drawbacks. Natural circulation might allow dust to collect in the air gap, reducing heat transfer. At the same time, several PCMs are costly and hazardous to the environment [34]. Additionally, PCMs can achieve limited BIPV module cooling due to their short cooling duration. Because of all these issues and how long-term studies (i.e., studies longer than a year) are not available, a miniature house BIPV system was manufactured to better understand the long-term temperature conditions of the roofing system with metal tiles and attached PV modules without dedicated ventilations and PCMs for 2.5 years in South Korea. The comparison of the temperature of the roof tiles with that under the PV modules was used to assess the possibility of installing PV modules on the entire roofing system in this roofing configuration with metal tiles. The contributions of this study are as follows:
  • Insight into how a BIPV roofing system in South Korea performed for 2.5 years in terms of its power generation and system temperature.
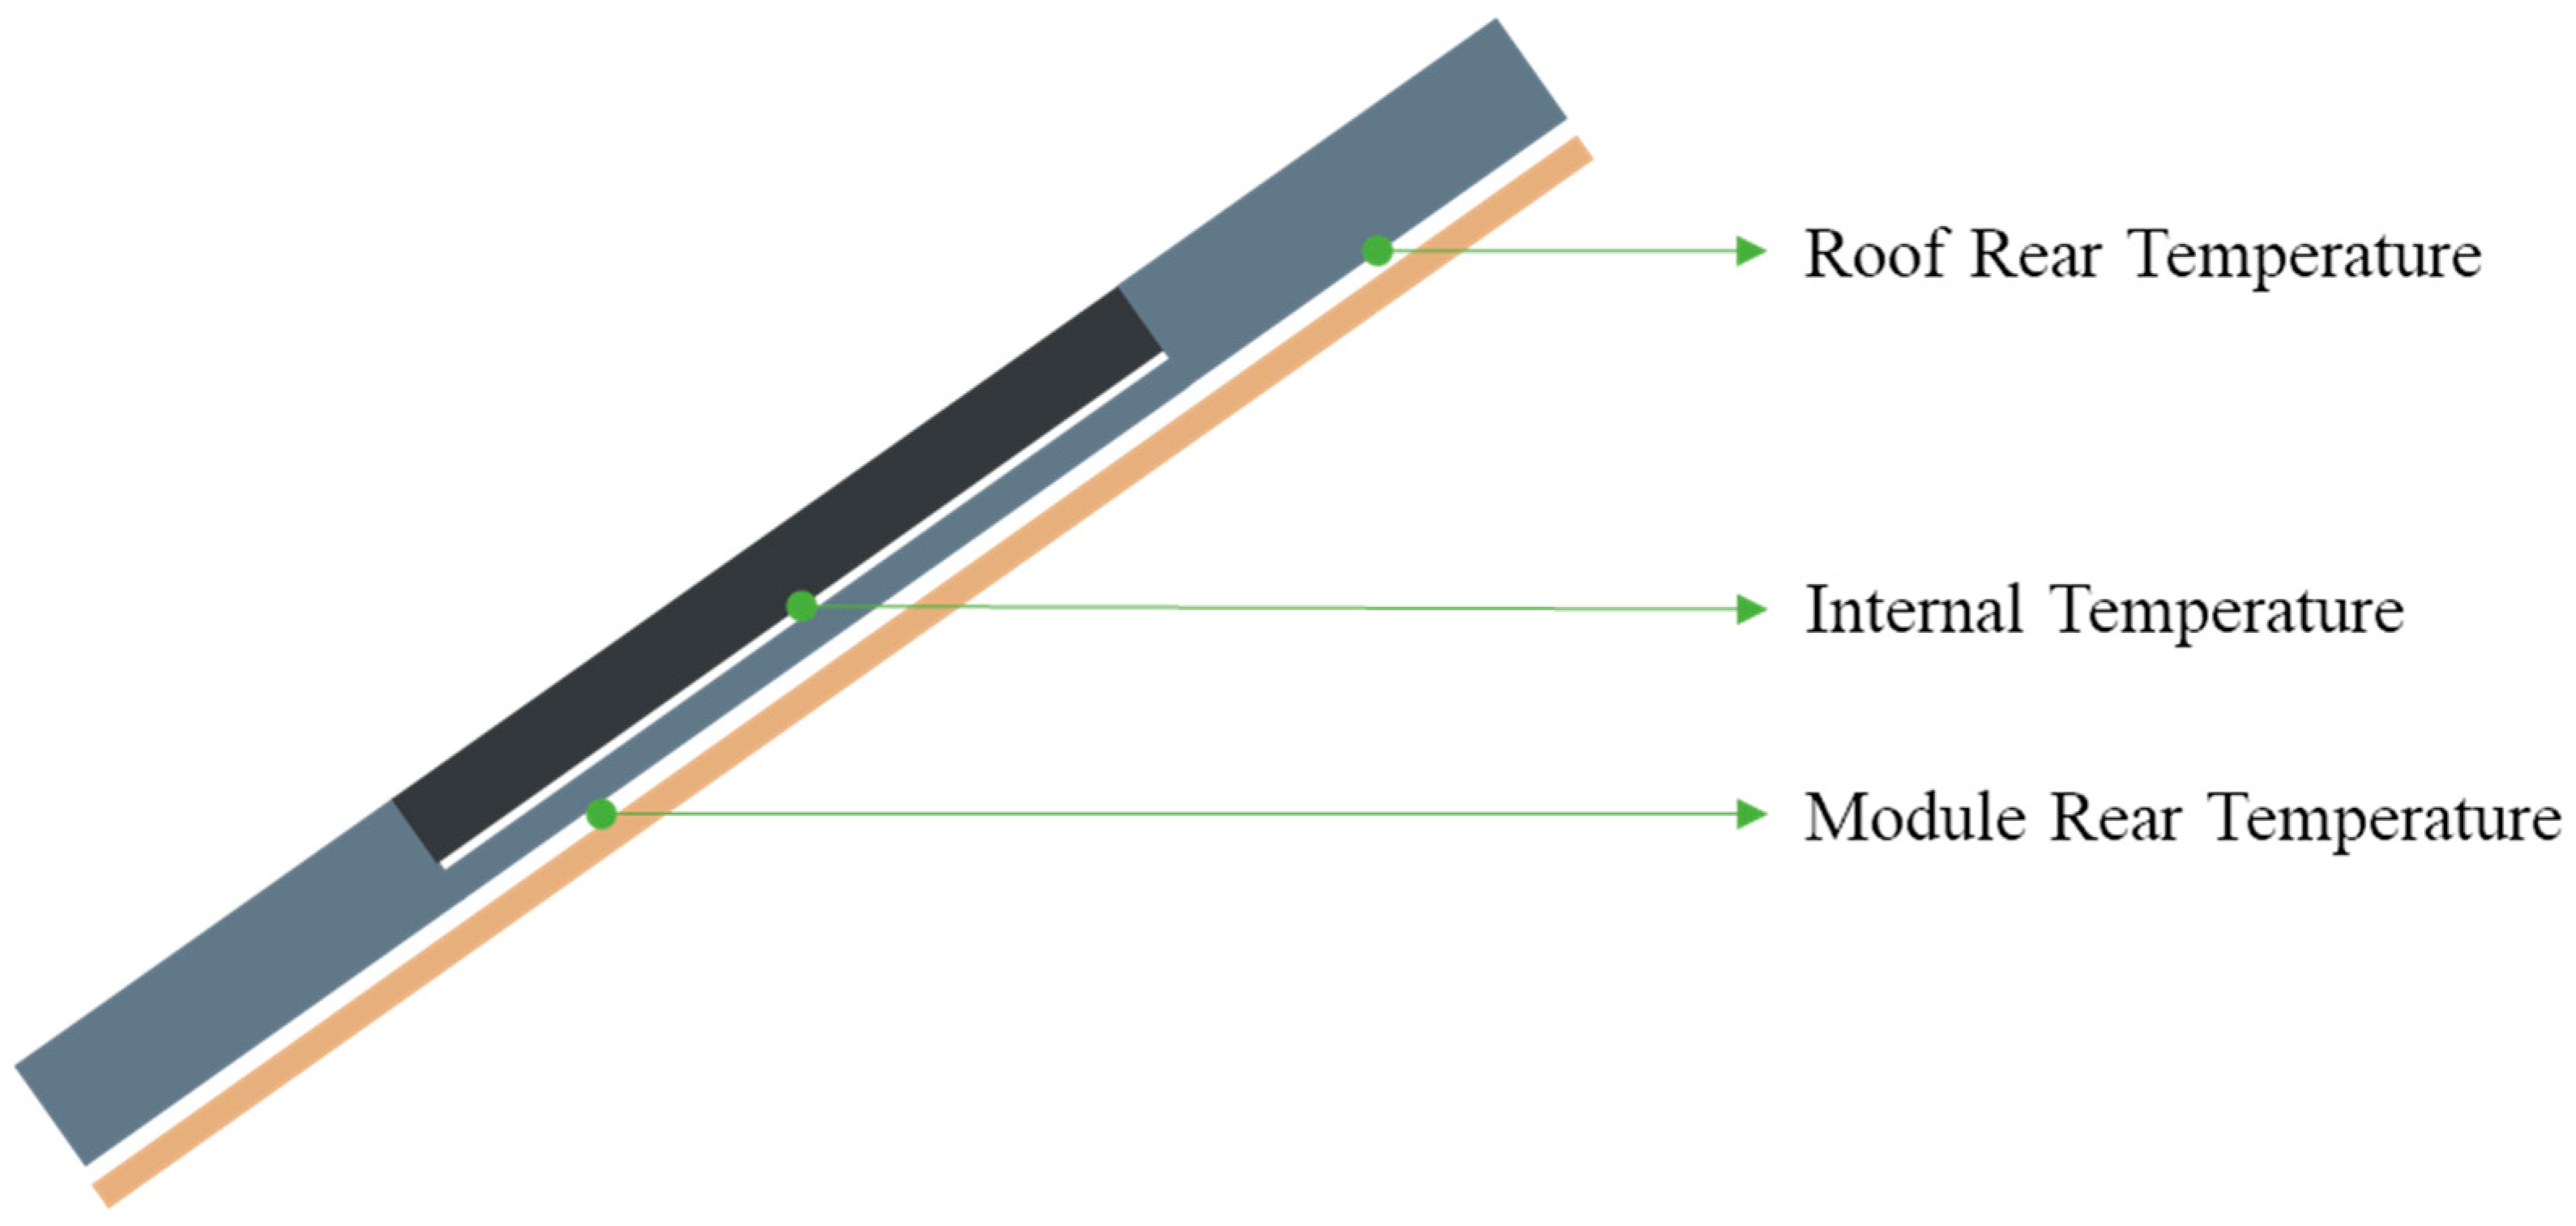
  • More detailed and specific information on the BIPV system temperature based on the PV module internal temperature and the comparison between the temperature of the roof tiles and that of the roof tiles behind the PV modules.
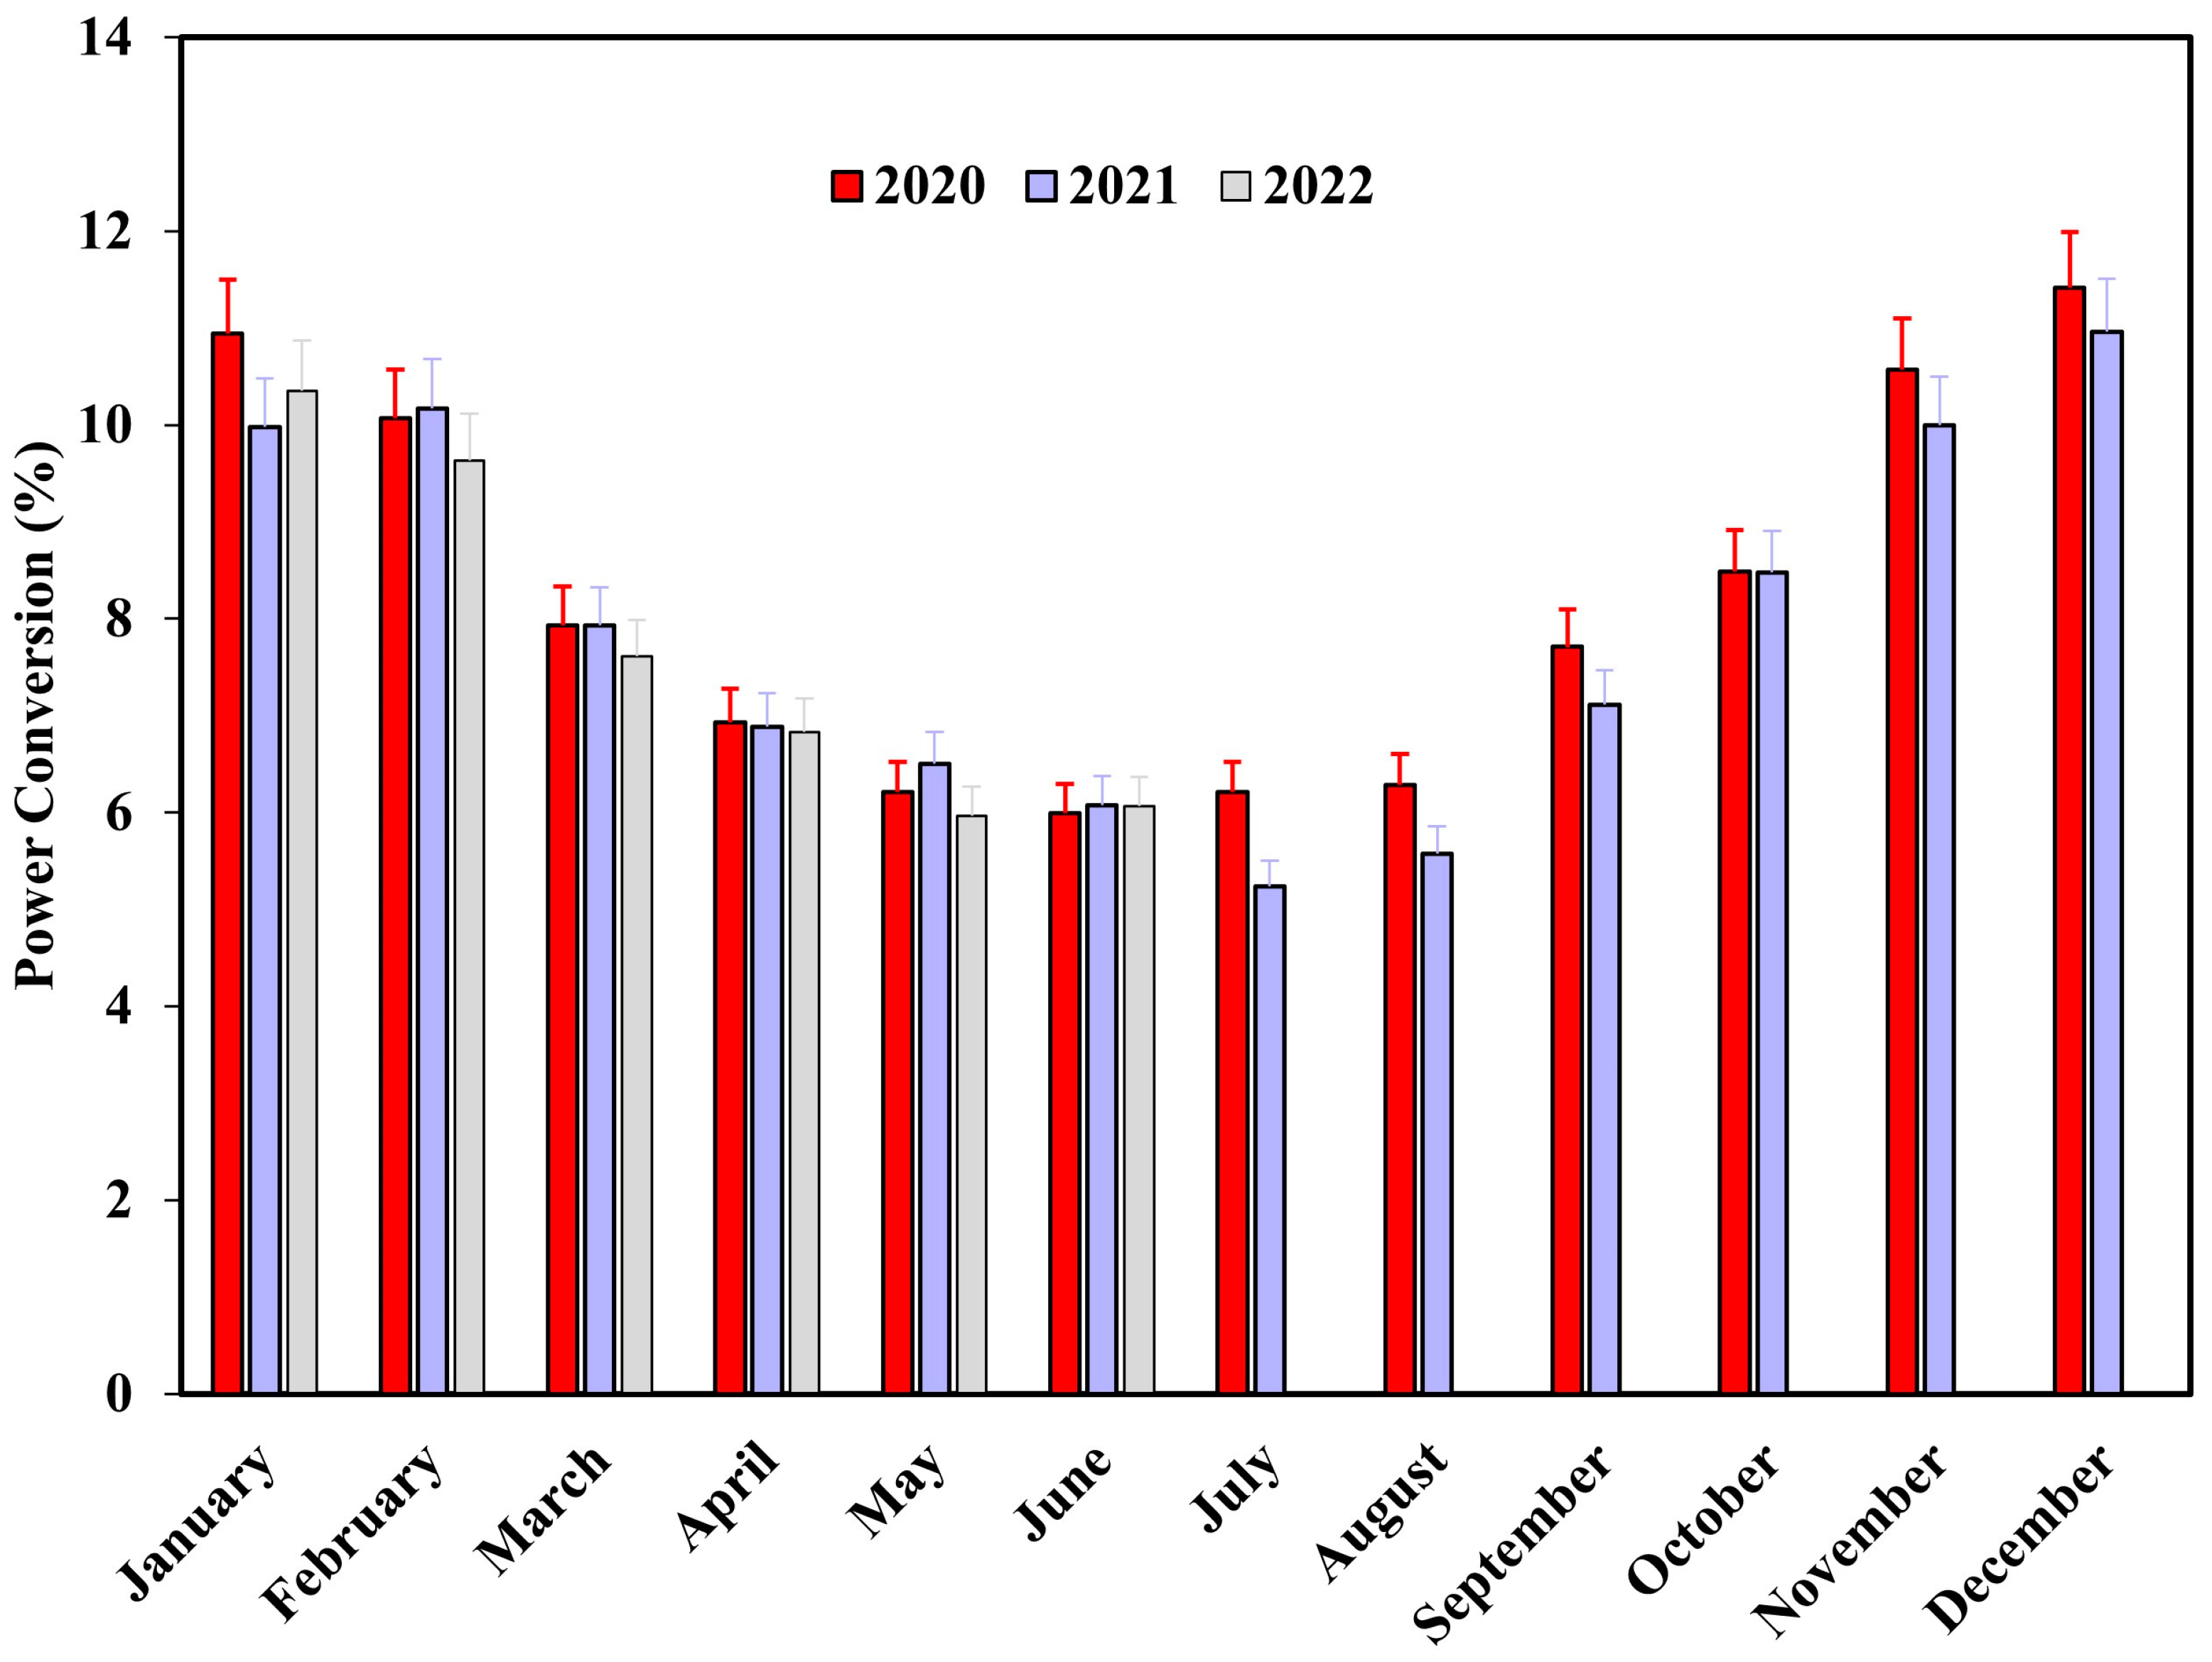
  • Observations regarding the changes in PV module power conversion prowess during long-term use in the BIPV roofing system.
The findings of this study address questions regarding the effect of PV module installation on the roof temperature and the PV module’s performance over time.

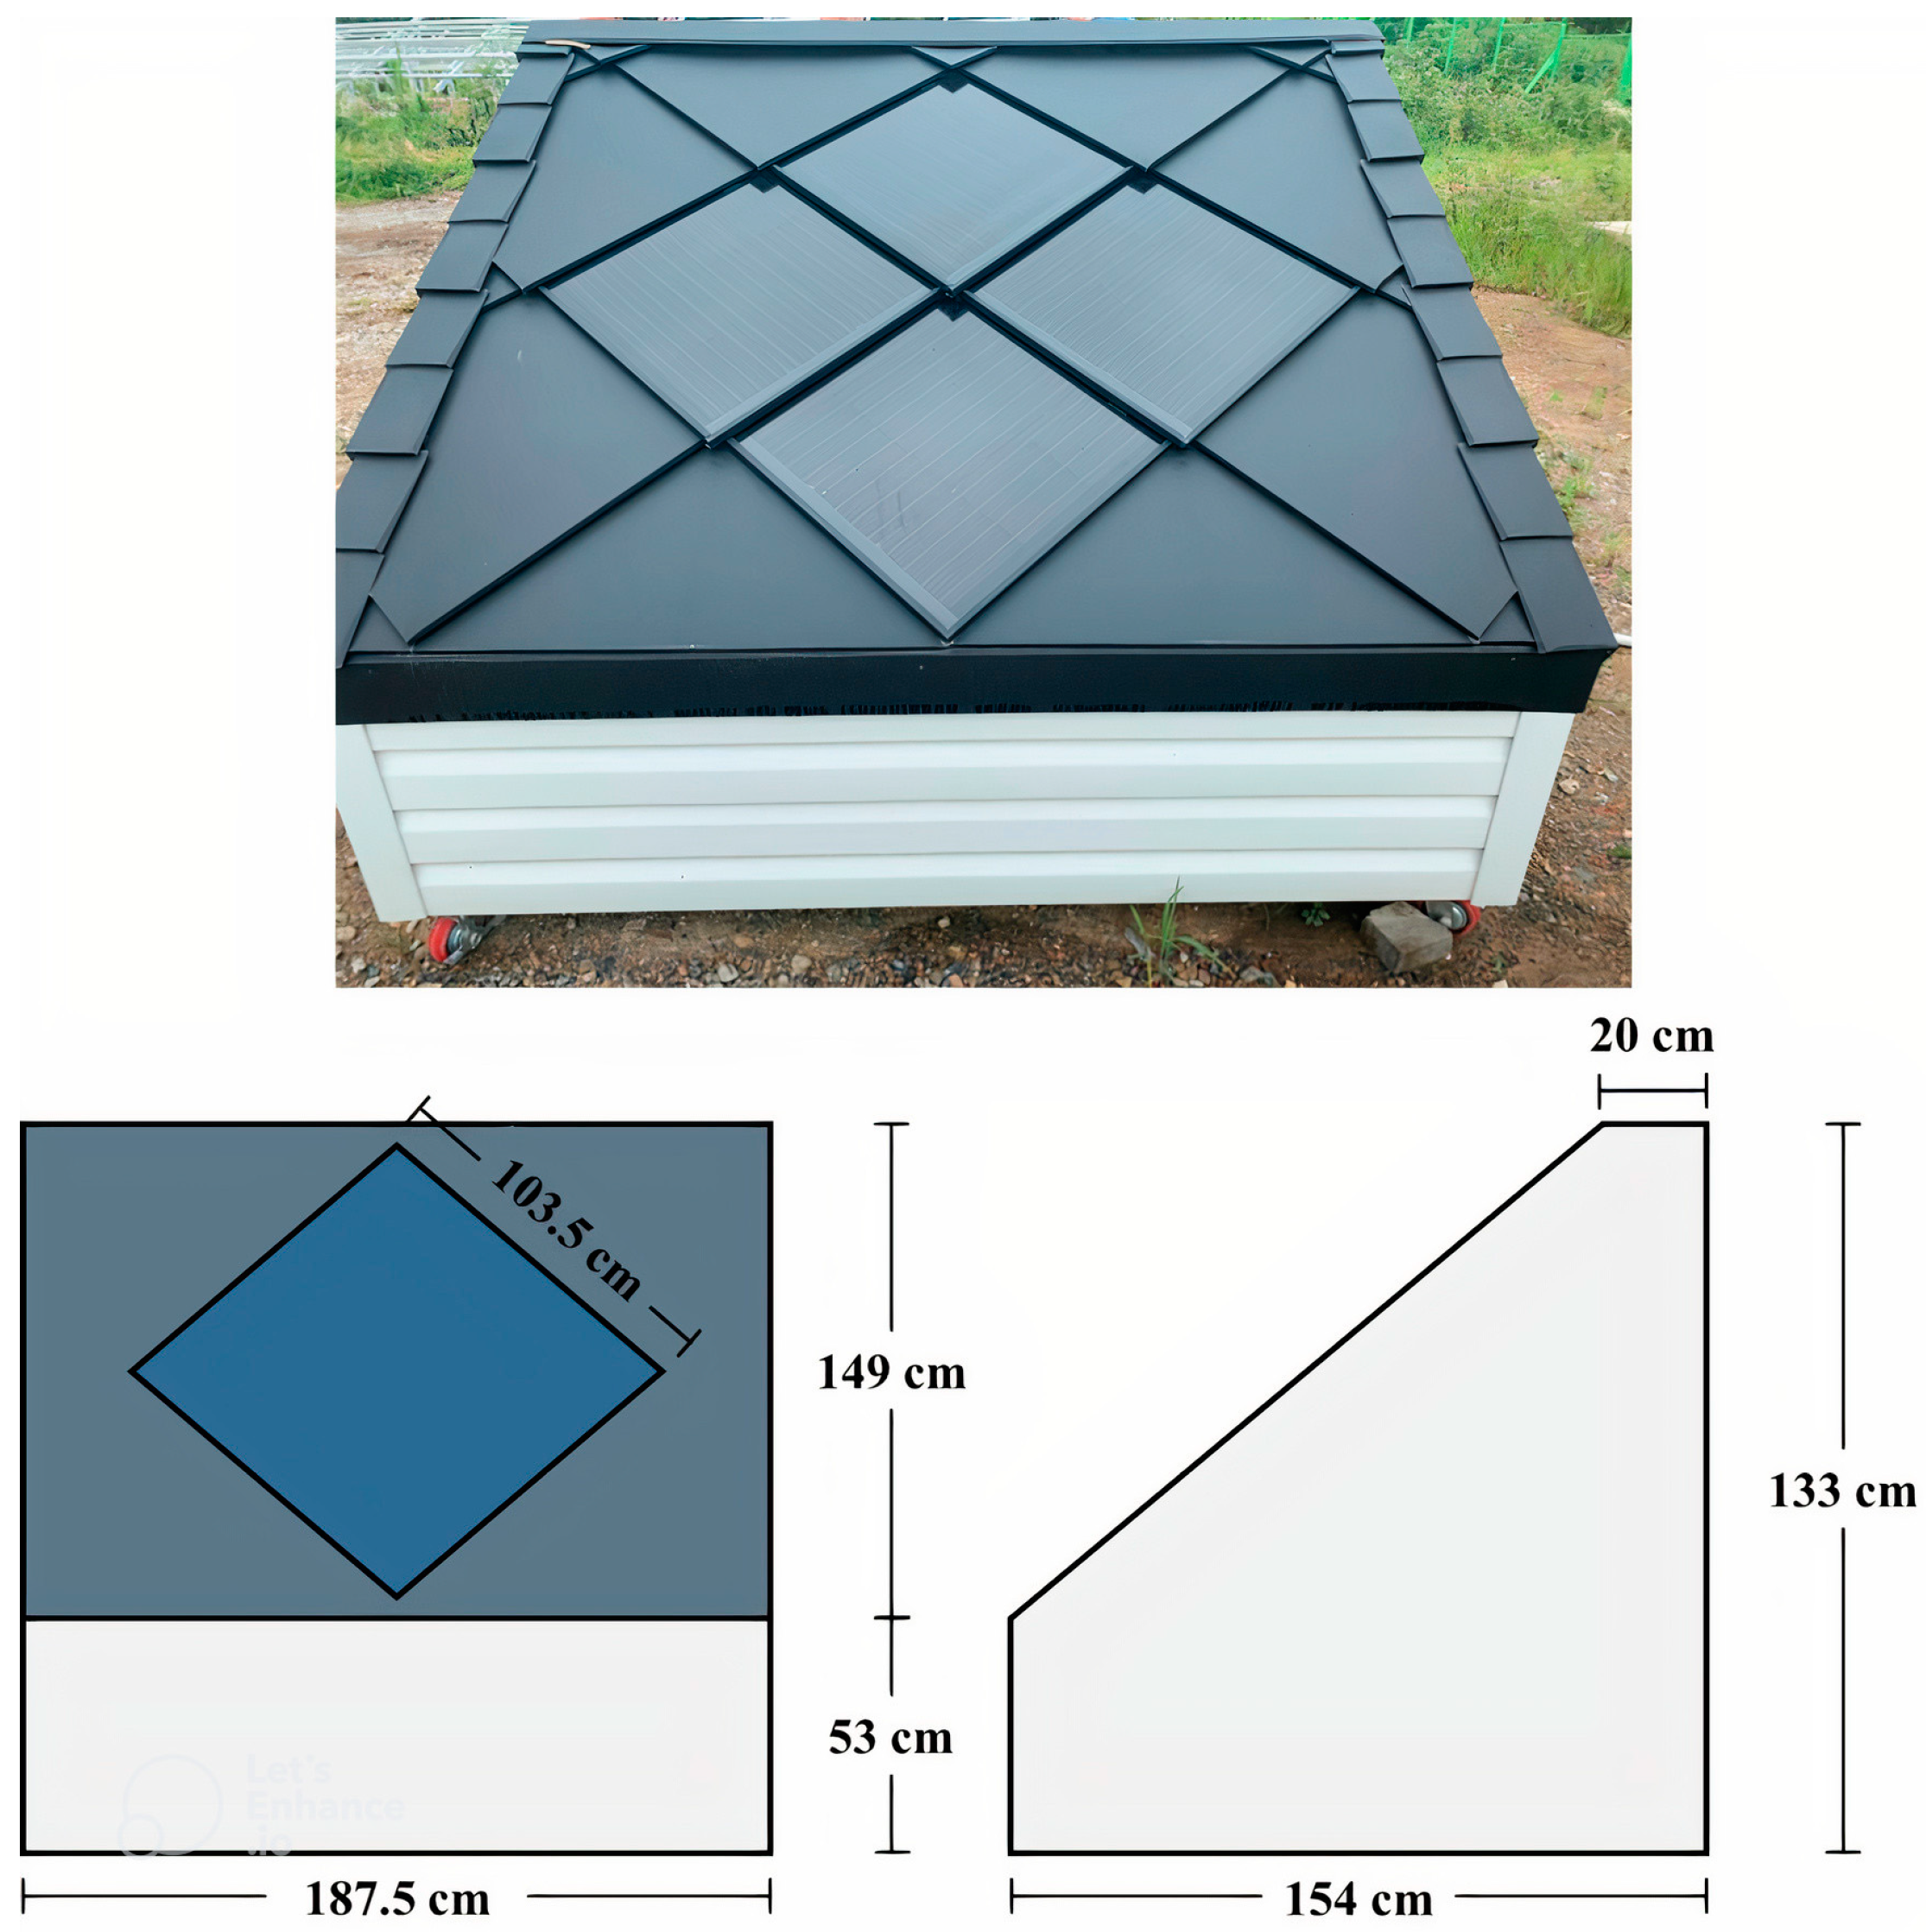
2. Materials and Methods

This study observed and analyzed a miniature house roof-integrated PV system. The utilized solar roofing system was manufactured by Roser (Gyeongsan, South Korea) (Figure 1). The system was a sloped, unventilated roofing system and was 187.5 cm in length, 154 cm in width, and 133 cm in height. Four PV modules with 536 × 536 mm2 dimensions were attached to the top of the roof. The modules were surrounded by more roof tiles to form the roof of the miniature house, covering a total area of 187.5 × 149.0 cm2. The system was installed in 2019 at the Yeungnam University Photovoltaic Power Systems R&BD Demonstration Complex, Gyeongsan, South Korea (location: 35.82° N, 128.76° E). The system was south-facing, had no obstructions in front of it resulting in shading, and was tilted by 35° to the ground. The PV modules were tested under standard conditions (STC), having a peak power of 40 W. Other parameters of the PV modules are outlined in Table 1.
Three parameters were monitored to assess the roof-integrated PV system’s performance: solar irradiance, power generation, and system temperature. Solar irradiance data, the primary source of electrical generation from PV modules, were obtained using a CMP6 first-class pyranometer (<5% daily uncertainty) installed near the BIPV system. The PV modules were connected to a programmable DC electronic load LODA LF 600C (accuracy ±0.05%) to monitor the power generation of the PV modules for the duration of the study. Three thermocouples were installed inside the roofing system at different locations to monitor changes in the system’s temperatures. The three types of temperature data collected were the module internal temperature (MI), module rear temperature (MR), and roof rear temperature (RR). The thermocouple measuring MI was placed between the PV modules and the thin roof layer beneath. MR and RR were measured to assess the conditions of the roof tiles with and without attached PV modules, respectively. The thermocouple measuring MR was placed behind the thin roof under the PV modules while the thermocouple measuring RR was fixed behind a roof tile with no attached PV modules. The locations of the thermocouples are shown in Figure 2. Solar irradiance, power generation, and system temperature data were subsequently averaged at a 30-s interval and stored in separate daily files by the monitoring system software Data Gather.
From the obtained solar irradiance data, monthly totals were created to elucidate the total irradiance during each month over the observation period. Monthly totals were created for the power generation data to elucidate the total power generation of the BIPV system during each month over the observation period. The power generation data were subsequently used to obtain the power yield as follows:
M o n t h l y   P o w e r   Y i e l d = T o t a l   p o w e r   p r o d u c t i o n   i n   o n e   m o n t h T o t a l   p o w e r   c a p a c i t y   o f   t h e   P V   s y s t e m
The monthly power yield was subsequently calculated using the total monthly solar irradiance to determine the system efficiency as follows:
S y s t e m   E f f i c i e n c y = M o n t h l y   P o w e r   Y i e l d T o t a l   M o n t h l y   S o l a r   I r r a d i a n c e × 100 %
System temperature data were analyzed based on monthly averaging throughout the study.

3. Results and Discussion

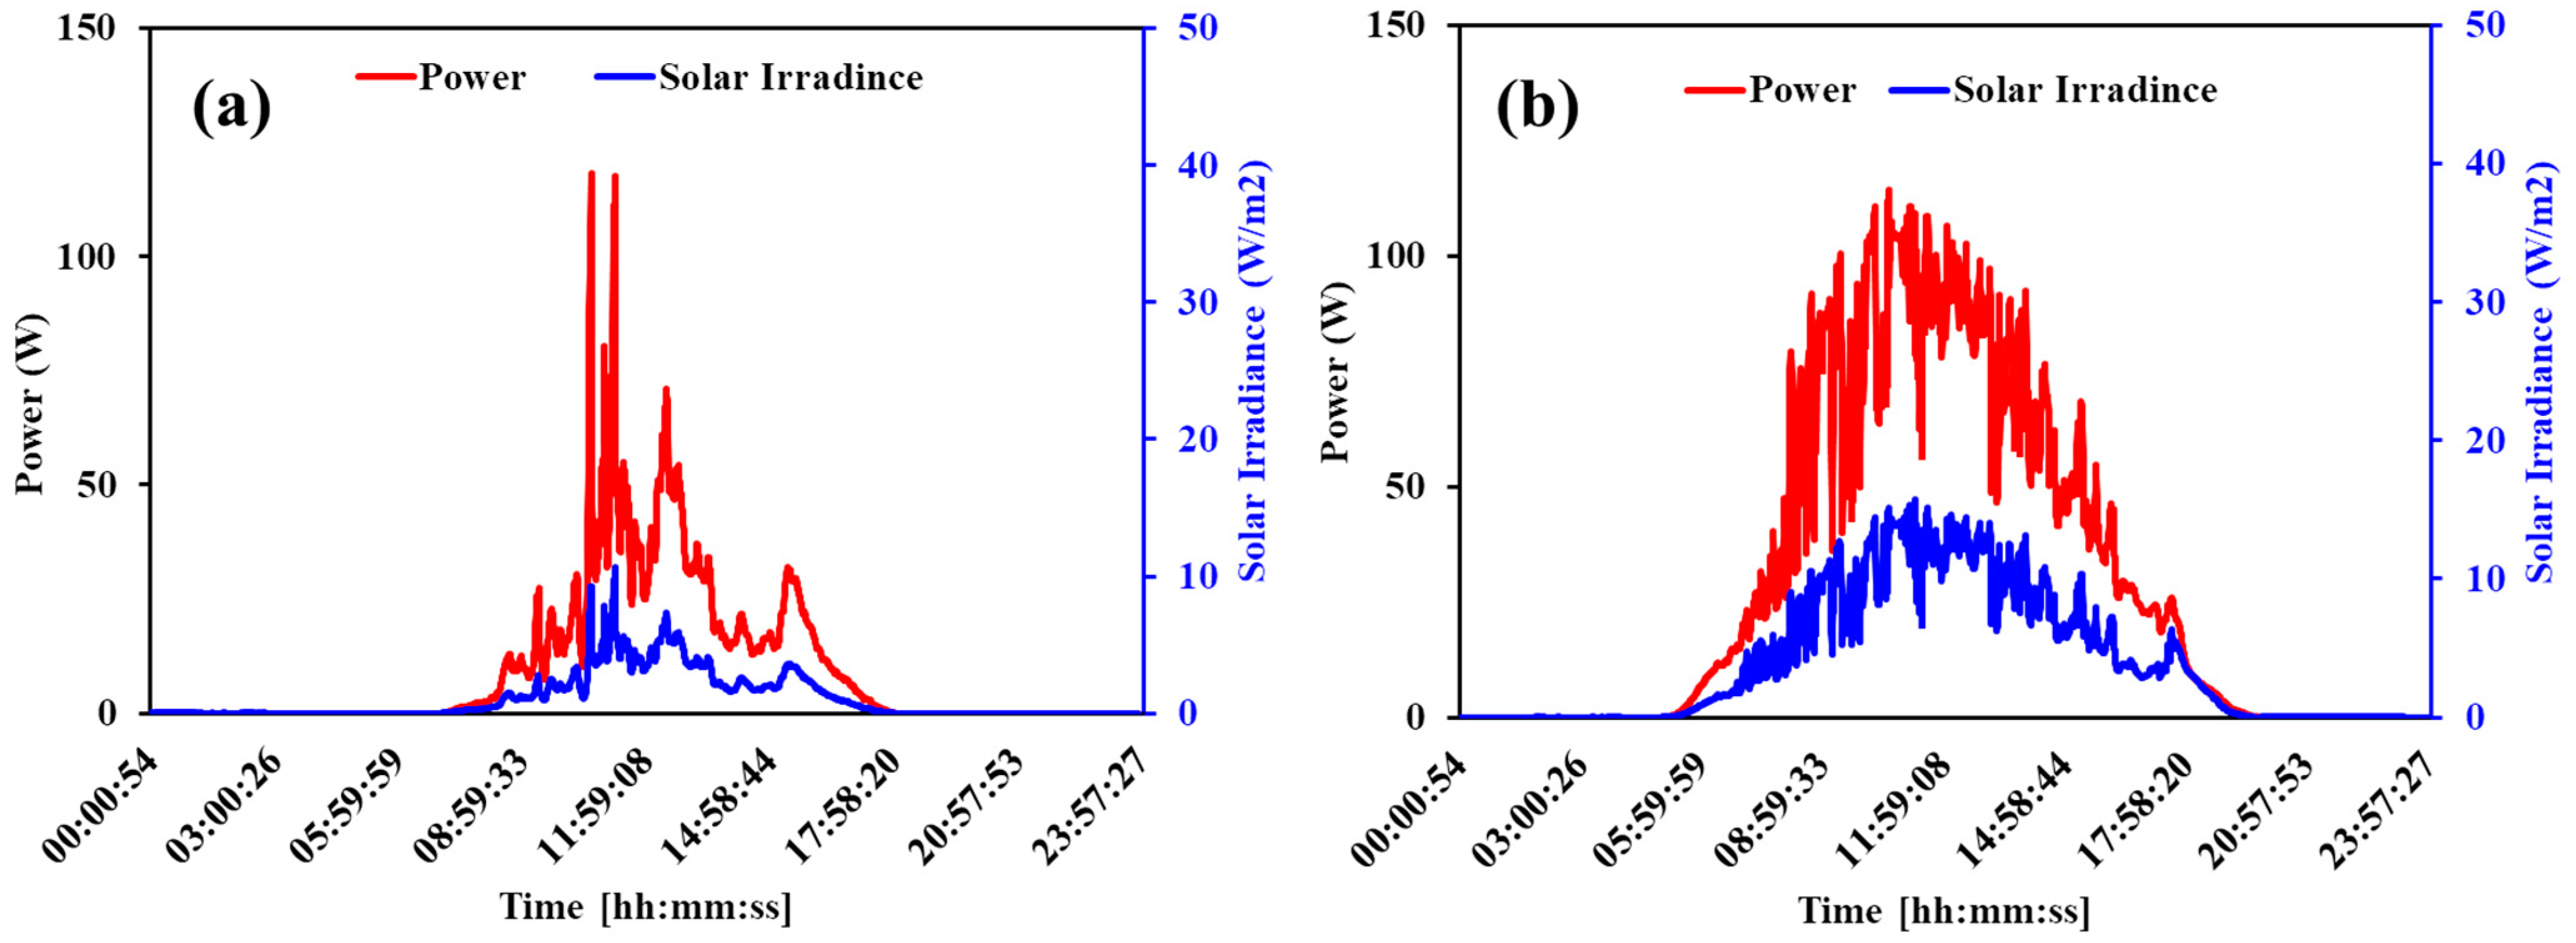
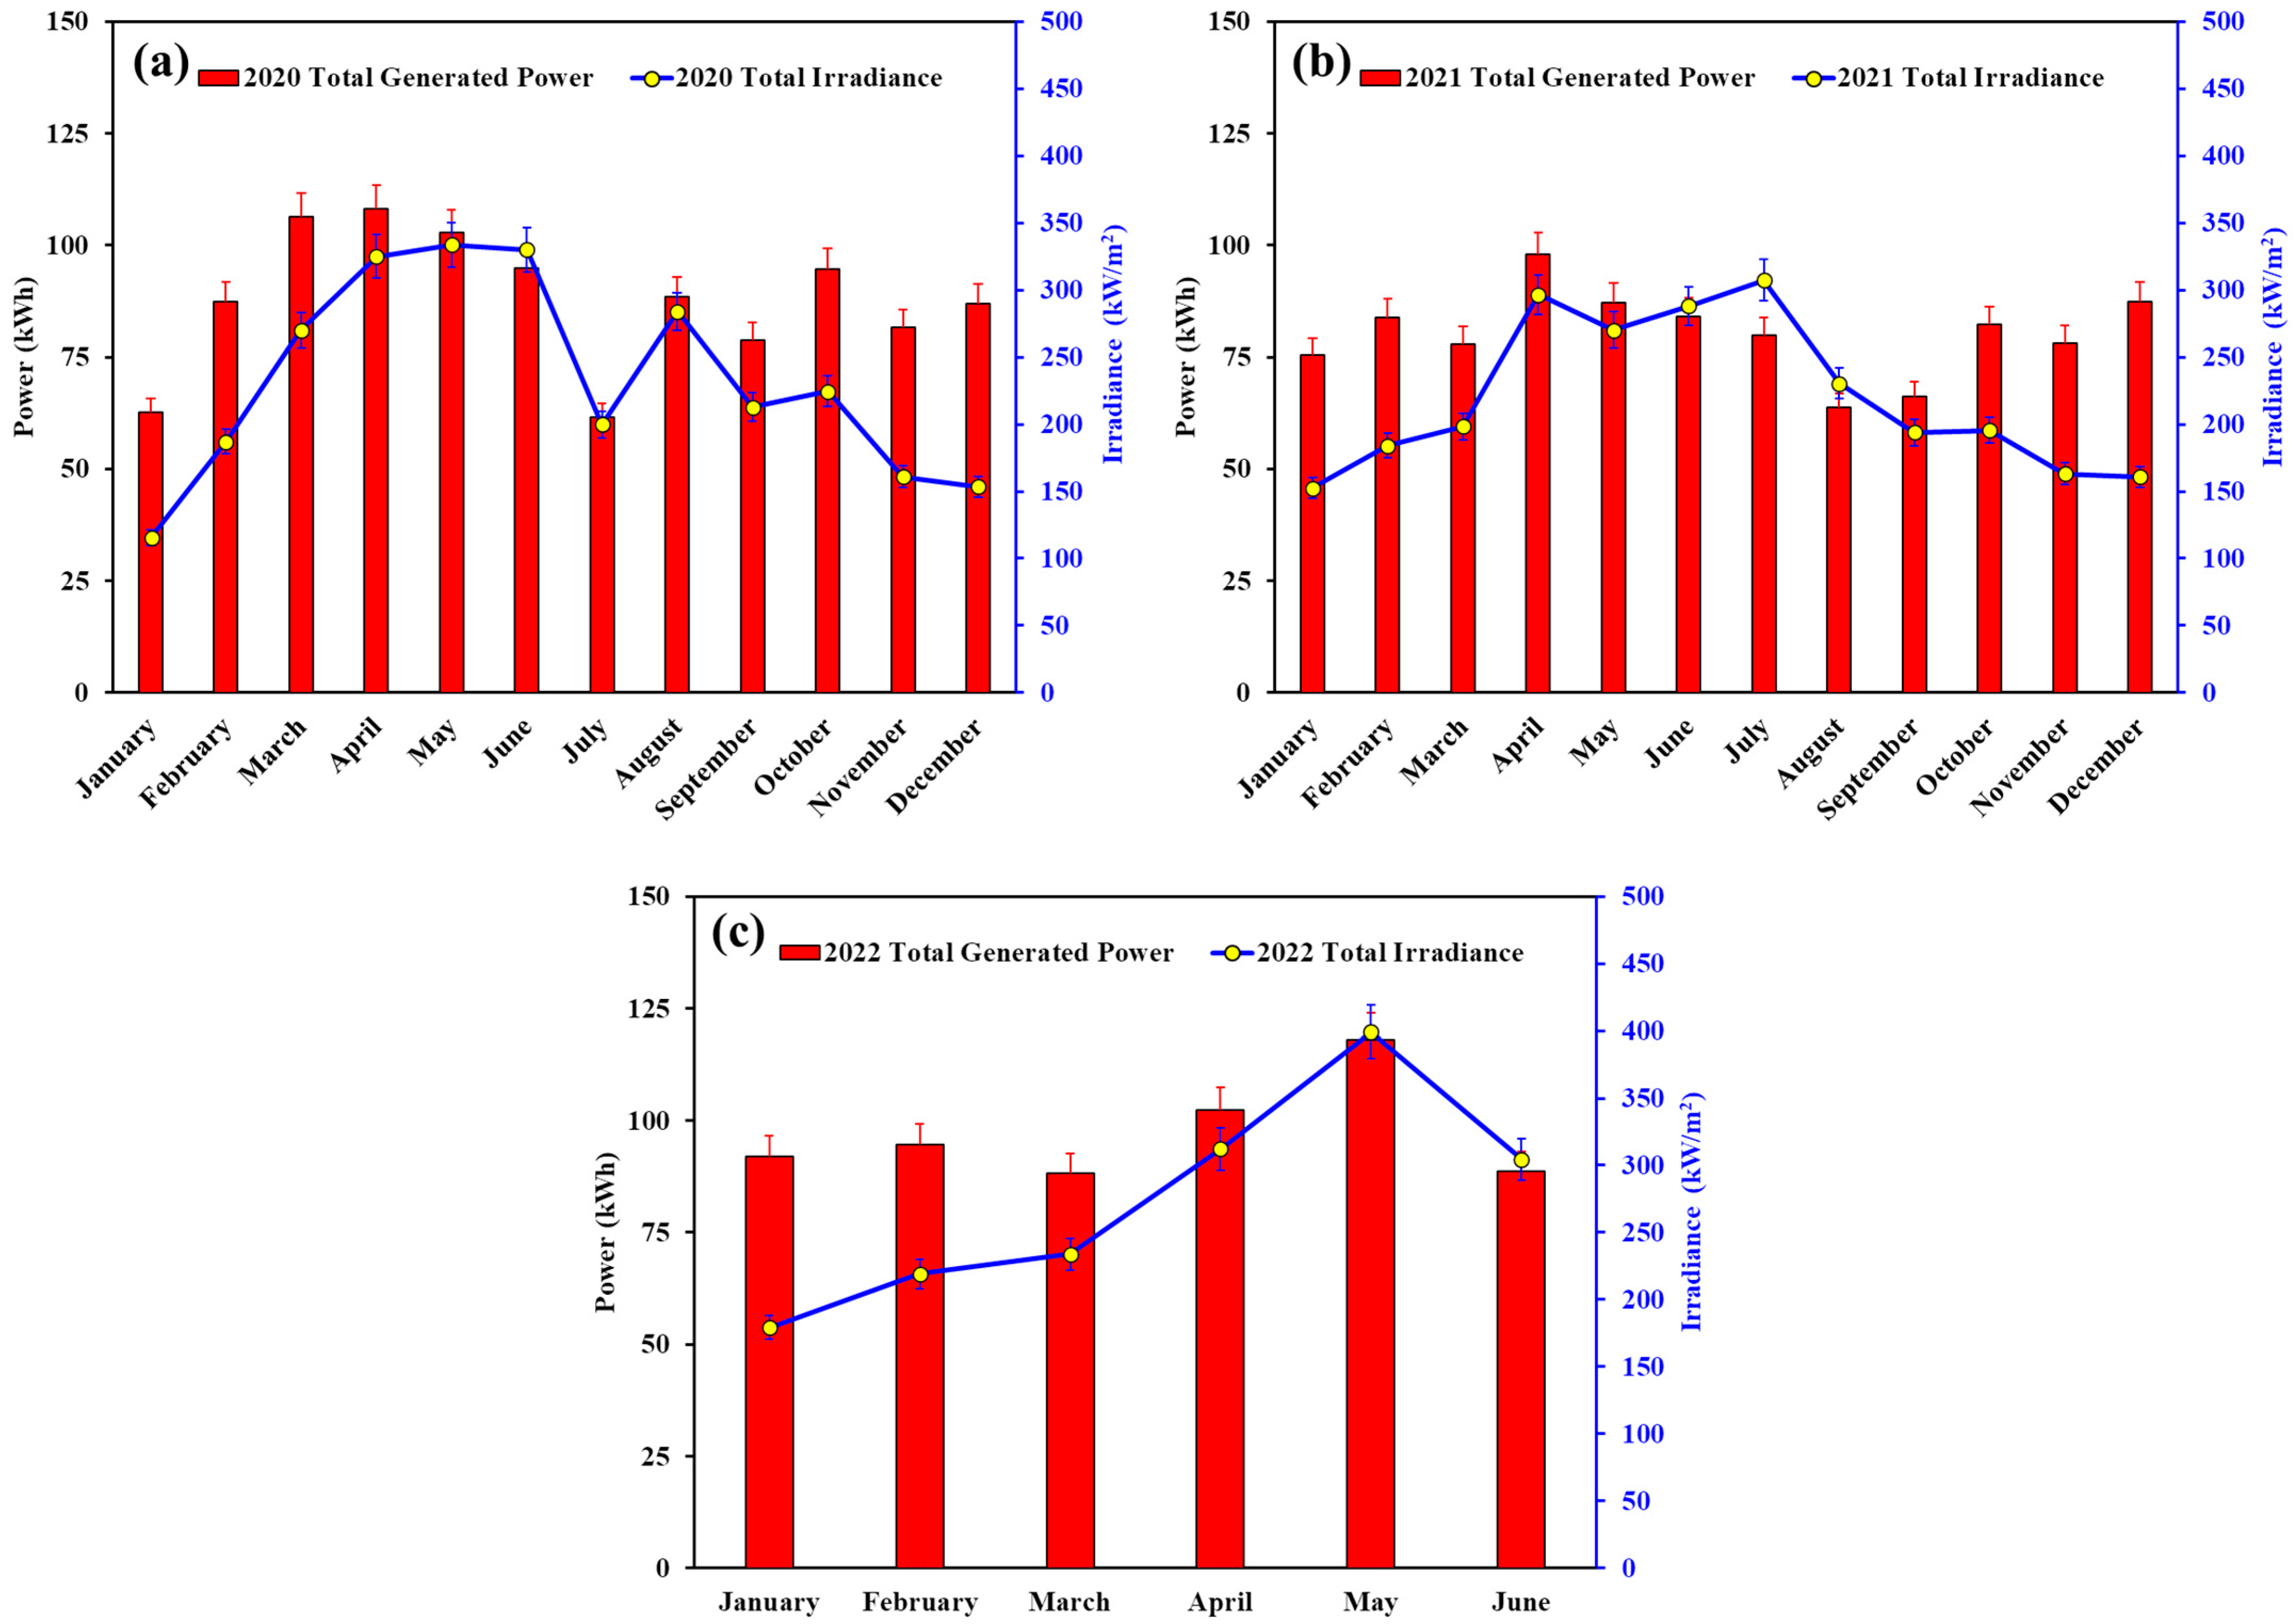
3.1. Power Generation Interdependence on Solar Irradiance

The power generation performance of the BIPV system and solar irradiance were examined for 2.5 years. To elucidate the diurnal cycles of the two parameters, Figure 3 represents two selected days, namely 14 February and 2 June 2021, with the graphs depicting the data on a minute basis. Power generation generally followed the solar irradiance trend, as PV modules use solar irradiance as their energy source to generate electricity. The different solar irradiance values between the two days are mainly due to seasonal differences. In South Korea, February is winter, and June is summer, characterized by different sun paths and, thus, different irradiance intensities [8]. The total generated power and solar irradiance for each month are shown in Figure 4, with more detailed data from 2020 until the middle of 2022 shown in Table 2. Power generation and solar irradiance exhibited similar trends, with fluctuations in solar irradiance being accompanied in most cases by proportional fluctuations in generated power. The detailed power generation and solar irradiance values in Table 2 reveal that the highest power generation occurred in the earlier part of each year, with the highest power generation being evident in April or May. Total solar irradiance exhibited a slightly shifted trend, with the highest solar irradiance observed in the months of May to July of each year except in 2020.
Solar irradiance variations throughout the year were attributed to changes in the solar position. The path of the sun is longer in spring and summer, resulting in longer days and higher total solar irradiance values [8]. The uncertain nature of the weather resulted in several cloudy and rainy days affecting the amount of solar irradiance throughout the observation period, with the relatively lower values in July 2020 and June 2022 being attributed to increased occurrences of such uncertain weather conditions. As solar irradiance is among the main influences on a PV system’s power output, the power generation data followed the fluctuations in solar irradiance input throughout the observation period, and this agrees with Tina et al., whose floating PV system produced power generation values proportional to the solar irradiance values during optimal PV system operation [8]. However, the highest generated power value was not produced during the solar irradiance peak, as observed in May 2020 and July 2021, and this was due to another factor, namely system temperature, influencing the power generation of the PV modules [7,8,14]. The effect of temperature on the BIPV system’s performance is discussed in the following section.

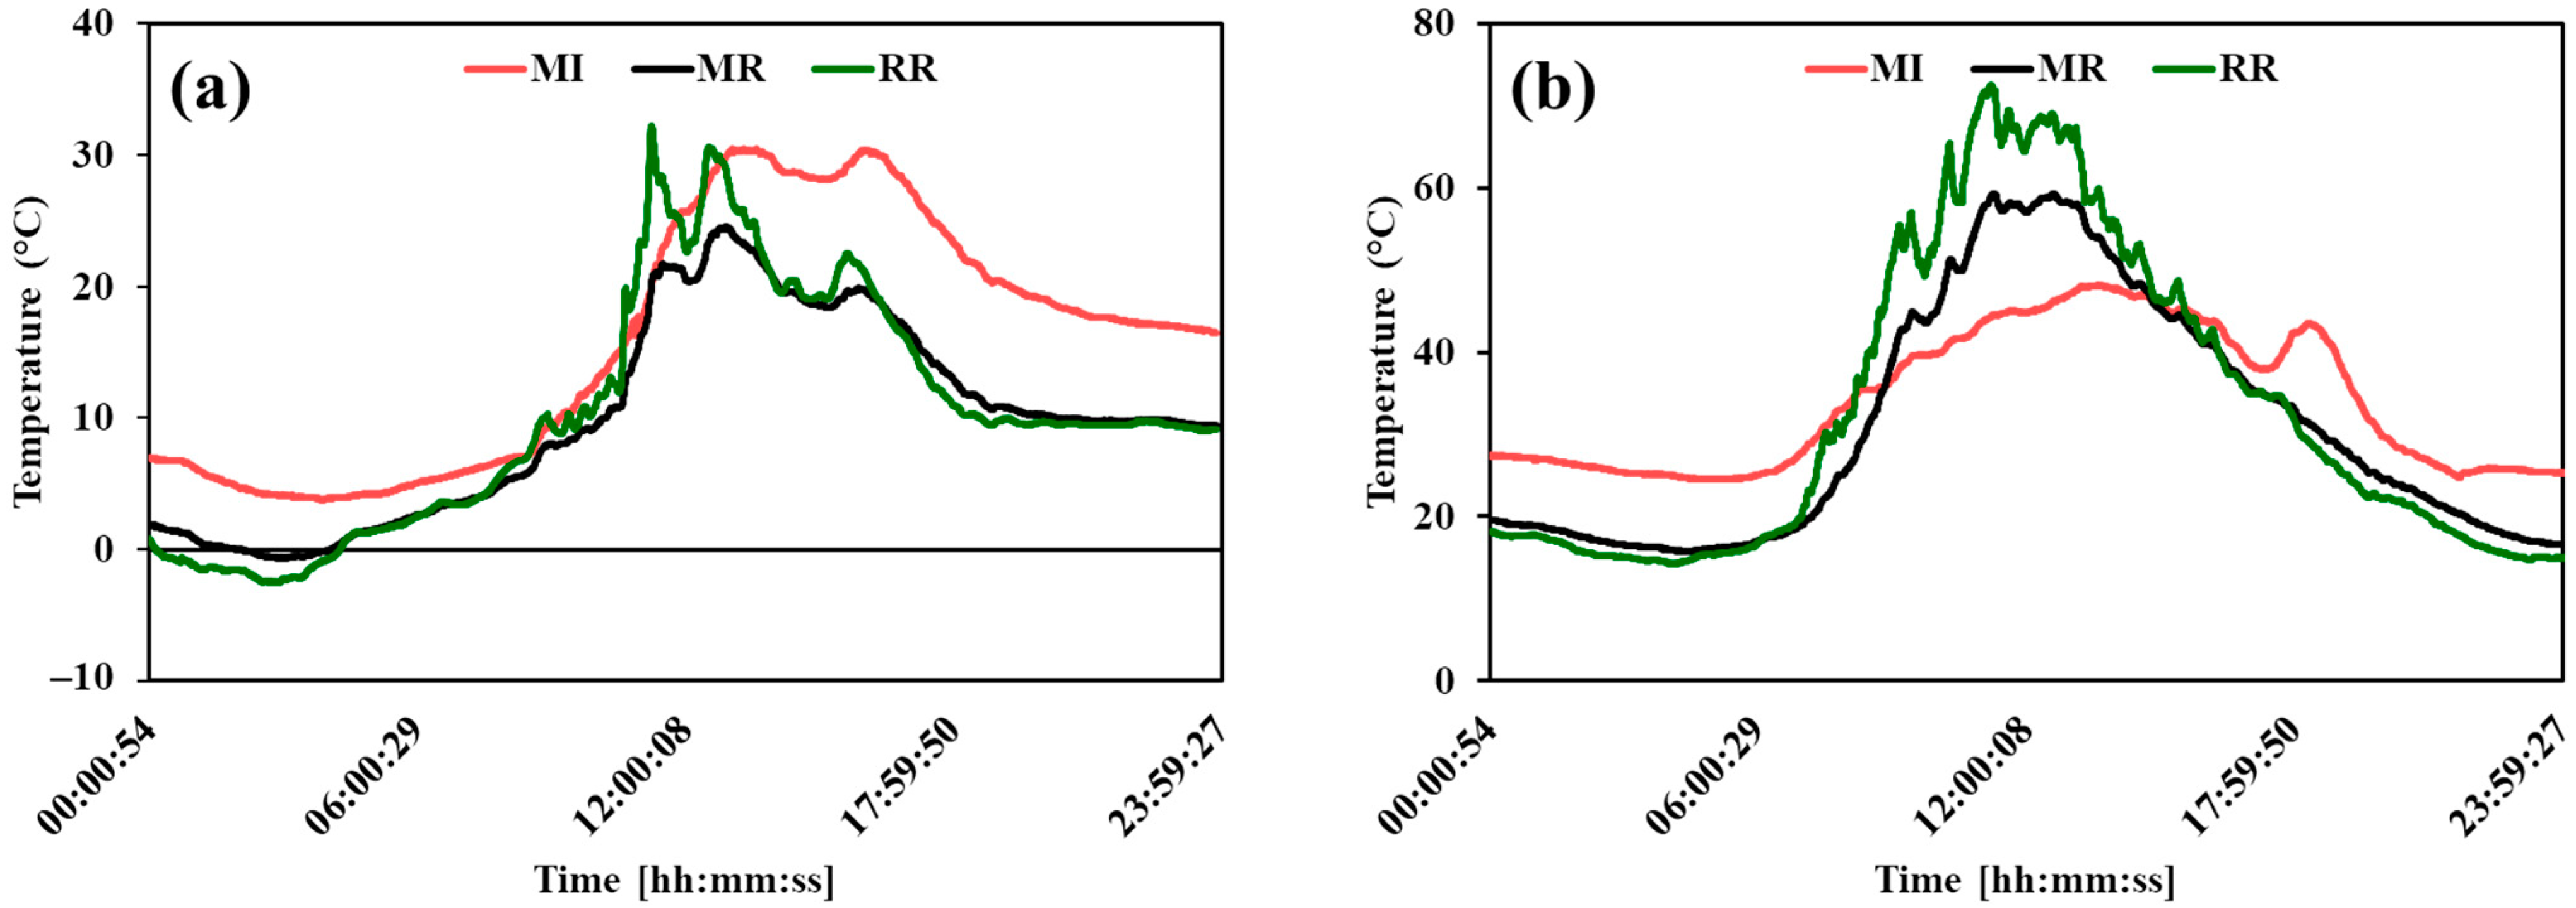
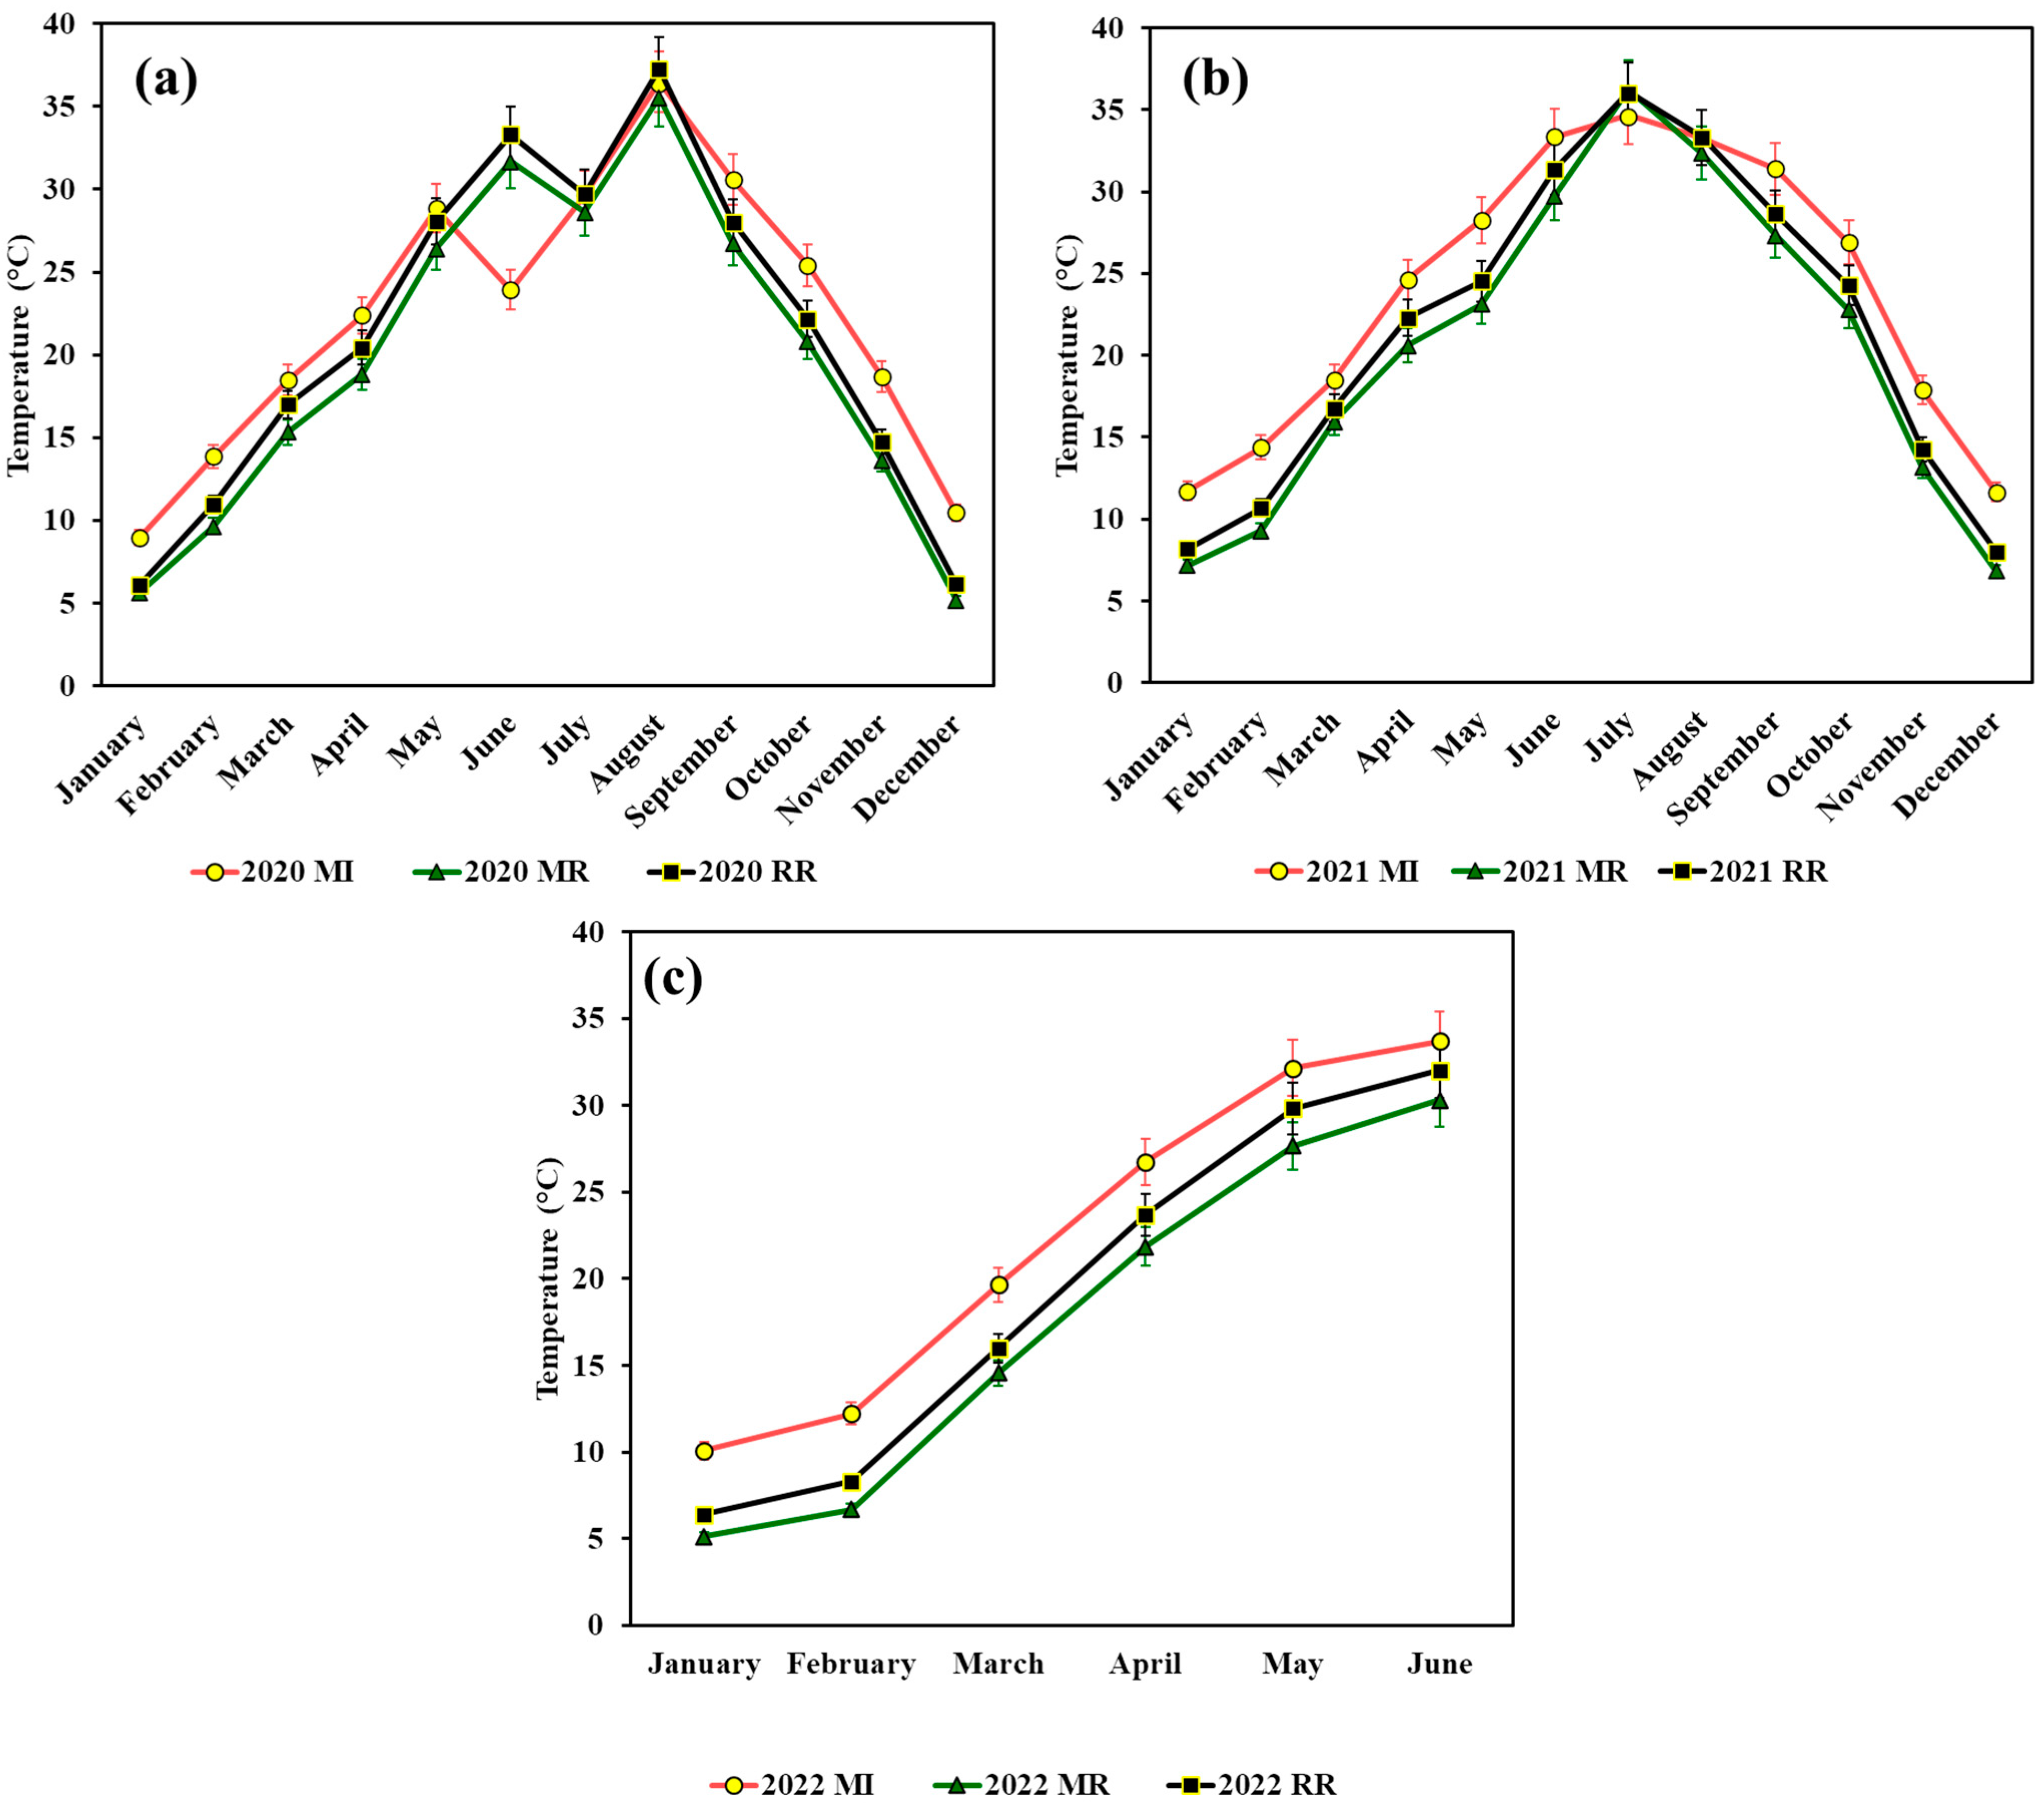
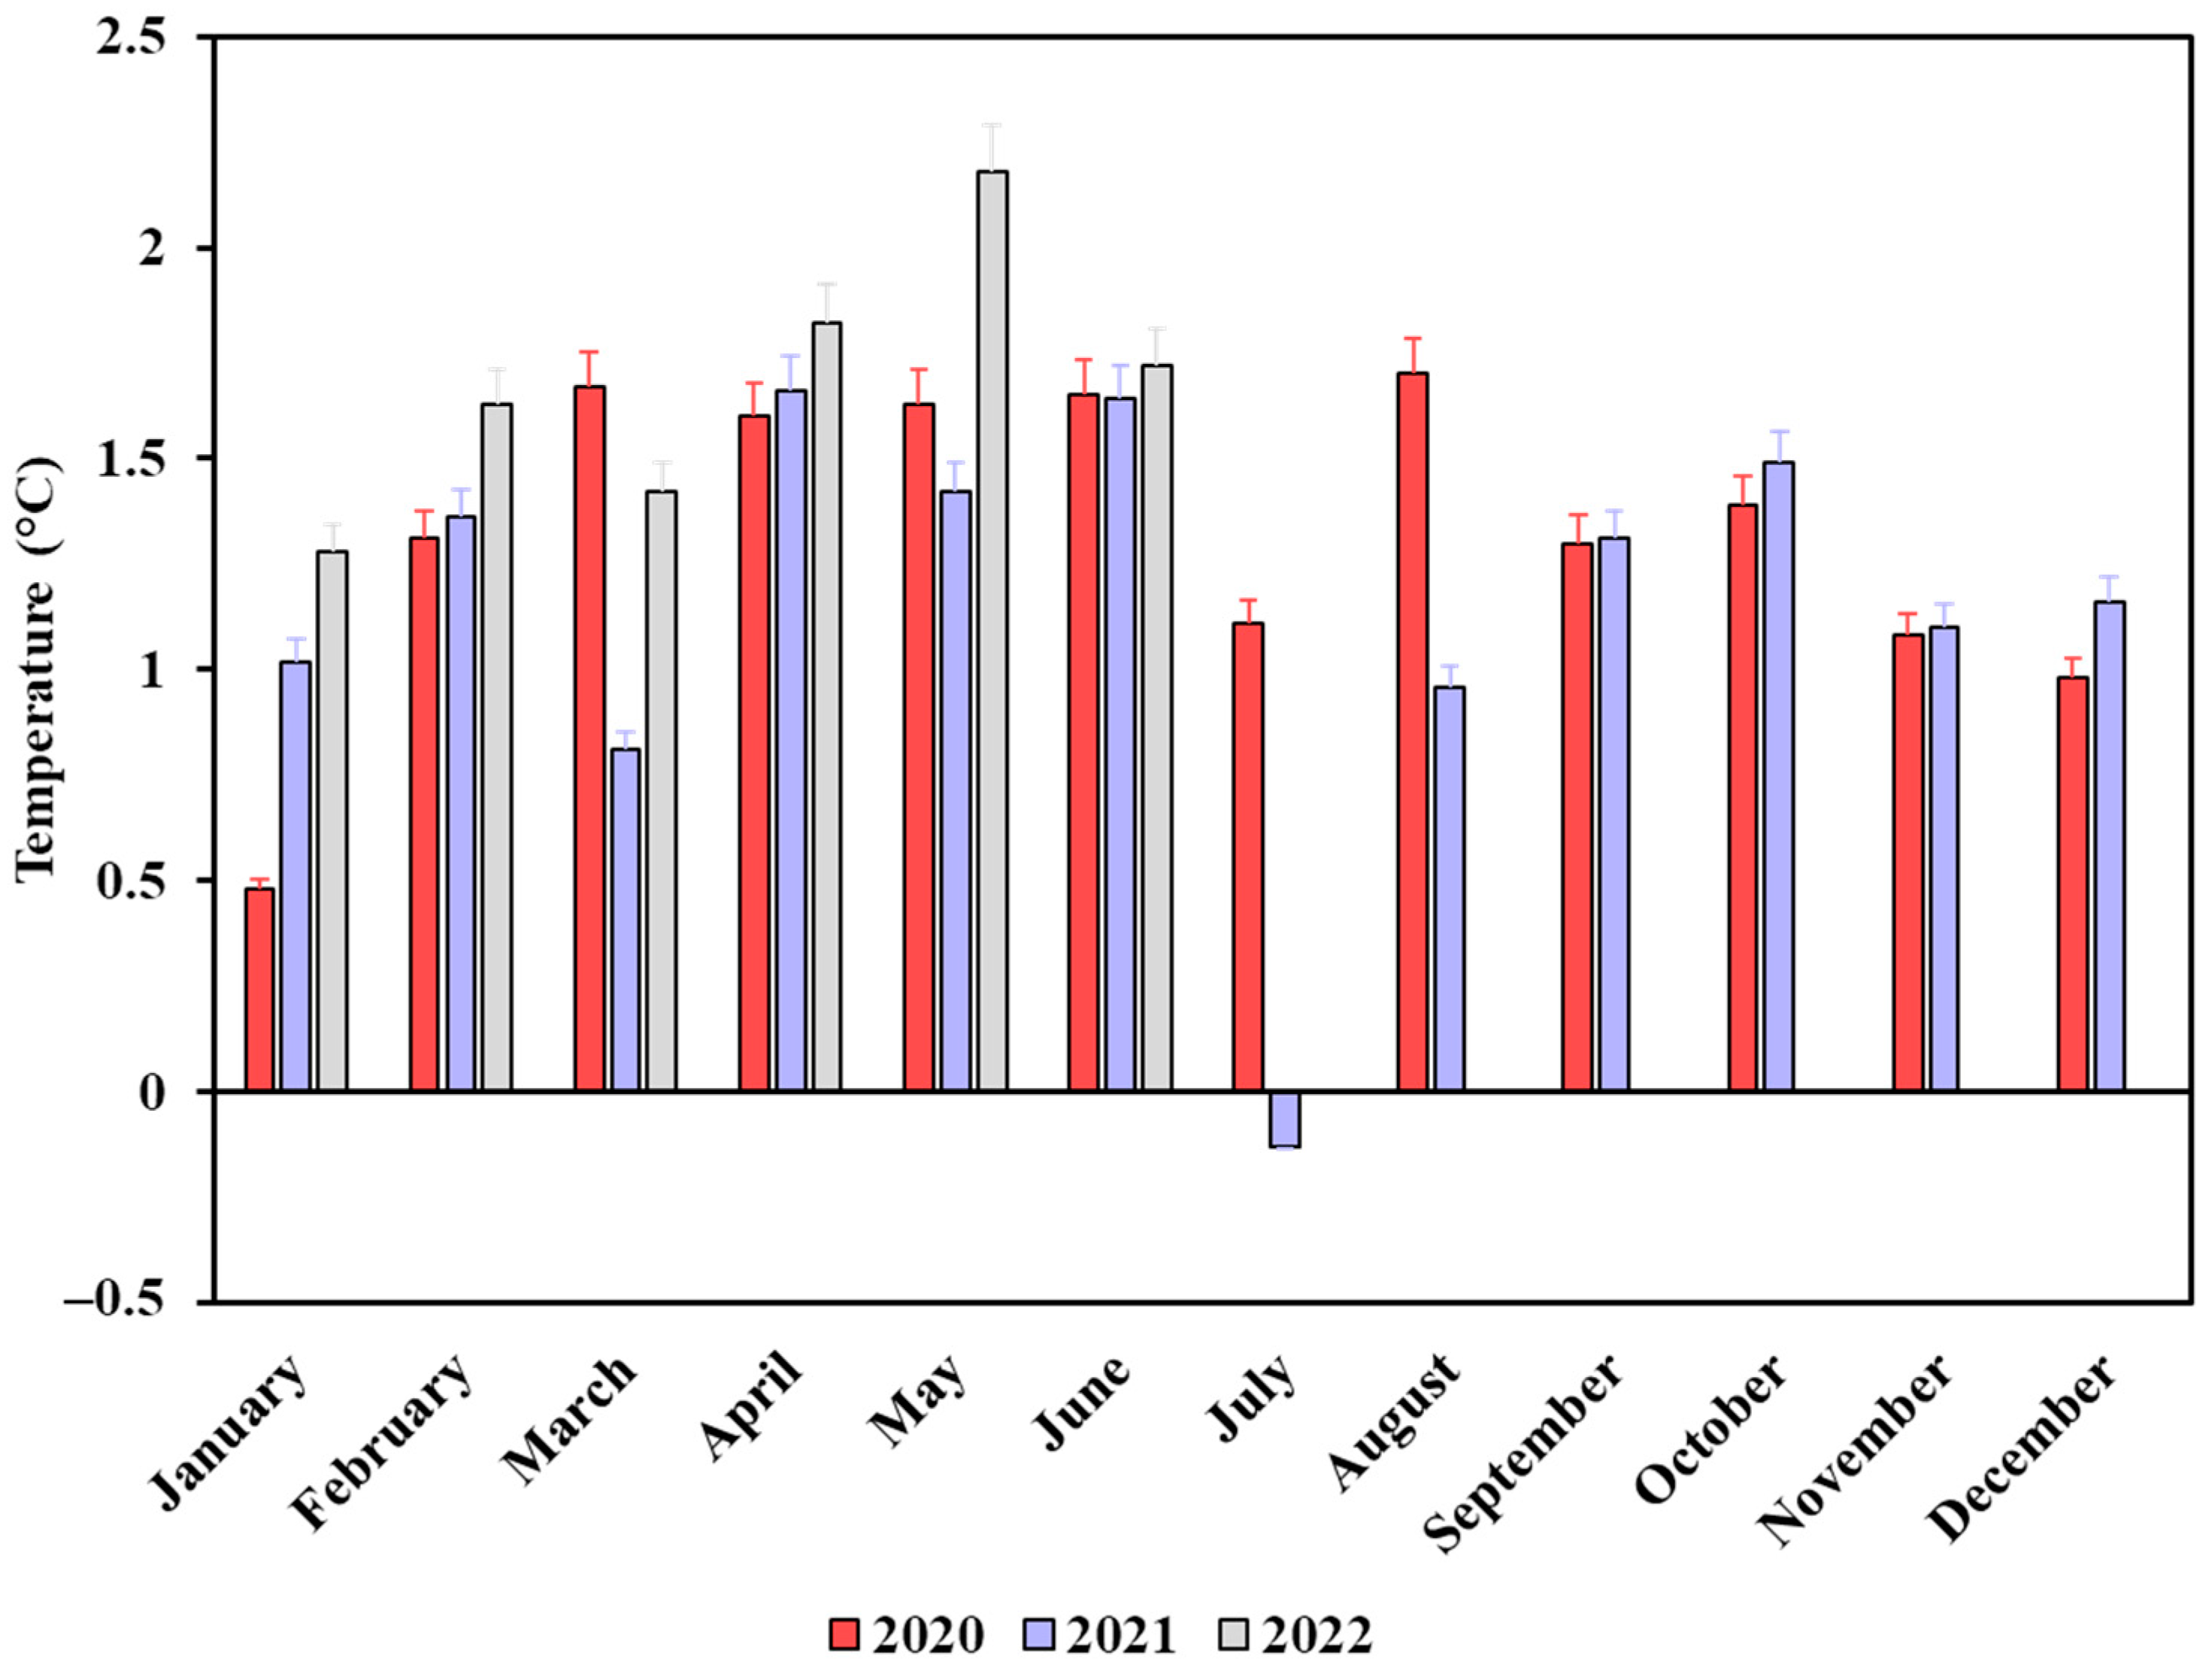
3.2. System Temperature

Three system temperatures were examined and processed to obtain the average system temperature data. Figure 5 shows the diurnal variations of the system temperatures on 14 February and 2 June 2021 based on a minute interval. All temperatures increase in the middle of the day and decrease towards the end of the day; however, the trend of MI is distinctly different from those of the two roof temperatures, MR and RR, with the latter trends being quite similar. The trend similarity was also reported by Saleh et al. [33] for the PV module temperature and Chung and Park [34] for the roof temperature. Similar to the case in Figure 3, the difference in temperature between the two days was due to seasonal differences, in South Korea, February is winter and June is summer. The analyzed data from 2020 until the middle of 2022 are represented in Figure 6 and the temperature data from 2020 to 2022 are summarized in Table 3. The trend shown in Figure 6 displays an increase from the start of the year until the middle of the year and a subsequent decline until the end of the year. The variation shown throughout the year is caused by seasonal changes, as South Korea experiences four seasons throughout the year. The increases in system temperatures were correlated with—and caused by—the seasonal changes from a cold winter to a warm spring to an even warmer summer. Subsequently, the system temperature dropped in autumn, and the lowest temperature occurred in winter, thereby completing the annual cycle.
The average value of MI was higher than MR and RR throughout the year, except in the middle of the year, from June to August, when those of RR matched its values. The higher MI compared to the other system temperatures was caused by the activity of the PV modules. The absorption of solar energy in the form of light and its conversion to electricity was conducted at the PV modules’ capacity, with the other form of solar energy, i.e., heat energy, being absorbed. Heat absorption was subsequently aggravated by the dark color of the PV modules, thereby increasing the heat absorption capacity of the PV modules [11,12]. A high MI value is characteristic of most BIPV systems, as roofing systems encapsulate them without enough air ventilation compared to the cases of conventionally installed PV modules and more traditional BAPV systems [11,12].
The MR values were always the lowest among the values of the three measured temperatures and were always approximately 1–2 °C lower than the RR values and 1–5 °C lower than the MI values. The annual differences between RR and MR are shown in Figure 7, where MR is almost always lower than RR throughout the 2.5-year observation period, except in July 2021. The small differences between MR and RR were likely due to the different roof tile configurations used in this system when the PV modules were installed on top of the tiles. The installation of PV modules on the roof tiles left a little gap which facilitated the heat transfer caused by more wind. In contrast, the original roof tiles retained more heat because the gap was nonexistent [35,36,37]. The finding implies that the PV system could be installed as the entire roofing system with this configuration without sacrificing the roof temperature.

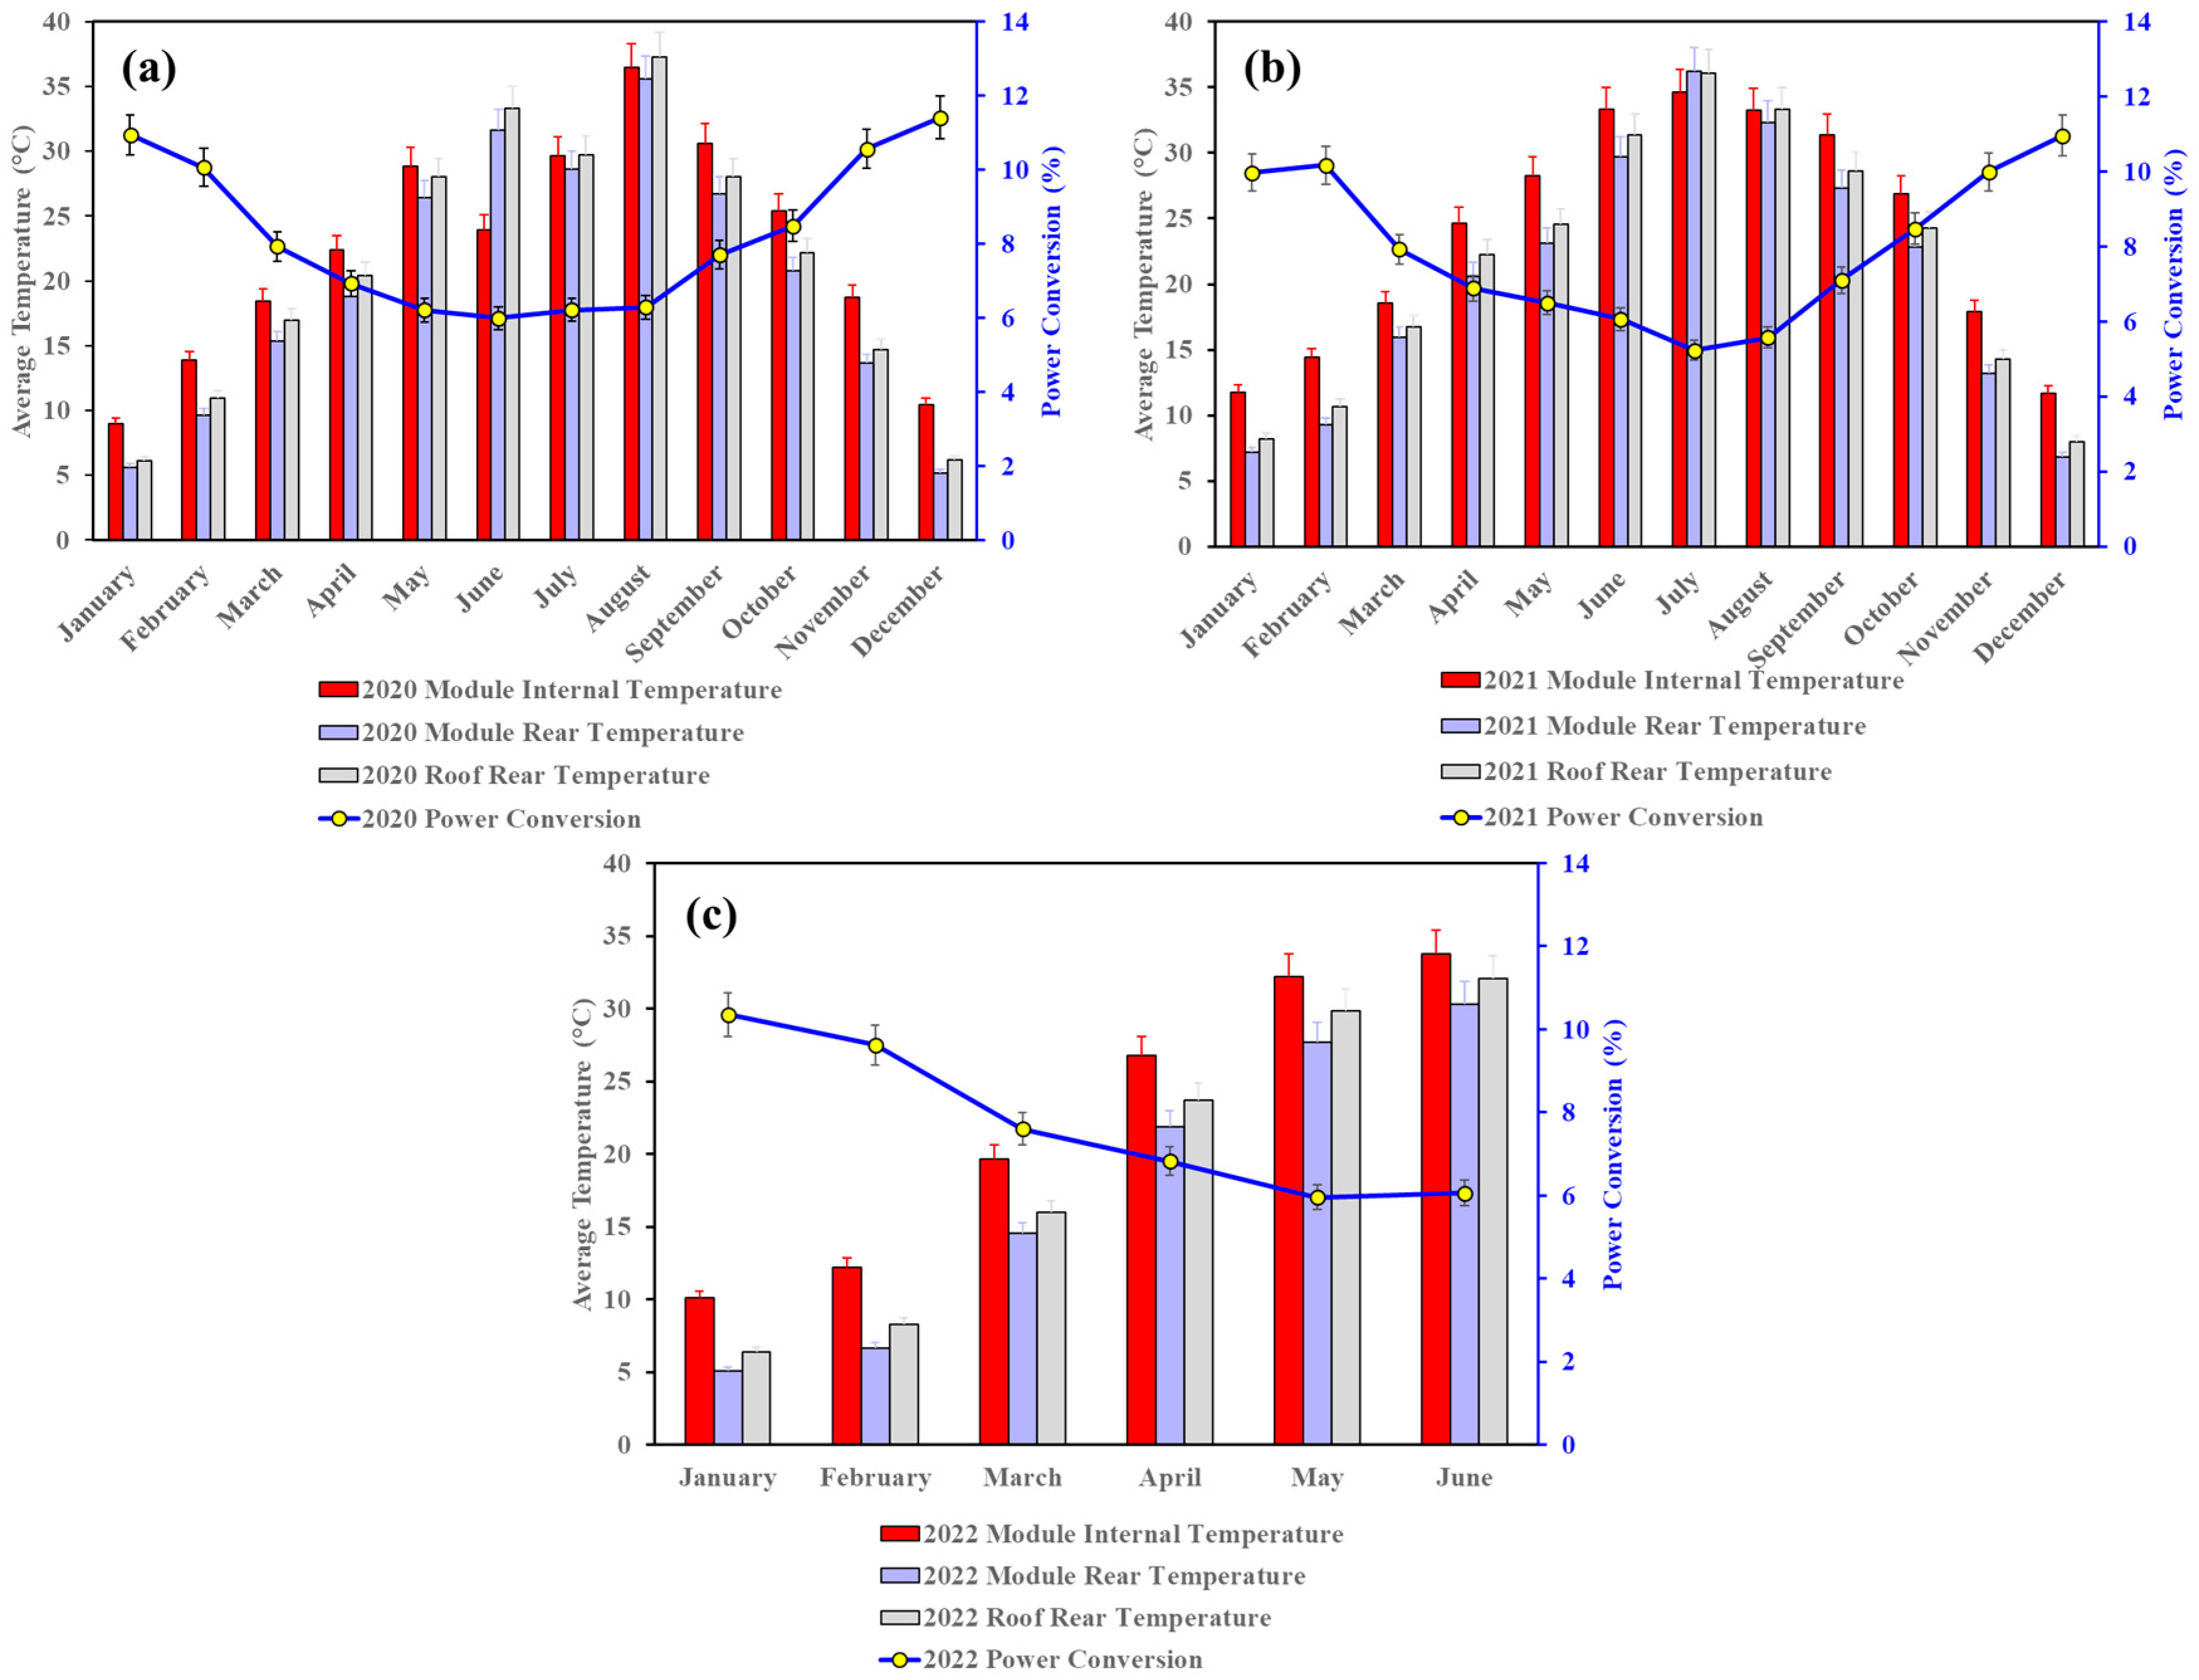
3.3. Effect of System Temperature on Power Conversion

To determine how the system temperature affects the power-generation efficiency of this BIPV system, monthly power conversion and system temperature were compared and analyzed, and tabulated in Table 4. Figure 8 shows that the trends of system temperature and power conversion are opposite to each other. The system temperature trends followed the seasonal changes in South Korea, i.e., the system temperature increased in spring and summer and decreased in autumn and winter. Conversely, power conversion decreased in spring and summer and increased in autumn and winter.
As mentioned previously, the system temperature is one of the factors affecting the power generation performance of a BIPV system [21,26,27,28,29,30,31,32,33,35,36,37]. In this BIPV roofing system, it was apparent that the system temperature affected the performance of the PV modules. The highest efficiency of 11.42% was achieved in December 2020, when the system temperature was the lowest. In contrast, the lowest efficiency of 5.24% occurred in July 2021, when the system temperature was 10 °C above the ambient temperature. This correlation shows how a system temperature increase negatively impacts the PV module efficiency, dropping to half its maximum value at the peak system temperature. A PV temperature increase leads to an increase in carrier concentration, thereby enhancing the rate of carrier recombination and leading to decreased open-current voltage (VOC), fill factor (FF), and thus performance [38].
Figure 9 shows that during the 2.5-year observation period, there was no significant decline in system performance regarding power conversion. The largest drop in power conversion was in July 2021, which decreased by ~1% compared to the previous year. Such a large decline in efficiency was not evident in the rest of the months when efficiency decreased on average only by 0.25% compared to the values in the previous years. These findings confirm that this particular BIPV system can maintain its performance with a negligible effect on efficiency over 2.5 years.

4. Conclusions

The long-term performance of a BIPV system of 160 Wp was evaluated using outdoor monitoring in South Korea for 2.5 years. This study revealed the intercorrelations between power generation, solar irradiance, and system temperature. While solar irradiance mainly affected power generation, system temperatures contributed to power generation fluctuations, following the seasonal changes from cold to warm and again to cold temperatures throughout the year. Results showed that half of the BIPV system’s performance was lost due to temperature fluctuations. Therefore, addressing this issue is crucial, particularly in hot regions. Factors such as wind direction, ventilation, and the type of PV technology could play important roles in achieving better economic value for the installed PV system. The temperature behind the PV modules was lower than that behind the roof tiles, implying that installing such a BIPV system will not increase the temperature of the roofing system. This finding suggests that the comfort of the room underneath the PV modules may be uncompromised by using this configuration in the climate of South Korea. Therefore, expanding the use of PV modules as an entire roofing system by using this configuration has great potential. This study proves that one of the generally associated temperature concerns—the roofing temperature—is not necessarily concerned with this BIPV system configuration.

Author Contributions

Conceptualization, W.K.K., M.H.A.A., S.A. and S.J.; Methodology, W.K.K., M.H.A.A., S.A. and S.J.; Data curation, M.H.A.A., S.A. and S.J.; Formal analysis, M.H.A.A., S.A. and S.J.; Resources, W.K.K., J.K. (Jitaek Kim) and J.K. (Jungtaek Kim); Funding acquisition, W.K.K.; Supervision, W.K.K.; Writing—original draft, M.H.A.A., S.A. and S.J.; Writing—review and editing, W.K.K. All authors have read and agreed to the published version of the manuscript.

Funding

This research was supported by the 2021 Yeungnam University Research Grant.

Institutional Review Board Statement

Not applicable.

Informed Consent Statement

Not applicable.

Data Availability Statement

Not applicable.

Conflicts of Interest

The authors declare no conflict of interest.

References

  1. International Energy Agency. World Energy Outlook 2022. Available online: https://www.iea.org/reports/world-energy-outlook-2022 (accessed on 7 February 2023).
  2. International Energy Agency. Global Energy Review: CO2 Emissions in 2021. Available online: https://www.iea.org/reports/global-energy-review-co2-emissions-in-2021-2 (accessed on 7 February 2023).
  3. Scully, J. PV Industry Production Hits 310GW of modules in 2022; What about 2023? Available online: https://www.pv-tech.org/pv-industry-production-hits-310gw-of-modules-in-2022-what-about-2023/ (accessed on 10 March 2023).
  4. Verband Deutscher Mashinen- und Anlagenbau. International Technology Roadmap for Photovoltaic (ITRPV). Available online: https://www.vdma.org/international-technology-roadmap-photovoltaic (accessed on 7 February 2023).
  5. Masson, G.; Bosch, E.; Kaizuka, I.; Jäger-Waldau, A.; Donoso, J. Snapshot of Global PV Markets 2022 Task 1 Strategic PV Analysis and Outreach PVPS. Available online: https://www.researchgate.net/publication/360562245_Snapshot_of_Global_PV_Markets_2022_Task_1_Strategic_PV_Analysis_and_Outreach_PVPS (accessed on 7 February 2023).
  6. Chudinzow, D.; Nagel, S.; Güsewell, J.; Eltrop, L. Vertical bifacial photovoltaics—A complementary technology for the European Electricity Supply? Appl. Energy 2020, 264, 114782. [Google Scholar] [CrossRef]
  7. Pascaris, A.S.; Schelly, C.; Pearce, J.M. A first investigation of agriculture sector perspectives on the opportunities and barriers for agrivoltaics. Agronomy 2020, 10, 1885. [Google Scholar] [CrossRef]
  8. Tina, G.M.; Bontempo-Scavo, F.; Merlo, L.; Bizzarri, F. Comparative analysis of monofacial and bifacial photovoltaic modules for Floating power plants. Appl. Energy 2021, 281, 116084. [Google Scholar] [CrossRef]
  9. Baumann, T.; Nussbaumer, H.; Klenk, M.; Dreisiebner, A.; Carigiet, F.; Baumgartner, F. Photovoltaic systems with vertically mounted bifacial PV modules in combination with green roofs. Sol. Energy 2019, 190, 139–146. [Google Scholar] [CrossRef]
  10. Corti, P.; Bonomo, P.; Frontini, F.; Mace, P.; Bosch, E. Building Integrated Photovoltaics: A Practical Handbook for Solar Buildings’ Stakeholders. Available online: https://solarchitecture.ch/wp-content/uploads/2020/11/201022_BIPV_web_V01.pdf (accessed on 7 February 2023).
  11. Eiffert, P.; Kiss, G.J. Building-Integrated Photovoltaics for Commercial and Institutional Structures: A Sourcebook for Architects and Engineers. Available online: https://www.nrel.gov/docs/fy00osti/25272.pdf (accessed on 7 February 2023).
  12. Roberts, S.; Guariento, N. Building Integrated Photovoltaics: A Handbook; Birkhauser: Basel, Switzerland, 2009; ISBN 9783034604864. [Google Scholar]
  13. James, T.; Goodrich, A.; Woodhouse, M.; Margolis, R.; Ong, S. Building-Integrated Photovoltaics (BIPV) in the Residential Sector: An Analysis of Installed Rooftop System Prices. Available online: https://www.nrel.gov/docs/fy12osti/53103.pdf (accessed on 7 February 2023).
  14. Kuhn, T.E.; Erban, C.; Heinrich, M.; Eisenlohr, J.; Ensslen, F.; Neuhaus, D.H. Review of Technological Design Options for Building Integrated Photovoltaics (BIPV). Energy Build. 2021, 231, 110381. [Google Scholar] [CrossRef]
  15. De L’epine, M.; Salel, D. National Survey Report of PV Power Applications in France 2021. Available online: https://iea-pvps.org/wp-content/uploads/2022/07/IEA-PVPS-NSR-France-EN-2021-v5.pdf (accessed on 9 March 2023).
  16. Yamazaki, M.; Ikki, O. National Survey Report of PV Power Applications in JAPAN 2021. Available online: https://iea-pvps.org/wp-content/uploads/2022/11/NSR_Japan_2021.pdf (accessed on 9 March 2023).
  17. Fang, L.; Honghua, X.; Yang, Y. National Survey Report of PV Power Applications in CHINA 2021. Available online: https://iea-pvps.org/wp-content/uploads/2022/11/PVPS-National-Survey-Report-China-2021.pdf (accessed on 9 March 2023).
  18. Park, C.; Yang, H.; Won, C. National Survey Report of PV Power Applications in Korea 201. Available online: https://iea-pvps.org/wp-content/uploads/2021/01/NSR_Korea_2019.pdf (accessed on 9 March 2023).
  19. Building-Integrated Photovoltaics Market Size Report, 2030. Available online: https://www.grandviewresearch.com/industry-analysis/building-integrated-photovoltaics-bipv-market (accessed on 10 March 2023).
  20. Huld, T.; Amillo, A. Estimating PV module performance over large geographical regions: The role of irradiance, air temperature, wind speed and solar spectrum. Energies 2015, 8, 5159–5181. [Google Scholar] [CrossRef] [Green Version]
  21. Kumar, N.M.; Sudhakar, K.; Samykano, M. Performance comparison of BAPV and BIPV systems with C-si, CIS and CdTe photovoltaic technologies under tropical weather conditions. Case Stud. Therm. Eng. 2019, 13, 100374. [Google Scholar] [CrossRef]
  22. Liu, Z.; Zhang, Y.; Yuan, X.; Liu, Y.; Xu, J.; Zhang, S.; He, B. A comprehensive study of feasibility and applicability of building integrated photovoltaic (BIPV) systems in regions with high solar irradiance. J. Clean. Prod. 2021, 307, 127240. [Google Scholar] [CrossRef]
  23. Jordan, D.C.; Deline, C.; Deceglie, M.; Silverman, T.J.; Luo, W. PV Degradation—Mounting & Temperature. In Proceedings of the IEEE 46th Photovoltaic Specialists Conference (PVSC46), Chicago, IL, USA, 16–21 June 2019. [Google Scholar] [CrossRef]
  24. Gok, A.; Ozkalay, E.; Friesen, G.; Frontini, F. The Influence of Operating Temperature on the Performance of BIPV Modules. IEEE J. Photovolt. 2020, 10, 1371–1378. [Google Scholar] [CrossRef]
  25. Kumar Singh, Y.; Dubey, S.; Pandey, K.; Sastry, O.S. Performance of HIT Module in Different Climatic Condition in India. Mater. Today Proc. 2019, 17, 321–328. [Google Scholar] [CrossRef]
  26. Skandalos, N.; Kapsalis, V.; Karamanis, D. The Effect of Local Climatic Conditions on the Building Integration of Photovoltaics. IOP Conf. Ser. Earth Environ. Sci. 2022, 1123, 012020. [Google Scholar] [CrossRef]
  27. Dabaghzadeh, N.; Eslami, M. Temperature distribution in a photovoltaic module at various mounting and wind conditions: A complete CFD modeling. J. Renew. Sustain. Energy 2019, 11, 053503. [Google Scholar] [CrossRef]
  28. Poulek, V.; Matuška, T.; Libra, M.; Kachalouski, E.; Sedláček, J. Influence of Increased Temperature on Energy Production of Roof Integrated PV Panels. Energy Build. 2018, 166, 418–425. [Google Scholar] [CrossRef]
  29. Kim, H.; Boafo, F.E.; Kim, J.; Kim, J. Investigating the effect of roof configurations on the performance of BIPV System. Energy Procedia 2015, 78, 1974–1979. [Google Scholar] [CrossRef] [Green Version]
  30. D’Orazio, M.; Di Perna, C.; Di Giuseppe, E. Performance Assessment of Different Roof Integrated Photovoltaic Modules under Mediterranean Climate. Energy Procedia 2013, 42, 183–192. [Google Scholar] [CrossRef] [Green Version]
  31. Kaplanis, S.; Kaplani, E.; Kaldellis, J.K. PV Temperature and Performance Prediction in Free-Standing, BIPV and BAPV Incorporating the Effect of Temperature and Inclination on the Heat Transfer Coefficients and the Impact of Wind, Efficiency and Ageing. Renew. Energy 2022, 181, 235–249. [Google Scholar] [CrossRef]
  32. Mittelman, G.; Alshare, A.; Davidson, J.H. A Model and Heat Transfer Correlation for Rooftop Integrated Photovoltaics with a Passive Air Cooling Channel. Solar Energy 2009, 83, 1150–1160. [Google Scholar] [CrossRef]
  33. Saleh, I.M.; Abufares, H.M.; Snousi, H.M. Three-Year Performance Evaluation of Single Junction Amorphous Solar Cells Grid-Connected Power Station in Libya. Conf. Pap. Eng. 2013, 2013, 950195. [Google Scholar] [CrossRef] [Green Version]
  34. Chung, M.H.; Park, J.C. An Experimental Study on the Thermal Performance of Phase-Change Material and Wood-Plastic Composites for Building Roofs. Energies 2017, 10, 195. [Google Scholar] [CrossRef] [Green Version]
  35. Karthikeyan, V.; Sirisamphanwong, C.; Sukchai, S.; Sahoo, S.K.; Wongwuttanasatian, T. Reducing PV module temperature with radiation based PV module incorporating composite phase change material. J. Energy Storage 2020, 29, 101346. [Google Scholar] [CrossRef]
  36. Hasan, A.; McCormack, S.; Huang, M.; Norton, B. Evaluation of Phase Change Materials for Thermal Regulation Enhancement of Building Integrated Photovoltaics. Sol. Energy 2010, 84, 1601–1612. [Google Scholar] [CrossRef] [Green Version]
  37. Wai, L.Z.; Yusoff, M.; Irwanto, M.; Razak, A.; Ibrahim, S.; Zhubir, N. Investigation of Solar Panel Performance Based on Different Wind Velocity Using ANSYS Software. Indones. J. Electr. Eng. Comput. Sci. 2016, 1, 456–463. [Google Scholar] [CrossRef]
  38. Amin, A.A.; Al-Maghrabi, M.A. The analysis of temperature effect for MC-si photovoltaic cells performance. Silicon 2017, 10, 1551–1555. [Google Scholar] [CrossRef]
Figure 1. Installed solar roofing system (PV module depicted as the blue square) and its dimensions.
Sustainability 15 09493 g001
Figure 2. Schematic diagram of the thermocouples (green dots) locations inside the roofing system.
Sustainability 15 09493 g002
Figure 3. Daily power and solar irradiance on (a) 14 February 2021 and (b) 2 June 2021.
Sustainability 15 09493 g003
Figure 4. Total generated power and solar irradiance in (a) 2020, (b) 2021, and (c) 2022.
Sustainability 15 09493 g004
Figure 5. Diurnal variations of the system temperatures on (a) 14 February and (b) 2 June 2021.
Sustainability 15 09493 g005
Figure 6. Average system temperature in (a) 2021, (b) 2021, and (c) 2022.
Sustainability 15 09493 g006
Figure 7. Monthly differences between the roof rear temperature (RR) and module rear temperature (MR) throughout the observation period.
Sustainability 15 09493 g007
Figure 8. Power conversion and system temperature in (a) 2020, (b) 2021, and (c) 2022.
Sustainability 15 09493 g008
Figure 9. Comparison of monthly power conversion from January 2020 to June 2022.
Sustainability 15 09493 g009
Table 1. Studied solar module label specifications.
PV ParametersValue
Peak Power (Pm)(W)40
Open-Circuit Voltage (VOC)(V)5.75
Short-Circuit Current (ISC)(A)8.96
Maximum Voltage (Vm)(V)4.76
Maximum Current (Im)(A)8.42
Table 2. Total average generated power and solar irradiance from January 2020 to June 2022.
MonthTotal Power Generated
(kWh)
Total Solar Irradiance
(kW/m2)
202020212022202020212022
January59.6075.4792.07115.36152.49179.26
February87.4383.8094.55187.13183.87219.12
March106.2777.9488.33270.03198.21234.04
April108.1198.02102.35324.94296.54312.20
May102.7987.19118.06333.76270.32399.13
June94.9484.0088.61330.04288.26304.50
July61.5379.84-199.68307.39-
August88.5363.71-283.95230.40-
September78.7766.17-212.90193.92-
October94.5982.26-224.66195.57-
November81.6578.22-160.98163.03-
December86.9987.39-153.60160.73-
Table 3. Average system temperature from January 2020 to June 2022.
Month202020212022
MI
(°C)
MR
(°C)
RR
(°C)
MI
(°C)
MR
(°C)
RR
(°C)
MI
(°C)
MR
(°C)
RR
(°C)
January8.965.616.0911.737.178.1910.095.116.39
February13.889.6510.9614.399.3110.6712.236.688.31
March18.4715.3216.9918.5215.9616.7719.6614.5715.99
April22.3818.8320.4324.6220.6122.2726.7721.8723.69
May28.8626.4328.0628.2723.1124.5332.1827.6729.85
June32.9231.6733.3233.3529.7431.3833.7430.3232.04
July29.6628.6129.7234.6536.2136.08---
August36.4935.5937.2933.2932.3533.31---
September30.5926.7128.0131.3927.3428.65---
October25.4320.7822.1726.8922.7924.28---
November18.7113.6514.7317.8913.1614.26---
December10.465.186.1611.656.858.01---
Table 4. Power conversion from January 2020 to June 2022.
MonthPower Conversion (%)
202020212022
January10.429.9810.35
February10.0710.179.63
March7.937.937.61
April6.936.896.83
May6.216.505.96
June5.996.076.06
July6.215.24
August6.295.57
September7.717.11
October8.498.48
November10.579.99
December11.4210.96
Disclaimer/Publisher’s Note: The statements, opinions and data contained in all publications are solely those of the individual author(s) and contributor(s) and not of MDPI and/or the editor(s). MDPI and/or the editor(s) disclaim responsibility for any injury to people or property resulting from any ideas, methods, instructions or products referred to in the content.

