Article

The Infrared Radiation Characteristics of Sandstone Fracture Seepage under Coupled Stress-Hydro Effect

1
School of Art, Anhui University of Finance and Economics, Bengbu 233030, China
2
State Key Laboratory for Geomechanics & Deep Underground Engineering, China University of Mining and Technology, Xuzhou 221116, China
3
School of Public Finance and Taxation, Zhongnan University of Economics and Law, Wuhan 430073, China
4
Department of Mining Engineering, Pak-Austria Fachhochschule Institute of Applied Sciences and Technology, Haripur 22620, Pakistan
5
Department of Civil and Environmental Engineering, Hanyang University, 222 Wangsimni-ro, Seongdong-gu, Seoul 04763, Republic of Korea
6
Department of Sustainable Advanced Geomechanical Engineering, Military College of Engineering, National University of Sciences and Technology, Risalpur 23200, Pakistan
7
Key Laboratory of Deep Coal Resource Mining, China University of Mining and Technology, Ministry of Education, Xuzhou 221116, China
8
Zijin Mining Group Co., Ltd., Longyan 364200, China
9
Zijin (Changsha) Engineering Technology Co., Ltd., Changsha 410114, China
10
Beijing Window Technology Co., Ltd., Beijing 100089, China
11
Luoyang Kunyu Mining Co., Ltd., Luoyang 471700, China
12
Department of Geology and Geophysics, College of Science, King Saud University, P.O. Box 2455, Riyadh 11451, Saudi Arabia
*
Author to whom correspondence should be addressed.
Sustainability 2022, 14(24), 16454; https://doi.org/10.3390/su142416454
Submission received: 22 November 2022 / Revised: 3 December 2022 / Accepted: 5 December 2022 / Published: 8 December 2022
(This article belongs to the Special Issue Advances in Rock Mechanics and Geotechnical Engineering)

Abstract

:
Effective monitoring of rock fracture and seepage is an important information means to ensure the safety of geotechnical engineering. Therefore, sandstone samples were subject to uniaxial compression under different hydraulic conditions in the presence of infrared radiation and observation. This study uses the multiple infrared radiation indexes (ΔAIRT, IRV, VDIIT) and image data to analyze the influence of coupled stress-hydro effect of infrared radiation change on sandstone surface. The main findings are: (1) The surface temperature of sandstone samples rises in the compaction and linear elastic stages, keeps stable or decreases in the fracture development stage, and rapidly decreases in the post-peak failure stage. (2) The samples with internal water pressure not more than 0.30 MPa, surface temperature and load curve at the compaction and linear elastic stage have a strong power function relationship, which a coefficient of determination is 0.8900. (3) The IRV curve appears as a pulse jump at the time of water seepage. After that, both the fracture development and the post-peak failure stages have stepped up. The VDIIT curve also appears to be a pulse jump at the time of water seepage, and obvious up and down fluctuations exist before water seepage and fracture. (4) Based on the Pauta Criterion, by analyzing the values of VDIIT during the experiment, the early warning threshold of sandstone fracture seepage is determined to be 0.00559. The research finding can provide an experimental and theoretical basis for the early warning of flood accidents in underground rock engineering.

1. Introduction

With the rapid development of social construction, many cities worldwide have taken the development and utilization of underground space as an important way to solve the population, resource and environmental crises and implement the concept of sustainable development [1,2,3,4,5,6,7,8,9]. However, the development of underground space and other geotechnical engineering is often restricted by groundwater [10,11,12,13,14,15,16,17]. Because water can cause changes in the physico-chemical properties of rocks, it is generally regarded as one of the most active and direct factors in geotechnical engineering disasters [18,19,20,21,22,23,24,25]. The rock in the engineering site is usually subject to the double action of water pressure and external force. Therefore, it is imperative to explore the dynamic law of rock fracture and seepage under the coupled stress-hydro effect and carry out the prediction research of water damage accidents to reduce the occurrence rate of geotechnical engineering accidents.
It has been found, that when the rock breaks, it usually releases electromagnetic energy [26,27,28,29,30,31], elastic energy [32,33,34,35,36,37,38,39,40,41], thermal energy [42,43,44], acoustic energy [45,46,47,48,49,50,51], and other kinds of energy [52]. Hence, generating a variety of disaster warning methods related to rock mass, such as infrared radiation method [53,54], electromagnetic radiation method [55,56], acoustic emission method [57,58], potential method [51,59] and microseismic method [60,61]. Among these, as a non-contact method, the infrared radiation method has the advantages of high accuracy [62], strong reliability [63], simple operation [64], and visualization [65], etc., which provides a convenient and accurate early warning method for rock fracture seepage monitoring under coupled stress-hydro effect.
Many scholars have recently studied the infrared radiation characteristics of rock failure and instability. Wu et al. [66] believe that there are abnormal changes in the infrared radiation image and temperature curve before rock failure. Lin et al. [67] found that the evolution law of average infrared radiation temperature is closely related to rock porosity, and the process of rock failure can be inferred from this. Huang et al. [68] found that the surface emissivity of loaded rock varies linearly with stress through experiments. Cao et al. [69] proposed a new index, “load-unload response ratio (LURR)” based on the rock failure characteristics under cyclic loading and unloading conditions. Zhang et al. [70] conducted some experiments on preflawed sandstone to investigate the infrared radiation characteristics during failure process and presented a new quantitative model based on Verhulst inverse function.
In addition to the above research on the infrared radiation characteristics of dry rocks, some scholars have conducted relevant experiments with water-bearing rocks. Cao et al. [71] carried out uniaxial loading tests of sandstone with different water content and thus proposed a quantitative analysis index of energy dissipation infrared radiation ratio, which was applied to predict and identify the failure of saturated rock. In addition, his team also found that rock saturation weakened its mechanical properties and amplified the changes in infrared radiation during the bearing process. According to the experimental results, they established a uniaxial loading constitutive model of rock based on infrared radiation [72]. Cai et al. [73] studied the infrared radiation characteristics of sandstone, granite, and marble with different water saturations during loading. They considered that the increment of infrared radiation has a great relationship with rock samples’ water content and compressive strength. Shen et al. [74] proved through experiments that the maximum infrared radiation temperature of rock samples presents different characteristics at different stages of loading.
However, because many rock masses in the project site are under the simultaneous and continuous action of water pressure and external force, the above research cannot fully meet the requirement of real engineering application. Therefore, this paper innovatively designed the infrared radiation observation experiment of sandstone failure seepage under the coupled stress-hydro effect and established the quantitative characterization method of sandstone failure seepage through the infrared radiation response indicators, i.e., AIRT, IRV, and VDIIT. After that, the infrared radiation warning threshold of sandstone fracture and seepage was determined. The research results can provide an experimental and theoretical basis for the early warning of flood accidents in geotechnical engineering, e.g., tunnels, mines, and underground reservoirs.

2. Experimental Design

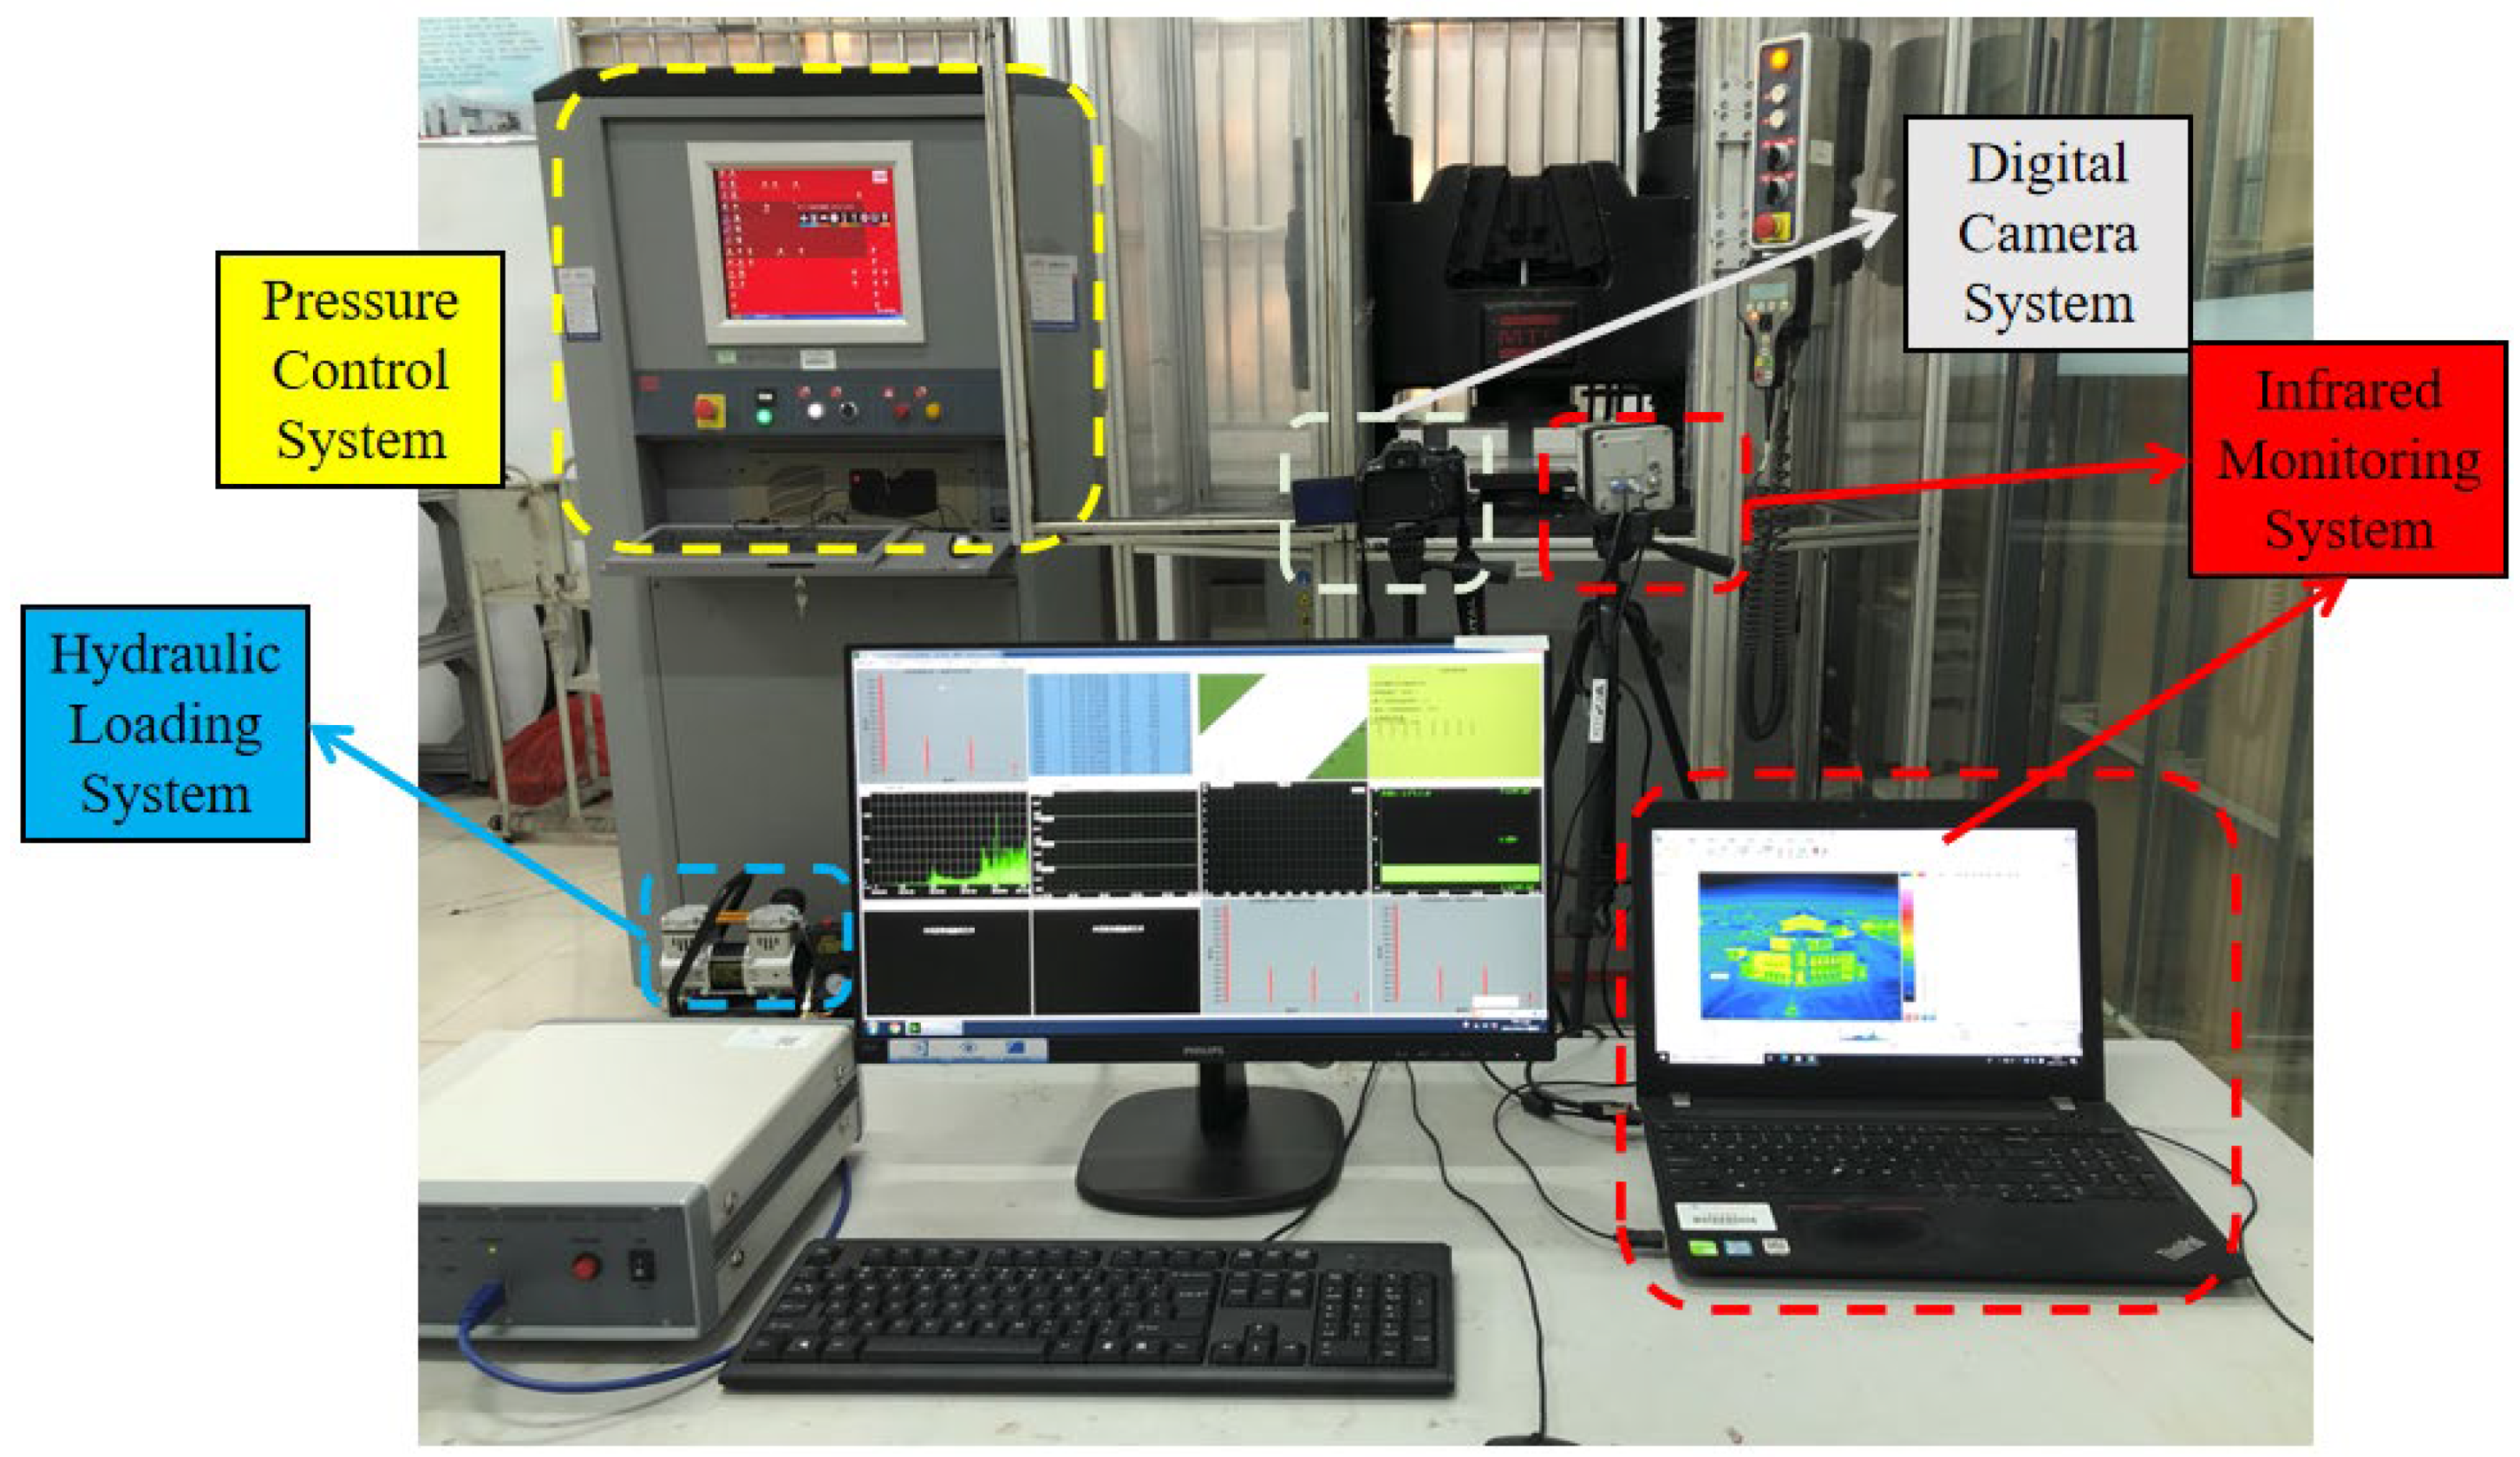
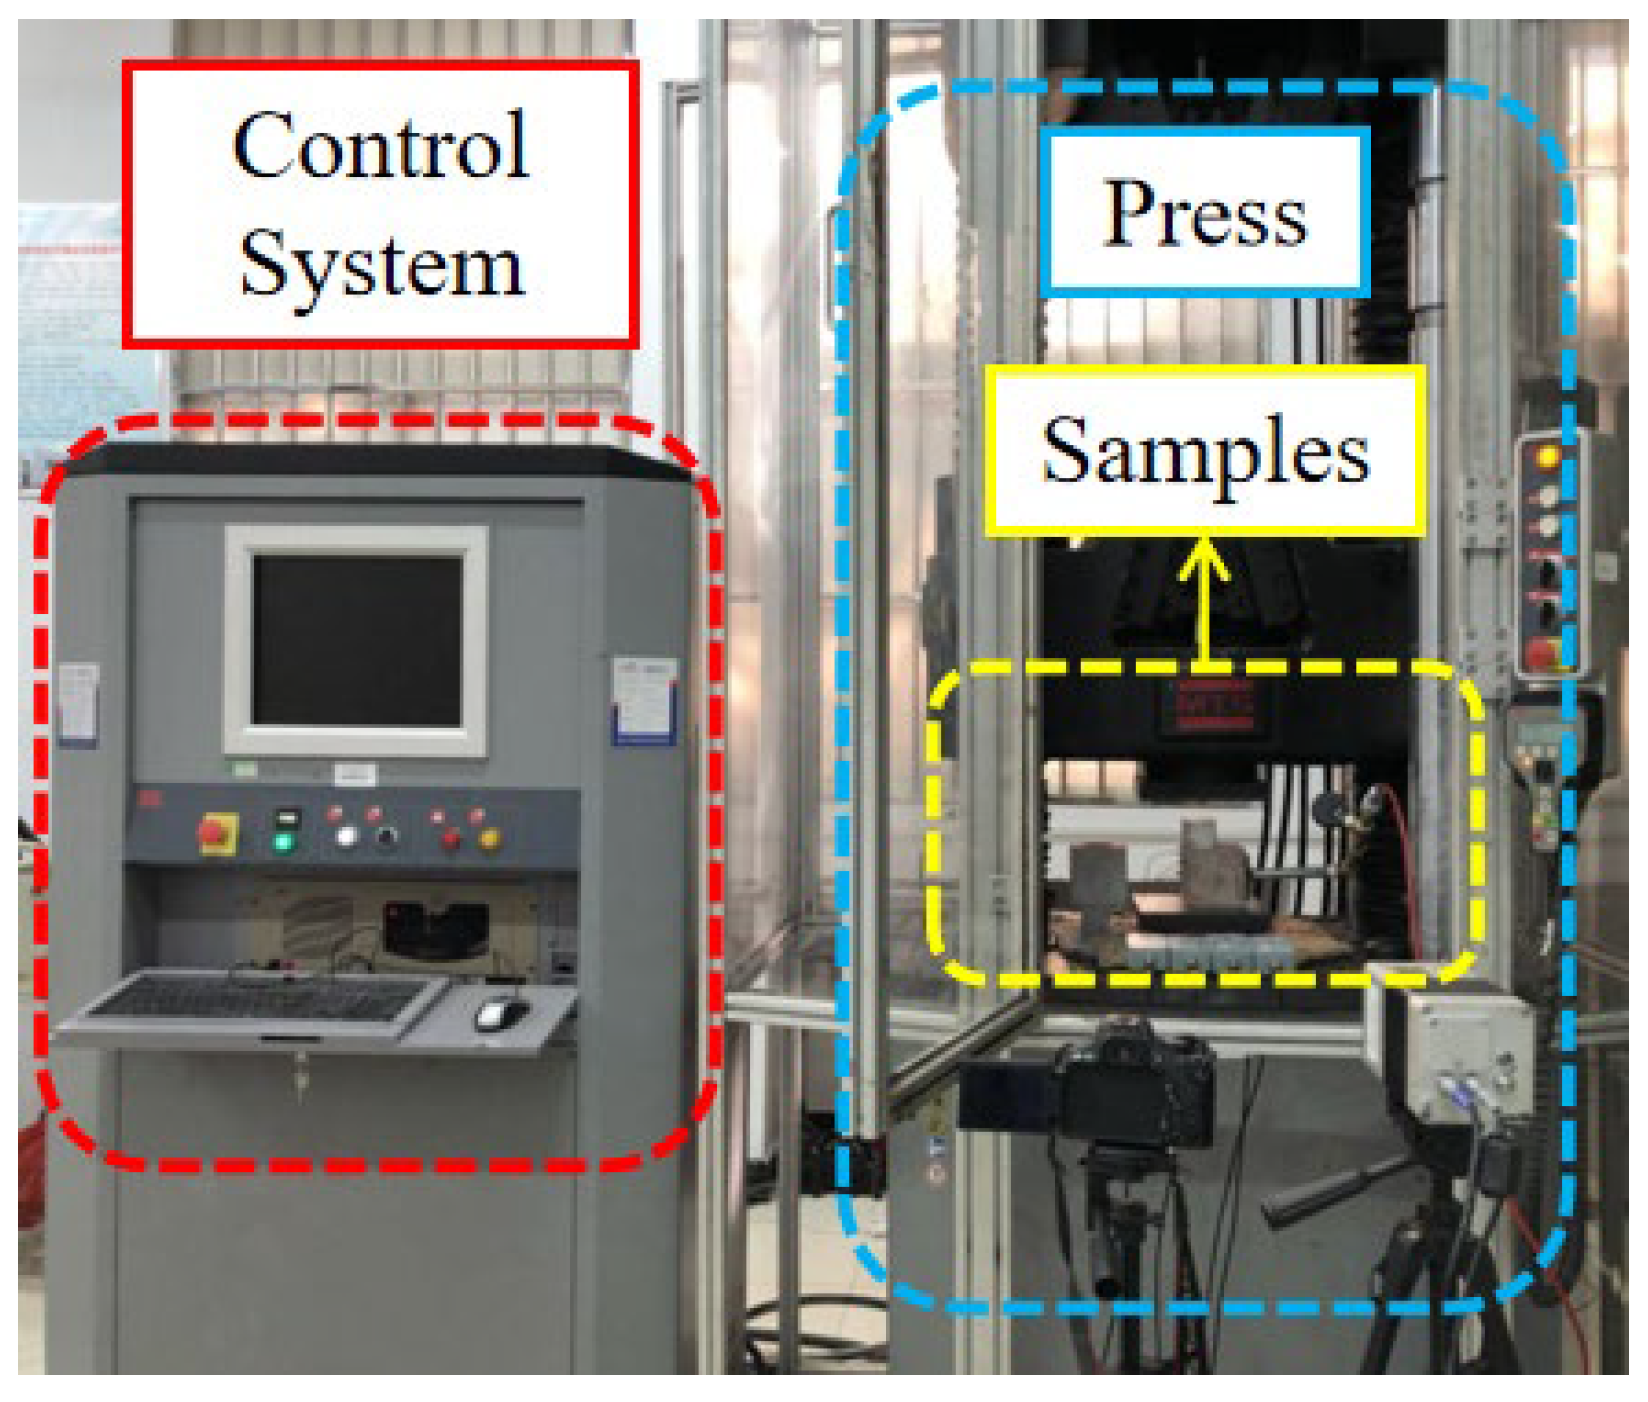
2.1. Experimental System and Equipment

The infrared radiation observation experiment for sandstone fracture and seepage under coupled stress-hydro effect, consists of a pressure control system, a hydraulic loading system, a digital camera system, and an infrared monitoring system. The influence of coupled stress-hydro effect on the infrared parameters of the sandstone surface is analysed through the collection of various parameters during the experiment; the initial position and damage characteristics of sandstone seepage fracture under various conditions are investigated. Figure 1 depicts the experiment system schematic diagram.
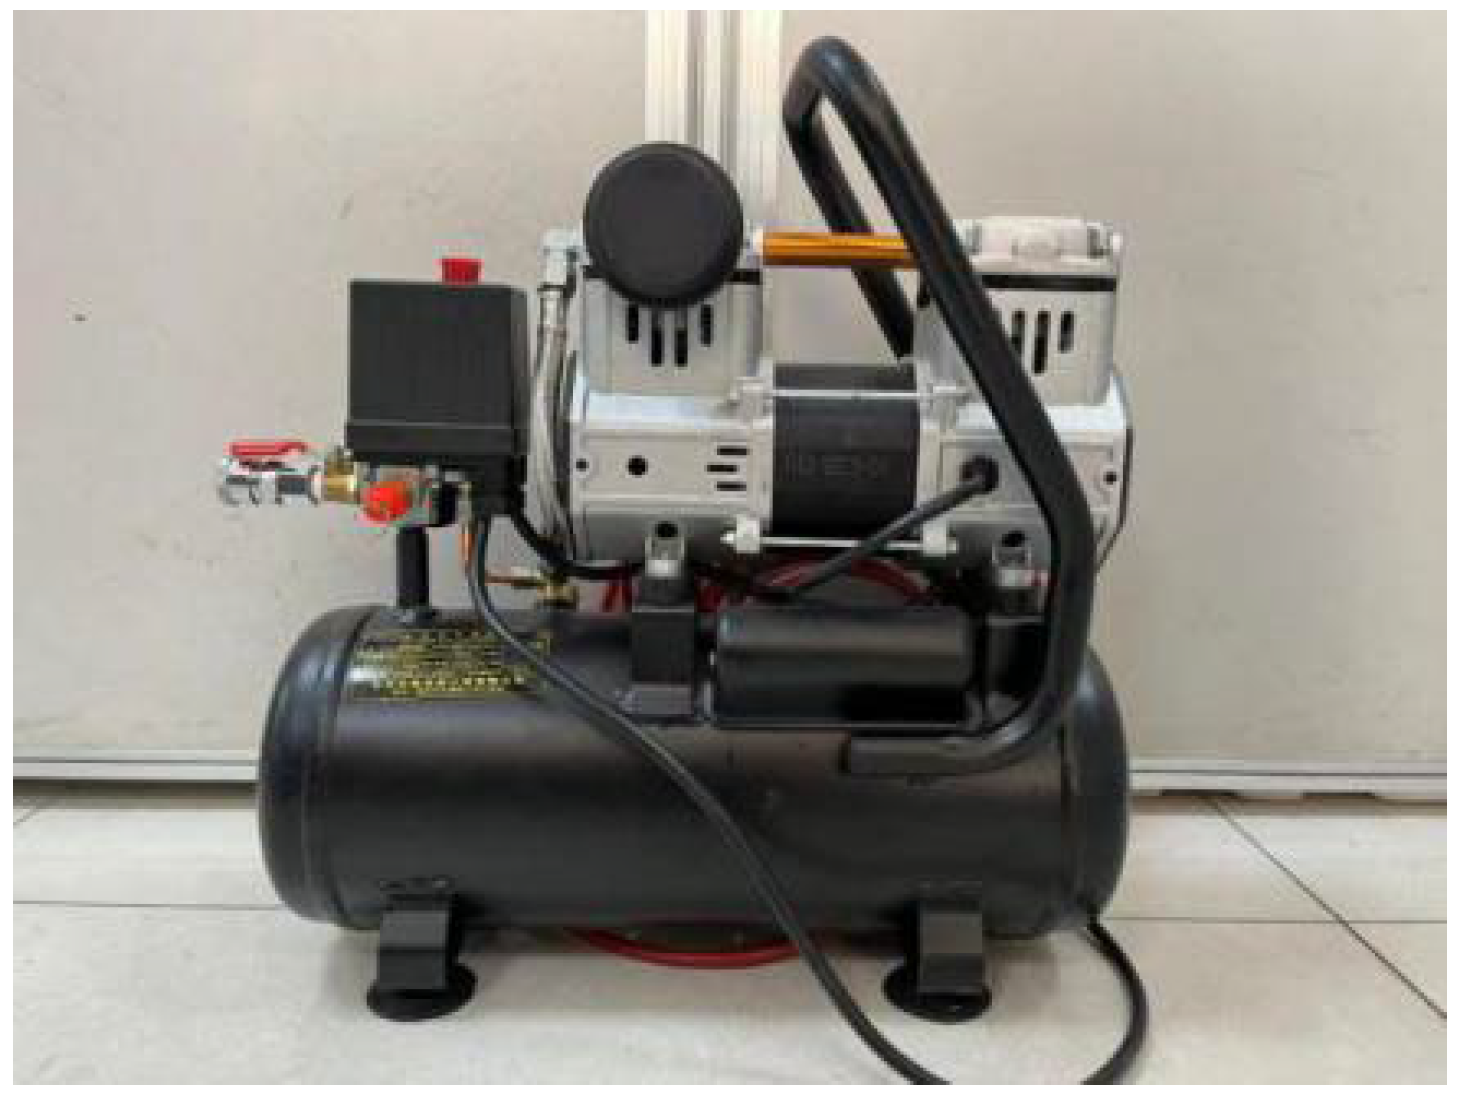
  • Pressure control system
This test uses the MTS C64.106 electro hydraulic servo universal testing equipment as the pressure control system, as shown in Figure 2. In Figure 1, the press may display the test parameter curve dynamically and record the axial stress, strain, displacement, and load in real-time. The sampling frequency is 1000 Hz, the maximum static load is 1000 kN. The loading, displacement, and deformation accuracy are within 0.5%.
  • Digital camera system
The Canon 600D SLR camera is used in this experiment to record the images. It has an 18 million pixel CMOS sensor, a digital 4 image processor, a 3-inch reversible LCD screen, full HD video recorder. The camera will record the entire experiment and be utilised to watch the sample fracture and water seepage process in the later stages of the experiment.
  • Hydraulic loading system
Pull a steel pipe out of the drilled sandstone, fill it with water, connect the pressure gauge, and link it to the air pump interface, before strong glue using to secure the perforated iron sheet to the top of the sandstone. An air pump compression technique is used to verify that the internal water pressure reaches and maintains a specific value during the test. The primary air compressor (Figure 3) characteristic parameters are listed in Table 1.
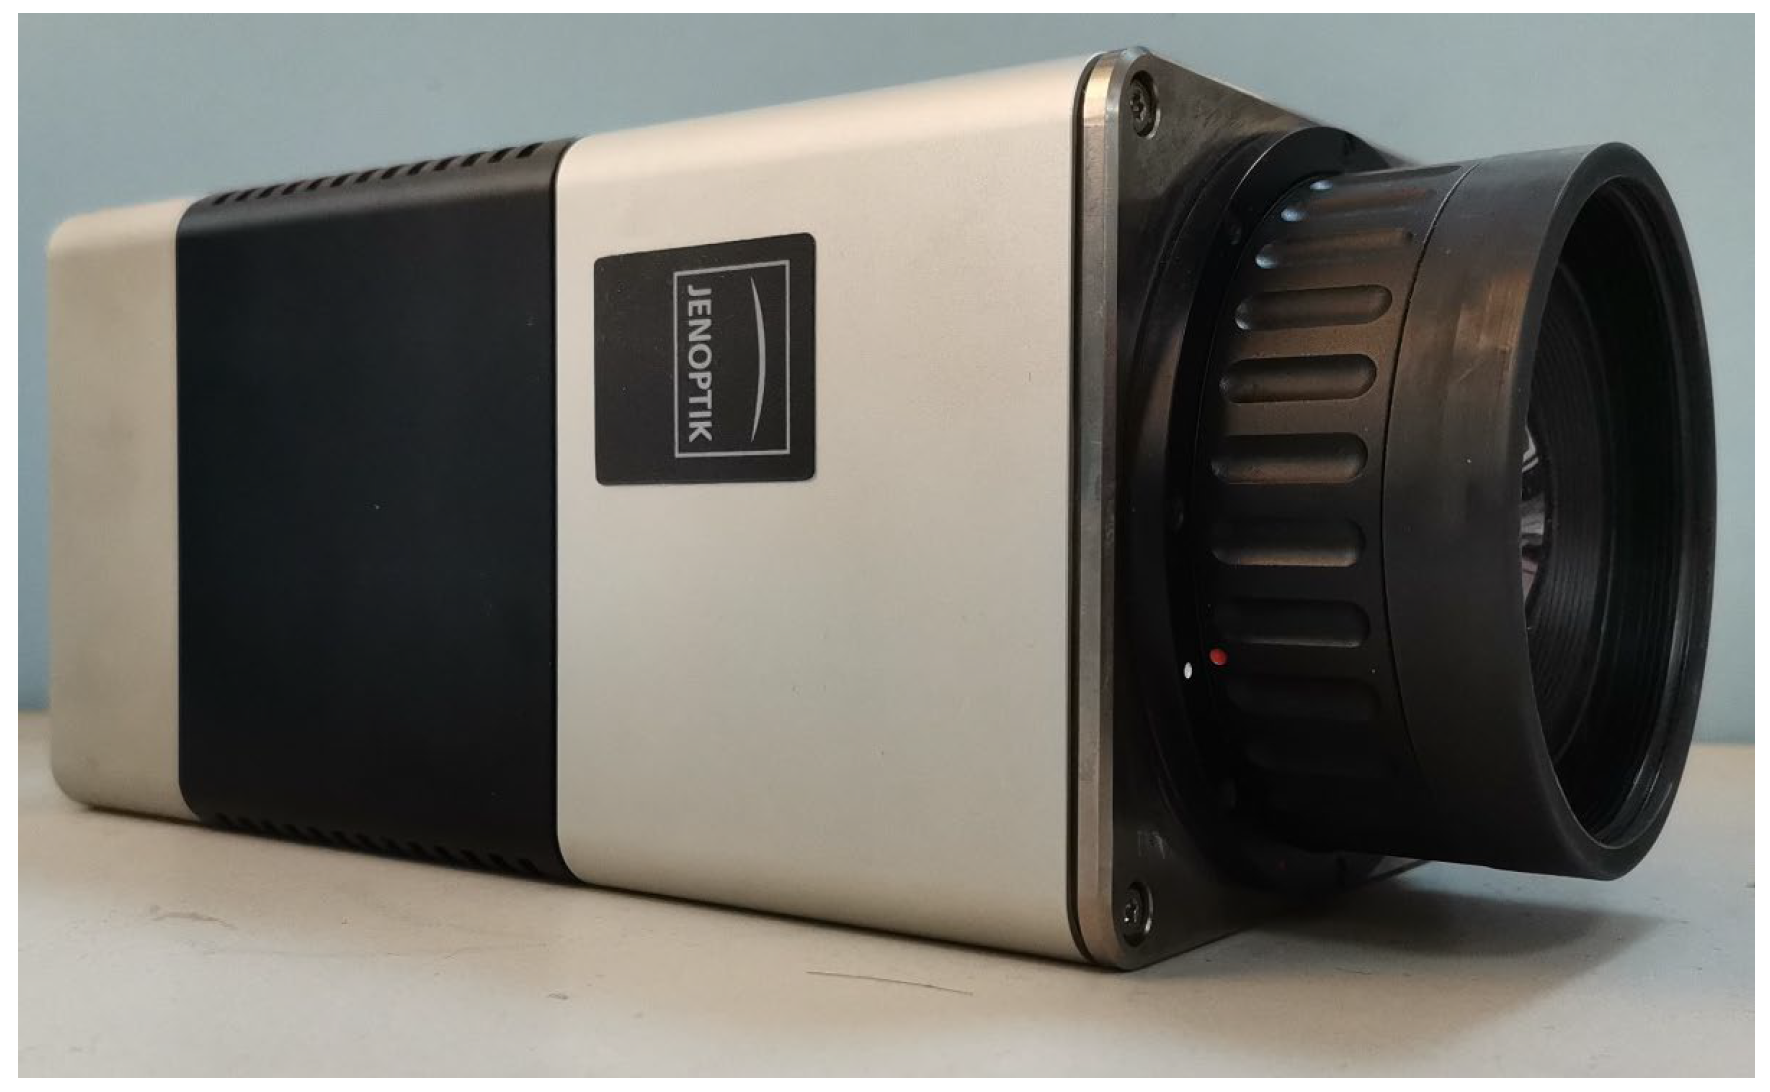
  • Infrared observation system
An infrared thermal imager and its professional control system comprise the infrared radiation observation system, as shown in Figure 4. The infrared thermal imager is an uncooled infrared thermal imager with the type varioCAM HD head 880 from infra Tec, Dresden, Germany. The essential characteristics and performance of the infrared thermal imager are described in Table 2.

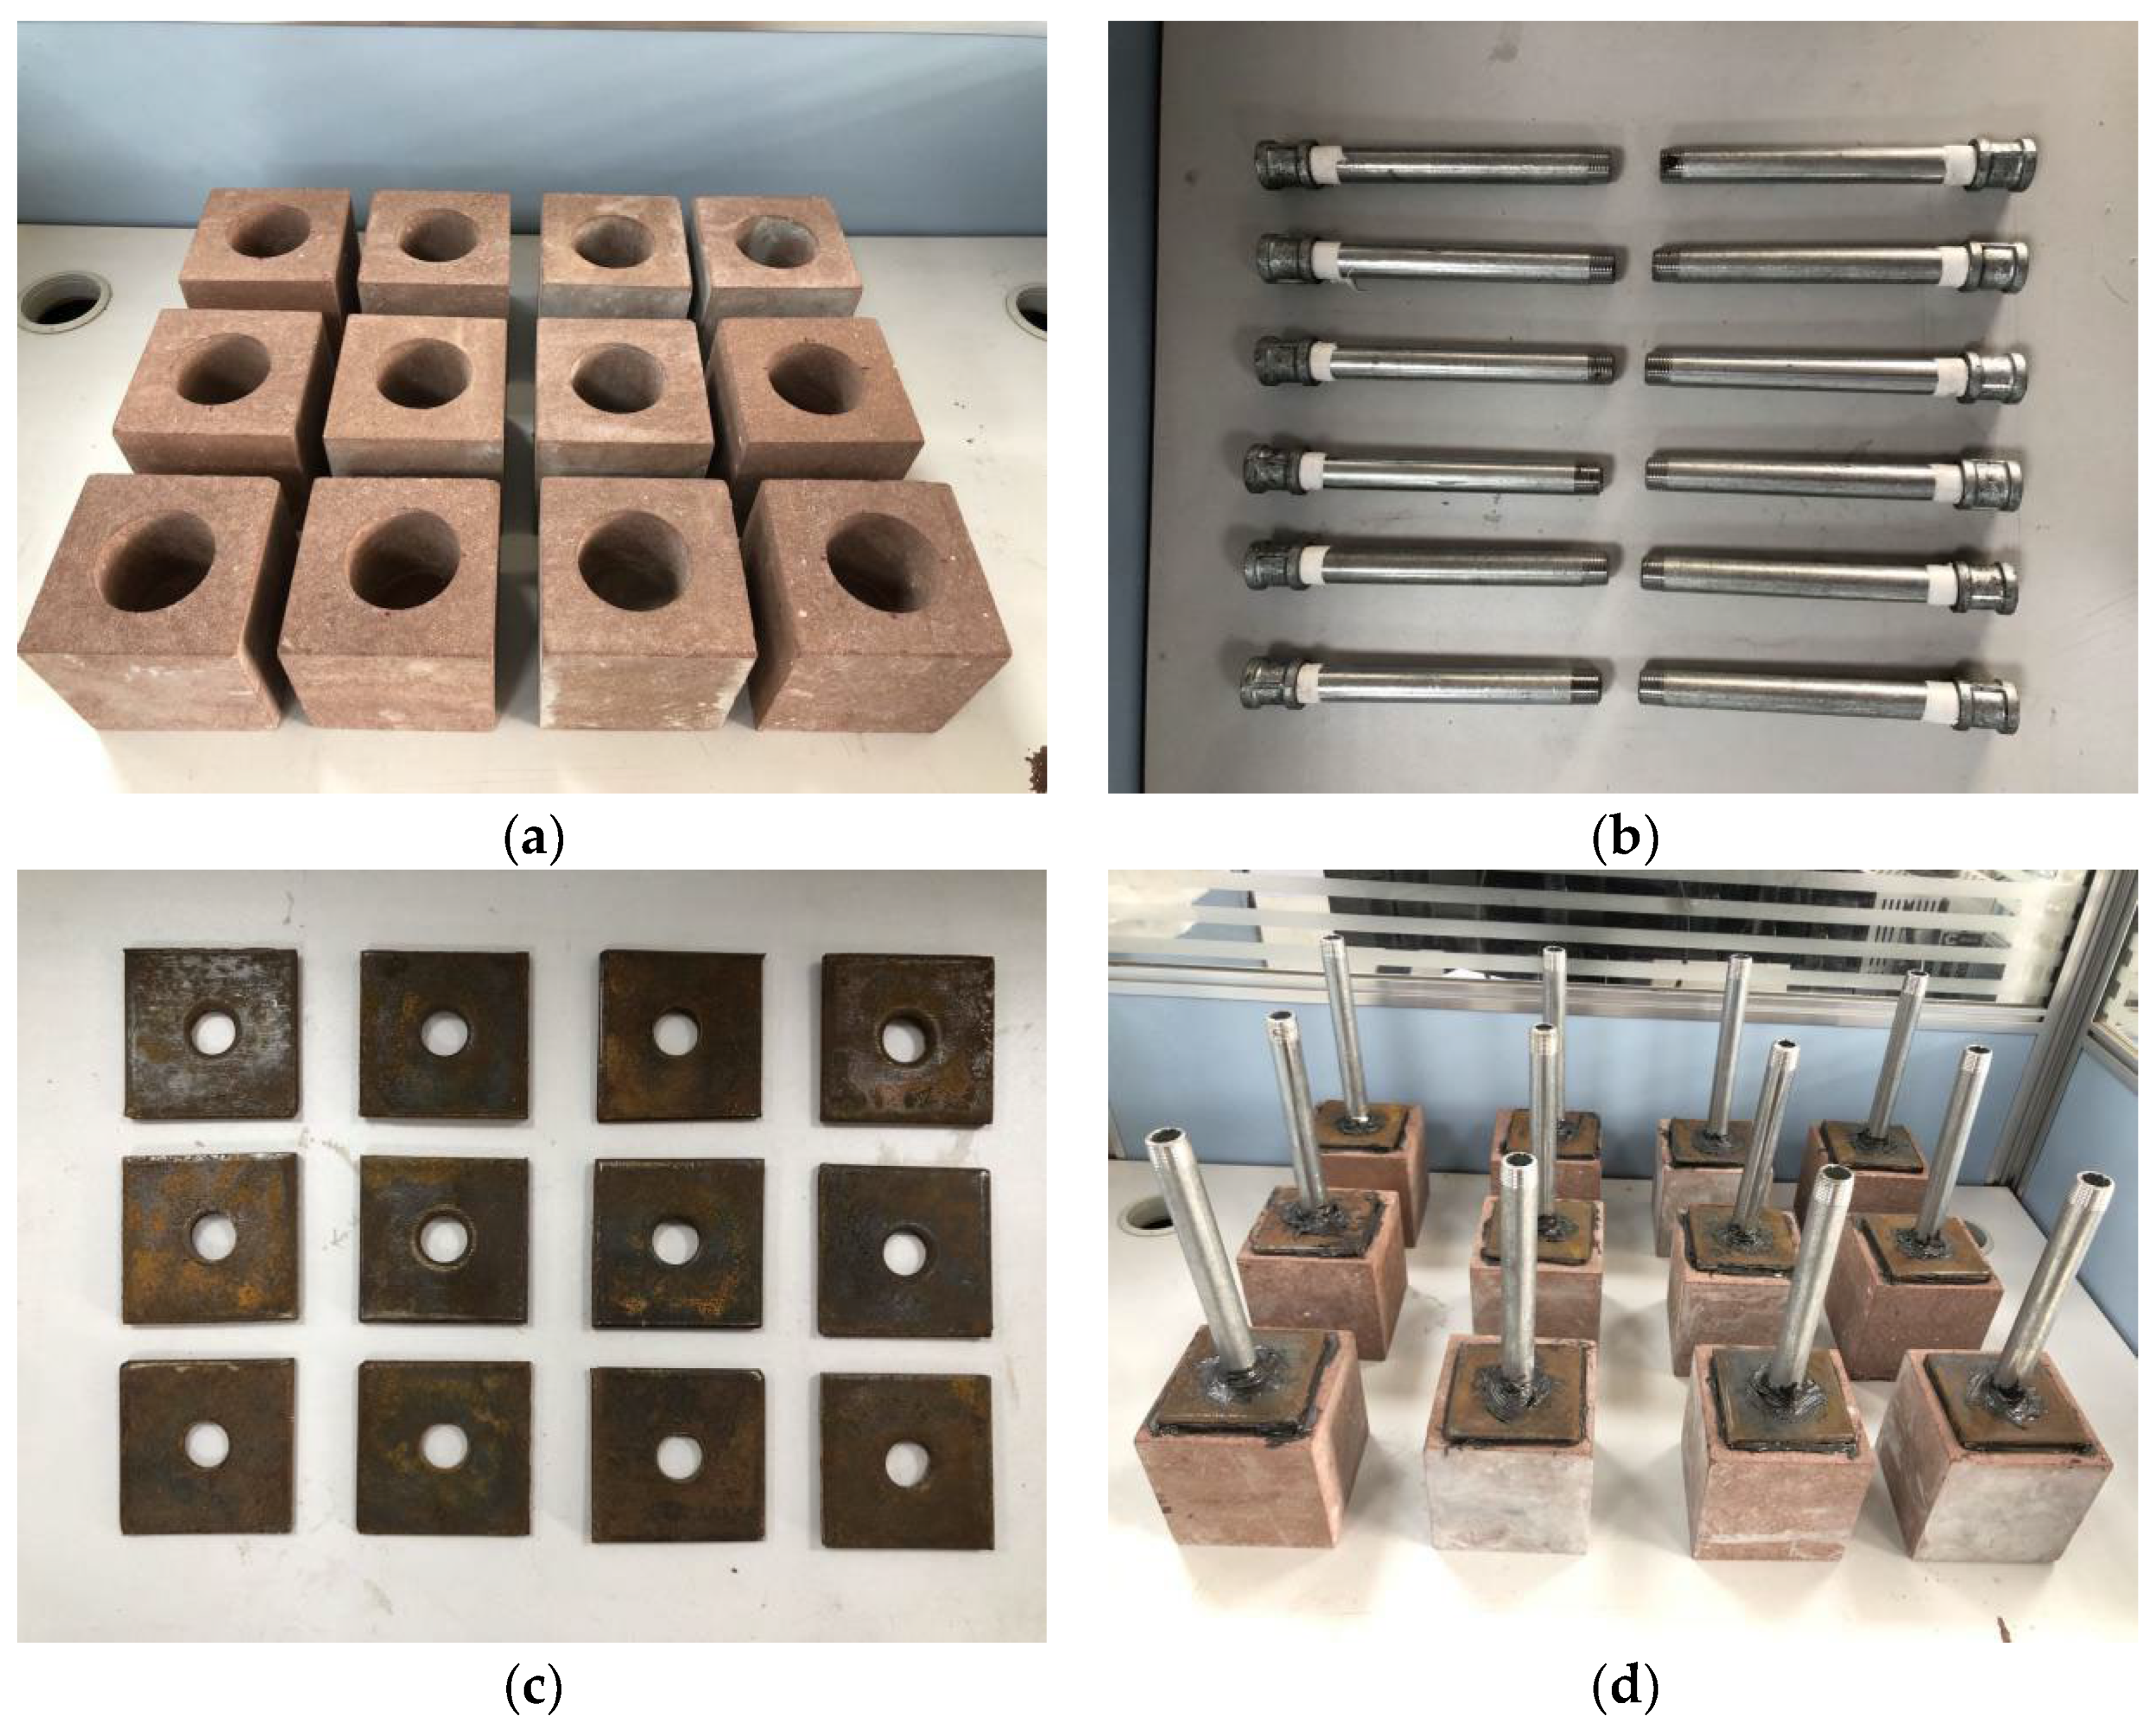
2.2. Sample Preparation

The rock samples used by the authors were taken from the coal mine site and made by cutting a whole rock. First, the authors preliminarily screened the processed rock samples and eliminated the rock samples with surface cracks. Next, the authors used the U510 non-metallic ultrasonic detector to accurately measure the wave velocity of the sample. During the process, the probe should be kept in direct contact, and the probe should be in close contact with the sample through the couplant. At the same time, the authors eliminated the samples whose wave velocity deviated by more than 10% to ensure the maximum elimination of the dispersion of rock samples. The representative samples of cubic shape had dimensions 100 mm × 100 mm × 100 mm. To provide a space for water injection in the sandstone, drill a sandstone cylinder with a diameter of 50 mm and a depth of 65mm, at the centre of the sample surface with a drilling machine (see Figure 5a). After that, a steel pipe with an exterior diameter of 20 mm, an inner diameter of 18 mm, and a length of 200 mm (see Figure 5b) and an iron square piece of specification 80 mm, shall be used (see Figure 5c). Keep the drilled sandstone, steel pipe, and perforated iron sheet in a ventilated area for 24 h to allow the strong adhesive to set completely. Simultaneously, the small space at the three-part junction must be filled with strong glue and sealed to guarantee that the processed sample does not leak (see Figure 5d).
To ensure the accuracy of the experimental monitoring data, the flatness parameters of the rock sample surface are set as follows: the roughness of the rock sample surface is less than 0.1 mm, and there is no bulge and depression. The side of the rock sample shall be perpendicular to the upper and lower end faces, with a deviation of less than 0.05°. Rock samples are natural samples without special treatment such as drying or soaking. The rock sample shall be put into the laboratory one day before the experiment to ensure that the temperature of the rock sample is consistent with the temperature of the experimental environment. That is to prevent the accuracy of the infrared radiation response information from being disturbed by the heat transfer during the experiment.
The test is divided into 4 groups, with 3 samples in each group, 12 in total. Four different water pressures of 0 MPa, 0.15 MPa, 0.3 MPa and 0.45 MPa are, respectively, used to pressurize. The experimental samples grouping details are given in Table 3.

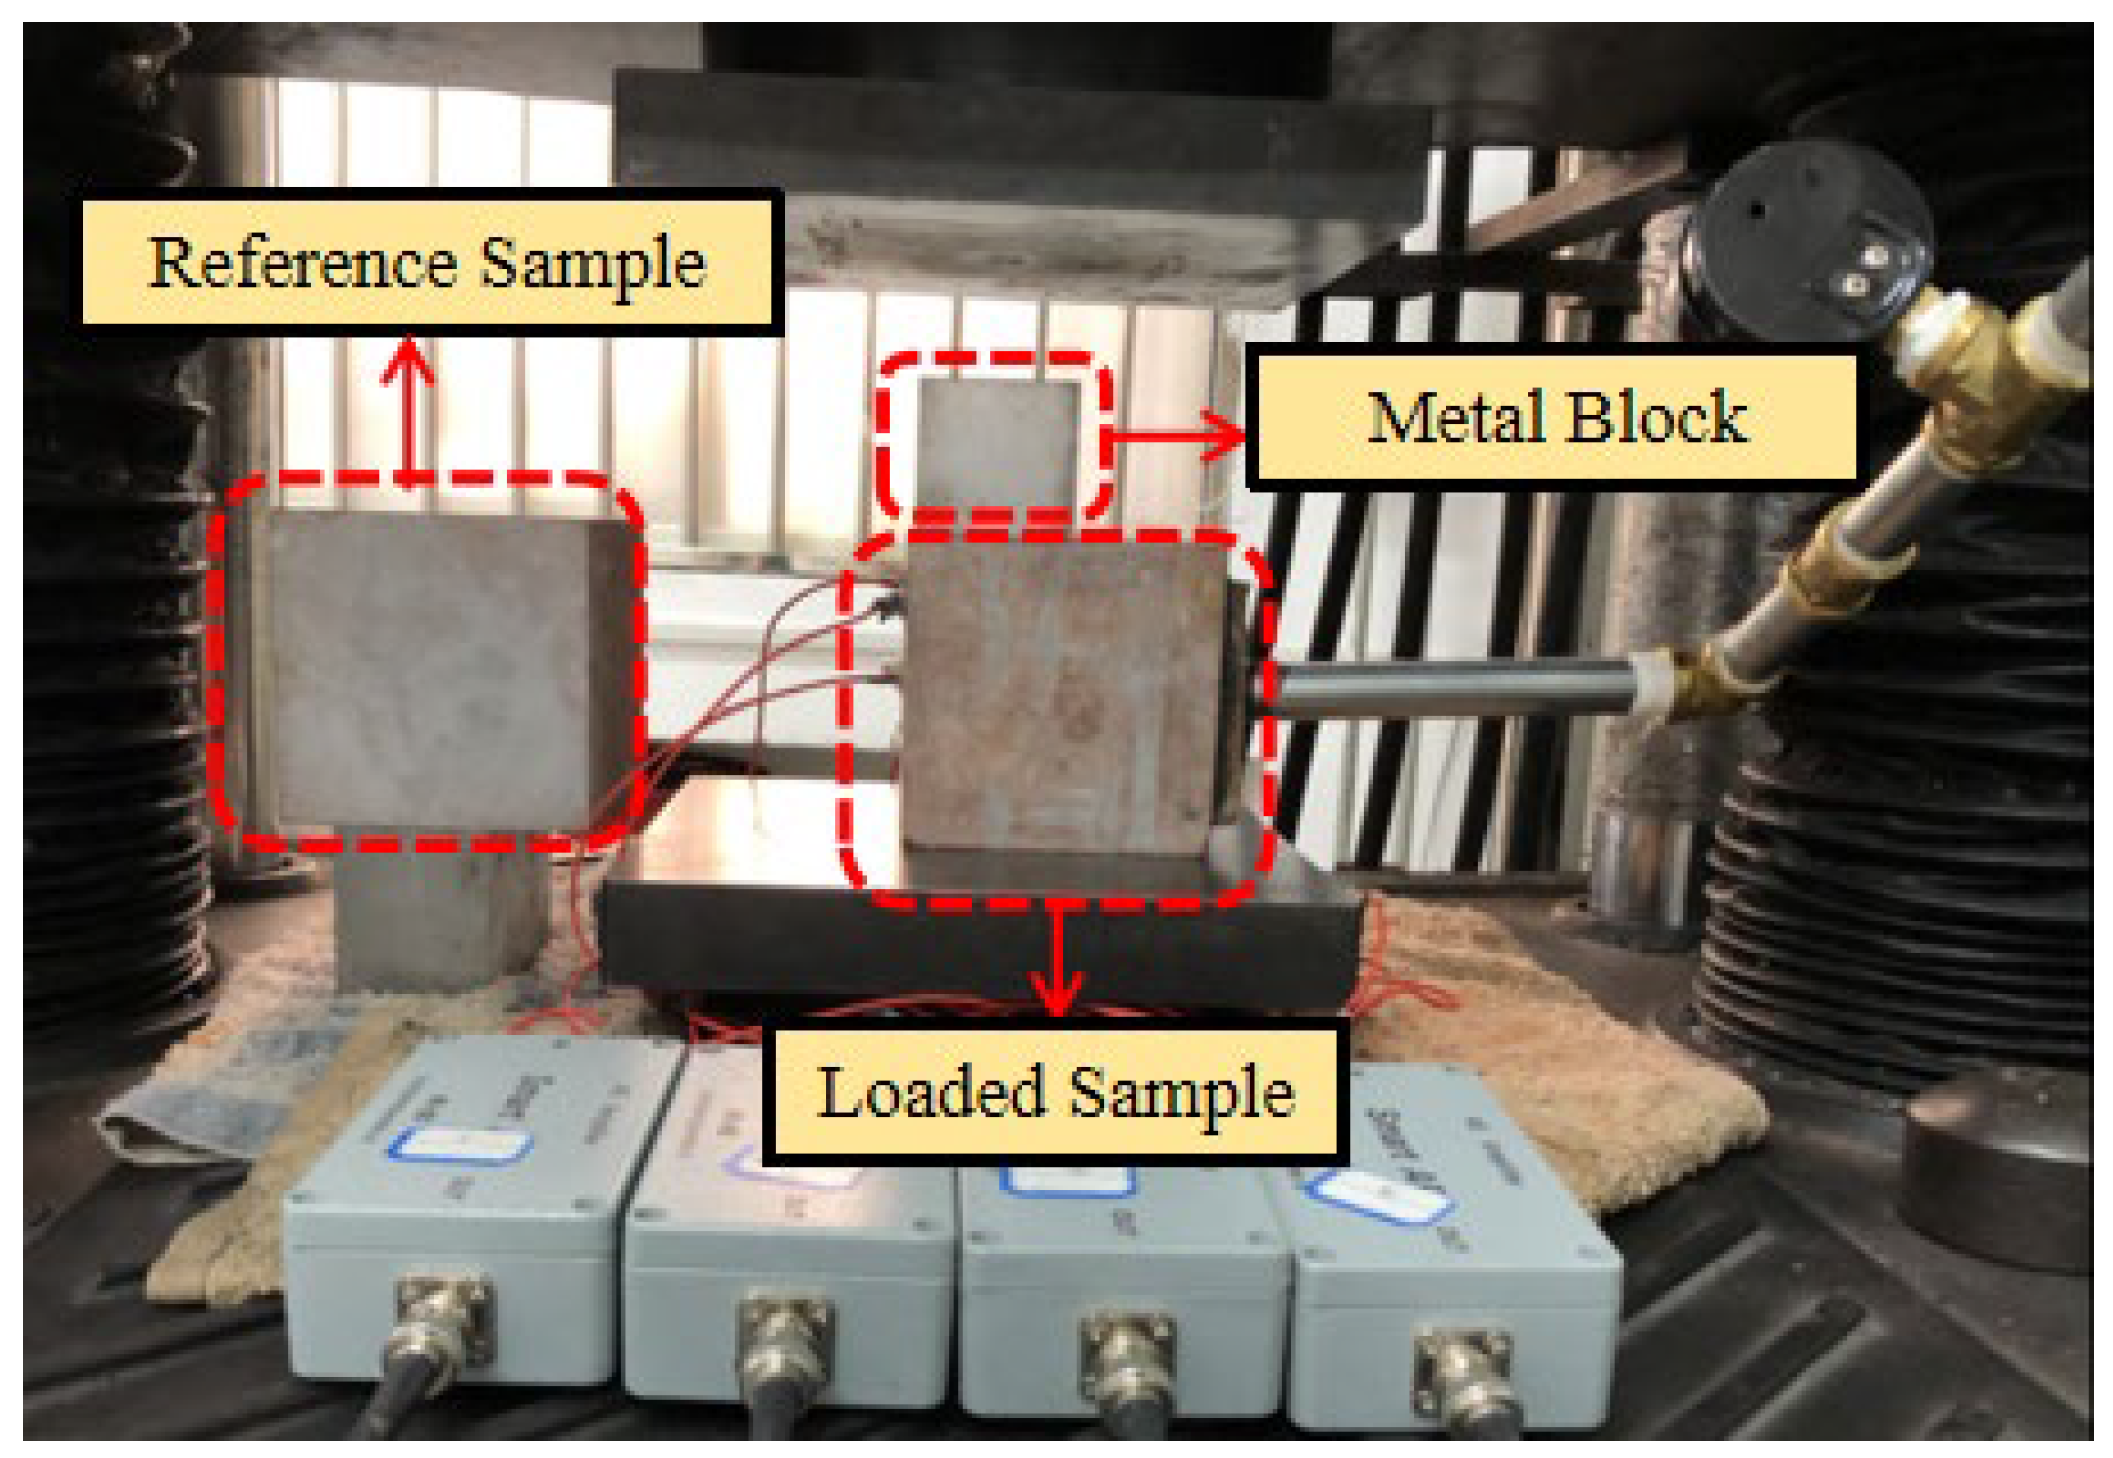
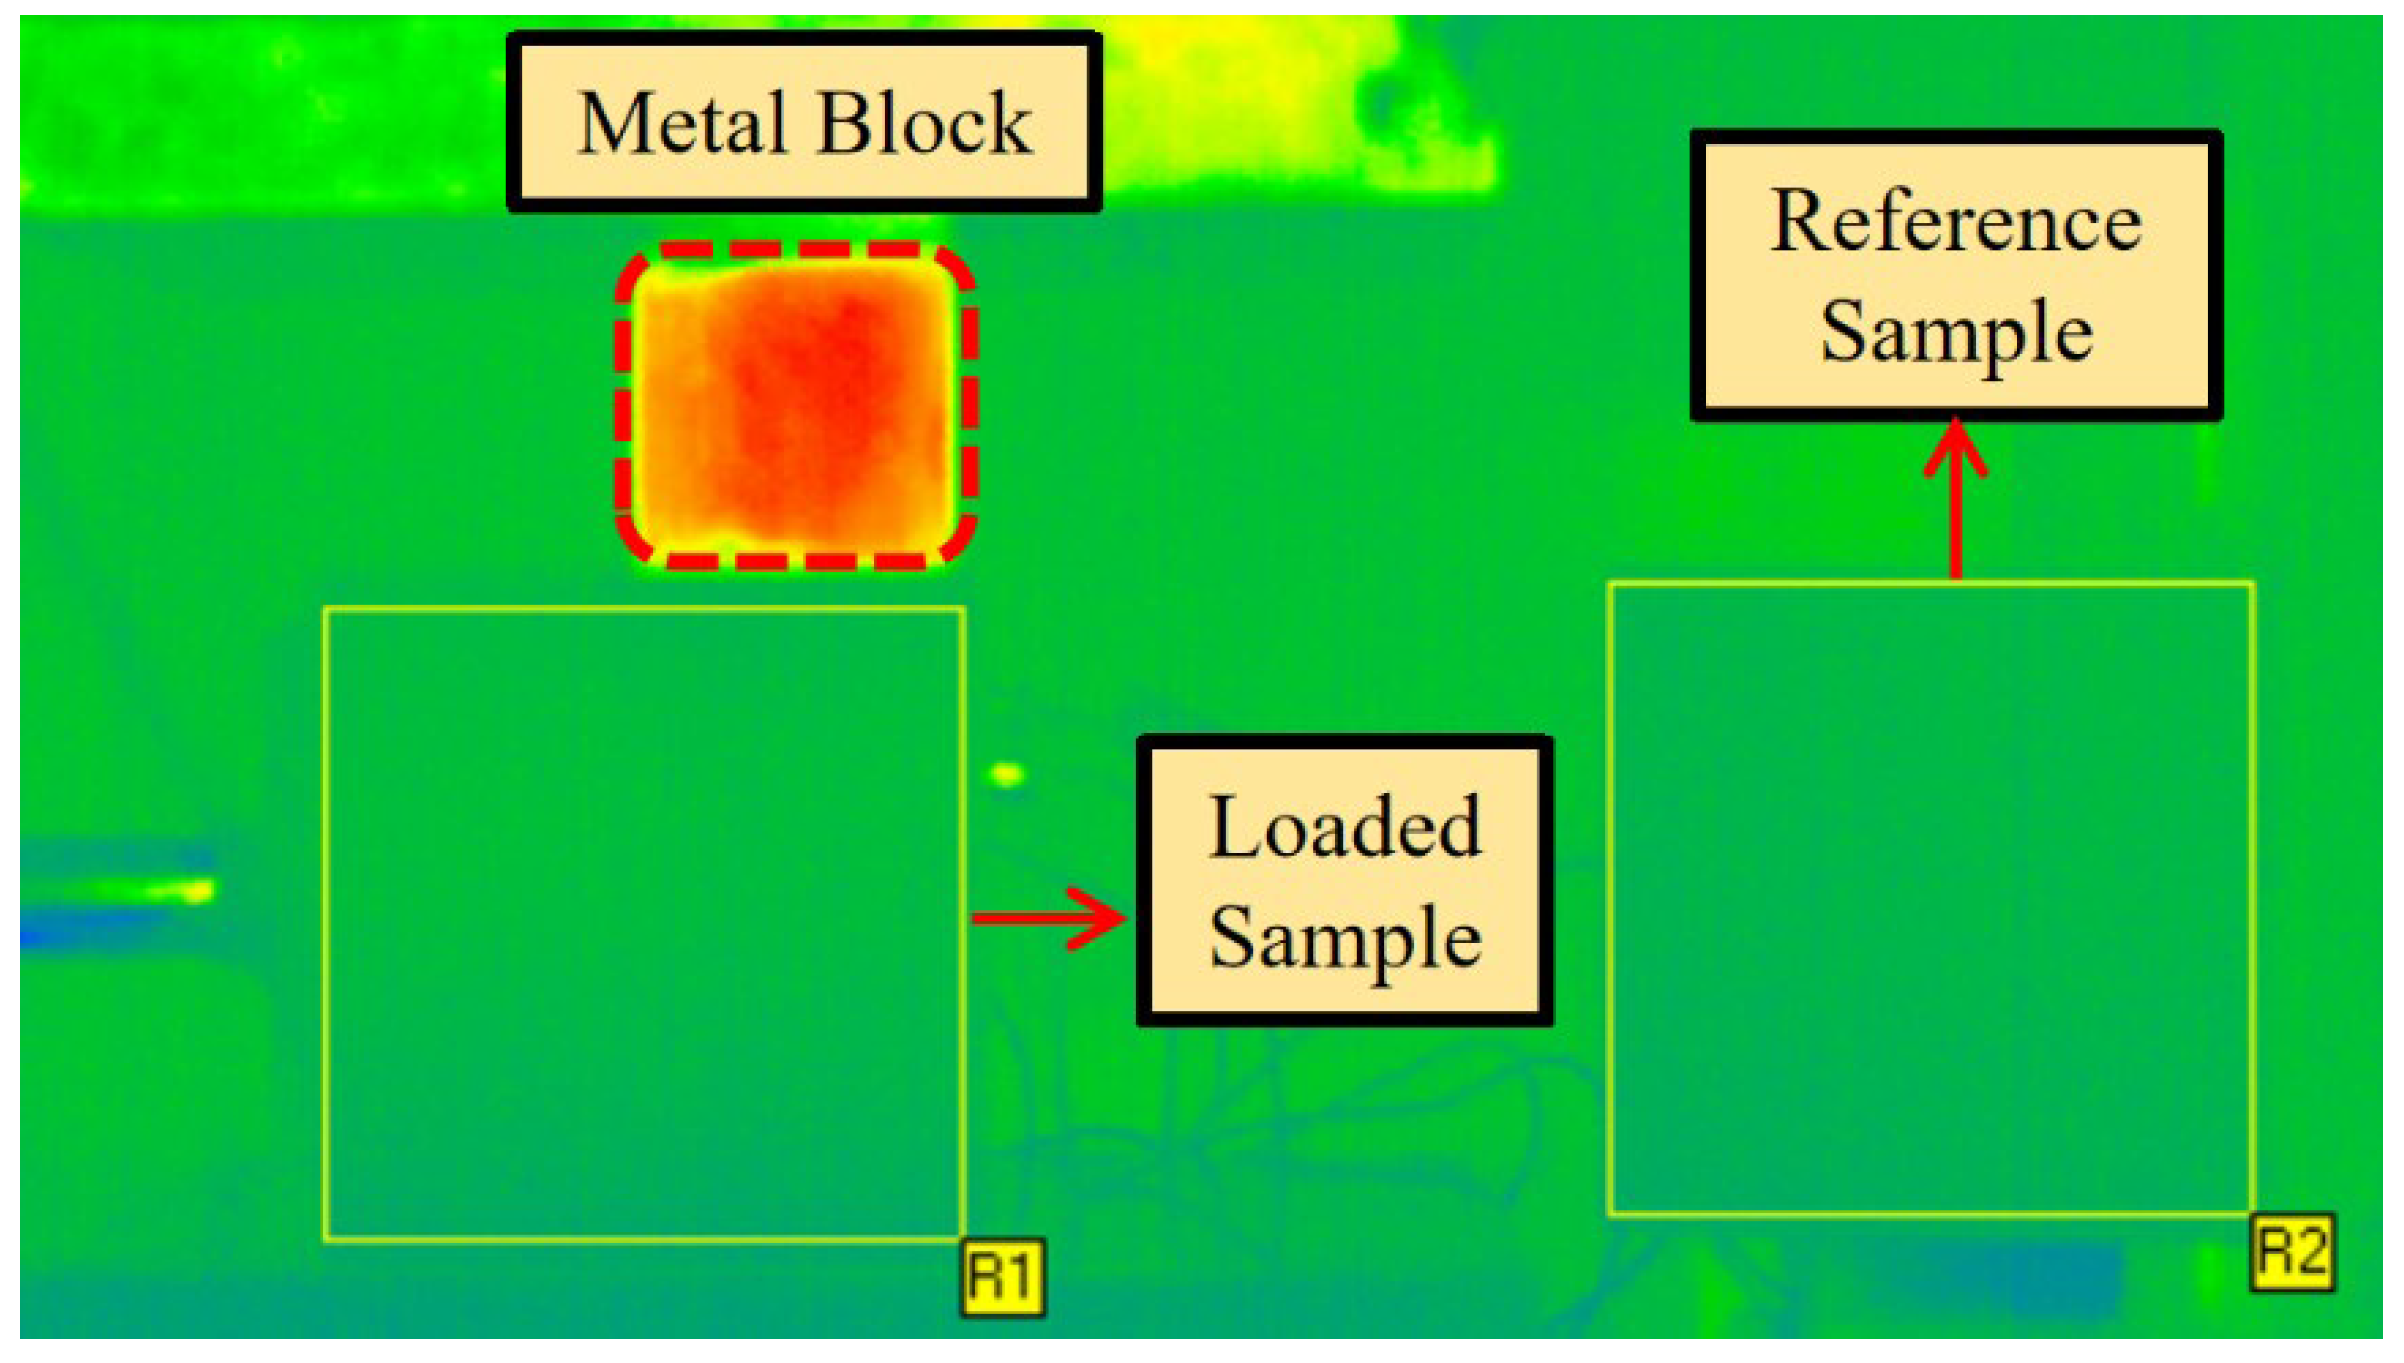
2.3. Experimental Process

Figure 1 depicts the pressure control system, water pressure loading system, digital camera system, and infrared observation system. The infrared observation instrument and digital camera are placed 1 m in front of the sample to enable observation and recording. The steel pipe is used to fill the interior chamber of the loaded sample with water sample, and the steel pipe is connected to the air compressor via the rubber pipe to assist later pressurisation. Place the loaded specimen on the presser pressure plate. Given the poor bearing capacity of the rock sample’s cavity, a specification of 100 mm (length) × 35 mm (width) × 30 mm (height) metal cushion block is placed on the solid part of the rock sample and its center is aligned with the loading center, as illustrated in Figure 6. Simultaneously, the reference sample used for noise reduction must be put and kept on the loaded sample’s side, and its height must be consistent with that of the loaded sample.
After arranging the necessary equipment and samples, each experimenter is responsible for configuring the storage directory and other basic settings for the press, infrared thermal imager, and other equipment, with a 0.2 mm/min loading rate. After that, the air compressor increases the water pressure to the desired value, and the valve is closed to guarantee that the internal water pressure of the rock sample remains constant. After setup, the infrared thermal imager, digital camera, press, and other equipment will begin to operate in unison under the unified password. It is prohibited for laboratory staff to move around and close the laboratory windows, curtains, and all lighting sources that may create radiation interference during the information gathering procedure of the infrared thermal imager.
After the test, all equipment shall stop working at the same time, and the test personnel shall properly save the data of all equipment, and take photos of the fracture morphology of the rock sample. After cleaning the test bench, place the next sample to continue the experiment.

2.4. Experimental Data Processing Method

In the infrared radiation information collection system, the infrared thermal imager maps the rock samples’ physical and structural changes during the experimental procedure to the infrared radiation temperature field. It shows in the form of infrared thermal images. When the difference between the background temperature and the temperature of the rock sample is large, the abnormal features of the infrared thermal picture are not visible (as shown in Figure 7), so the infrared radiation data of the rock sample must be extracted again in a small range.
A rectangular area (as illustrated in Figure 7) is constructed along the whole sample section in the infrared radiation acquisition system, and the infrared radiation response information of the rectangle area is then retrieved and preserved in the form of a series of two-dimensional matrices. The resampled infrared radiation data of frame P is a two-dimensional matrix with the following expression:
f p x , y = f p 1 , 1 f p 1 , 2 f p 1 , L y f p 2 , 1 f p 2 , 2 f p 2 , L y f p L x , 1 f p L x , 2 f p L x , L y
where x represents the row number of the matrix f p x , y and y represents the column number; L x and L y are the maximum number of rows and columns of x and y, respectively.
According to the obtained temperature matrix, the following parameters can be calculated:
(1)
Average infrared radiation temperature (AIRT) and ΔAverage infrared radiation temperature (ΔAIRT)
AIRT can directly reflect the bearing rock surface’s overall infrared radiation field temperature. The average infrared radiation temperature (AIRT (p)) of the pth frame in the original infrared radiation thermal image sequence is expressed as:
AIRT p = 1 L x 1 L y x = 1 L x y = 1 L y f p ( x , y )
Since the radiation interference of the loaded sample and the reference sample is almost synchronous in time and space, the AIRT of the loaded sample can be subtracted from the AIRT of the reference sample to obtain the denoised ΔAIRT. This can be calculated by using Equation (3):
Δ AIRT p = AIRT p AIRT p
(2)
Infrared radiation variance (IRV)
The physical meaning of IRV is the changing trend of the dispersion degree of the temperature field in the original infrared radiation thermal image sequence diagram. The variance (IRV (p)) of the original infrared radiation thermal image sequence of the pth frame is expressed as:
IRV p = 1 L x 1 L y y = 1 L x x = 1 L y f p x , y AIRT p 2
(3)
Variance of differential infrared image temperature (VDIIT)
The physical meaning of VDIIT is the variation trend of the dispersion degree of the temperature field in the differential infrared radiation thermal image sequence diagram. The variance (VDIIT (P)) of the differential infrared radiation thermal image sequence of the pth frame is expressed as:
VDIIT p = 1 L x 1 L y y = 1 L x x = 1 L y φ p x , y AIRT p 2
where φ p x , y = f p + 1 x , y f p x , y .

3. Experimental Results and Analysis

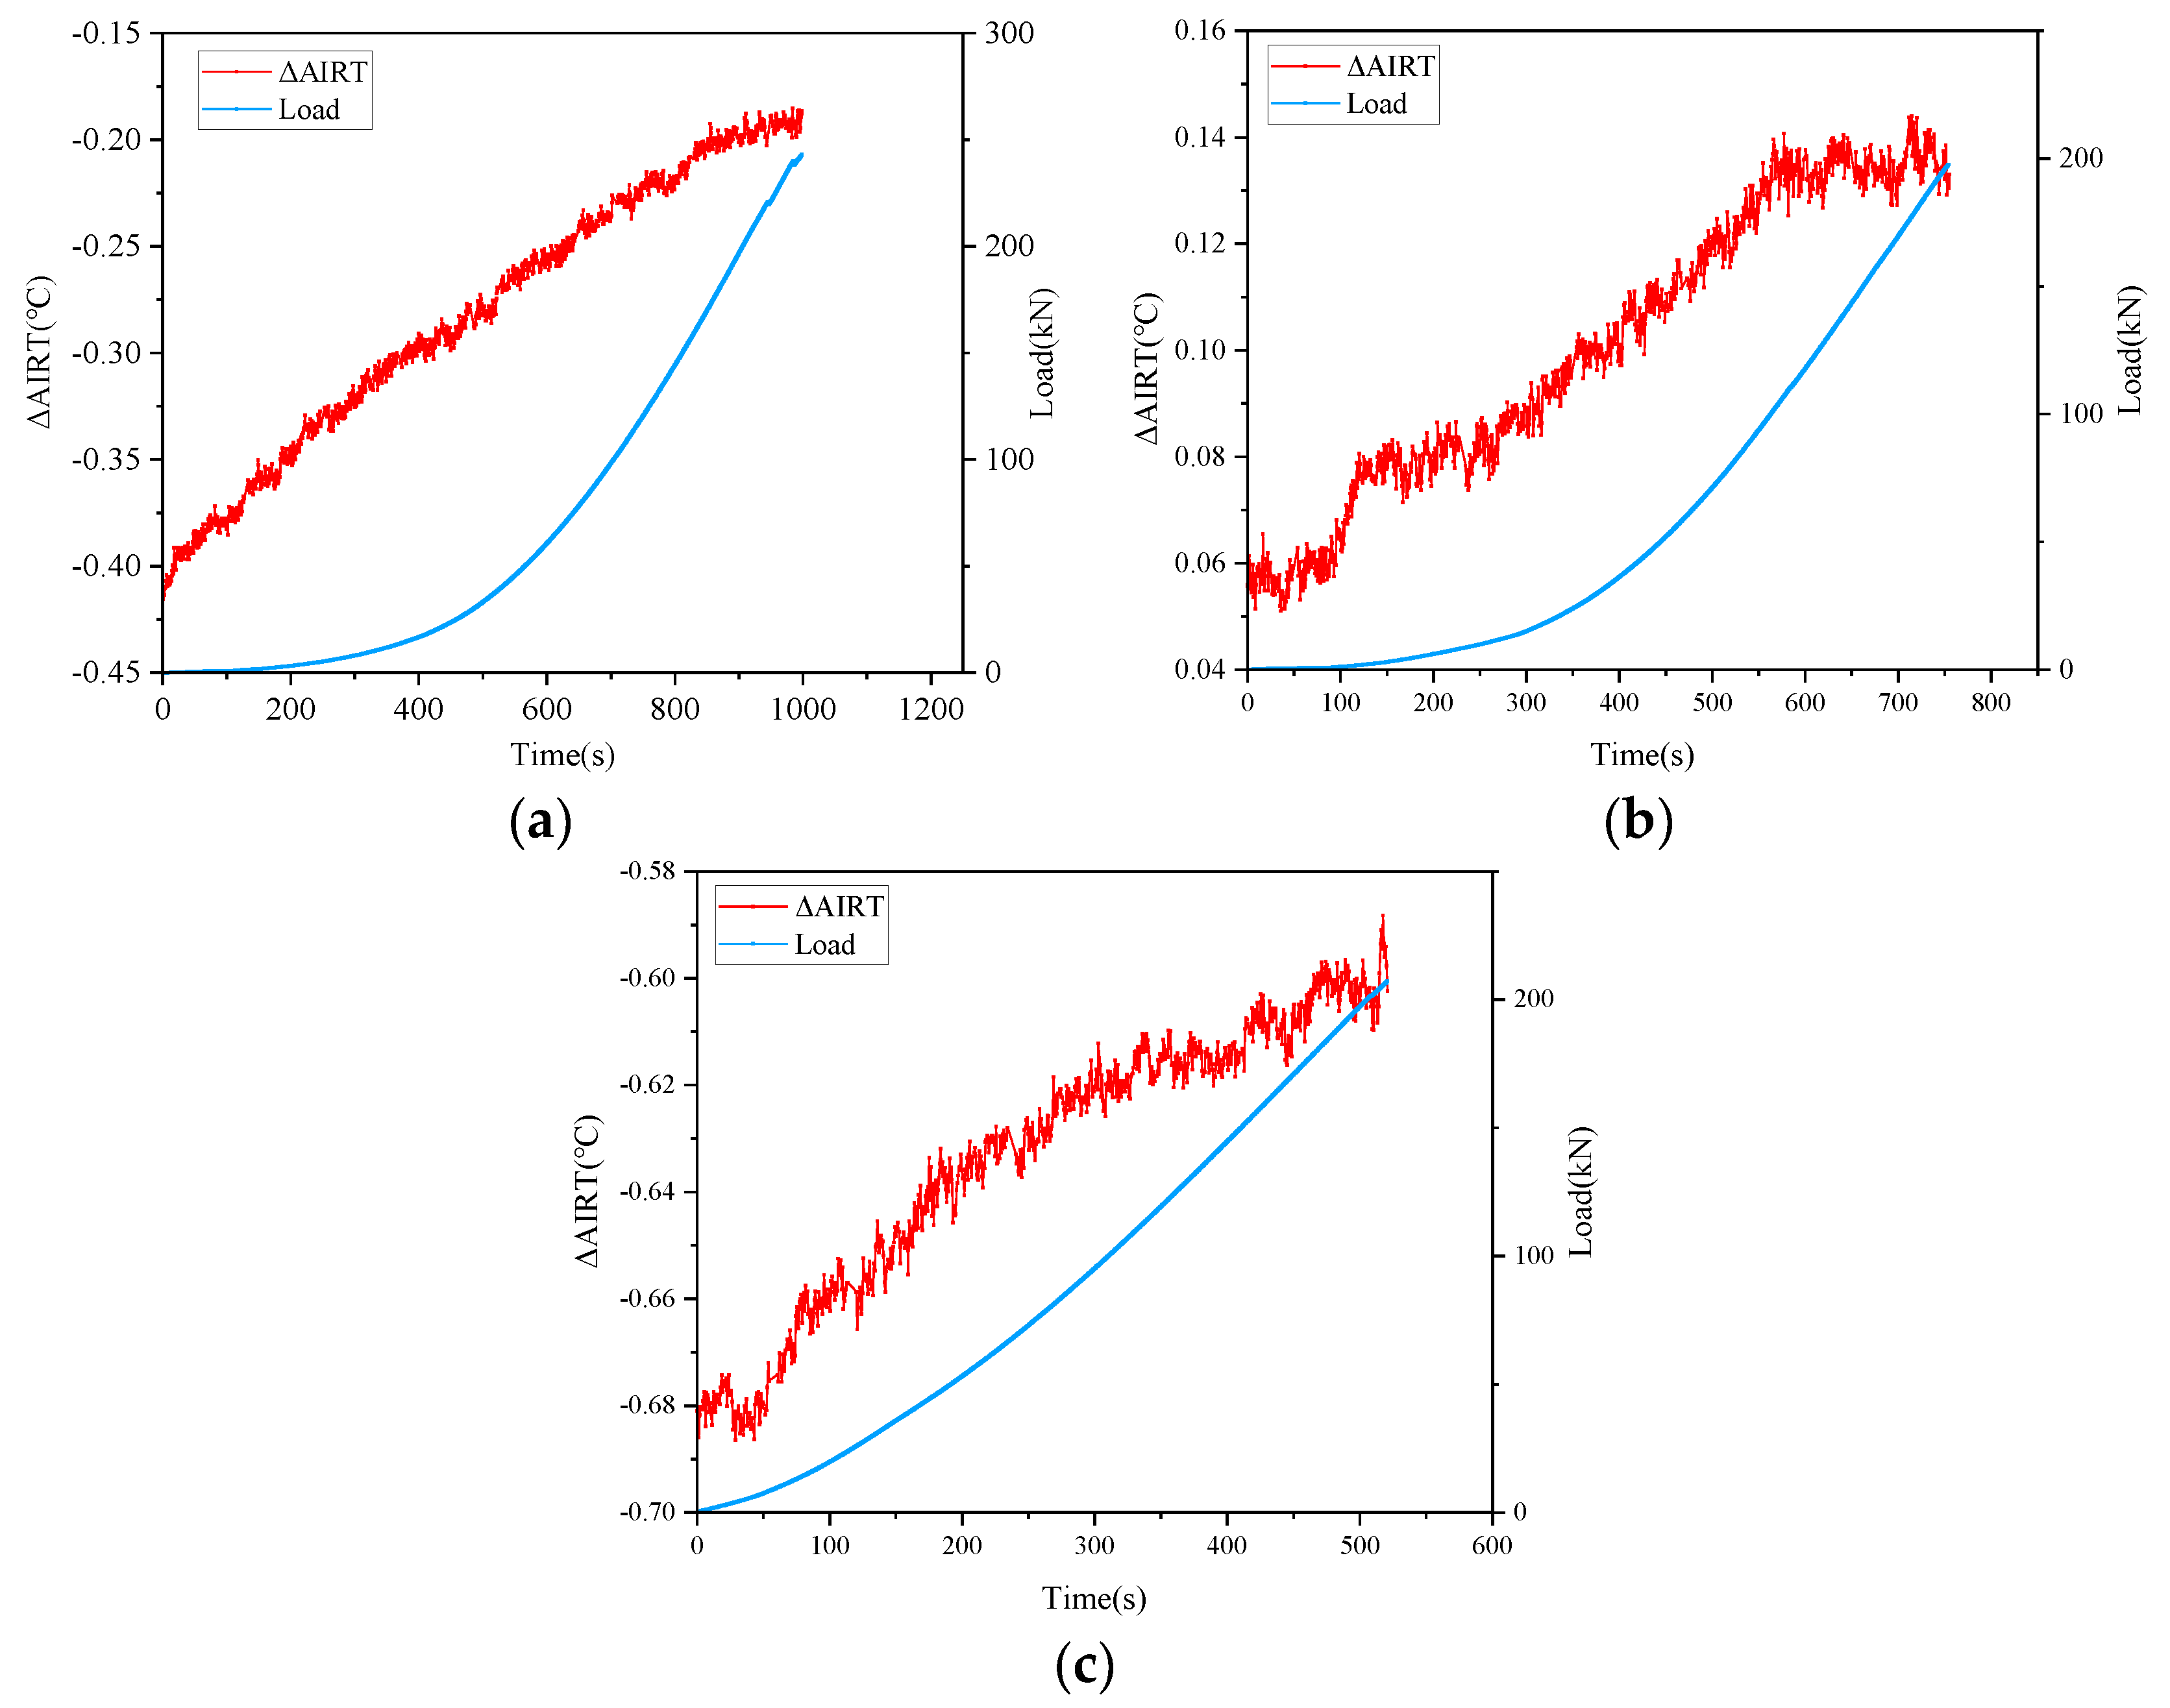
3.1. AIRT Response Characteristics of Sandstone Seepage

The loaded specimen ΔAIRT value has prominent change characteristics, mainly showing an upward-downward trend. According to the inflection point (breakpoint) of the corresponding load curve, the whole process can be divided into four stages: (I) compaction stage, (II) linear elastic stage, (III) fracture development stage, and (IV) post peak failure stage.
(1)
sample 0–1
Figure 8 depicts the ΔAIRT-load curve for sample (0–1). At 0 s, the ΔAIRT was −0.147 °C. In the compaction stage, it showed a fluctuating upward trend. The sample enters the linear elastic stage at 340.17 s, at which the corresponding load is 54.27 kN, the ΔAIRT is −0.100 °C, which is 0.047 °C higher than that at the beginning. In the elastic stage, the ΔAIRT also showed an upward trend, and the temperature rise rate was almost the same as in the previous stage. Before and after 697 s, the load curve fluctuated, decreasing from 233.32 kN to 215.96 kN. At this time, the corresponding ΔAIRT was −0.043 °C, which indicates that the sample was at the end of the linear elastic stage, and the temperature increased by 0.057 °C compared with the initial stage. In the next fracture development stage, with the increase of the load curve, the ΔAIRT begins to decrease. At 796.19 s, the load curve has a peak value. After that, it rapidly decreases, which means the beginning of the post-peak failure stage. At this time, the corresponding ΔAIRT is −0.056 °C. At 802.80 s, the end of the experiment, the load decreased to 215.86 kN, and the ΔAIRT fell to −0.059 °C.
(2)
sample 0–3
Figure 9 depicts the ΔAIRT-load curve for sample (0–3). The ΔAIRT at 0 s is 0.056 °C, it rises slowly at the compaction stage. In the range of 100.48 s to 120.35 s, ΔAIRT jumps from 0.063 °C to 0.081 °C, increasing by 0.018 °C. During this period, the load has not exceeded 2 kN, and the heat generation is caused by friction of particles in the rock sample. At 454.41 s, the bearing rock sample enters the linear elastic stage. At this time, ΔAIRT was 0.109 °C, which is 0.053 °C higher than the initial stage. In the linear elastic stage, ΔAIRT continued to rise. At 758 s, the load curve suddenly drops, and the drop amplitude reaches 13 kN. The ΔAIRT value was 0.134 °C, and the whole stage increased by 0.025 °C. The loaded rock sample thus enters the fracture development stage. In this stage, the load curve drops again at about 836 s, with a magnitude of 9 kN. At 919.91 s, the load curve reached the peak of 202.46 kN, followed by a sudden drop, which is a sign of the beginning of the post-peak failure stage. So far, the temperature drop of the whole fracture development stage is 0.057 °C. At the post-peak stage, the load curve and ΔAIRT both decreased rapidly, and the ΔAIRT fell to −0.041 °C.
(3)
sample 0.30–2
Figure 10 depicts the ΔAIRT-load curve for sample (0.30–2). The initial value of ΔAIRT was −0.671 °C. In the compaction stage (0 s~193.05 s), the load rises to 51 kN and ΔAIRT rises to −0.646 °C. In the linear elastic stage (193.05 s~524.76 s), the load curve and ΔAIRT showed a nearly linear rising trend, in which the load increased to 210.04 kN, ΔAIRT rose to −0.601 °C. During the whole fracture development stage (524.76 s~637.80 s), the load increased from 210.04 kN to 253.37 kN, which is also the peak load. During this period, the ΔAIRT was stable, and only slightly increased by 0.011 °C. After the peak of the load curve, the ΔAIRT and the load have a sudden drop trend, wherein ΔAIRT dropped to −0.773 °C, which overall decreased by 0.183 °C.
Figure 11 shows the ΔAIRT’s difference of the three samples at each stage. It revealed that in the compaction stage, the water body is confined to the interior of the rock sample. Its control effect on the ΔAIRT has not yet appeared, so the temperature change trend of the rock sample surface is dominated by the temperature rise caused by loading. In the linear elastic stage, the original fracture in the rock sample is gradually closed in the previous stage, the internal water body is difficult to seep out, so the surface temperature of the rock sample is still rising. In the fracture development stage, the internal cracks of the rock sample begin to grow, and gradually develop into macroscopic cracks, which is visible to the naked eye. The cracks begin to meet and penetrate, and the sample volume expands. In this stage, as the water begins to seep out along the developed fracture, its cooling effect on the rock sample surface begins to appear, in which 0–1 sample is cooled by 0.013 °C and 0–3 sample is cooled by 0.067 °C. Although the 0.30–2 sample still has a small temperature rise of 0.011 °C, the temperature rise trend has been significantly suppressed. In the post-peak failure stage, the load curve has decreased significantly since the macro fracture surface was formed. The water in the rock sample flows out in large quantities, resulting in a significant cooling effect. Among them, 0–1 sample is cooled by 0.003 °C, 0–3 sample is cooled by 0.118 °C, and 0.30–2 sample is cooled by 0.183 °C.
In this experiment, when the internal water pressure is not more than 0.30 MPa, the water seeps out after the crack is developed, thus causing the cooling phenomenon. When the water pressure is 0.45 MPa, the internal water body seeps out in the linear elastic stage, thus, the ΔAIRT value changes from up to down. For rock samples with a water pressure of 0.45 MPa, the analysis of ΔAIRT changes will be given in combination with IRV and VDIIT.

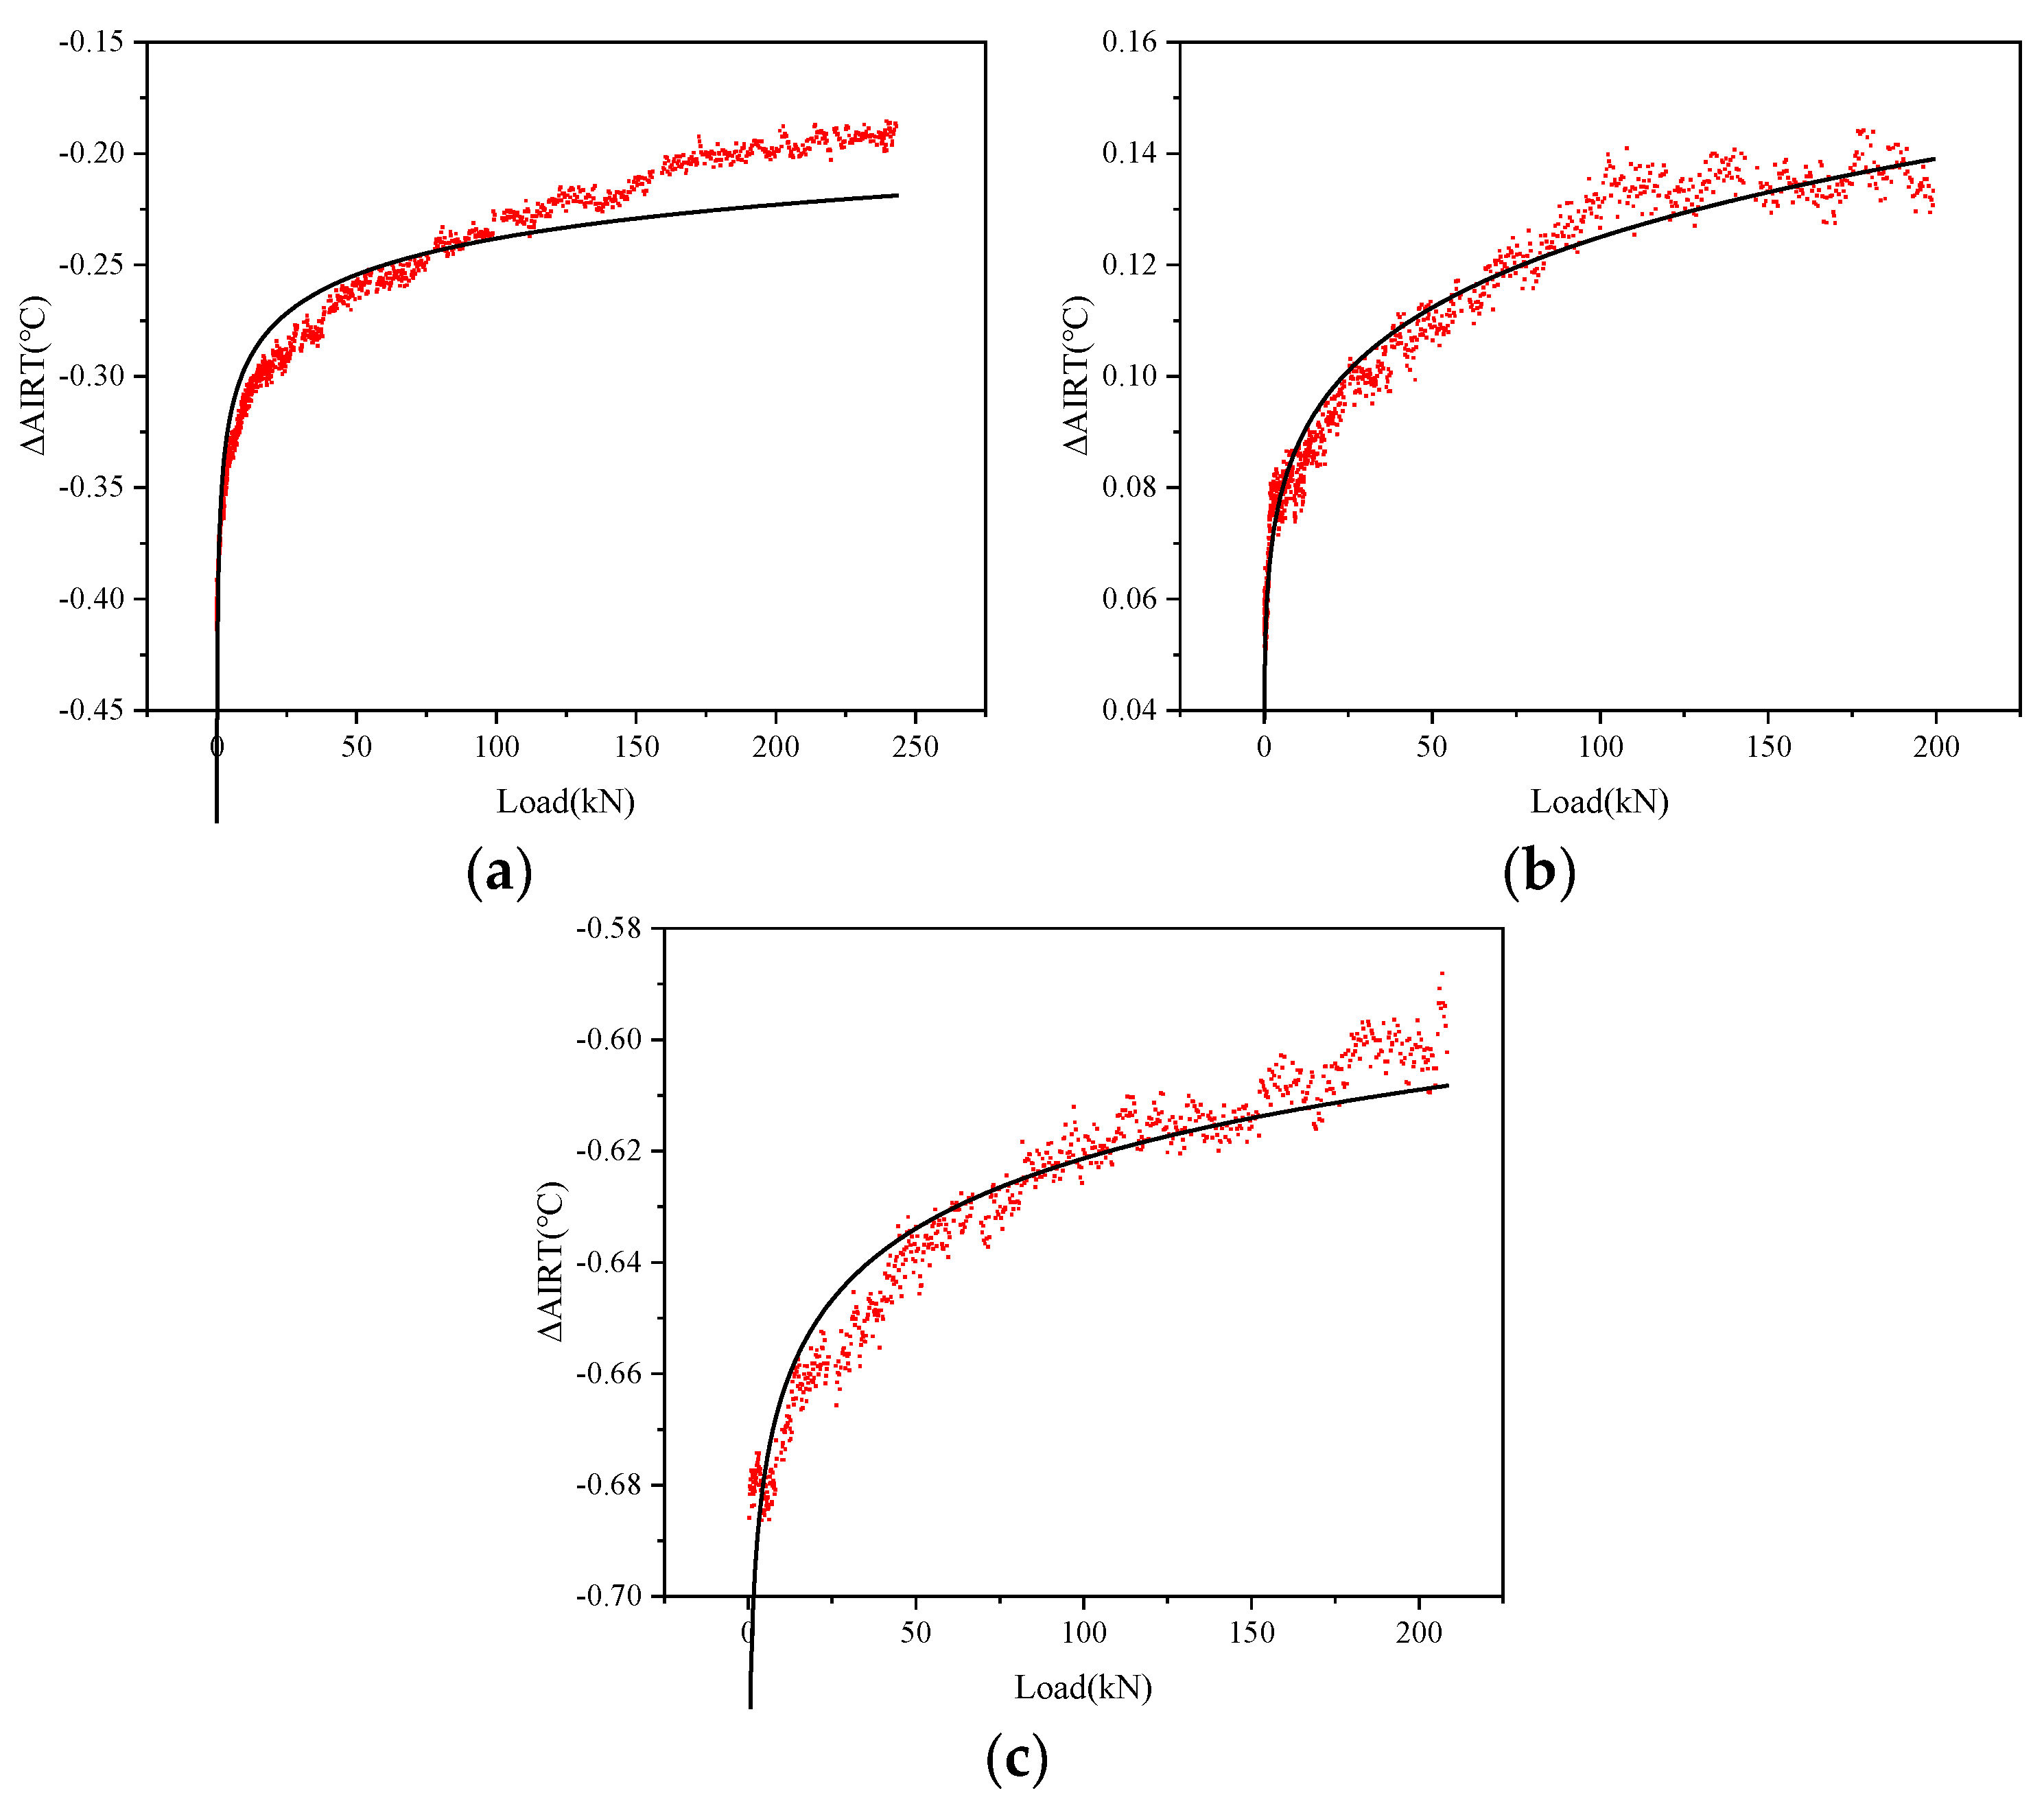
3.2. The Functional Relationship between ΔAIRT and Load before Sandstone Seepage

By plotting the ΔAIRT-load curve of each rock sample, it can be found that when the internal water pressure is not more than 0.30 MPa, the load and ΔAIRT show a certain positive relationship in the compaction stage and the linear elastic stage, that is ΔAIRT increases with the increase of load. The 0–2 sample, 0–3 sample and 0.30–2 sample with typical experimental results are selected for analysis.
To further explore the functional relationship between ΔAIRT and load in this process, the ΔAIRT and load data of these rock samples in the compaction and linear elastic stages can be extracted. The function fitting can be performed according to the time parameters as shown in Figure 12. After several fitting times of, it was found that the trend of the power function model is consistent with the corresponding relationship point. The functional expression of ΔAIRT and load (L) is:
Δ AIRT = a L b
where, ΔAIRT is the average infrared radiation temperature difference (°C), L is the axial load (kN), a and b are coefficients.
Figure 13 depicts a fitting curve of ΔAIRT-load of each sample. The maximum standard deviation of the fit curve for each sample is only 0.06429, and the minimum value of the function correlation coefficient is 0.8924, which indicates that the model selection and fit effect are ideal. The details about each sample are given in Table 4.

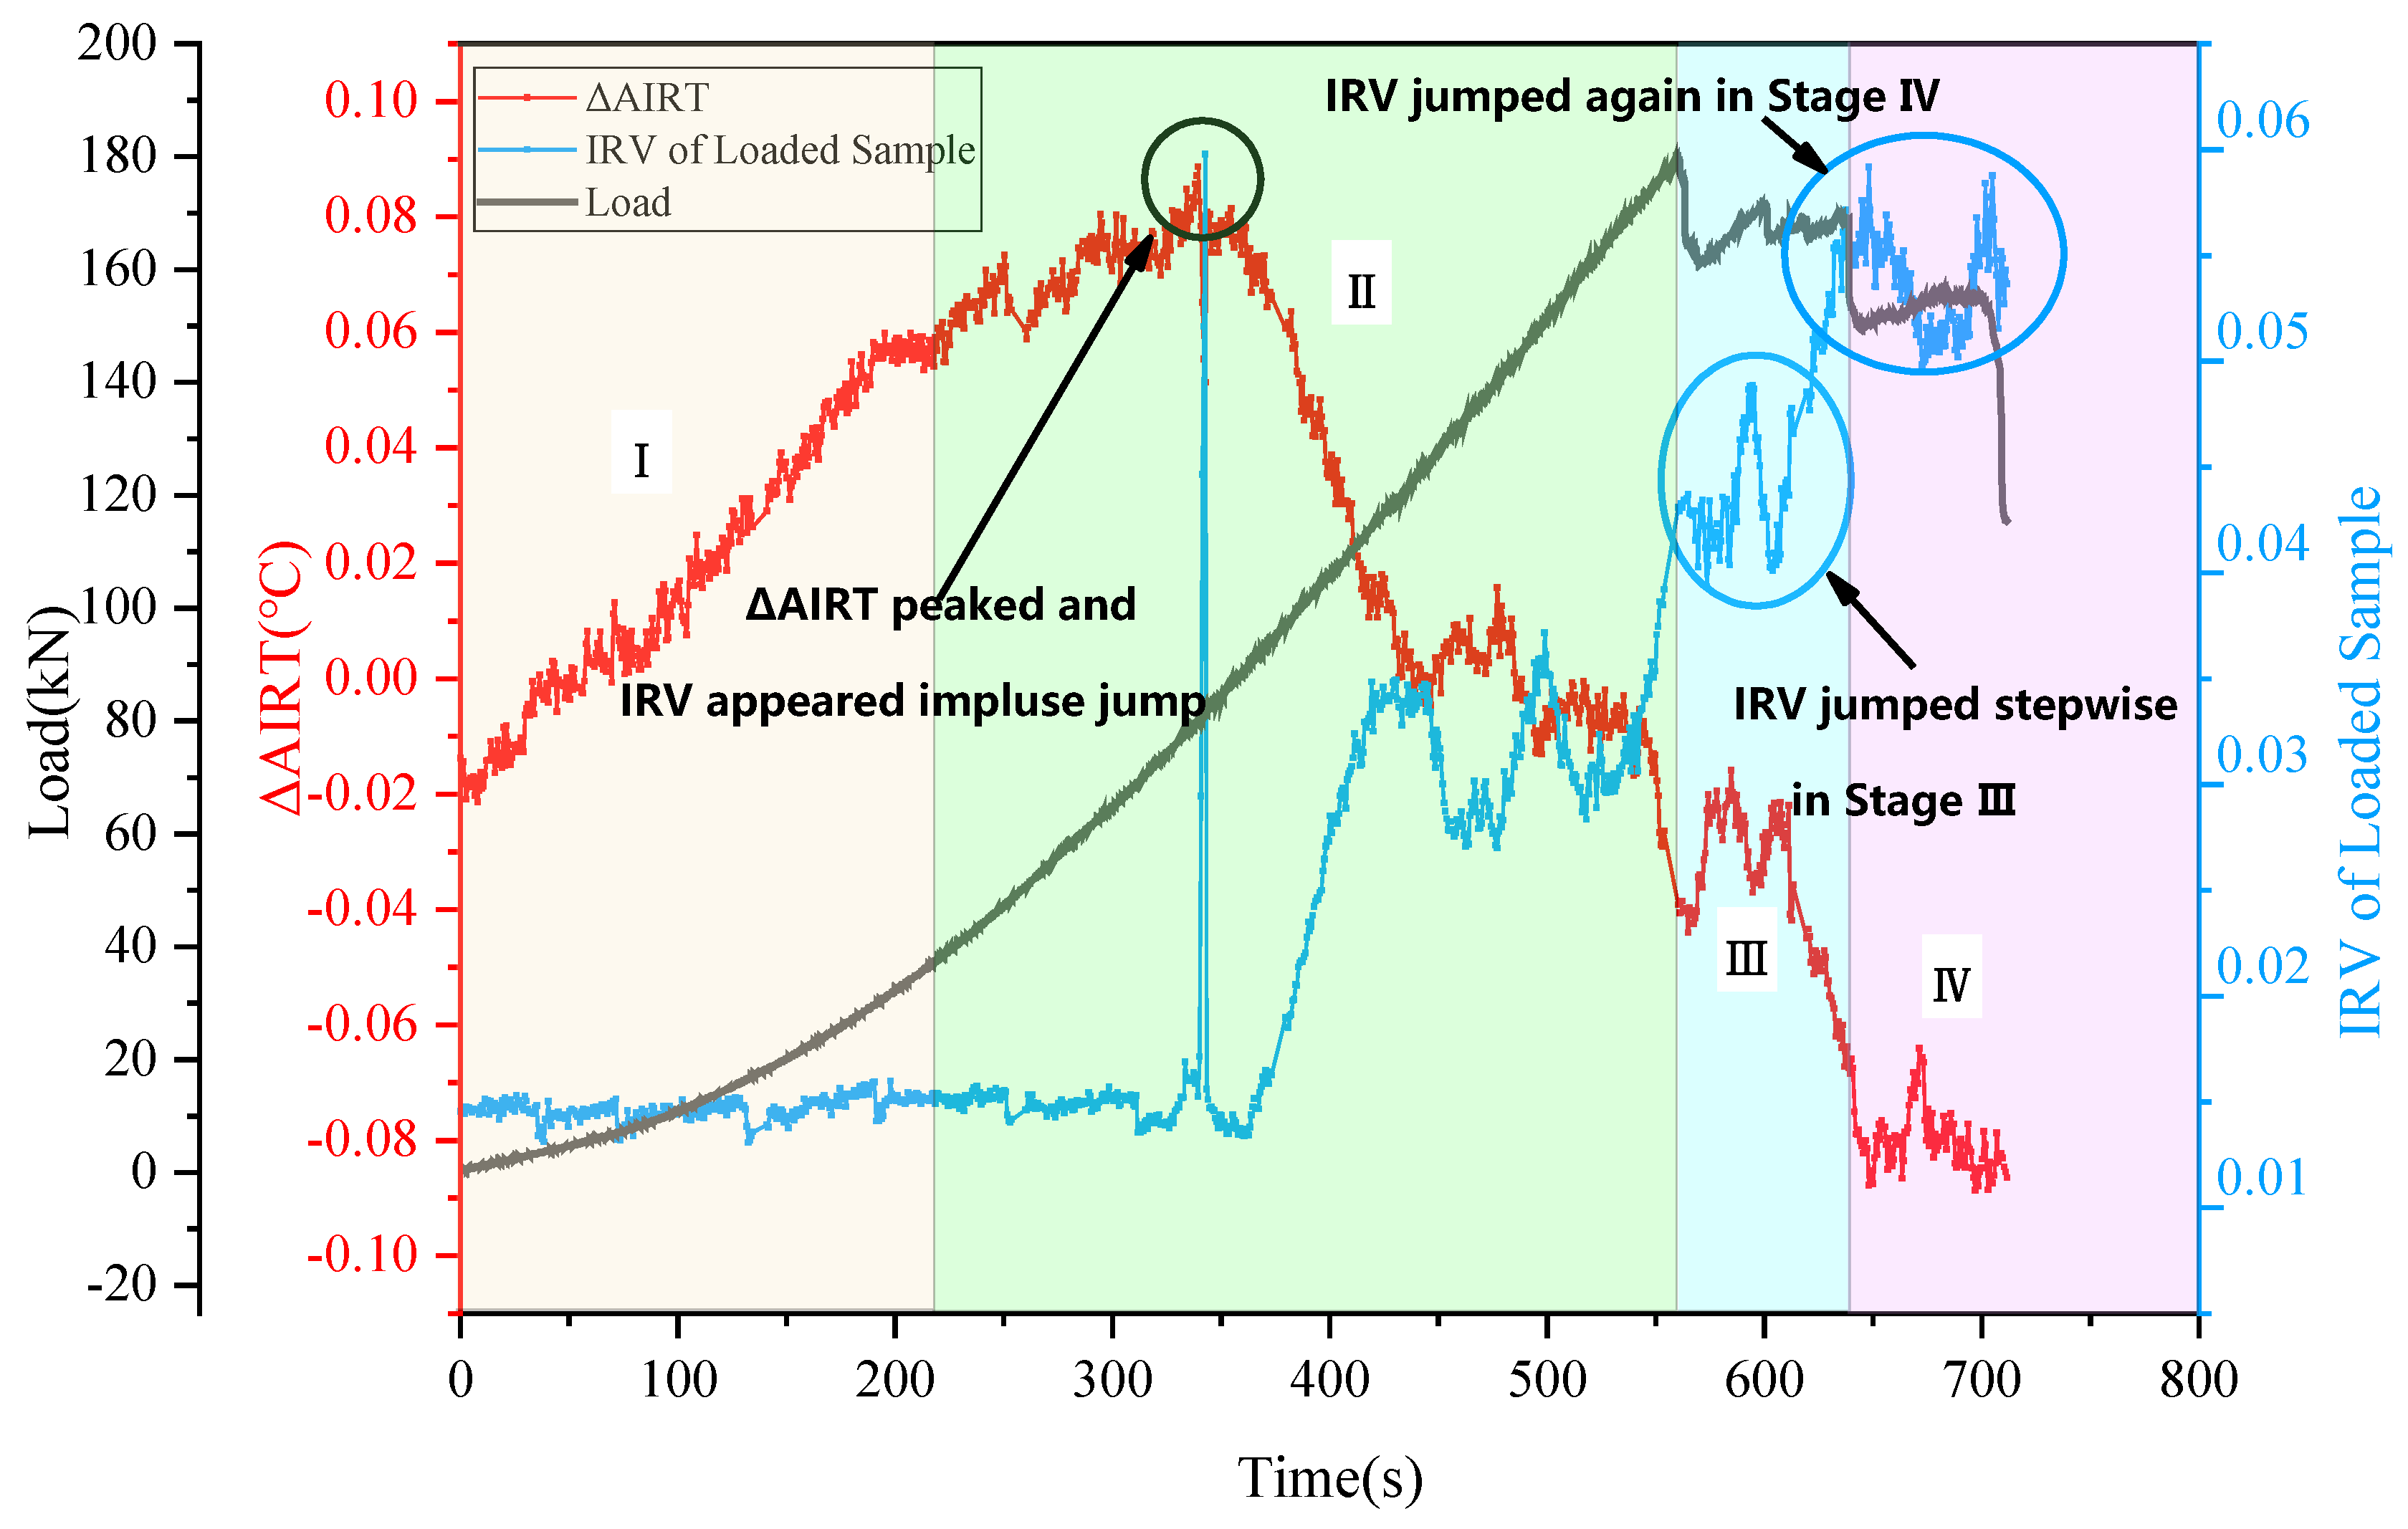
3.3. IRV Response Characteristics of Sandstone Seepage

Figure 14 depicts the ΔAIRT-load-IRV curve of 0.45–2 sample. It revealed that in the compaction stage (0 s−217.15 s), the ΔAIRT of 0.45–2 sample shows an upward trend, rising from −0.013 °C to 0.057 °C, increasing by 0.070 °C, and the corresponding load curve bends upward to 36.98 kN. As the water body inside the rock sample has not yet seeped out, the control effect on the surface temperature of the rock sample has not yet appeared. The temperature change trend is mainly dominated by the temperature rise caused by uniaxial loading, and the IRV has been stable between 0.013 and 0.016.
Under 0.45 MPa water pressure, the water in the rock sample escapes and seeps through the original fissures in the rock and the micro pores between the particles around 340 s (see Figure 15). At the same time, the load value reached 80.41 kN, and remained in a linear rising state, while the AIRT and IRV curves exhibited significant changes. For example, at 339.47 s, the AIRT curve attained a peak value of 0.089 °C before beginning to fall. At 338.81 s, the IRV remained stable at 0.016, but at 342.78 s, the IRV pulse jumped at 0.060 before returning to 0.015 at 343.44 s. It can be seen that when the water pressure is strong (enough to cause a water seepage point and form a water seepage surface in a short time), the inflection point of ΔAIRT from rising to falling and the pulse type jump peak of IRV can be used as an early warning signal for water seepage (water inrush) of rock samples.
After water seepage (water inrush) of rock samples, the ΔAIRT value drops rapidly. During the period from 339.47 s to 560.24 s, the ΔAIRT decreased from the peak value of 0.089 °C to −0.039 °C, and the cooling range was as high as 0.128 °C. While the IRV also increased from 0.015 to about 0.034 and maintained stable instability. During this period, the load curve has been in a linear rising state, reaching 179.46 kN at the end of the stage.
In the fracture development stage (560.24 s–638.80 s), IRV appears a step-type jump compared with the previous stage. In the later stage of the last linear elastic stage, IRV was once stable at around 0.034. Though the appearance of first peak of the load curve, the IRV curve rises rapidly, and remains constant at about 0.045 at this stage. This can be understood that the IRV response characteristics of the rock samples entering the fracture development stage. During this period, the load curve decreased from 179.46 kN to about 165.42 kN, and ΔAIRT was still in a downward trend.
In the post-peak failure stage (638.80 s–711.71 s), IRV continued to rise in stages. IRV, which was previously stable at 0.045 in the fracture development stage, rose rapidly to 0.055 and maintained a stable fluctuation trend. During this period, the load curve reached the peak of 168.61 kN and began to drop, while the ΔAIRT value was stable at −0.079 °C.
Figure 15 is an image recording of water seepage of the 0.45–2 sample before and after 340 s. The rock sample’s observation surface is dry at 338 s, and a wet water point appears at the upper part of the rock sample, that is, the water seepage point. The seepage point is the starting point of the seepage process. After the water seepage, the wet area centered on the water seepage point began to expand. With time, it mainly expanded to the lower part of the rock sample and rapidly formed water droplets to slide down, which also affected the changes in ΔAIRT curve and IRV curve.

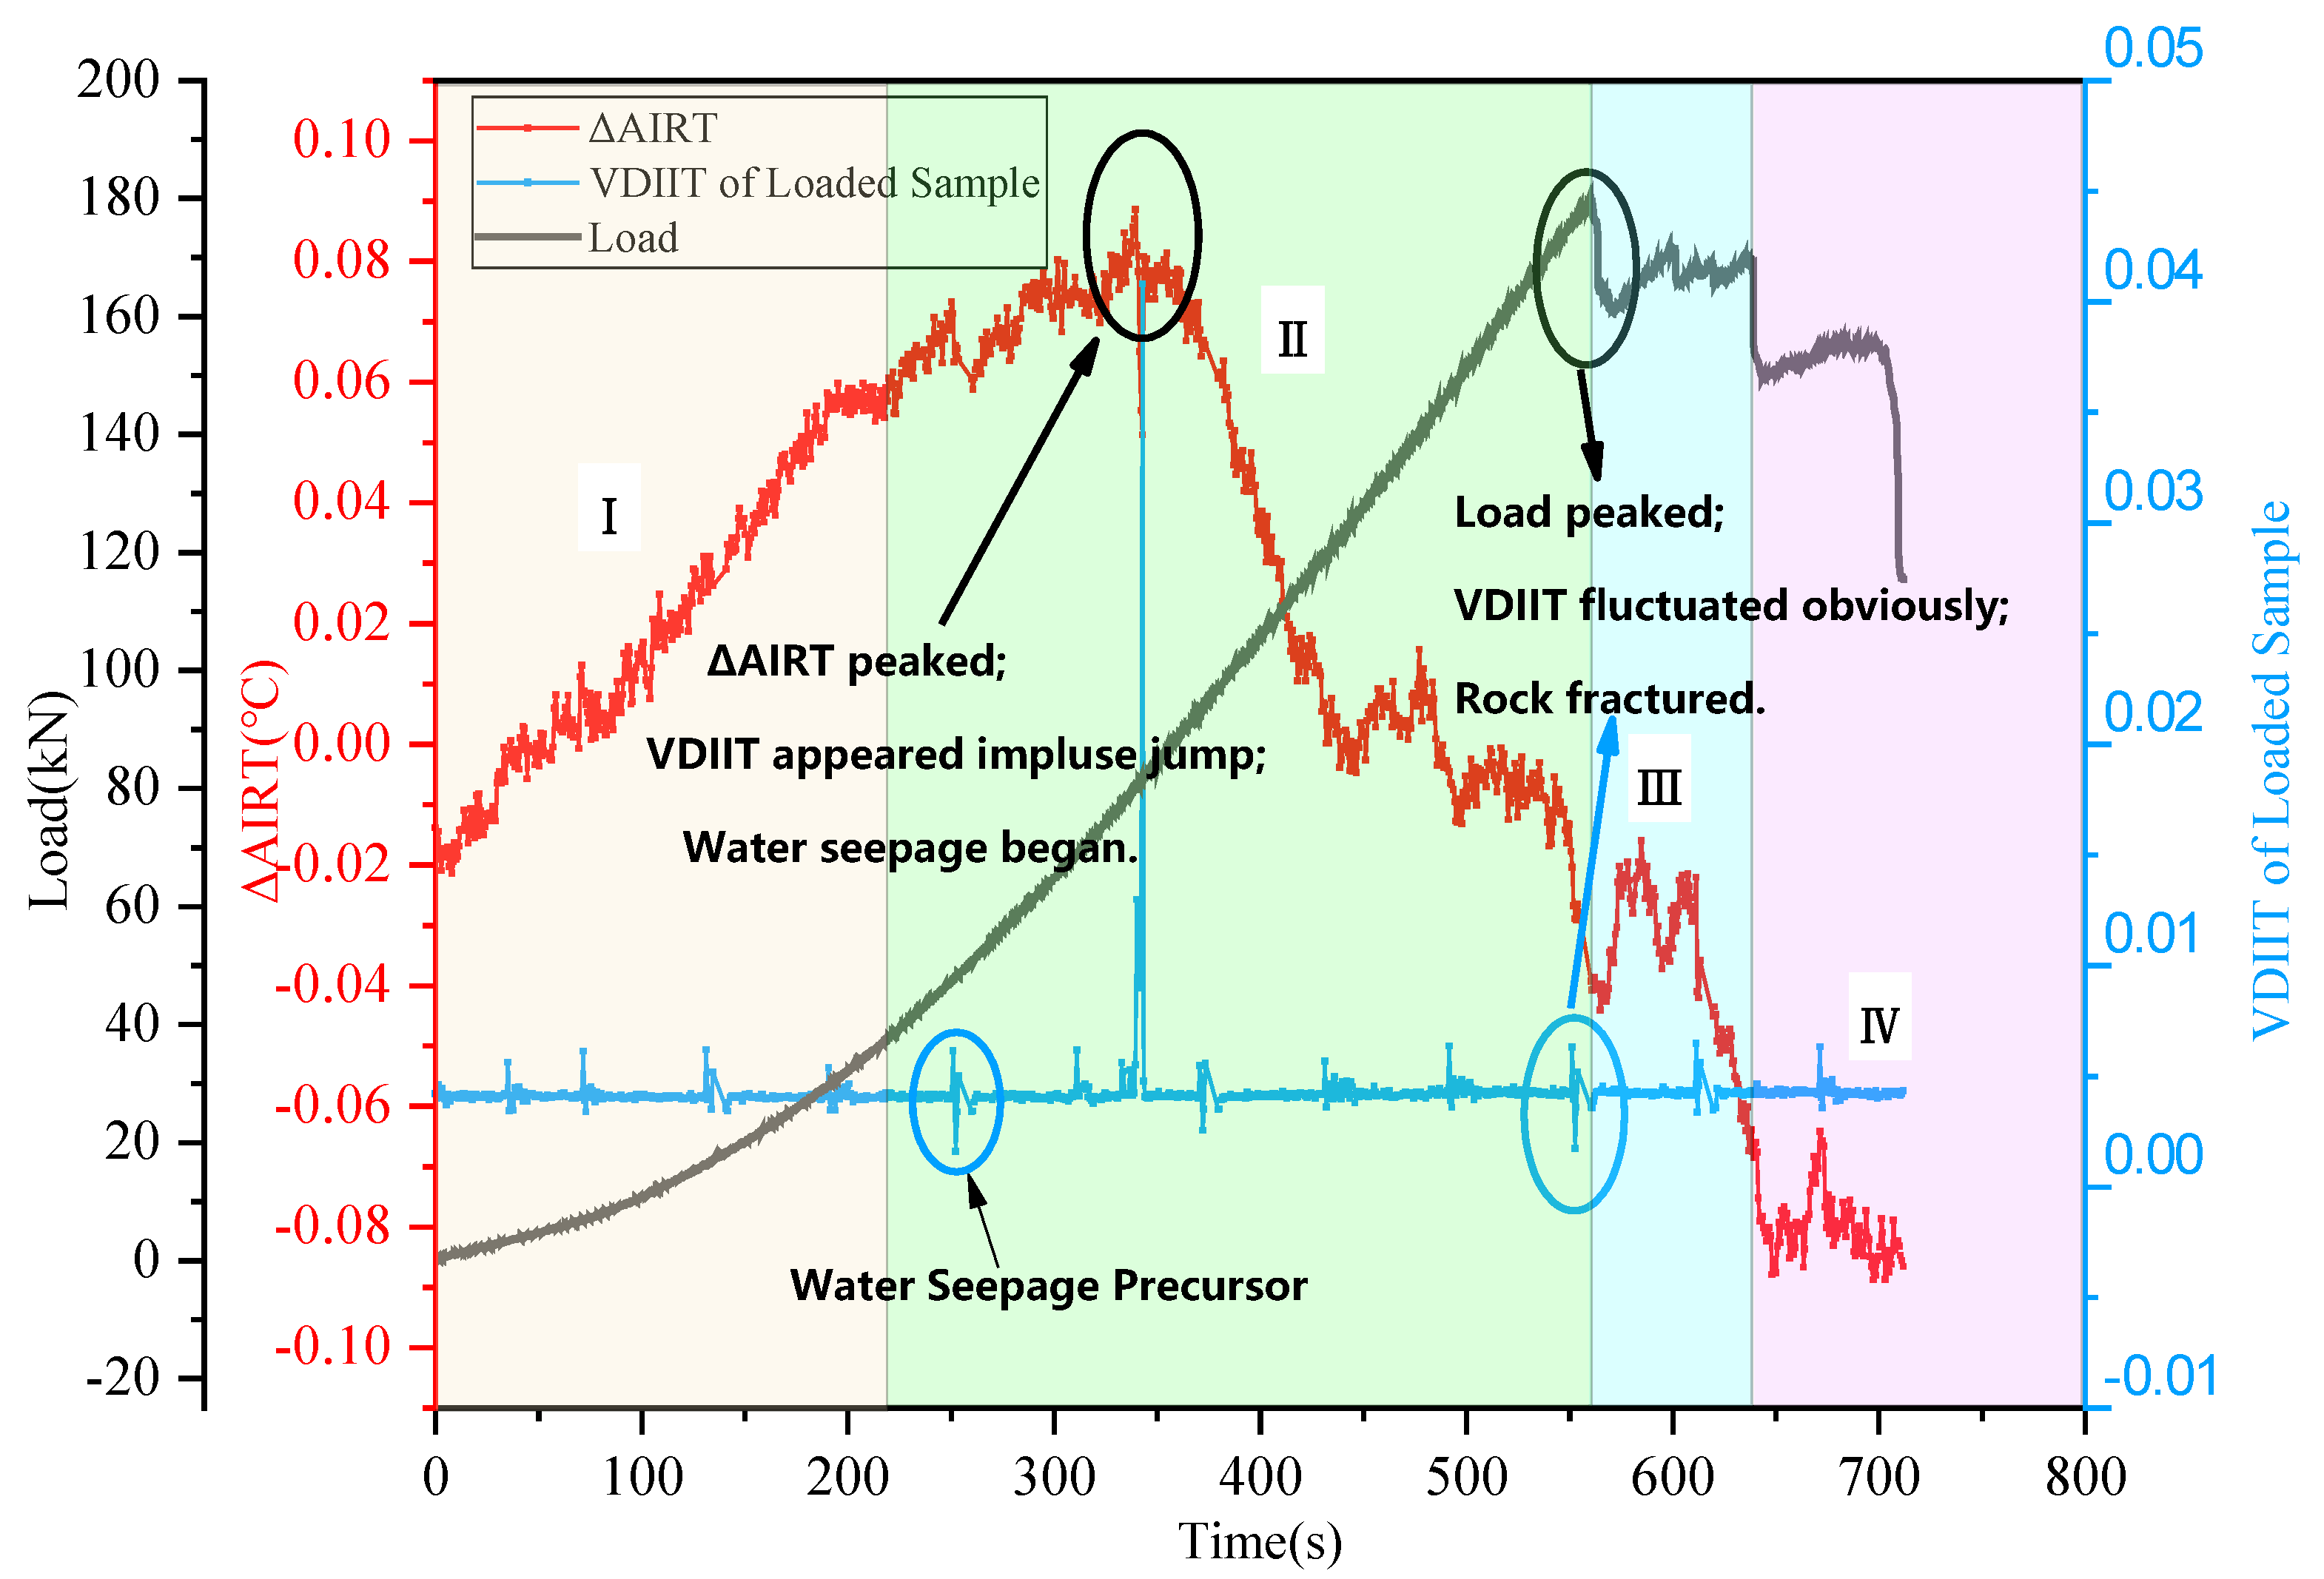
3.4. VDIIT Response Characteristics of Sandstone Seepage

Figure 16 is the ΔAIRT-load-VDIIT curve of the 0.45–2 sample. Figure 16 revealed the VDIIT of this rock sample is always around 0.0040 in the early stage of the experiment. However, between 250.20 s and 252.28 s, VDIIT jumped from 0.0040 to 0.0062, and then rapidly decreased to 0.0016. This point can be used as a precursor of water seepage of rock samples. After a development period, VDIIT suddenly increased to 0.0130 at 340.13 s, then jumped to 0.0408 at 342.78 s. This time point also corresponds to the inflection point of AIRT from rising to falling and the water seepage phenomenon, as shown in Figure 15.
The VDIIT also shows abnormal fluctuation when the rock sample breaks and water seep. At 551.27 s, VDIIT jumps from 0.0043 of the previous frame to 0.0063, then drops to 0.0017 at 552.60 s. It can be seen from the image records that this time point corresponds to the macro crack development and fracture water seepage process of the rock, as shown in Figure 17.
Figure 17 shows the macro crack development and fracture in the water seepage process of 0.45–2 sample before and after 552 s. At 551 s, longitudinal cracks appeared in the middle of the rock sample observation surface, and water flowed out at the lower part. At 552 s, a VDIIT fluctuated when longitudinal water seepage growth also appeared, at the left of the center upper part. Over time (555 s–560 s), the two seepage zones developed, expanded, and penetrated each other, forming a Y-shaped macro fracture. During this period, the ΔAIRT also rapidly decreased to 0.013 °C.
In order to reflect the mutation characteristics of VDIIT of the sample, the mutation threshold of VDIIT is determined based on the Pauta Criterion, and the discrimination criteria can be calculated using Equation (7).
ε μ > 3 σ
where: ε is the VDIIT value, μ is the average value of VDIIT, σ is the standard deviation of VDIIT. The infrared radiation threshold is μ ± 3 σ .
For example, the Sandstone sample 0.45–2 mutation threshold of VDIIT of the sandstone sample based on Pauta Criterion is 0.00798. It can be seen from Figure 16 that the VDIIT index based on the Pauta Criterion can effectively identify the VDIIT mutation in the process of water seepage (water inrush), which can be used as an early warning of disasters. Table 5 shows the mutation threshold statistics of all sandstone samples. The average value of the upper threshold of the mutation threshold is 0.00627, the maximum value is 0.00798, and the minimum value is 0.00559. When water seepage (water inrush) occurs in the rock, the difference in the infrared radiation temperature matrix increases, which makes VDIIT suddenly increase. Therefore, when identifying VDIIT mutations, it is only necessary to consider the upper threshold. In the application process, the minimum value of mutation threshold 0.00559 should be taken as the early warning threshold to ensure the accuracy of early warning.

4. Discussion

The rock, before uniaxial loading, contains a certain amount of pores, air and water. In the process of uniaxial loading, the internal stress of rock mass will increase, accompanied by pore compression, crack development, fracture and water seepage.The coupling effect of water pressure and stress leads to rock mass fracture, and the crack development will promote the seepage of water in the rock. The change of energy (ΔE) on the rock surface under coupled stress-hydro effect mainly includes the following five parts:
ΔE = ΔE1 + ΔE2 + ΔE3 + ΔE4 + ΔE5
ΔE1 is energy that the gas escape process carries in the primary pore. It has been confirmed through laser Raman spectroscopy analysis technology that CH4, CO2, O2 and other gases are in most rocks’ pores [75]. Before the pores are damaged, the internal gas exists in the interior or surface of the pores in a free or adsorbed state. Under the action of external load, the pores are compressed or even destroyed, resulting in the escape of internal gas. In the process of gas escape, some energy will be taken away. Therefore, generally, ΔE1 < 0.
ΔE2 is the energy generated by friction heat generation. In the rock’s interior, the friction behavior will occur between the pores, fractures, joints and rock particles developed in all directions. Two factors affect the friction heat generation process: the positive pressure on the contact surface and the friction coefficient. When the friction coefficient is constant, the greater the normal stress on the contact surface, the greater the friction force, and the more work is done to overcome the friction force in the process of crack and particle sliding, thus causing the temperature of the contact surface to rise, so ΔE2 > 0.
ΔE3 is the energy generated by the thermoelastic effect. The change of temperature rise of the loaded sample is in direct proportion to the change of stress, and the expression is:
ΔT/T = K0Δσ
where: T is the absolute temperature of the solid unit; ΔT is the temperature change; Δσ is the variation of the principal stress sum, and K0 is the thermal elastic coefficient.
In the process of uniaxial loading, the principal stress increases with loading, so the sample temperature rises, ΔE3 > 0.
ΔE4 is the heat generated by the expansion of original pores, fractures, and joints in the rock and the development of new fractures. With the increase of external load, internal pores and joints will shrink and close. With further loading, the pores will collapse, and the original fractures and joints will further expand, penetrate and merge, accompanied by new fractures. The increase of heat accompanies this process, so ΔE4 > 0.
ΔE5 is the energy loss caused by the water body escaping. With the development, expansion, and penetration of rock fracture, the water in the sample begins to seep out. Water’s specific heat capacity and thermal inertia are larger than rock’s. The water has an evaporation effect, the temperature of water under the same conditions is lower than that of surrounding objects, and the water seepage part shows an obvious low-temperature area in the thermal image. With the increase of water seepage, the temperature of rock sample decreases continuously, so ΔE5 < 0.
The whole process of the experiment, includes the above five energy changes. With the difference in stress state, damage degree and other conditions of rock samples, the five changes work together to cause the rise and fall of rock sample temperature.
In the process of fracture and water seepage caused by rock mass compression, the seepage of water in the rock mass will lead to a decrease in infrared radiation temperature, while the thermal elastic effect, friction thermal effect, and crack propagation thermal effect will lead to the increase of infrared radiation temperature in the rock mass. Because the temperature drop of water seepage is higher than the temperature rise of rock fracture, the infrared radiation temperature of the rock will drop rapidly when the rock is near the fracture seepage. Infrared radiation has a strong sensitivity to water, which also provides the feasibility for monitoring the rock water seepage (water inrush) of underground engineering with infrared radiation.
Figure 15 and Figure 17 show the whole process of sandstone before (fracture and water seepage) and after macro fracture development and water seepage, respectively. The microcracks on the surface of rock samples under uniaxial loading are mainly tensile cracks. For example, the microcracks on the surface of rock 0.45–2 sample first appear in the middle and late stages of loading, and gradually expand with the increase of stress, eventually forming large-scale fracture and water seepage. The authors believe this is related to the fact that the sandstone selected in this test is hard brittle sandstone. Hard rock has no obvious post-peak stage than soft rock samples such as mudstone. It is generally destroyed immediately after the peak strength, accompanied by sound. The hard rock stress-strain curves show a rapid decline after the peak stress. This type of rock strength is higher than soft rock. Most rock samples are axially split; the failure surface is nearly parallel to the axial tension failure. The specimen will not be damaged immediately after axial splitting, but also has a certain bearing capacity until a through tensile failure crack is formed in the rock. However, the water seepage in the rock sample impacts the rock’s failure form; that is, a small number of rock samples appear shear microcracks on the surface in the middle and late stages of loading, and then the water seeps out along the shear microcracks. This is because the water seepage in the rock sample has a lubricating effect on the rock particles, reduces the friction force of particle crystals for friction sliding, and thus promotes the growth of primary cracks and the generation of new cracks (tensile cracks and shear cracks). The propagation of primary cracks can induce the generation of new cracks, and local damage is easy to occur, eventually leading to shear microcracks in a few rock samples. However, the seepage effect of water in the rock mass is affected by the rock mass microstructure. The rock microstructure in different areas of underground engineering is different, even in different regions of the same rock. In future research, the authors will further study the seepage effect of water in the rock mass and the corresponding infrared radiation characteristics, in combination with the microstructure characteristics of the rock mass to finally realize the monitoring and early warning of water seepage (water inrush) in underground engineering.

5. Conclusions

To explore the infrared radiation changes in the process of sandstone fracture and water seepage and determine the corresponding infrared radiation warning threshold, this study designed the infrared radiation observation experiment of sandstone failure seepage under the coupled stress-hydro effect and evaluated the corresponding relationship among load, AIRT, IRV, and VDIIT during the experiment. The following conclusions were drawn:
(1)
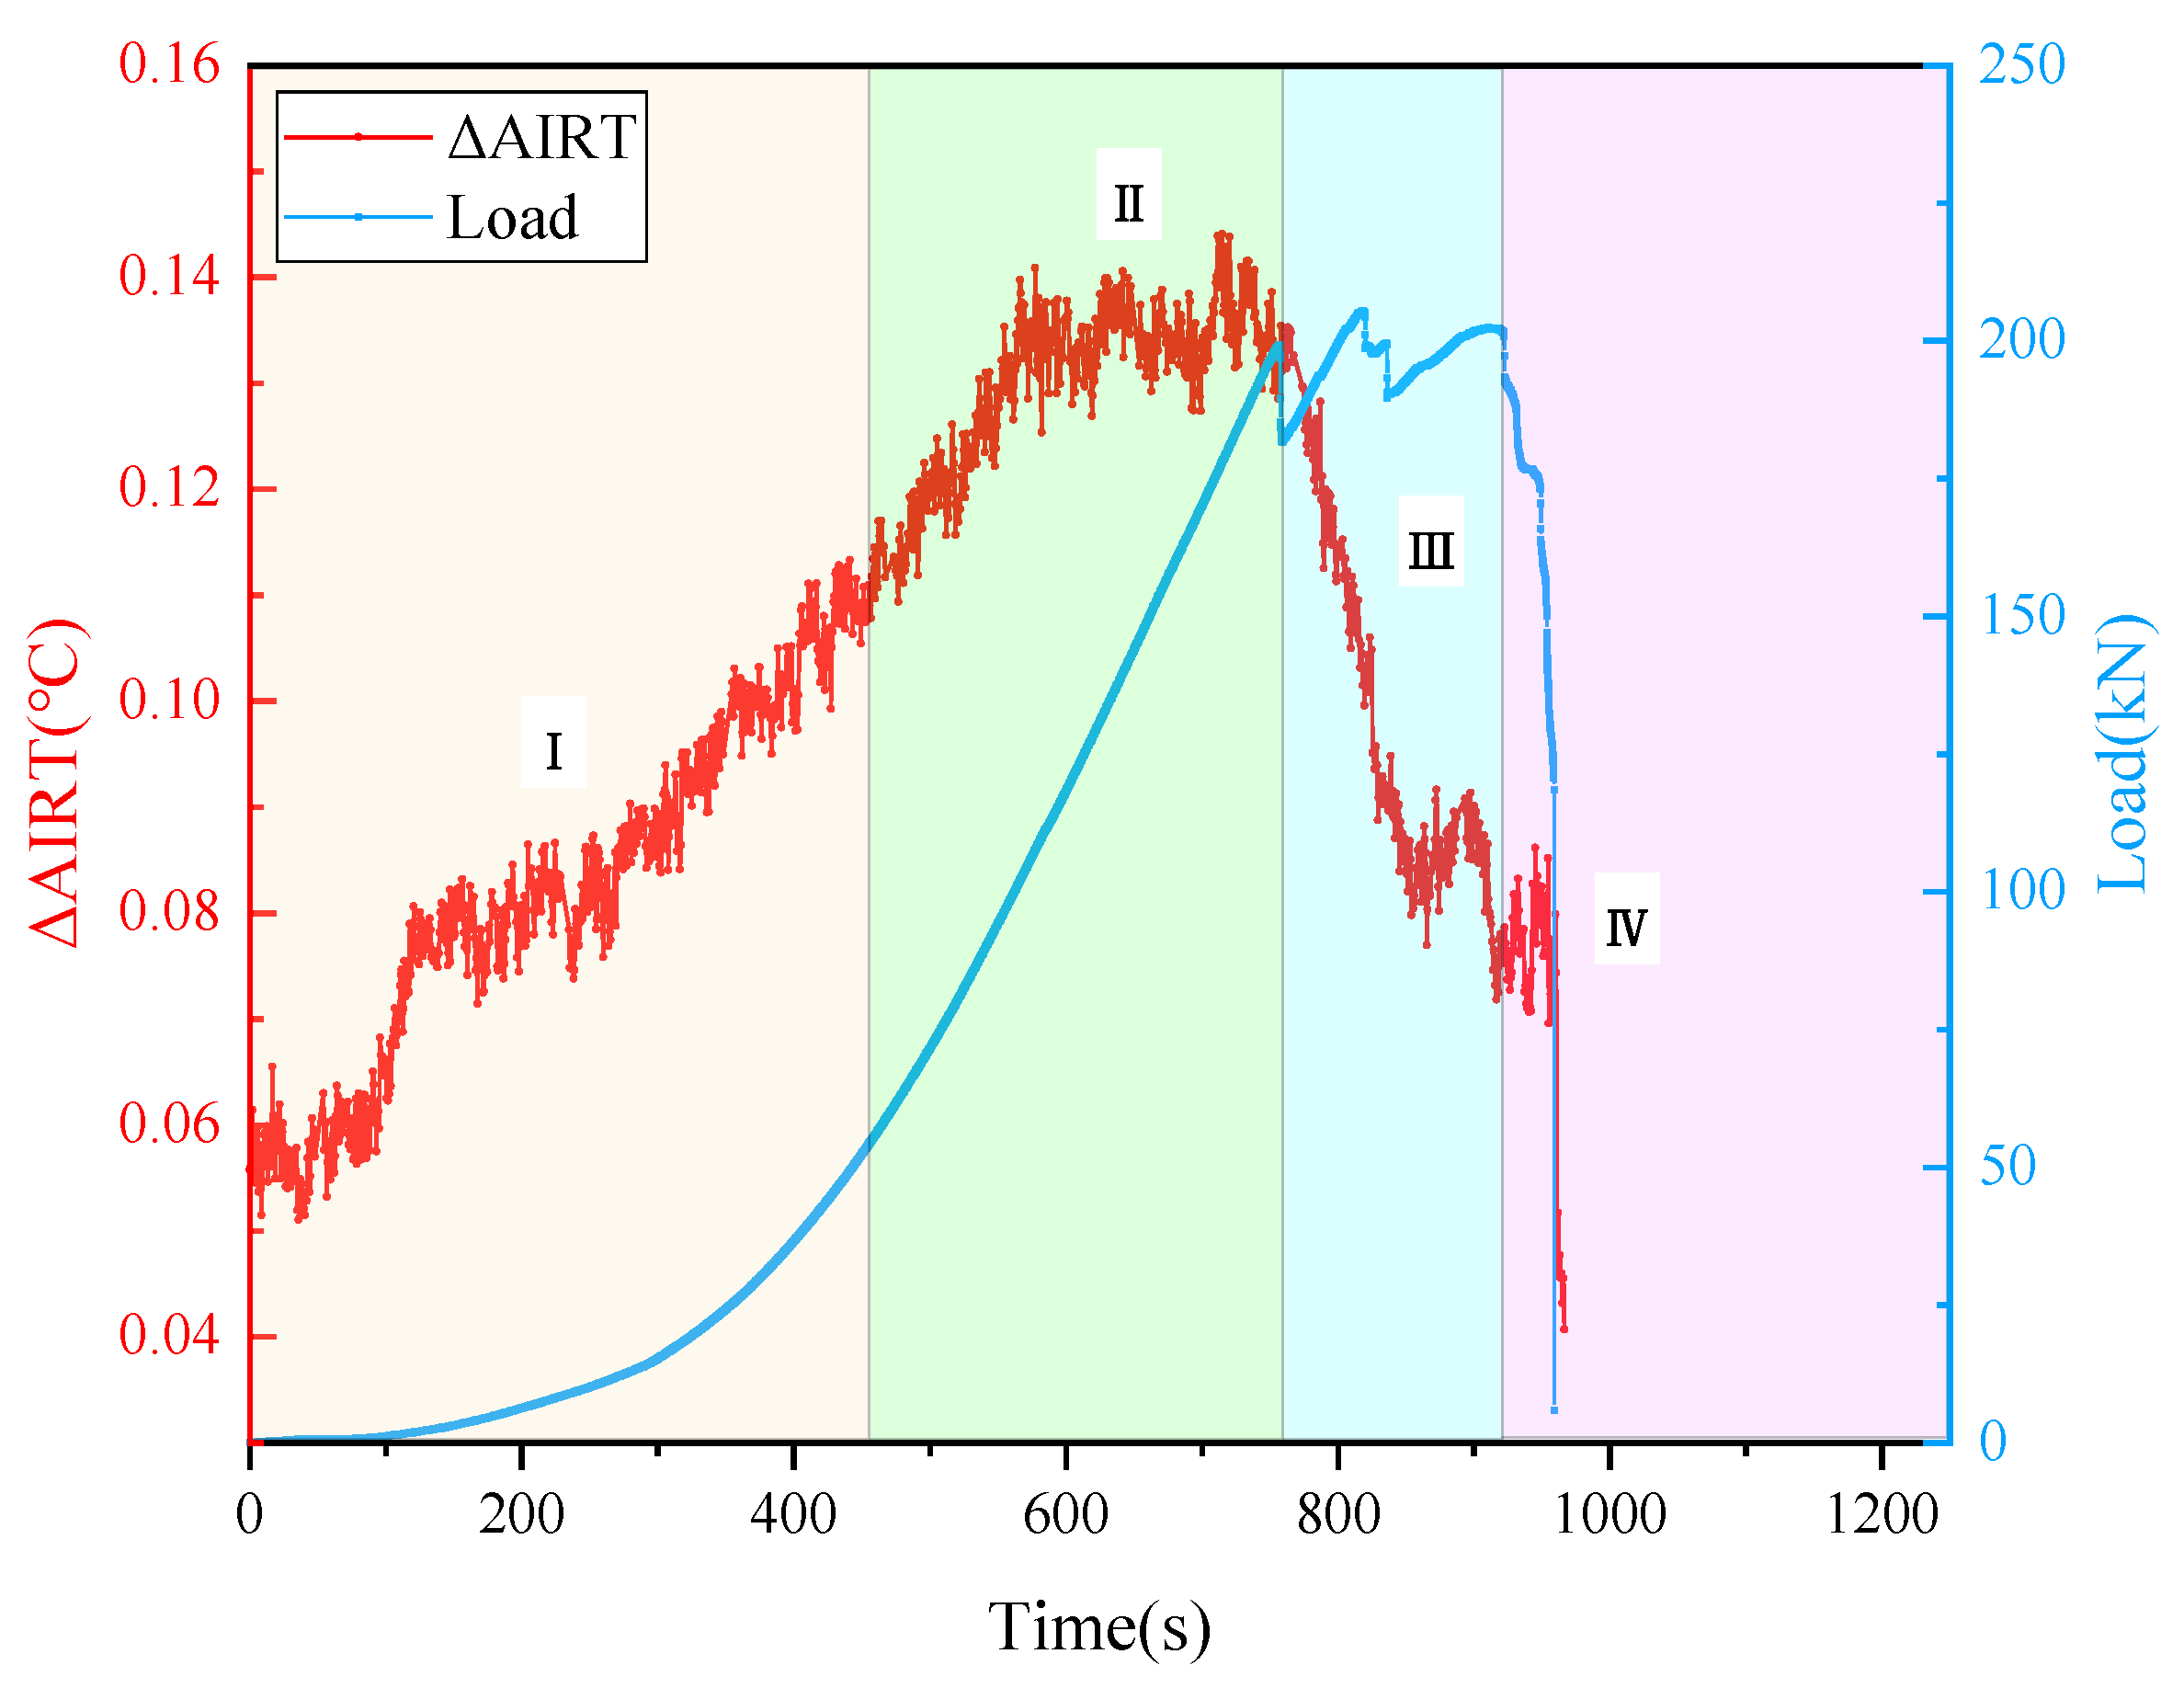
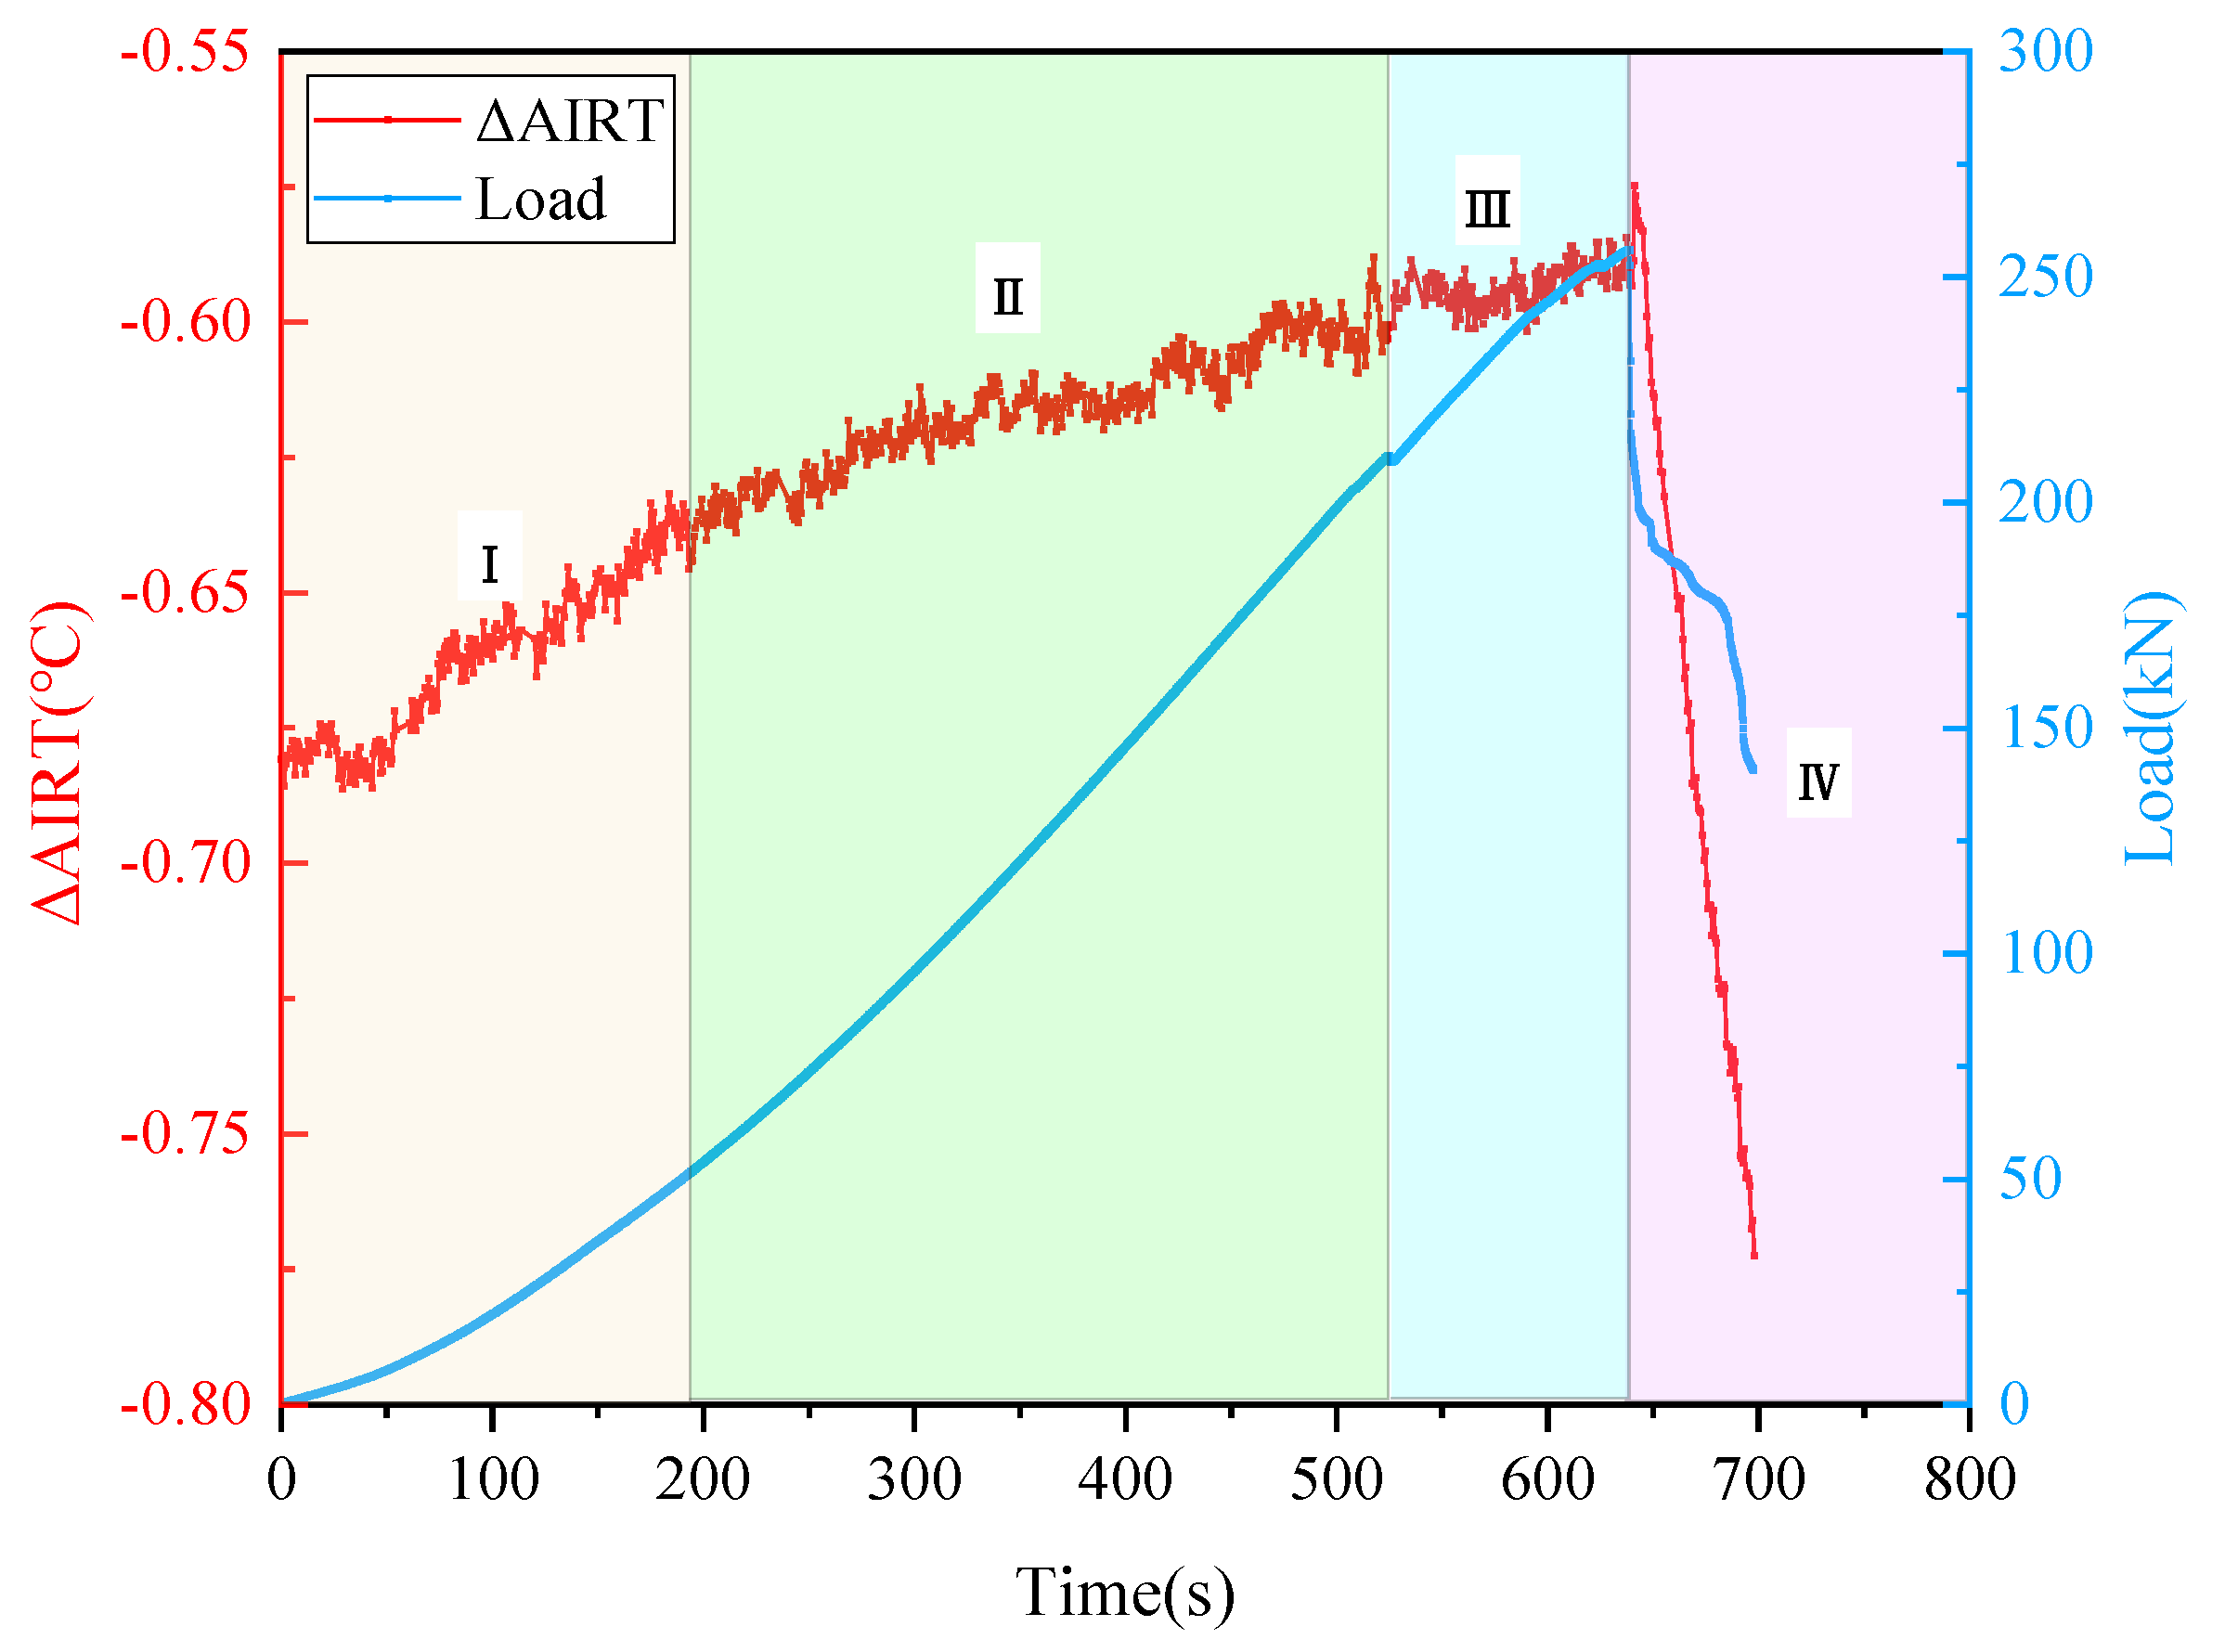
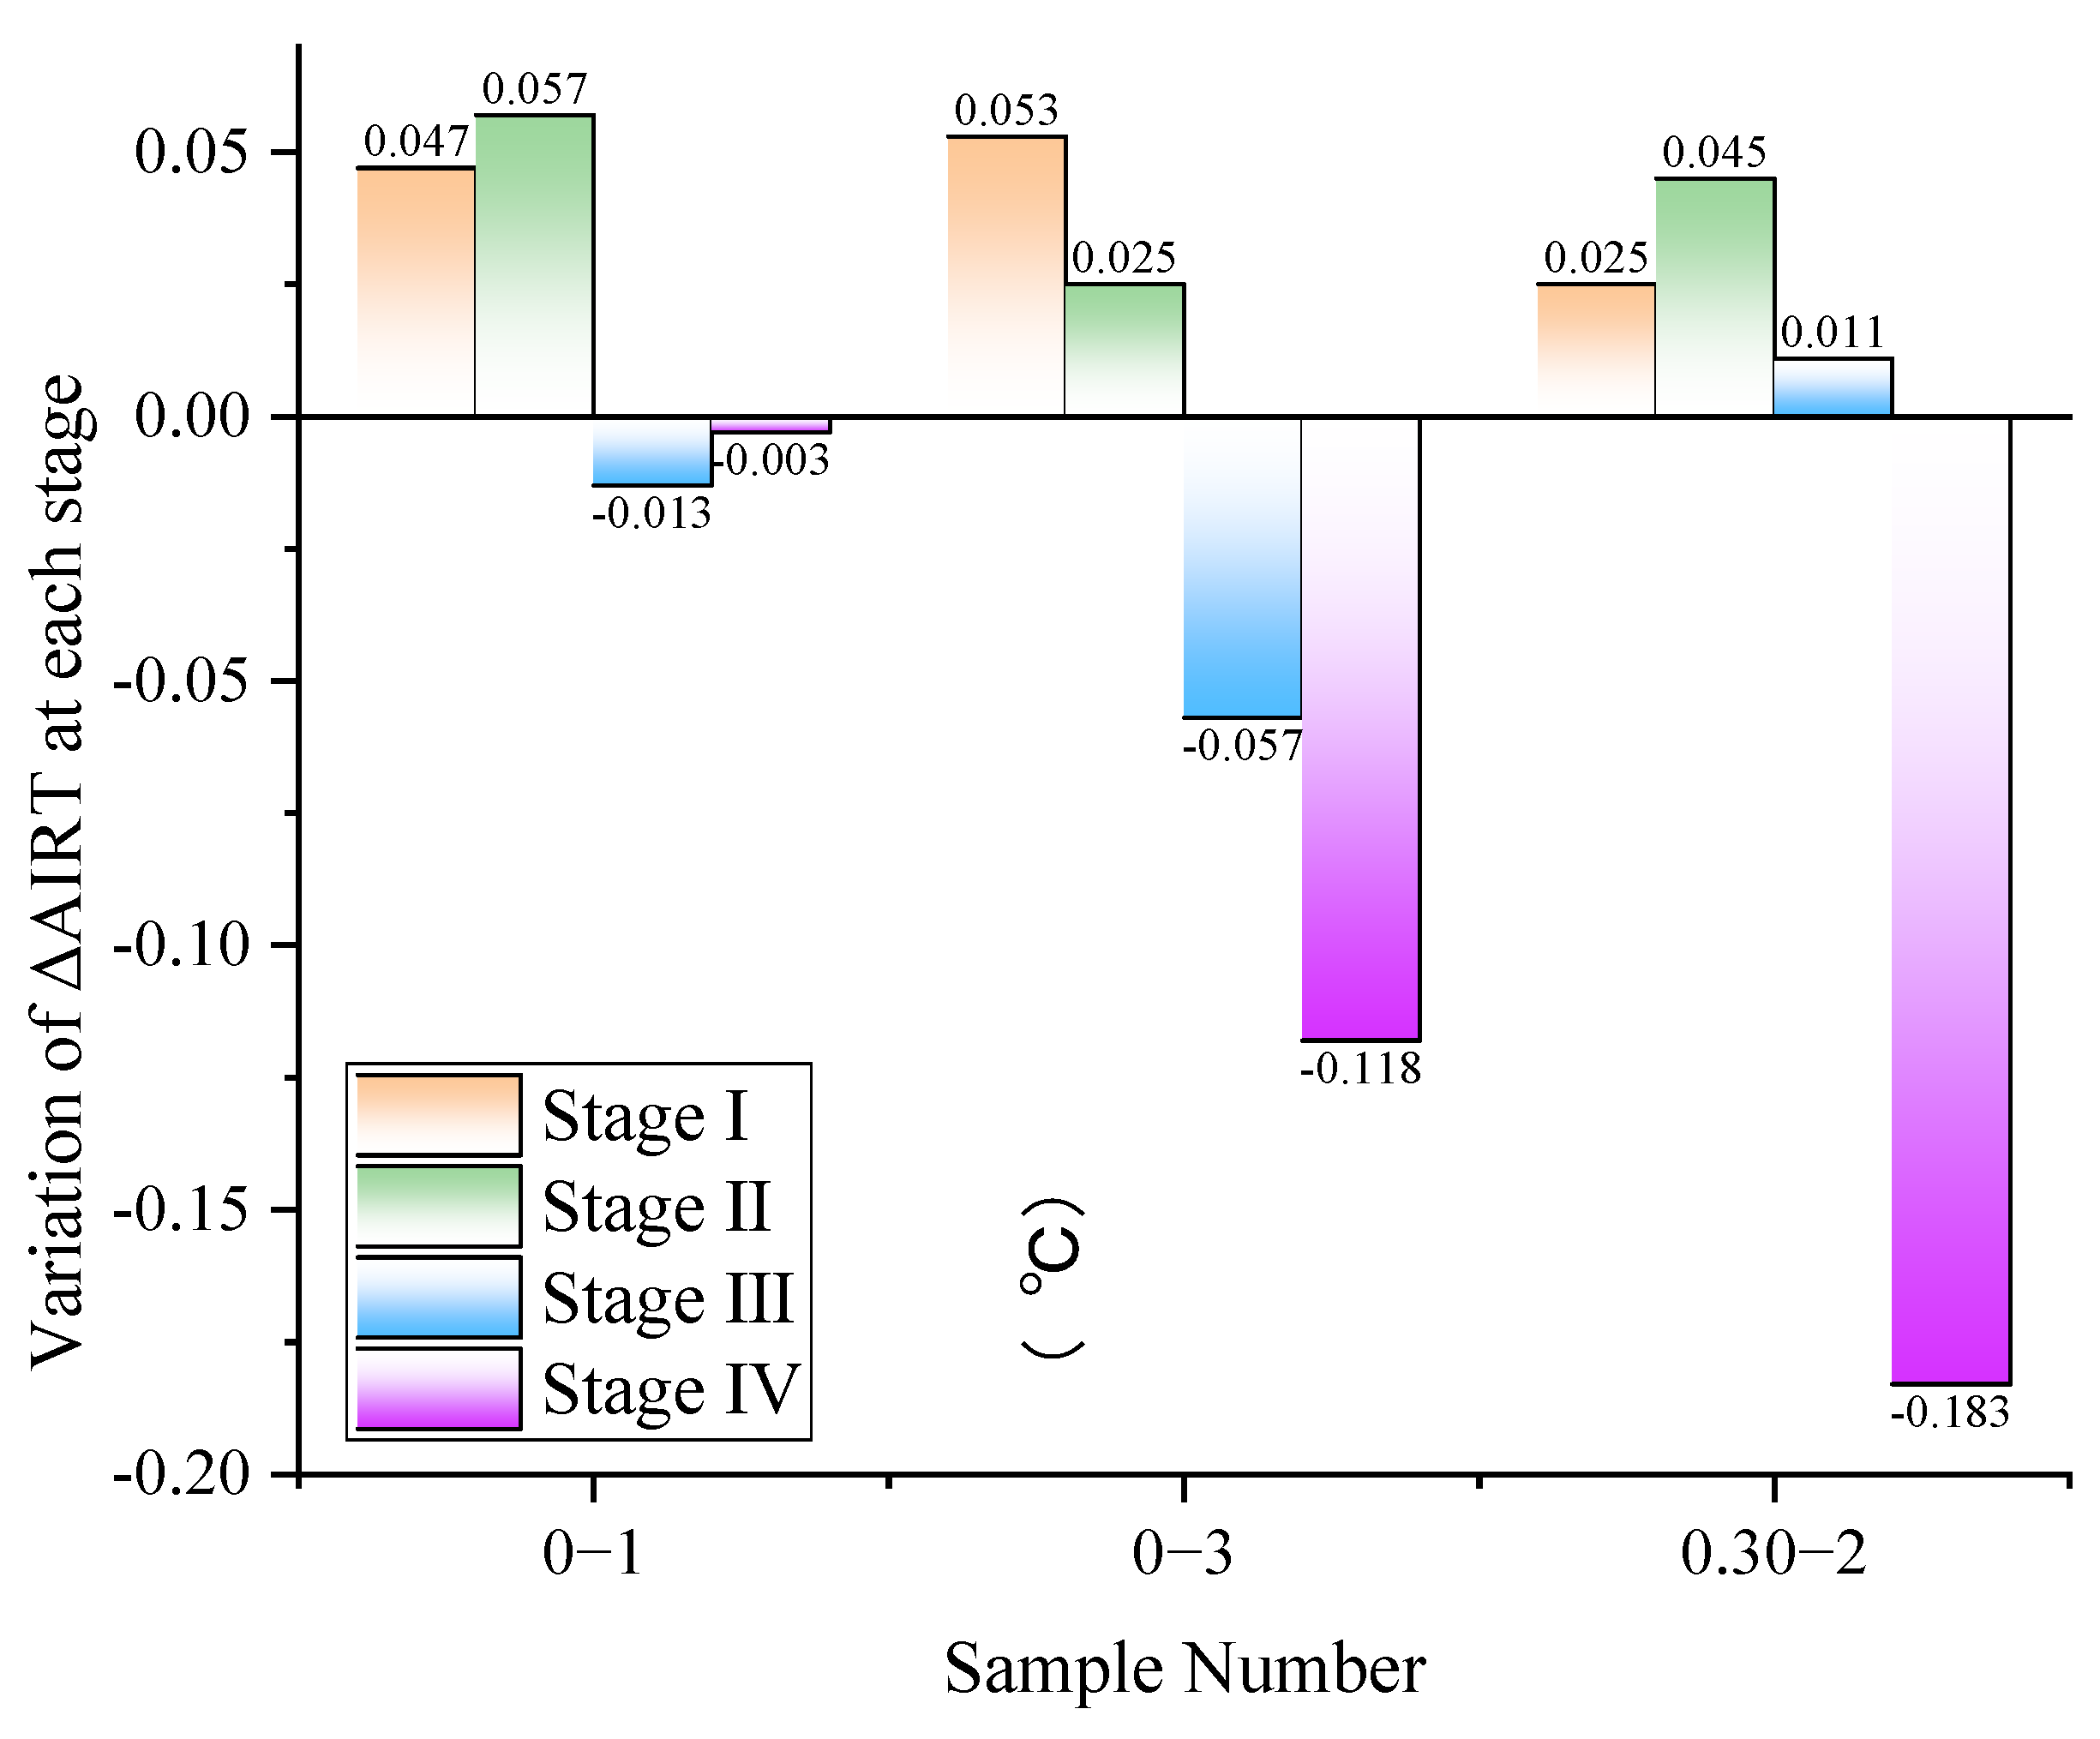
During the experiment, the ΔAIRT of the sample mainly showed an upward-downward trend. Among them, the compaction stage and the linear elastic stage are both rising, the fracture development stage is stable or falling, and the post-peak failure stage has an obvious downward trend.
(2)
For the sample with internal water pressure lower than 0.30 MPa, ΔAIRT at the compaction and linear elastic stage has a strong power function relationship with the load. The expression is ΔAIRT = aLb, where ΔAIRT is the difference between the infrared radiation average temperature of the loaded sample and the reference sample, L is the load, and a and b are the undetermined coefficients. The correlation coefficient of the function can reach above 0.8900, which has a strong reference value.
(3)
The IRV curve has a pulse jump at the time of water seepage of the rock sample, and a step jump at the fracture development and the post-peak failure stages, respectively. The VDIIT curve has a pulse jump at the time of water seepage, and there is an obvious up and down fluctuation before water seepage and fracture.
(4)
Based on the Pauta Criterion, a VDIIT mutation threshold for rock fracture seepage is proposed, which is 0.00559.

Author Contributions

R.C.—Conceptualization, writing-original draft and experiments; K.C.—Conceptualization, supervision and project administration; X.L.—Software and data curation; R.M.A.K.—Methodology; N.M.K.—Visulization; W.L.—Writing review&editing; Q.G.—Investigation and Data curation; F.W.—Experiments; Y.Y.—Investigation; J.Q.—Writing-review&editing; S.S.A.—Writing-review&editing. All authors have read and agreed to the published version of the manuscript.

Funding

This research was funded by the major university level scientific research project of Anhui University of Finance and Economics, “Research on the Connotative Characteristics and New Era Inheritance and Innovation of Northern Anhui Culture under the Yangtze River Delta Integration Strategy”,(ACKYA20003). Also this research was supported by Researchers Supporting Project number (RSP2022R496), King Saud University, Riyadh, Saudi Arabia.

Data Availability Statement

The data that supports the findings of this study is available from the corresponding author upon reasonable request.

Acknowledgments

This research was funded by the major university level scientific research project of Anhui University of Finance and Economics, "Research on the Connotative Characteristics and New Era Inheritance and Innovation of Northern Anhui Culture under the Yangtze River Delta Integration Strategy",(ACKYA20003). Also this research was supported by Researchers Supporting Project number (RSP2022R496), King Saud University, Riyadh, Saudi Arabia. Meanwhile, the authors gratefully acknowledge Yangyang Wang and Jiangtao Zhai for helpful suggestions.

Conflicts of Interest

The authors declare no conflict of interest.

References

  1. Xie, H.; Zhao, J.W.; Zhou, H.W.; Ren, S.H.; Zhang, R.X. Secondary utilizations and perspectives of mined underground space. Tunn. Undergr. Space Technol. 2020, 96, 103129. [Google Scholar] [CrossRef]
  2. Ma, T.; Liu, J.; Fu, J.; Wu, B. Drilling and completion technologies of coalbed methane exploitation: An overview. Int. J. Coal Sci. Technol. 2022, 9, 68. [Google Scholar] [CrossRef]
  3. Armaghani, D.J.; Kumar, D.; Samui, P.; Hasanipanah, M.; Roy, B.J.E.W.C. A novel approach for forecasting of ground vibrations resulting from blasting: Modified particle swarm optimization coupled extreme learning machine. Eng. Comput. 2021, 37, 3221–3235. [Google Scholar] [CrossRef]
  4. Vervoort, A. Various phases in surface movements linked to deep coal longwall mining: From start-up till the period after closure. Int. J. Coal Sci. Technol. 2021, 8, 412–426. [Google Scholar] [CrossRef]
  5. Lian, X.; Hu, H.; Li, T.; Hu, D. Main geological and mining factors affecting ground cracks induced by underground coal mining in shanxi province, china. Int. J. Coal Sci. Technol. 2020, 7, 362–370. [Google Scholar] [CrossRef] [Green Version]
  6. Wiatowski, M.; Kapusta, K.; Nowak, J.; Szyja, M.; Basa, W. An exsitu underground coal gasification experiment with a siderite interlayer: Course of the process, production gas, temperatures and energy efficiency. Int. J. Coal Sci. Technol. 2021, 8, 1447–1460. [Google Scholar] [CrossRef]
  7. Qiao, X.; Chang, F. Underground location algorithm based on random forest and environmental factor compensation. Int. J. Coal Sci. Technol. 2021, 8, 1108–1117. [Google Scholar] [CrossRef]
  8. Yi, M.; Wang, L.; Hao, C.; Liu, Q.; Wang, Z. Method for designing the optimal sealing depth in methane drainage boreholes to realize efficient drainage. Int. J. Coal Sci. Technol. 2021, 8, 1400–1410. [Google Scholar] [CrossRef]
  9. Zhao, W.; Wang, K.; Zhang, R.; Dong, H.; Lou, Z.; An, F. Influence of combination forms of intact sub-layer and tectonically deformed sub-layer of coal on the gas drainage performance of boreholes: A numerical study. Int. J. Coal Sci. Technol. 2020, 7, 571–580. [Google Scholar] [CrossRef] [Green Version]
  10. Yu, H.; Gui, H.; Zhao, H.; Wang, M.; Li, J.; Fang, H.; Jiang, Y.; Zhang, Y. Hydrochemical characteristics and water quality evaluation of shallow groundwater in suxian mining area, huaibei coalfield, china. Int. J. Coal Sci. Technol. 2020, 7, 825–835. [Google Scholar] [CrossRef]
  11. Sun, K.; Fan, L.; Xia, Y.; Li, C.; Chen, J.; Gao, S.; Wu, B.; Peng, J.; Ji, Y. Impact of coal mining on groundwater of luohe formation in binchang mining area. Int. J. Coal Sci. Technol. 2020, 8, 88–102. [Google Scholar] [CrossRef]
  12. Zhang, K.; Li, H.; Han, J.; Jiang, B.; Gao, J. Understanding of mineral change mechanisms in coal mine groundwater reservoir and their influences on effluent water quality: A experimental study. Int. J. Coal Sci. Technol. 2020, 8, 154–167. [Google Scholar] [CrossRef]
  13. Armaghani, D.J.; Yagiz, S.; Mohamad, E.T.; Zhou, J. Prediction of TBM performance in fresh through weathered granite using empirical and statistical approaches. Tunn. Undergr. Space Technol. 2021, 118, 104183. [Google Scholar] [CrossRef]
  14. Wang, G.Y.; You, G.; Shi, B.; Yu, J.; Tuck, M. Long-term land subsidence and strata compression in changzhou, china. Eng. Geol. 2009, 104, 109–118. [Google Scholar] [CrossRef] [Green Version]
  15. Moon, J.; Fernandez, G. Effect of excavation-induced groundwater level drawdown on tunnel inflow in a jointed rock mass. Eng. Geol. 2010, 110, 33–42. [Google Scholar] [CrossRef]
  16. Wu, Q.; Wang, M.; Wu, X. Investigations of groundwater bursting into coal mine seam floors from fault zones. Int. J. Rock Mech. Min. 2004, 41, 557–571. [Google Scholar] [CrossRef]
  17. Liu, Z.; Wang, G.; Li, J.; Li, H.; Zhao, H.; Shi, H.; Lan, J. Water-immersion softening mechanism of coal rock mass based on split hopkinson pressure bar experiment. Int. J. Coal Sci. Technol. 2022, 9, 61. [Google Scholar] [CrossRef]
  18. DeCuir, M.J.; Gupta, R.B.; Sastri, B. Beneficiation of coal using supercritical water and carbon dioxide extraction: Sulfur removal. Int. J. Coal Sci. Technol. 2020, 8, 717–726. [Google Scholar] [CrossRef]
  19. Wang, J.; Yang, J.; Wu, F.; Hu, T.; Faisal, S.A. Analysis of fracture mechanism for surrounding rock hole based on water-filled blasting. Int. J. Coal Sci. Technol. 2020, 7, 704–713. [Google Scholar] [CrossRef]
  20. Liu, A.; Liu, S.; Liu, P.; Wang, K. Water sorption on coal: Effects of oxygen-containing function groups and pore structure. Int. J. Coal Sci. Technol. 2021, 8, 983–1002. [Google Scholar] [CrossRef]
  21. Hou, E.; Wen, Q.; Ye, Z.; Chen, W.; Wei, J. Height prediction of water-flowing fracture zone with a genetic-algorithm support-vector-machine method. Int. J. Coal Sci. Technol. 2020, 7, 740–751. [Google Scholar] [CrossRef]
  22. Li, L.; Li, F.; Zhang, Y.; Yang, D.; Liu, X. Formation mechanism and height calculation of the caved zone and water-conducting fracture zone in solid backfill mining. Int. J. Coal Sci. Technol. 2020, 7, 208–215. [Google Scholar] [CrossRef] [Green Version]
  23. Guo, P.; Gu, J.; Su, Y.; Wang, J.; Ding, Z. Effect of cyclic wetting–drying on tensile mechanical behavior and microstructure of clay-bearing sandstone. Int. J. Coal Sci. Technol. 2021, 8, 956–968. [Google Scholar] [CrossRef]
  24. Qi, T.; Zhang, F.; Pei, X.; Feng, G.; Wei, H. Simulation research and application on response characteristics of detecting water-filled goaf by transient electromagnetic method. Int. J. Coal Sci. Technol. 2022, 9, 17. [Google Scholar] [CrossRef]
  25. Ma, D.; Duan, H.; Zhang, J.; Bai, H. A state-of-the-art review on rock seepage mechanism of water inrush disaster in coal mines. Int. J. Coal Sci. Technol. 2022, 9, 50. [Google Scholar] [CrossRef]
  26. Li, X.L.; Wang, E.Y.; Li, Z.H.; Liu, Z.T.; Song, D.Z.; Qiu, L.M. Rock burst monitoring by integrated microseismic and electromagnetic radiation methods. Rock Mech. Rock Eng. 2016, 49, 4393–4406. [Google Scholar] [CrossRef]
  27. Di, Y.Y.; Wang, E.Y. Rock burst precursor electromagnetic radiation signal recognition method and early warning application based on recurrent neural networks. Rock Mech. Rock Eng. 2021, 54, 1449–1461. [Google Scholar] [CrossRef]
  28. Xie, H.P.; Zhu, J.B.; Zhou, T.; Zhao, J. Novel three-dimensional rock dynamic tests using the true triaxial electromagnetic hopkinson bar system. Rock Mech. Rock Eng. 2021, 54, 2079–2086. [Google Scholar] [CrossRef]
  29. Teimoori, K.; Cooper, R. Multiphysics study of microwave irradiation effects on rock breakage system. Int. J. Rock Mech. Min. Sci. 2021, 140, 104586. [Google Scholar] [CrossRef]
  30. Song, D.Z.; Wang, E.Y.; Song, X.Y.; Jin, P.J.; Qiu, L.M. Changes in frequency of electromagnetic radiation from loaded coal rock. Rock Mech. Rock Eng. 2016, 49, 291–302. [Google Scholar] [CrossRef]
  31. Liu, H.F.; Li, Z.L.; He, X.Q.; Wang, L.B.; Song, D.Z.; Tian, X.H.; Qiu, L.M.; Wang, W.X. Dynamic and static electrical characteristics of micro-surface of rocks by coupled use of atomic force microscope and micro-loading device. Int. J. Rock Mech. Min. Sci. 2021, 148, 104977. [Google Scholar] [CrossRef]
  32. Asem, P.; Gardoni, P. Bayesian estimation of the normal and shear stiffness for rock sockets in weak sedimentary rocks. Int. J. Rock Mech. Min. Sci. 2019, 124, 104129. [Google Scholar] [CrossRef]
  33. Momber, A.W. A refined model for solid particle rock erosion. Rock Mech. Rock Eng. 2016, 49, 467–475. [Google Scholar] [CrossRef]
  34. Nikolenko, P.V.; Epshtein, S.A.; Shkuratnik, V.L.; Anufrenkova, P.S. Experimental study of coal fracture dynamics under the influence of cyclic freezing–thawing using shear elastic waves. Int. J. Coal Sci. Technol. 2020, 8, 562–574. [Google Scholar] [CrossRef]
  35. Sun, C.; Li, G.; Gomah, M.E.; Xu, J.; Rong, H. Experimental investigation on the nanoindentation viscoelastic constitutive model of quartz and kaolinite in mudstone. Int. J. Coal Sci. Technol. 2021, 8, 925–937. [Google Scholar] [CrossRef]
  36. Moore, J.R.; Geimer, P.R.; Finnegan, R.; Thorne, M.S. Use of seismic resonance measurements to determine the elastic modulus of freestanding rock masses. Rock Mech. Rock Eng. 2018, 51, 3937–3944. [Google Scholar] [CrossRef]
  37. Wu, H.; Ju, Y.; Han, X.; Ren, Z.; Sun, Y.; Zhang, Y.; Han, T. Size effects in the uniaxial compressive properties of 3d printed models of rocks: An experimental investigation. Int. J. Coal Sci. Technol. 2022, 9, 83. [Google Scholar] [CrossRef]
  38. Bobet, A. Lined circular tunnels in elastic transversely anisotropic rock at depth. Rock Mech. Rock Eng. 2011, 44, 149–167. [Google Scholar] [CrossRef]
  39. Tang, X.H.; Zhang, Y.H.; Xu, J.J.; Rutqvist, J.; Hu, M.S.; Wang, Z.Z.; Liu, Q.S. Determining young’s modulus of granite using accurate grain-based modeling with microscale rock mechanical experiments. Int. J. Rock Mech. Min. Sci. 2022, 157, 105167. [Google Scholar] [CrossRef]
  40. Liu, H.H.; Rutqvist, J.; Birkholzer, J.T. Constitutive relationships for elastic deformation of clay rock: Data analysis. Rock Mech. Rock Eng. 2011, 44, 463–468. [Google Scholar] [CrossRef]
  41. Du, F.; Ma, J.; Guo, X.; Wang, T.; Dong, X.; Li, J.; He, S.; Nuerjuma, D. Rockburst mechanism and the law of energy accumulation and release in mining roadway: A case study. Int. J. Coal Sci. Technol. 2022, 9, 67. [Google Scholar] [CrossRef]
  42. Khan, N.M.; Ma, L.Q.; Cao, K.W.; Hussain, S.; Liu, W.; Xu, Y.J.; Yuan, Q.P.; Gu, J. Prediction of an early failure point using infrared radiation characteristics and energy evolution for sandstone with different water contents. Bull. Eng. Geol. Environ. 2021, 80, 6913–6936. [Google Scholar] [CrossRef]
  43. Liu, L.Y.; Ji, H.G.; Elsworth, D.; Zhi, S.; Lv, X.F.; Wang, T. Dual-damage constitutive model to define thermal damage in rock. Int. J. Rock Mech. Min. Sci. 2020, 126, 104185. [Google Scholar] [CrossRef]
  44. Vargas, E.D.; Velloso, R.Q.; Chavez, L.E.; Gusmao, L.; do Amaral, C.P. On the effect of thermally induced stresses in failures of some rock slopes in rio de janeiro, brazil. Rock Mech. Rock Eng. 2013, 46, 123–134. [Google Scholar] [CrossRef]
  45. Liu, B.; Zhao, Y.; Zhang, C.; Zhou, J.; Li, Y.; Sun, Z. Characteristic strength and acoustic emission properties of weakly cemented sandstone at different depths under uniaxial compression. Int. J. Coal Sci. Technol. 2021, 8, 1288–1301. [Google Scholar] [CrossRef]
  46. Dou, L.; Yang, K.; Chi, X. Fracture behavior and acoustic emission characteristics of sandstone samples with inclined precracks. Int. J. Coal Sci. Technol. 2020, 8, 77–87. [Google Scholar] [CrossRef]
  47. Su, G.S.; Huang, J.H.; Xu, H.J.; Qin, Y.Z. Extracting acoustic emission features that precede hard rock instability with unsupervised learning. Eng. Geol. 2022, 306, 106761. [Google Scholar] [CrossRef]
  48. Kong, X.G.; Wang, E.Y.; Li, S.G.; Lin, H.F.; Xiao, P.; Zhang, K.Z. Fractals and chaos characteristics of acoustic emission energy about gas-bearing coal during loaded failure. Fractals 2019, 27, 1950072. [Google Scholar] [CrossRef]
  49. Chi, X.; Yang, K.; Wei, Z. Breaking and mining-induced stress evolution of overlying strata in the working face of a steeply dipping coal seam. Int. J. Coal Sci. Technol. 2021, 8, 614–625. [Google Scholar] [CrossRef]
  50. Xue, D.; Lu, L.; Zhou, J.; Lu, L.; Liu, Y. Cluster modeling of the short-range correlation of acoustically emitted scattering signals. Int. J. Coal Sci. Technol. 2020, 8, 575–589. [Google Scholar] [CrossRef]
  51. He, S.; Qin, M.; Qiu, L.; Song, D.; Zhang, X. Early warning of coal dynamic disaster by precursor of ae and emr “quiet period”. Int. J. Coal Sci. Technol. 2022, 9, 46. [Google Scholar] [CrossRef]
  52. Kong, X.G.; He, D.; Liu, X.F.; Wang, E.Y.; Li, S.G.; Liu, T.; Ji, P.F.; Deng, D.Y.; Yang, S.R. Strain characteristics and energy dissipation laws of gas-bearing coal during impact fracture process. Energy 2022, 242, 123028. [Google Scholar] [CrossRef]
  53. Yao, Q.L.; Tang, C.J.; Xia, Z.; Liu, X.L.; Zhu, L.; Chong, Z.H.; Hui, X.D. Mechanisms of failure in coal samples from underground water reservoir. Eng. Geol. 2020, 267, 105494. [Google Scholar] [CrossRef]
  54. Junique, T.; Vazquez, P.; Geraud, Y.; Thomachot-Schneider, C.; Sidibe, H. Microstructural evolution of granitic stones exposed to different thermal regimes analysed by infrared thermography. Eng. Geol. 2021, 286, 106057. [Google Scholar] [CrossRef]
  55. He, X.Q.; Chen, W.X.; Nie, B.S.; Mitri, H. Electromagnetic emission theory and its application to dynamic phenomena in coal-rock. Int. J. Rock Mech. Min. 2011, 48, 1352–1358. [Google Scholar] [CrossRef]
  56. Wu, R.; Zhang, P.; Kulatilake, P.H.S.W.; Luo, H.; He, Q. Stress and deformation analysis of gob-side pre-backfill driving procedure of longwall mining: A case study. Int. J. Coal Sci. 2021, 8, 1351–1370. [Google Scholar] [CrossRef]
  57. Tang, J.; Zhang, X.; Sun, S.; Pan, Y.; Li, L. Evolution characteristics of precursor information of coal and gas outburst in deep rock cross-cut coal uncovering. Int. J. Coal Sci. Technol. 2022, 9, 5. [Google Scholar] [CrossRef]
  58. Song, Z.; Ji, H.; Liu, Z.; Sun, L. Study on the critical stress threshold of weakly cemented sandstone damage based on the renormalization group method. Int. J. Coal Sci. Technol. 2020, 7, 693–703. [Google Scholar] [CrossRef] [Green Version]
  59. Panthulu, T.V.; Krishnaiah, C.; Shirke, J.M. Detection of seepage paths in earth dams using self-potential and electrical resistivity methods. Eng. Geol. 2001, 59, 281–295. [Google Scholar] [CrossRef]
  60. Zhou, J.R.; Wei, J.; Yang, T.H.; Zhu, W.C.; Li, L.C.; Zhang, P.H. Damage analysis of rock mass coupling joints, water and microseismicity. Tunn. Undergr. Space Technol. 2018, 71, 366–381. [Google Scholar] [CrossRef]
  61. Liu, F.; Tang, C.A.; Zhang, Y.J.; Ma, T.H. Rockburst and microseismicity characteristics in the qinling water conveyance tunnel of the hanjiang-to-weihe river diversion project. Int. J. Rock Mech. Min. Sci. 2021, 148, 104973. [Google Scholar] [CrossRef]
  62. Yang, H.Q.; Liu, B.L.; Karekal, S. Experimental investigation on infrared radiation features of fracturing process in jointed rock under concentrated load. Int. J. Rock Mech. Min. Sci. 2021, 139, 104619. [Google Scholar] [CrossRef]
  63. Cao, K.W.; Ma, L.Q.; Zhang, D.S.; Lai, X.P.; Zhang, Z.T.; Khan, N.M. An experimental study of infrared radiation characteristics of sandstone in dilatancy process. Int. J. Rock Mech. Min. Sci. 2020, 136, 104503. [Google Scholar] [CrossRef]
  64. Sun, X.M.; Xu, H.C.; He, M.C.; Zhang, F. Experimental investigation of the occurrence of rockburst in a rock specimen through infrared thermography and acoustic emission. Int. J. Rock Mech. Min. 2017, 93, 250–259. [Google Scholar] [CrossRef]
  65. Liu, S.J.; Wu, L.X.; Wu, Y.H. Infrared radiation of rock at failure. Int. J. Rock Mech. Min. 2006, 43, 972–979. [Google Scholar] [CrossRef]
  66. Wu, L.X.; Liu, S.J.; Wu, Y.H.; Wang, C.Y. Precursors for rock fracturing and failure—Part i: Irr image abnormalities. Int. J. Rock Mech. Min. 2006, 43, 473–482. [Google Scholar] [CrossRef]
  67. Lin, Y.; Zheng, Z.B.; Zhou, K.P.; Gu, Z.Y.; Pan, Z. Research on the characteristics of infrared radiation and energy evolution law of red sandstone with different porosity during uniaxial compression. Sustainability 2022, 14, 7698. [Google Scholar] [CrossRef]
  68. Huang, J.W.; Liu, S.J.; Gao, X.; Yang, Z.C.; Ni, Q.; Wu, L.X. Experimental study of the thermal infrared emissivity variation of loaded rock and its significance. Remote Sens. 2018, 10, 818. [Google Scholar] [CrossRef] [Green Version]
  69. Cao, K.W.; Ma, L.Q.; Wu, Y.; Khan, N.M.; Spearing, A.J.S.; Hussain, S.; Yang, J. Cyclic fatigue characteristics of rock failure using infrared radiation as precursor to violent failure: Experimental insights from loading and unloading response. Fatigue Fract. Eng. M 2021, 44, 584–594. [Google Scholar] [CrossRef]
  70. Zhang, K.; Liu, X.H.; Chen, Y.L.; Cheng, H.M. Quantitative description of infrared radiation characteristics of preflawed sandstone during fracturing process. J. Rock Mech. Geotech. 2021, 13, 131–142. [Google Scholar] [CrossRef]
  71. Cao, K.; Ma, L.; Wu, Y.; Khan, N.M.; Yang, J. Using the characteristics of infrared radiation during the process of strain energy evolution in saturated rock as a precursor for violent failure. Infrared Phys. Technol. 2020, 109, 103406. [Google Scholar] [CrossRef]
  72. Cao, K.W.; Ma, L.Q.; Wu, Y.; Spearing, A.J.S.; Khan, N.M.; Hussain, S.; Rehman, F.U. Statistical damage model for dry and saturated rock under uniaxial loading based on infrared radiation for possible stress prediction. Eng. Fract. Mech. 2022, 260, 108134. [Google Scholar] [CrossRef]
  73. Cai, X.; Zhou, Z.L.; Tan, L.H.; Zang, H.Z.; Song, Z.Y. Water saturation effects on thermal infrared radiation features of rock materials during deformation and fracturing. Rock Mech. Rock Eng. 2020, 53, 4839–4856. [Google Scholar] [CrossRef]
  74. Shen, R.X.; Li, H.R.; Wang, E.Y.; Chen, T.Q.; Li, T.X.; Tian, H.; Hou, Z.H. Infrared radiation characteristics and fracture precursor information extraction of loaded sandstone samples with varying moisture contents. Int. J. Rock Mech. Min. Sci. 2020, 130, 104344. [Google Scholar] [CrossRef]
  75. Wu, L.X.; Liu, S.J.; Wu, Y.H.; Wang, C.Y. Precursors for rock fracturing and failure—Part ii: Irr t-curve abnormalities. Int. J. Rock Mech. Min. 2006, 43, 483–493. [Google Scholar] [CrossRef]
Figure 1. Experimental system diagram.
Sustainability 14 16454 g001
Figure 2. MTS electro-hydraulic servo universal testing machine.
Sustainability 14 16454 g002
Figure 3. Air compressor.
Sustainability 14 16454 g003
Figure 4. Infrared thermal imager.
Sustainability 14 16454 g004
Figure 5. Sample manufacturing process. (a) Borehole sandstones; (b) Steel pipes; (c) Perforated iron plates; (d) Finished samples.
Sustainability 14 16454 g005
Figure 6. Details of samples.
Sustainability 14 16454 g006
Figure 7. Infrared thermal image of rock sample.
Sustainability 14 16454 g007
Figure 8. Experimental data of sample 0–1.
Sustainability 14 16454 g008
Figure 9. Experimental data of sample 0–3.
Sustainability 14 16454 g009
Figure 10. Experimental data of 0.30–2 sample.
Sustainability 14 16454 g010
Figure 11. Temperature change in each stage.
Sustainability 14 16454 g011
Figure 12. Data of each sample in the compaction and elastic stages. (a) 0–2 sample; (b) 0–3 sample; (c) 0.30–2 sample.
Sustainability 14 16454 g012
Figure 13. Fitting curve of each sample. (a) 0–2 sample; (b) 0–3 sample; (c) 0.30–2 sample.
Sustainability 14 16454 g013
Figure 14. IRV of 0.45–2 sample and other related data.
Sustainability 14 16454 g014
Figure 15. Water seepage diagram of 0.45–2 sample before and after 340 s.
Sustainability 14 16454 g015
Figure 16. VDIIT of 0.45–2 sample and other related data.
Sustainability 14 16454 g016
Figure 17. Macro crack development and fracture water seepage process of 0.45–2 sample before and after 552 s. The red circle represents the location of fracture development.
Sustainability 14 16454 g017
Table 1. Main characteristic parameters of the air compressor.
ItemParameterItemParameter
Size45 × 19 × 45 cmSpeed2800 r/min
Matching power980 WRated exhaust pressure0.7 MPa
Overall weight14 kgVolume of air storage tank8 L
Table 2. Main Characteristic Parameters of Infrared Thermal Imager System.
ItemParameter
Thermal sensitivity0.02 °C;
Thermal resolution50 mK
Measuring band7.5~14 μm
LensF1.0
Standard calibration range−40~1200 °C
Pixel2048 × 1536
High acquisition rate240 Hz
Table 3. Experimental grouping.
Water PressureSample NumberWater PressureSample NumberWater PressureSample NumberWater PressureSample Number
0 MPa0–10.15 MPa0.15–10.3 MPa0.30–10.45 MPa0.45–1
0–20.15–20.30–20.45–2
0–30.15–30.30–30.45–3
Table 4. Function fitting parameters of ΔAIRT and load of some samples.
SampleFunction Correlation CoefficientABStandard
Deviation
0–20.9063−0.36895−0.095056.429%
0–30.96230.061490.154062.705%
0.30–20.8924−0.70989−0.028942.517%
Table 5. Water seepage (water inrush) threshold of sandstone samples.
SampleUpper ThresholdLower Threshold
0–10.005590.00367
0–20.006830.00455
0–30.005660.00368
0.15–10.006440.00401
0.15–20.005610.00383
0.15–30.006970.00487
0.30–10.006580.00434
0.30–20.006540.00427
0.30–30.005670.00362
0.45–10.005750.00376
0.45–20.007980.00048
0.45–30.005620.00360
Average value0.006270.00372
Publisher’s Note: MDPI stays neutral with regard to jurisdictional claims in published maps and institutional affiliations.

