1. Introduction
To solve the problems of the uneven distribution of water resources and the contradiction between supply and demand, many large-scale water conservancy construction projects have been built around the world, among which water transmission tunnels are a key component with high importance. Extreme engineering geological conditions, such as significant faults, seasonal thawing in permafrost regions, and high-pressure water action, frequently cause the issue of surrounding rock deformation and damage during tunnel excavation [
1,
2,
3,
4]. Similarly, the stability of the surrounding rock is also significantly impacted by the complicated stress changes, rock extrusion, and deformation brought on by tunnel excavation. Dong et al. [
5] exposed how tectonic stress forces affected the rock surrounding the tunnel’s stress and deformation damage pattern. After conducting an excavation simulation under high ground stress for the underground chamber complex of Jinping I hydropower facility, Qian and Zhou [
6] discovered that the rock body will manifest as two-dimensional band disintegration phenomenon and suggested corresponding support measures. After examining the primary stress rotation mechanism and the rock extrusion and deformation law during the excavation of high and deep buried tunnels, Cai et al. [
7,
8] pointed out that the three-dimensional spatial effect is more significant for the analysis of the stability of the surrounding rock. They proposed a three-dimensional orthotropic analysis and rock strength based on the GZZ strength criterion that can weaken the three-dimensional spatial effect and exert the rock body’s own strength.
Additionally, as a particular class of engineering geological problems, alteration rocks have been exposed in several projects around the world, such as the Sanjiang orogenic section of the Yunnan–Tibet Railway in China [
9], the Kerman Tunnel in the Urmia–Dokhtar Magmatic Arc (UDMA) in central Iran [
10], multiple geothermal power plants in the Kuril–Kamchatka island arc, Russia [
11], and the Wheal Martyn china pit in Southwest England [
12]. Alteration rocks are a new class of rock that forms after diagenesis by hydrothermal erosion, tectonic dynamics, and secondary weathering that alters the elemental composition and structural features of the original rock to various degrees [
13,
14]. Researchers have examined the composition and characteristics of altered rocks in various geological contexts and discovered that some feldspar and mica minerals are mostly changed into clay minerals, sericite, chlorite, and chlorite after alteration [
15,
16,
17]. The destruction of the original internal structure of the rocks caused by the alteration of tiny minerals increases the internal porosity of the rocks. The development of internal porosity as well as microcracks in the rock will produce continuity fracture damage after being disturbed by excavation [
18,
19]. Along with the long-term geological tectonic evolution and the effect of ground stress in the region, the distribution of alteration rocks is irregular, the internal structure is highly fragmented and the physical and mechanical properties are poor [
20,
21,
22,
23], which have a direct impact on site selection and the design and construction of projects.
The previous research system to examine the mechanical behavior of deeply buried tunnels from the viewpoints of intrinsic model and geological structure is reasonably well developed; the theoretical research on micro mineral analysis, physical and mechanical property changes, and alteration degree classification of altered rocks is also reasonably mature [
24,
25], but the pertinent engineering case studies are slightly lacking. Specifically in deeply buried tunnels, where the damage to the mechanical properties of rocks due to alteration is frequently beyond our original prediction, it has been common to observe construction challenges, schedule delays, and even safety threats brought on by improper support and poor response in the field. This is because there is little consideration of the alteration effect of rocks during engineering construction in altered rock areas. Therefore, there is scientific and practical value in analyzing the stress and deformation damage characteristics of tunnel excavation surrounding rocks under the effect of alteration for the design and construction of projects in altered rock areas. This study considered a water transfer tunnel with different degrees of alteration as an example. The FLAC
3D software was used to numerically simulate the excavation of a typical alteration tunnel section in its natural state and under two working conditions after support with the objective of analyzing the stress and deformation damage characteristics of the surrounding rock under different alteration degrees and elucidating the actual impact of alteration on the surrounding rock stability. The findings of this study provide the theoretical basis for optimizing the support scheme, and a reference for the design and construction of similar projects.
2. Engineering Geological Conditions
The water transmission tunnel is located in the central and western part of North Tianshan. This tunnel has a total length of 41.82 km, diameter of 5.3 m, and longitudinal slope of 1/564.8, which means that it is a deep and long buried tunnel. The study area has a complex geological structure with several northwest and northeast-trending compression–torsional faults, fold zones, and extrusion fracture zones. The tunnel’s surrounding rocks belong to various lithologies, and mainly include Silurian, Devonian, Carboniferous sandstone, metamorphic sandstone, tuff, tuffaceous sandstone, and Hualixi-age granite. Among them, the granite section is 9.81 km long, dominated by diorite, granodiorite, and potassium granite, and was formed by the crustal movement of the Late Paleozoic and magmatic activity of the Hualixi period. After a long and complex tectonic–hydrothermal superposition modification, the granites in the study area have generally been affected by alteration, with the chloritization of black mica and clayification of feldspar minerals as the main alteration types.
Based on a field survey and field test, the degree of rock alteration can be divided into three categories: slight alteration, moderate alteration, and strong alteration. Slightly altered rocks have a relatively intact structure, produce a brittle hammering sound, and their rebound values are between 30 and 50; the cave blocks are less collapsed and larger in size. Moderately altered rocks have a partially broken structure, produce a muffled hammering sound, and their rebound values are between 10 and 30; the cave blocks are more collapsed and larger in size, and cavities can easily form at the top arch. The structure of strongly altered rocks is completely destroyed, with visible traces of the original structure, and these rocks can be crushed by hand; the rebound value is less than 10, and the cavern is in a large area of debris collapse, exhibiting obvious plastic deformation when wet. The alteration of the surrounding rock in the tunnel is widely distributed, and the construction process often leads to the large deformation of the surrounding rock, collapse, and other geological problems.
3. Numerical Computational Model
3.1. Computational Model
Based on site investigation and geological data, the geological model of the study area was generalized, and a three-dimensional (3D) numerical calculation tunnel model was established based on FLAC
3D. As shown in
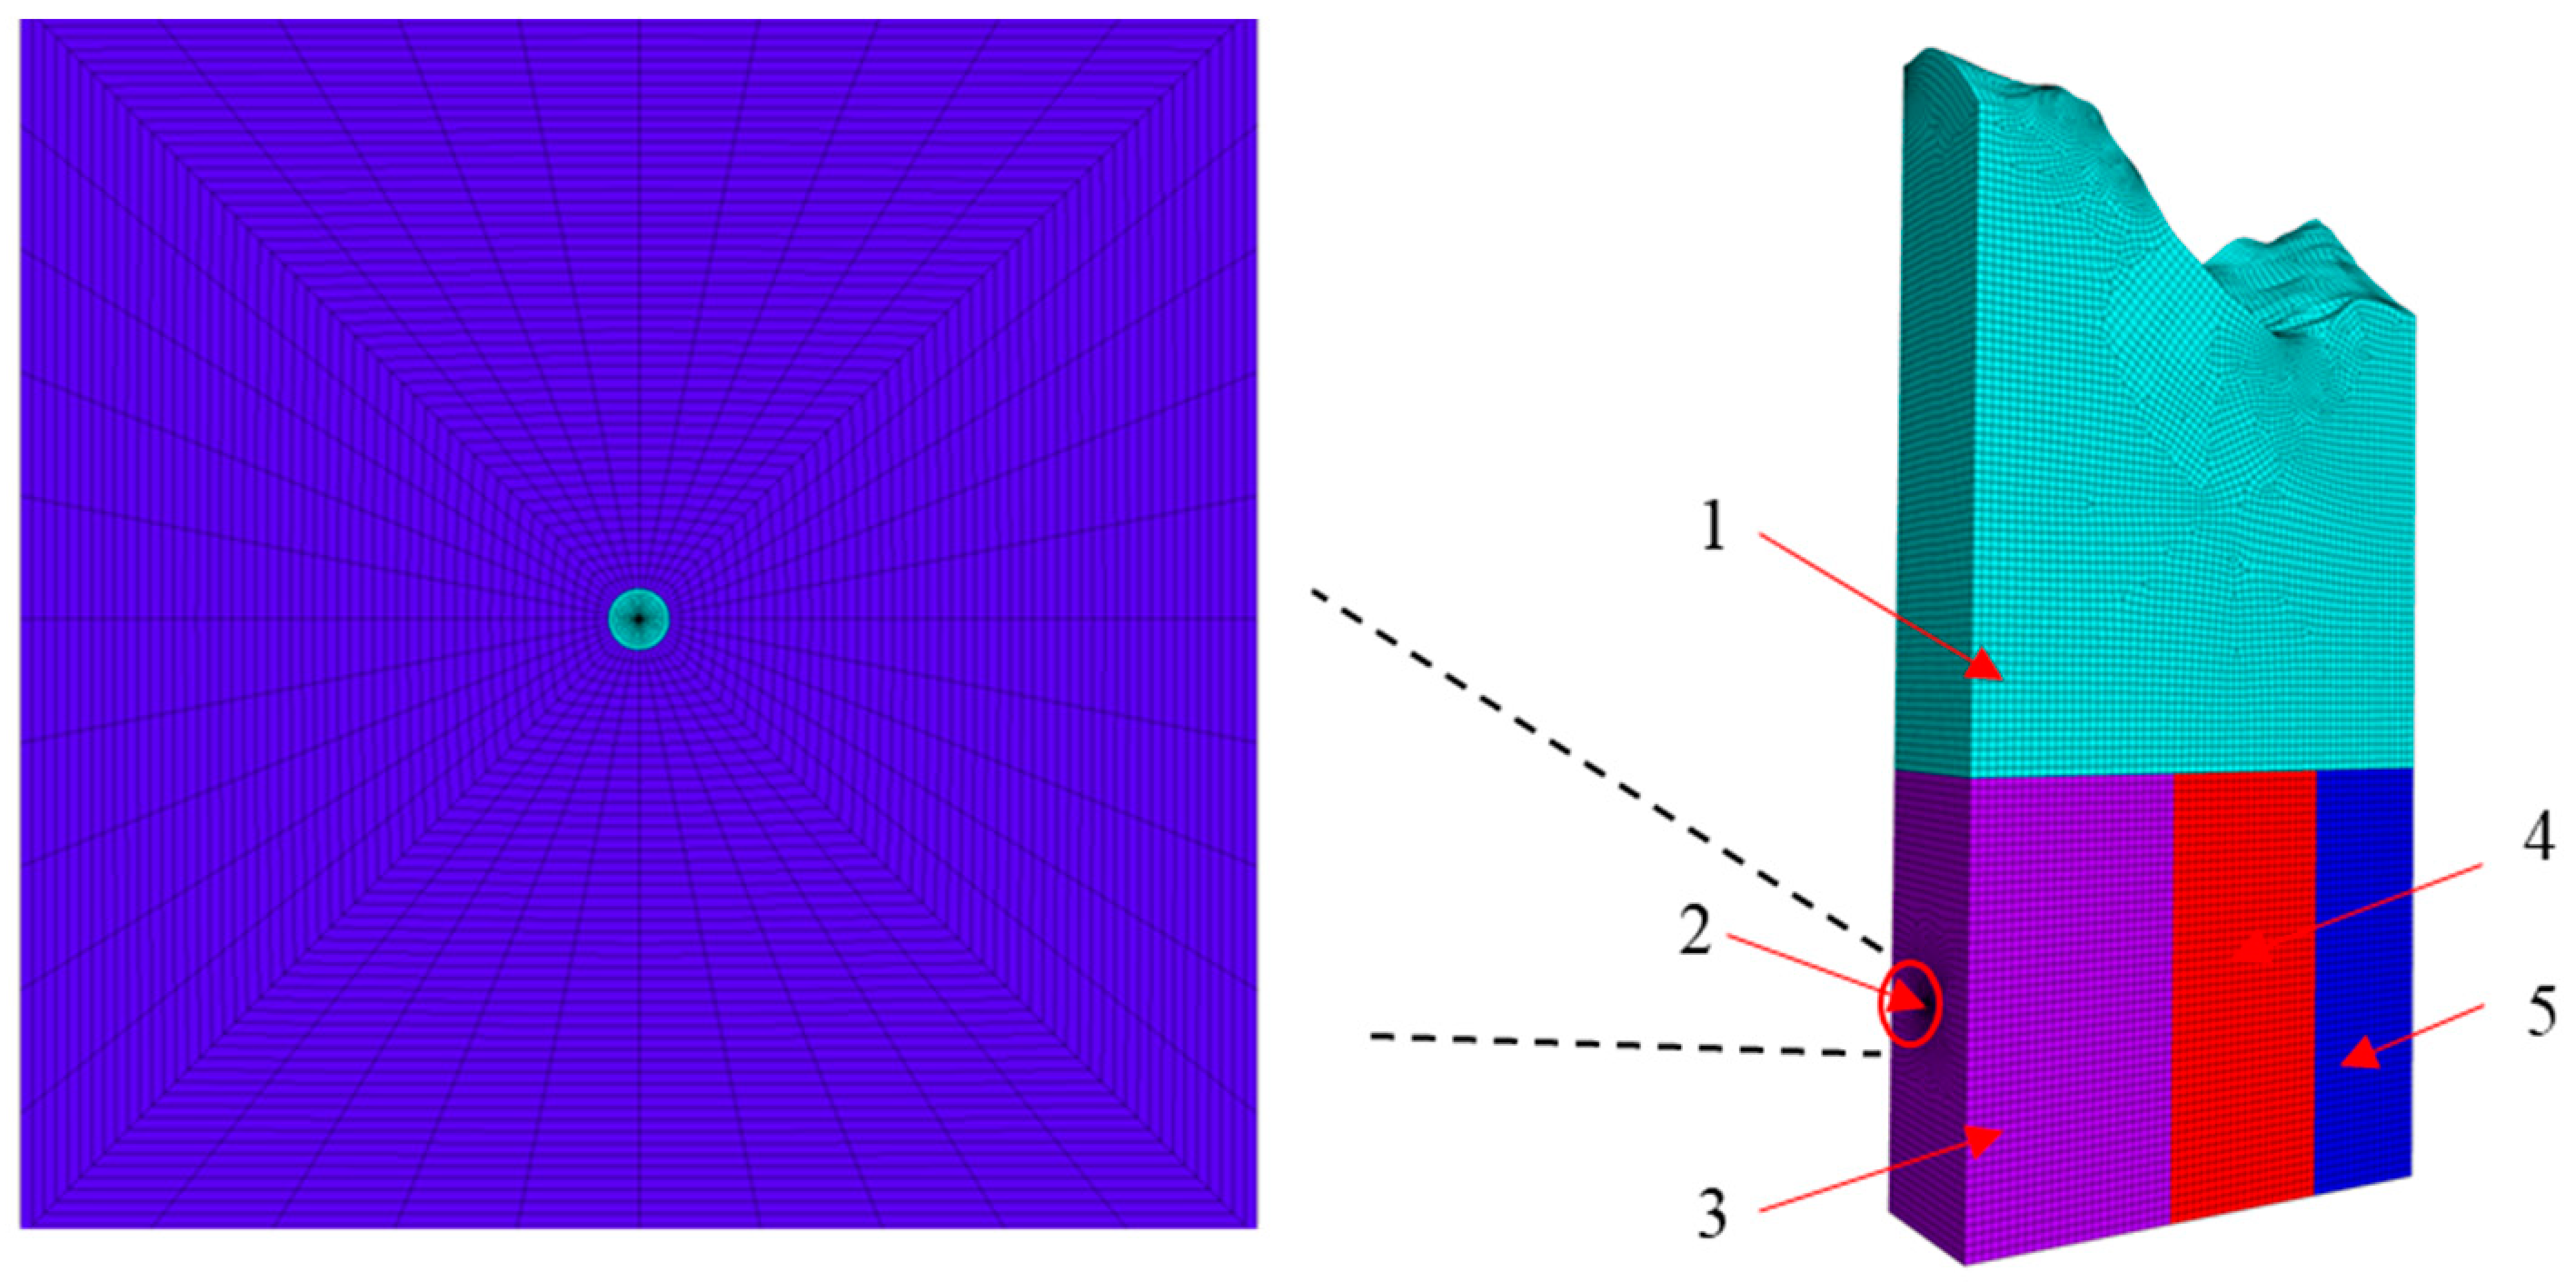
Figure 1a, the water transmission tunnel model had an 8 m diameter, the height of the model was approximately 1313 m in the vertical direction (Z-axis), the calculated elevation at the bottom was 1000 m, and the highest elevation at the top surface was 2313 m. The model width was 200 m (X-axis direction), and 100 m was taken from each side of the tunnel’s centerline. The extension of the model was 600 m (Y-axis direction), including 250 m for the slightly altered rock section (mileage K32 + 105–355), 200 m (mileage K32 + 355–555) for the moderately altered rock section, and 150 m (mileage K32 + 555–705) for the strongly altered rock section.
The geological model was simplified to four geotechnical materials, namely, the upper low resistance overburden and the lower three granites with different degrees of alteration. The tunnel passed through the lower altered rock layer, where the medium altered rock zone contained a fault. The geological model is shown in
Figure 1. Since the model’s overall size was too large, transitional meshing was employed to simplify the computation while guaranteeing that the mesh size close to the tunnel satisfied the requirements for calculation accuracy. The boundary conditions of the model were the X-directional displacement constraint along the tunnel extension boundary, the Y-directional displacement constraint along the vertical tunnel boundary, and the fixed constraint at the bottom boundary.
3.2. Application of Ground Stress and Selection of Calculation Parameters
To accurately obtain the tunnel ground stress field distribution, six sets of acoustic emission Kaiser effect ground stress tests and analyses were conducted on the borehole cores of the granite section, and the measured results are presented in
Table 1. The test results reveal that the measured principal stress value of the borehole increased with the depth; the maximum principal compressive stress
σ1 was approximately horizontal, the dip angle
a1 was within ± 10°, and the dominant direction was north-northwest, which was more consistent with the direction of the regional tectonic stress field. The middle principal stress
σ2 had a gentle dip angle, and the dip angle
a2 varied within ± 28°; the minimum principal stress dip angle
a3 was above 64°.
Based on the data in
Table 1, the ground stress in the granite cave section can be projected, and the linear correlation equations between the maximum horizontal principal stress (
σ1), horizontal intermediate principal stress (
σ2), and minimum horizontal principal stress (
σ3) and the burial depth (
H) can be derived as follows:
The principal stresses in the cavern line were projected according to the linear correlation equation, and the results are shown in
Table 2. In the numerical calculation,
σ1,
σ2, and
σ3 were transformed along the X-direction (horizontal vertical tunnel axis direction), Y-direction (tunnel axis direction), and vertical direction to apply the Sxx, Syy, and Szz stresses to the model.
The elastic–plastic model and Mohr–Coulomb strength criterion were used in the calculation. The rock surrounding parameters were determined according to the standard of International Society of Rock Mechanics (ISRM, 2007) after testing at the Quality Inspection Center of Capital Construction Project of Haihe Water Conservancy Commission, Ministry of Water Resources of China and School of Earth Science and Engineering, North China University of Water Resources and Electric Power, with reference to the Engineering Rock Quality Grading Standard (GBT50218-2014) and after considering the degree of rock alteration, as presented in
Table 3.
According to the excavation design plan, after the tunnel excavation, the TBM shield was closed with synthetic coarse fiber concrete in time after the initial spraying. The slightly altered section adopted HW125 steel arch racks with a distance of 0.9 m; the moderately altered section adopted HW150 steel arch racks with a distance of 0.5 m; the strongly altered section adoptsedHW150 steel arch racks with a distance of 0.3 m. The longitudinal connection adopted Φ20 steel bars with a ring spacing of 1 m, and the top arch was equipped with Φ20 reinforcement rows within 150°. The support parameters are shown in
Table 4,
Table 5, and
Table 6, respectively.
4. Analysis of the Calculation Results
For the in-depth investigation of the distribution and changes of the stress field and deformation field of the surrounding rock, typical sections were selected for detailed analysis in the surrounding rock with different degrees of alteration. Section K32 + 230 was selected in the slightly altered surrounding rock with a burial depth of 905 m; section K32 + 455 was selected in the moderately altered surrounding rock with a burial depth of 860 m; section K32 + 630 was selected in the strongly altered surrounding rock with a burial depth of 930 m.
4.1. Analysis of Stress Field
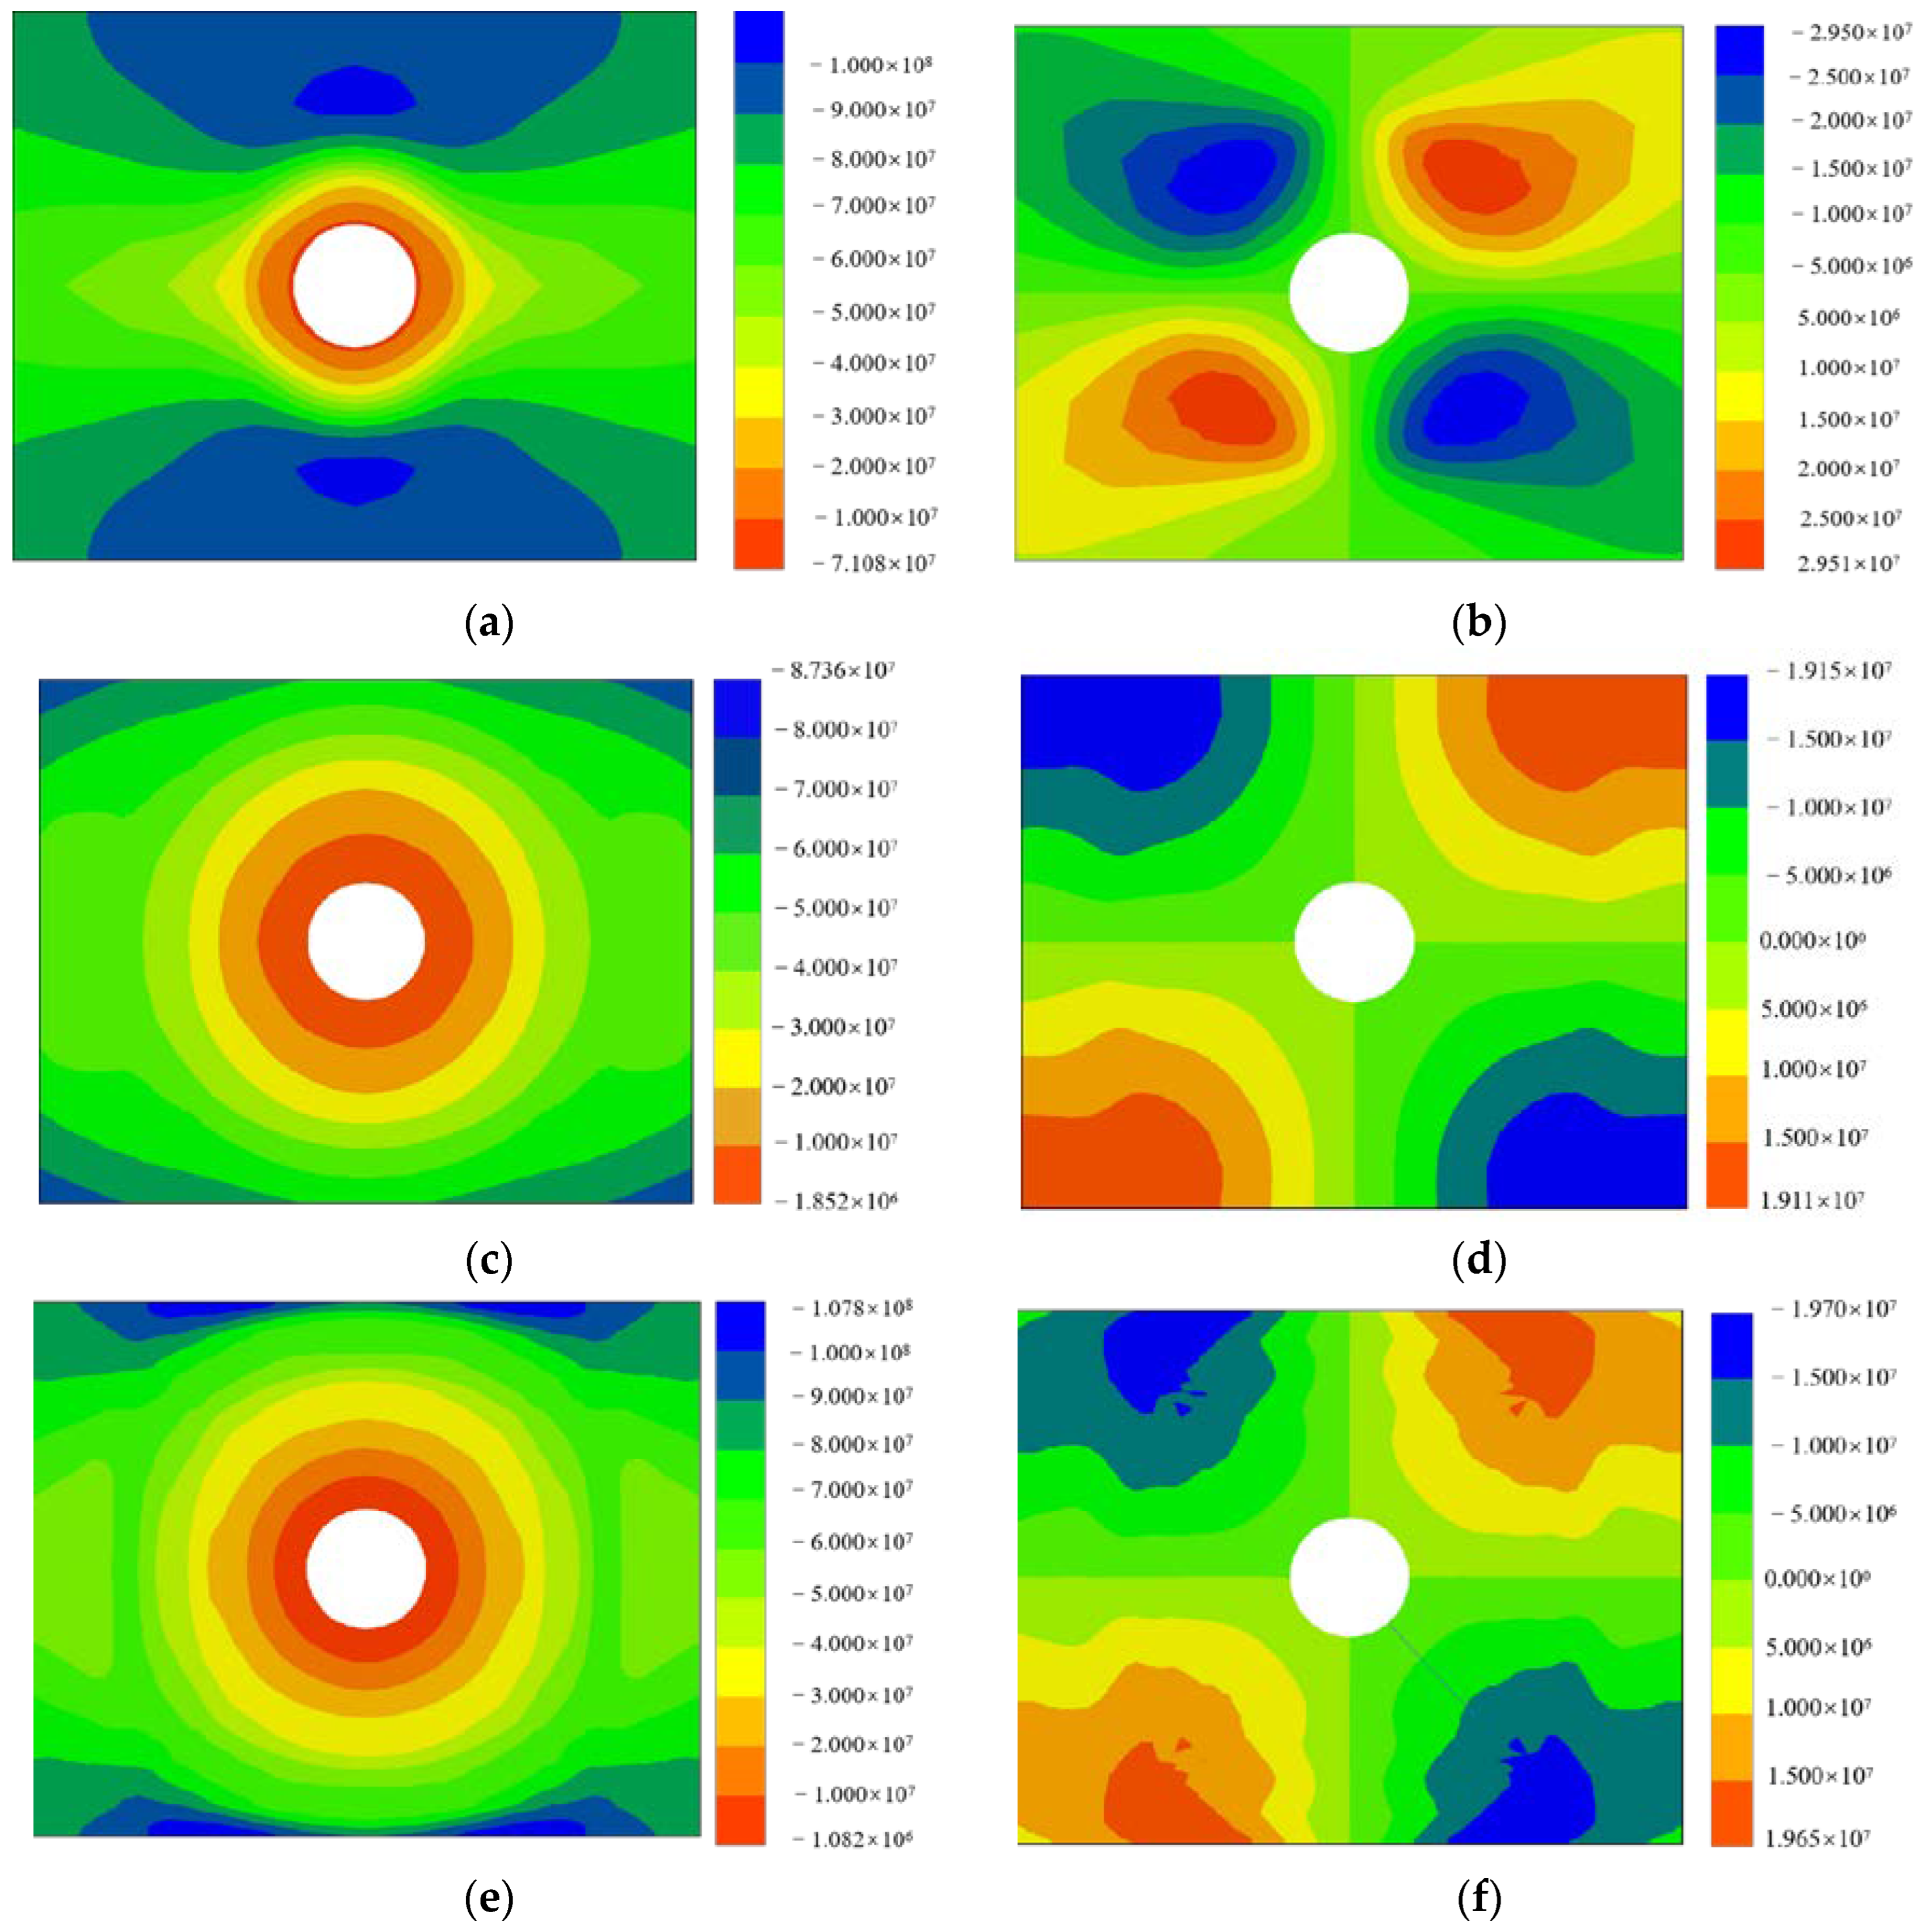
After the tunnel excavation, the horizontal maximum principal stress was approximately in line with the tunnel axis, ignoring its influence on the tunnel surrounding rock. The horizontal intermediate principal stress was approximately perpendicular to the tunnel axis, and the self-weight stress was the minimum principal stress. Provided that support measures were not used, under the influence of horizontal tectonic stress, a compressive stress concentration with a maximum value of 102.4 MPa appeared in the slightly altered surrounding rock section at the top and bottom 7.0 m of the chamber’s depth, and gradually decreased to the initial stress state as the distance from the chamber increased, as shown in
Figure 2a. Under the influence of chamber excavation and unloading, a stress reduction zone with a value of 54.6 MPa and influence depth of 16.0 m appeared in the surrounding rock on both sides and at the top of the chamber. Shear stress concentration appeared at the top and bottom corners of the cavern, and its maximum value was 29.5 MPa, as shown in
Figure 2b. Compressive stress concentration with a maximum value of 87.36 MPa appeared in the medium alteration surrounding rock section 20 m at the top and bottom corners of the cavern, and gradually decreased to the initial stress state as the distance from the cavern chamber increased; the influence depth was 28.0 m, as shown in
Figure 2c. A stress reduction zone appeared in the surrounding rock on both sides of the cavern chamber and at the top and bottom; its value was 42.3 MPa and its influence depth was 32.0 m. Shear stress concentration appeared at the top and bottom corner of the cavern, and its maximum value was 19.15 MPa, as shown in
Figure 2d. In the strongly altered surrounding rock section, compressive stress concentration occurred at a depth of 13.0 m from the bottom of the cavern, and had the maximum value of 107.8 MPa, as shown in
Figure 2e. In addition to the bottom of the cavern, a stress reduction zone with the minimum value of 49.04 MPa and small main stress influence depth of 35 m existed around the cavern. Shear stress concentration with an influence depth of 12.0 m existed at the top and bottom corners of the cavern. The maximum value was 19.7 MPa, as shown in
Figure 2f. The depth of stress influence was significantly higher in the moderately altered and strongly altered surrounding rocks compared to the slightly altered surrounding rock.
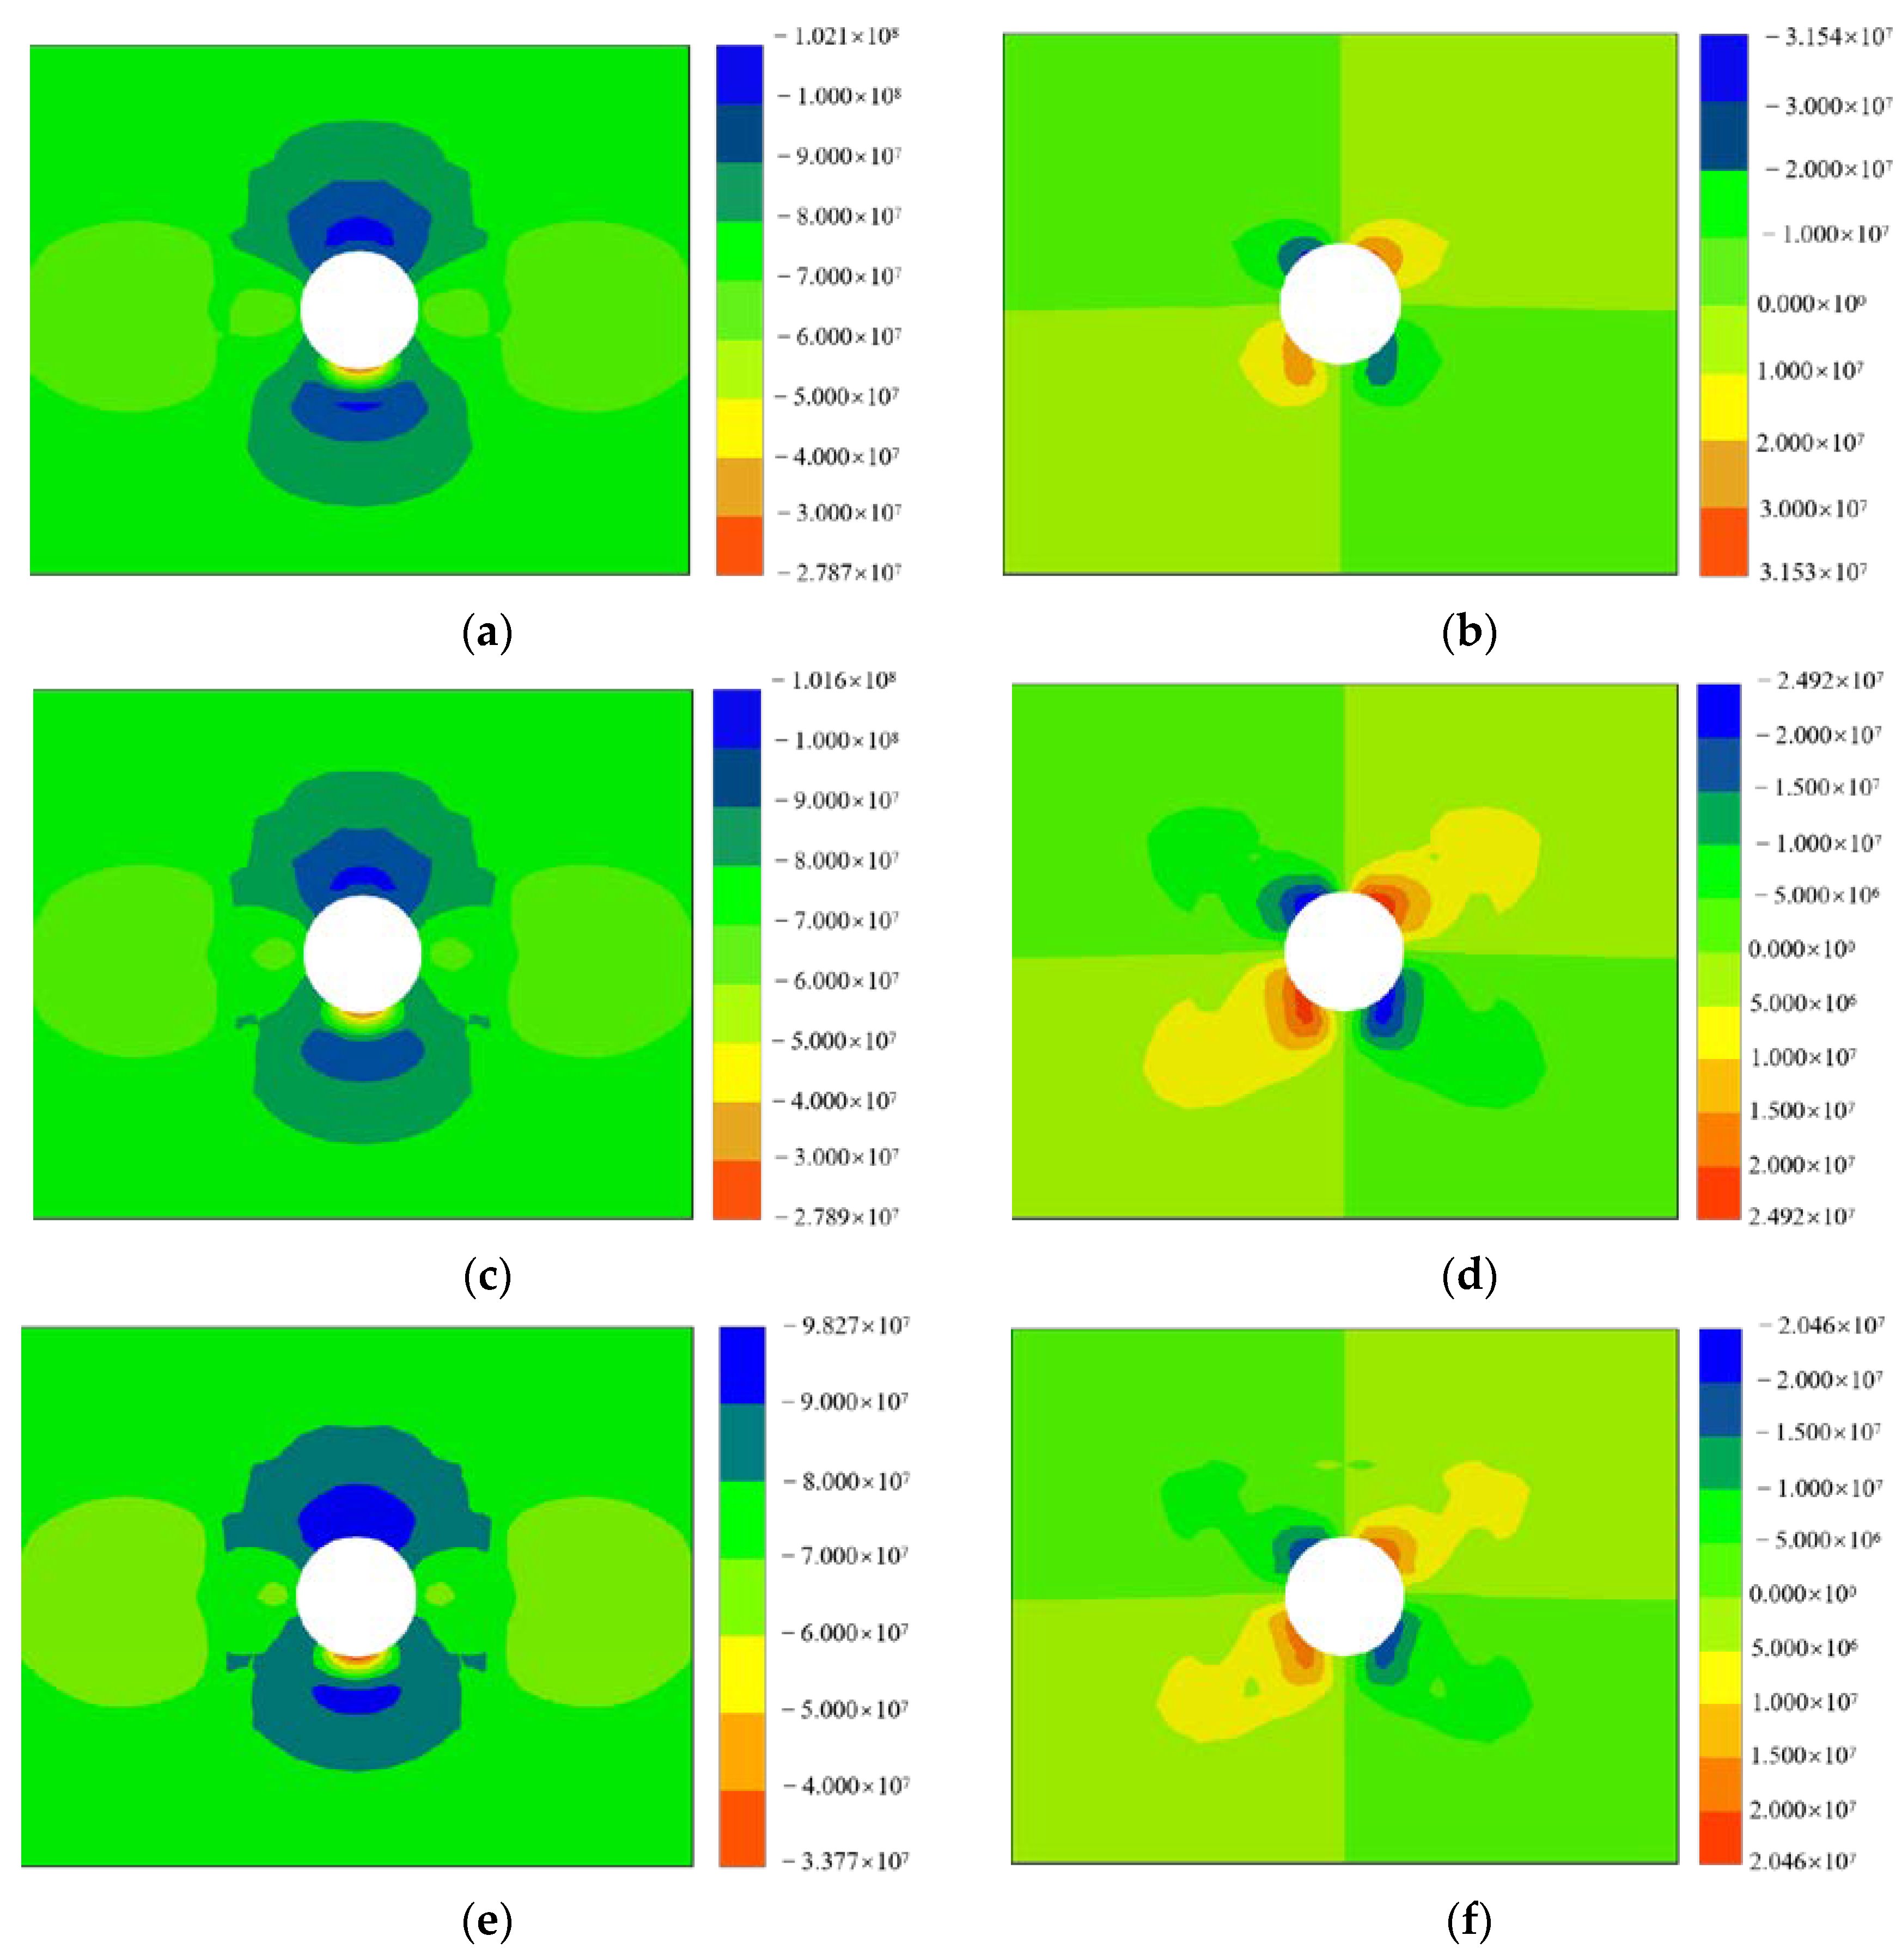
After using support measures, the slightly altered surrounding rock section exhibited compressive stress concentration in the surrounding rock at the top and bottom corners of the cavern, and its maximum value was 102.1 MPa, as shown in
Figure 3a. The stress reduction zone appeared at the bottom of the cavern, and its value was 59.9 MPa. Shear stress concentration appeared at the top and bottom corners of the cavern, and its maximum value was 31.5 MPa, as shown in
Figure 3b. In the moderately altered surrounding rock section, compressive stress concentration appeared at the top and bottom corners of the cavern, and its maximum value was 101.6 MPa, as shown in
Figure 3c. A stress reduction zone appeared at the side walls and bottom of the cavern, and its value was 61.4 MPa. Shear stress concentration appeared at the top and bottom corners of the cavern, and its maximum value was 24.9 MPa, as shown in
Figure 3d. Compressive stress concentration appeared at the top and bottom corners of the cavern section, with a maximum value of 98.3 MPa, and gradually decreased to the initial stress state as the distance from the cavern increased, as shown in
Figure 3e. A stress reduction zone with a minimum value of 61.06 MPa appeared in the side walls of the cavern. Shear stress concentration appeared at the top and bottom corners of the cavern, and its maximum value was 20.46 MPa, as shown in
Figure 3f.
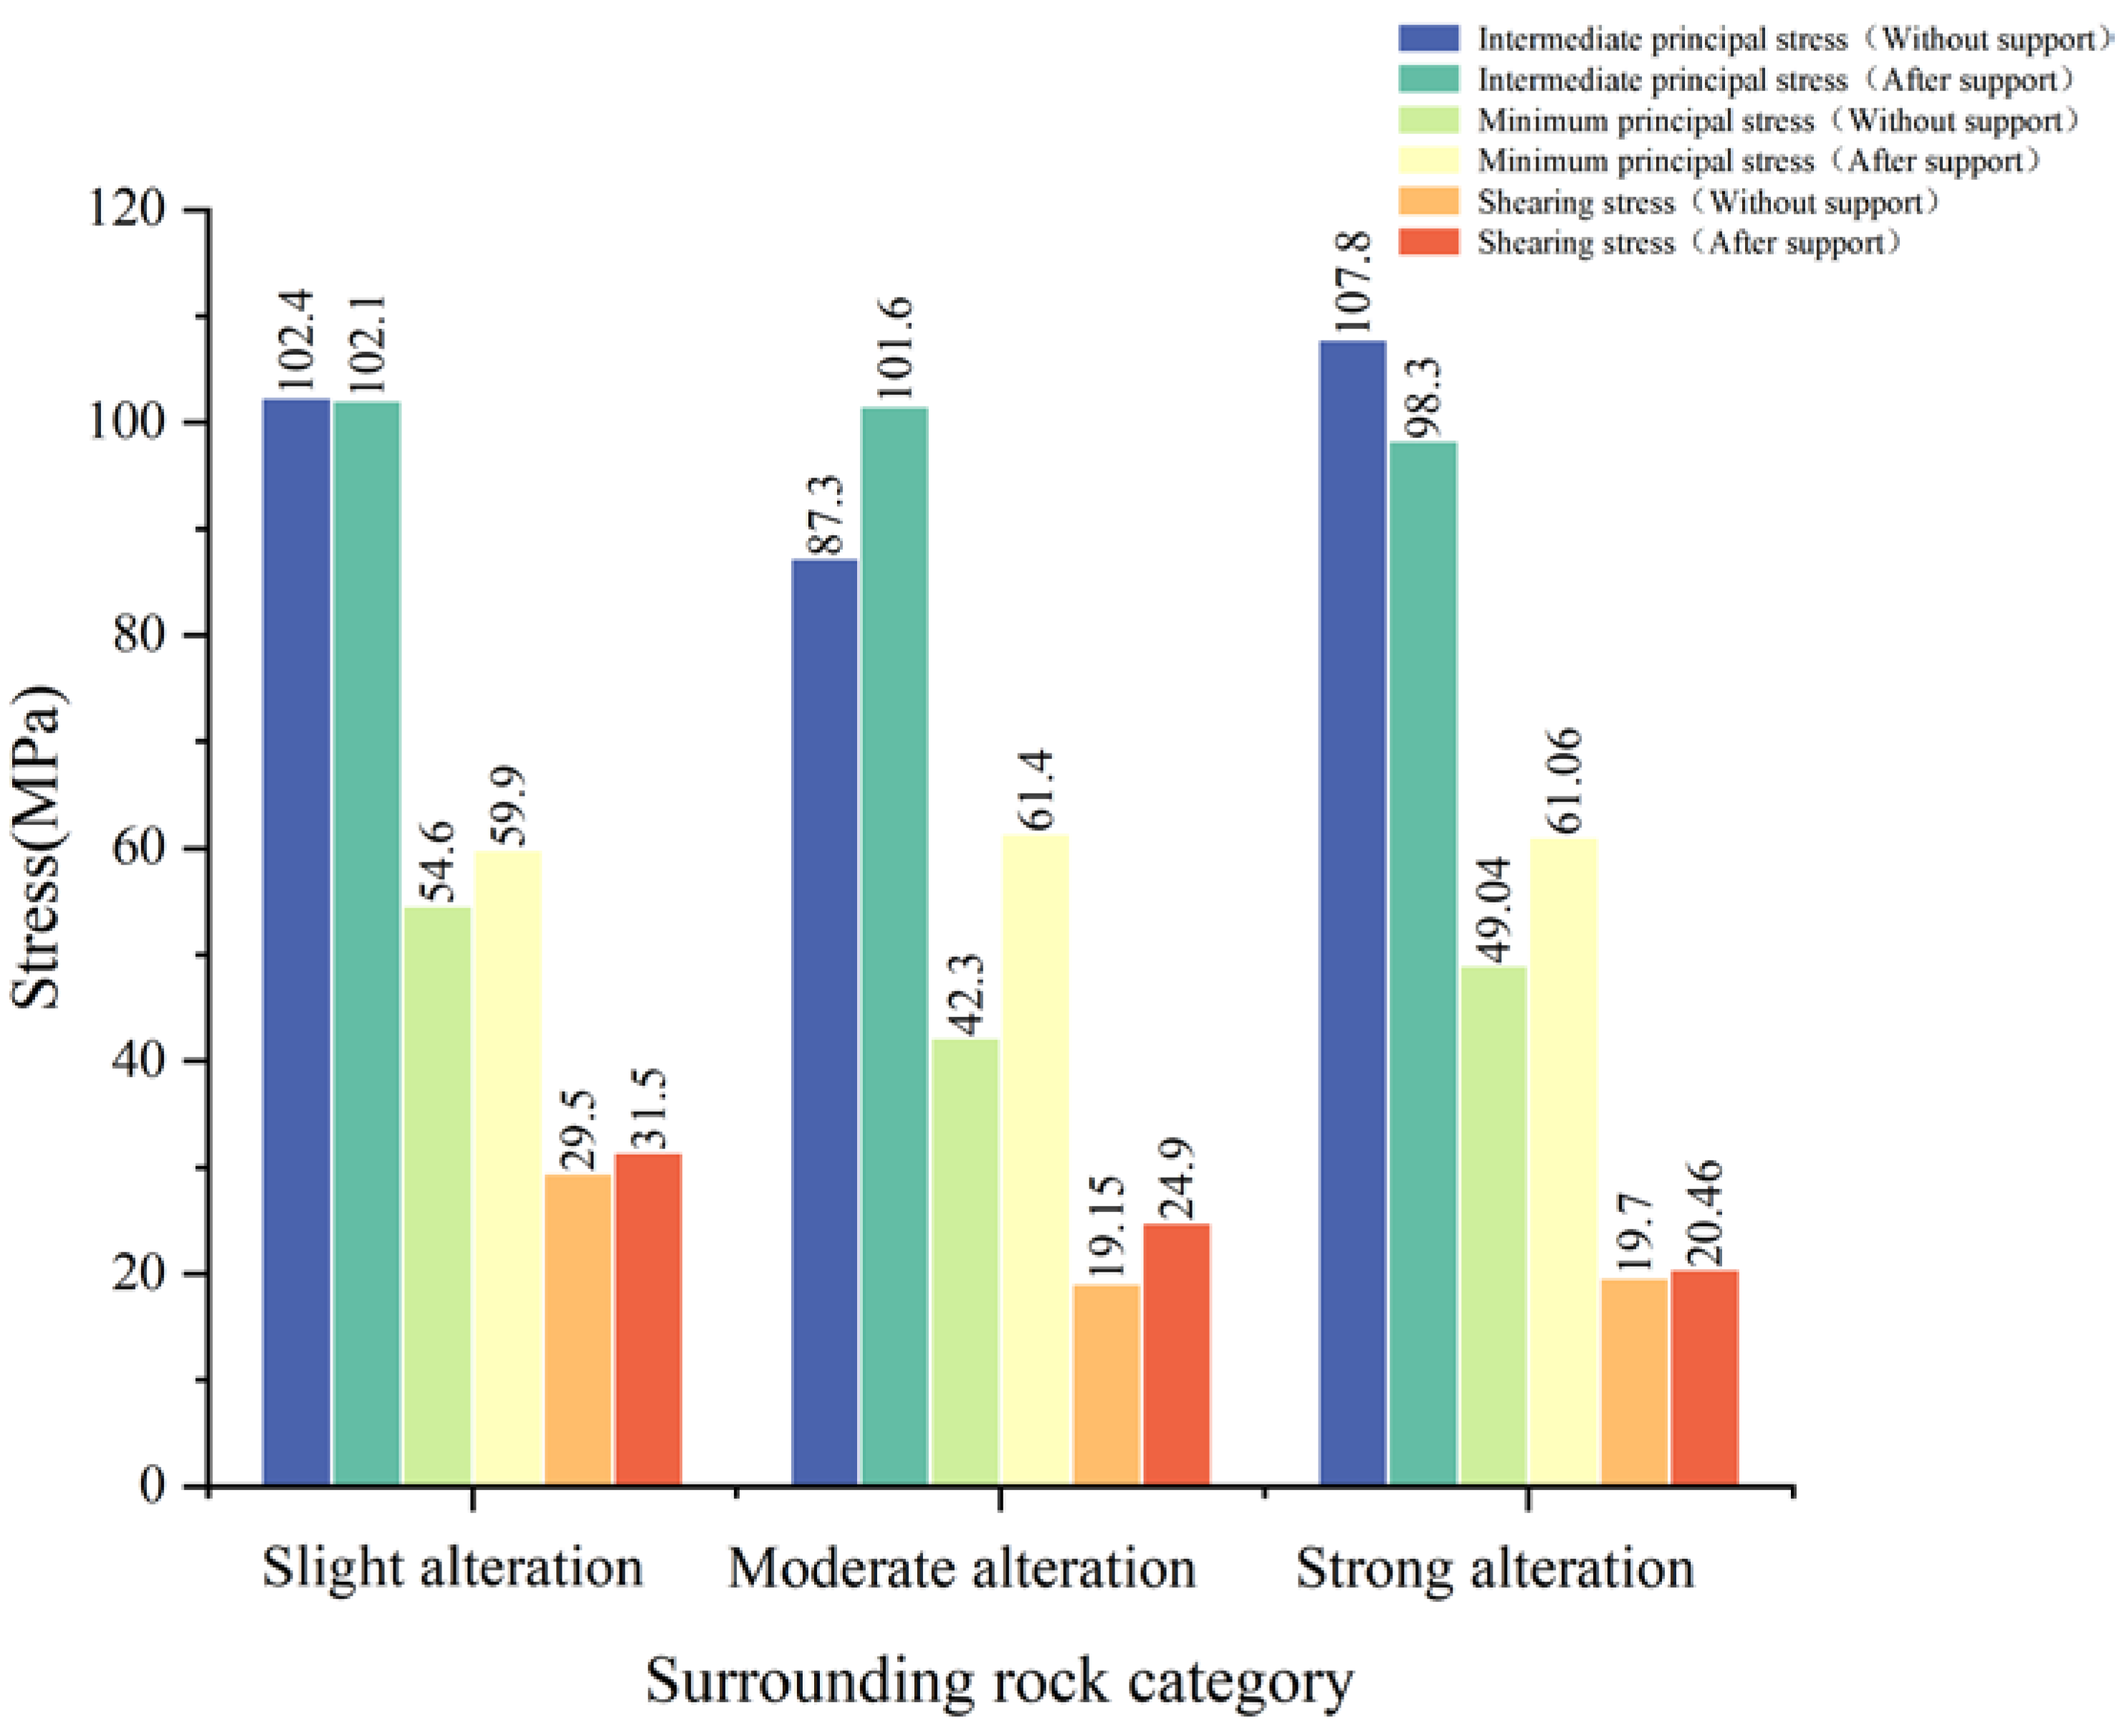
The comparison between the stresses in the unsupported and supported cavern chambers is shown in
Figure 4. As can be seen from the support, except for the strong alteration surrounding the rock section, owing to the occurrence of surrounding rock damage deformation and X-direction compressive stress reduction, the other stresses were increased by the surrounding rock owing to the restraining effect of the support structure.
4.2. Analysis of Surrounding Rock Displacement Field
In the natural state, the mountain displacement gradually decreases from top to bottom, with a stable trend in general, and the maximum displacement occurs in an area with large surface elevation and obvious surface undulation. The numerical simulation conducted by this study mainly considered the surrounding rock deformation caused by tunnel excavation. Therefore, the displacement in the natural state was considered to be zero, and the relative displacement of the surrounding rock after tunnel excavation was investigated on this basis.
In the tunnel excavation without support measures, the overall deformation of the surrounding rock after tunnel excavation was directed toward the cavern face; the top arch sank, the bottom slab rose, and the side walls moved inward.
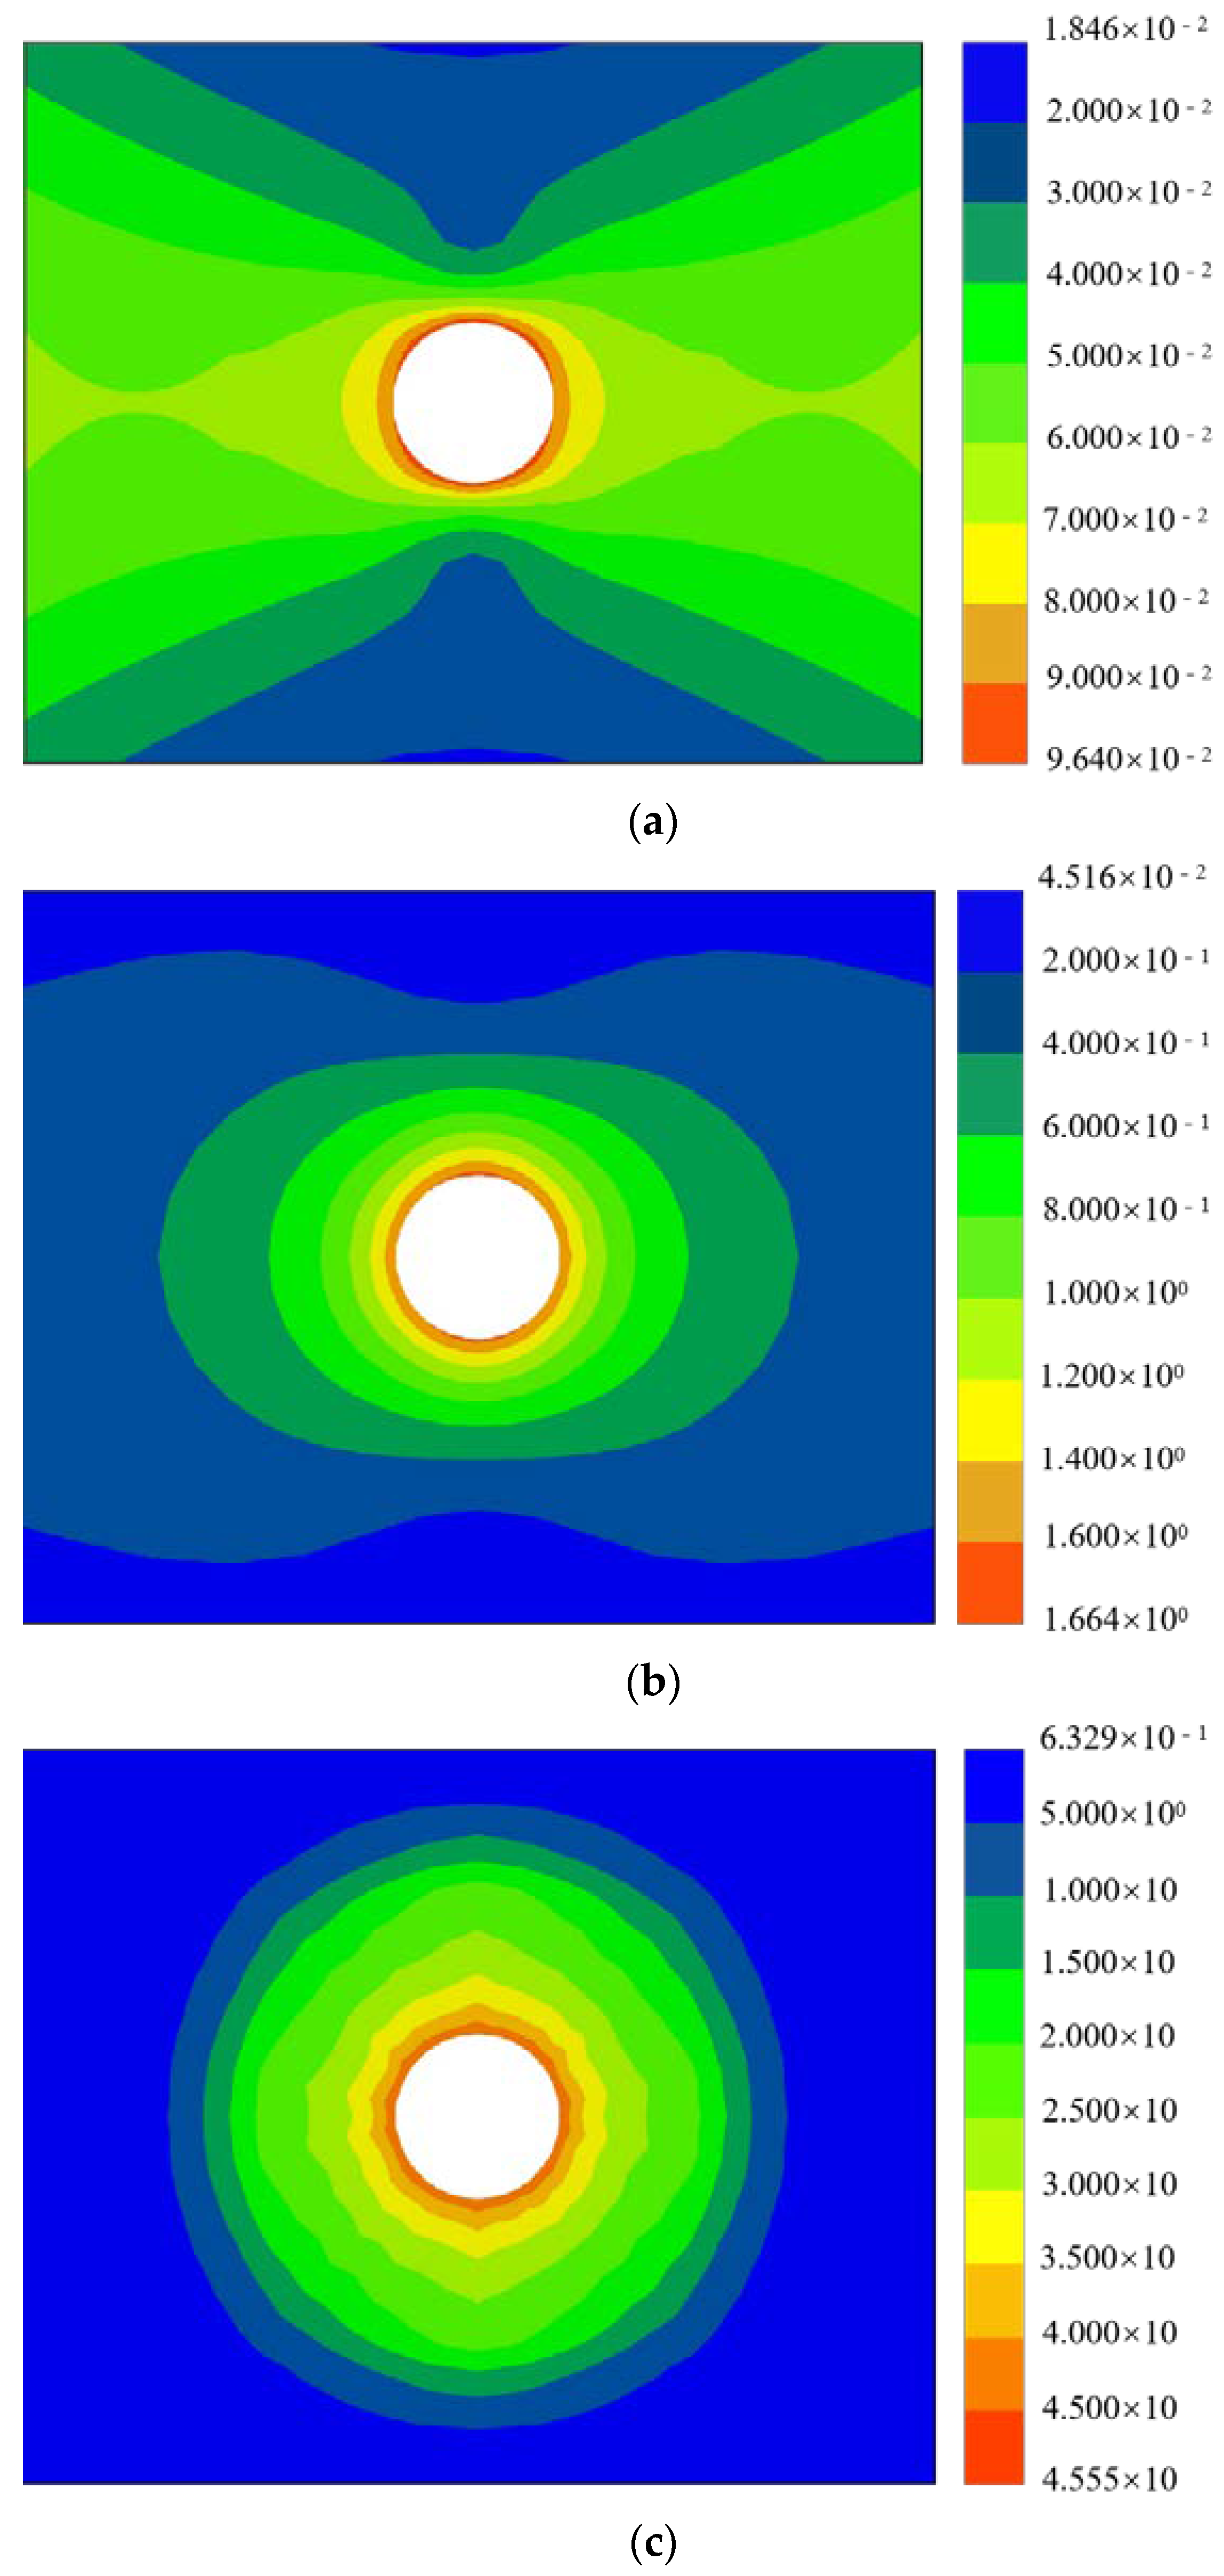
Figure 5 shows the displacement trend of each typical section of the surrounding rock under unsupported excavation. As can be seen, the maximum total displacement of the surrounding rock in the slightly altered section was 9.64 cm, and the displacement and impact depth of the top slab and sidewall were relatively large, while the displacement and impact depth of the bottom slab were relatively small. The deformation of the surrounding rock in the moderately altered section was larger than that in the slightly altered section, and the maximum total displacement was 166.4 cm. The maximum total displacement of the surrounding rock in the strongly altered section was 45.6 m, and the displacement at the base plate and sidewall was the most variable. In the displacement cloud distribution of each typical section (
Figure 5), the area of the surrounding rock deformation caused by cavern excavation was pie shaped. Because of the large burial depth, the displacements of the surrounding rock in the vertical direction (Z-direction) and vertical tunnel direction (X-direction) were relatively large owing to the influence of self-weight stress and horizontal tectonic stress, while the displacement in the tunnel extension direction (Y-direction) was small. Owing to the influence of the degree of rock erosion, the displacement of the and moderately altered section (section 32 + 455, depth of 860 m) was much larger than that of the slightly altered section (section 32 + 230, depth of 905 m). Considering the discontinuity characteristics of the rock, it is concluded that large deformation damage occurs frequently. The strongly altered section (section 32 + 630, depth of 930 m) had actually been completely destroyed by large deformation.
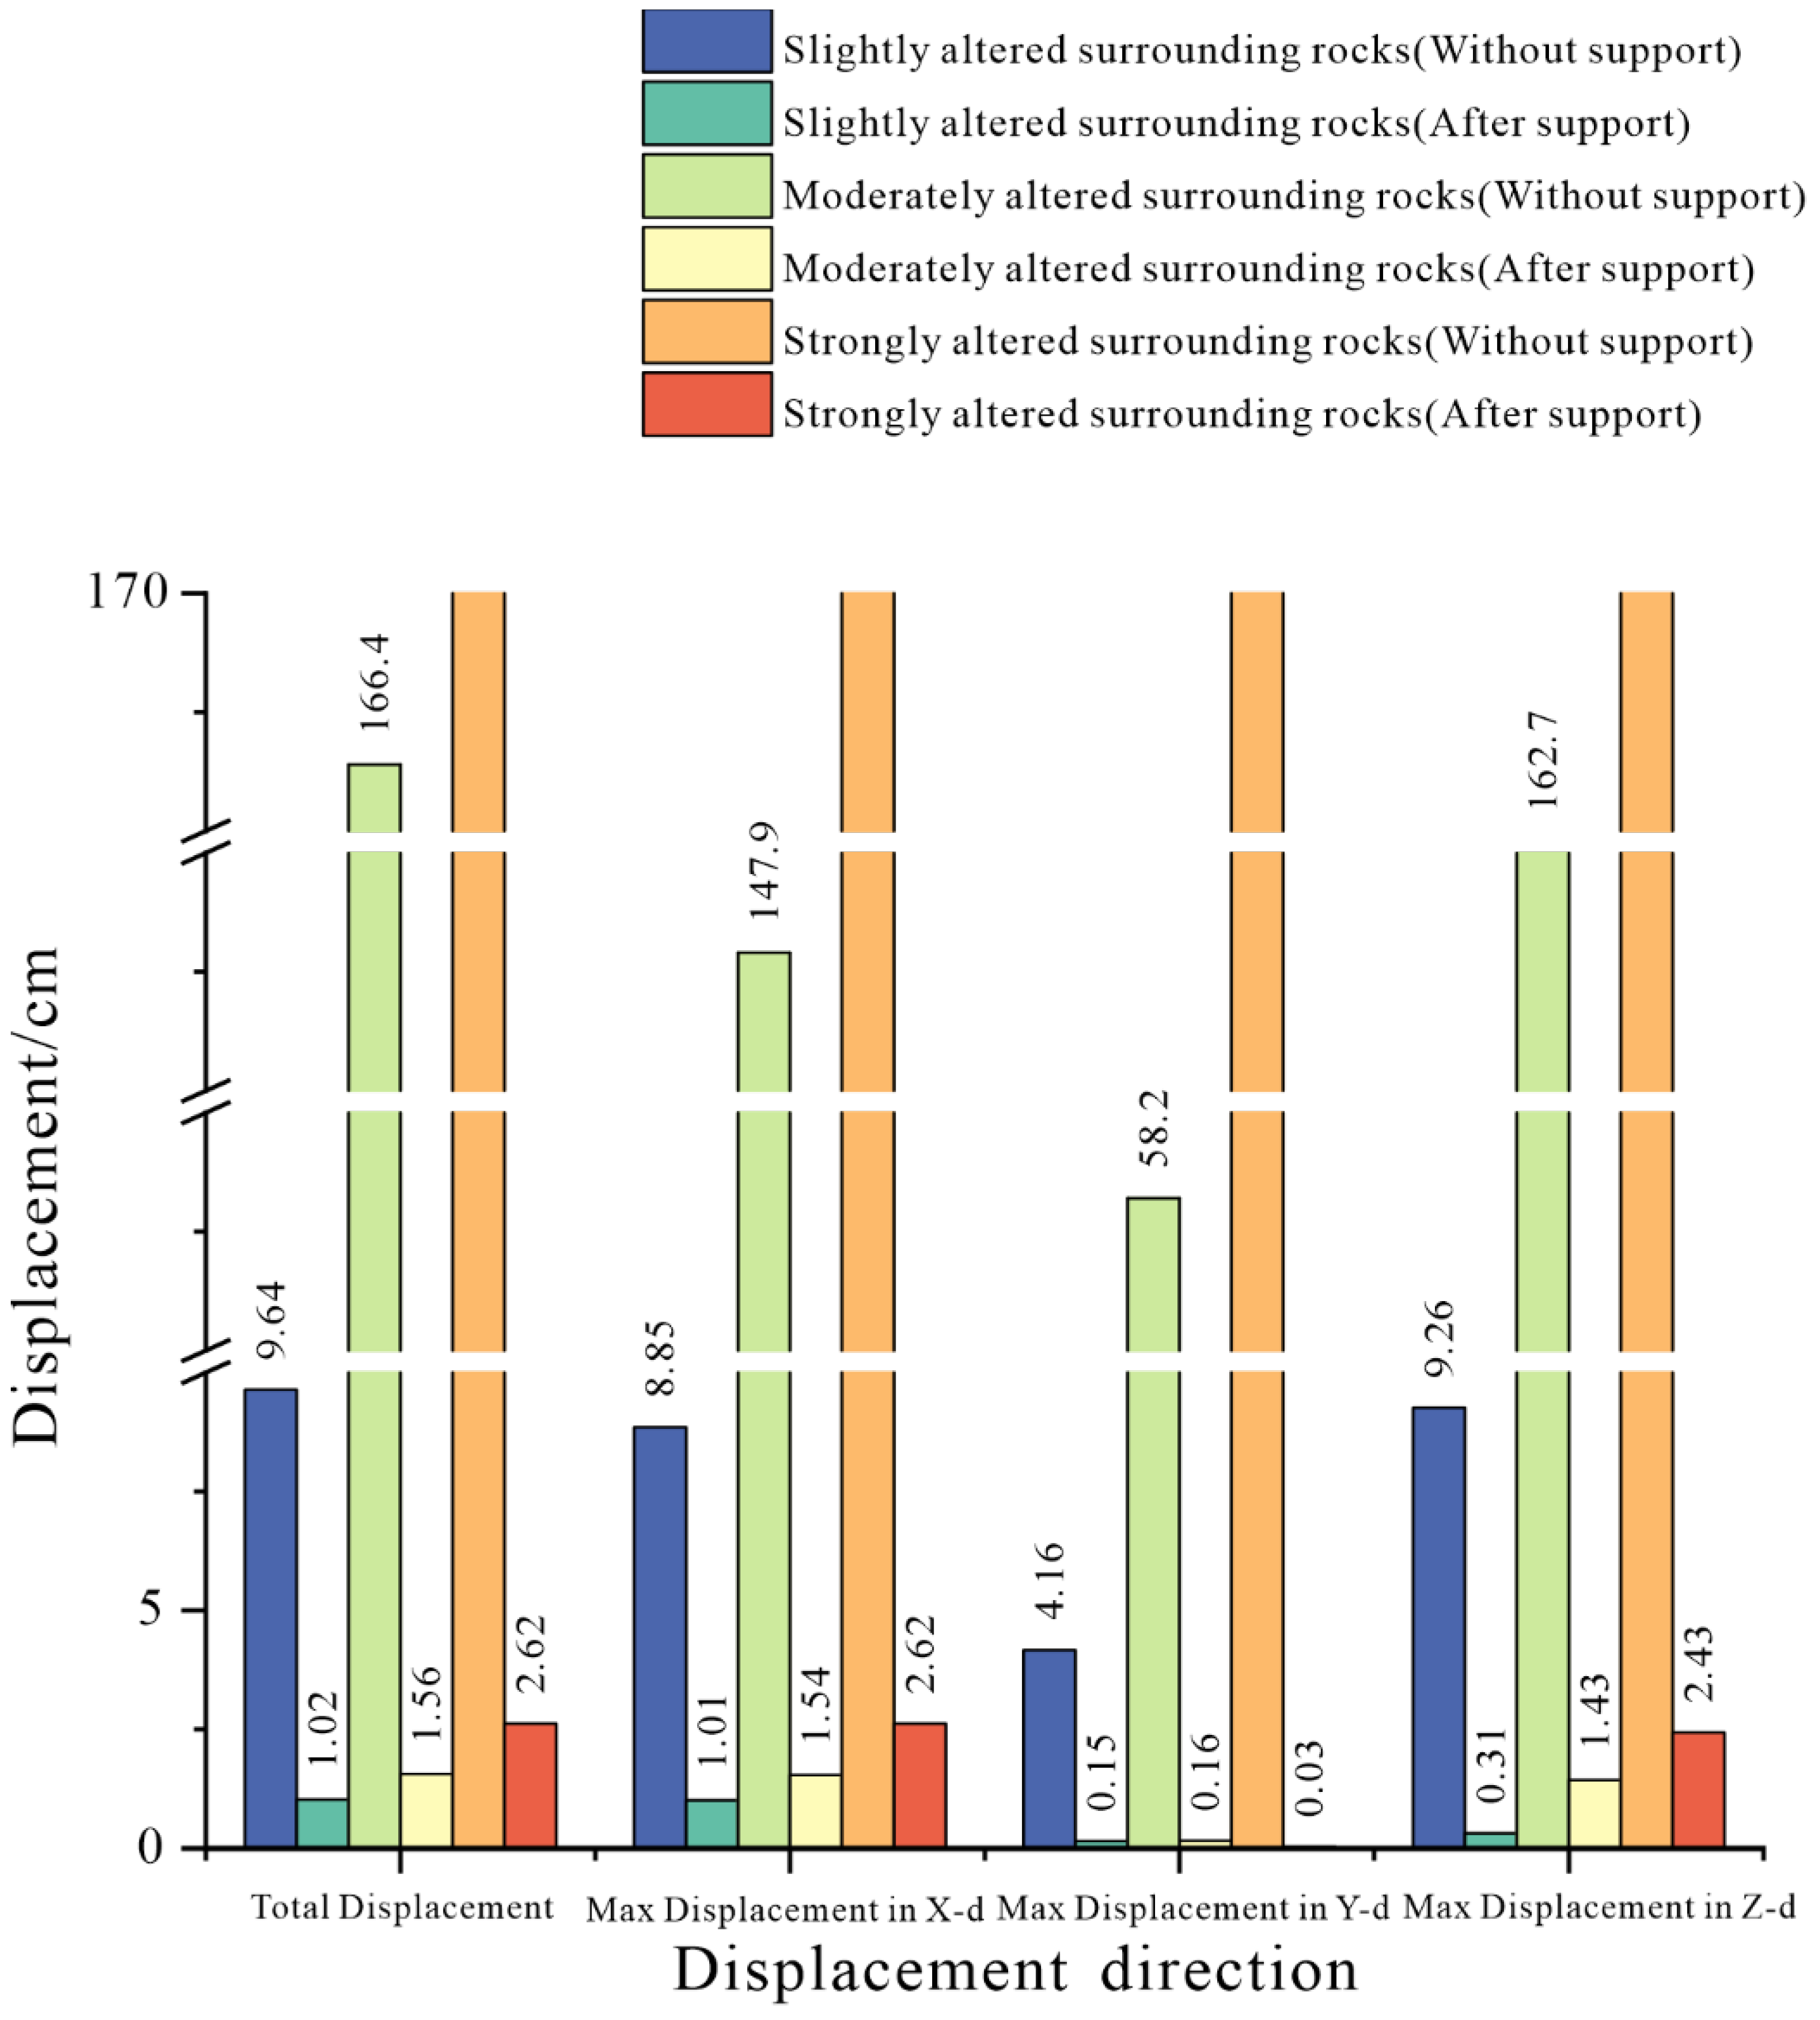
After adopting support measures, such as the anchors of a grouting reinforcement system, steel arch, shotcrete, and reinforcement mesh, the deformation area of the surrounding rock caused by tunnel excavation became butterfly shaped, and the deformation area of the surrounding rock was mainly concentrated at the side wall, whose displacement and influence depth were relatively large while the displacement and influence depth of the top arch and bottom slab were relatively small.
Figure 6 shows the typical section displacement changes of each surrounding rock under supported excavation. As can been seen, the maximum total displacement of the slightly altered surrounding rock section was 1.02 cm, the maximum total displacement of the moderately altered surrounding rock section was 1.56 cm, and the maximum total displacement of the strongly altered surrounding rock section was 2.62 cm. The main reason for this is that the horizontal structural stress was the maximum main stress and the vertical stress was the minimum main stress in the tunnel. This led to the displacement of the surrounding rock, which was caused by the lateral expansion effect as the main contradiction, and the displacement of the top and bottom slab as the secondary contradiction, coupled with a high degree of fragmentation, extremely low mechanical strength, and the poor integrity of the strongly altered rock body, which led to the downward movement of the bottom slab under the influence of excavation disturbance and the constraint of the support effect during the excavation process (
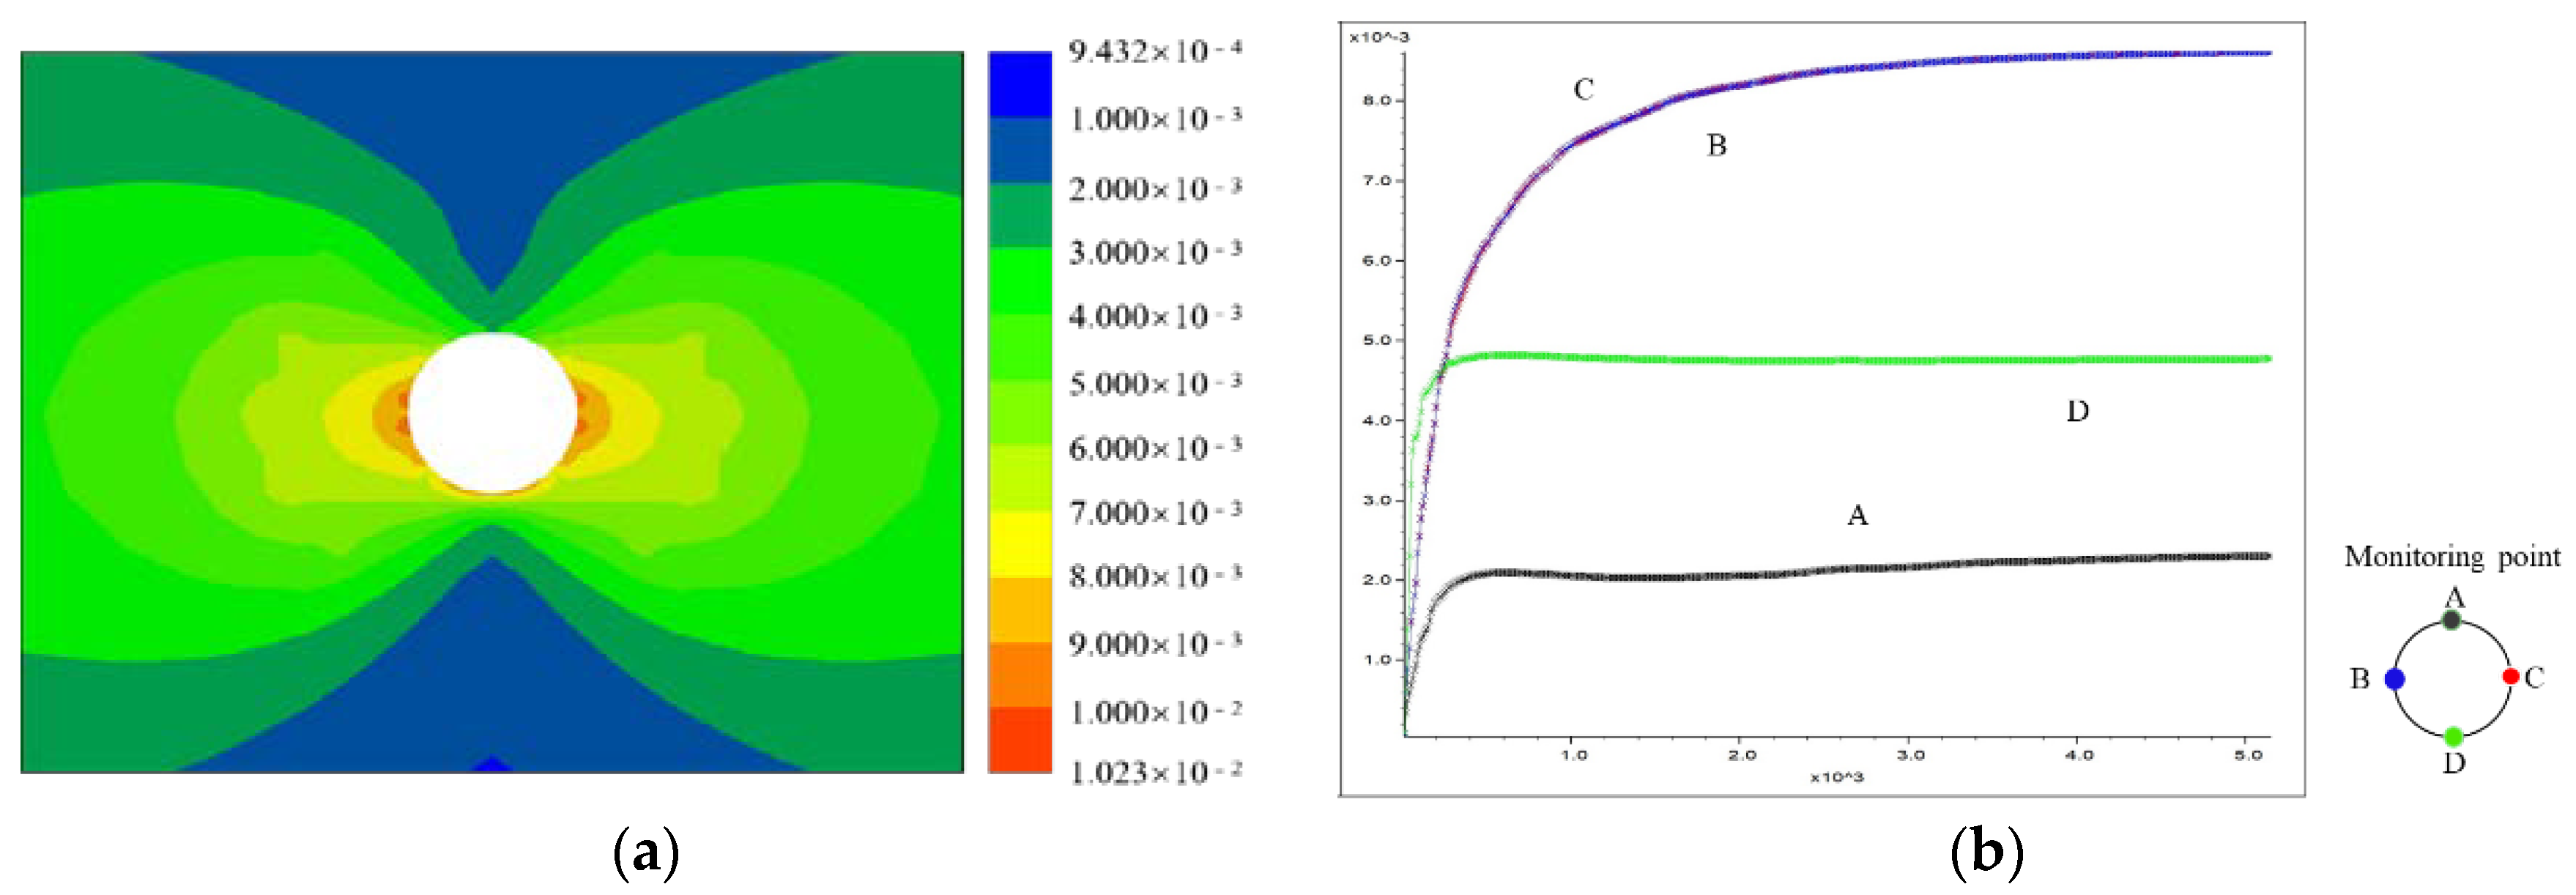
Figure 7a,c,e).
In the calculation process, to monitor the deformation evolution process of each type of surrounding rock after tunnel excavation, displacement monitoring points were set at the top plate, both walls, and bottom plate of the cavern; the monitoring results are shown in
Figure 7b,d,f. It can be seen that after the use of support measures, the displacement monitoring amount of all types of surrounding rocks in the cavern was significantly reduced, and the surrounding rocks of the tunnel exhibited the largest displacement at the cavern side walls, followed by the bottom slab and smallest top slab. Among them, the displacement of the top plate of the slightly altered surrounding rock was 0.23 cm, the maximum displacement of both walls was 0.86 cm, and the displacement of the bottom plate was 0.48 cm. The maximum displacement of the top plate of the moderately altered surrounding rock was 0.32 cm, the maximum displacement of both walls was 1.30 cm, and the maximum displacement of the bottom plate was 0.88 cm. The displacement of the top plate of the strongly altered surrounding rock was 0.56 cm, the maximum displacement of both walls was 2.19 cm, and the displacement of the bottom slab was 1.62 cm.
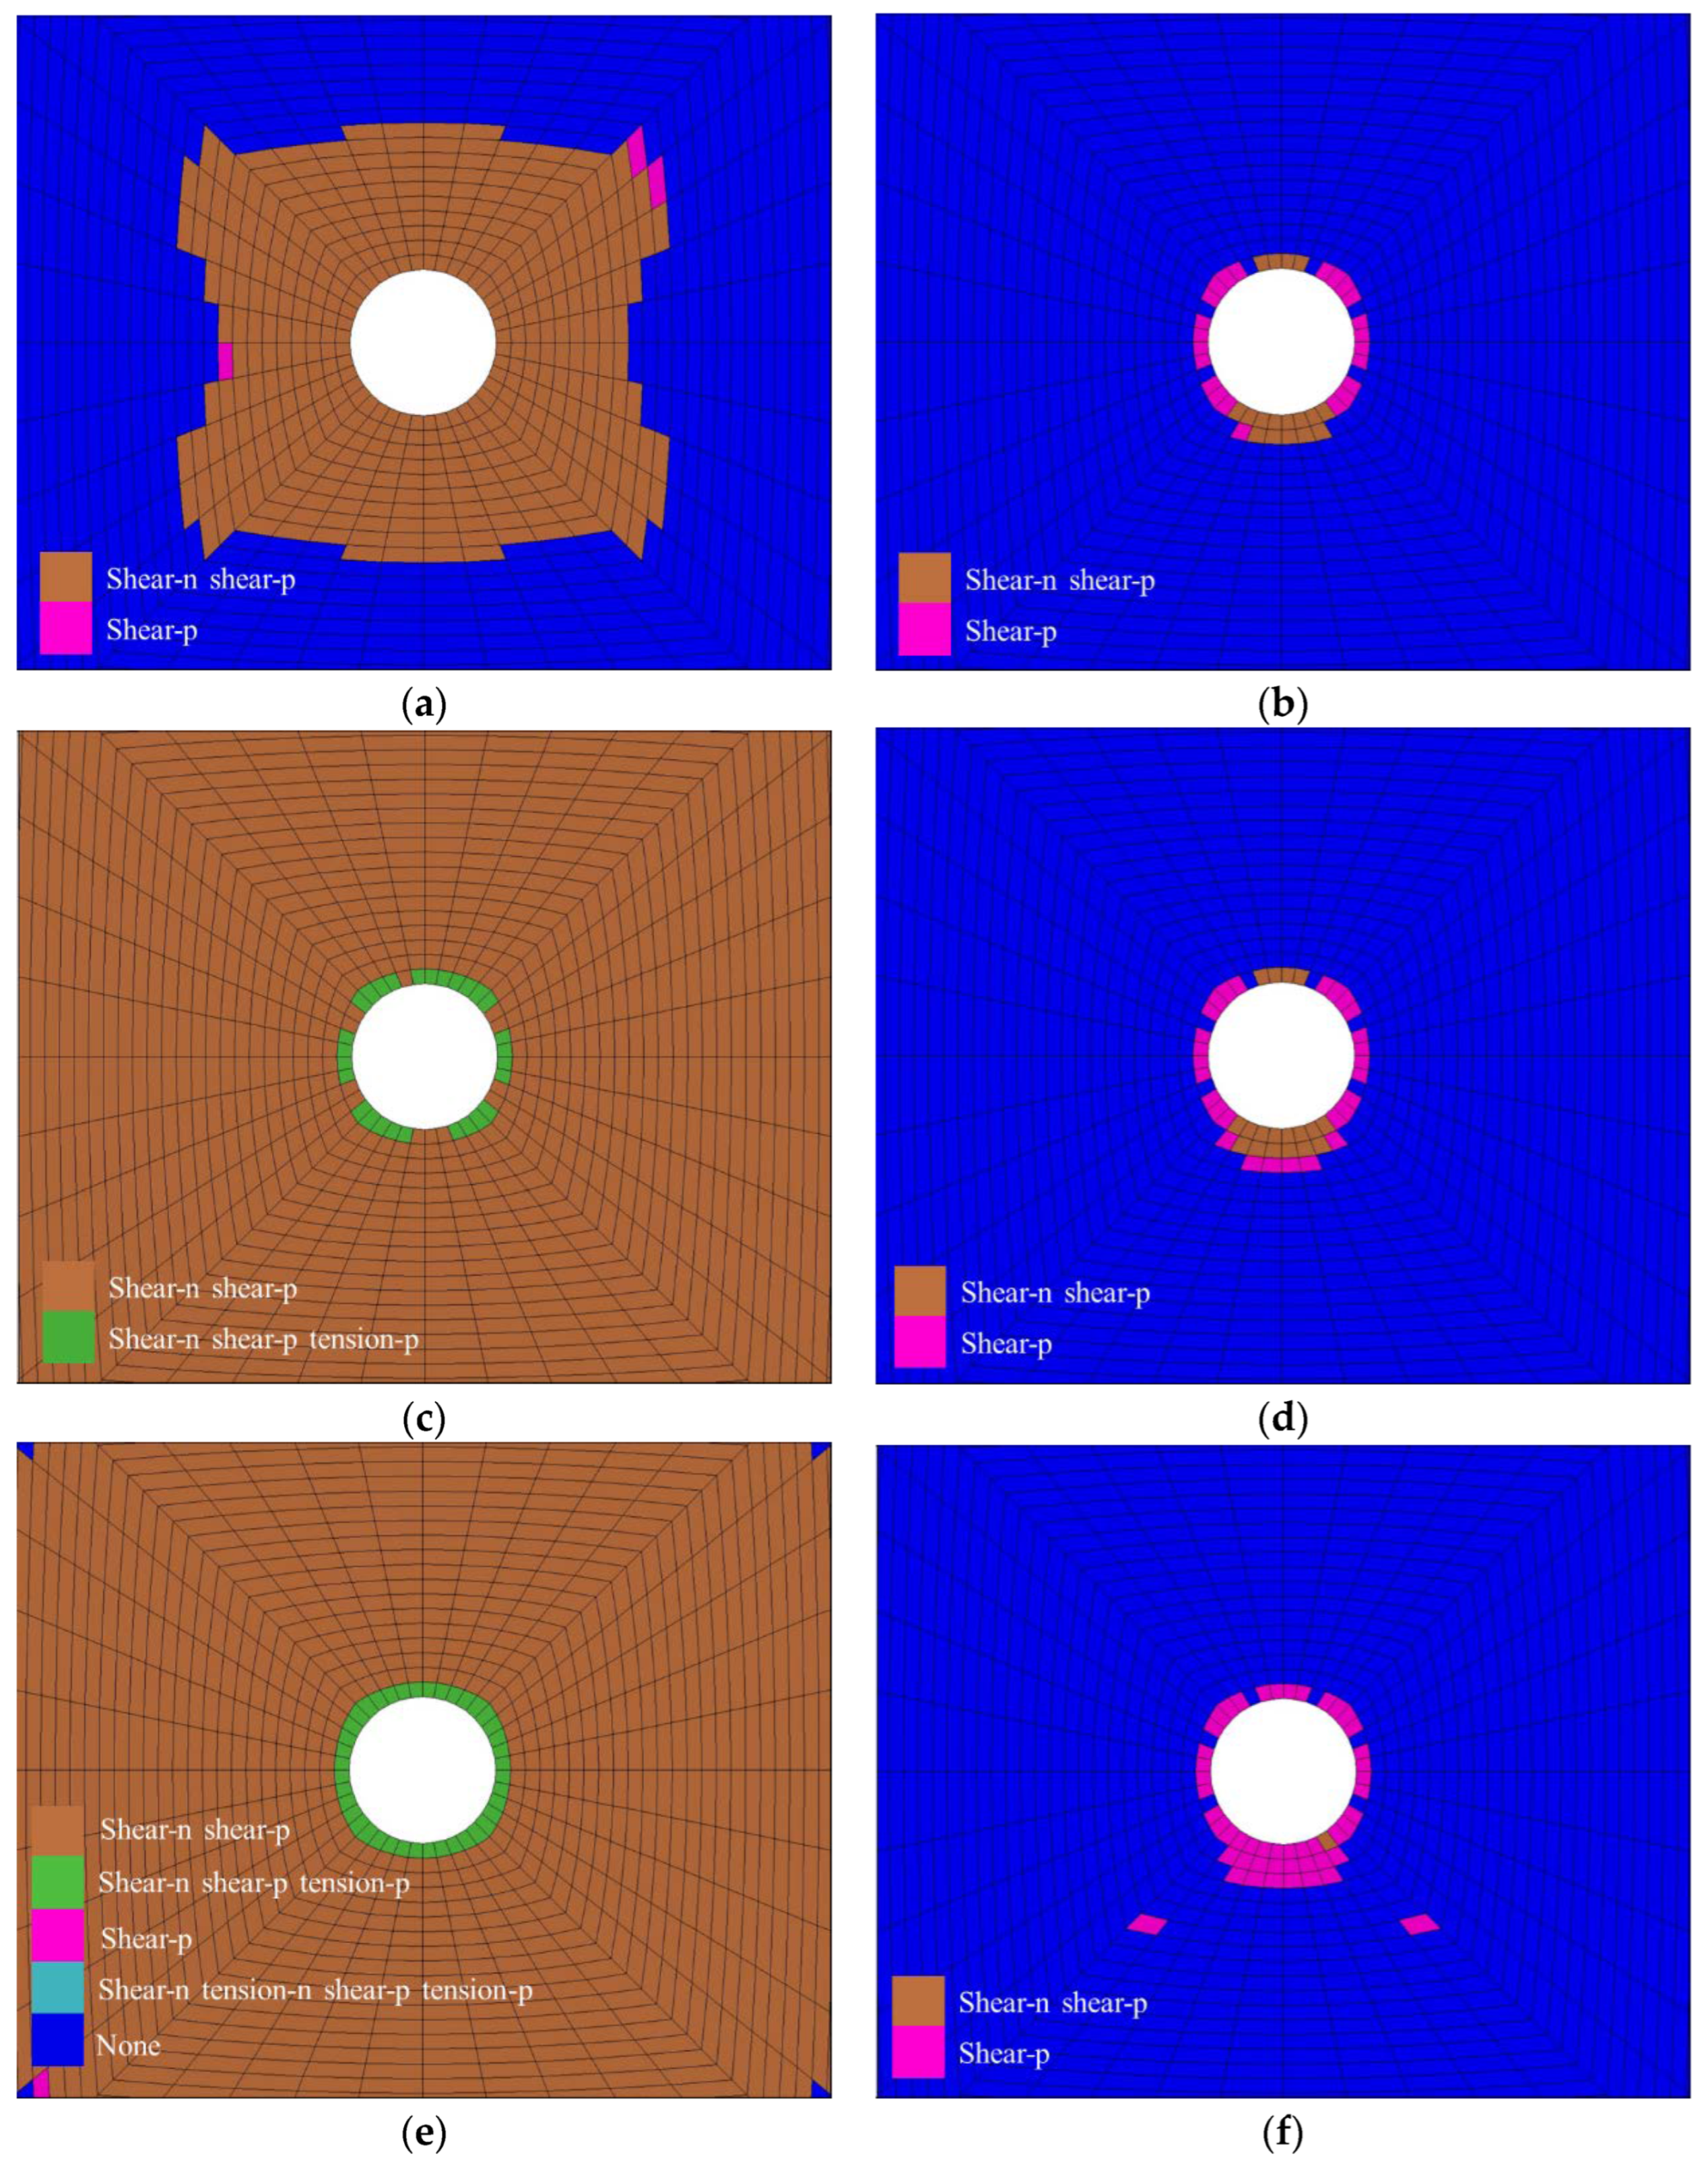
4.3. Analysis of the Plastic Zone of Surrounding Rock
The size and distribution characteristics of the plastic zone reflect the mechanical properties of the surrounding rock. Additionally, they characterize the actual size of the loosening zone of the tunnel surrounding rock after excavation and unloading, and the degree of disturbance to the surrounding rock in each excavation phase. After excavation, because of the increase in the large principal stress and decrease in small principal stress in the surrounding rock, the surrounding rock unit was in the form of compression–shear damage; the distribution of its plastic zone is shown in
Figure 8.
In the natural state, the damage depth of the plastic zone was approximately 8.0–10.0 m for slightly altered surrounding rock (section 32 + 230, depth of 905 m), approximately 20.0 m for moderately altered surrounding rock (section 32 + 455, depth of 860 m), and the strongly altered section of the perimeter rock had been completely destroyed and the depth of impact was too great, after tunnel excavation, as shown in
Figure 8a,c,e.
After the use of support measures, the extent of the plastic zone in the surrounding rock decreased significantly compared with the unsupported condition, and the depth of damage of the plastic zone in the slightly altered surrounding rock (section 32 + 230, depth of 905 m) decreased to approximately 1.0–2.0 m. The depth of damage of the plastic zone in the moderately altered surrounding rock (section 32 + 455, depth of 860 m) decreased to approximately 1.0–3.0 m, and the depth of damage of the plastic zone in the strongly altered surrounding rock (section 32 + 630, depth of 930 m) decreased to approximately 0.6–1.0 m. The depth of damage in the plastic zone (section 32 + 630, depth of 930 m) decreased to approximately 1.0–3.0 m, as shown in
Figure 8b,d,f.
4.4. Recheck of the Surrounding Rock Deformation
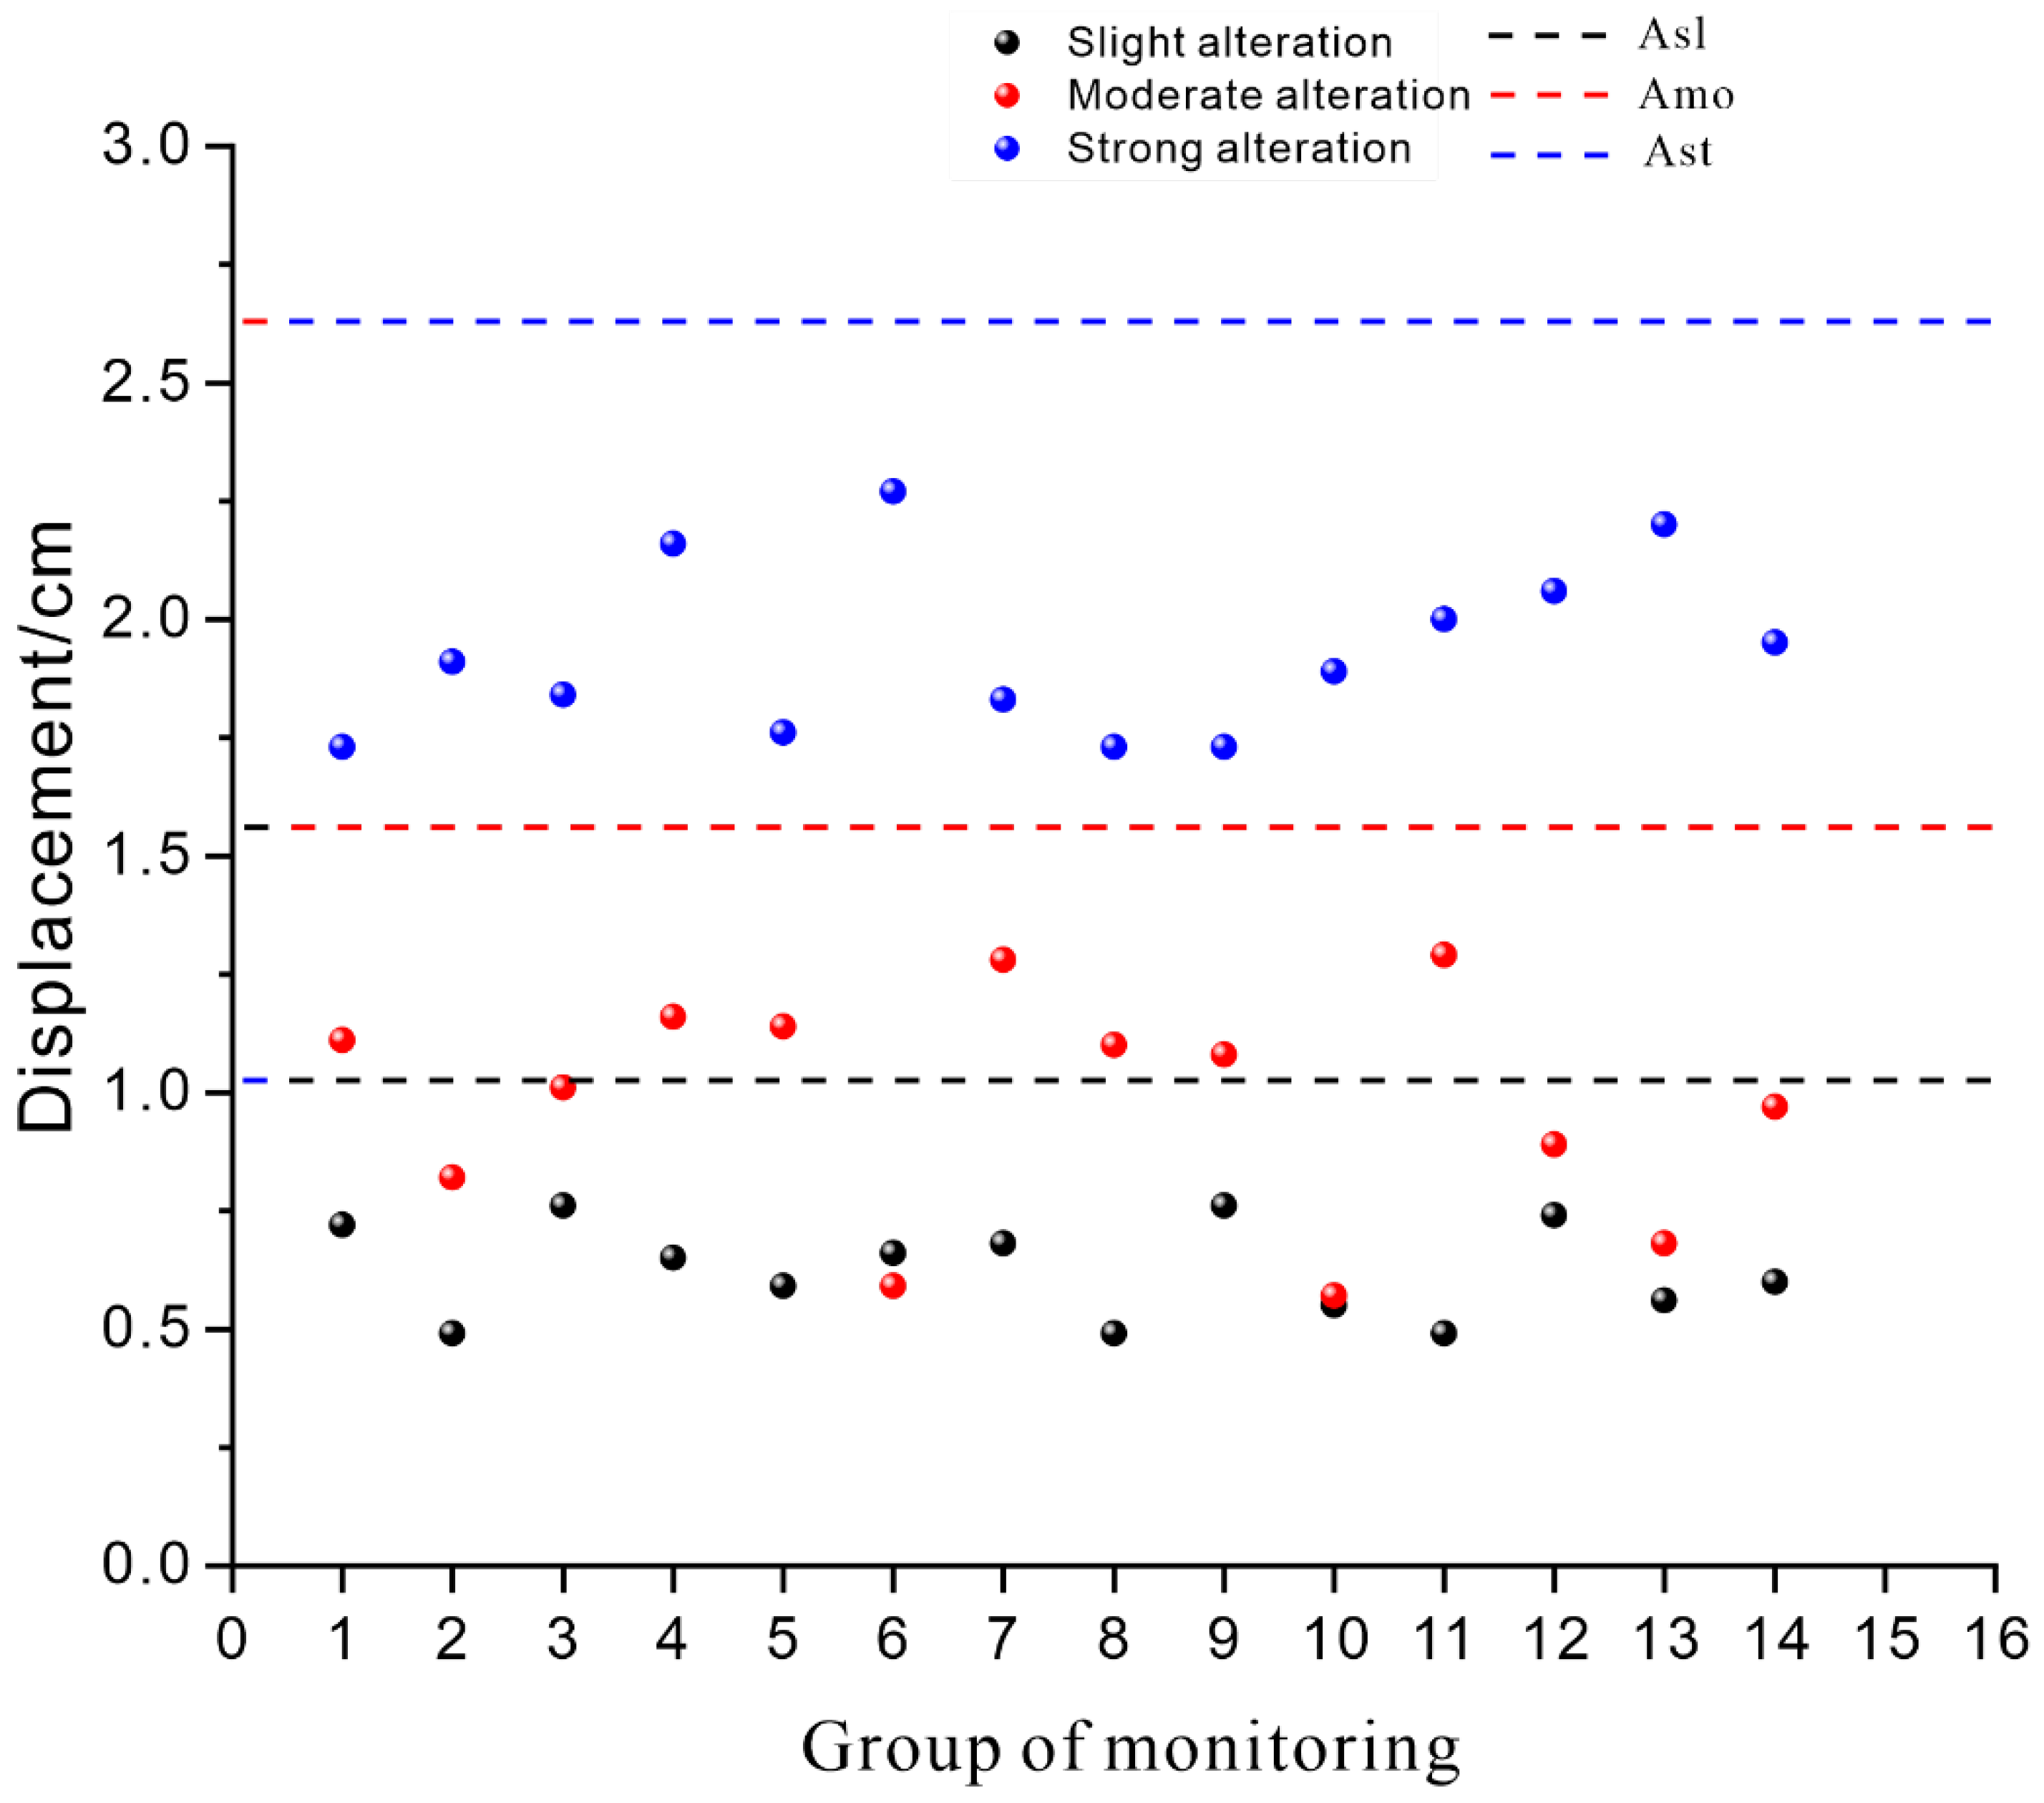
During the tunnel boring process, it was found that the deformation of the steel arch was mainly concentrated within 24 h after excavation, after which it gradually stabilized, and the final deformation was less different to the 24 h monitoring value. Therefore, 14 monitoring points with different degrees of alteration were randomly selected for each section of the excavation, and the above-mentioned support method was used to monitor and count the displacement changes of the steel arch after 24 h. The actual monitoring values are presented in
Table 7 and
Figure 9. Among them, the deformation of the steel arch in the slightly altered rock section ranged from 0.49 to 0.76 cm, and the average value was 0.62 cm. The deformation of the steel arch in the moderately altered rock section ranged from 0.57 to 1.29 cm, and the average value was 0.97 cm. The deformation of the steel arch in the strongly altered rock section ranged from 1.73 to 2.27 cm, and the average value was 1.93 cm.
After comparison with the numerical simulation results, it was found that the average value of the actual deformation of various altered rocks was basically consistent with the numerical simulation results, and the error was controlled within 1 cm, which validated the numerical simulation. The deformation of some moderately altered rocks was lower than the average value of deformation of slightly altered rocks, which indicates that moderately altered rocks still possessed a certain strength, and the rocks had good stability under supporting measures. The maximum deformation value of strongly altered rocks was 2.27 cm, which was significantly lower compared with unsupported excavation. Hence, the deformation of the surrounding rock was effectively controlled, which verified the reasonableness of the support measures.
5. Conclusions
This study carried out numerical simulations of a typical tunnel section excavated in the study area under unsupported and supported conditions using the FLAC3D software. The stress field, displacement field, and plastic zone of a typical section of the surrounding rock were selected for calculation and comparison, and the results were analyzed. The following conclusions were drawn:
After tunnel excavation, under the action of tectonic stress, the initial horizontal tectonic stress field was much larger than the vertical self-gravity stress field, and the intermediate principal stress and minimum principal stress exerted greater influence on the surrounding rock. Stress redistribution in the mountain body led to the concentration of compressive and shear stresses within a certain depth of the cavern surrounding rock. Under the influence of horizontal tectonic stress, the displacement of the rock around the tunnel was maximum in the vertical tunnel direction (X-direction) followed by the vertical direction (Z-direction), and minimum in the tunnel extension direction (Y-direction). Based on the displacement monitoring curve of the surrounding rock, it is concluded that the displacement of the side wall of the cavern chamber was the largest, followed by the bottom plate and smallest top plate;
Under unsupported tunnel excavation, the surrounding rock underwent plastic damage at a certain depth range and large deformation damage was likely to occur owing to the discontinuous characteristics of the rock body. After implementing support measures, the stress in all directions of the tunnel surrounding rock increased owing to the restraint of the surrounding rock by the support structure, and the deformation of the surrounding rock was effectively controlled;
The comparison between the stress and displacement field results for the more strongly altered section and slightly altered section revealed that the deformation of the tunnel surrounding rock increased significantly with the deepening of alteration, and the alteration destroyed the original structure of the surrounding rock body, which led to the reduction in its stiffness and strength, and thus increased the deformation of the surrounding rock such that destabilization damage occurred. After implementing support measures, the deformation of the tunnel decreased significantly. The actual monitoring value of the surrounding rock displacement was consistent with the simulation results, and the support scheme was reasonable, which provides a theoretical basis for the design and construction of similar projects.
Author Contributions
Conceptualization, Y.C.; methodology, J.D.; software, J.L.; validation, T.W., Y.C. and J.D.; formal analysis, S.S.; investigation, X.Y.; resources, Y.C.; data curation, S.S.; writing—original draft preparation, S.S.; writing—review and editing, J.D.; visualization, S.S.; supervision, J.D.; project administration, T.W.; funding acquisition, Y.C. All authors have read and agreed to the published version of the manuscript.
Funding
This research work was sponsored by the National Key Research and Development Project of China (Grant No. 2019YFC1509704), the National Natural Science Foundation of China (Grant Nos. U1704243, 41741019, 41977249 and 42090052), Henan Province Science and technology research project (Grant No. 192102310006).
Data Availability Statement
The data that supports the findings of this study is available from the corresponding author upon reasonable request.
Acknowledgments
We thank all project team members for their contributions to this study.
Conflicts of Interest
The authors declare no conflict of interest.
References
- Wang, Y.; Jing, H.; Su, H.; Xie, J. Effect of a fault fracture zone on the stability of tunnel-surrounding rock. Int. J. Geomech. 2017, 17, 04016135. [Google Scholar] [CrossRef]
- Fang, W.; Wang, G.; Wang, C. Effect of the Location of Fault Fracture Zones on the Stability of Symmetrical Submarine Tunnels. Symmetry 2021, 13, 1111. [Google Scholar] [CrossRef]
- Shen, S.; Xia, C.; Huang, J.; Li, Y. Influence of seasonal melt layer depth on the stability of surrounding rock in permafrost regions based on the measurement. Nat. Hazards 2015, 75, 2545–2557. [Google Scholar] [CrossRef]
- Yu, J.; Li, T.-B.; Zhang, J.-Z.; Cai, Y.-Y. Stress characteristics of surrounding rocks for inner water exosmosis in high-pressure hydraulic tunnels. J. Cent. S. Univ. 2014, 21, 2970–2976. [Google Scholar] [CrossRef]
- Dong, J.Y.; Yang, J.H.; Zhou, J.J.; Yu, H. Influence of the Tectonic Stress Field on Stress and Deformation Failure Characteristics of a Tunnel’s Surrounding Rock. Mod. Tunn. Technol. 2016, 53, 54–62. [Google Scholar] [CrossRef]
- Qian, Q.; Zhou, X. Failure Behaviors and Rock Deformation During Excavation of Underground Cavern Group for Jinping I Hydropower Station. Rock Mech. Rock Eng. 2018, 51, 2639–2651. [Google Scholar] [CrossRef]
- Cai, W.; Zhu, H.; Liang, W. Three-dimensional stress rotation and control mechanism of deep tunneling incorporating generalized Zhang–Zhu strength-based forward analysis. Eng. Geol. 2022, 308, 106806. [Google Scholar] [CrossRef]
- Cai, W.; Zhu, H.; Liang, W. Three-dimensional tunnel face extrusion and reinforcement effects of underground excavations in deep rock masses. Int. J. Rock Mech. Min. Sci. 2022, 150, 104999. [Google Scholar] [CrossRef]
- Zhang, Y.; Guo, C.; Qu, Y.; Song, Y. Engineering geological properties of altered rocks and implications for railway construction in the Sanjiang orogenic belt, Southwest China. Bull. Eng. Geol. Environ. 2011, 70, 143–152. [Google Scholar] [CrossRef]
- Hashemnejad, A.; Aghda, S.M.F.; Talkhablou, M. Mechanized tunnelling in hydrothermally altered grounds: The effect of hydrothermal fluids on the rock behaviour in the central Iran. Tunn. Undergr. Space Technol. Inc. Trenchless Technol. Res. 2020, 99, 103340. [Google Scholar] [CrossRef]
- Julia, F.; Vladimir, L.; Sergey, R.; David, Z. Effects of hydrothermal alterations on physical and mechanical properties of rocks in the Kuril–Kamchatka island arc. Eng. Geol. 2014, 183, 80–95. [Google Scholar] [CrossRef]
- Coggan, J.; Stead, D.; Howe, J.; Faulks, C. Mineralogical controls on the engineering behavior of hydrothermally altered granites under uniaxial compression. Eng. Geol. 2013, 160, 89–102. [Google Scholar] [CrossRef]
- Hu, S.X. Petrography of Sympatric Alteration Rocks; Geological Press: Beijing, China, 1980. [Google Scholar]
- Bamba, T.; Togaried, K. Wall Rock Alteration Ore Genesis; The Society of Mining Geologists of Japan: Tokyo, Japan, 1988. [Google Scholar]
- Tu, X.; Jian, B.; Wang, S.; Bian, H.; Wang, J.; Li, S. Swelling behavior induced by alteration in granite and its implications on underground excavation. Tunn. Undergr. Space Technol. 2005, 20, 378–389. [Google Scholar] [CrossRef]
- Środoń, J.; Kuzmenkova, O.; Stanek, J.J.; Petit, S.; Beaufort, D.; Gilg, H.A.; Liivamägi, S.; Goryl, M.; Marynowski, L.; Szczerba, M. Hydrothermal alteration of the Ediacaran Volyn-Brest volcanics on the western margin of the east European Craton. Precambrian Res. 2019, 325, 217–235. [Google Scholar] [CrossRef]
- Ren, M.; Wang, W.; Huang, Z.; Li, S.; Wu, Q.; Yu, H.; Yuan, G.; Sargent, P. Effect of alteration on the geochemistry and mechanical properties of granite from Pingjiang, Hunan Province, China. Environ. Earth Sci. 2022, 81, 60. [Google Scholar] [CrossRef]
- Wang, X.; Asem, P.; Hu, C.; Labuz, J.F. Microcracking in tensile fracture of a brittle rock. Eng. Fract. Mech. 2021, 251, 107789. [Google Scholar] [CrossRef]
- Wang, X.; Wang, E.; Liu, X.; Zhou, X. Failure mechanism of fractured rock and associated acoustic behaviors under different loading rates. Eng. Fract. Mech. 2021, 247, 107674. [Google Scholar] [CrossRef]
- Del Potro, R.; Hürlimann, M. The decrease in the shear strength of volcanic materials with argillic hydrothermal alteration, insights from the summit region of Teide stratovolcano, Tenerife. Eng. Geol. 2008, 104, 135–143. [Google Scholar] [CrossRef]
- Wang, H.; Xu, W.Y.; Shao, J. Experimental Researches on Hydro-Mechanical Properties of Altered Rock Under Confining Pressures. Rock Mech. Rock Eng. 2014, 47, 485–493. [Google Scholar] [CrossRef]
- Pola, A.; Crosta, G.B.; Fusi, N.; Castellanza, R. General characterization of the mechanical behaviour of different volcanic rocks with respect to alteration. Eng. Geol. 2014, 169, 1–13. [Google Scholar] [CrossRef]
- Callahan, O.A.; Eichhubl, P.; Olson, J.E.; Davatzes, N.C. Fracture mechanical properties of damaged and hydrothermally altered rocks, Dixie Valley-Stillwater Fault Zone, Nevada, USA. J. Geophys. Res. Solid Earth 2019, 124, 4069–4090. [Google Scholar] [CrossRef] [Green Version]
- Khanlari, G.R.; Naseri, F. Investigation of physical deterioration of Malayer granitic rocks using a new weathering coefficient (Kr4). Environ. Earth Sci. 2016, 75, 414. [Google Scholar] [CrossRef]
- Wyering, L.; Villeneuve, M.; Kennedy, B.; Gravley, D.; Siratovich, P. Using drilling and geological parameters to estimate rock strength in hydrothermally altered rock—A comparison of mechanical speciffc energy, R/N-W/D chart and Alteration Strength Index. Geothermics 2017, 69, 119–131. [Google Scholar] [CrossRef]
Figure 1.
Calculation model diagram. 1. Low-resistivity overburden; 2. Water tunnel; 3. Slightly altered rock zone; 4. Moderately altered rock zone; 5. Strongly altered rock zone.
Figure 1.
Calculation model diagram. 1. Low-resistivity overburden; 2. Water tunnel; 3. Slightly altered rock zone; 4. Moderately altered rock zone; 5. Strongly altered rock zone.
Figure 2.
Main stress diagram of the tunnel excavation under unsupported conditions. (a) Middle main stress diagram of the slightly altered surrounding rock section. (b) Shear stress cloud diagram of the slightly altered surrounding rock section. (c) Middle main stress diagram of the moderately altered surrounding rock section. (d) Shear stress cloud diagram of the moderately altered surrounding rock section. (e) Middle main stress diagram of the strongly altered surrounding rock section. (f) Shear stress cloud diagram of the strongly altered surrounding rock section.
Figure 3.
Main stress diagram of the excavation after the tunnel support. (a) Middle main stress diagram of the slightly altered surrounding rock section. (b) Shear stress cloud diagram of the slightly altered surrounding rock section. (c) Middle main stress diagram of the moderately altered surrounding rock section. (d) Shear stress cloud diagram of the moderately altered surrounding rock section. (e) Middle main stress diagram of the strongly altered surrounding rock section. (f) Shear stress cloud diagram of the strongly altered surrounding rock section.
Figure 4.
Comparison of surrounding rock stress in each profile before and after excavation and support of alteration rock tunnel.
Figure 4.
Comparison of surrounding rock stress in each profile before and after excavation and support of alteration rock tunnel.
Figure 5.
Displacement diagram of the tunnel excavation under unsupported conditions. (a) Total displacement diagram of the slightly altered surrounding rock section. (b) Total displacement diagram of the moderately altered surrounding rock section. (c) Total displacement diagram of the strongly altered surrounding rock section.
Figure 6.
Comparison of the displacement in each profile after the excavation of the tunnel without support and after support.
Figure 6.
Comparison of the displacement in each profile after the excavation of the tunnel without support and after support.
Figure 7.
Excavation displacement map after tunnel support. (a) Total displacement diagram of the slightly altered surrounding rock section. (b) Displacement monitoring map of the slightly altered surrounding rock section. (c) Total displacement diagram of the moderately altered surrounding rock section. (d) Displacement monitoring map of the moderately altered surrounding rock section. (e) Total displacement diagram of the strongly altered surrounding rock section. (f) Displacement monitoring map of the strongly altered surrounding rock section.
Figure 8.
Cloud map of the plastic zone after tunnel excavation. (a) Cloud map of the plastic zone of the slightly altered rock section (without support). (b) Cloud map of the plastic zone of the slightly altered rock section (after support). (c) Cloud map of the plastic zone of the moderately altered rock section (without support). (d) Cloud map of the plastic zone of the moderately altered rock section (after support). (e) Cloud map of the plastic zone of the strongly altered rock section (without support). (f) Cloud map of the plastic zone of the strongly altered rock section (after support).
Figure 9.
Actual monitoring value of tunnel surrounding rock deformation (Asl: calculated deformation value of the slightly altered surrounding rock; Amo: calculated deformation value of the moderately altered surrounding rock; Ast: calculated deformation value of the moderately altered surrounding rock.
Table 1.
Earth stress test results.
Table 1.
Earth stress test results.
| Group | Depth (m) | Main Stress Values (MPa) | Main Stress Inclination (º) | Main Stress Direction (º) |
|---|
| σ1 | σ2 | σ3 | a1 | a2 | a3 | β1 | β2 | β3 |
|---|
| 1 | 470–500 | 25.9 | 17.9 | 10.9 | 1.1 | −25.4 | 64.6 | 18.5 | −32.2 | −73.9 |
| 2 | 580–610 | 28.7 | 18.4 | 13.9 | 9.6 | −27.5 | −60.6 | 13.8 | −61.7 | 86.4 |
| 3 | 650–680 | 28.8 | 20.4 | 16.8 | −2.6 | −9.9 | 79.8 | 1.5 | −70.8 | −74.1 |
| 4 | 823–829 | 31.5 | 24.4 | 20.5 | −8.6 | 23.6 | 64.7 | 11.8 | −63.9 | 83.6 |
| 5 | 848–855 | 33.2 | 24.9 | 22.9 | 4.5 | −16.2 | −73.1 | 8.6 | −86.8 | 83.6 |
| 6 | 883–886 | 35.2 | 26.5 | 23.9 | 2.7 | 6.8 | 82.6 | 5.2 | 64.7 | 63.5 |
Table 2.
Projected ground stress values in the calculated section of tunnel.
Table 2.
Projected ground stress values in the calculated section of tunnel.
| Main Lithology | Depth of Burial (m) | Density | Max. Main Stress σ1 (MPa) | Intermediate Main Stress σ2 (MPa) | Min. Principal Stress σ3 (MPa) |
|---|
| Min. | Max. | Average | g/cm3 | Min. | Max. | Average | Min. | Max. | Average | Min | Max | Average |
|---|
| monzonitic granite | 594 | 1078 | 858 | 2.67 | 27.1 | 43.0 | 35.8 | 18.1 | 29.8 | 24.5 | 15.9 | 28.8 | 22.9 |
Table 3.
Proposed values of the main geological parameters of the tunnel envelope.
Table 3.
Proposed values of the main geological parameters of the tunnel envelope.
| Surrounding Rock Type | Rock Density | Modulus of Elasticity | Deformation Modulus | Poisson Ratio | Shearing Strength |
|---|
| g/cm3 | E (GPa) | E0 (GPa) | μ | C (MPa) | φ (°) |
|---|
| Fresh | 2.60~2.70 | 16~20 | 11~13 | 0.21~0.23 | 1.6~1.8 | 46~52 |
| Slightly altered | 2.45~2.60 | 12~15 | 9~11 | 0.25~0.28 | 1.0~1.2 | 38~44 |
| Moderately altered | 2.40~2.45 | 5~8 | 4~6 | 0.31~0.34 | 0.3~0.5 | 30~35 |
| Strongly altered | 2.30~2.40 | 0.2~1.0 | 0.1~0.4 | 0.36~0.38 | 0.05~0.10 | 22~26 |
Table 4.
Basic parameters of the anchor rods.
Table 4.
Basic parameters of the anchor rods.
| Diameter (mm) | Length (m) | Equivalent Elastic Modulus (GPa) | Tensile Strength (MPa) | Cement Slurry Stiffness (MPa) | Cement Slurry Cohesion (MPa) |
|---|
| 22/25 | 2.0/2.5/3.5 | 200 | 360 | 15 | 0.8 |
Table 5.
Basic parameters of the steel arch.
Table 5.
Basic parameters of the steel arch.
| Elastic Modulus (GPa) | Poisson Ratio | Cross Sectional Area (cm2) | Bulk Density (kN/m3) | Y-Axis Moment of Inertia (104 cm4) | Z-Axis Moment of Inertia (104 cm4) |
|---|
| 21 | 0.3 | 30.31 | 23.8 | 847 | 294 |
Table 6.
Basic parameters of the concrete primary lining.
Table 6.
Basic parameters of the concrete primary lining.
| Concrete Grade | Equivalent Elastic Modulus (GPa) | Bulk Density (kN/m3) | Poisson Ratio |
|---|
| C20 | 25.5 | 25 | 0.25 |
Table 7.
Comparison between the monitored and calculated values of the surrounding rock deformation in tunnel sections with different degrees of alteration.
Table 7.
Comparison between the monitored and calculated values of the surrounding rock deformation in tunnel sections with different degrees of alteration.
| The Degree of Surrounding Rock Alteration | The Actual Monitoring Range of Surrounding Rock Deformation (cm) | The Actual Monitoring Average Value of Surrounding Rock Deformation (cm) | The Numerical Simulation Calculation Value (cm) |
|---|
| Slightly altered | 0.49~0.76 | 0.62 | 1.02 |
| Moderately altered | 0.57~1.29 | 0.97 | 1.56 |
| Strongly altered | 1.73~2.27 | 1.93 | 2.62 |
| Disclaimer/Publisher’s Note: The statements, opinions and data contained in all publications are solely those of the individual author(s) and contributor(s) and not of MDPI and/or the editor(s). MDPI and/or the editor(s) disclaim responsibility for any injury to people or property resulting from any ideas, methods, instructions or products referred to in the content. |
© 2023 by the authors. Licensee MDPI, Basel, Switzerland. This article is an open access article distributed under the terms and conditions of the Creative Commons Attribution (CC BY) license (https://creativecommons.org/licenses/by/4.0/).


