Article

Advanced Analysis of Collision-Induced Blast Fragmentation in V-Type Firing Pattern

by
Lalit Singh Chouhan
1,*,
Avtar K. Raina
2,
V. M. S. R. Murthy
1,
Mohanad Muayad Sabri Sabri
3,
Edy Tonnizam Mohamad
4 and
Ramesh Murlidhar Bhatawdekar
5
1
Department of Mining Engineering, Indian Institute of Technology (Indian School of Mines), Dhanbad 826 004, India
2
CSIR-Central Institute of Mining and Fuel Research, Nagpur 440001, India
3
Centre of Peter the Great St. Petersburg Polytechnic University, 195251 St. Petersburg, Russia
4
Centre of Tropical Geoengineering (GEOTROPIK), Institute of Smart Infrastructure and Innovative Construction (ISiiC), Universiti Teknologi Malaysia, Johor Bahru 81310, Malaysia
5
Centre of Tropical Geoengineering (GEOTROPIK), School of Civil Engineering, Faculty of Engineering, Universiti Teknologi Malaysia, Johor Bahru 81310, Malaysia
*
Author to whom correspondence should be addressed.
Sustainability 2022, 14(23), 15703; https://doi.org/10.3390/su142315703
Submission received: 13 September 2022 / Revised: 29 October 2022 / Accepted: 14 November 2022 / Published: 25 November 2022
(This article belongs to the Special Issue Advances in Rock Mechanics and Geotechnical Engineering)

Abstract

:
The firing pattern of blastholes influences the geometric aspects of a blast design in terms of change in blasting burden and spacing. This in turn changes the effective stiffness of a blasthole and confinement of the explosive and aids in better fragmentation. However, during the blasting, the fragments tend to collide and further fragment the rock. In comparison with other patterns, the V-type firing pattern increases the chances of collision between the fragments during flight. The process is scantly documented and accordingly field experiments were conducted using three firing patterns, viz., line, diagonal, and V-type, in a mine with minor variation in rock factor and minor to moderate changes in blast design variables. Sixteen blast design variables such as burden, spacing, charge per hole, in-hole charge density, etc. along with firing pattern were considered for the analysis and fragmentation modeled with the help of surface response analysis and artificial neural networks. The analysis revealed that there is a significant influence of firing patterns on fragmentation. The V-type pattern showed significant reduction in fragment sizes that can be ascribed to in-flight collision processes. A surface response model was developed using advanced ANOVA and resulted in an adjusted R2 and RMSE of 0.89, 0.025, respectively. Further, modeling with ANN was attempted that showed better results than ANOVA with R2 and RMSE of 0.96 and 0.040 in training, and 0.884 and 0.049 in validation tests. Since, diagonal and V-type patterns have similar design parameters, the reduction in fragment size in the former pattern can be ascribed to the collision of rock fragments during their flight in blasting.

1. Introduction

The objectives of blasting in mining are to ease the excavation operation by obtaining maximum yield through optimum fragment sizes while minimizing the adverse impacts of blasting such as blast-induced ground vibration, air overpressure, flyrock, and noise. To obtain the desired blast results, various blast design variables and factors, viz., burden, spacing, stemming length, type of explosive, powder factor, stiffness ratio, firing pattern, etc. are optimized as per the site-specific requirement. The end purpose of rock blasting in limestone mines, where investigations were carried out, is to produce the desired size feed for a crusher. Fragments produced by blasting should not only be small enough for economic loading of equipment, but should also pass easily through the crusher to realize equipment productivity [1]. To achieve the desired rock fragmentation by blasting, an effective way of determining the blast design variables should be selected [2]. There is ample evidence of the role of fragmentation on the overall mine–mill fragmentation system performance [3,4]. The efficiency of the system through fragmentation optimization is documented by several researchers [5,6,7,8,9,10] and can be achieved only when fragment sizes obtained from the blasting are measured. Therefore, fragmentation measurement of blasted muck piles is essential [11].
To reduce the production cost, the blast design should be revisited to match the cost of the mine–mill fragmentation system (MMFS) that includes unit operations such as drilling, blasting, loading, hauling, or conveying and crushing of primary or secondary nature [4]. In open pit mines, the cost of drilling and blasting operations covers approximately 15–20% of the total mining cost [12,13,14]. An increase in blasting cost reduces the cost of the downstream operations, viz., loading, hauling, crushing, and boulder breaking [3]. This requires the determination of an optimum fragment size range so that the cost of MMFS is optimized. If increasing the cost of blasting operations does not reduce the cost of successive operations, it will not impact the overall economics of the system.
Methods such as blast design evaluation or auditing lead to changes in main blast design variables such as burden, spacing, and stemming, hence, resulting in improved fragmentation and better system performance. One such method involves a change in firing sequence that can be considered as another critical blast design requirement for improving the rock fragmentation [15].
A proper design of the firing pattern, i.e., the delay required between hole to hole and row to row, plays a vital role not only in reducing fragmentation size but also helps to reduce ground vibration as well as back break. To maintain the continuous momentum for the inter-row displacement, a systematic release of the blasting energy is required which can be achieved with a proper burden. An improper delay in multi-row blast gives poor blast results, viz., poor rock fragmentation from the back rows, severe over/under break, large boulders from the collar region of the blasthole, and tight muck pile, etc. [16]. Different types of firing patterns, e.g., line, diagonal, and V-type are used in bench blasting. Each firing pattern has its own application and advantages [17,18]. The change in firing sequence from line firing to diagonal pattern changes the design geometries while blasting. This helps to reduce the blasted burden and increase the spacing and overall actual charge per unit mass of the blasthole. Thus, the effective stiffness and explosive confinement in the blasthole are modified significantly resulting in improved fragmentation particularly in the case of diagonal firing.
The V-type firing pattern has similar blasting design variables except those two limbs of a blast from the center fire towards each other. A distinction between the fragmentation in diagonal and V-type firing patterns should thus account for the fragmentation due to the collision of the fragments while in flight during blasting.
Although V-type and diagonal firing patterns provide a similar effective spacing to burden ratio, the V-type firing pattern is more suitable for achieving smaller fragmentation because it increases the opportunity for in-flight collision between broken rock fragments [15]. This particular characteristic of V-type firing is considered important to reduce fragment size and boulder occurrence within the blasted rock piles [17].
With this hypothesis studies have been conducted to document the reduction in blast fragmentation with V-type firing pattern. The primary focus of this paper is thus to evaluate the influence of in-flight collision between rock fragments on fragmentation and is probably the first of its kind study.

2. Influence of Firing Patterns on Fragmentation

As mentioned earlier, the firing patterns play a vital role in rock fragmentation size during blasting of the rock.
The firing pattern influences the rock fragmentation by following three ways, these are:
  • By changing burden and spacing during blasting which is also known as effective burden (Be) and effective spacing (Se) or blasting burden and blasting spacing;
  • Through possible in-flight collision between rock fragments during blasting and
  • a combination of the above two mechanisms.
There are many variations in firing patterns, but the most known firing patterns are:
  • Line firing pattern;
  • Diagonal firing pattern;
  • V-type firing pattern.
The objectives and effect of these patterns on rock fragmentation during blasting are summarized in Table 1, Table 2, Table 3, Table 4 and Table 5.

3. Data Compilation and Analysis

The study was conducted in a limestone mine in India. The deposit belongs to a hilly terrain of the Precambrian age of the Delhi Super Group. The annual production of the mines was 6 MTPa. Compressive strength of limestone varied from 80 to 110 MPa. The mine uses a blasthole diameter of 115 mm. ANFO was used as the explosive having a density of 800 kg/m3 and the average VoD of the explosive measured through continuous in-hole method was 3700 m/s. The charging process of the blasthole is summarized in the following steps:
  • Create an air deck at the bottom of the hole with a wooden spacer having a length of 0.75 cm placed first;
  • Seal off the gap between the wooden spacer and the blasthole periphery, cut a primer cartridge, and put in the hole;
  • Lower the primer cartridge, attached with DTH of 250 ms, into the hole as a base charge;
  • Pour the prilled ANFO into the hole as a column charge;
  • Stem the blasthole with the help of drill cutting;
  • Connect blastholes of the first row with the help of TLD of 25 ms and the blasthole of the second and third row connected with the help of TLD of 42 ms as depicted in the figures given in Table 1, Table 2, Table 3, Table 4 and Table 5.
The blasts were initiated by a shock tube system with a delay sequencing of 17 ms, 25 ms, and 42 ms with a staggered drill hole pattern. The loading operations were performed by front end loader, shovel, and backhoe. The blast muck was transported by 55 MT rear dump trucks.
In order to achieve the objectives of this study, full scale blast trials were conducted in the mines by deploying line firing (L), diagonal firing (D), and V-type firing patterns (V). Other variables of the blast design varied over a narrow range and thus provided a means for comparing fragmentation in the above three firing patterns.
To assess the in-flight collision process between rock fragments during blasting in different firing pattern and its impacts, the following research methods were resorted to:
  • Determination of rock type, its strength and variation. Three main types of the rock formations are present in the area which were assigned three values for rock factor (RF);
  • Fragmentation analysis of blasted muck pile as explained in Table 6
  • Data analysis was carried out using Surface response analysis and artificial neural networking methods as explained in the following sections.

Fragmentation Analysis of Blasted Muck Pile

A digital image analysis method using Fragalyst software was used for measurement of fragmentation in all the blasts monitored. The method requires muck pile images with a scale to calculate the size of fragments. The representative images of blasted muck pile, captured at different time intervals during the excavation operation to cover all the sizes of fragmentation in the whole muck pile, were thus taken. The process of fragmentation assessment by Fragalyst software is depicted in Table 6.
Ninety-two full-scale blasts were conducted while monitoring the blast design variables such as burden, spacing and stemming, bench height, specific charge, firing patterns, delay, and mean fragmentation, etc., with one free face availability. The statistics of the data generated are presented in Table 7. The difference in fragment sizes in the three types of firing patterns is evident from Figure 1d, wherein a reduction of around 26% in diagonal and around 45% in the case of the V-type firing pattern is registered in comparison with the fragmentation obtained in the line firing pattern.
Representative images of fragmentation obtained from different firing patterns are provided in Figure 1a–c and the distribution of fragmentation in all the three firing patterns representing the average fragment sizes of all the blasts monitored are plotted in Figure 1d.
The distribution of some important blast design variables along with their ranges is given in Figure 2a–f.

4. Model Development

4.1. Response Surface Analysis (RSA)

The impact of change in firing patterns on rock fragmentation during blasting can be evaluated properly if other variables of blasting are kept constant. However, it is important to note that in bench blasting there are variations in design pattern due to drilling, charging, and measuring errors. Moreover, there are conflicts in some factors and variables that make perfect modeling difficult. To develop an easy-to-use model for rock fragmentation prediction, response surface analysis (RSA) of the data was carried out while using the variables that most influence the fragmentation. The results of the RSA evaluation (Table 8) obtained through multivariate non-linear ANOVA method (Table 9), were finally used in developing the model. A back propagation algorithm being robust in nature was deployed to evaluate the variables over p-value, R2, Akaike information criterion (AiCC) and Bayesian information criterion (BiCC), to eliminate insignificant and redundant terms in a quadratic model suggested by the initial analysis.
The Model F-value of 106.42 implies that the model is significant. There is only a 0.01% chance that an F-value this large could occur due to noise and p-values less than 0.0500 indicating that the model terms are significant. In this case, A, B, C, D, BC, and D2 (see Table 8 for terms) are significant model terms. Values of p > 0.1000 indicate the model terms are not significant. The modeling results are presented in Table 8.
The Predicted R2 of 0.88 is in reasonable agreement with the Adjusted 
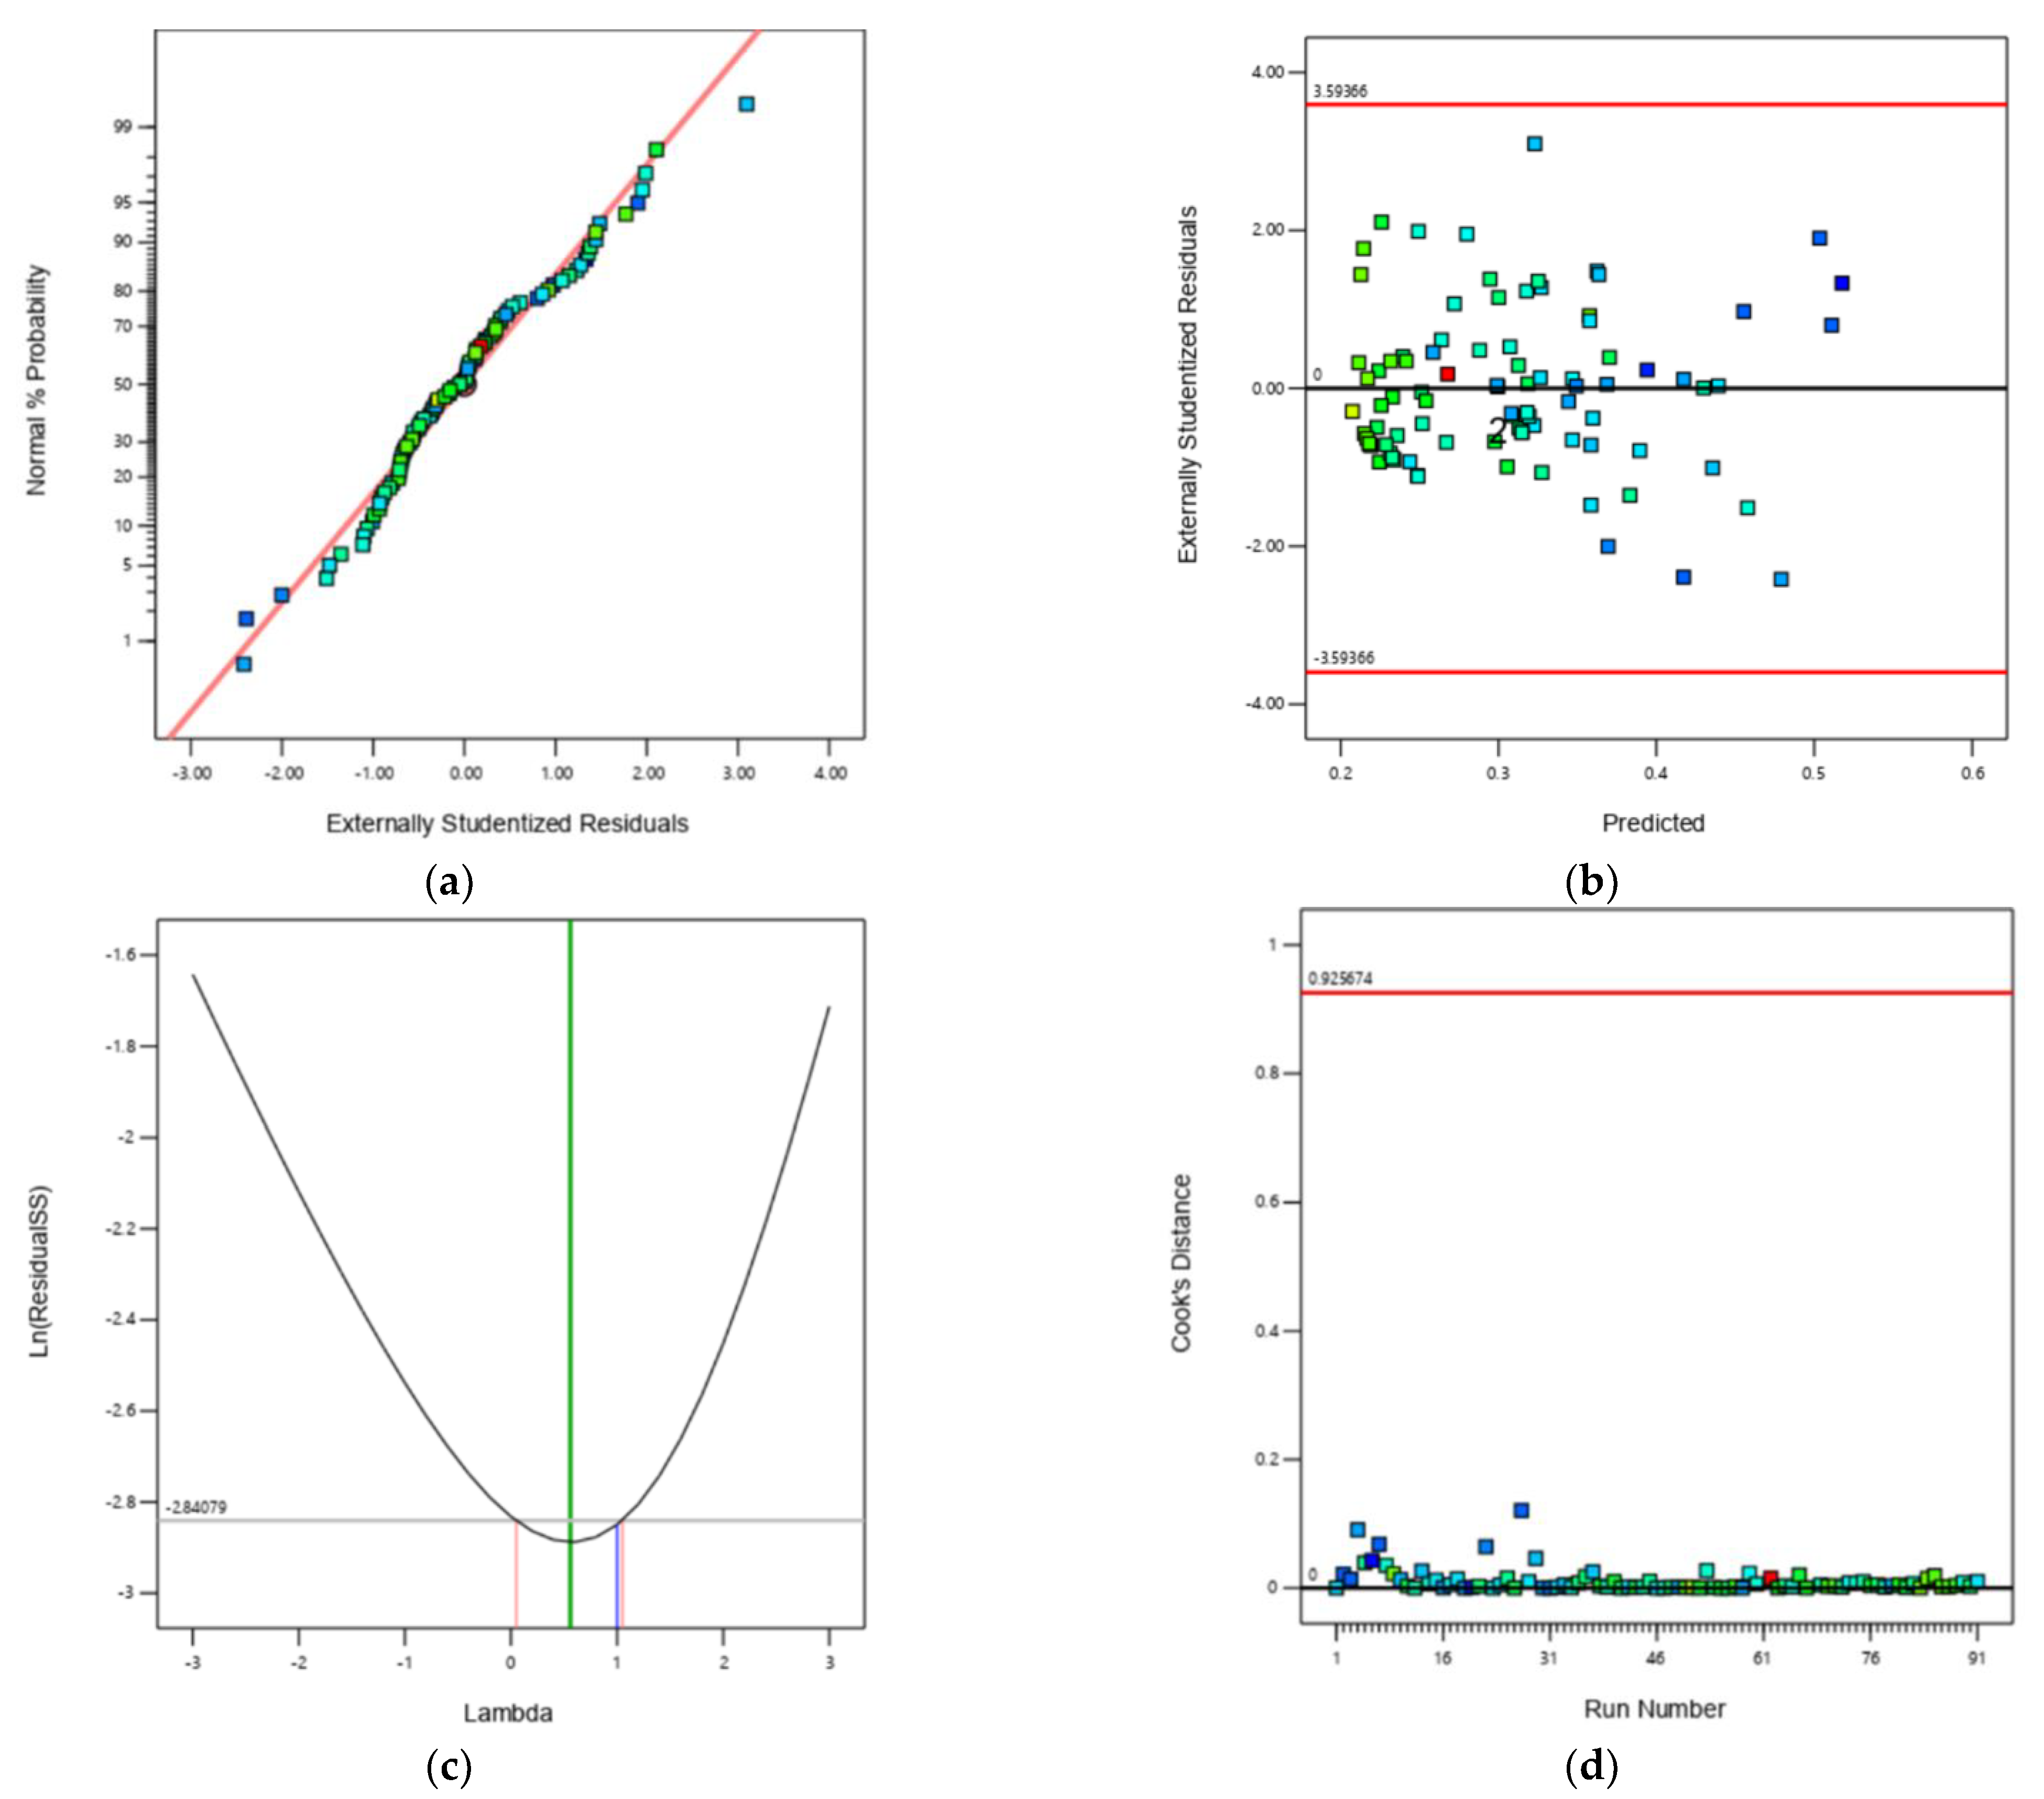
R2 of 0.89, i.e., the difference is less than 0.2. Adequate precision, a measure of the signal to noise ratio, should be greater than four. In our case, the ratio of 38.70 indicates an adequate signal. This model can be used to navigate the design space. Several diagnostics were deployed (Figure 3) before accepting the final equation.
The plot of normal probability of externally studentized residuals follows a straight line (Figure 3a) indicating a proper transformation of the output, and that the residuals are within the expected ranges (Figure 3b) with no outliers. The Box-Cox plot for transformation (Figure 3c) confirms the transformation applied to the output, and all the data in the Cook’s distance (
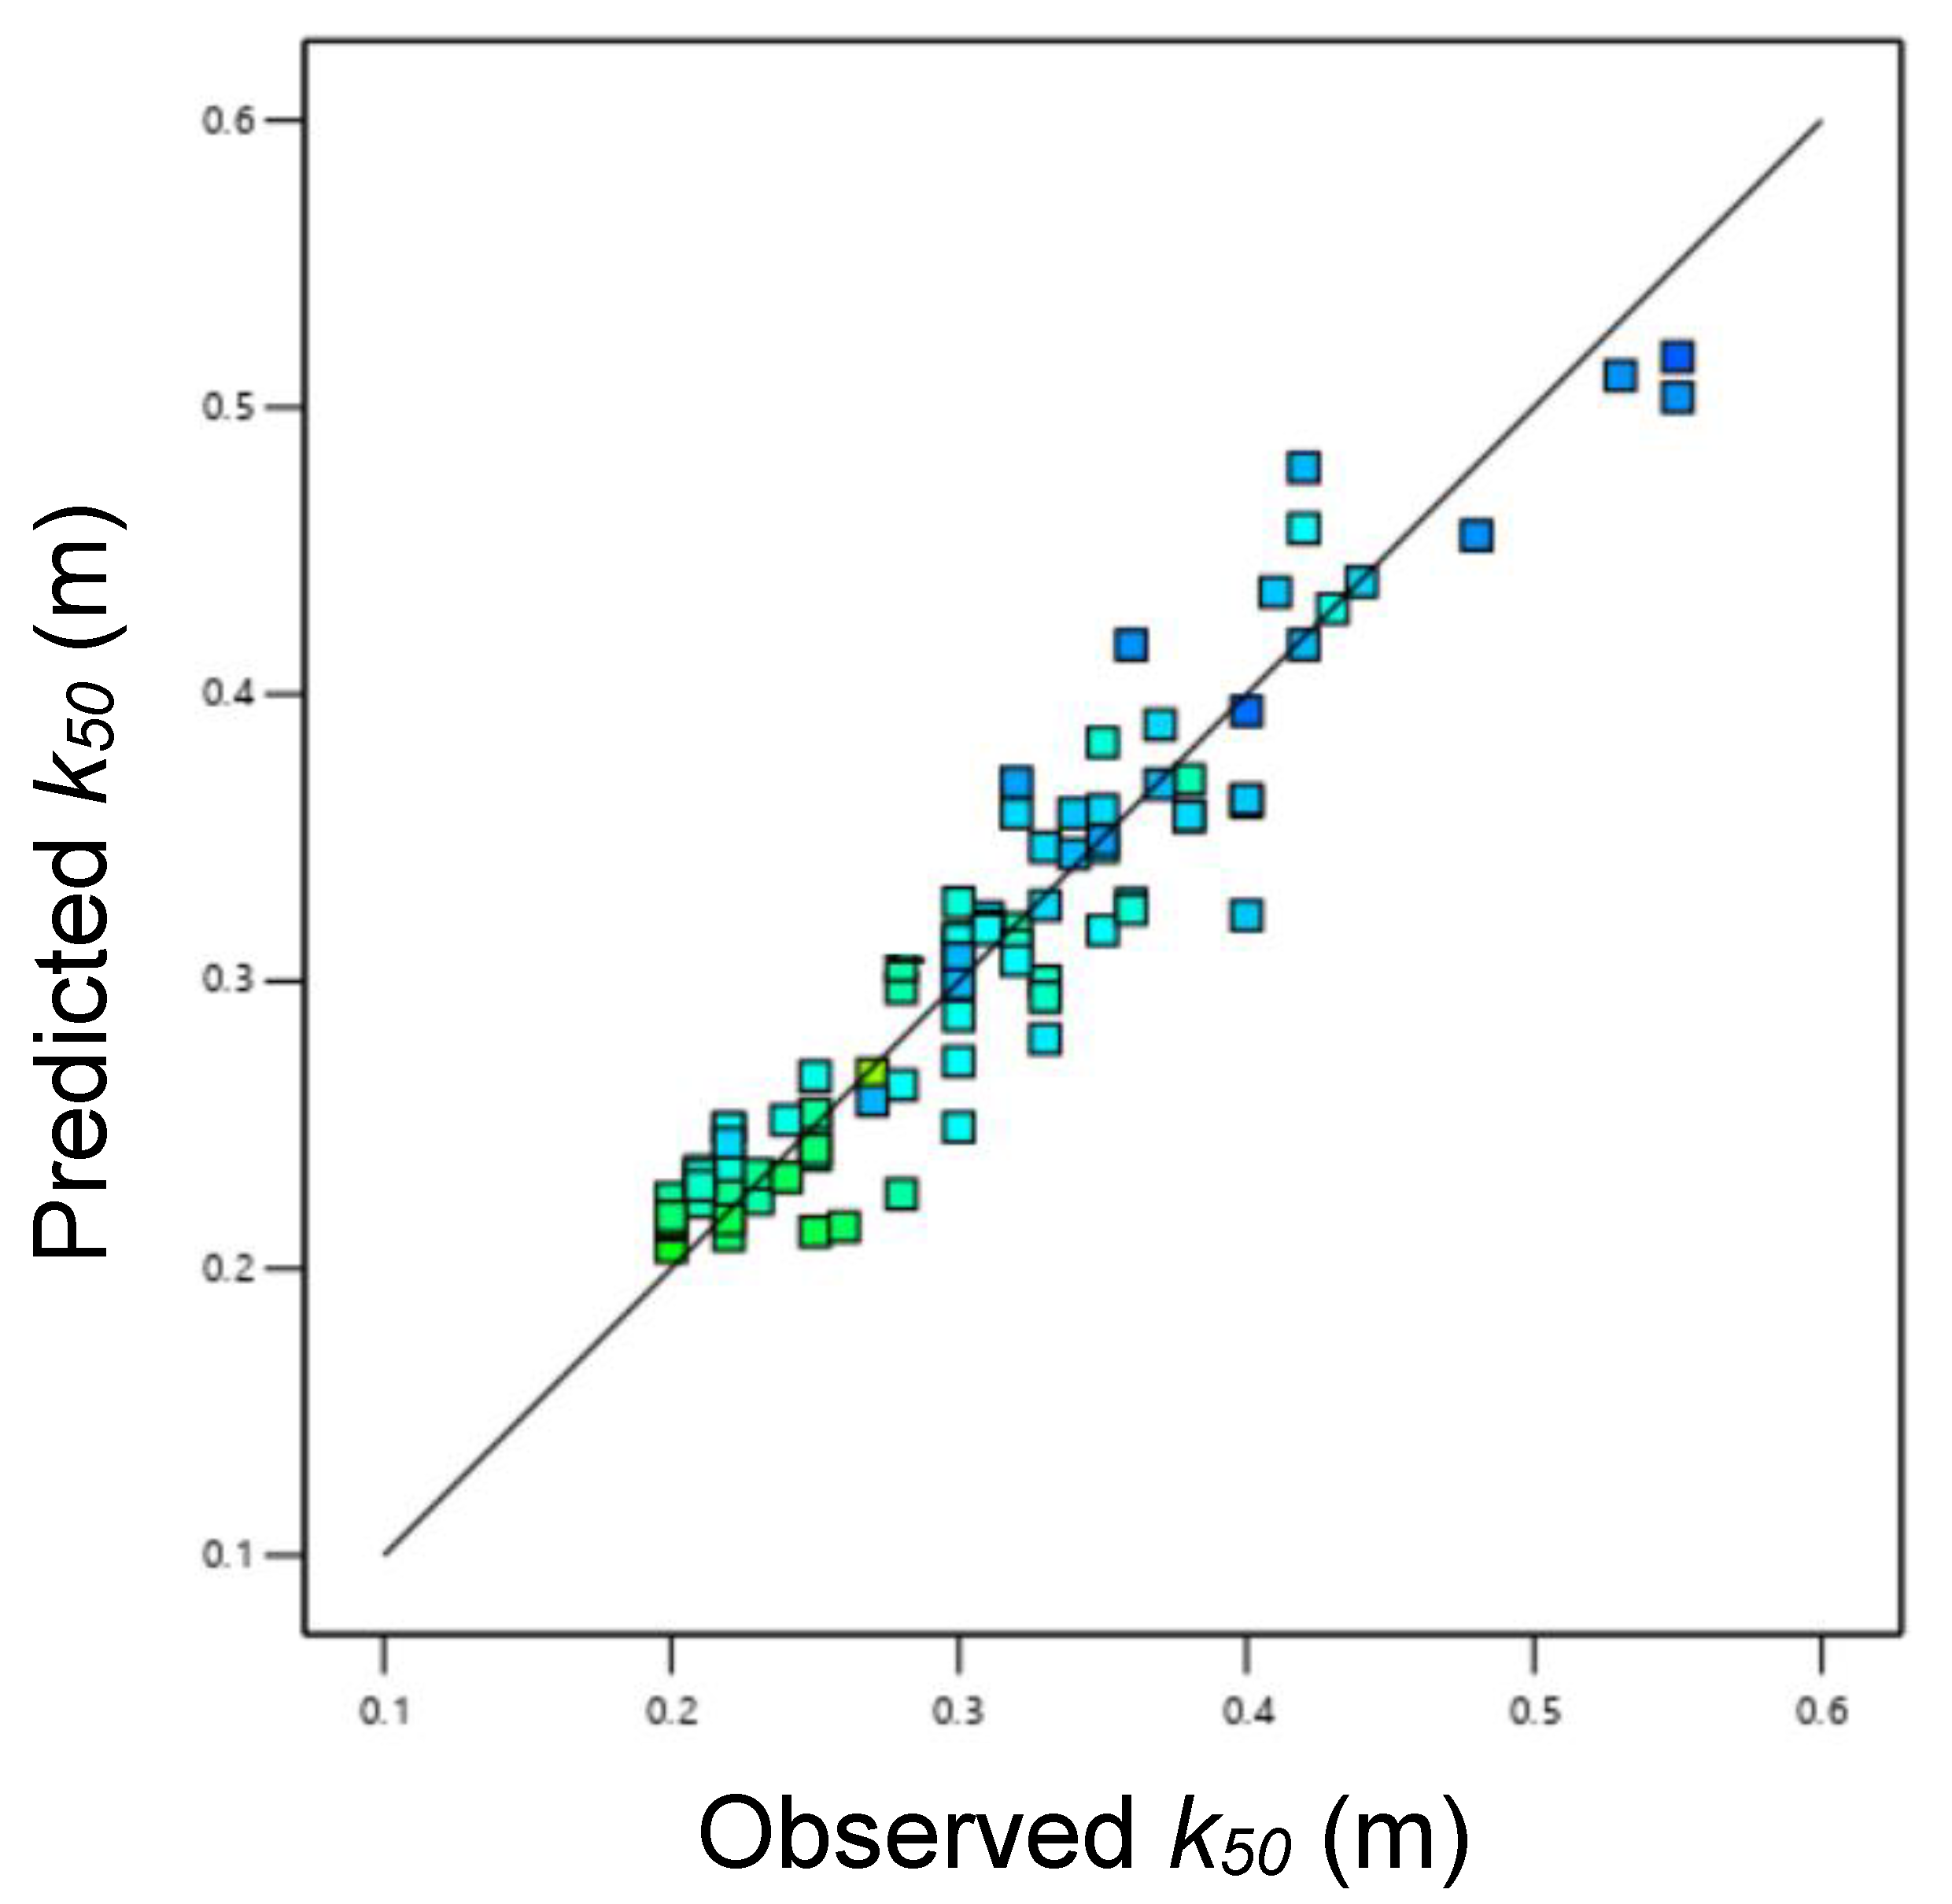
Figure 3d) are quite well within the limits. The diagnosis thus points to the well-behaved structure of the design and analysis. The predicted vs. observed plot of the mean fragmentation size (k50) shows that the prediction is quite significant with an adjusted R2 of 0.89 and predicted R2 of 0.88. Accordingly, the final equation for prediction of mean fragmentation size (k50) in terms of the independent variables is provided in Equation (1).
k 50 = I n t . + 0.21 R F + 0.00204 ρ e e 0.256 B × S + 0.0039 R F × ρ e e + 0.134 B × S 2
where Int. is the intercept and equals 0.471 for L, 0.389 for D, and 0.327 for the V-type firing patterns (for other symbols please see abbreviations at the end of this paper).
A comparison of mean fragmentation size predicted by the RSA model given in Equation (1) and measured value is shown in Figure 4 and confirms that the model can be used for mean fragmentation size (k50) prediction.
To ascertain the surface response through the model and the interactions between the variables over space, several iterations were conducted while keeping two variables constant and varying one at a time. The results of such simulations are presented in Figure 5a–i.
Figure 5a–c show the relationship with RF and ρee versus mean fragmentation size (k50) with average (B × S). Similar trends are observed in all three firing patterns. However, there is significant reduction in fragment size despite the constant variables at average (B × S) in case of V-type of firing pattern.
Figure 5d–f shows the influence of RF and (B × S) on the mean fragmentation size (k50) with an average value of ρee and have similar trends of fragment size (k50) irrespective of the type of firing pattern. The figure confirms that the relationship of burden and spacing is not linear with fragmentation and an optimum value is evident for achieving the best possible fragment size. However, a significant change in fragment size is observed in the case of the V-type firing pattern.
The influence of ρee and (B × S) on the mean fragmentation size (k50) with average value of RF is shown in Figure 5g–i. The trends in all the cases of firing patterns are similar, except the size of fragmentation that is varying over the three firing patterns tested. These figures also provide an optimum value of (B × S) at which we can achieve smaller fragmentation with the same value of ρee. There is a marked change in fragment size in the case of diagonal and V-type firing patterns. Distinct trends in the change in fragmentation with variation in (B × S) and ρee are, however, apparent from the figures.

4.2. Fragmentation Prediction Using Artificial Neural Network (ANN)

Artificial neural network (ANN) is a computational method consisting of several processing elements that receive inputs and deliver outputs based on their predefined activation functions. ANN consists of three layers, viz., input layer, the hidden layer, and the output layer. The input layer picks up the input signals and transfers them to the next layer and, finally, the output layer gives the prediction. The neural networks have to be trained with some training data to obtain a solution to a complex process output. The ANN and related methods have a capability to solve complicated problems, especially when the process and results are not fully understood [20]. The case is similar in blasting where the design variables present a complex relationship with rockmass, which in turn has several inconsistencies such as inhomogeneity and anisotropy.
Various algorithms have been suggested for training of the neural network, but the backpropagation algorithm is the most versatile and robust technique and provides the most efficient learning procedure for multy layer perceptron (MLP) networks. An experimental database including enough datasets is required to train the ANN model. Once the training process is completed, prediction can be made for a new input dataset.
Accordingly, to predict rock fragmentation by blasting, a back propagation ANN model was deployed for the data acquired and analyzed earlier by ANOVA. Several iterations were made to find the best possible network and hidden layers. The model that trained well and presented the best results is given in Figure 6. The plot of training progression thus obtained during the process is given in Figure 7.
In the above training process, the network is presented with a pair of patterns: an input pattern and the corresponding desired output pattern. The firing patterns can be treated as a string in the ANN training and therefore it is possible to estimate the mean fragment size from the trained network. The network can be queried for such results and hence compared.
Table 10 and 
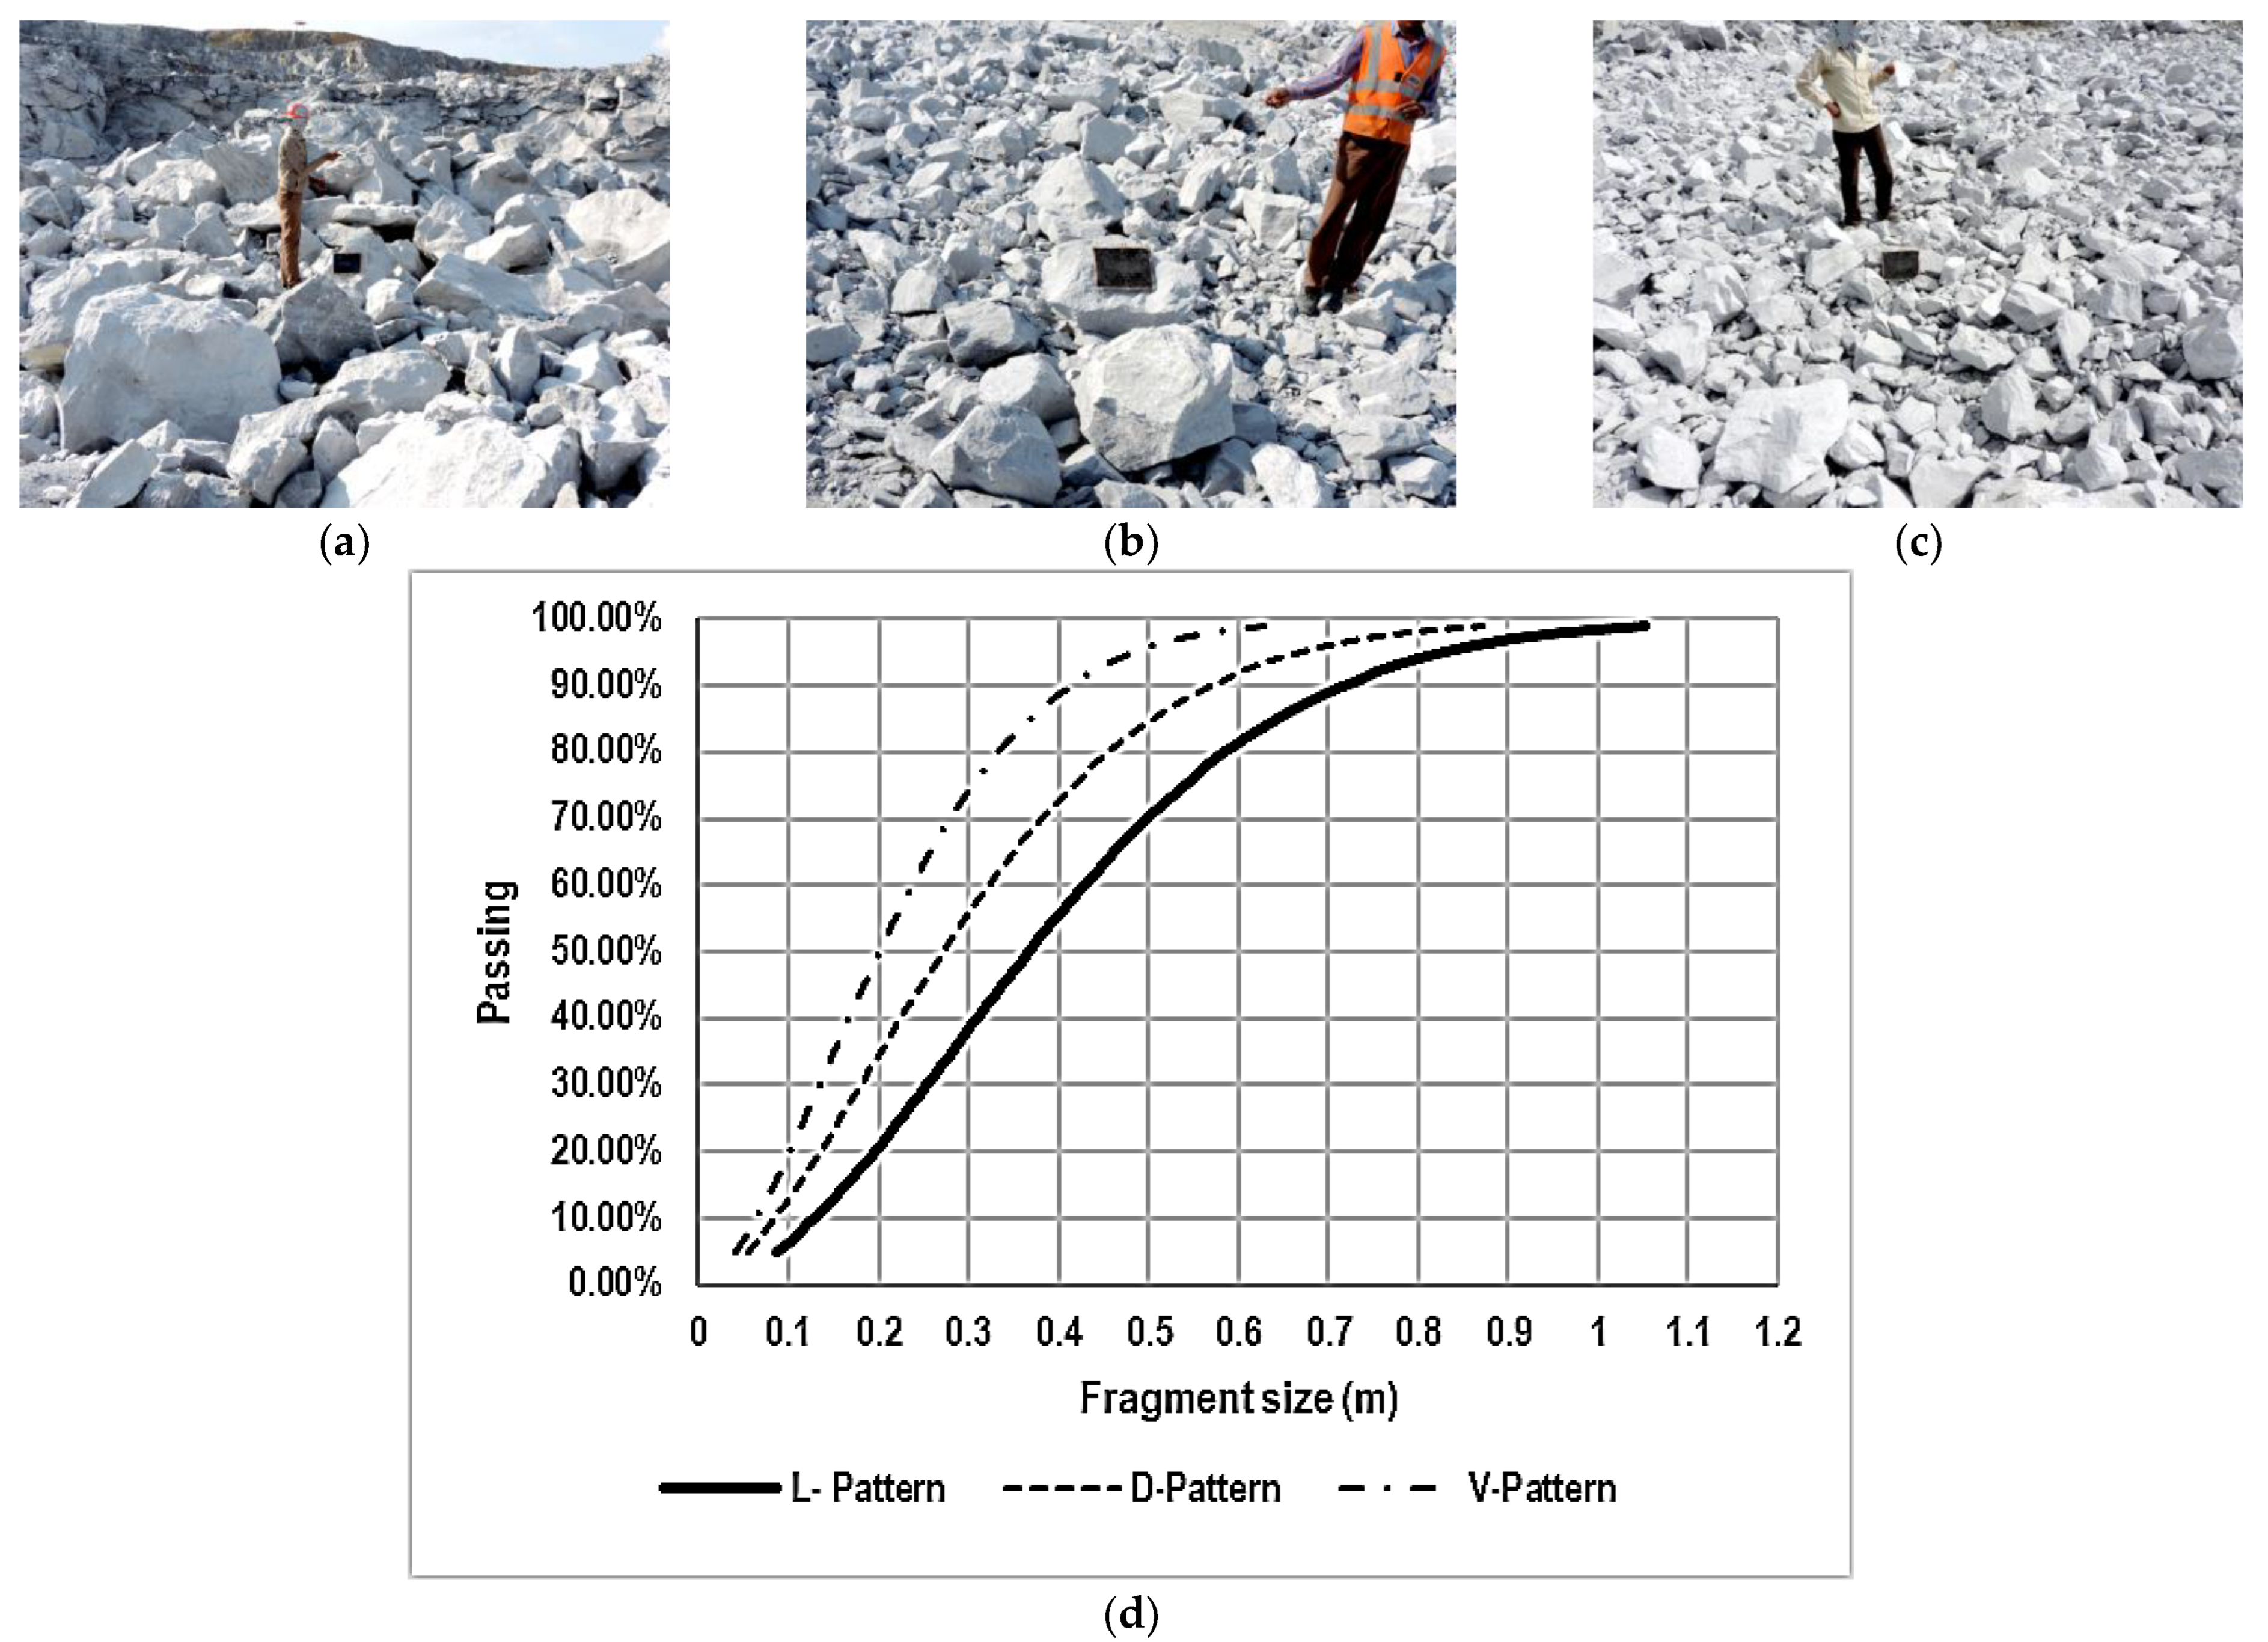
Table 11 show the input parameters and output parameters with their symbols and range, respectively, considered for developing the neural network. For introducing fragmentation to the network, an image analysis method, i.e., “Fragalyst” software was employed to determine muck pile size distribution. The process of fragmentation assessment by Fragalyst software is illustrated in Table 6. The 50% passing size (k50) was chosen to determine the fragmentation quality. Out of a total of 92 datasets, 73 datasets were used to train the ANN model and 19 separate datasets (not used in training) were utilized for the purpose of validation thus representing the standard 80:20 ratio.
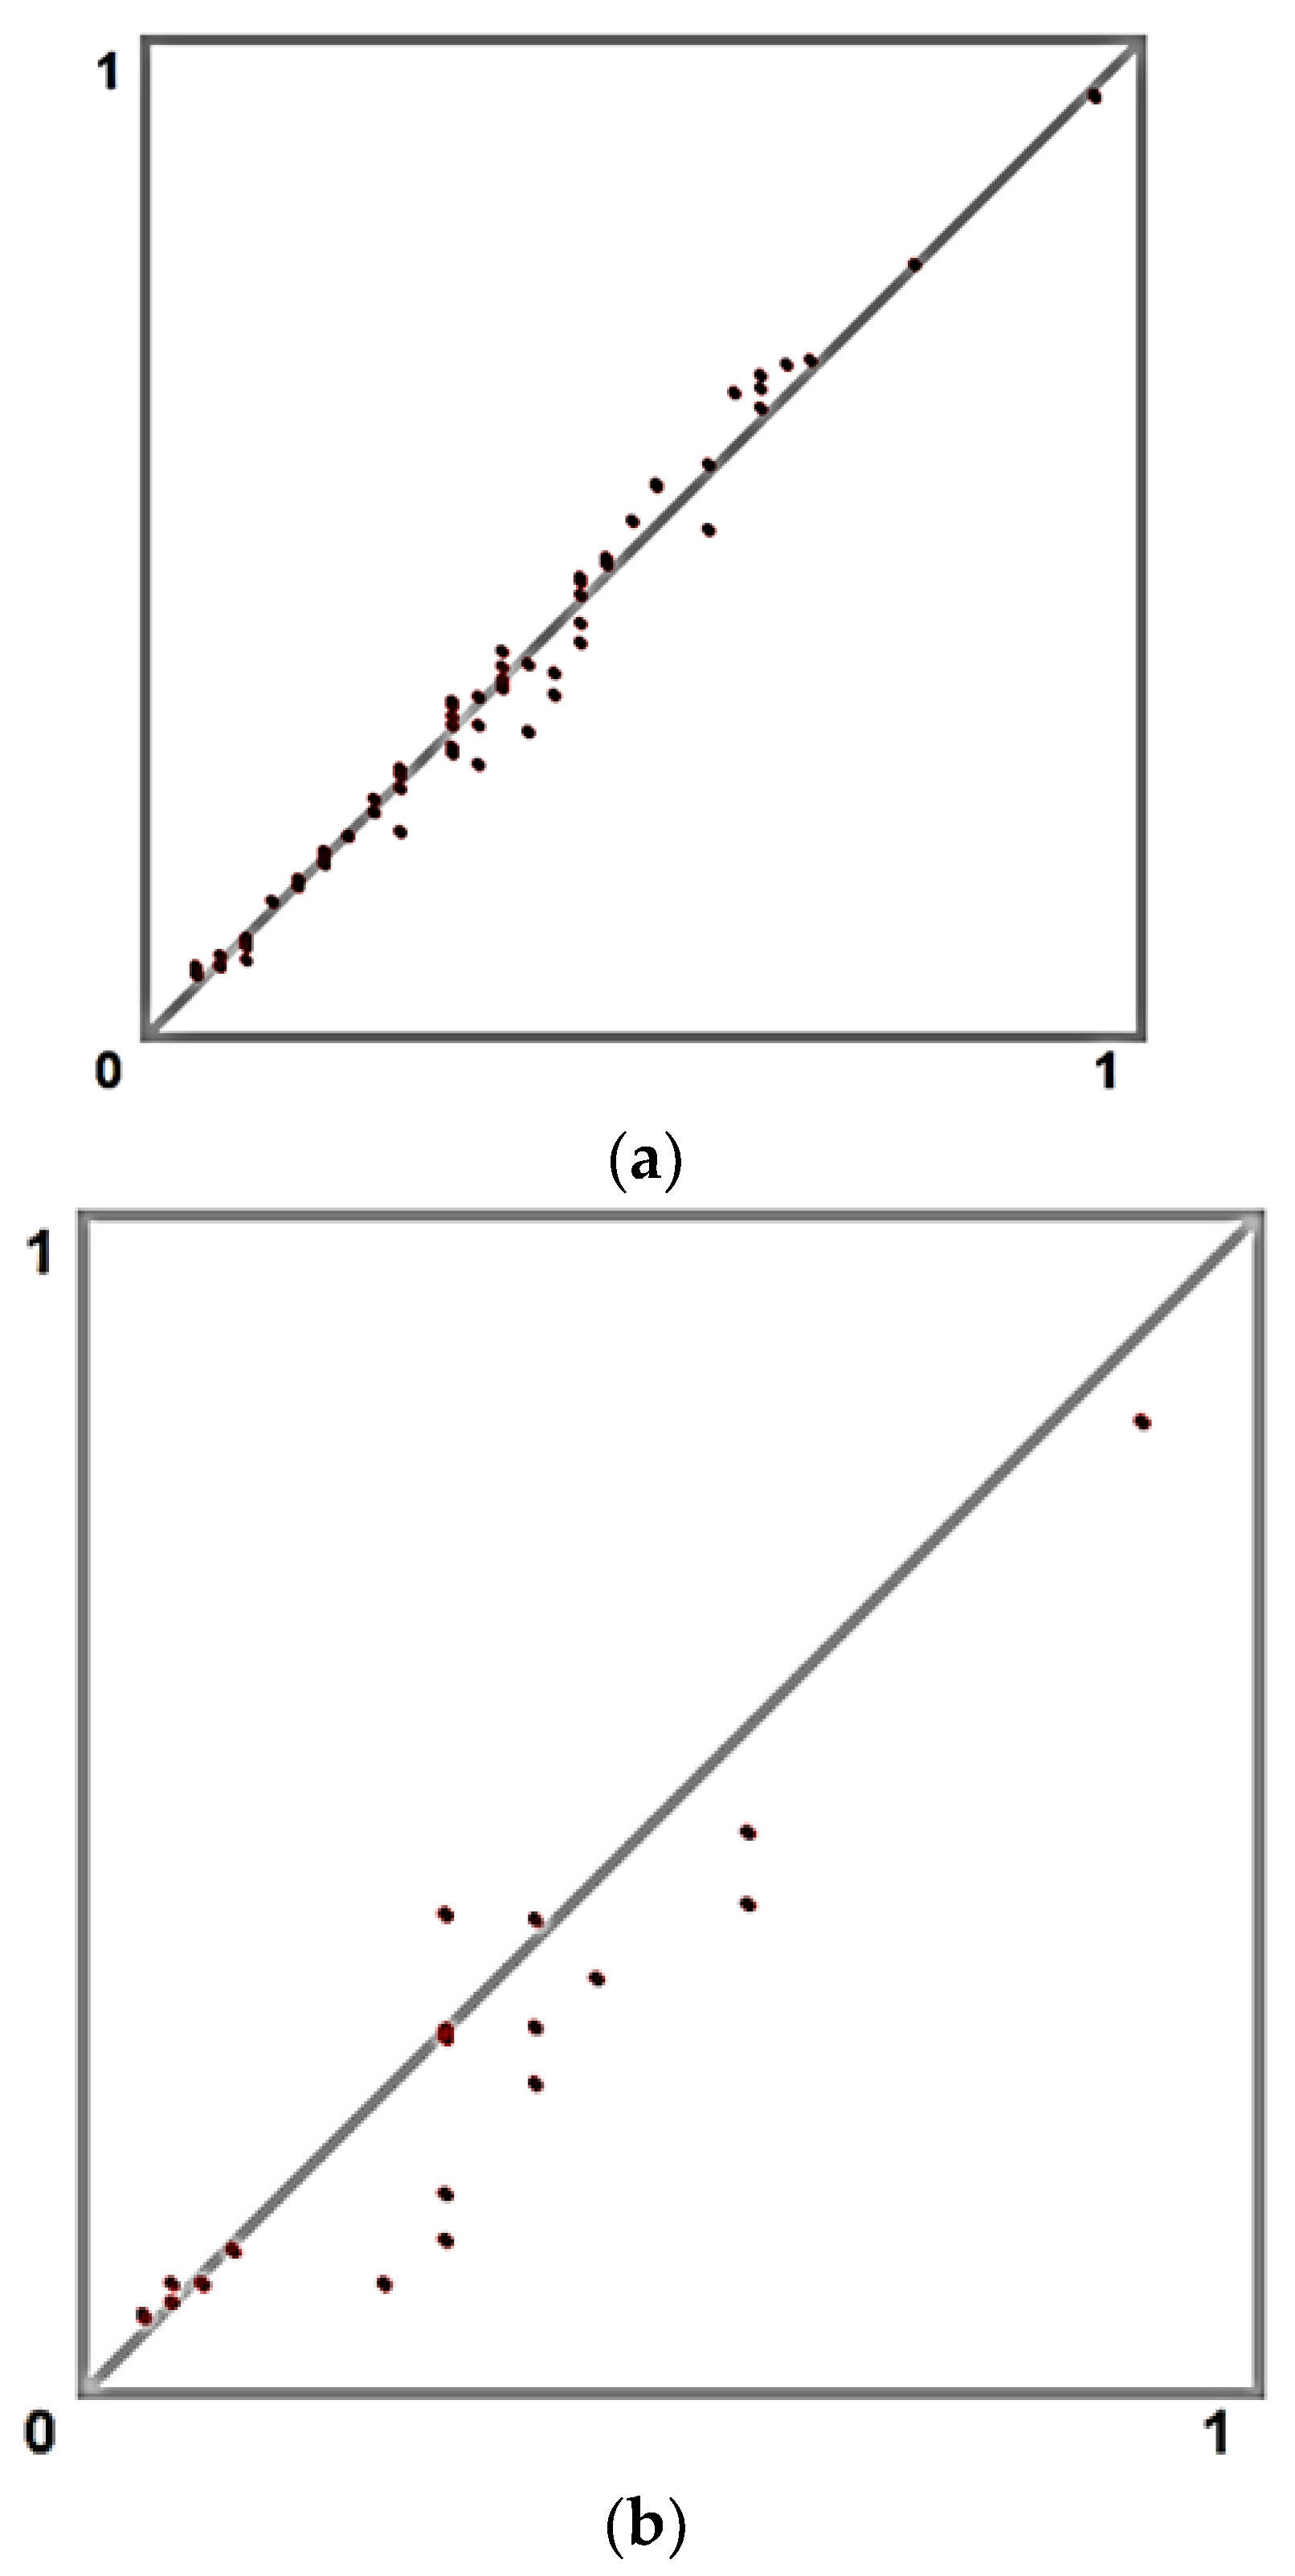
The training results of the ANN model and the validation results are presented in Figure 8a,b respectively. The results of the analysis show R2 and RMSE of 0.96 and 0.040 in the case of training and 0.884 and 0.049 in the case of validation tests. The results point to the fact that the ANN method can be well used for the prediction of fragmentation.
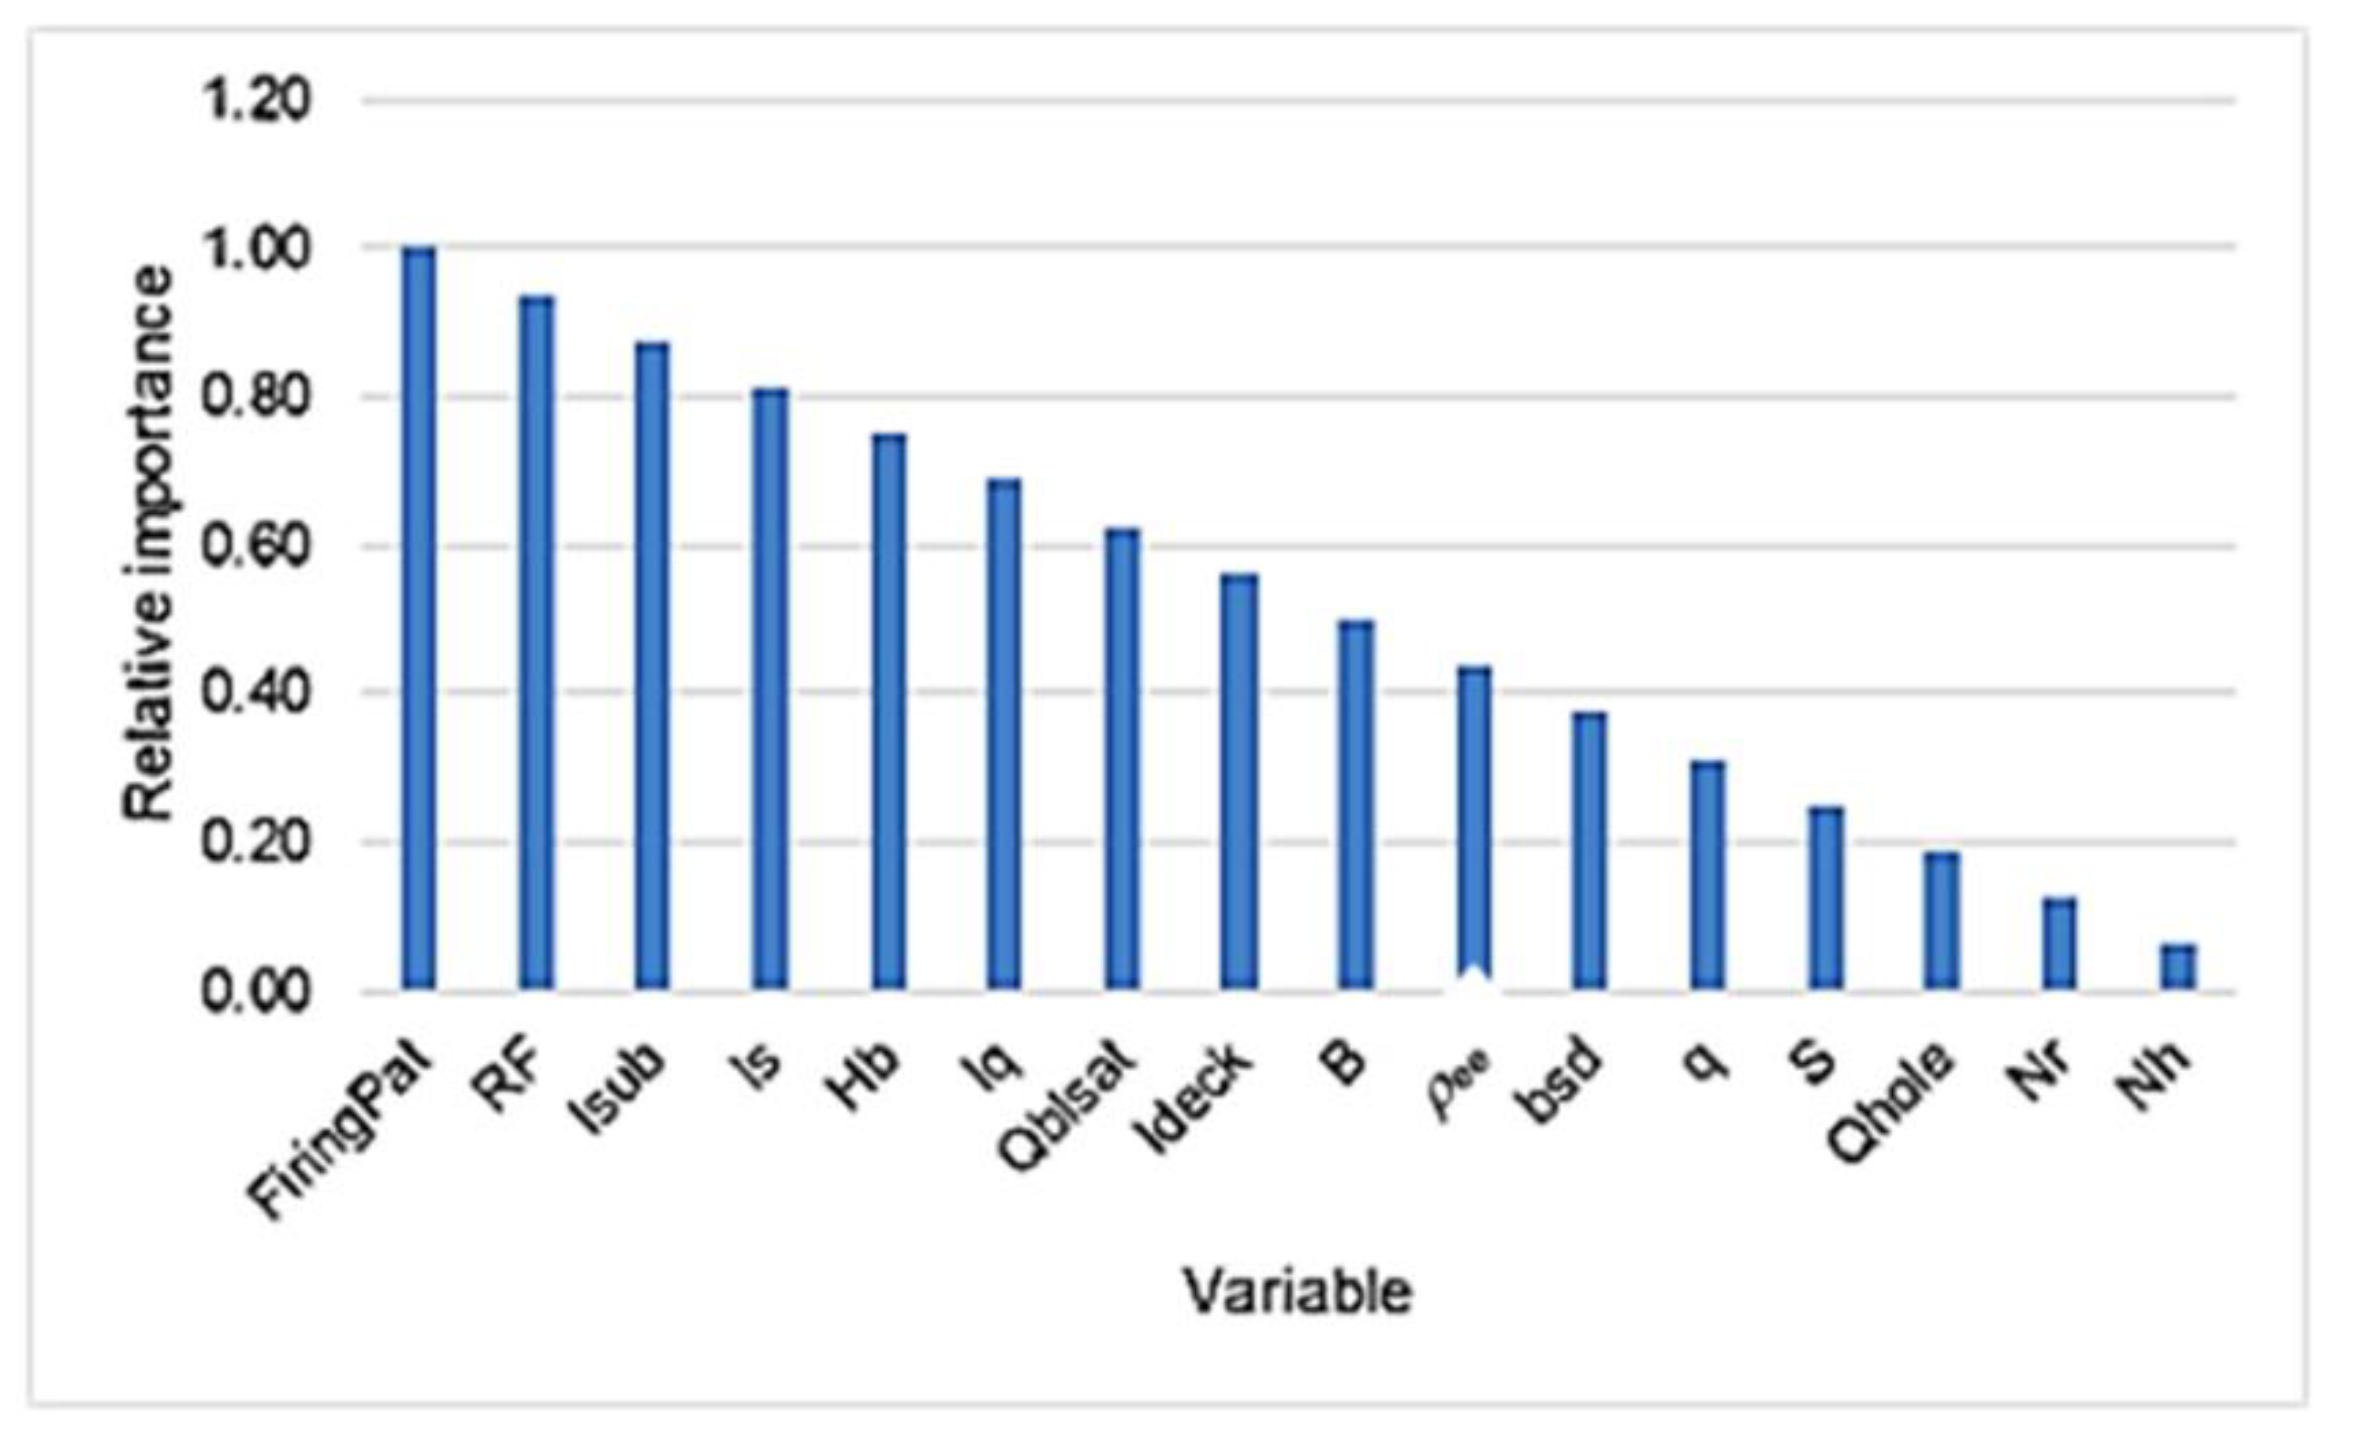
In addition to the above, the sum of the absolute weights of the connections from the input node to all the nodes in the first hidden layer defines the importance of the input variables. The relative importance can thus be worked out from such results. The results of such analysis are presented in Figure 9.
There are variables in the above list that can be grouped together or represent explosive distribution in a blasthole such as charge length, stemming length, decking length, and sub-drill length that has a significant contribution to fragmentation. This is probably the reason that some of the variables such as B and S assume less importance in ANN but have retained their importance in RSA when several such variables were combined in a single factor ρee.

5. Conclusions

A hypothesis that there is further breakage by the collision effect during flight of fragments in the blasting process was evaluated in this study. An experimental scheme that presents similar trends in design variables was adopted and comparison was made with the help of fragmentation measured in three types of firing patterns in blasting. The effect of firing patterns on fragmentation were evaluated with the help of 92 blasts in which 12 blasts were taken with a line firing pattern, 36 blasts with diagonal, and 44 blasts with a V-Type firing pattern in a limestone mine. The results acquired showed that there is a significant reduction in fragmentation in the case of the V-Type and diagonal firing patterns, respectively, and counts for 45% and 26% reduction in fragmentation in comparison to that of the line firing pattern and diagonal firing pattern. Since design variables are similar in the case of diagonal and V-type firing patterns, the reduction in fragmentation in the case of the latter pattern can be assigned to the impact of collision.
A surface response model was developed for prediction of the mean fragmentation size (k50) that provided excellent results while using a rock factor with effective energy density in a blasthole and (B × S) as modeling variables. The results of the analysis are provided in the form of models for the three types of firing patterns analyzed which showed significant R2 and a strong agreement in adjusted and predicted R2.
Further, the ANN method was deployed for assessing the predictability of the fragmentation using a back propagation algorithm and two hidden layers. The model trained well and validation tests yielded significant correlation between the predicted and observed values of mean fragment size of the blasts. Moreover, the importance of blast variables on rock fragmentation was evaluated with the help of ANN analysis in which the firing patterns and rock factor along with the charge distribution in the blasthole assumed higher significance.

Author Contributions

Conceptualization, L.S.C., A.K.R., V.M.S.R.M., E.T.M., and R.M.B.; methodology, A.K.R. and V.M.S.R.M.; software, L.S.C. and A.K.R.; formal analysis, A.K.R. and V.M.S.R.M.; resources, A.K.R. and V.M.S.R.M.; data curation, L.S.C.; writing—original draft, L.S.C., A.K.R., V.M.S.R.M., E.T.M., and R.M.B.; writing—review and editing, A.K.R., V.M.S.R.M., and M.M.S.S.; supervision, A.K.R.; funding acquisition, M.M.S.S. All authors have read and agreed to the published version of the manuscript.

Funding

This research received no external funding.

Institutional Review Board Statement

Not applicable.

Informed Consent Statement

Not applicable.

Data Availability Statement

The data presented in this study are available on request from the corresponding author.

Acknowledgments

The paper forms a part of the Ph.D. work of the first author. The authors are thankful to their respective employers for their permission to publish the findings. Help of several persons in conducting the study is duly acknowledged.

Conflicts of Interest

The authors declare that there is no conflict of interest to disclose.

Abbreviations

The following abbreviations are used in this manuscript:
AbbreviationsExplanations
HbBench height (m)
BBurden (m)
BeEffective burden (m),
SSpacing (m)
SeEffective spacing (m)
MbRatio of Se to Be
MdRatio of S to B
lsStemming length (m)
k50Mean fragment size (m)
dBlasthole diameter(mm)
qSpecific charge (kg/m3)
NhNumber of holes
NrNumber of rows
QholeExplosive charge per hole (kg)
FiringPatFiring pattern
TLDTrunk Line Delay Detonator
DTHDown The Line Delay Detonator
RHSRight Hand Side (Connection of TLD leaning towards Right hand Side)
LHSLeft Hand Side (Connection of TLD leaning towards Left hand Side)
lsubLength of subgrade drilling (m)
ldeckLength of decking (m)
lqLength of explosive charge in the hole (m)
QblastExplosive charge per blast (kg)
RFRock factor
ρeeEquivalent explosive charge density (kg/m3), i.e., ratio of explosive per hole in kg to volume of charged section the blasthole where volume = B × S × lq
bsdProduct of burden (B) and spacing (S) (m2)
RSAResponse surface analysis
ANNArtificial neural network
ANOVAAnalysis of variance
ANFOAmmonium Nitrate Fuel oil

References

  1. Božić, B. Control of fragmentation by blasting. Rud. Geol. Naft. Zb 1998, 10, 49–57. [Google Scholar]
  2. Engin, I.C. A practical method of bench blasting design for desired fragmentation based on digital image processing technique and Kuz-Ram model. In Proceedings of the 9th International Symposium on Rock Fragmentation by Blasting, FRAGBLAST 9, Granada, Spain, 13–17 August 2009; pp. 257–263. [Google Scholar]
  3. Mackenzie, A. Cost of explosives—Do you evaluate it properly? Min. Congr. J. 1966, 52, 32–41. [Google Scholar]
  4. Hustrulid, W. Blasting Principles for Open Pit Mining: Volume 1—General Design Concepts; CRC Press: Boca Raton, FL, USA, 1999; Volume 1. [Google Scholar]
  5. Torrealba-Vargas, J.; Esteban, R.; Roy, D.; Runnels, D. Mine to mill approach to optimize power consumption in a process plant operation by modelling and simulation. In Proceedings of the IMPC 2016 28th International Mineral Processing Congress, Quebec City, Canada, 11–15 September 2016. [Google Scholar]
  6. Kim, K.M.; Kemeny, J. Site specific blasting model for mine-to-mill optimization. In Proceedings of the SME Annual Meeting and Exhibit and CMA 113th National Western Mining Conference, Denver, CO, USA, 28 February–2 March 2011; pp. 619–623. [Google Scholar]
  7. Lewandowski, D.; Lipnicki, P. Grinding Mill Process Optimization Algorithm; IEEE: Toulouse, France, 2019. [Google Scholar]
  8. Lam, M.; Jankovic, A.; Valery, W.; Kanchibotla, S. Maximising SAG mill throughput at Progera gold mine by optimizing blast fragmentation. In Proceedings of the International Conference on Autogenous and Semi-Autogenous Grinding Technology, Vancouver, BC, Canada, 25–28 September 2001; pp. 271–287. [Google Scholar]
  9. Afum, B.O. Rock Fragmentation Evaluation towards Blast-To-Mill Concept of Blast Optimization in Hard Rock Mines. J. Miner. Mater. Sci. 2021, 2, 1–9. [Google Scholar] [CrossRef]
  10. Zhang, Z.; Luukkanen, S. Feasibility and necessity of mine to mill optimization in mining industry. Mater. Medica 2021, 2, 63–66. [Google Scholar]
  11. Siddiqui, F.; Shah, S.; Behan, M. Measurement of Size Distribution of Blasted Rock Using Digital Image Processing. J. King Abdulaziz Univ. Sci. 2009, 20, 81–93. [Google Scholar] [CrossRef] [Green Version]
  12. Afeni, T.B. Optimization of drilling and blasting operations in an open pit mine-the SOMAIR experience. Min. Sci. Technol. 2009, 19, 736–739. [Google Scholar] [CrossRef]
  13. da Gama, C.D.; Jimeno, C.L. Rock fragmentation control for blasting cost minimization and environmental impact abatement. In Rock Fragmentation by Blasting; CRC Press: Boca Raton, FL, USA, 1993; pp. 273–280. [Google Scholar]
  14. Shim, H.J.; Ryu, D.W.; Chung, S.K.; Synn, J.H.; Song, J.J. Optimized blasting design for large-scale quarrying based on a 3-D spatial distribution of rock factor. Int. J. Rock Mech. Min. Sci. 2009, 46, 326–332. [Google Scholar] [CrossRef]
  15. Chouhan, L.S.; Raina, A.K. Analysis of In-Flight Collision Process During V-Type Firing Pattern in Surface Blasting Using Simple Physics. J. Inst. Eng. Ser. D 2015, 96, 85–91. [Google Scholar] [CrossRef]
  16. Choudhary, B.S. Firing Patterns and Its Effect on Muckpile Shape. Int. J. Res. Eng. Technol. 2013, 2, 32–45. [Google Scholar]
  17. Konya, C.J.; Walter, E.J. Rock blasting and overbreak control (No. FHWA-HI-92-001; NHI-13211). Security 1991, 132, 430. [Google Scholar]
  18. Jimeno, C.L.; Jimeno, E.L.; Carcedo, F.J.; de Ramiro, Y. Drilling and Blasting of Rocks. Drill. Blasting Rocks 1997, 1–391. [Google Scholar] [CrossRef]
  19. Luo, G.; Xiewen, H.; Yingjin, D.; Jiankang, F.; Xuefeng, M. A collision fragmentation model for predicting the distal reach of brittle fragmentable rock initiated from a cliff. Bull. Eng. Geol. Environ. 2019, 78, 579–592. [Google Scholar] [CrossRef]
  20. Monjezi, M.; Bahrami, A.; Varjani, A.Y. Simultaneous prediction of fragmentation and flyrock in blasting operation using artificial neural networks. Int. J. Rock Mech. Min. Sci. 2010, 47, 476–480. [Google Scholar] [CrossRef]
Figure 1. Influence of different firing patterns on rock fragmentation. (a) Rock fragmentation with line firing pattern (coarser size). (b) Rock fragmentation with diagonal firing pattern (medium size). (c) Rock fragmentation with V-type firing pattern (smaller size). (d) Average mean fragment size distributions of the three patterns for the test blasts.
Sustainability 14 15703 g001
Figure 2. Histogram(s) of various blast variables: (a) burden, (b) spacing, (c) stemming, (d) bench height, (e) specific charge, and (f) mean fragmentation size, monitored during the study.
Sustainability 14 15703 g002
Figure 3. Diagnostic plots: (a) Externally Studentized Residuals vs Normal % Probability, (b) Externally Studentized Residuals vs. Predicted, (c) Box-Cox pot for power transformation, and (d) Cook’s distance vs. Run Number.
Sustainability 14 15703 g003
Figure 4. Predicted versus measured values of the mean fragmentation size (k50) for the RSA model.
Sustainability 14 15703 g004
Figure 5. Interaction of different blast variables and response surface defined with the model for mean fragmentation size k50, (ac) relationship between RF and ρee with k50 with average (B × S), (df) influence of RF and (B × S) on k50 with average value of ρee, (gi) relationship between ρee and (B × S) on k50 with average value of RF, for three different firing patterns tested.
Sustainability 14 15703 g005aSustainability 14 15703 g005b
Figure 6. Suggested ANN topology for the study.
Sustainability 14 15703 g006
Figure 7. Neural network training and validation.
Sustainability 14 15703 g007
Figure 8. ANN training results (a), ANN-based validation results (b).
Sustainability 14 15703 g008
Figure 9. Importance of blast variables as determined by ANN.
Sustainability 14 15703 g009
Table 1. Line firing pattern (a).
Firing PatternLine Firing Pattern (Holes in Same Row Fired Simultaneously)
Representative imageSustainability 14 15703 i001
Main objectivesTo achieve coarser fragmentation with lesser muck pile throw
Effect of firing pattern on fragmentationMb = Md
where Mb is the ratio of Se to Be and Md is the ratio of S to B. With this type of firing pattern, effective burden (Be) is equal to the drill burden, which results in no advantage to the firing pattern on fragmentation. In addition, the movement of rock fragments is also in a single direction, with little possibility of inter collision of rock fragments during blasting. However, when rock fragments strike the ground, further fragmentation may take place which is governed by several variables, namely, discontinuities in the initial rock mass, their orientation at the time of impact, physicomechanical properties, incident angle, impact velocity, geometry and stiffness of the ground, and the presence of water [19].
Table 2. Line firing pattern (b).
Firing PatternLine Firing Pattern (Holes in Same Row Fired Individually, But Firing of Successive Row Starts after Completion of the Preceding Row)
Representative imageSustainability 14 15703 i002
Main objectivesTo achieve larger fragmentation with more muck pile throw.
Effect of firing pattern on fragmentationMb = Md
Similar influence on rock fragmentation as provided by line firing pattern given in Table 1.
Table 3. Diagonal firing pattern (RHS).
Firing PatternDiagonal Firing Pattern (RHS)
Representative imageSustainability 14 15703 i003
Main objectivesTo achieve coarser and uniform fragmentation with medium muck pile throw.
Effect of firing pattern on fragmentationMb < Md
Since effective burden (Be) increases than the drill burden (B) during firing, a coarser fragmentation is achieved. Since movement of rock fragments is only in a single direction, this pattern also has little possibility of in-flight collision of rock fragments during blasting.
Table 4. Diagonal firing pattern (LHS).
Firing PatternDiagonal Firing Pattern (LHS)
Representative imageSustainability 14 15703 i004
Main objectivesTo achieve medium and uniform fragmentation with medium muck pile throw.
Effect of firing pattern on fragmentationMb > Md
Since effective burden (Be) decreases than the drill burden (B) during firing, a medium fragmentation is achieved. Since the movement of rock fragments is only in a single direction, this pattern also has little possibility of in-flight collision of rock fragments during blasting.
Table 5. V-type firing pattern.
Firing PatternV-Type Firing Pattern
Representative imageSustainability 14 15703 i005
Main objectivesTo achieve smaller and uniform fragmentation with optimum muck pile throw.
Effect of firing pattern on fragmentationMb < Md
Since effective burden (Be) decreases than the drill burden (B) during firing, a smaller fragmentation is achieved. In addition, it provides in-flight collision of rock fragments during blasting leading to further fragmentation.
Mb = Se/Be, Md = S/B, S = drill spacing, B = drill burden, Se = effective spacing during blasting, Be = effective burden during blasting.
Table 6. Process of fragmentation assessment by the Fragalyst software.
StepImageDescription
1Sustainability 14 15703 i006Images of muck pile captured with calibrator at different time intervals to cover the all sizes of fragments in the whole muck pile.
2Sustainability 14 15703 i007Import the image in Fragalyst software.
3Sustainability 14 15703 i008Calibrate the image by known dimensions of calibrator in software.
4.1Sustainability 14 15703 i009Edge Deduction process (Boundary)
4.2Sustainability 14 15703 i010Edge Deduction process (Super Impose)
4.3Sustainability 14 15703 i011Edge Deduction process (Segmentation)
5Sustainability 14 15703 i012Fragmentation analysis—the data of Blasted Block Size Distribution (BBSD) i.e., a “3DR.file”, is saved automatically in a folder in which images are kept.
Table 7. General statistics of the variables measured.
StatisticsBurden (B) (m)Spacing (S) (m)Stemming Length (ls) (m)Bench Height (Hb) (m)Specific Charge (q) (kg/m3)Mean Fragmentation Size (k50) (m2)
Mean2.823.862.819.080.480.32
Standard Error0.010.020.040.080.000.01
Median2.833.912.509.360.480.30
Mode2.804.002.509.850.500.30
Standard Deviation0.090.180.400.800.040.10
Sample Variance0.010.030.160.630.000.01
Kurtosis1.030.76−1.211.52−0.681.34
Skewness-0.44−1.350.43−1.260.161.18
Range0.490.651.593.850.160.42
Minimum2.533.412.006.140.410.20
Maximum3.034.063.599.990.570.62
Sum259.28354.91258.49835.6844.2729.19
Count92.0092.0092.0092.0092.0092.00
Table 8. Response surface design evaluation results.
SourceSum of SquaresdfMean SquareF-Valuep-Value
Model0.532270.076106.42<0.0001
A-A0.143120.0715100.14<0.0001
B-RF0.014610.014620.4<0.0001
C-ρee0.016110.016122.55<0.0001
D-B × S0.014610.014620.44<0.0001
BC0.005810.00588.120.0055
D20.012410.012417.38<0.0001
Residual0.0579810.0007
Cor Total0.5988
Table 9. ANOVA for the reduced RSA model.
Std. Dev.0.0267R20.90
Mean0.3087Adjusted R20.89
C.V. %8.66Predicted R20.88
Adequate Precision38.70
Table 10. Input parameters used for developing the neural network and their ranges.
Input ParametersSymbolsRanges
Burden (m)B2.53–3.02
Spacing (m)S3.41–4.06
Stemming length (m)ls2.0–3.59
Bench Height (m)Hb6.13–9.98
Sub Drill (m)lsub0.0–0.2
Air Decking Length (m)ldeck0.0–1.7
Number of holesNh11–27
Number of rowsNr2–5
Charge length (m)lq3.23–8
Charge/hole (kg)Qhole29.75–61.87
Charge/blast (kg)Qblast401.21–1246.95
Rock factorRF6–8
ρee (kg/m3)ρee0.38–0.60
Specific Charge, kg/m3)q0.41–0.57
firing patternFPatL = 1, D = 2, V = 3
B × S-9.27–12.28
Table 11. Output parameter used for developing neural network and their ranges.
Output ParametersSymbolRange
Mean Fragmentation size (m)k500.20–0.62
Publisher’s Note: MDPI stays neutral with regard to jurisdictional claims in published maps and institutional affiliations.

