
The Impact of Surface Water Seepage on Seismicity and Rockbursting in Mines


Abstract
:1. Introduction
2. Study Site
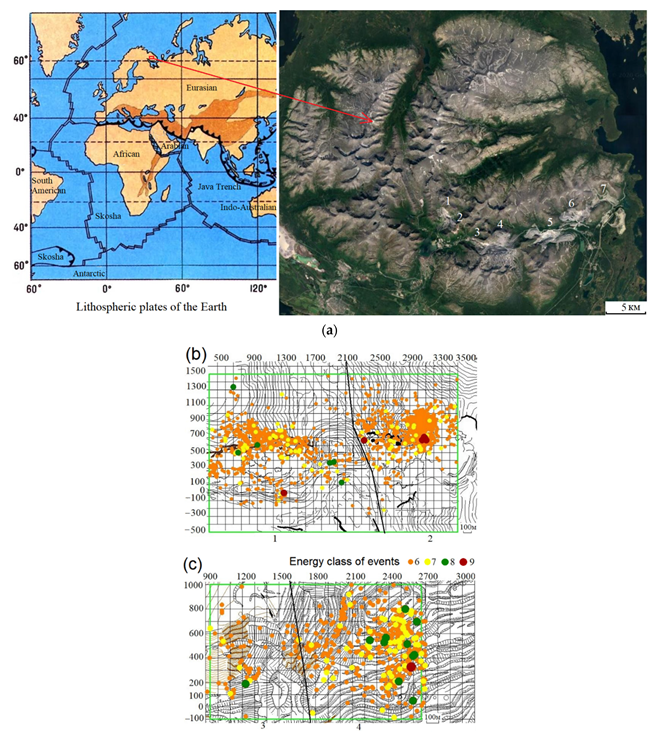
2.1. The Apatite–Nepheline Deposits, Kola Peninsula
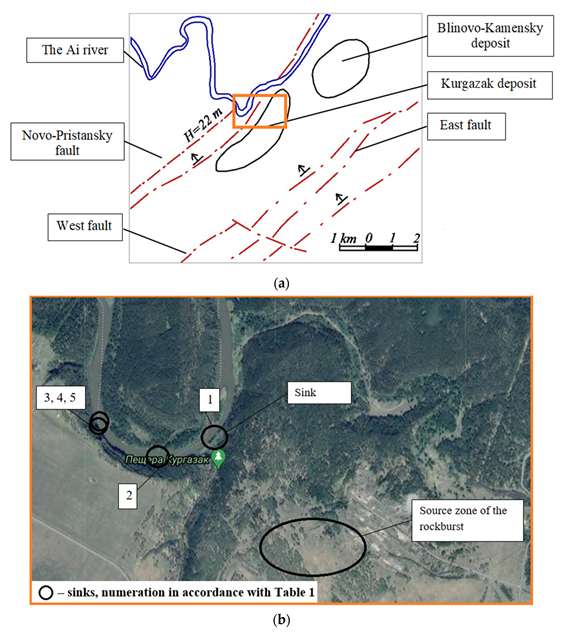
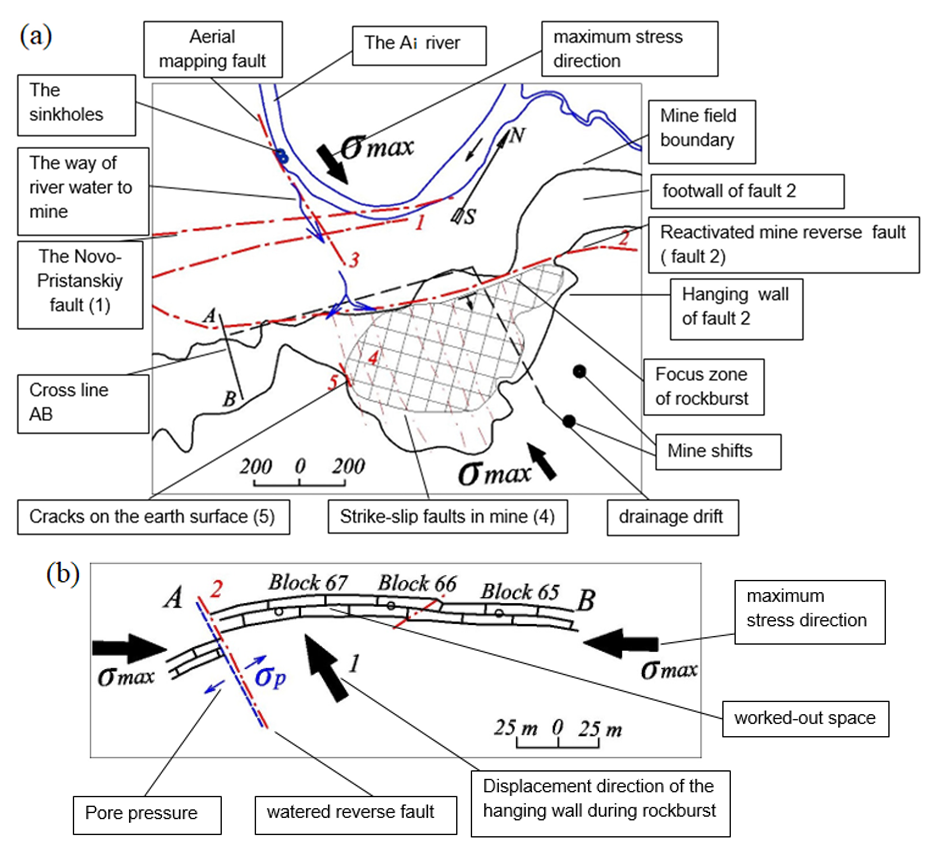
2.2. A Bauxite Mine, Southern Ural
3. Theory and Methods
3.1. Tectonophysics Conditions of Faults’ Reactivation
3.2. Reactivation of Faults during the Pore Pressure Measurement
4. In Situ Studies
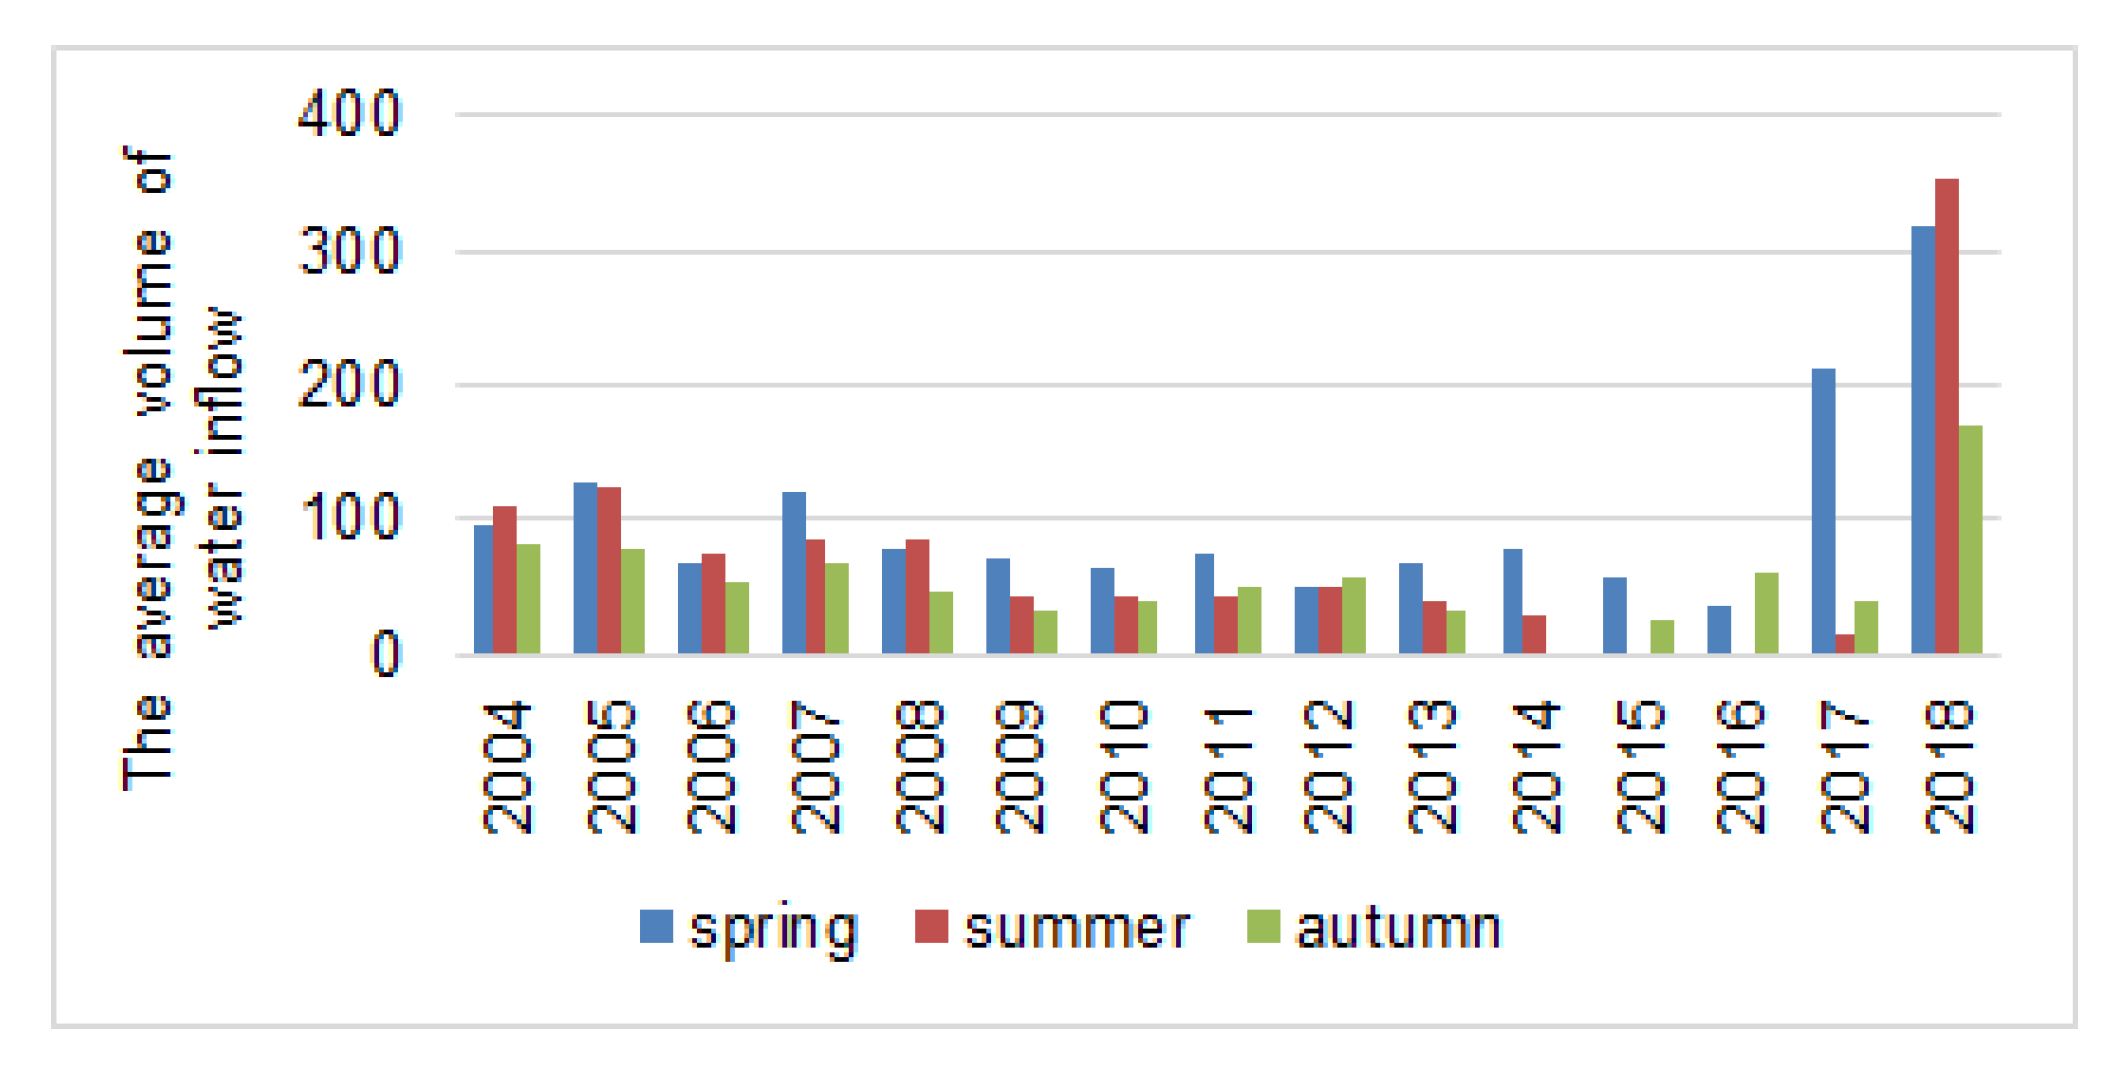
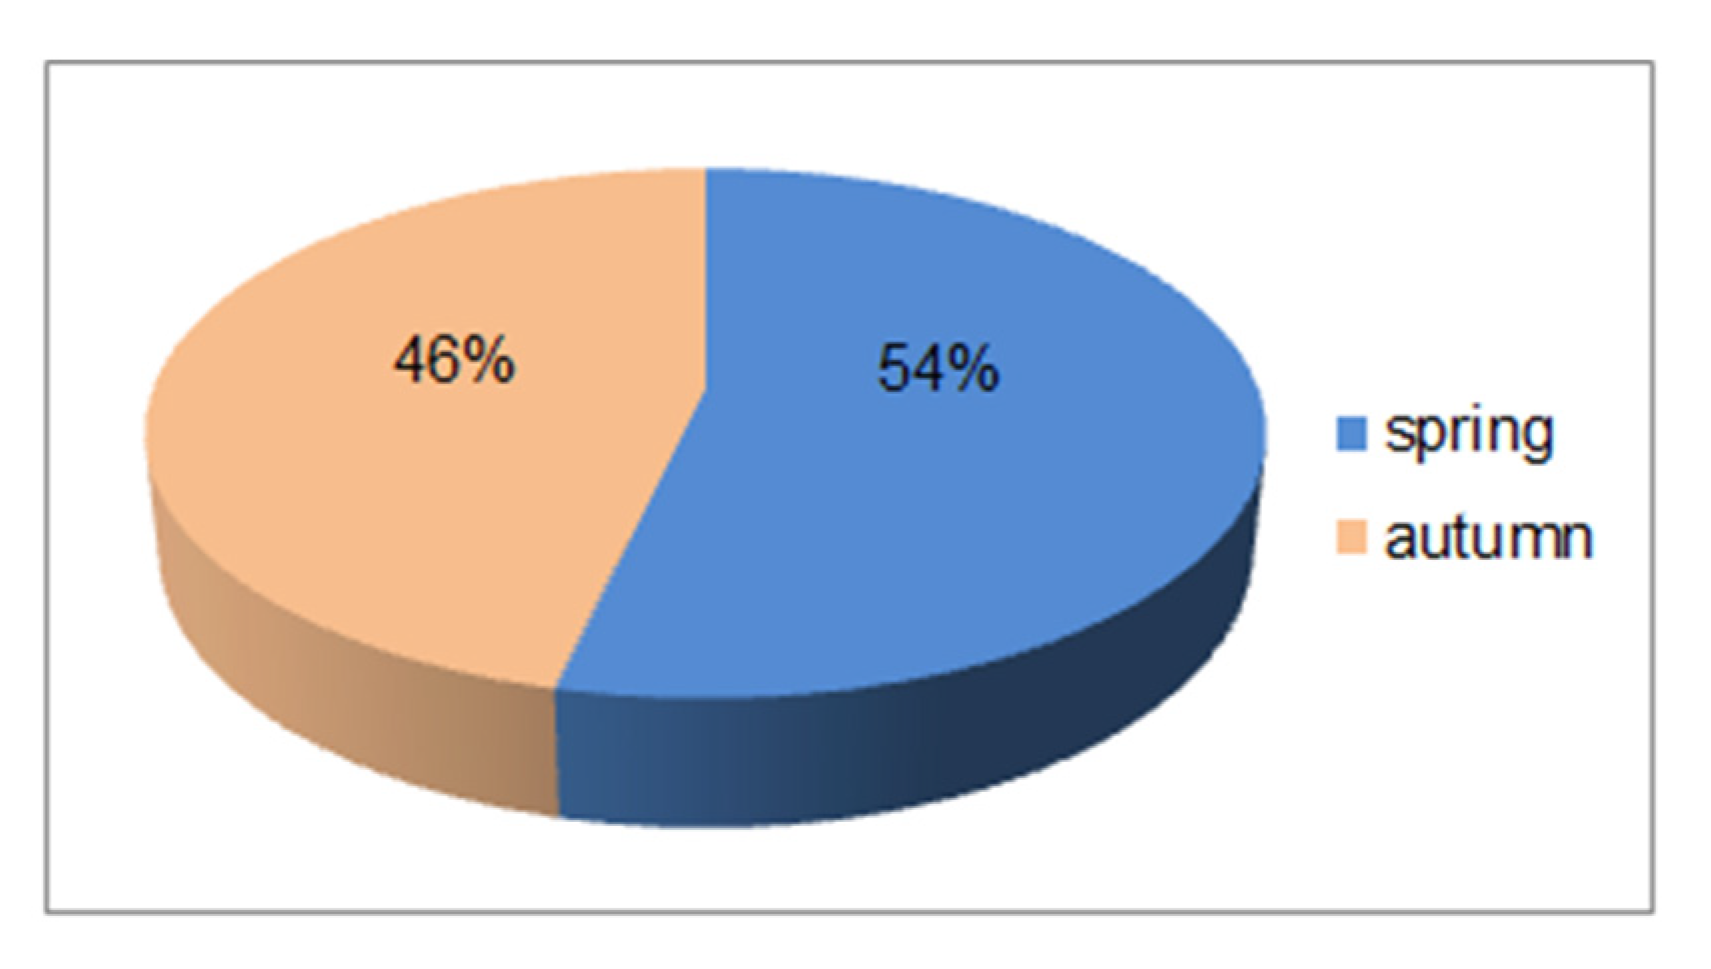
4.1. Monitoring of Water Inflows
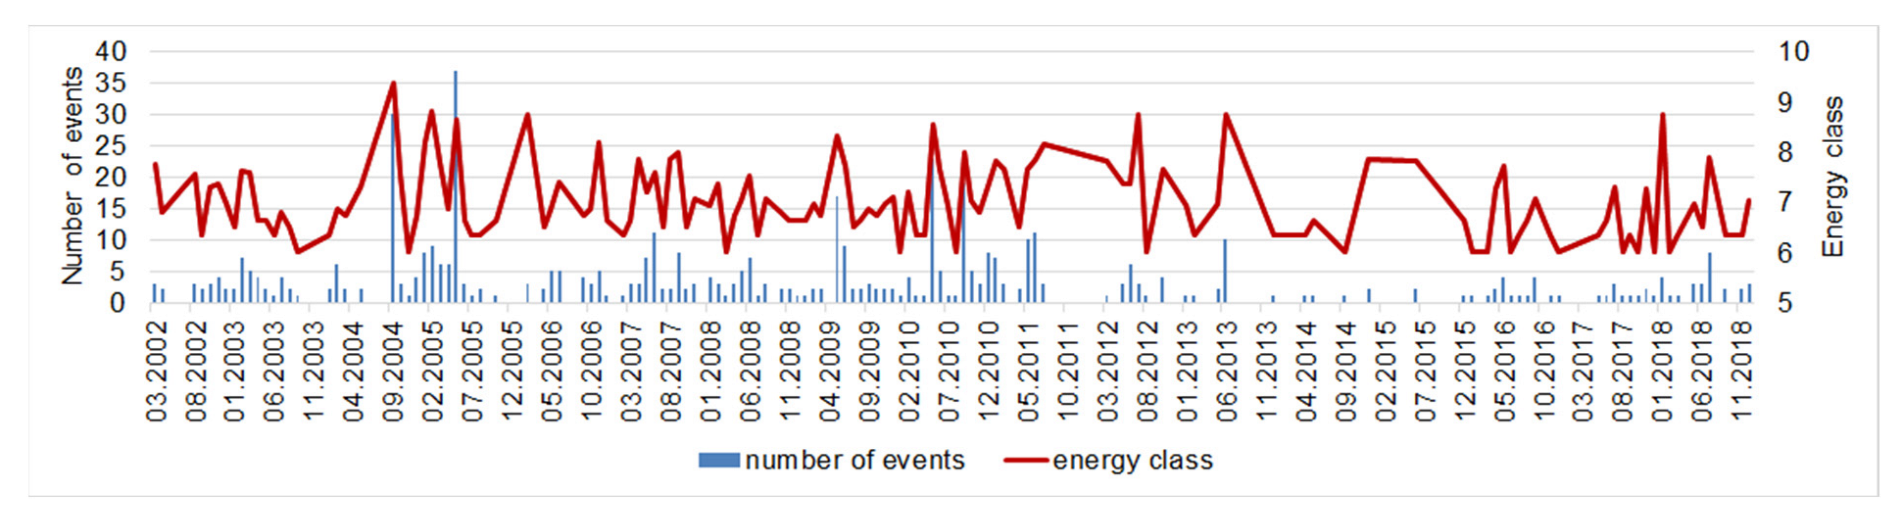
4.2. Monitoring of Seismic Events
5. Results and Discussion
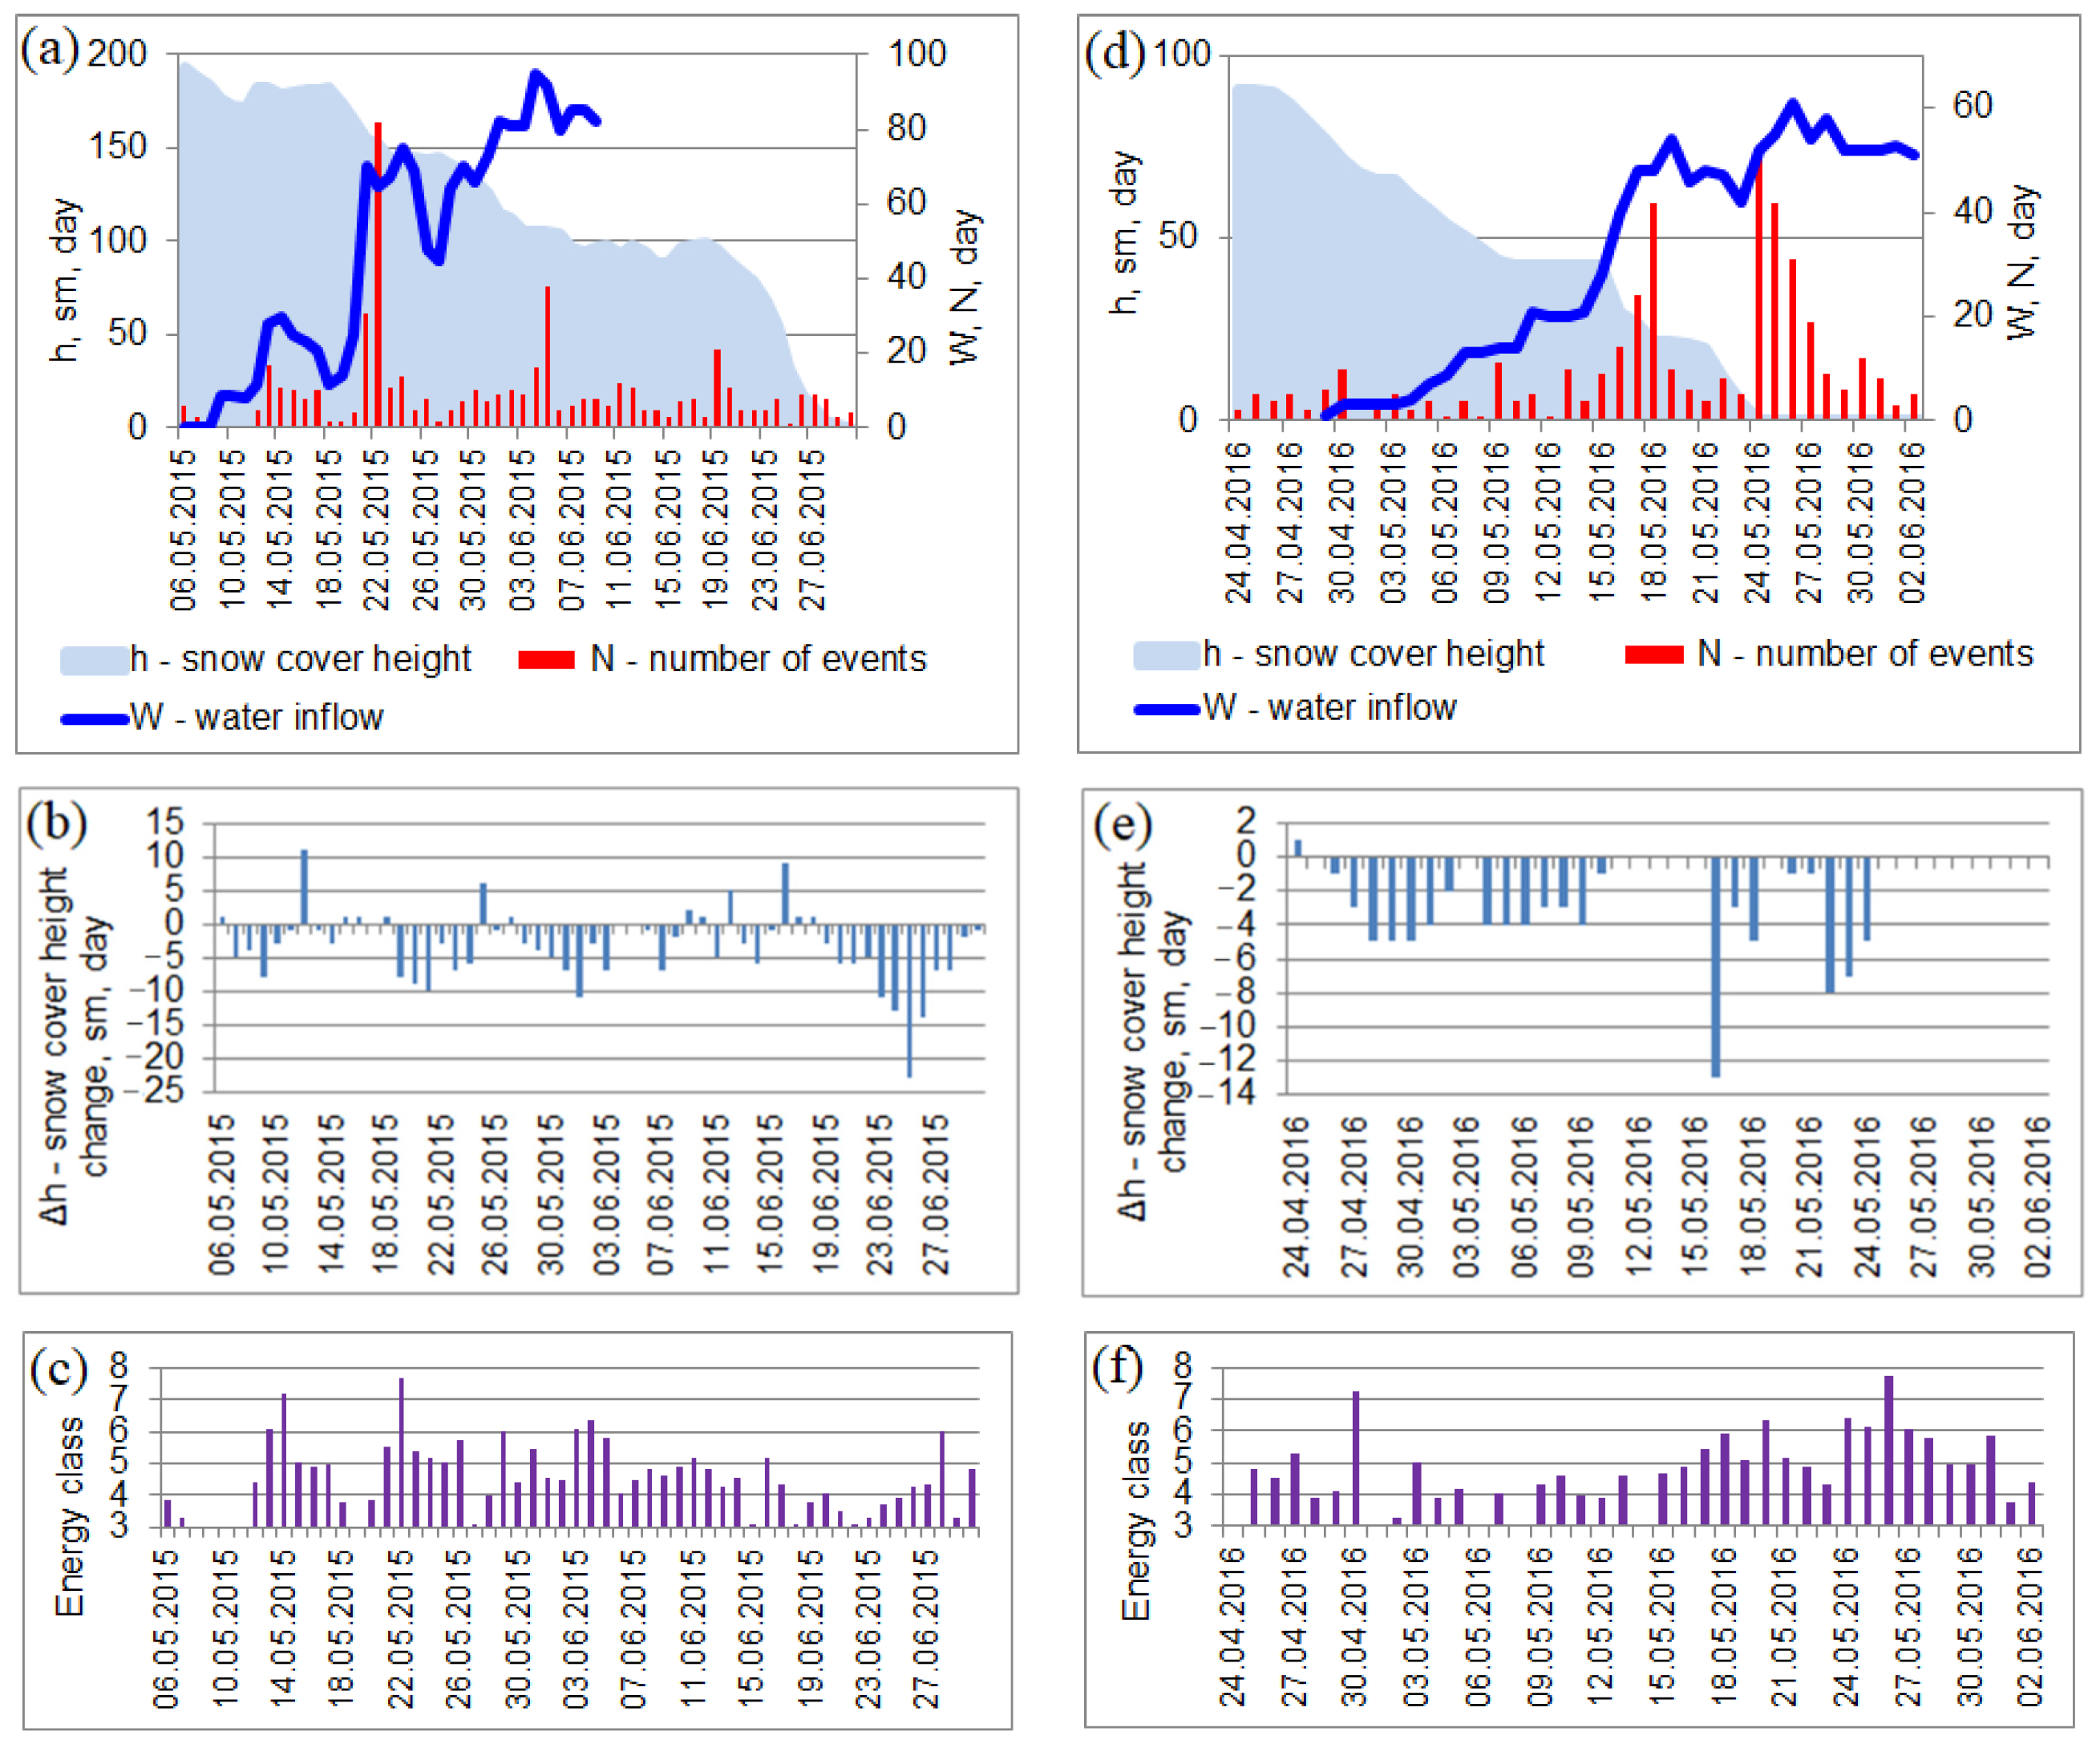
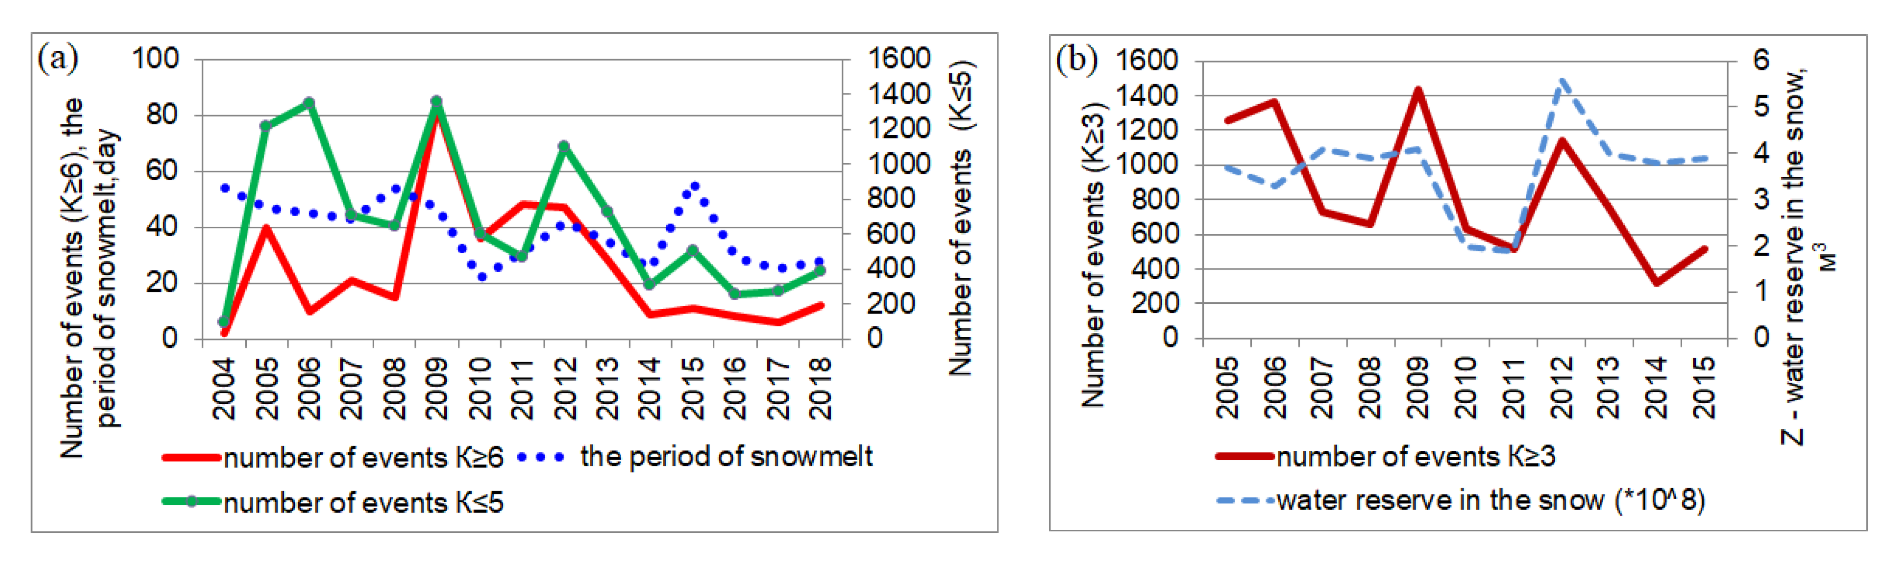
5.1. Regularity of the Increase in Seismic Activity of the Rock Mass Whilst under the Impact of Surface Seepage during Snowmelt or Heavy Precipitation in the Khibiny Deposits
- − Water reserve in the snow cover was more than 3 × 10⁸ m3;
- − The snowmelt period exceeded 40 days;
- − Increase in water ingress rates continued for over 5 days and the total water inflow volume exceeded the previous daily measurements by a factor of 2.
- − Some additional data is placed in Supplementary Materials.
5.2. A Possible Origin of the Strong Rockburst, Southern Ural
6. Conclusions
- − Water reserve in the snow cover was more than 3 × 10⁸ m3;
- − The snowmelt period exceeded 40 days;
- − Increase in water ingress rates continued for over 5 days and the total water inflow volume exceeded the previous daily measurements by a factor of 2.
Supplementary Materials
Author Contributions
Funding
Institutional Review Board Statement
Informed Consent Statement
Conflicts of Interest
References
- Chen, X.; Li, L.; Wang, L.; Qi, L. The current situation and prevention and control countermeasures for typical dynamic disasters in kilometer-deep mines in China. Saf. Sci. 2019, 115, 229–236. [Google Scholar] [CrossRef]
- Shabarov, A.N.; Tsirel, S.V. Geodynamic safety of subsurface management. In Geomechanics and Geodynamics of Rock Masses: Selected Papers from the 2018 European Rock Mechanics Symposium; CRC Press: Boca Raton, FL, USA, 2018; Volume 1, pp. 105–120. [Google Scholar]
- Eremenko, A.A.; Mashukov, I.V.; Eremenko, V.A. Geodynamic and Seismic Events under Rockburst-Hazardous Block Caving in Gornaya Shoria. J. Min. Sci. 2017, 53, 65–70. [Google Scholar] [CrossRef]
- Rudziński, Ł.; Mirek, K.; Mirek, J. Rapid ground deformation corresponding to a mining-induced seismic event followed by a massive collapse. Nat. Hazards 2019, 96, 461–471. [Google Scholar] [CrossRef] [Green Version]
- Bao, X.; Eaton, D.W. Fault activation by hydraulic fracturing in western Canada. Science 2016, 354, 1406–1409. [Google Scholar] [CrossRef] [PubMed]
- Petrov, V.A.; Minaev, V.A.; Ustinov, S.A.; Nafigin, I.O.; Lexin, A.B. Assessment of Seismogeodynamic Activity of Mining Areas on the Basis of 3D Geoinformation Modeling. Russ. J. Earth Sci. 2021, 21, ES6003. [Google Scholar] [CrossRef]
- Kozyrev, A.A.; Semenova, I.E.; Zhuravleva, O.G.; Panteleev, A.V. Hypothesis of strong seismic event origin in Rasvumchorr mine on January 9, 2018. Min. Informational Anal. Bull. 2018, 2018, 74–83. [Google Scholar] [CrossRef]
- Małkowski, P.; Niedbalski, Z. A comprehensive geomechanical method for the assessment of rockburst hazards in underground mining. Int. J. Min. Sci. Technol. 2020, 30, 345–355. [Google Scholar] [CrossRef]
- He, M.; Xia, H.; Jia, X.; Gong, W.; Zhao, F.; Liang, K. Studies on classification, criteria and control of rockbursts. J. Rock Mech. Geotech. Eng. 2012, 4, 97–114. [Google Scholar] [CrossRef] [Green Version]
- Li, T.; Ma, C.; Zhu, M.; Meng, L.; Chen, G. Geomechanical types and mechanical analyses of rockbursts. Eng. Geol. 2017, 222, 72–83. [Google Scholar] [CrossRef]
- Liu, J.; Liu, Z.; Wang, S.; Shi, C.; Li, Y. Analysis of microseismic activity in rock mass controlled by fault in deep metal mine. Int. J. Min. Sci. Technol. 2016, 26, 235–239. [Google Scholar] [CrossRef]
- Rasskazov, I.Y.; Fedotova, Y.V.; Sydlyar, A.V.; Potapchuk, M.I. Analysis of induced seismic events in rockburst-hazardous Nikolaevsk deposit. Min. Inf. Anal. Bull. 2020, 2020, 46–56. [Google Scholar] [CrossRef]
- Yakovlev, D.V.; Tsirel’, S.V.; Mulev, S.N. Laws of spreading and operational evaluation procedure for induced seismicity in mines and in mining areas. J. Min. Sci. 2016, 52, 233–244. [Google Scholar] [CrossRef]
- Feng, G.L.; Feng, X.T.; Chen, B.R.; Xiao, Y.X.; Yu, Y. A Microseismic Method for Dynamic Warning of Rockburst Development Processes in Tunnels. Rock Mech. Rock Eng. 2015, 48, 2061–2076. [Google Scholar] [CrossRef]
- Han, J.; Zhang, H.; Liang, B.; Rong, H.; Lan, T.; Liu, Y.; Ren, T. Influence of Large Syncline on In Situ Stress Field: A Case Study of the Kaiping Coalfield, China. Rock Mech. Rock Eng. 2016, 49, 4423–4440. [Google Scholar] [CrossRef]
- Keneti, A.; Sainsbury, B.A. Review of published rockburst events and their contributing factors. Eng. Geol. 2018, 246. [Google Scholar] [CrossRef]
- Tarasov, B.G. Paradoxes of strength and brittleness of rocks at seismic depths. Gorn. Zhurnal 2020, 2020, 11–17. [Google Scholar] [CrossRef]
- Petukhov, I.M.; Linkov, A.M. Theoretical principles and fundamentals of rock burst prediction and control. In Proceedings of the Congress of the 5th International Society for Rock Mechanics, Melbourne, Australia, 10 April 1983; pp. D113–D120. [Google Scholar]
- Diao, Y.; Espinosa-Marzal, R.M. The role of water in fault lubrication. Nat. Commun. 2018, 9, 2309. [Google Scholar] [CrossRef] [Green Version]
- Dou, Z.; Gao, T.; Zhao, Z.; Li, J.; Yang, Q.; Shang, D. The role of water lubrication in critical state fault slip. Eng. Geol. 2020, 271, 105606. [Google Scholar] [CrossRef]
- Guglielmi, Y.; Cappa, F.; Avouac, J.-P.; Henry, P.; Elsworth, D. Seismicity triggered by fluid injection-induced aseismic slip. Science 2015, 348, 1224–1226. [Google Scholar] [CrossRef] [Green Version]
- Elsworth, D.; Spiers, C.J.; Niemeijer, A.R. Understanding induced seismicity. Science 2016, 354, 1380–1381. [Google Scholar] [CrossRef]
- Srinivasan, S.; Benady, S.; Sivakumaz, C. Fluid Seismicity in Kolar Mining Region. In Proceedings of the Dam Safety, Including Instrumentation of Dams, Proceedings of Workshop, Thiruvanenthapuram, India, 15–17 November 2000. [Google Scholar]
- Batugin, A.; Klimanova, V. Assessment of the influence of the depth of flooding of the liquidated mines on the increase of the geodynamic hazard. In Deformation and Destruction of Materials with Defects and Dynamic Phenomena in Workings; Simferopol, Crimean Peninsula, 2000; pp. 26–27. [Google Scholar]
- Goldbach, O.D. Seismic risks posed by mine flooding. In Proceedings of the Hard Rock Safe Safety Conference, Sun City, South Africa, 28–30 September 2009; pp. 149–174. [Google Scholar]
- Holub, K. Rock mass response to the decline in underground coal mining. J. Min. Sci. 2006, 42, 15–26. [Google Scholar] [CrossRef]
- Gupta, H.K.; Rastogi, B.K. Dams and Earthquakes; Elsevier Scientific Publishing Company: Amsterdam, The Netherlands, 1976. [Google Scholar]
- Nikolaev, N.I. The first case of induced earthquakes during construction of a hydro-electric power-station in the USSR. Eng. Geol. 1974, 8, 107–108. [Google Scholar] [CrossRef]
- Hainzl, S.; Kraft, T.; Wassermann, J.; Igel, H.; Schmedes, E. Evidence for rainfall-triggered earthquake activity. Geophys. Res. Lett. 2006, 33. [Google Scholar] [CrossRef] [Green Version]
- Muço, B. The atmospheric water as a triggering factor for earthquakes in the central Virginia seismic zone. Nat. Hazards 2014, 71, 135–150. [Google Scholar] [CrossRef]
- Guryev, A.A. Sustainable development of the ore raw material base and beneficiation capacities of Apatit JSC on the basis of the best engineering solutions. Notes Min. Inst. 2017, 228, 662–673. [Google Scholar]
- Melnikov, N.N.; Kozyrev, A.А.; Panin, V.I. Seismicity in Mining; Melnikov, N.N., Ed.; KSC RAS: Apatity, Russia, 2002. [Google Scholar]
- Zhukova, S.А. The relationship of hydrogeological situation and activization of seismic activity on apatite circus deposit and Rasvumchorr deposit. Min. Inf. Anal. Bull. 2015, 1, 319–329. [Google Scholar]
- Lovchikov, A. The Strongest Earthquakes and Rock Burst in Russian Ore Mines; Palmarium Academic Publishing: Saarbrucken, Germany, 2016; 141p. [Google Scholar]
- Kozlovsky, E.A. (Ed.) Mining Encyclopedia; Soviet Encyclopedia; Soviet Encyclopedia: Moscow, Russia, 1991. [Google Scholar]
- Fisenko G., L. Study of Slope Stability of Open Pits and Dumps; Nelra: Moscow, Russia, 1965; 378p. [Google Scholar]
- Novoselchenko, P. M South Ural bauxite deposits. Izv. Univ. J. Min. 2000, 3, 256–259. [Google Scholar]
- Lomakin, V.S.; Kholevin, N.I. Tectonic rockbursts in actual seismicity of the Urals. In Geodynamic Safety in the Development of the Subsoil and the Earth’s Surface; Publishing House of KSC RAS: Apatity, Russia, 2002; pp. 79–89. [Google Scholar]
- Ortlepp, W.D.; Stacey, T.R. Rockburst mechanisms in tunnels and shafts. Tunn. Undergr. Sp. Technol. Inc. Trenchless 1994, 9, 59–65. [Google Scholar] [CrossRef]
- Petukhov, I.M. Rockbursts in Coal Mines; VNIMI: Saint-Petersburg, Russia, 2004; ISBN 5-902531-01-2. [Google Scholar]
- Scott, D.F.; Williams, T.J.; Friedel, M.J. Investigation of a Rockburst Site. In Rockbursts and Seismicity in Mines; Balkema: Rotterdam, The Nertherland; Krakow, Poland, 1997; pp. 311–315. [Google Scholar]
- Batugin, A. Critically Stressed Areas of Earth’s Crust as Medium for Man-caused Hazards. In E3S Web of Conferences; EDP Sciences: Les Ulis, France, 2018; Volume 56. [Google Scholar]
- Syrnikov, N.M.; Tryapitsyn, V.M. On the mechanism of a mining-induced earthquake in the Khibiny. Trans. Dokl.-Russ. Acad. Sci. Earth Sci. Sect. 1990, 314, 830–833. [Google Scholar]
- Gushchenko, O.I.; Kuznetsov, V.A. Determination of the orientation and main stress ratio by the totality of directions of shear tectonic displacements. In Stress and Strain Fields in the Lithosphere; Nauka: Moscow, Russia, 1979; pp. 60–66. [Google Scholar]
- Plotnikov, N.I. Environmental Protection in Mining Operations of Ore Deposits, Moscow; Nedra: Moscow, Russia, 1985. [Google Scholar]
- Chen, X.; Shearer, P.M.; Abercrombie, R.E. Spatial migration of earthquakes within seismic clusters in Southern California: Evidence for fluid diffusion. J. Geophys. Res. Solid Earth 2012, 117, b04301. [Google Scholar] [CrossRef]
- Dong, S.; Li, L.; Zhao, L.; Shen, X.; Wang, W.; Huang, H.; Peng, B.; Xu, X.; Gao, R. Seismic Evidence for Fluid-Driven Pore Pressure Increase and Its Links With Induced Seismicity in the Xinfengjiang Reservoir, South China. J. Geophys. Res. Solid Earth 2022, 127, e2021JB023548. [Google Scholar] [CrossRef]
- Gupta, H.K. Artificial Water Reservoir-Triggered Seismicity (RTS): Most Prominent Anthropogenic Seismicity. Surv. Geophys. 2022, 43, 619–659. [Google Scholar] [CrossRef]
- Zhu, J.B.; Kang, J.Q.; Elsworth, D.; Xie, H.P.; Ju, Y.; Zhao, J. Controlling Induced Earthquake Magnitude by Cycled Fluid Injection. Geophys. Res. Lett. 2021, 48, e2021GL092885. [Google Scholar] [CrossRef]
- Batugina, I.; Petukhov, I. Geodynamic Zoning of Mineral Deposits for Planning and Exploitation of Mines; Balkema A. Oxford and IBH Publishing Co. Pvt. Ltd.: Rotterdam, The Netherlands; New Delhi, India, 1990; ISBN 9061919487. [Google Scholar]
- Ilyin, A.M.; Antipov, V.N.; Naimark, A.N. Labor Safety in the Mining Industry; Nedra: Moscow, Russia, 1991. [Google Scholar]


| Discovery Date | Type of a Sinkhole | Note | Schematic Symbol, Figure 2 |
|---|---|---|---|
| Spring of 1980 | 6 × 7 m in plan, depth 2 m | Backfilled in June of 1980 | 1 |
| 15 July 1984 | By river width—10 m; by river length—14 m; depth—21 m. | Backfilled by 1 September 1984 | 2 |
| 21 June 1985 | By river width—10 m; by river length—8 m; depth—6 m. | Backfilled on 2 August 1985 | 3 |
| 29 August 1985 | By river width—5 m; by river length—4 m; depth—20 m. | Backfilled in autumn of 1985 | 4 |
| Spring of 1990 | Was formed on the site of sink 2 | Existed to the moment of a rockburst on 28 May 1990 | 5 |
| Year | Day/Month | h (cм) | ∆h (cм) | Start Date W (m3/Hour) |
|---|---|---|---|---|
| 2015 | 7 May | 193 | −5 | 9 May |
| 2016 | 26 April | 91 | −1 | 29 April |
| 2017 | 7 June | 120 | −1 | 10 June |
| 2018 | 6 May | 177 | −6 | 12 May |
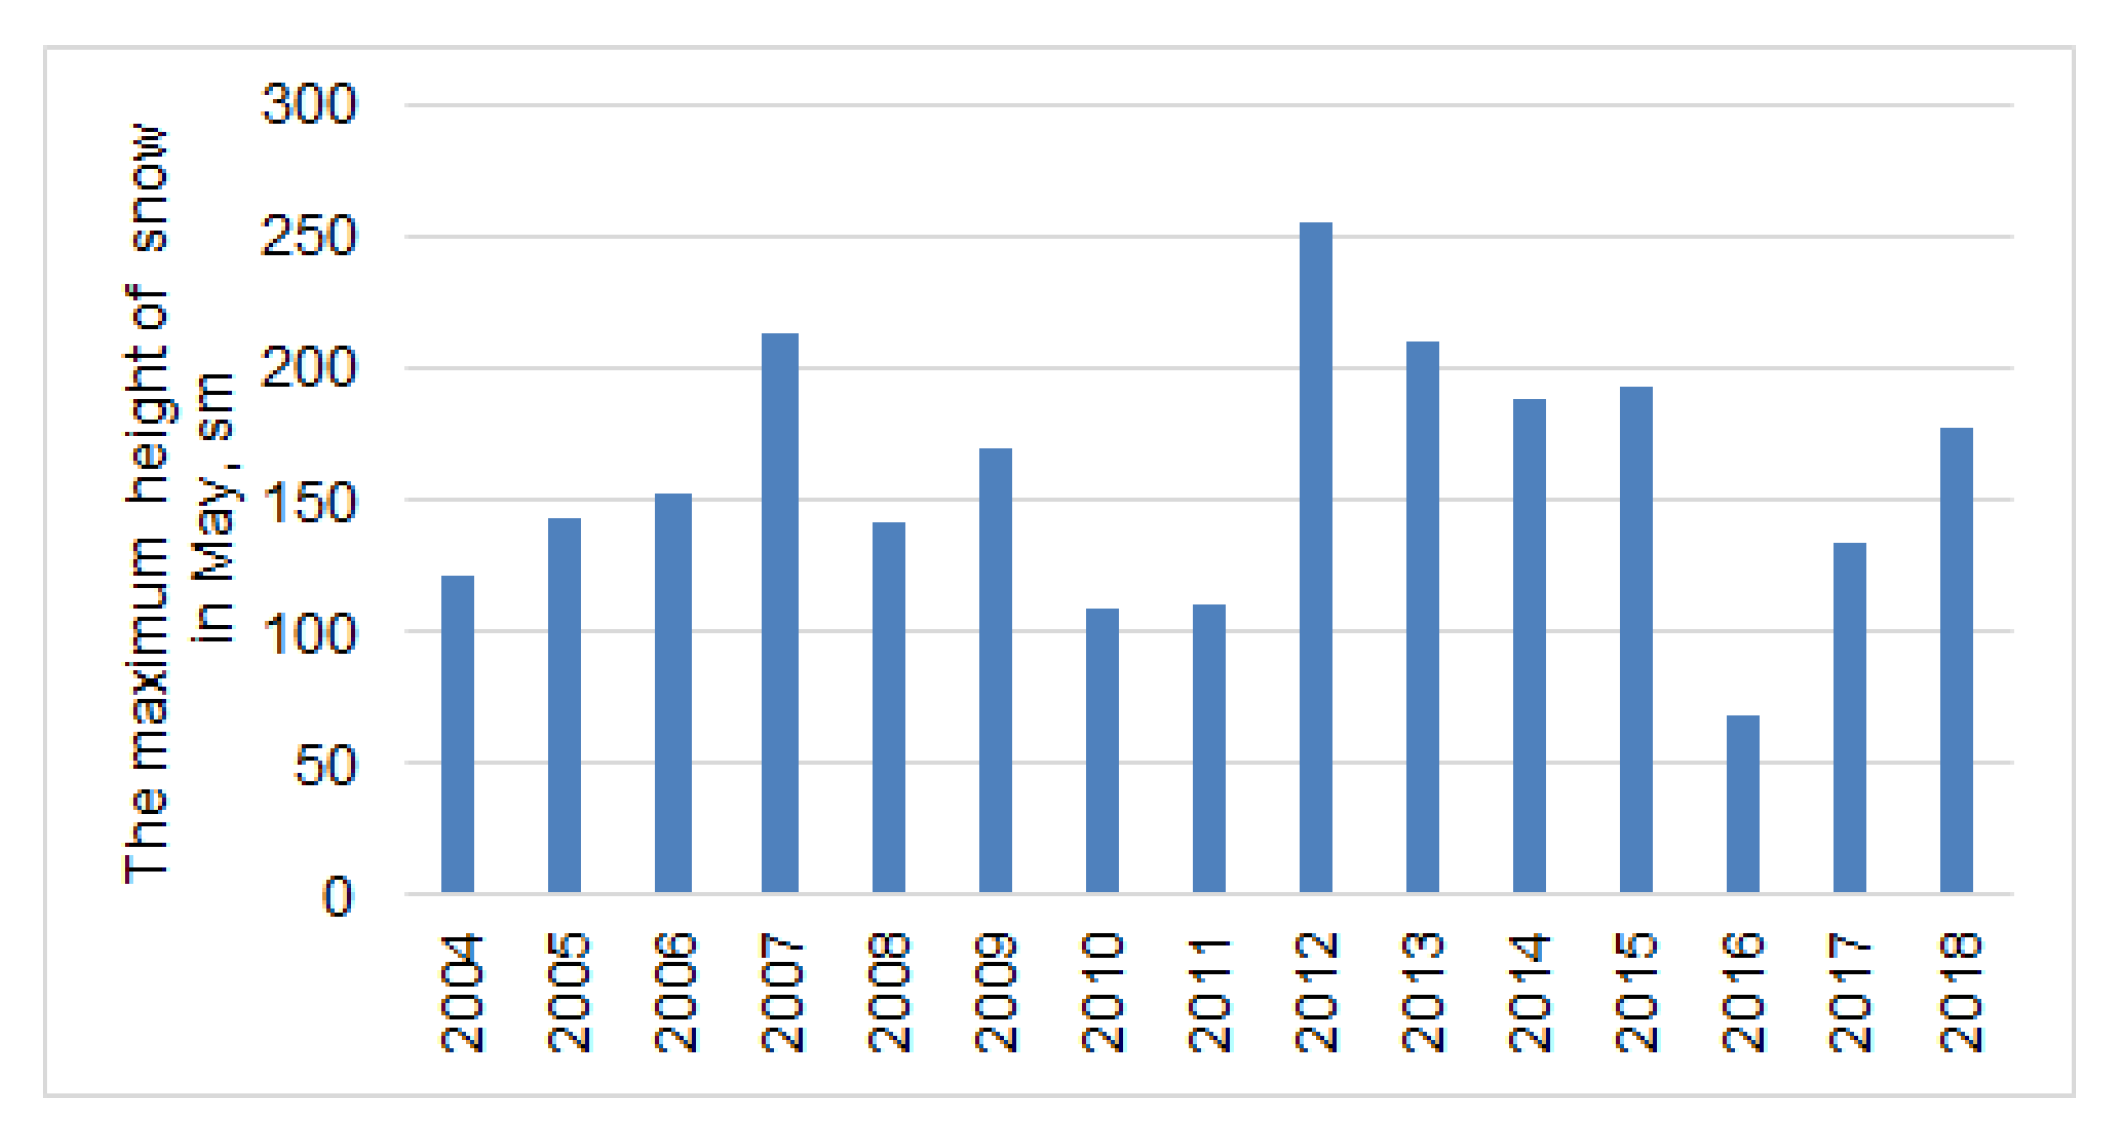
| Year | The Period of Snowmelt (Day) | Initial Height of Snow Cover for the Snowmelt Period (cm) | Average Water Inflow during the Snowmelt Period (m3/hour) | Total Released Energy of Events (J) | Water Reserve in the Snow (×108) (м3) | Number of Events K ≥ 6 | Number of Events K ≥ 3 |
|---|---|---|---|---|---|---|---|
| 2004 | 54 | 121 | 1737 | 2.0 × 10⁷ | - | 2 | 97 |
| 2005 | 47 | 143 | 1504 | 4.7 × 10⁸ | 3.7 | 40 | 1258 |
| 2006 | 45 | 152 | 985 | 2.4 × 10⁷ | 3.3 | 10 | 1361 |
| 2007 | 43 | 214 | 1889 | 7.4 × 10⁷ | 4.1 | 21 | 729 |
| 2008 | 54 | 141 | 717 | 8.0 × 10⁷ | 3.9 | 15 | 657 |
| 2009 | 47 | 170 | 722 | 6.8 × 10⁸ | 4.1 | 83 | 1438 |
| 2010 | 22 | 109 | 315 | 4.2 × 10⁷ | 2 | 36 | 635 |
| 2011 | 31 | 110 | 339 | 2.4 × 10⁸ | 1.9 | 48 | 520 |
| 2012 | 42 | 254 | 701 | 5.7 × 10⁸ | 5.6 | 47 | 1143 |
| 2013 | 35 | 210 | 864 | 6.8 × 10⁸ | 4 | 28 | 755 |
| 2014 | 25 | 186 | 630 | 1.9 × 10⁷ | 3.8 | 9 | 318 |
| 2015 | 56 | 193 | 551 | 1.5 × 10⁸ | 3.9 | 11 | 517 |
| 2016 | 29 | 91 | 196 | 2.6 × 10⁷ | - | 8 | 262 |
| 2017 | 25 | 121 | 2303 | 1.2 × 10⁷ | - | 6 | 278 |
| 2018 | 28 | 177 | 3991 | 2.9 × 10⁷ | - | 12 | 404 |
| Energy Class of the Main Event/Altitude Mark | Snow Melting Period | Energy Class of Foreshock/Aftershock Events | Height Range of Foreshocks/Aftershocks (m) | Description |
|---|---|---|---|---|
| Earthquake of 25 May 2005 | ||||
| K = 8/altitude mark 445 m | 1 May–17 June | K = 4 − 6/K = 4 − 8 | 200–700/150–850 | A series of shocks was felt in the area of ore passes and in the administrative buildings. In the open pit, crumbling of rock was observed in the spreusteinization zone. |
| Earthquake of 25 May 2009 | ||||
| K = 10/altitude mark—not determined (beyond the registration zone) | 8 May–24 June | K = 4 − 7/K = 4 − 7 | 100–860/100–900 | The main event as well as a series of foreshocks and aftershocks were felt in underground workings; in buildings of the Rasvumchorr, Tsentralny and Kirovsky mines; and in Kirovsk town. Rock falling off the walls and dust rising near the epicenter of the pit were noted at the mine. The events were triggered by a fault movement. |
| Shock of 18 May 2012 | ||||
| K = 8/altitude mark—not determined (beyond the in the control zone) | 16 May–27 June | K = 4 − 5/K = 4 − 7 | 340–600/100–700 | Shocks were felt in the junction zone of the underground Rasvumchorr mine and the Tsentralny open pit, as well as shocks to the Earth’s surface in the open pit. |
| Shock of 2 June 2013 | ||||
| K = 8/altitude mark 436 m | 16 May–20 June | K = 4 − 6/K = 4 − 7 | 100–600/100–700 | Activation of seismic activity was registered in the junction area and in the ore pass area. Workers at the Rasvumchorr mine felt tremors on June 2. No damage was found. |
Publisher’s Note: MDPI stays neutral with regard to jurisdictional claims in published maps and institutional affiliations. |
© 2022 by the authors. Licensee MDPI, Basel, Switzerland. This article is an open access article distributed under the terms and conditions of the Creative Commons Attribution (CC BY) license (https://creativecommons.org/licenses/by/4.0/).
Share and Cite
Kozyrev, A.; Batugin, A.; Zuo, J.; Zhukova, S. The Impact of Surface Water Seepage on Seismicity and Rockbursting in Mines. Sustainability 2022, 14, 15414. https://doi.org/10.3390/su142215414
Kozyrev A, Batugin A, Zuo J, Zhukova S. The Impact of Surface Water Seepage on Seismicity and Rockbursting in Mines. Sustainability. 2022; 14(22):15414. https://doi.org/10.3390/su142215414
Chicago/Turabian StyleKozyrev, Anatoly, Andrian Batugin, Jianping Zuo, and Svetlana Zhukova. 2022. "The Impact of Surface Water Seepage on Seismicity and Rockbursting in Mines" Sustainability 14, no. 22: 15414. https://doi.org/10.3390/su142215414