1. Introduction
According to [
1], people nowadays spend around 90% of their time indoors. Of significant importance is certainly the time spent in offices. As stated in [
2], the percentage of office workers in Vienna in the year of 2001 was 28.6% of all employees, and the trend has been raising in the last 20 years. Normal working time assumed by Austrian law is 8 h per day or 40 h per week, which turns out to be 24% of the total weekly time for employees working mainly in offices. [
3] Moreover, in Germany, a study shows the rise in the number of employees working in offices, as follows: In 2020, 71% of all employees in Germany worked at least partly in an office, which means 32 million people, whereas in 2015, it was only about 52% (22.5 million) [
4]. Due to all of the above stated facts, research regarding productivity in offices and the factors influencing it have become of even greater importance.
The biggest disturbances in the office work environment tend to be the temperature and climatic conditions, where air humidity plays a significant role [
5]. In [
6], the authors focused on the effects of temperature on performance at work in an office and their study showed that the performance of workers increases with temperature up to 21–22 °C, but also decreases with temperature above 23–24 °C. In addition to that, they also conclude that the highest productivity is at a temperature of around 22 °C. The results of ref. [
7] showed that the interaction and independent effect of temperature and illumination have a significant effect on the overall performance of office workers. The indoor room temperature reportedly influences the productivity more than the illumination. The effect of indoor temperature has 38.56% of the contribution to performance. In [
8], authors developed a new method to be able to quickly evaluate the impact of solar radiation on thermal comfort indoors. The results obtained in this study showed that the effect of solar radiation on thermal comfort is more severe in cold climate zones. Furthermore, it has been observed that controlling of the amount of solar radiation transmitted by windows facing east and west is more critical than for windows oriented in other directions.
Not only do the thermal conditions substantially influence the productivity but also the health and well-being of residents and office workers. Moreover, in the “WHO LARES” project [
9], the residents’ perceptions effectively showed that self-reported poor health is remarkably associated with poor thermal comfort. Based on [
10], the temperature range between 18 °C and 24 °C has been generally adopted as the thermal comfort range necessary to protect health and is supported by evidence.
The World Health Organisation (WHO) defines a “collection of non-specific symptoms including eye, nose and throat irritation, mental fatigue, headaches, nausea, dizziness and skin irritation, which seem to be linked with occupancy of certain workplaces” as sick building syndrome (SBS), the symptoms of which are common in highly populated places and can vary depending on the building [
11]. Considering the above-mentioned statistics on the time workers spend in an office building daily, it is obvious that office workers are the community mainly affected. Moreover, according to [
12] the SBS symptoms increase as the temperature increases. Furthermore, in [
13] calculations and analyses were carried out to show the effects of indoor climate, which is influenced by vertical greening, on the health conditions of the workers, as well as indirect economic effects in the context of reduced sick leave. The results showed that an economic consideration of vertical indoor greening in relation to its effects on sick leave in offices is worthwhile due to the improvement of humidity in the room and its impact on human health. Similarly, in [
14], a positive overall effect of the greenery on the well-being of elders in nursing homes in Austria was observed.
The American Society of Heating, Refrigerating and Air-Conditioning Engineers (ASHRAE) defines thermal comfort as: “the condition of the mind in which satisfaction is expressed with the thermal environment” [
15]. It is influenced by a range of individual and environmental objective and subjective factors. As such, thermal comfort is not a parameter that can be evaluated purely in an objective way. The environmental factors are the air temperature, the temperature of the surrounding surfaces, the relative humidity, the air movement, and the rate of air exchange (ventilation). Thermal comfort also depends on the clothing worn by the individual and the activity, as well as the health status, the age, the gender, and the adaptation to the local environment and climate of the individual [
9].
When it comes to office buildings and their structure, in [
16] the authors modelled office buildings in order to determine the effect of a range of energy-saving refurbishment measures on thermal comfort. Refurbishment of the building envelope was evaluated as remarkably useful for thermal comfort in the winter. However, the buildings were prone to overheating in the summer. In the existing experimental studies [
17,
18], the effect of green facades on building energy performance and temperature was studied by carrying out various measurements. Based on the experimental testing in [
19], it has been shown that vegetation placed horizontally at the outside wall of a building indeed affects the internal temperature. The research and the studies presented in [
20] have also shown that façade-bound greening improves the U-value (thermal transmittance) of uninsulated buildings. Even though many parameters of living wall systems have been investigated in the past ten years, thermal bridges of such systems were neglected for years. Investigations demonstrated in [
21] showed that thermal bridges of living wall systems must be taken into consideration. Furthermore, refs. [
22,
23] present investigations of different challenges existing in predicting and evaluating thermal comfort for vehicular cabins, when compared with thermal comfort in buildings. Such predictions are of course of a high importance, as people nowadays tend to spend an increased amount of time driving and in various types of vehicles.
As shown in the presented literature review, refurbishment measures of buildings, as well as usage of living green wall systems as a means of thermal insulation and their effect on thermal comfort, are among the fairly well investigated topics. However, a study of thermal comfort in a newly renovated and greened building, combining both investigations based on measurements and calculated predictions, and a survey of the employees is not known to the authors of this paper, which ensures the novelty of the approach to be presented.
The office building of a municipal department in Vienna was thermally renovated in the year of 2015 and street-side facade greening was installed. The aim of this paper and the investigations carried out was to determine the possible effects on thermal comfort inside the building due to these renovation measures, with the emphasis on the installation of the façade greening. Embedded in a broader research project, this work deals with the investigation of the effects that can be observed one year after the refurbishment. Thus, the current situation in the building is described and the effects of the building renovation are documented and proven.
Due to its subjective perception, there is no possibility of thermal comfort analysis that takes all influencing factors into account in a generally valid way. In this work, the evaluation is carried out in accordance with standards based on the predicted mean vote (PMV), which is calculated with collected measurement data [
24]. Furthermore, based on a survey of the employees of the renovated office building, the calculation results according to the standard are compared with the subjective perception and are then evaluated.
The satisfaction of the employees is reflected in their work performance. The goal is therefore to achieve the highest possible satisfaction of the building’s users, which is influenced by the quality of the working environment. Among other things, thermal comfort influences this quality and should therefore be guaranteed to a high degree.
2. Materials and Methods
To achieve the goal of this work and present the effects of the renovation measures on the thermal comfort inside the office building, both the theoretical calculations based on collected measurement data and the qualitative statements obtained through the created questionnaire were evaluated.
Thermal comfort in office buildings is assessed in accordance with DIN EN ISO 7730 by calculating the predicted mean vote (PMV) and the predicted percentage of dissatisfaction (PPD). The variables required for this calculation are obtained from the measurements performed, as well as supplemented by assumptions within the framework of the standard. The choice of the measuring instruments used is based on DIN EN ISO 7726 for a moderate ambient climate [
25]. For the determination of PMV and PPD, the mean value was used, with data that was previously checked for consistency and outliers.
In both the summer of 2015 and the summer of 2016, measurements were carried out in three offices, which were evaluated and compared with each other on a daily basis. In addition, compliance with the requirements for the indoor climate in work rooms according to the Workplace Ordinance [
26] was examined and the air temperature and relative humidity from the two years are compared for one room each and represented in its context.
Furthermore, a survey of the employees of the renovated office building was carried out using a developed questionnaire, which refers to the summer months of July and August 2016. The focus of the questionnaire is on those questions that are dedicated to the parameters that are also taken into account in the calculation, such as the perceived temperature and the related satisfaction, as well as the humidity and quality of the air or perceived drafts. For better comparability, the formulations and evaluation scales according to DIN EN ISO 7730 were used.
In addition, the employees’ impression of the lighting conditions as well as the acoustic and spatial conditions were also surveyed, which indirectly influence the subjective evaluation of the thermal comfort in the room. The last part of the survey was intended to find out whether the employees had already noticed a change compared to the condition before the building was renovated and, if so, how they perceived it. The results of the calculation and the findings from the survey will be compared and discussed.
2.1. Description of the Office Building
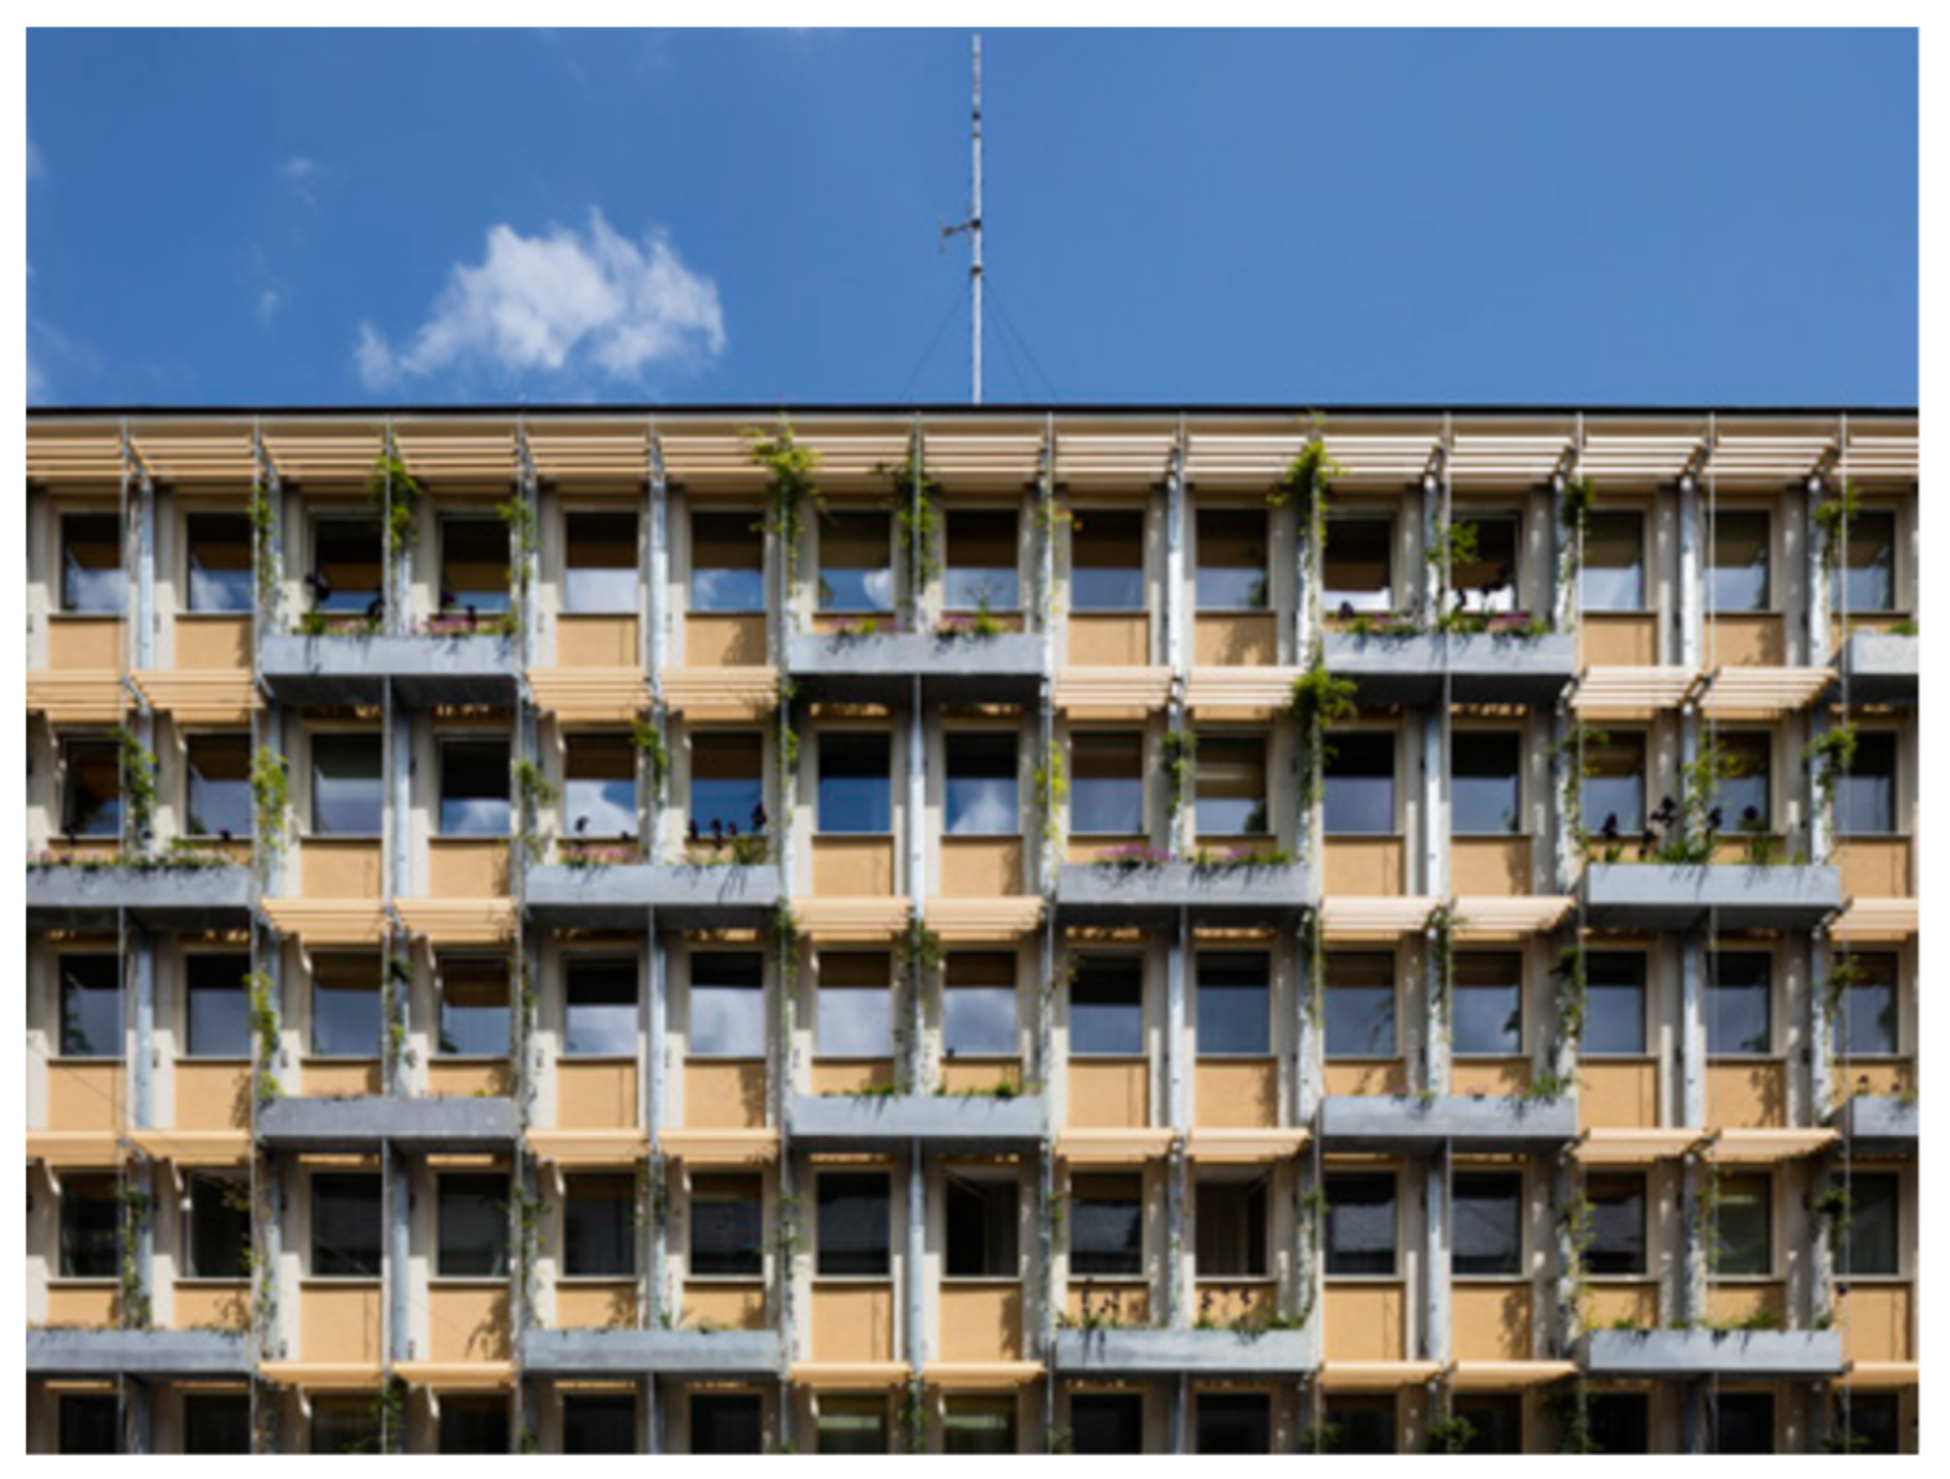
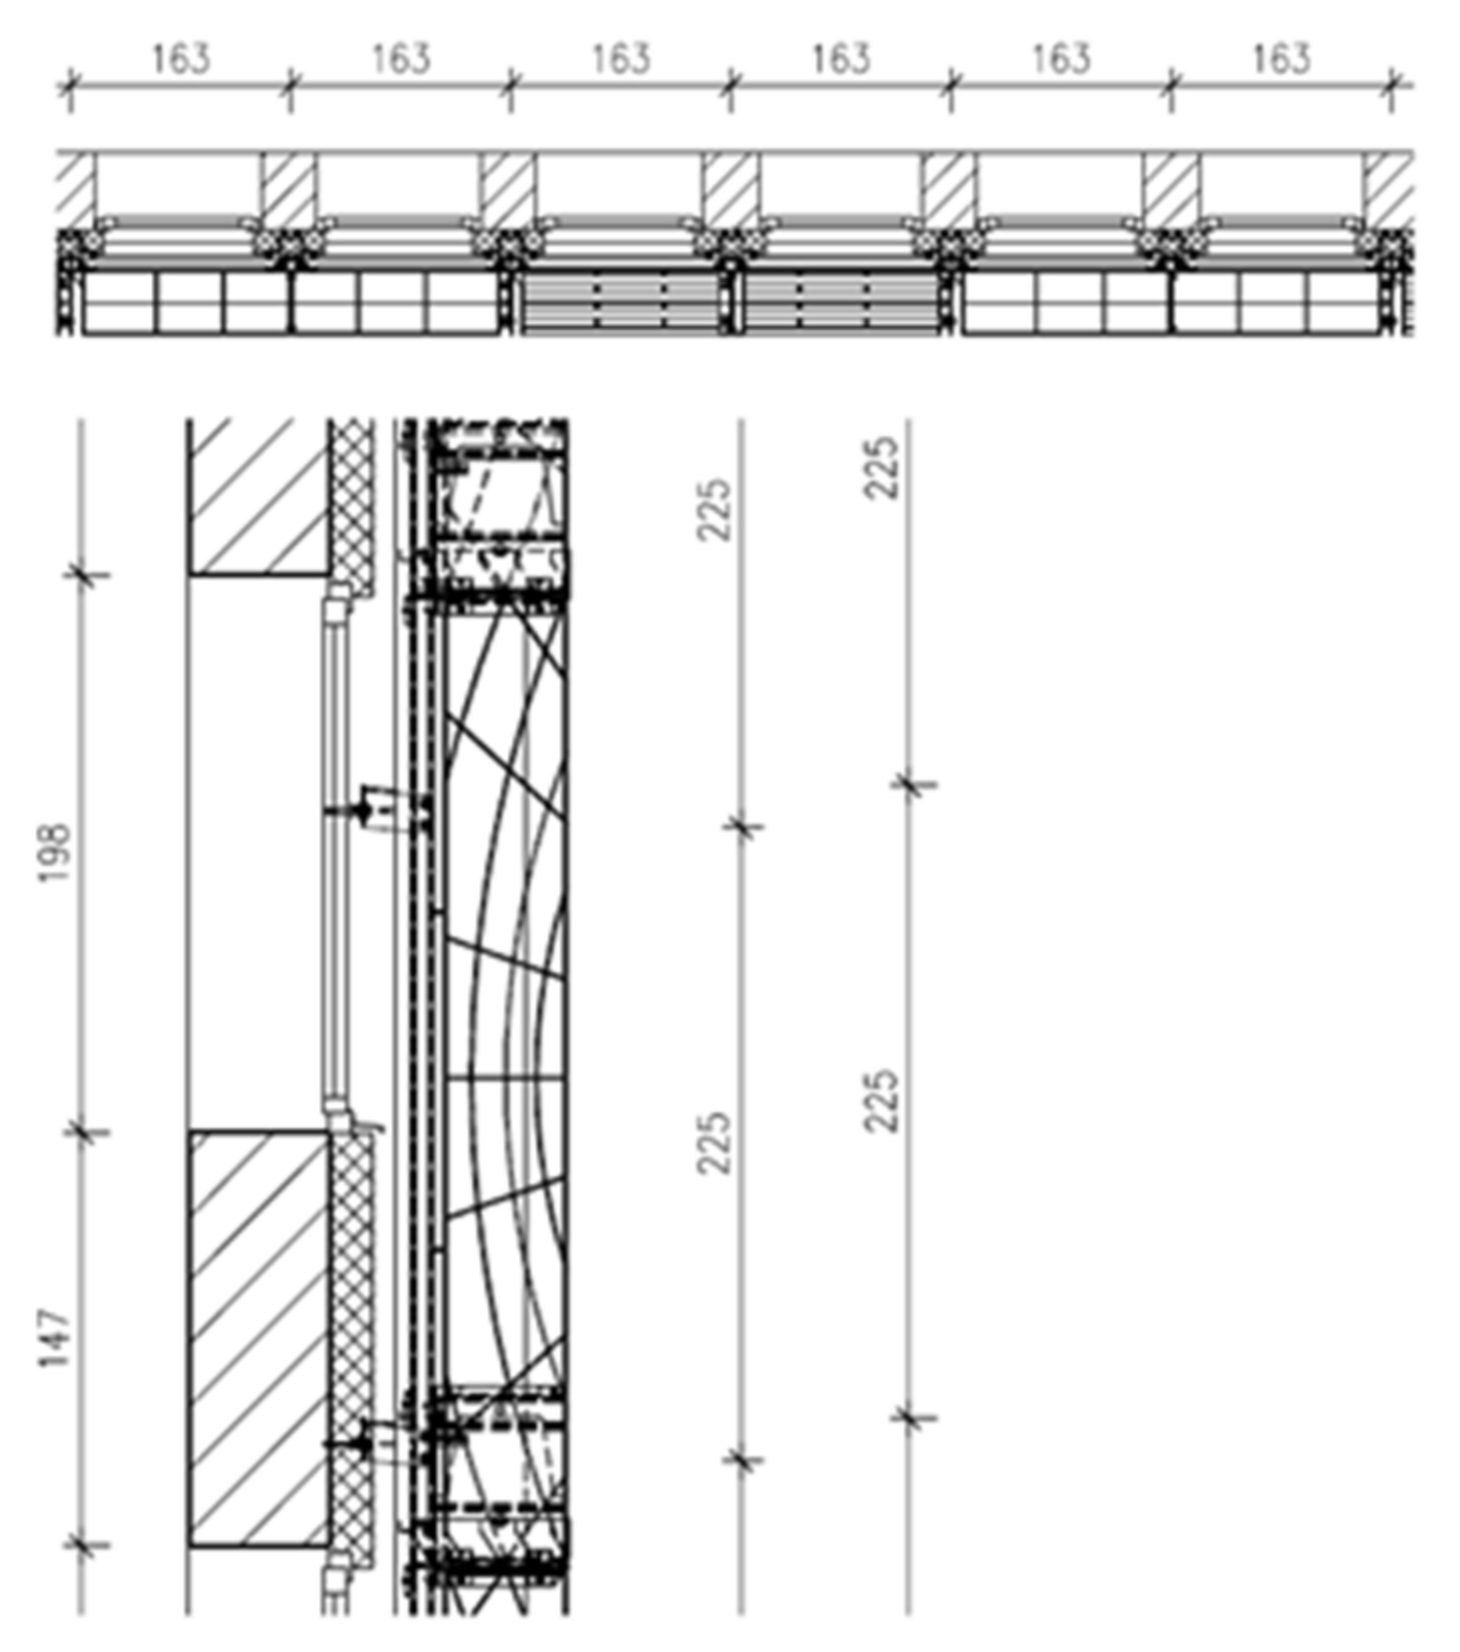
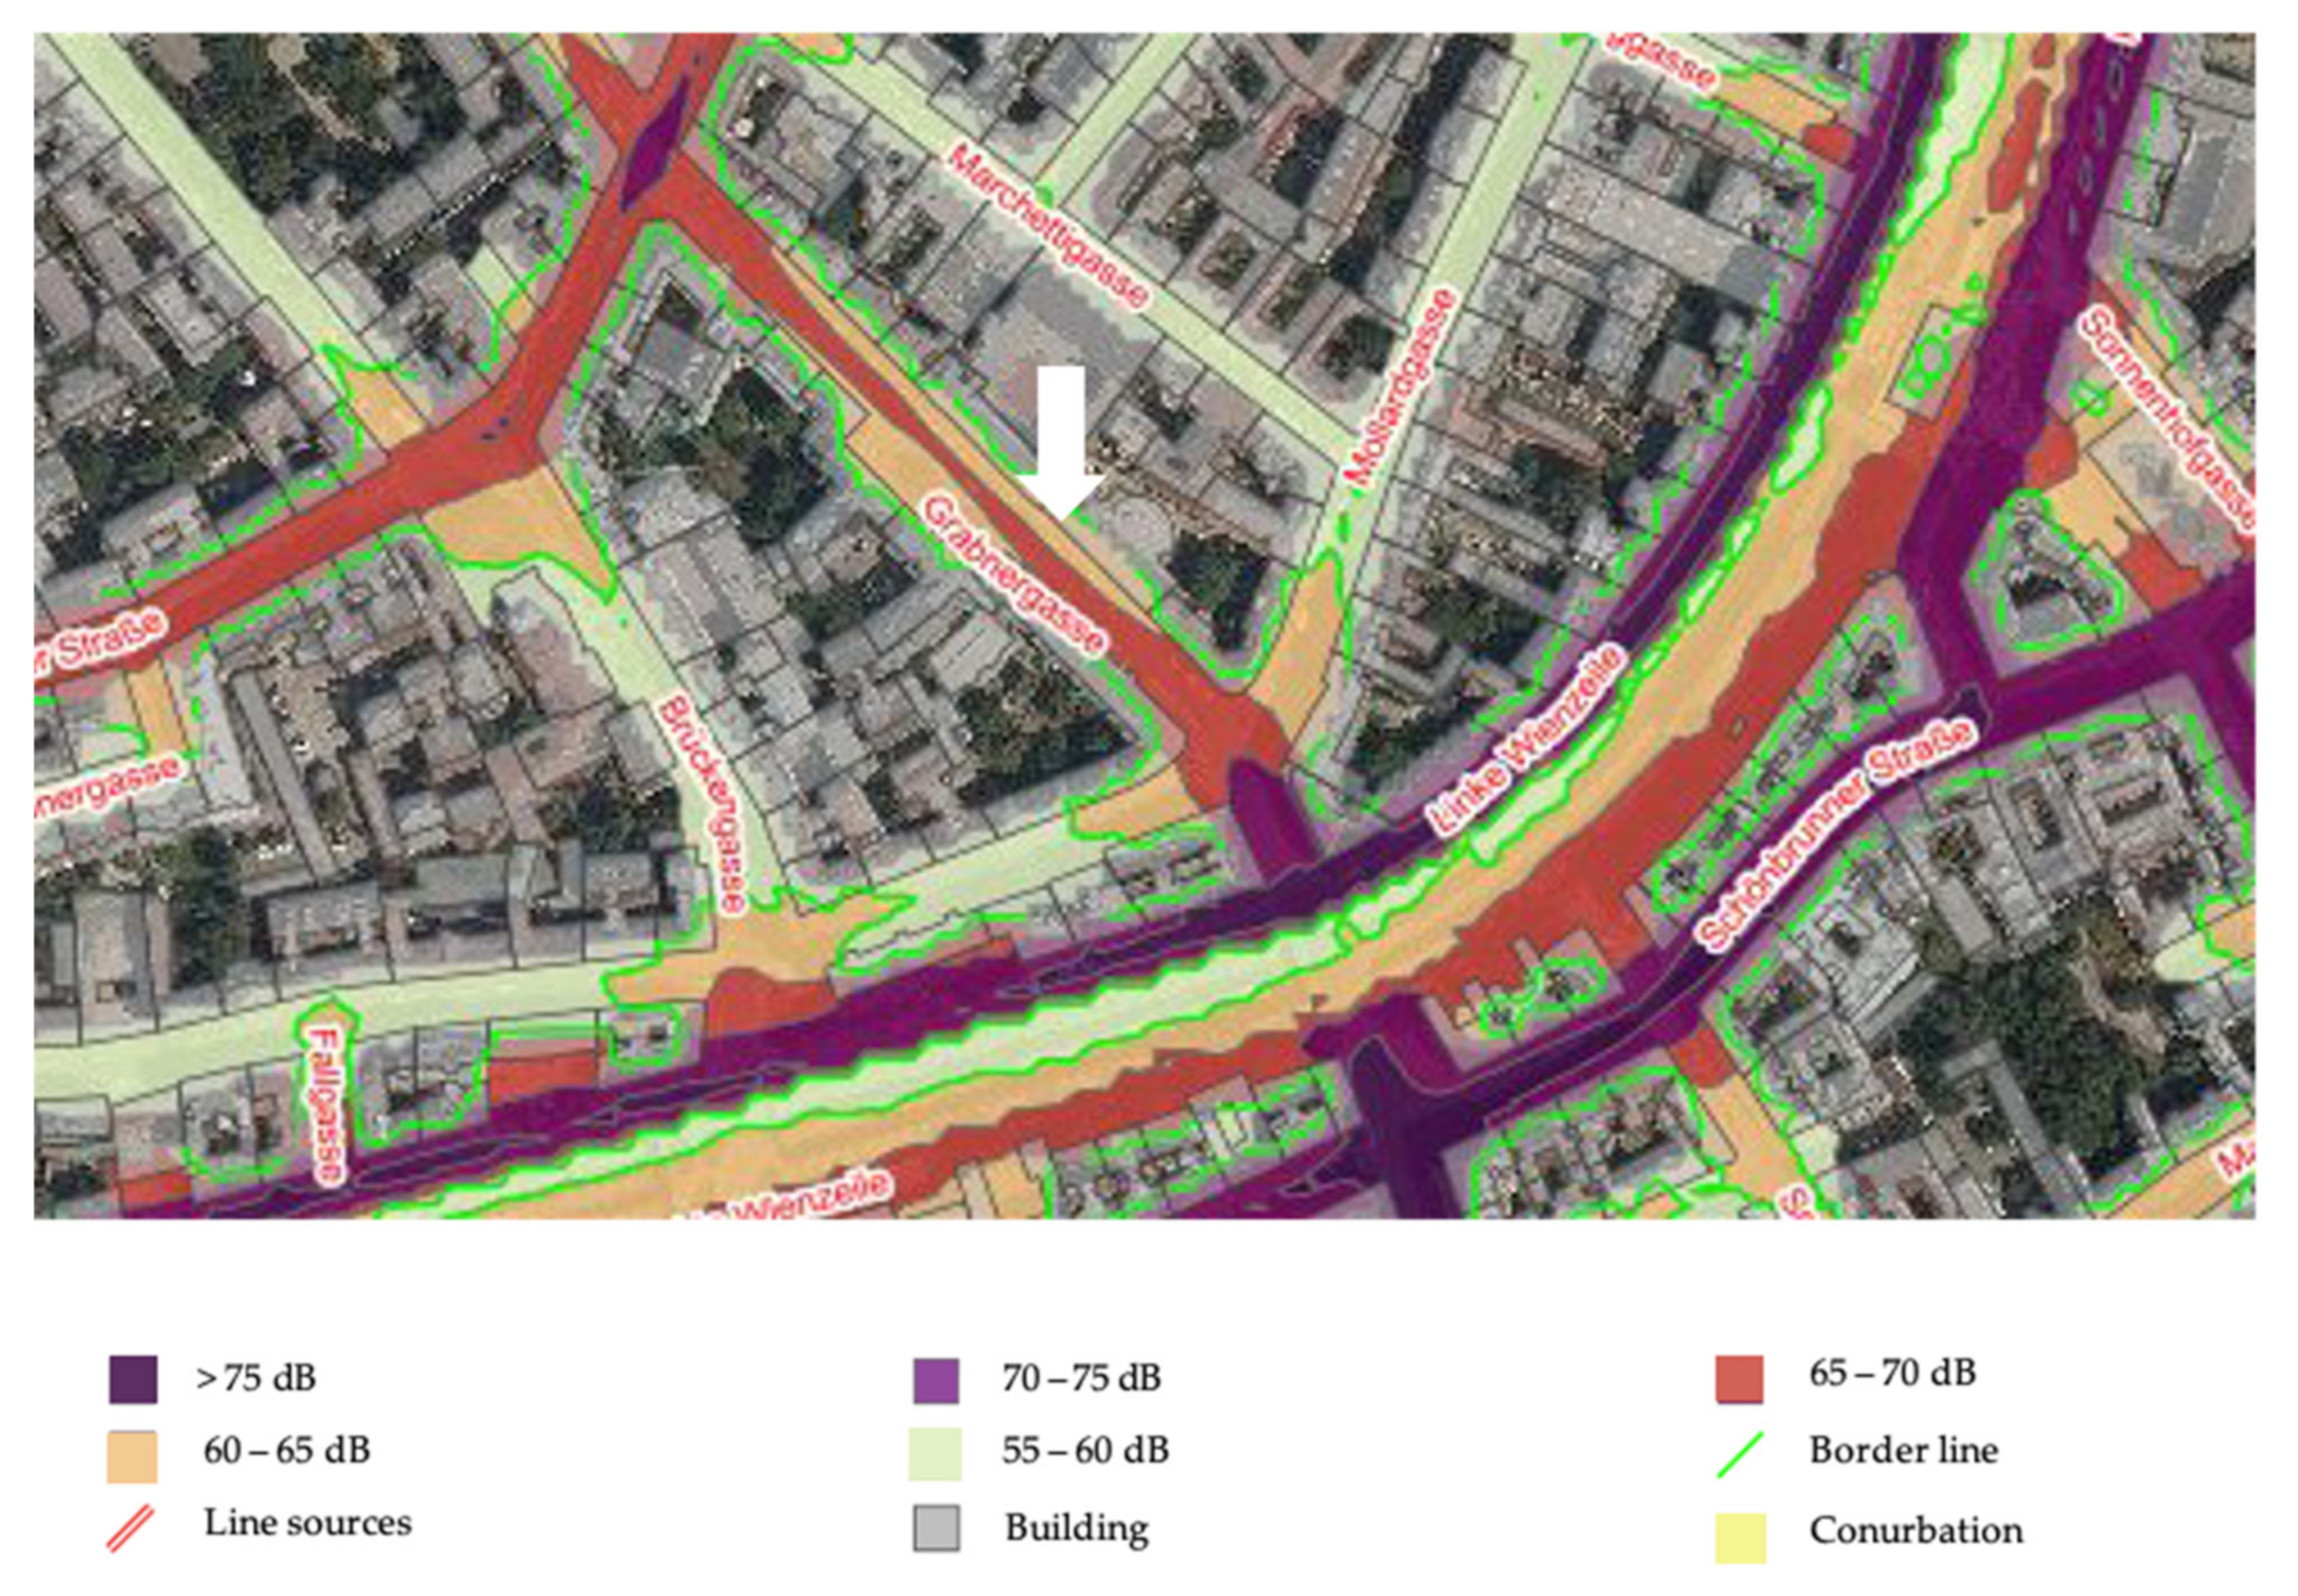
The considered office building of Vienna Water Municipal Department 31 was built in the 1960s and renovated in 2015 and is found in Vienna’s 6th District (Grabnergasse 4–6). As a part of the renovation, besides additional insulation of the facade with 16 cm of rock wool and replacement of the old windows with insulating windows, a vertical garden was installed on the southwest-facing exterior façade [
27]. This, as shown in
Figure 1 and
Figure 2, is façade-bound greenery with troughs and trellises. The trellises for the plants are arranged perpendicular to the façade, so that they have a different shading effect depending on the position of the sun, without impairing the free view through the windows. Troughs with a length of about 3.3 m were installed in front of two windows, offset by one floor. In front of the two windows, which are each located between two troughs, slats are installed for shading. This creates an even overall appearance on the facade. The water supply for the greenery is ensured by an appropriately installed irrigation system.
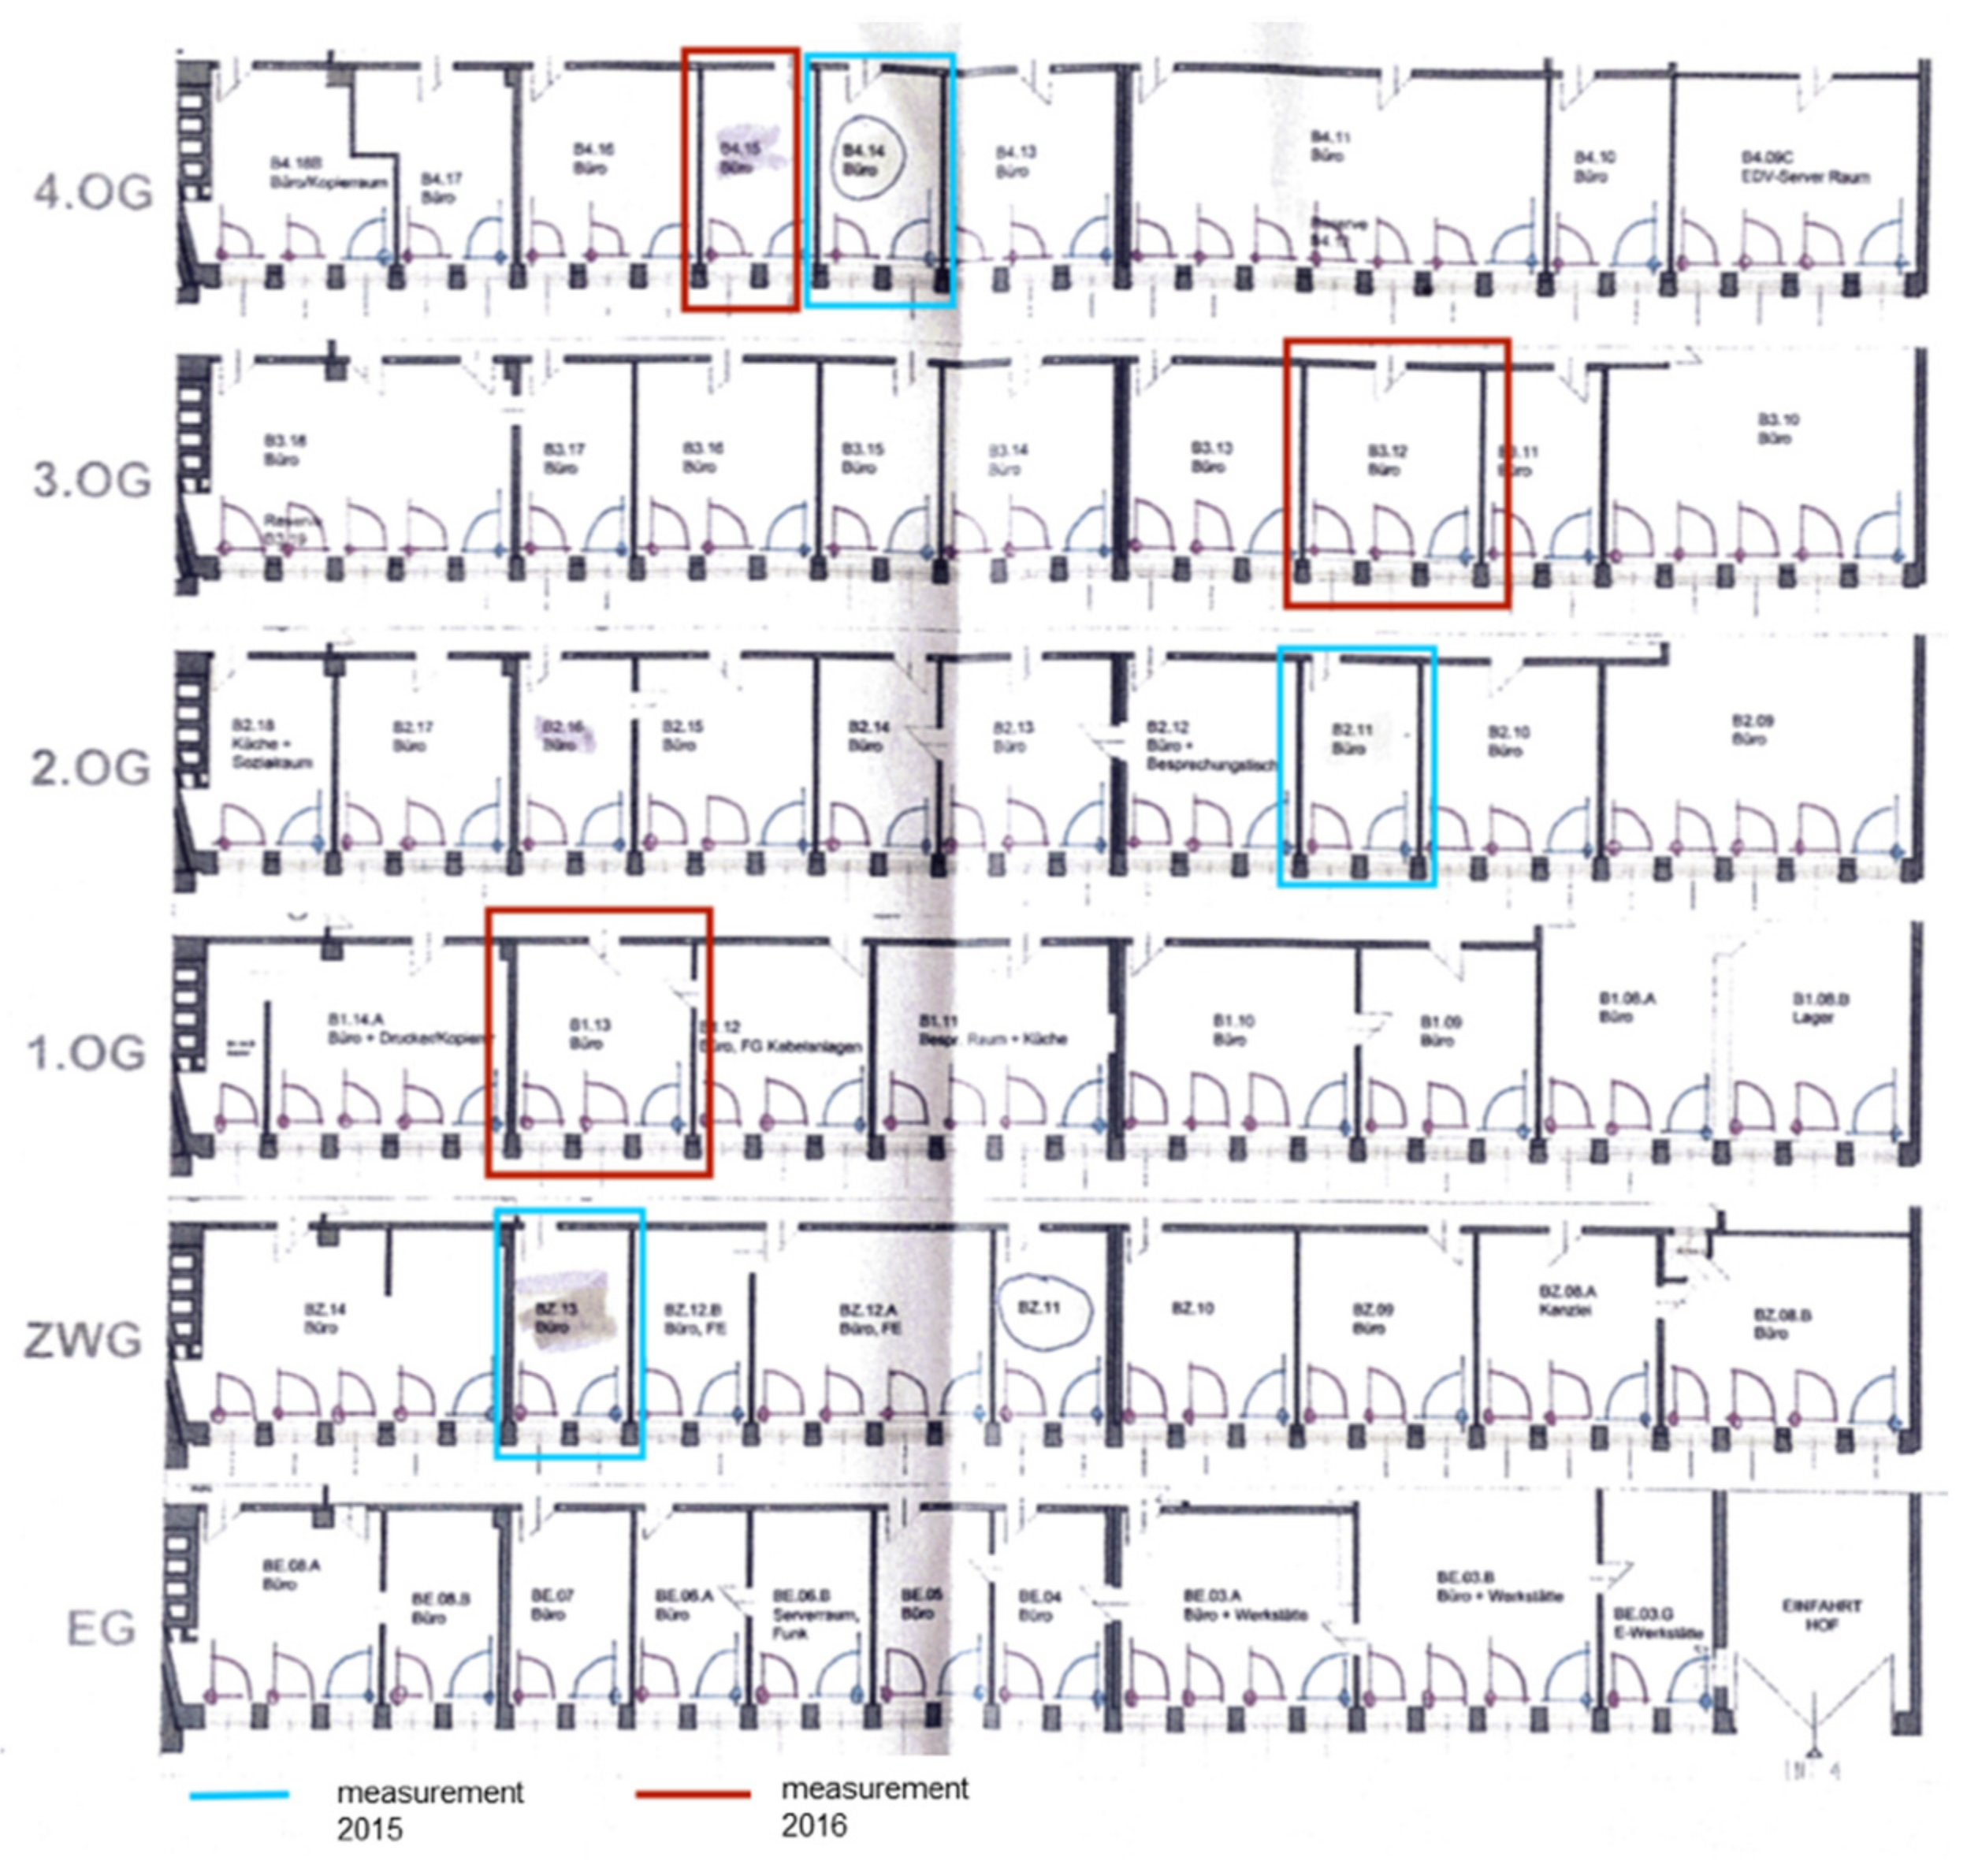
In the summer of 2016, measurements were carried out to determine the thermal comfort in three representative rooms and accordingly examined in more detail: B 1.13, B 3.12, and B 4.15 (
Figure 3). All three rooms are located on the street side (southwest facing) of the building, on which the façade greening has been installed.
The rooms on the different floors were selected with the aim of investigating the different irradiation at different heights of the building, which is particularly influenced by the shading from the opposite buildings. All rooms have a height of approximately 2.95 m. The floor covering in all rooms is a light gray PVC floor. The walls are painted white. In all office rooms there is a possibility of individual shading via internal blinds.
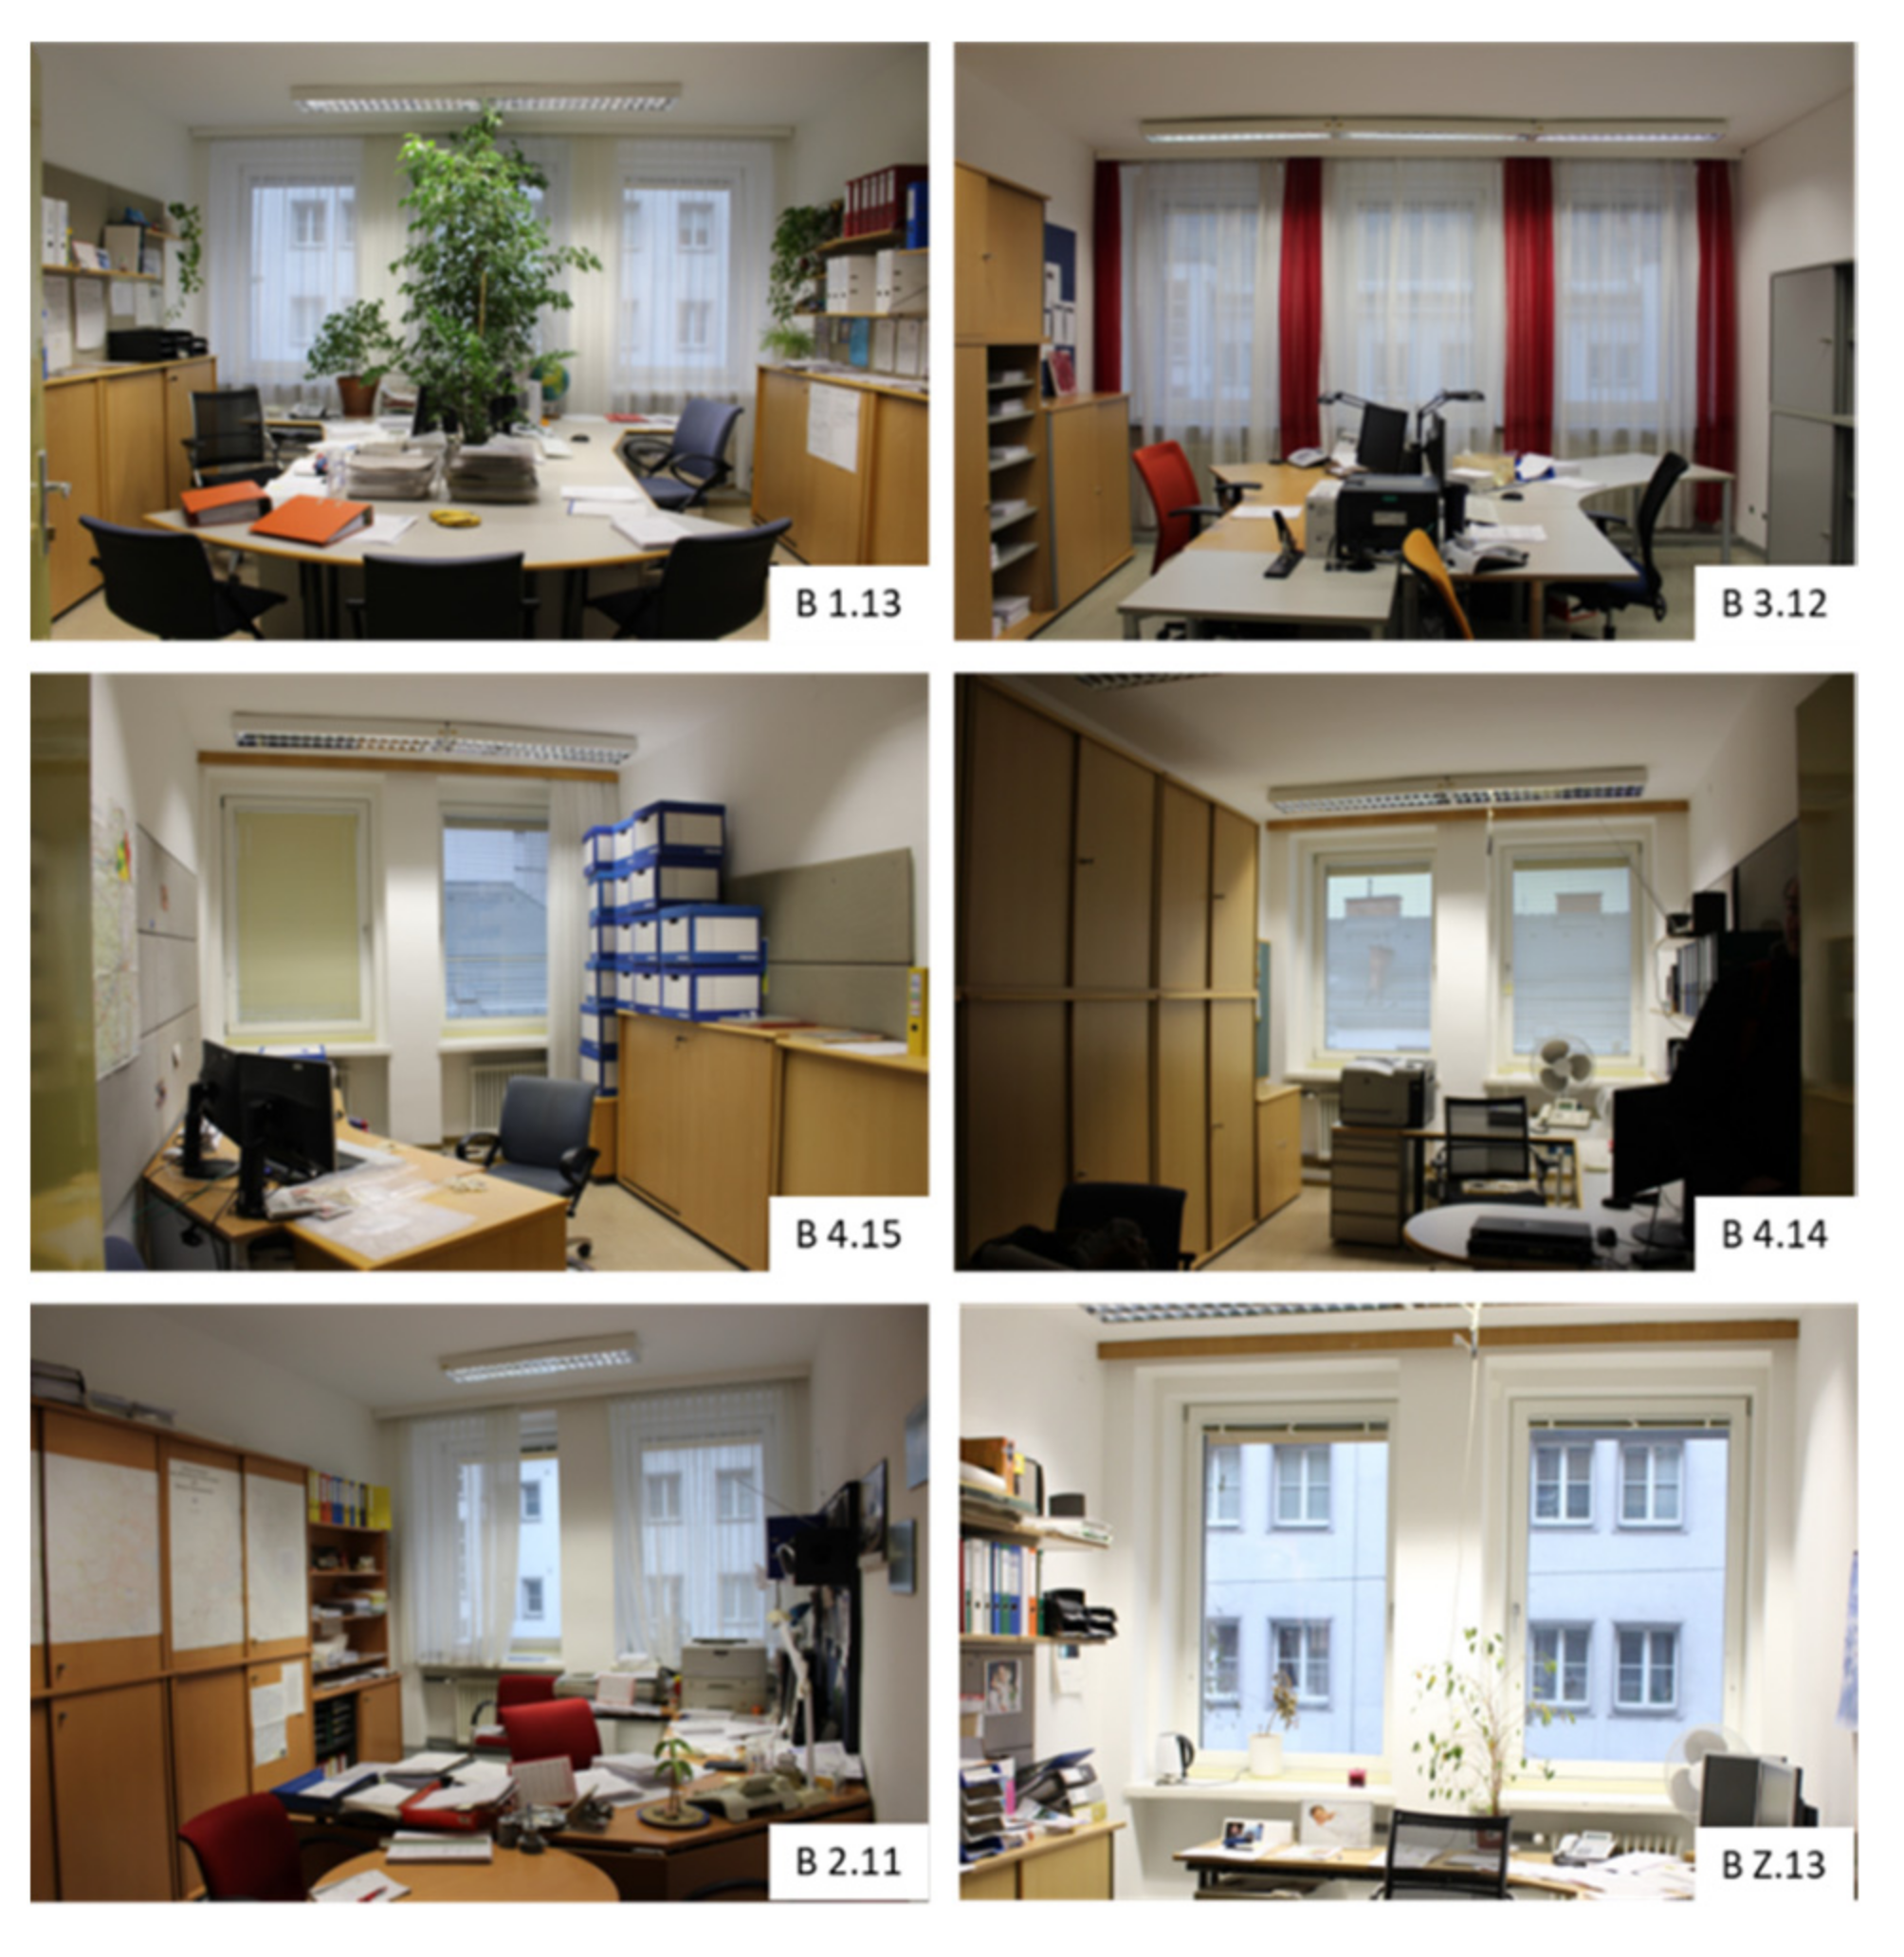
Office room B 1.13 (
Figure 4) is located on the second floor. It has three windows and two doors, one of which leads to the corridor and another to the adjacent office. The room, which is 5.25 m long and 4.75 m wide, contains two workstations, each with a computer. There are thin white curtains in front of the windows for privacy and glare protection. Particularly striking are the numerous large houseplants on the desk and shelves.
On the third floor, office room B 3.12 (
Figure 4) also has three windows facing the street (southwest facing), but only one door leading to the corridor. This room also has thin white curtains in front of the windows. There are two simply furnished workstations with computers in the room. The room is 5.25 m long and 4.75 m wide.
Room B 4.15 (
Figure 4), located on the fourth floor, with a width of 3.05 m and a length of 5.25 m, is significantly smaller than the other two rooms considered. However, there is also only one workstation in the room. There are two windows facing (southwest) the street and a door to the corridor. The blinds are almost always closed due to glare from sunlight. During both the summer of 2015 and the summer of 2016, indoor climate measurements were conducted in three identical rooms: B Z.13, B 2.11, and B 4.14 (
Figure 4). These are also all located on the street side of the building and are similar to the rooms with the thermal comfort measurements performed in summer 2016.
The office room B Z.13 is located directly below the room B 1.13 examined in 2016, but with a width of 3.10 m it is significantly smaller and has only two windows on the southwest side (facing the street) and a door to the corridor. There is one workstation in this room. Room B 2.11 on the second floor has the same geometry as B Z.13, but a slightly different layout. This office room is located directly below B 3.12.
On the fourth floor, room B 4.14 is located directly next to room B 4.15, which was examined in summer 2016 regarding thermal comfort. As with B 4.15, B 4.14 has two windows on the street side and a door facing the corridor but is slightly smaller in terms of floor space with the same length and a width of 3.05 m. An additional fan on the desk can already be seen.
2.2. Execution of the Measurements
The method described in DIN EN 7730 and applied in this work is based on consideration of the thermal equilibrium of the human body, taking into account environmental conditions such as air temperature, radiation temperature, air humidity, and air velocity, as well as personal factors such as clothing and the activity performed by the persons. According to Fanger [
29], as shown in
Table 1, the thermal rating PMV is on a scale between the values −3 and +3. However, according to DIN EN ISO 7730, only values between −2 and +2 should be applied. In addition, limit values must also be observed for parameters such as energy conversion, clothing insulation, air temperature, mean radiant temperature, relative air velocity, and water vapor partial pressure. The equations for calculating the surface temperature of the clothing and the convective heat transfer coefficient were solved iteratively as a function of each other.
The effect of air temperature on the PMV is unambiguously linear, allowing the change to be clearly predicted. Air velocity, on the other hand, can have a strong influence on the change in PMV even with minimal change, and this relationship is non-linear and consequently more difficult to evaluate. It is therefore important to ensure that this sensitive parameter is determined precisely. In particular, drafts can strongly influence the perceived comfort [
30].
The PPD considers the fact that thermal comfort is not a purely objective variable, but that it can be subjectively assessed in different ways. In addition to the consideration of the heat balance of the human body for the assessment of thermal comfort, drafts or vertical temperature differences can also cause local discomfort, which should be considered. In this work, the focus is on the determination of the PMV by means of heat balance. A detailed consideration of the radiation asymmetry as well as the draught phenomena was therefore not carried out, but this could provide more detailed information about the thermal comfort in further investigations. Furthermore, factors such as noise, lighting and air quality can also influence the subjective evaluation of thermal comfort, which will be explained in
Section 4.2.
In order to meet the requirements for the indoor climate in workrooms according to Section 28 of the Workplace Ordinance, an air temperature between 19 and 25 °C must be maintained. Office activities are classified as low physical effort. The air velocity should not exceed 0.10 m/s [
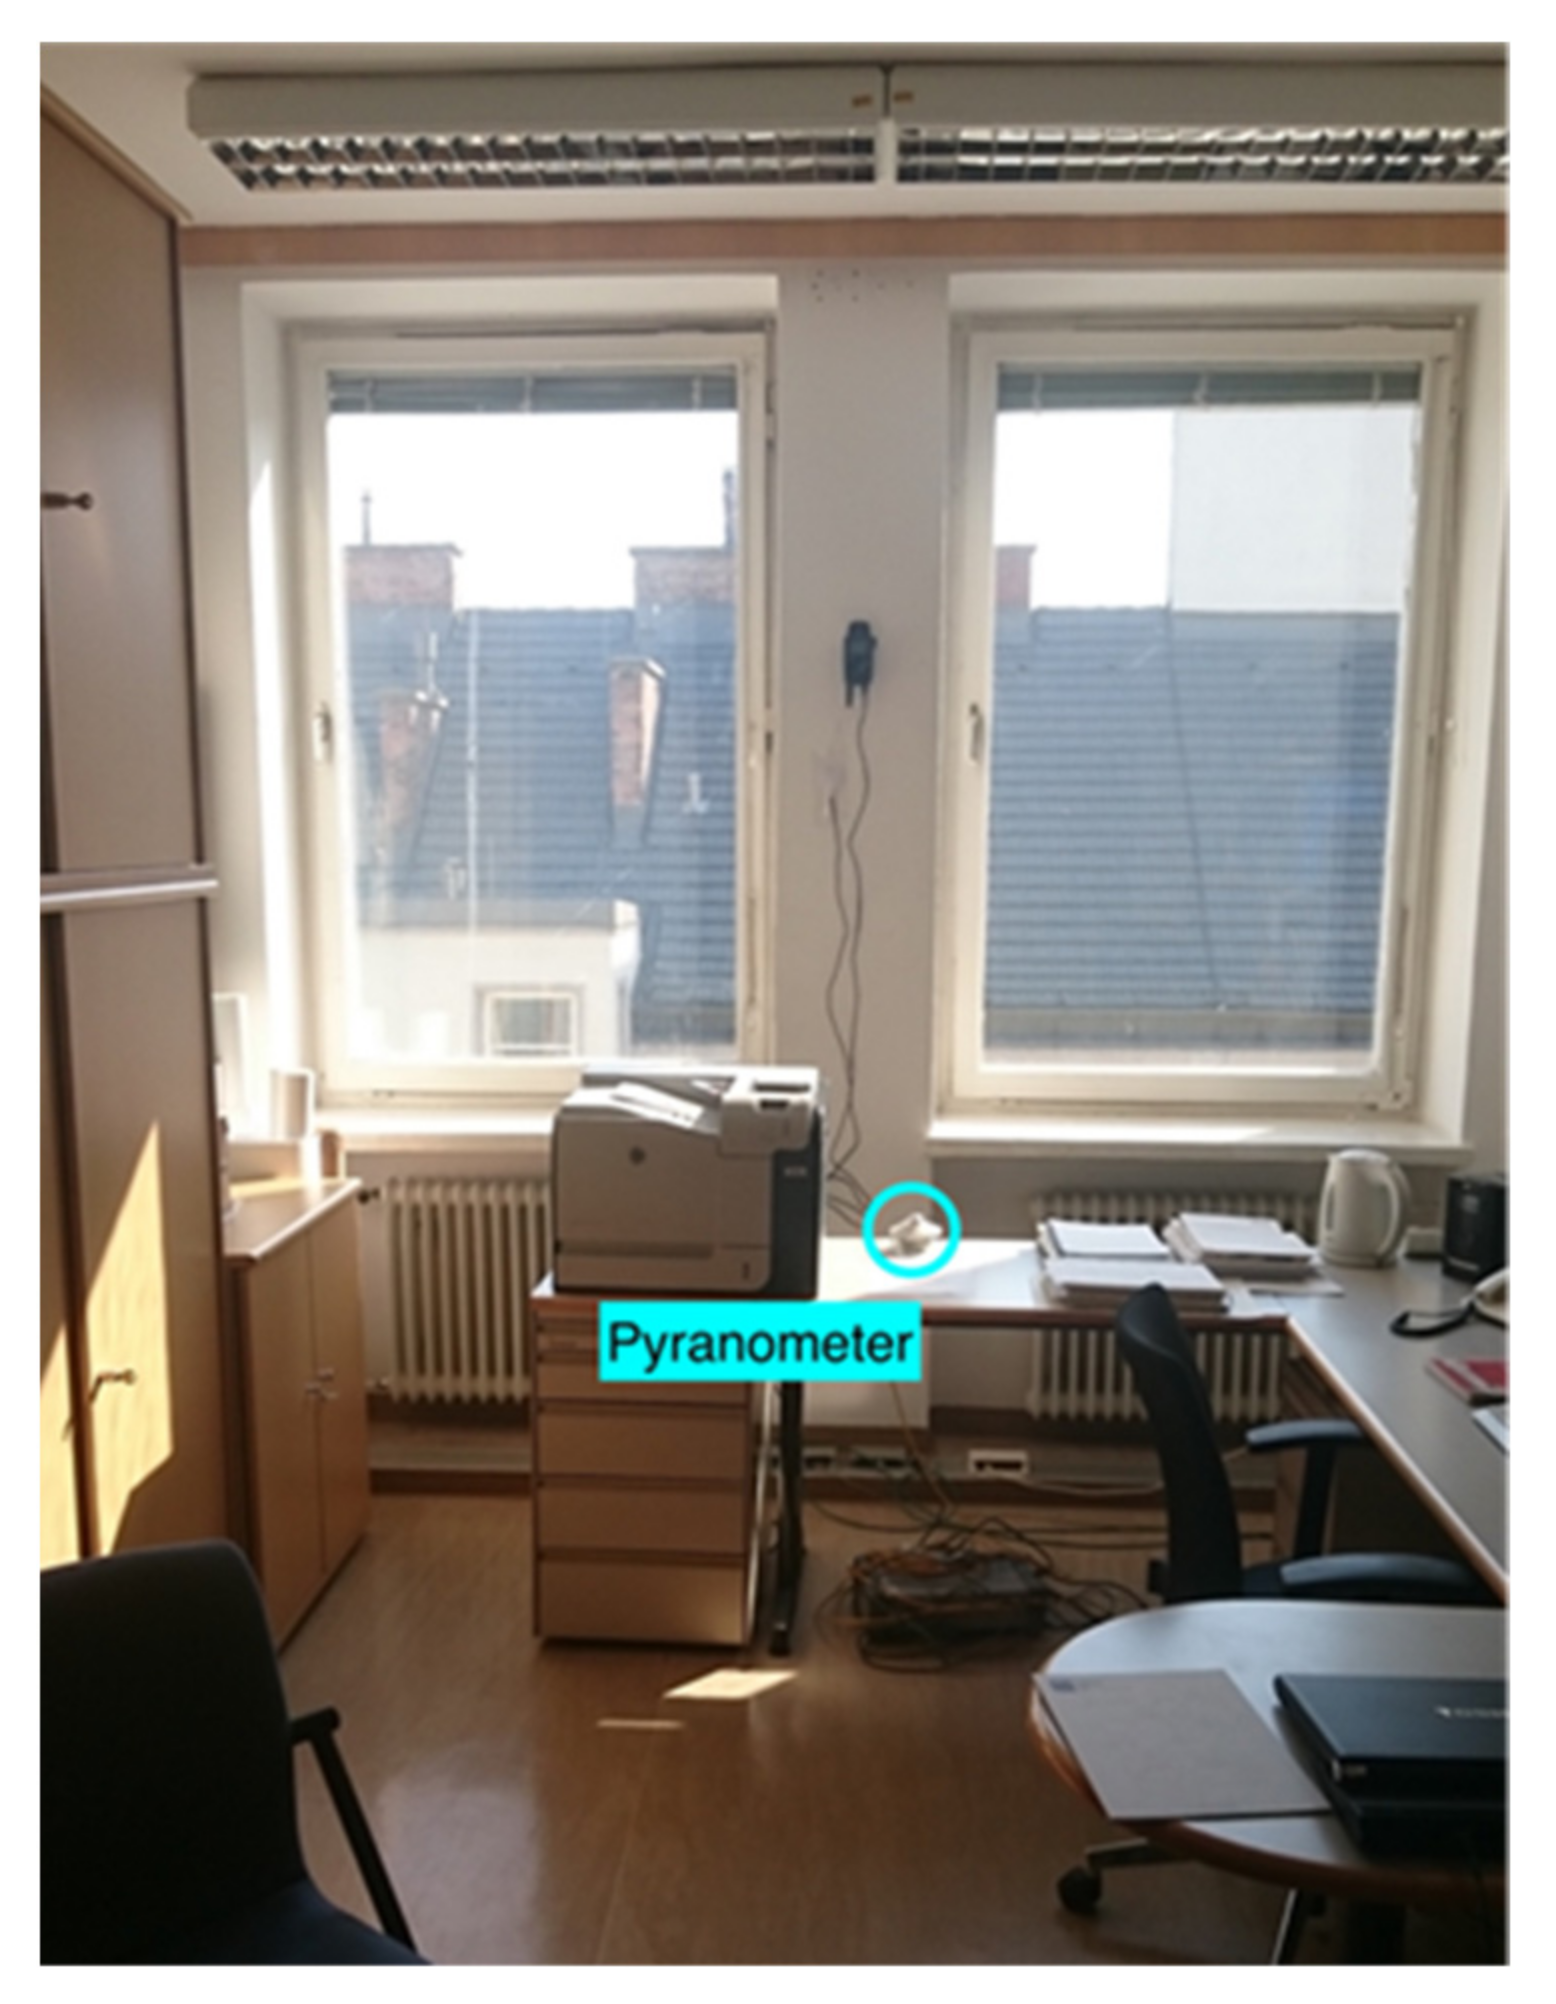
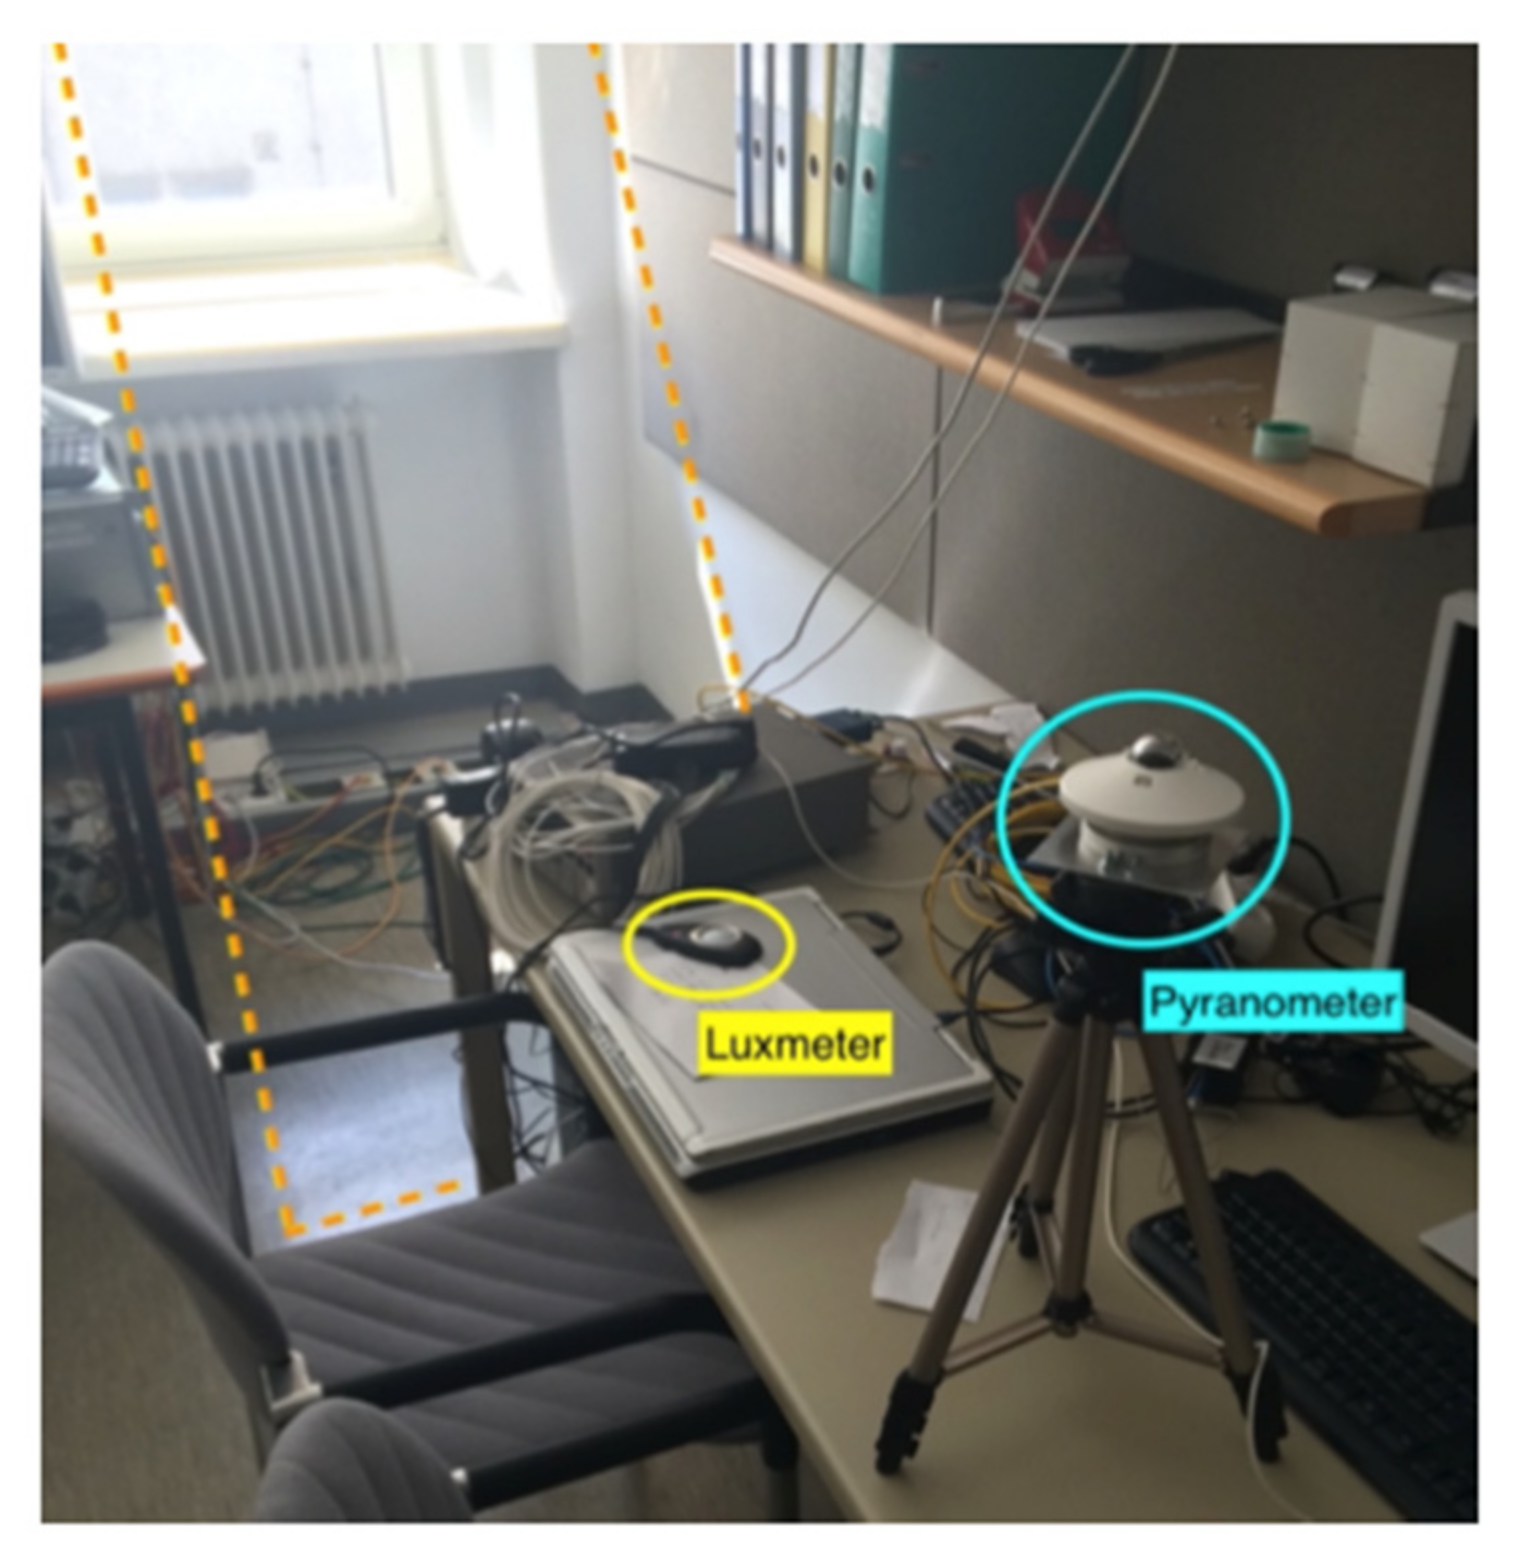
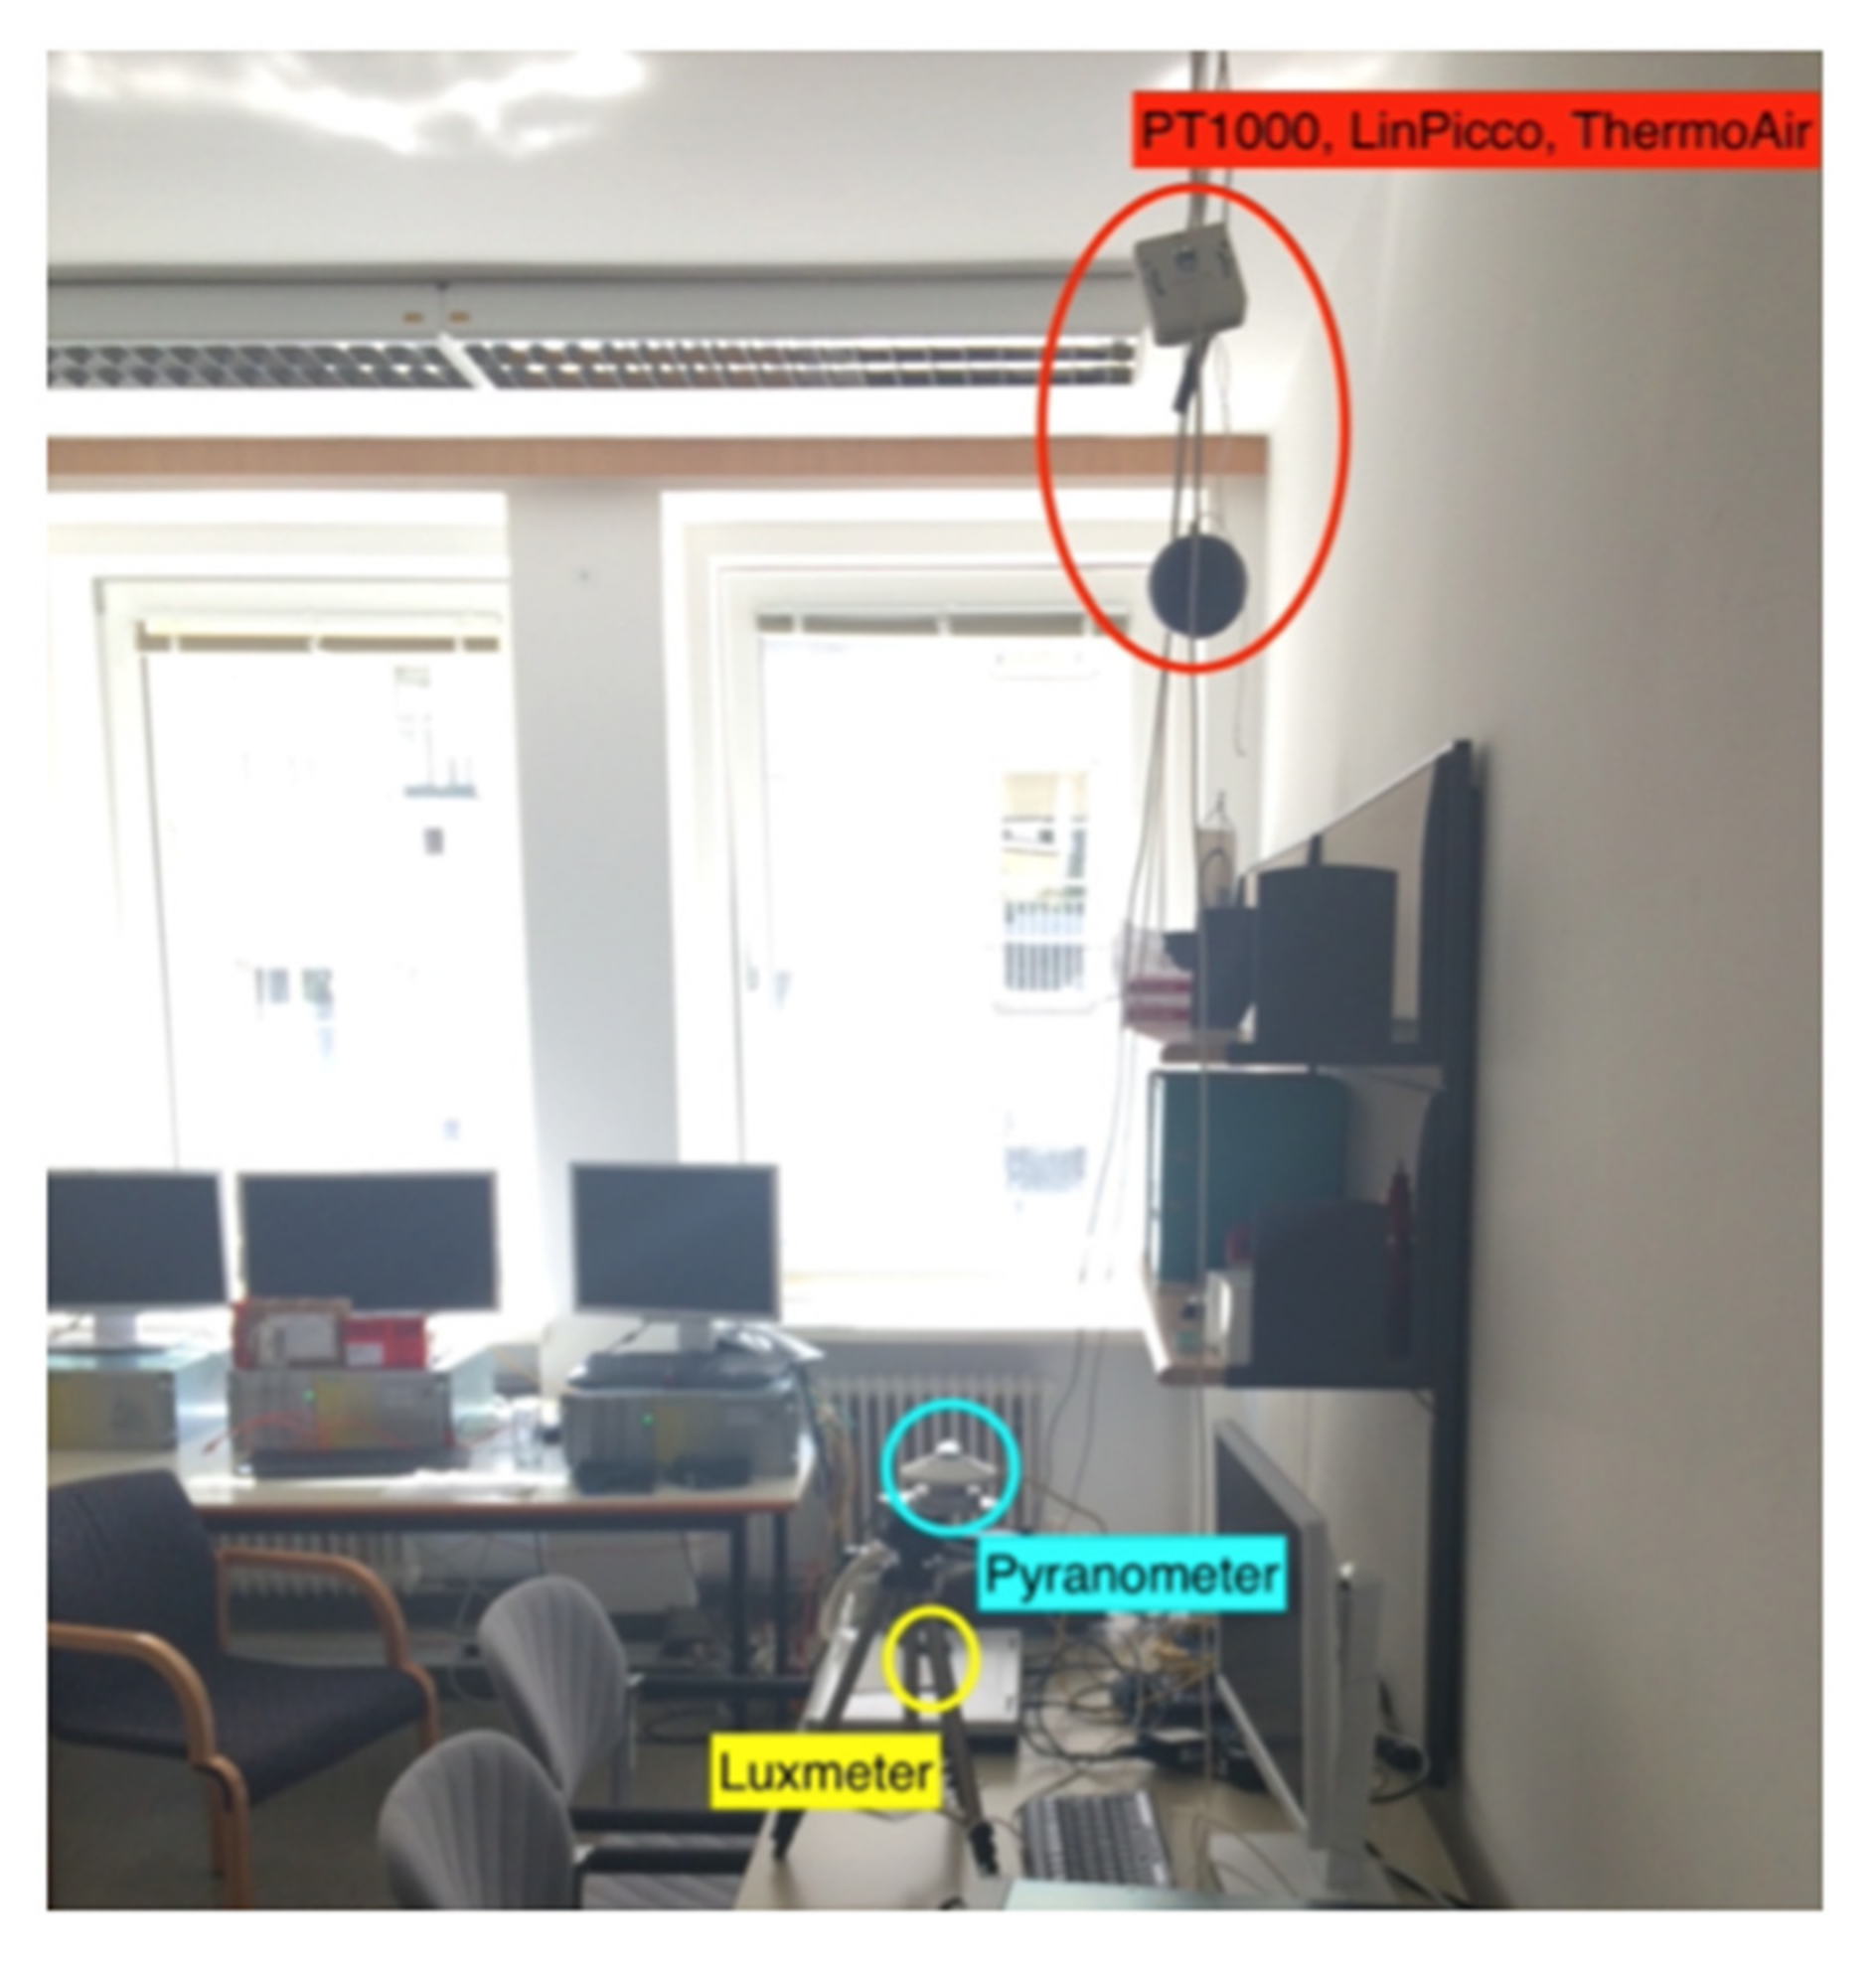
26]. For better comparability, the measurements to determine thermal comfort in the summer of 2016 were carried out as described in office spaces similar to those in which the measurements were also made before the refurbishment. All of these measurements were carried out between 28 July and 17 August 2016. According to the standard, no occupants were in the room at the time of the measurement so that the temperature and especially the air velocity could be measured unaffected by human activity. Doors and windows were closed at the time of measurement. It must be mentioned that due to the time of measurement, these are observations of the condition in summertime. Nevertheless, they can be used as a basis for comparison. The measuring devices were selected and calibrated to each other in accordance with DIN EN 7726. The interval between two measurements was 220 s. Here, the operative temperature was measured using a platinum temperature measuring element PT1000 with black ball. A pyranometer measured the radiation. CO
2 concentration was measured using a CO
2 sensor in ppm. Relative humidity and room air temperature measurements were carried out using a LinPicco sensor. A ThermoAir 6 sensor was used to measure the air velocity in m/s.
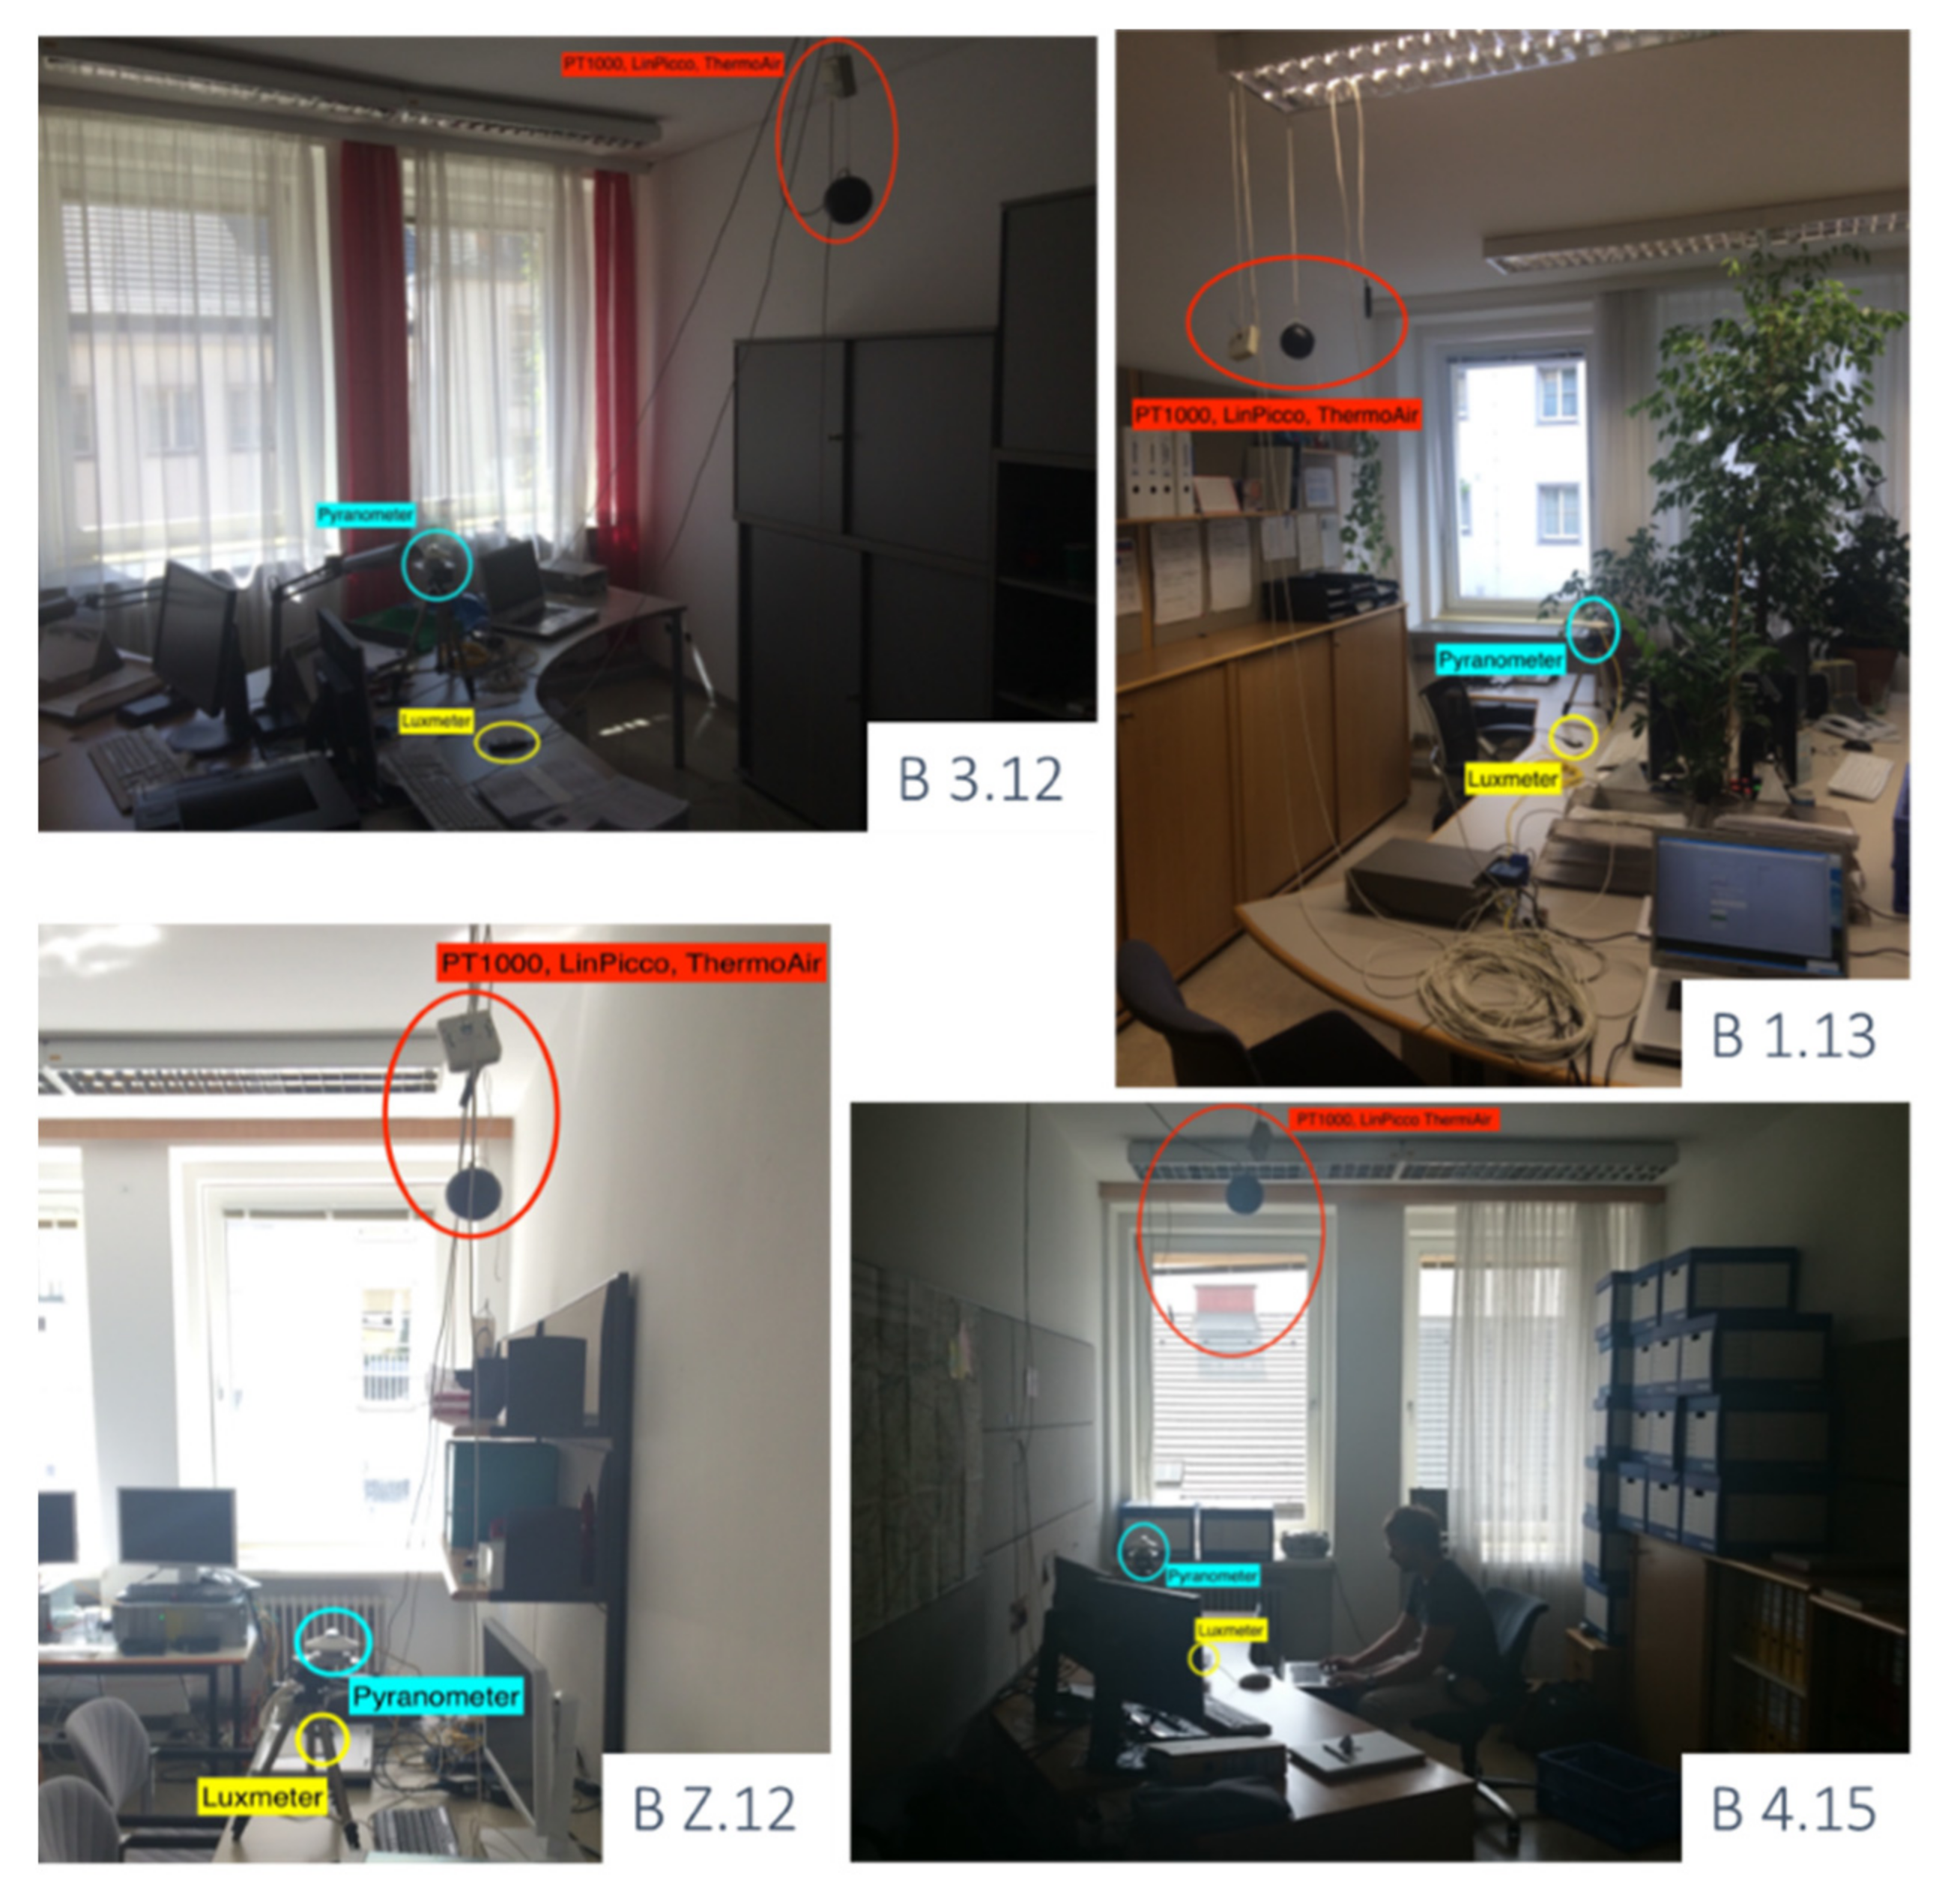
Table 2 shows the list of measuring devices used and their purpose. In accordance with the standard, these measuring devices were positioned at the workplace in each room. To check other possible influences on the comfort of the users in the room, a luxmeter was installed on the individual desks so that the lighting intensity was measured at the height of the actual workplace in accordance with the standard.
Figure 5 shows the set-up of measurement instruments in investigated rooms.
2.3. Conducting the Survey
The questionnaire was developed in agreement with the municipal department located in the building. In December 2016, the questionnaire was distributed to the 90 employees with the request to anonymously drop the completed questionnaire into a designated box within the next two weeks. The time allotted for answering the questions was 10–15 min.
3. Evaluation of the Measurements and Results
Measurement data from approximately 8 a.m. to 7 p.m., the period of a working day, were used for the evaluation. Over this period, the mean value was calculated free of outliers. The measured data of the air velocity were adjusted for a non-plausible outlier value.
Using meteorological data from the measuring station at Hohe Warte Vienna of the Central Institute for Meteorology and Geodynamics (ZAMG) for the period July and August 2016, it could be determined that the measuring days did not include the hottest days of 2016 for the Vienna site. Even though the Hohe Warte measurement station is not located at the site of the building under study, this data can be used as a benchmark. Nevertheless, the data measured at the respective office building may be considered representative, since the difference in air temperatures in the daily mean between the measurement day and the maximum value is small.
If only the hours from 12 o’clock onwards, in which the air temperature increased significantly compared to the cooler morning, are taken into consideration for a variation of the investigation, the result for the PMV is as expected, slightly higher than the result calculated based on the mean value over the entire working day. However, since the air temperature alone does not determine the PMV, the deviation is to be classified as small.
3.1. Evaluation of the Current Situation Based on the Measurements
The evaluation of the thermal comfort from the measured data was carried out for the three office rooms in each case as described using PMV and PPD.
For comparability of the calculations and the best possible representation of reality, it was assumed for all rooms that each occupant of the room wears underwear, a shirt, trousers, socks, and shoes in summer. This results in a clothing insulation of 0.11 m2K/W or a clothing area factor of 1.12 clo. The effective mechanical power was assumed to be M = 0 W/m2 in accordance with DIN EN ISO 7730 Appendix D. For seated activities, the energy conversion is W = 70 W/m2 according to DIN EN ISO 8996.
3.1.1. Office B1.13
Comfort measurements were carried out for the office room on the second floor on August 17th and 18th 2016. This day can be classified as a mild summer day with a maximum daily outdoor temperature of 23.8 °C measured at Hohe Warte [
31].
The calculation of the PMV results in a heat rating of 0.20 on both measurement days, which is considered ‘neutral’. This results in a PPD of 5.8%. The measured daily average indoor air temperature is 25.2 °C for both days. Summary of the measurement data is presented in
Table 3.
3.1.2. Office B3.12
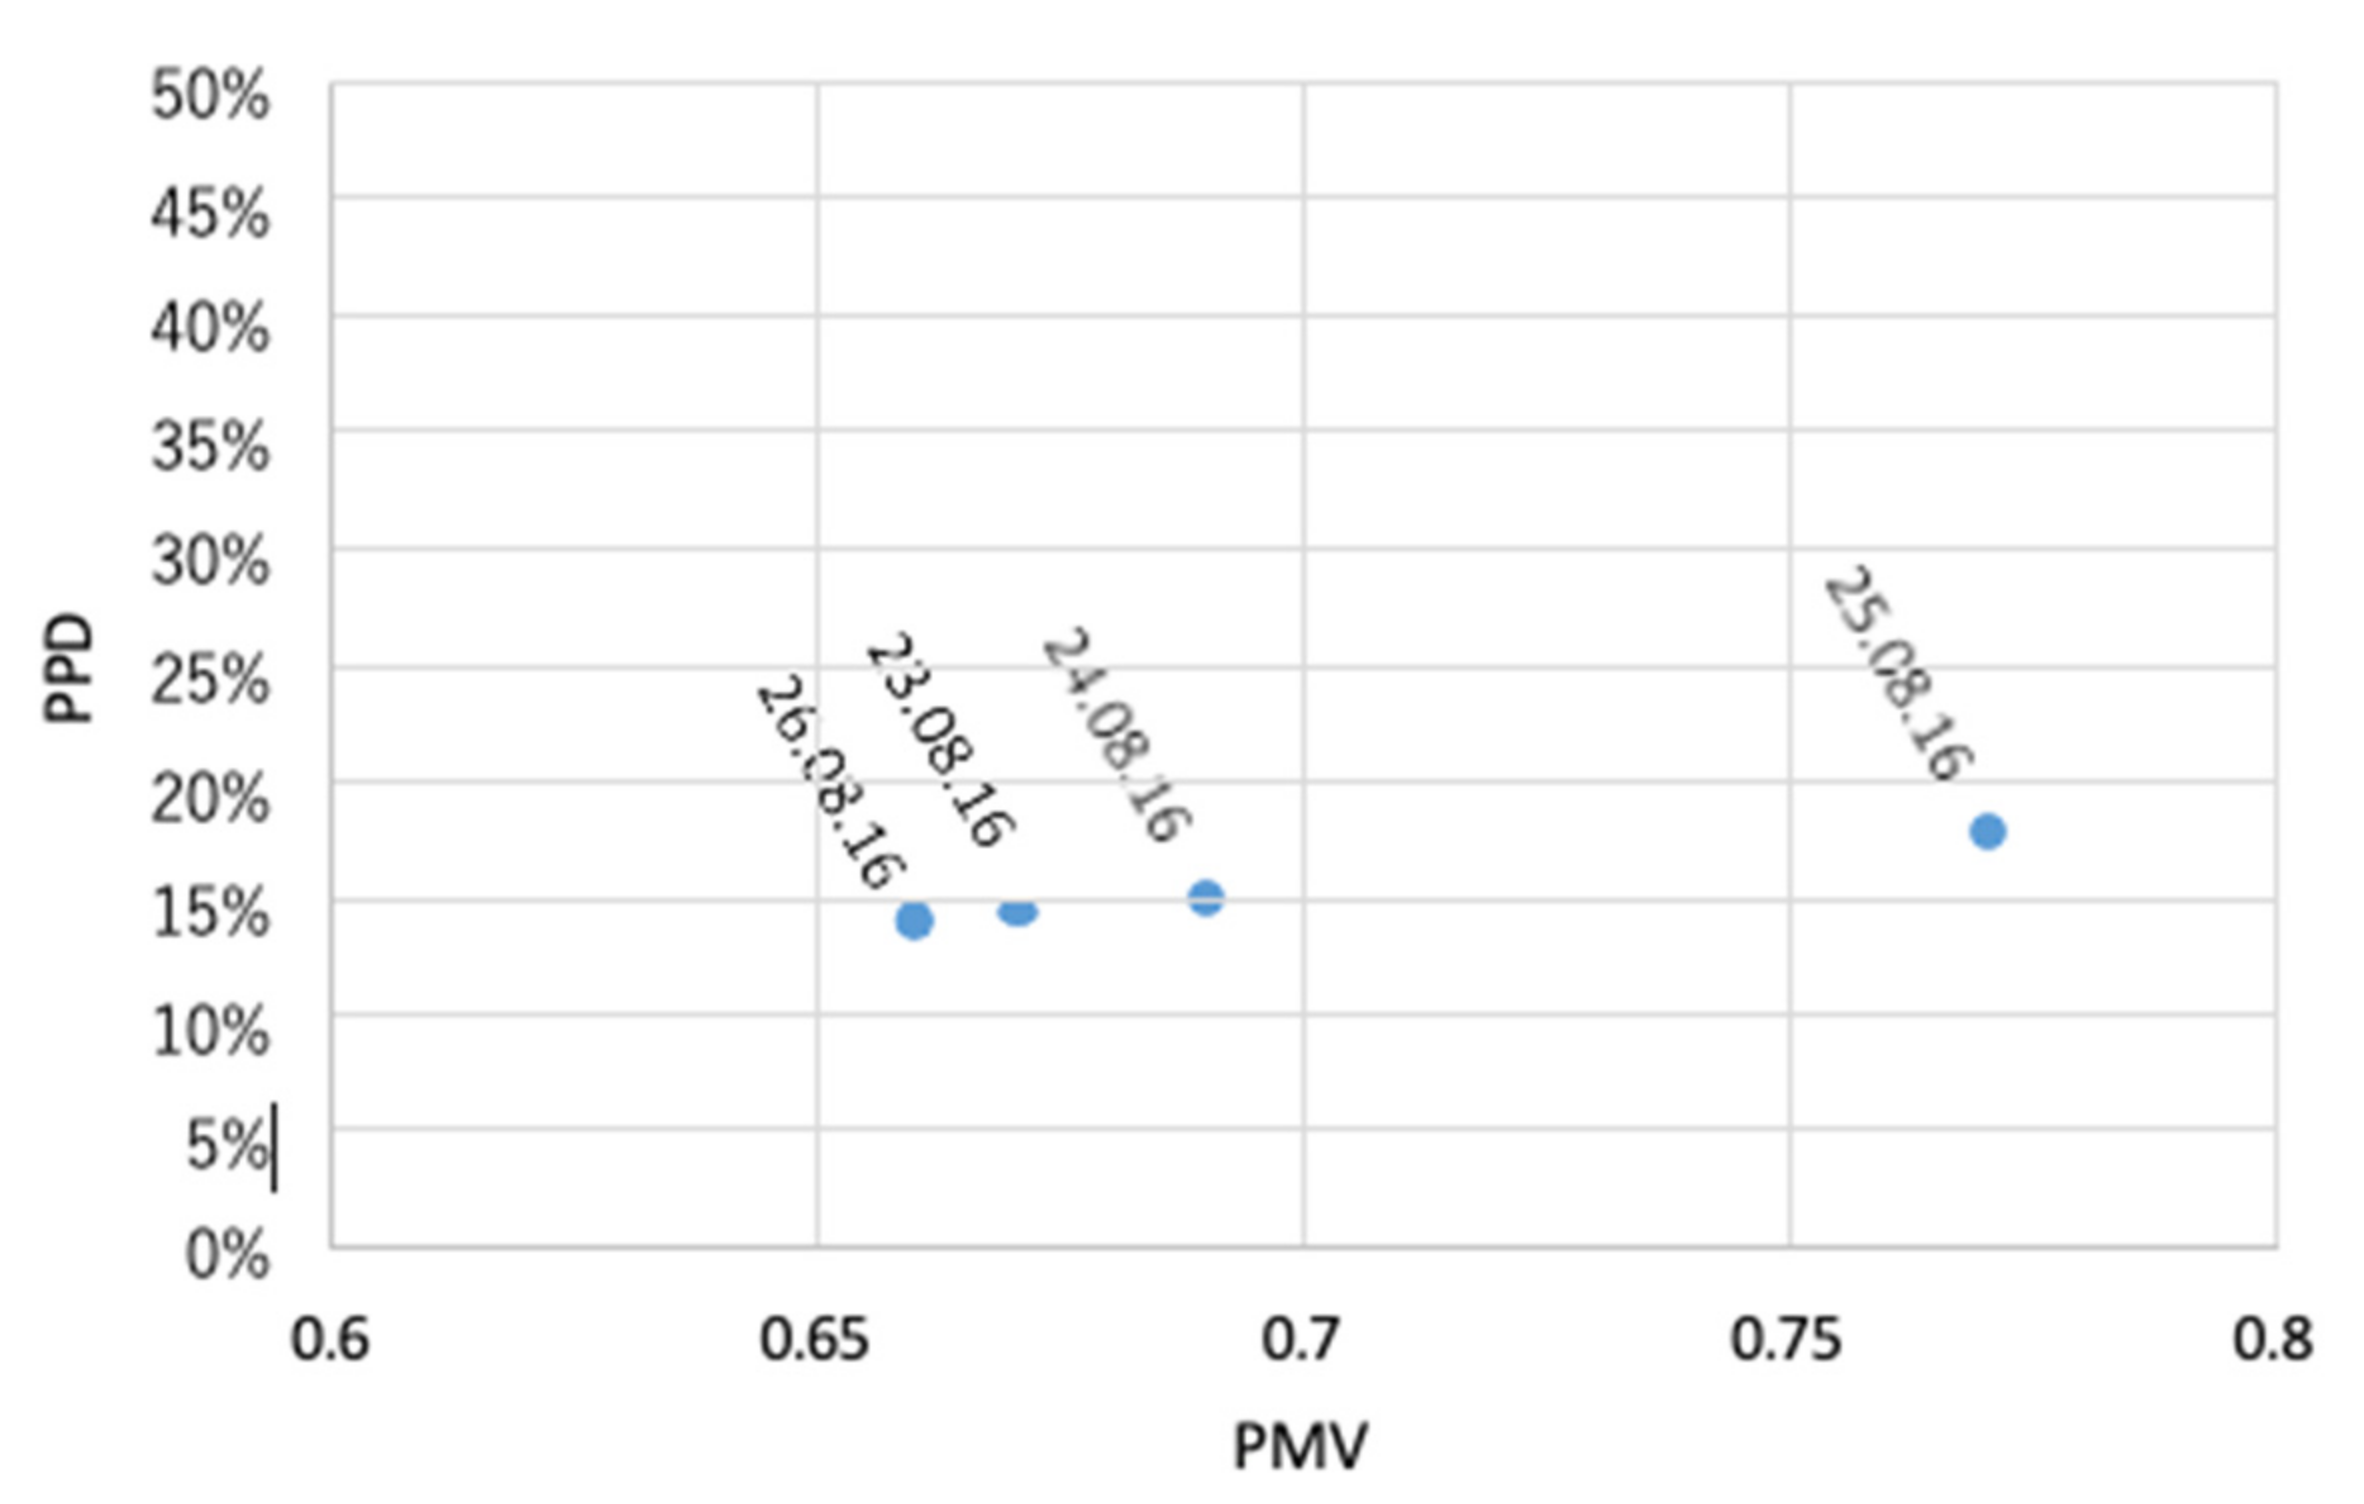
The measurements in office room B 3.12 on the third floor were carried out from 23rd to 26th August. The daily maximum of the outside air temperature measured at Hohe Warte was around 27 °C on each of these days [
31]. The measured air temperature and the operative temperature in the office room were between 27 and 28 °C on a daily average, on each of the considered days. For the relative humidity, values between 40 and 42% were measured on all four days. Due to these very similar conditions, the PMV is always around a value of 0.7 on the four days, resulting in the heat rating ‘slightly warm’ when rounded up. According to the standard, the percentage of those dissatisfied with these conditions is therefore around 15%. The summary of the measurement data for room B 3.12 is presented in
Table 4.
Figure 6 depicts the relationship between PMV and PPD for B 3.12 for the period 23–26 August 2016.
3.1.3. Office B4.15
Measurements were carried out in the office room on the fourth floor B 4.15 over a period of three weeks (28 July to 17 August 2016). The weather on these days, especially at the end of July and in the first days of August, was very hot [
31,
32].
On some days, the measured indoor air temperature is outside the limit of 30 °C given in the DIN EN ISO 7730 standard for the calculation using this method. Nevertheless, the calculations can be used as a reference due to the small excess.
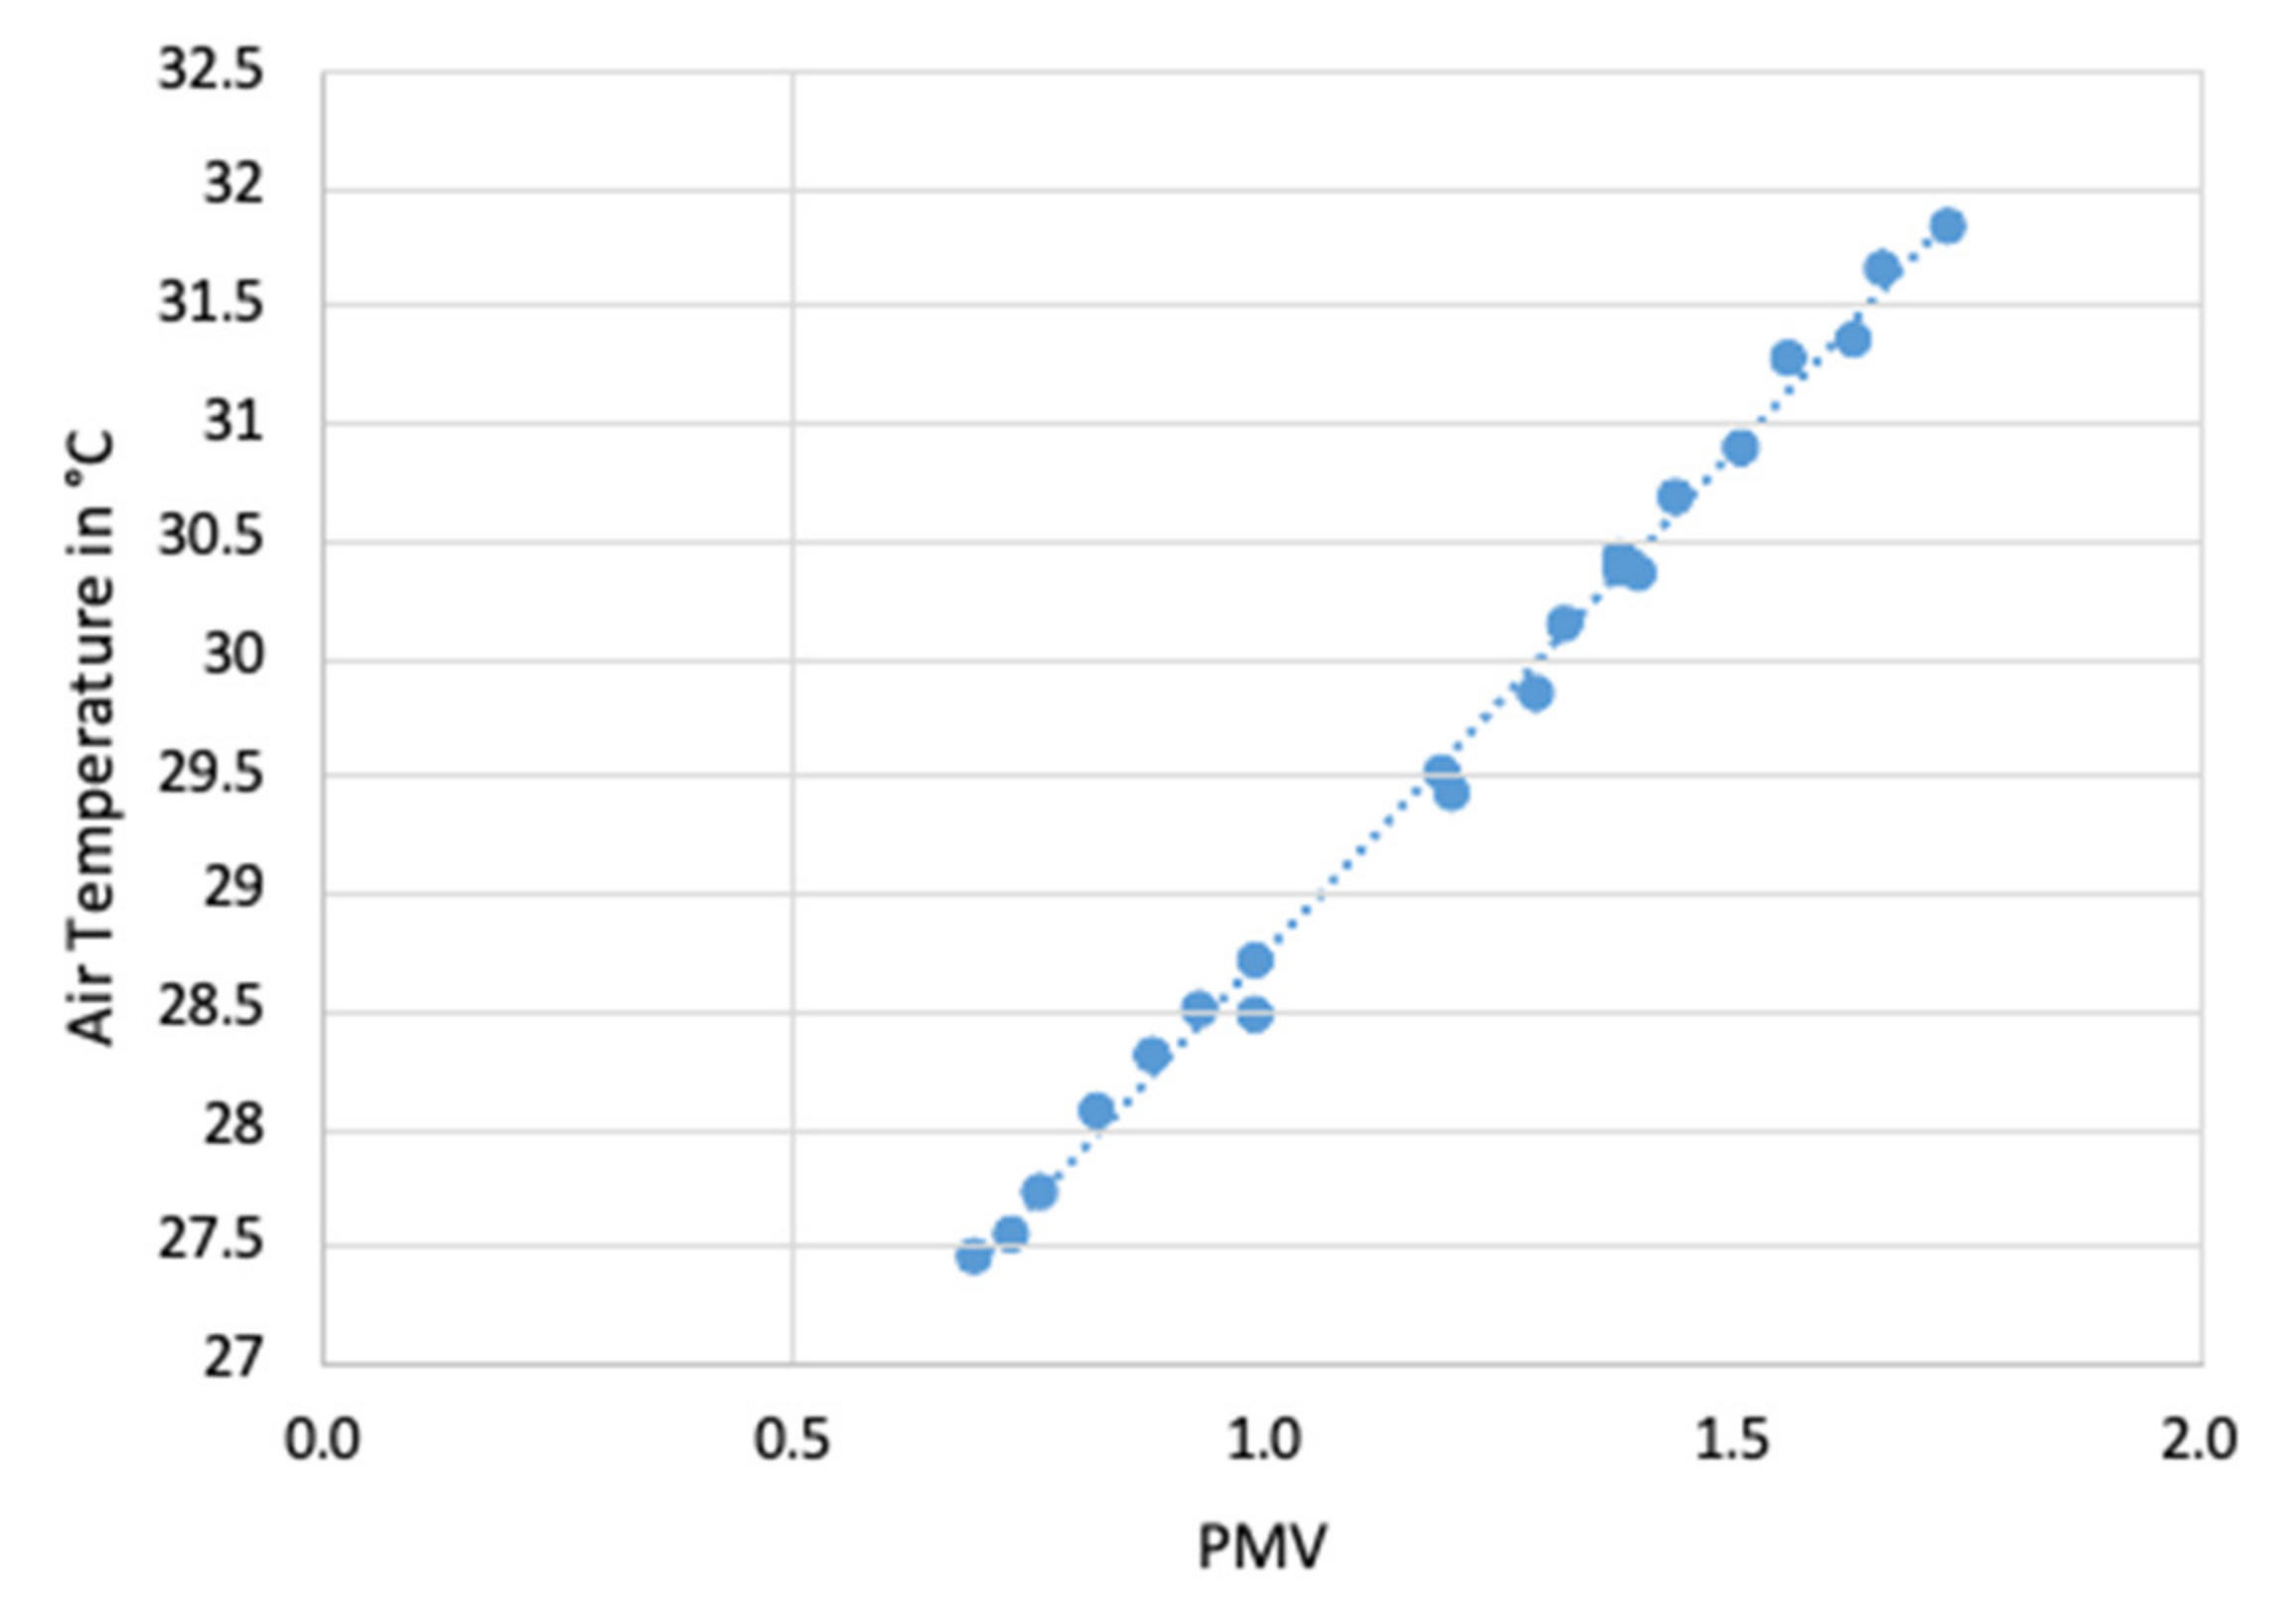
The linear relationship between air temperature and PMV can clearly be seen in
Figure 7. For example, the predicted mean vote on the days with very high air temperatures, such as on 30 or 31 July 2016, with a daily mean of almost 32 °C, is 1.7, which corresponds to an assessment of ‘warm’. According to the calculation, around 60%, i.e., more than half of the people, are dissatisfied with these conditions.
3.2. Comparison before and after Building Renovation Based on Measurements
In 2015, measurements of air temperature, operative temperature, and relative humidity were carried out in the indoor spaces prior to the building renovation. Since no measured data are available for the relative air velocity, a velocity of 0.05 m/s is assumed for all measurement days and rooms when calculating the PMV. This value is higher than the values measured in 2016 because it is assumed that the old windows were significantly less tight. A variant assuming an air velocity of 0.03 m/s results in a difference in the calculated PMV of only 0.02. The fact that this is an assumption must be considered in the evaluation, especially since the air velocity is a sensitive parameter in the calculation.
The measurements were carried out in three rooms, which are all located on the street side of the building. In addition to rooms B Z.13 and B 2.11, in which no measurements were carried out in 2016 to determine thermal comfort, measurement data are available for office room B 4.14. This room is located on the fourth floor directly next to room B 4.15, which was also investigated in 2016 and has the same size as this room. The other rooms will not be considered further below due to a lack of comparison possibilities.
The weather during the period of the measurements, 17–19 July 2015, was very hot with outdoor temperatures during the day of up to 37 °C [
33]. In 2016, the measurements in room B 4.15 were also carried out on the warmest days, which allows a comparison of the two years. Furthermore, it should be noted that the measurement data from 2015 is not available for a longer period, but only for the heat days. In addition, apart from the different outdoor temperatures on these days, it should be mentioned that the measurement interval in 2015 was chosen with an interval of ten minutes between two measurements. In comparison, the data from 2016 are available with a measurement interval of 220 s. This can lead to minor deviations in the averaging.
The predicted mean vote (PMV) is assessed as ‘warm’ on all three days considered in July 2015. On 19 July 2015, the calculated PMV, with a value of 2.3, is even outside the limits of −2 and +2 recommended by DIN EN ISO 7730 and thus between ‘warm’ and ‘hot’. This means a predicted percentage of dissatisfied people of around 87%.
In comparison, the heat judgments for the days in July 2016 are equally ‘warm’, but the calculated values for the PMV are lower than the values for 2015 (
Table 5 and
Table 6). Even though the outdoor temperatures were lower on the days studied in July 2016, an effect of the building renovation is visible here. Furthermore, when compared with the ASHRAE 55 standard [
15], it is obvious that the PMV results lay outside the stated acceptable range (−0.5 and +0.5) and that they get even more unsatisfactory on higher floors. Comparable results for PPD are observed, with an acceptable maximum of 10 according to the standard, and the obtained results with PPD passing 80% on the 18 July 2015.
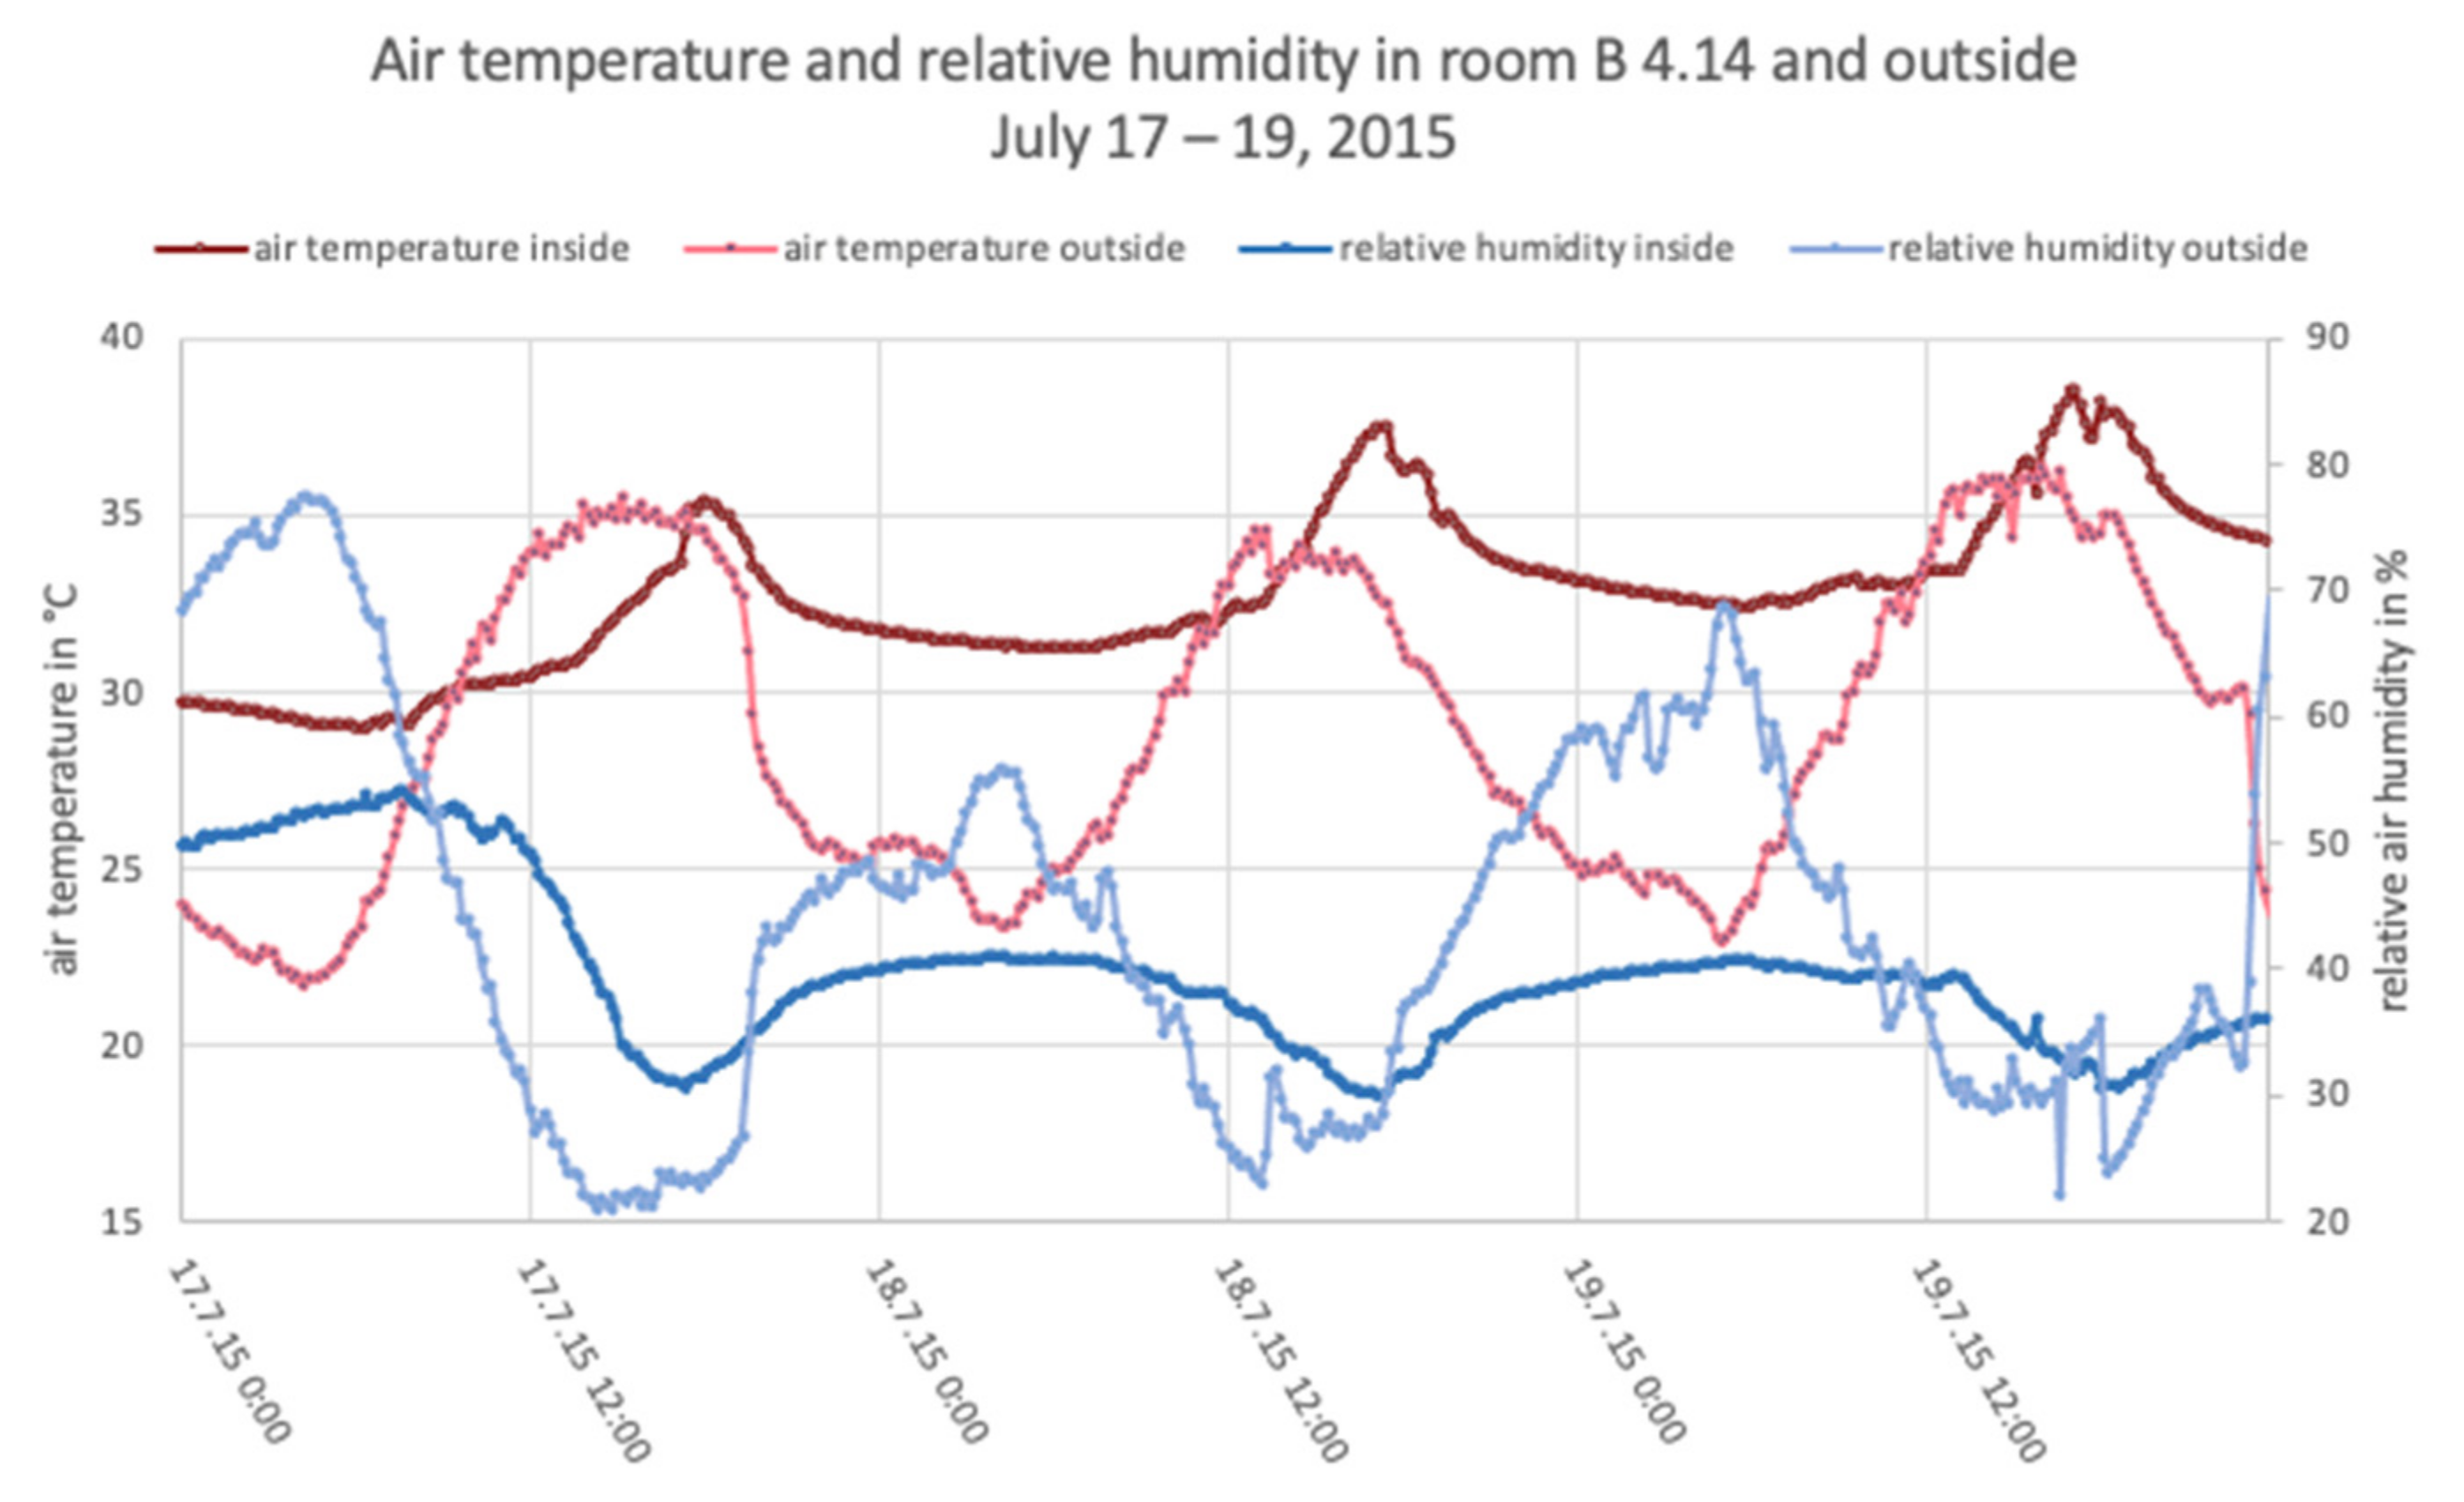
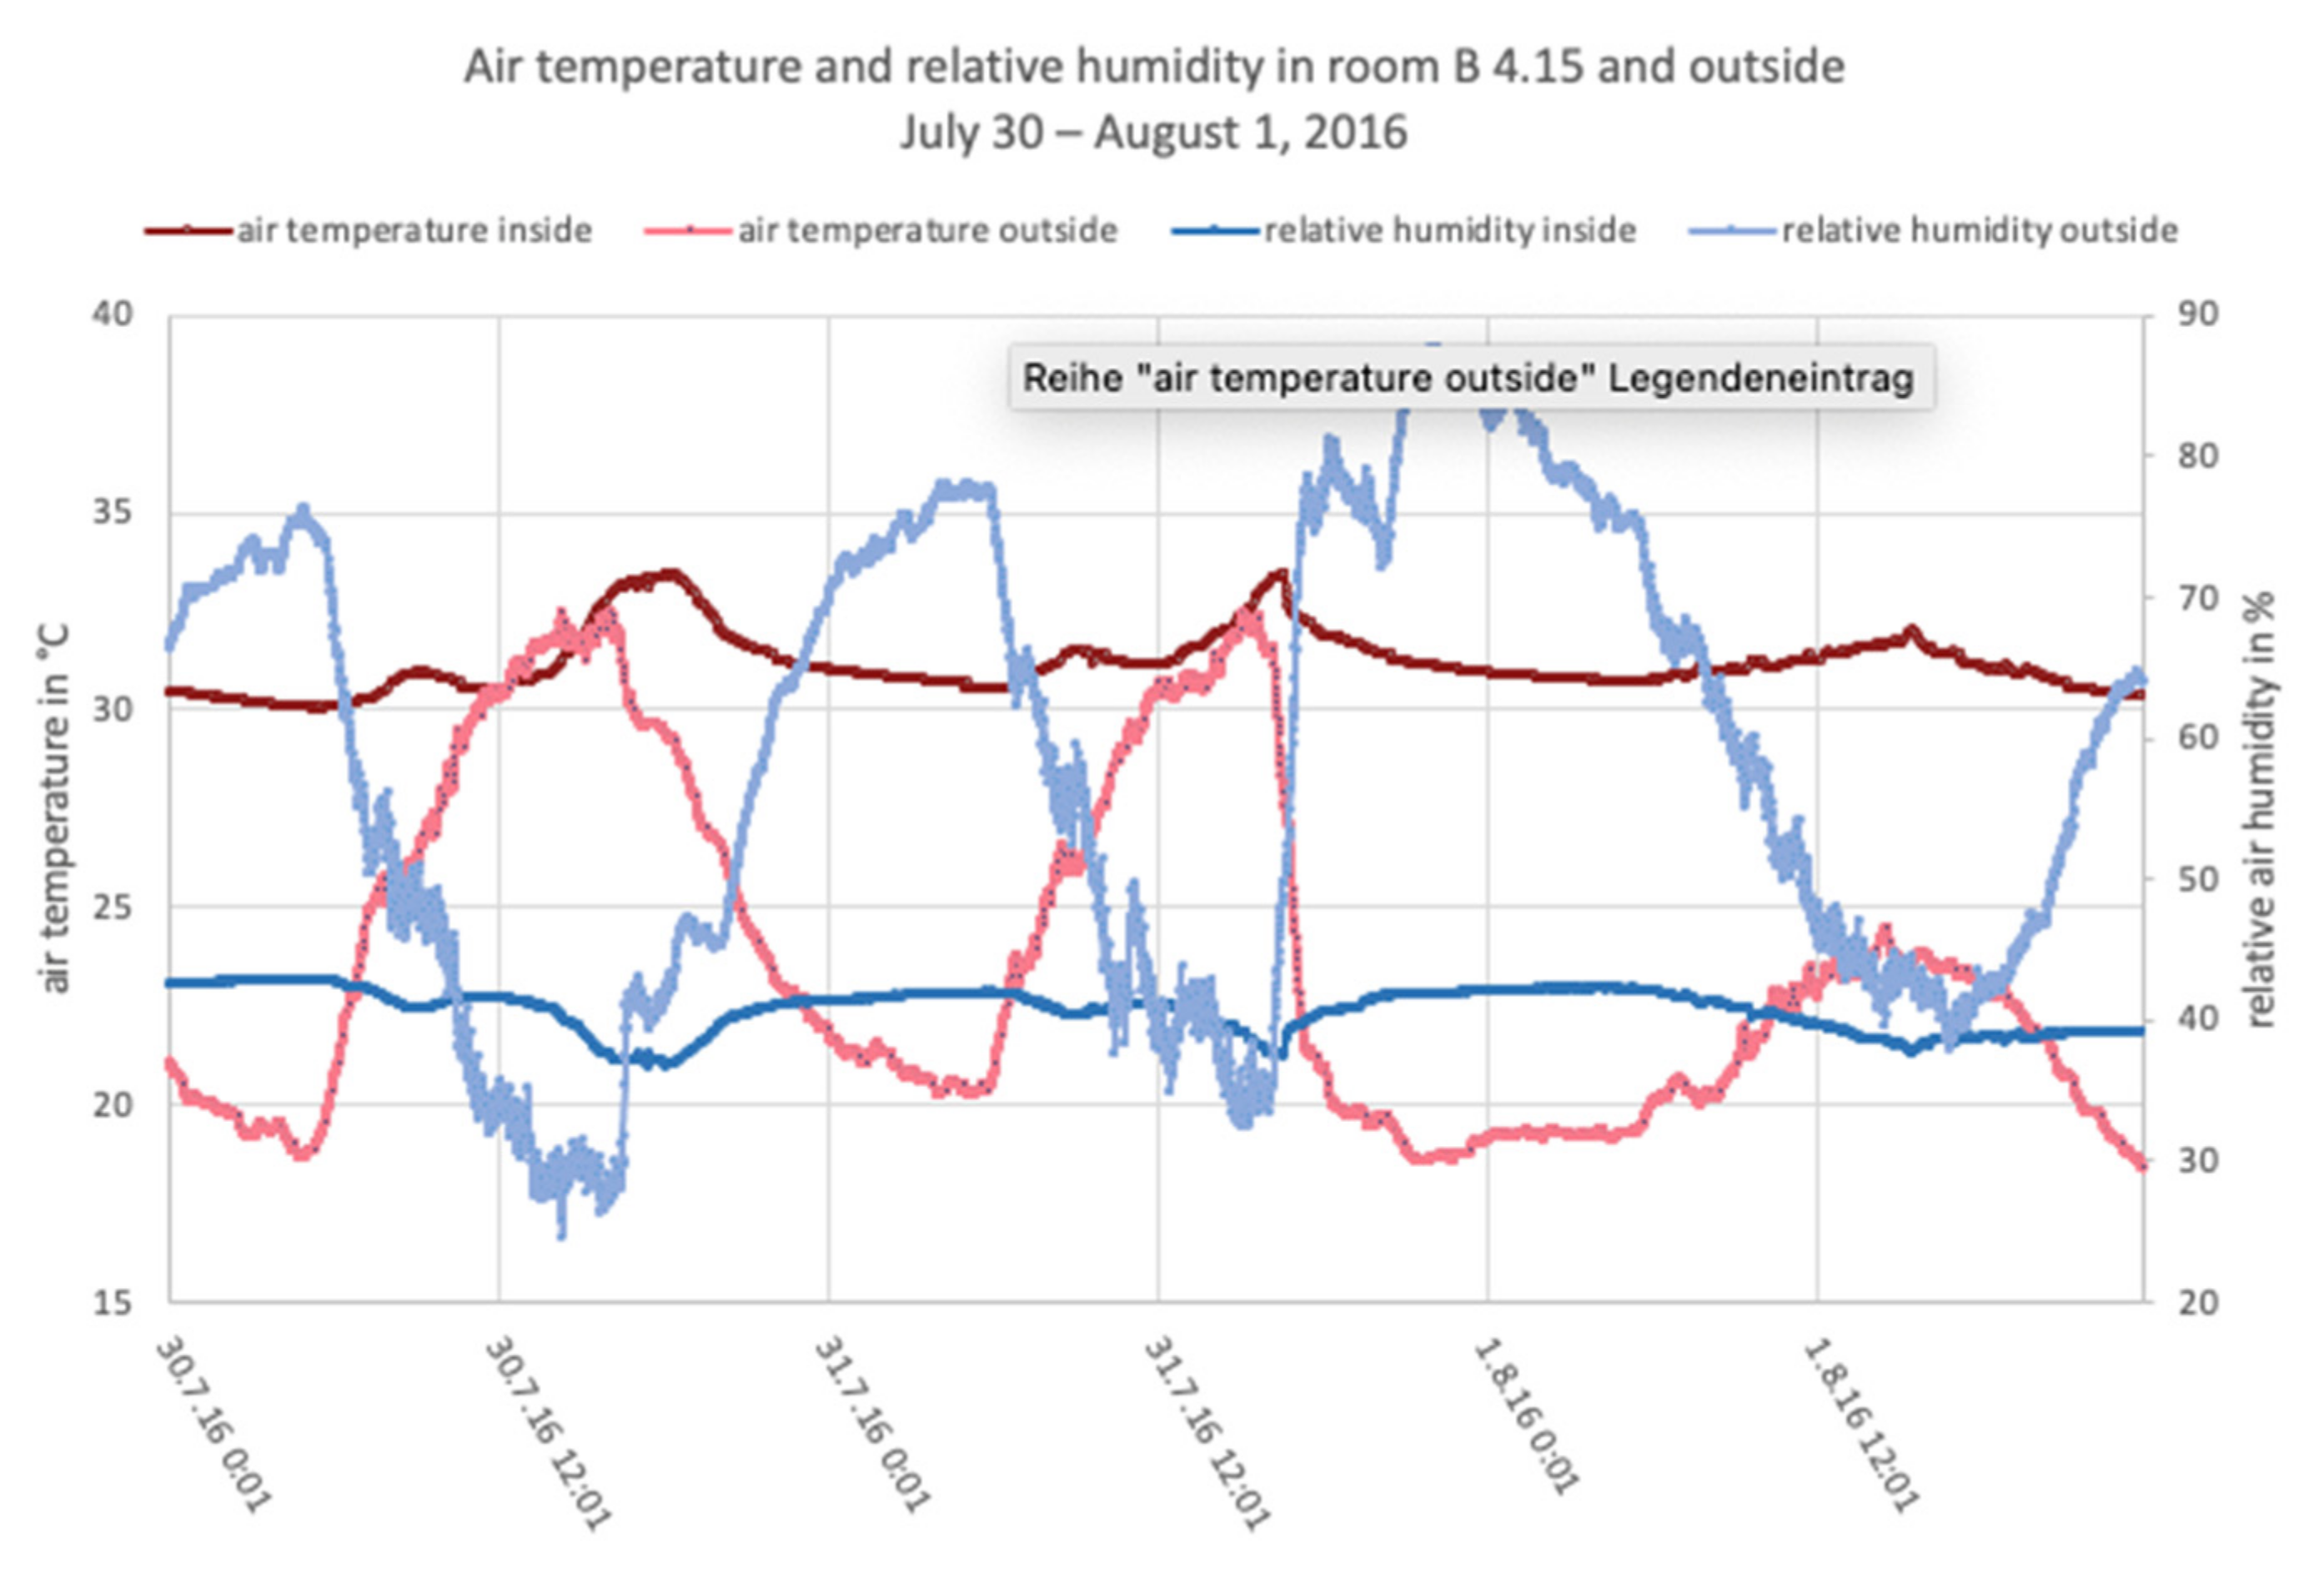
In order to achieve better comparability of the measured data, only the relative humidity and the air temperature for three days each were presented in the following. This eliminates the inaccuracy in the calculations of the PMV due to the assumption of the relative air velocity. Shown in each case are the measured air temperature and the relative humidity in the room, as well as data evaluated by the measuring station Aspanggründe for the outside temperature and the relative humidity measured outside. It can be clearly seen that during the period of the measurements in 2015, the air temperature in the office room is always above the 25 °C recommended by the Workplace Ordinance. This value is also clearly exceeded in 2016.
Figure 8 and
Figure 9 each show the measurement days with the highest measured indoor air temperatures (17–19 July 2015 and 30 July–1 August 2016, respectively). The values from 2015 are significantly higher than those from 2016. The relative humidity in the room should ideally be between 40 and 60%. This is not perfectly given on days with particularly high temperatures at 35% humidity.
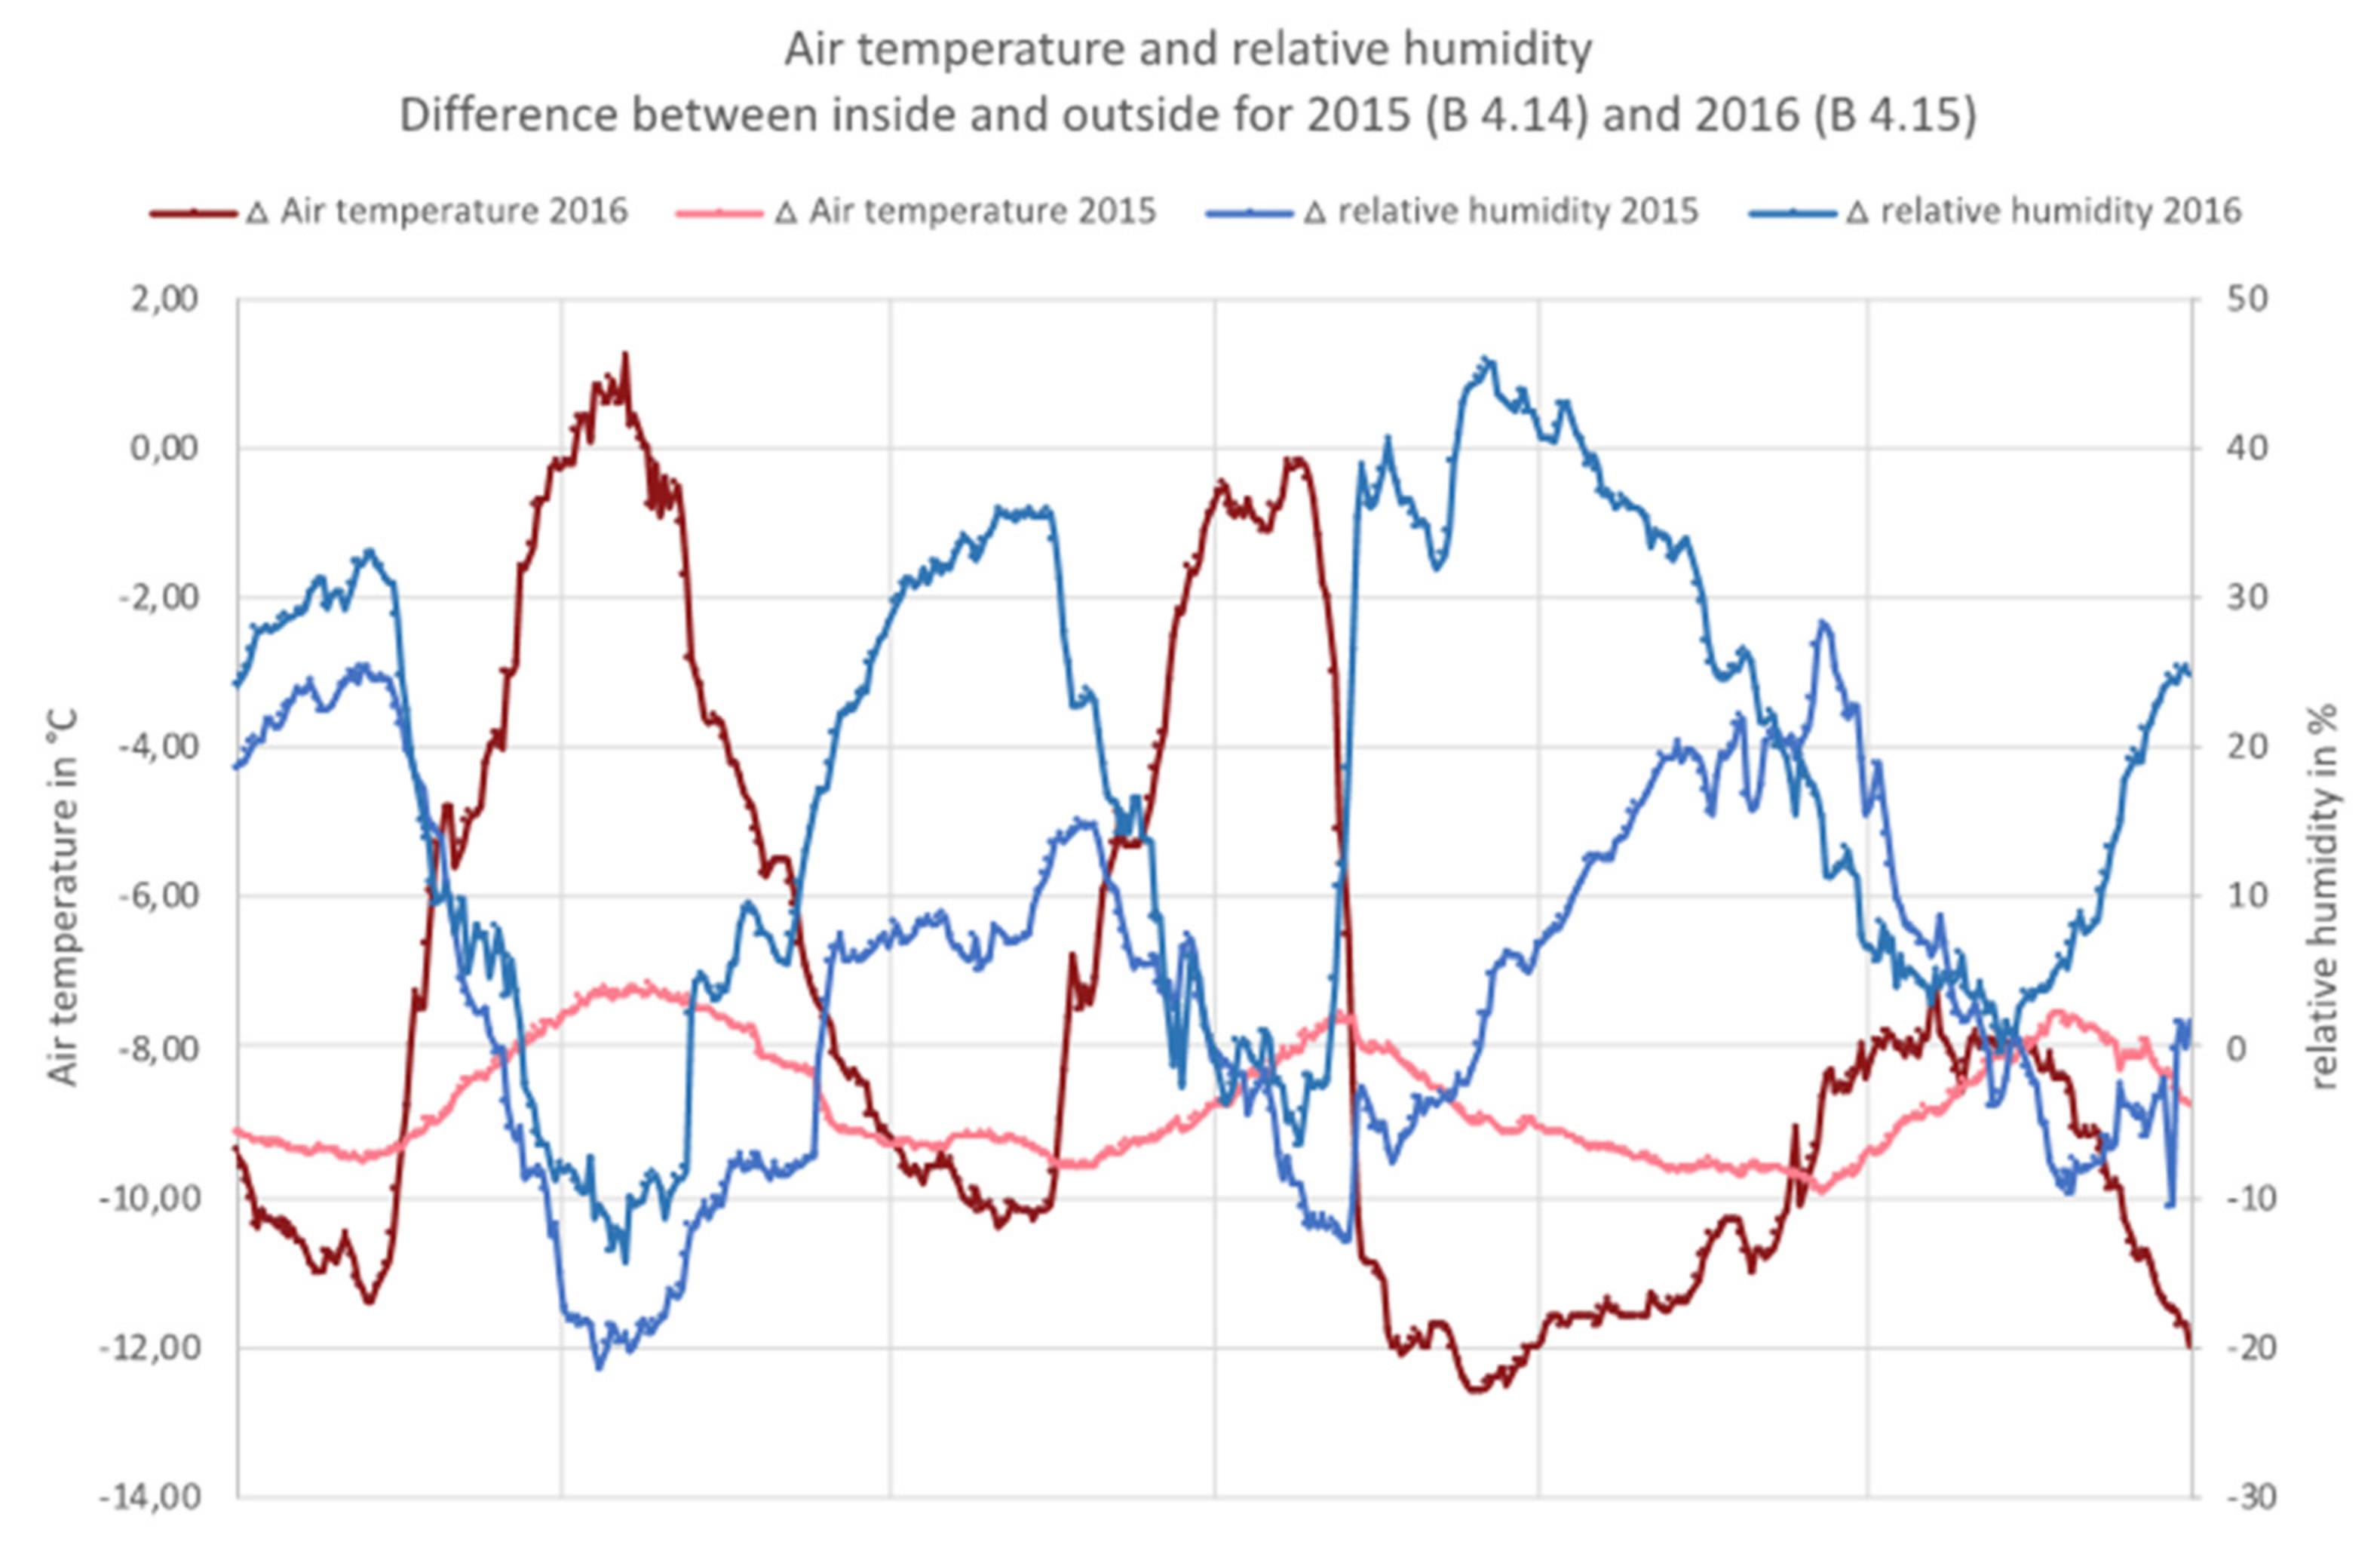
Figure 10 shows the difference between the values measured inside the room and on the asphalt surfaces outside for the same days. On the summer days considered in 2015, the indoor air temperature was always lower than the measured outdoor temperature. When comparing the difference values between 2015 and 2016, it is clear that this was not the case on the summer days in 2016 and that the values fluctuate more strongly, which is due to the shading and the new windows with lower total energy transmittance.
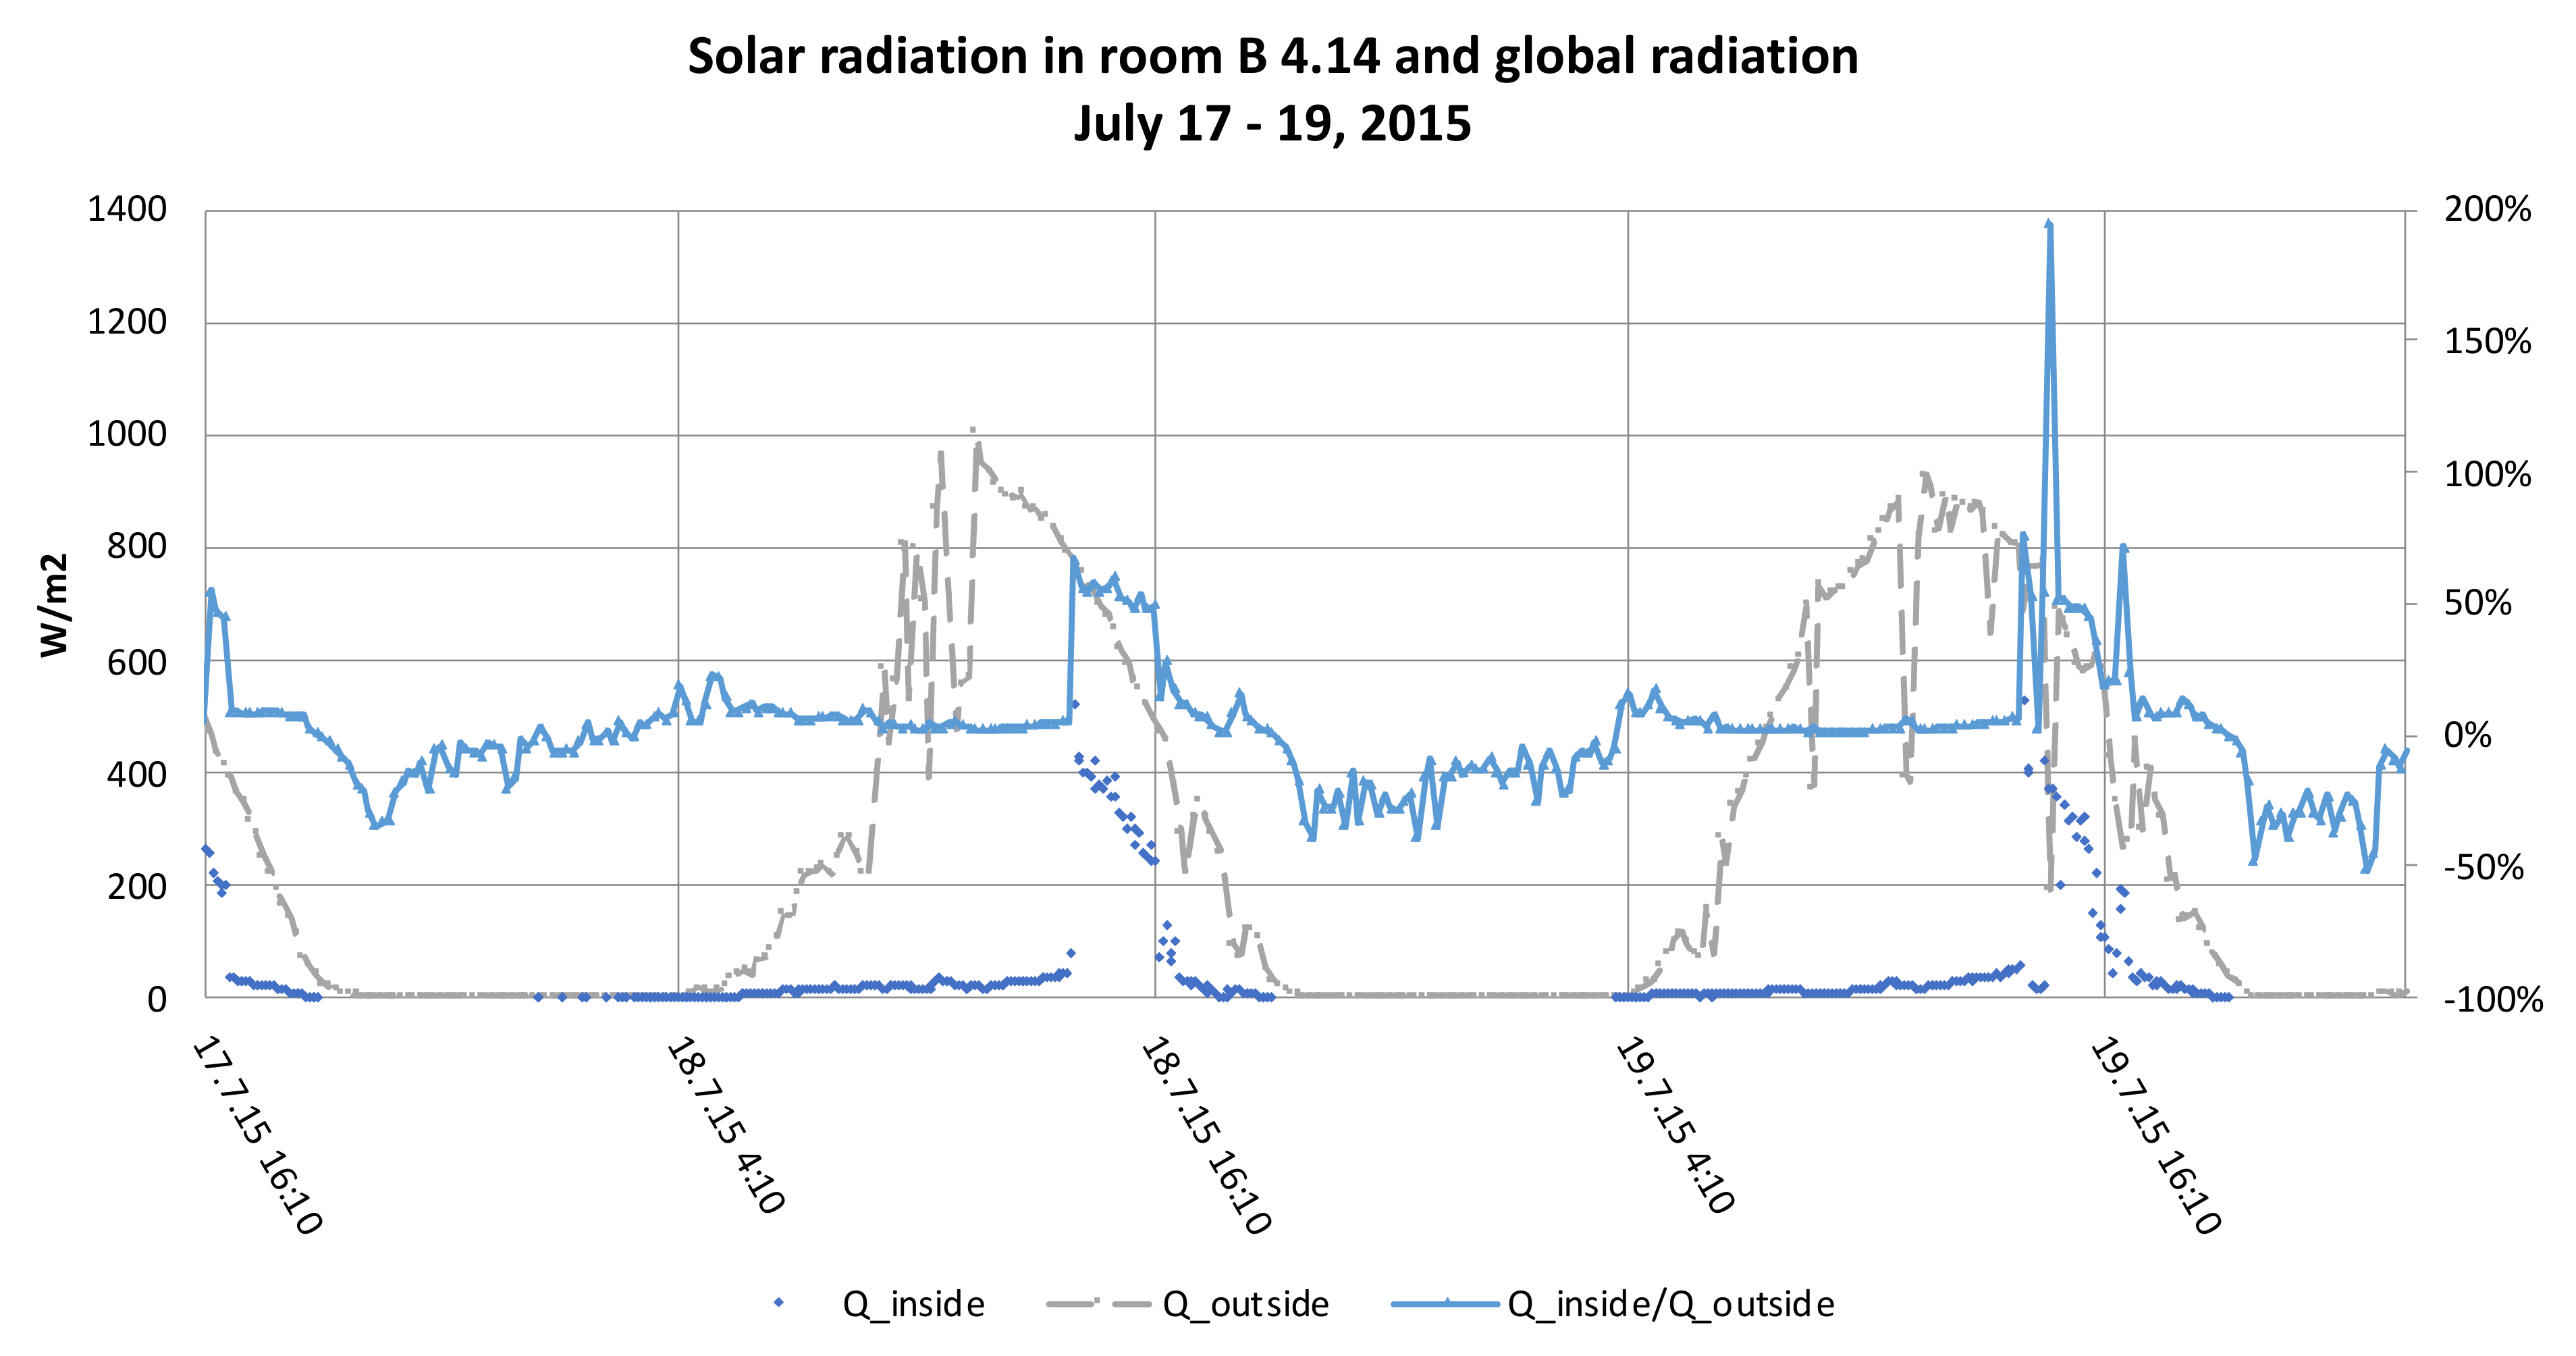
The two graphs below show the course of solar radiation in the office room B 4.14 for selected July days in 2015 and B4.15 for 2016 (
Figure 11 and
Figure 12). In addition, the global radiation for the respective point in time is presented based on measurement data from the TU Wien measuring station at Aspanggründe and a ratio of the solar radiation measured inside the room to the global radiation is determined. For the three days shown from the month of July 2015, the peak values in the midday hours amount to up to approximately 530 W/m
2. In contrast, in the period between 28 July and 9 August 2016, the maximum value is below 200 W/m
2, with solar radiation measured with the pyranometer being less than 30 W/m
2 on nine out of the thirteen days considered (
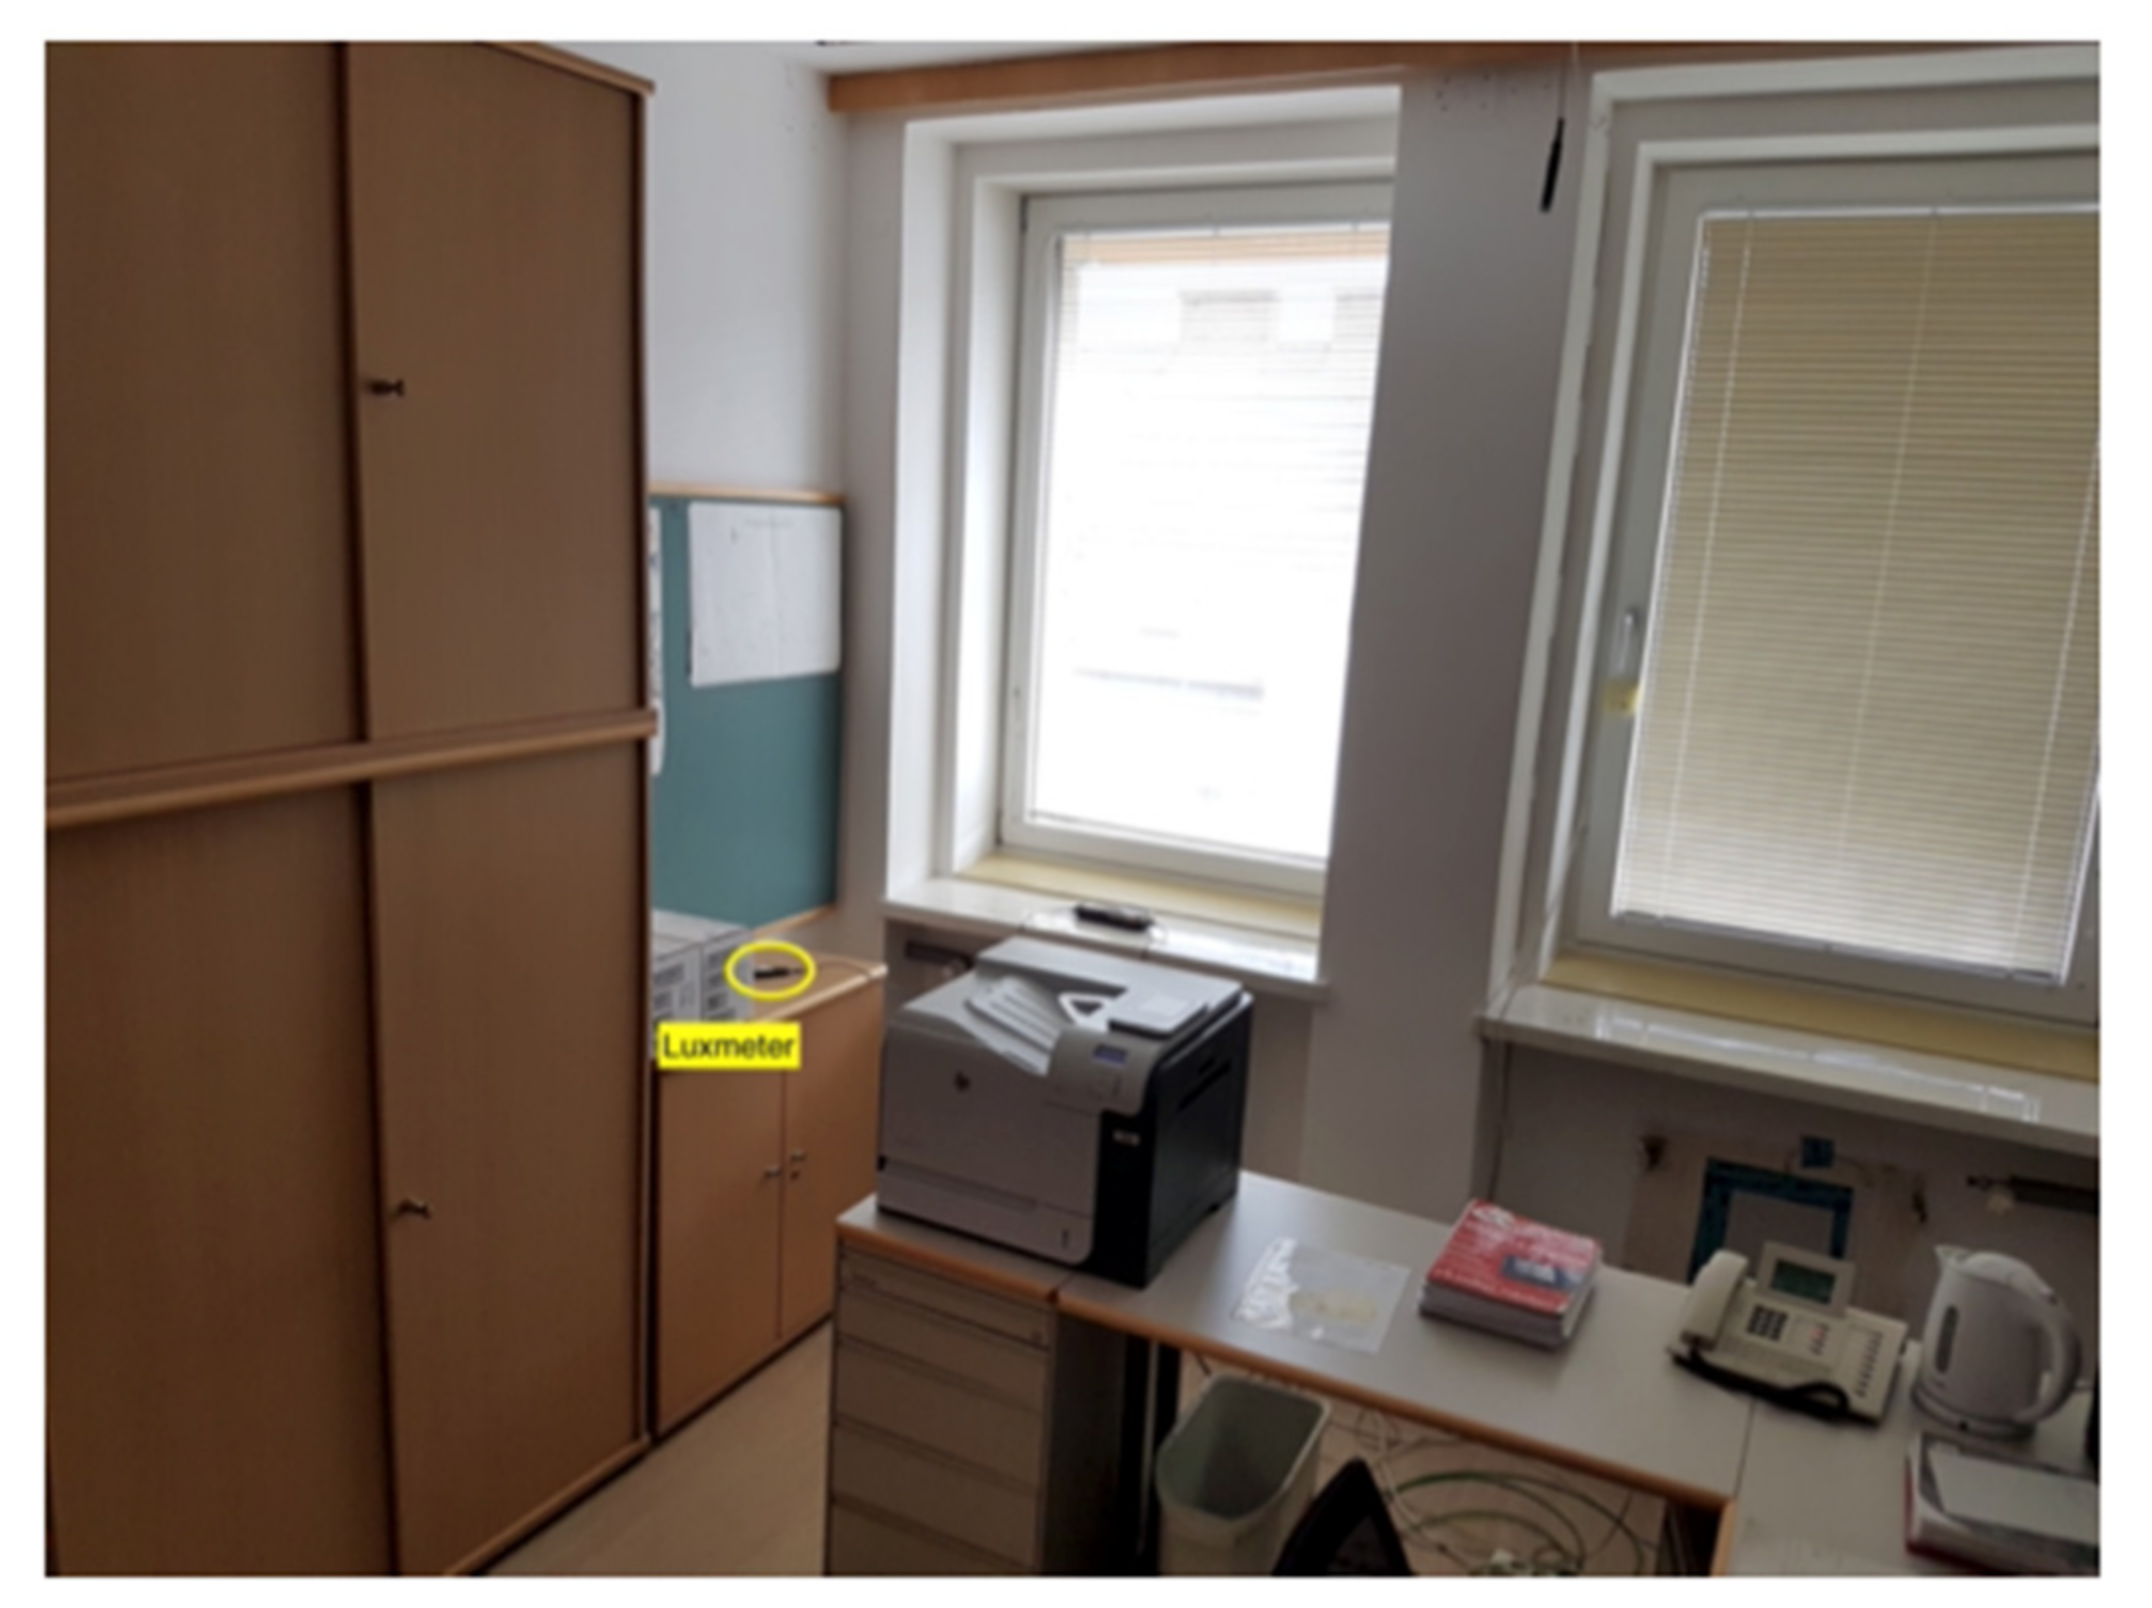
Figure 11). Particular attention should be paid here to the user-related setup of the room with curtains and windows covered with boxes (
Figure 13). In contrast, in summer 2015, the pyranometer in room B 4.14 is positioned directly at the window with the blinds and curtains open (
Figure 11).
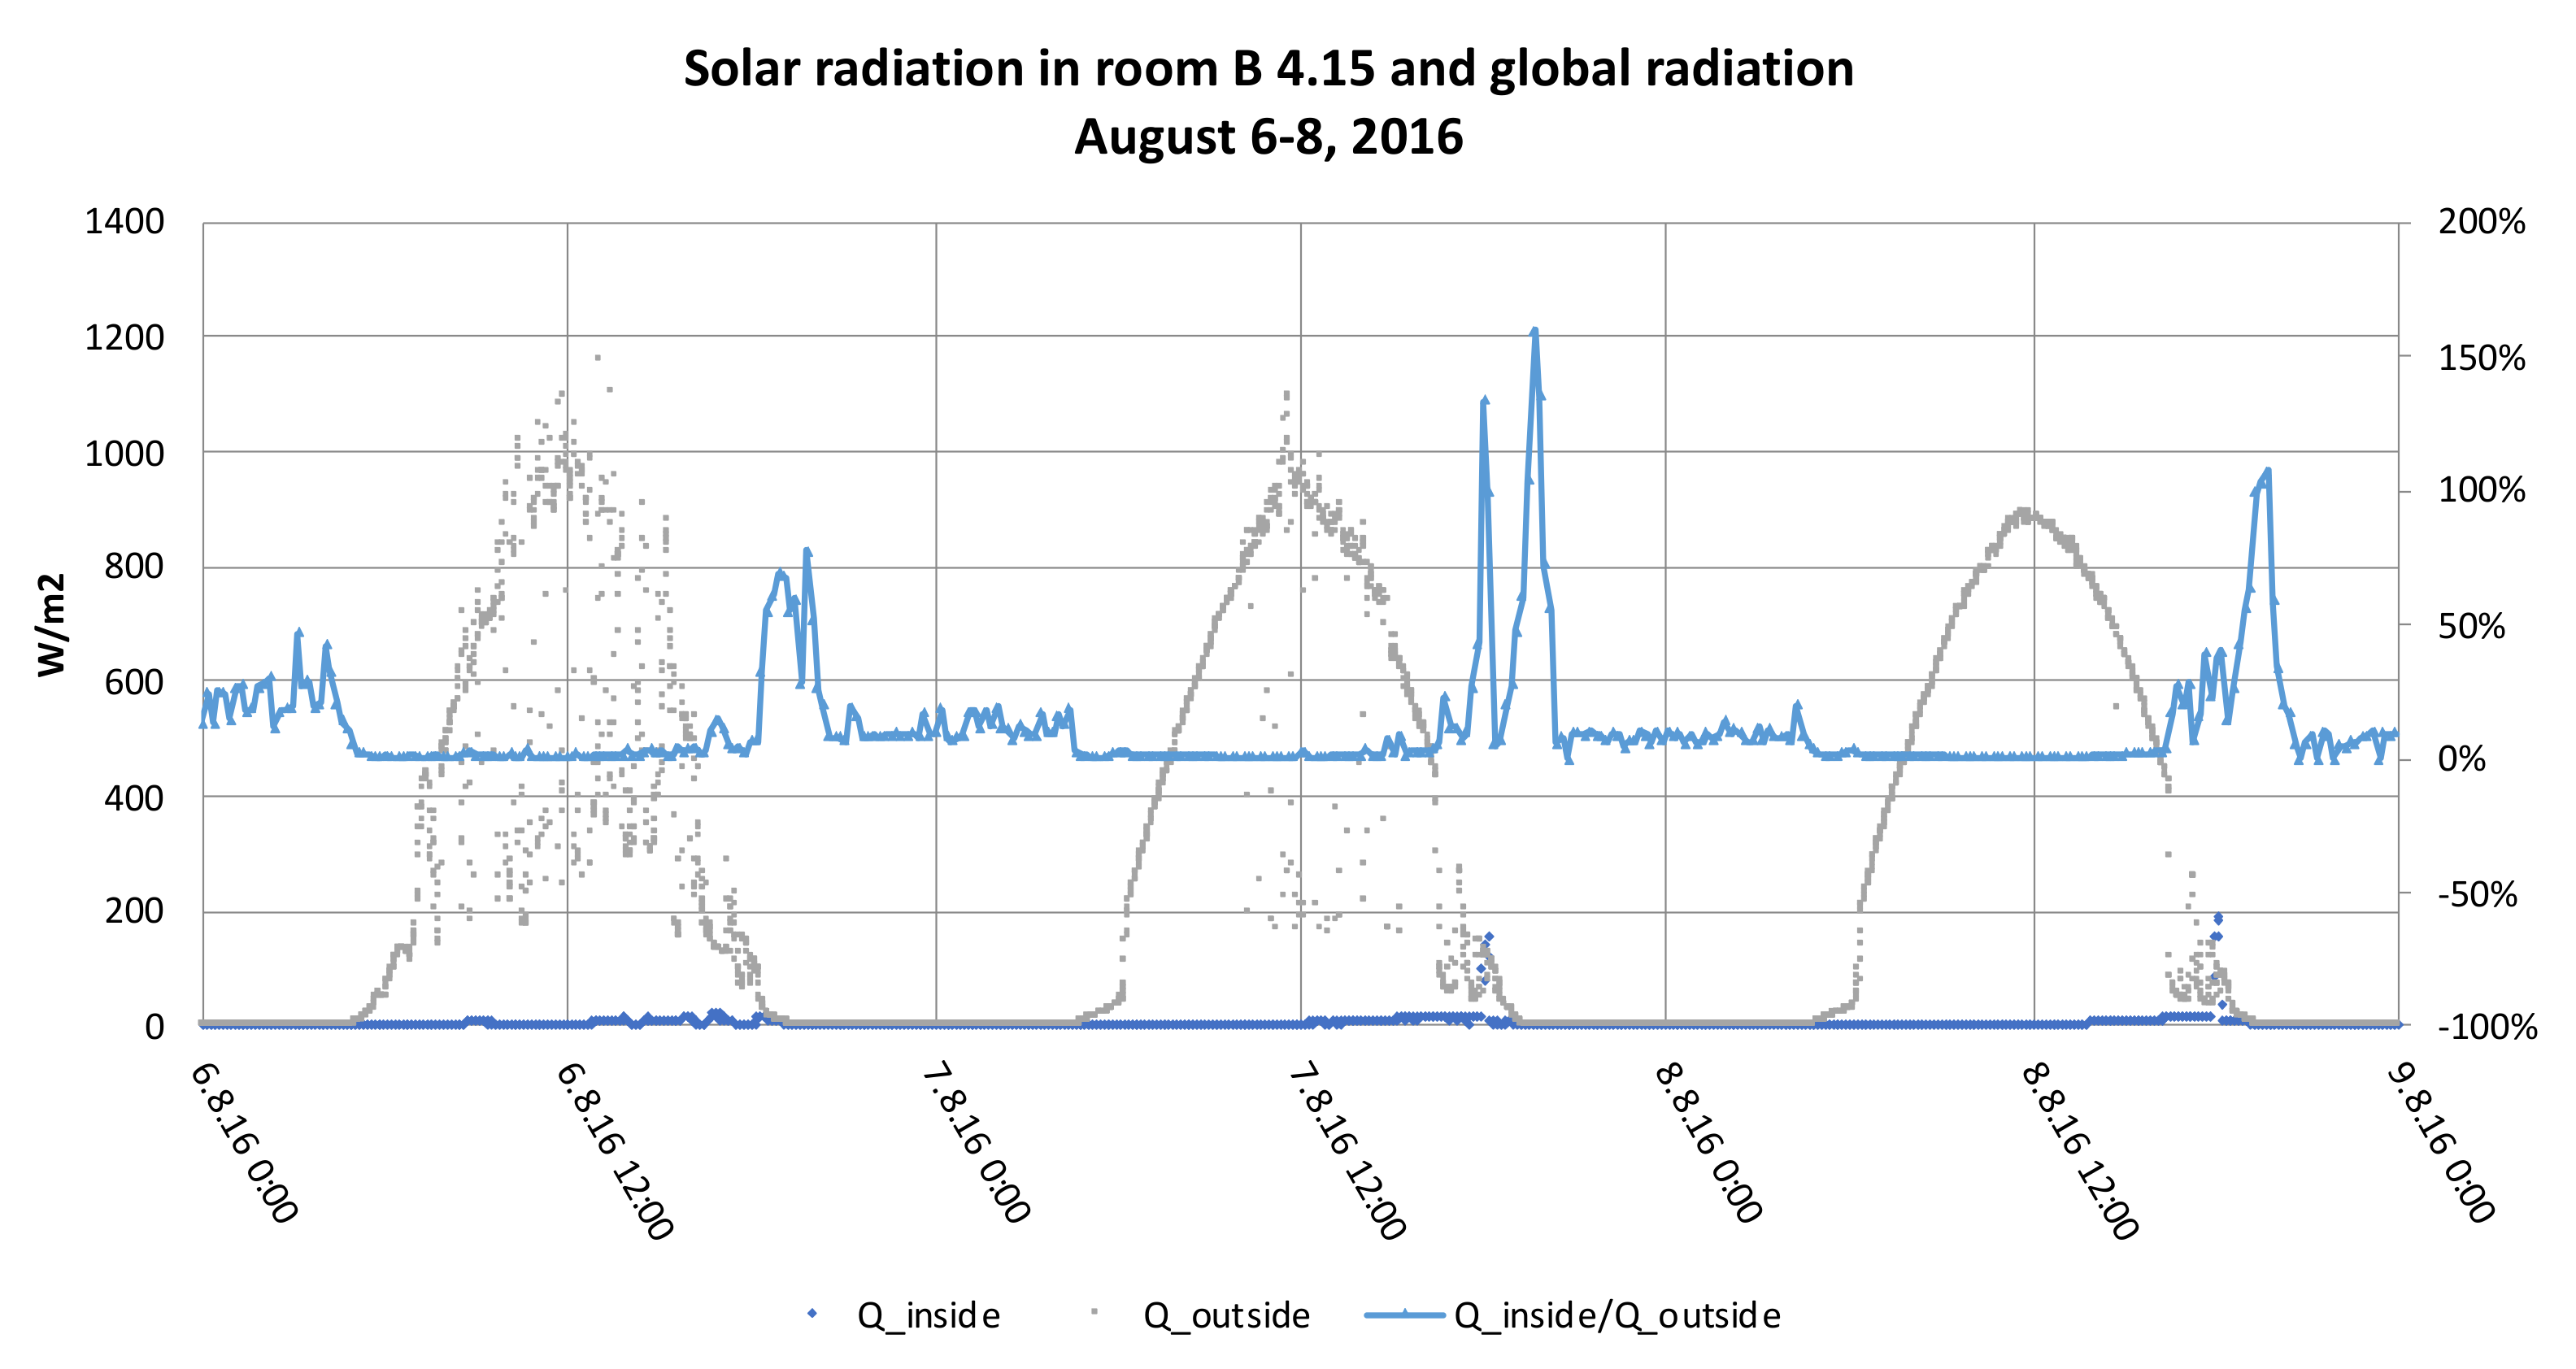
Figure 13 shows the days with maximum radiation during 6–8 August 2016. In addition to the different weather conditions, one possible explanation for the significantly different values in the two rooms is the shading installed as part of the renovation. The newly installed windows also influence solar radiation into the office room due to a lower total energy transmittance (g = 0.5) compared to the windows before the renovation (g = 0.67). In summer, this has a positive effect on preventing summer overheating. The effects of the new windows and the shading can be seen in the depicted relationship between the measured radiation inside the room and the global radiation (Q_inside/Q_outside) by the fact that this shows a significantly more regular and flattened course in summer 2016 compared to summer 2015. The scattering of the values of the global radiation at midday of 6 August 2016 can be explained by the cloudiness on this day.
3.3. Evaluation of the Survey Results
Out of 90 employees, 43 completed the questionnaire on indoor climate. This corresponds to a response rate of approximately 48%.
Due to the small size of the group of people surveyed, in order to preserve the anonymity of the employees, questions regarding age and gender as well as the question of whether the office is located on the street side of the building with façade greening or on the courtyard side without façade greening were not asked. This must be taken into account when evaluating the statements. It should also be noted that the survey, which refers to the summer months of July and August 2016, was only conducted retroactively in December 2016. In the following, due to the small sample size, the focus is placed on a qualitative evaluation and the presentation of the frequency distribution, and only partial use is made of other quantitative statistical methods, such as the examination of correlation or the creation of cross diagrams.
Out of 43 employees surveyed, 28, i.e., 65%, work more than 30 h per week and 37 of the respondents (86%) state that they are in their office both in the morning and in the afternoon.
3.3.1. Evaluation of the Current Situation Based on the Survey
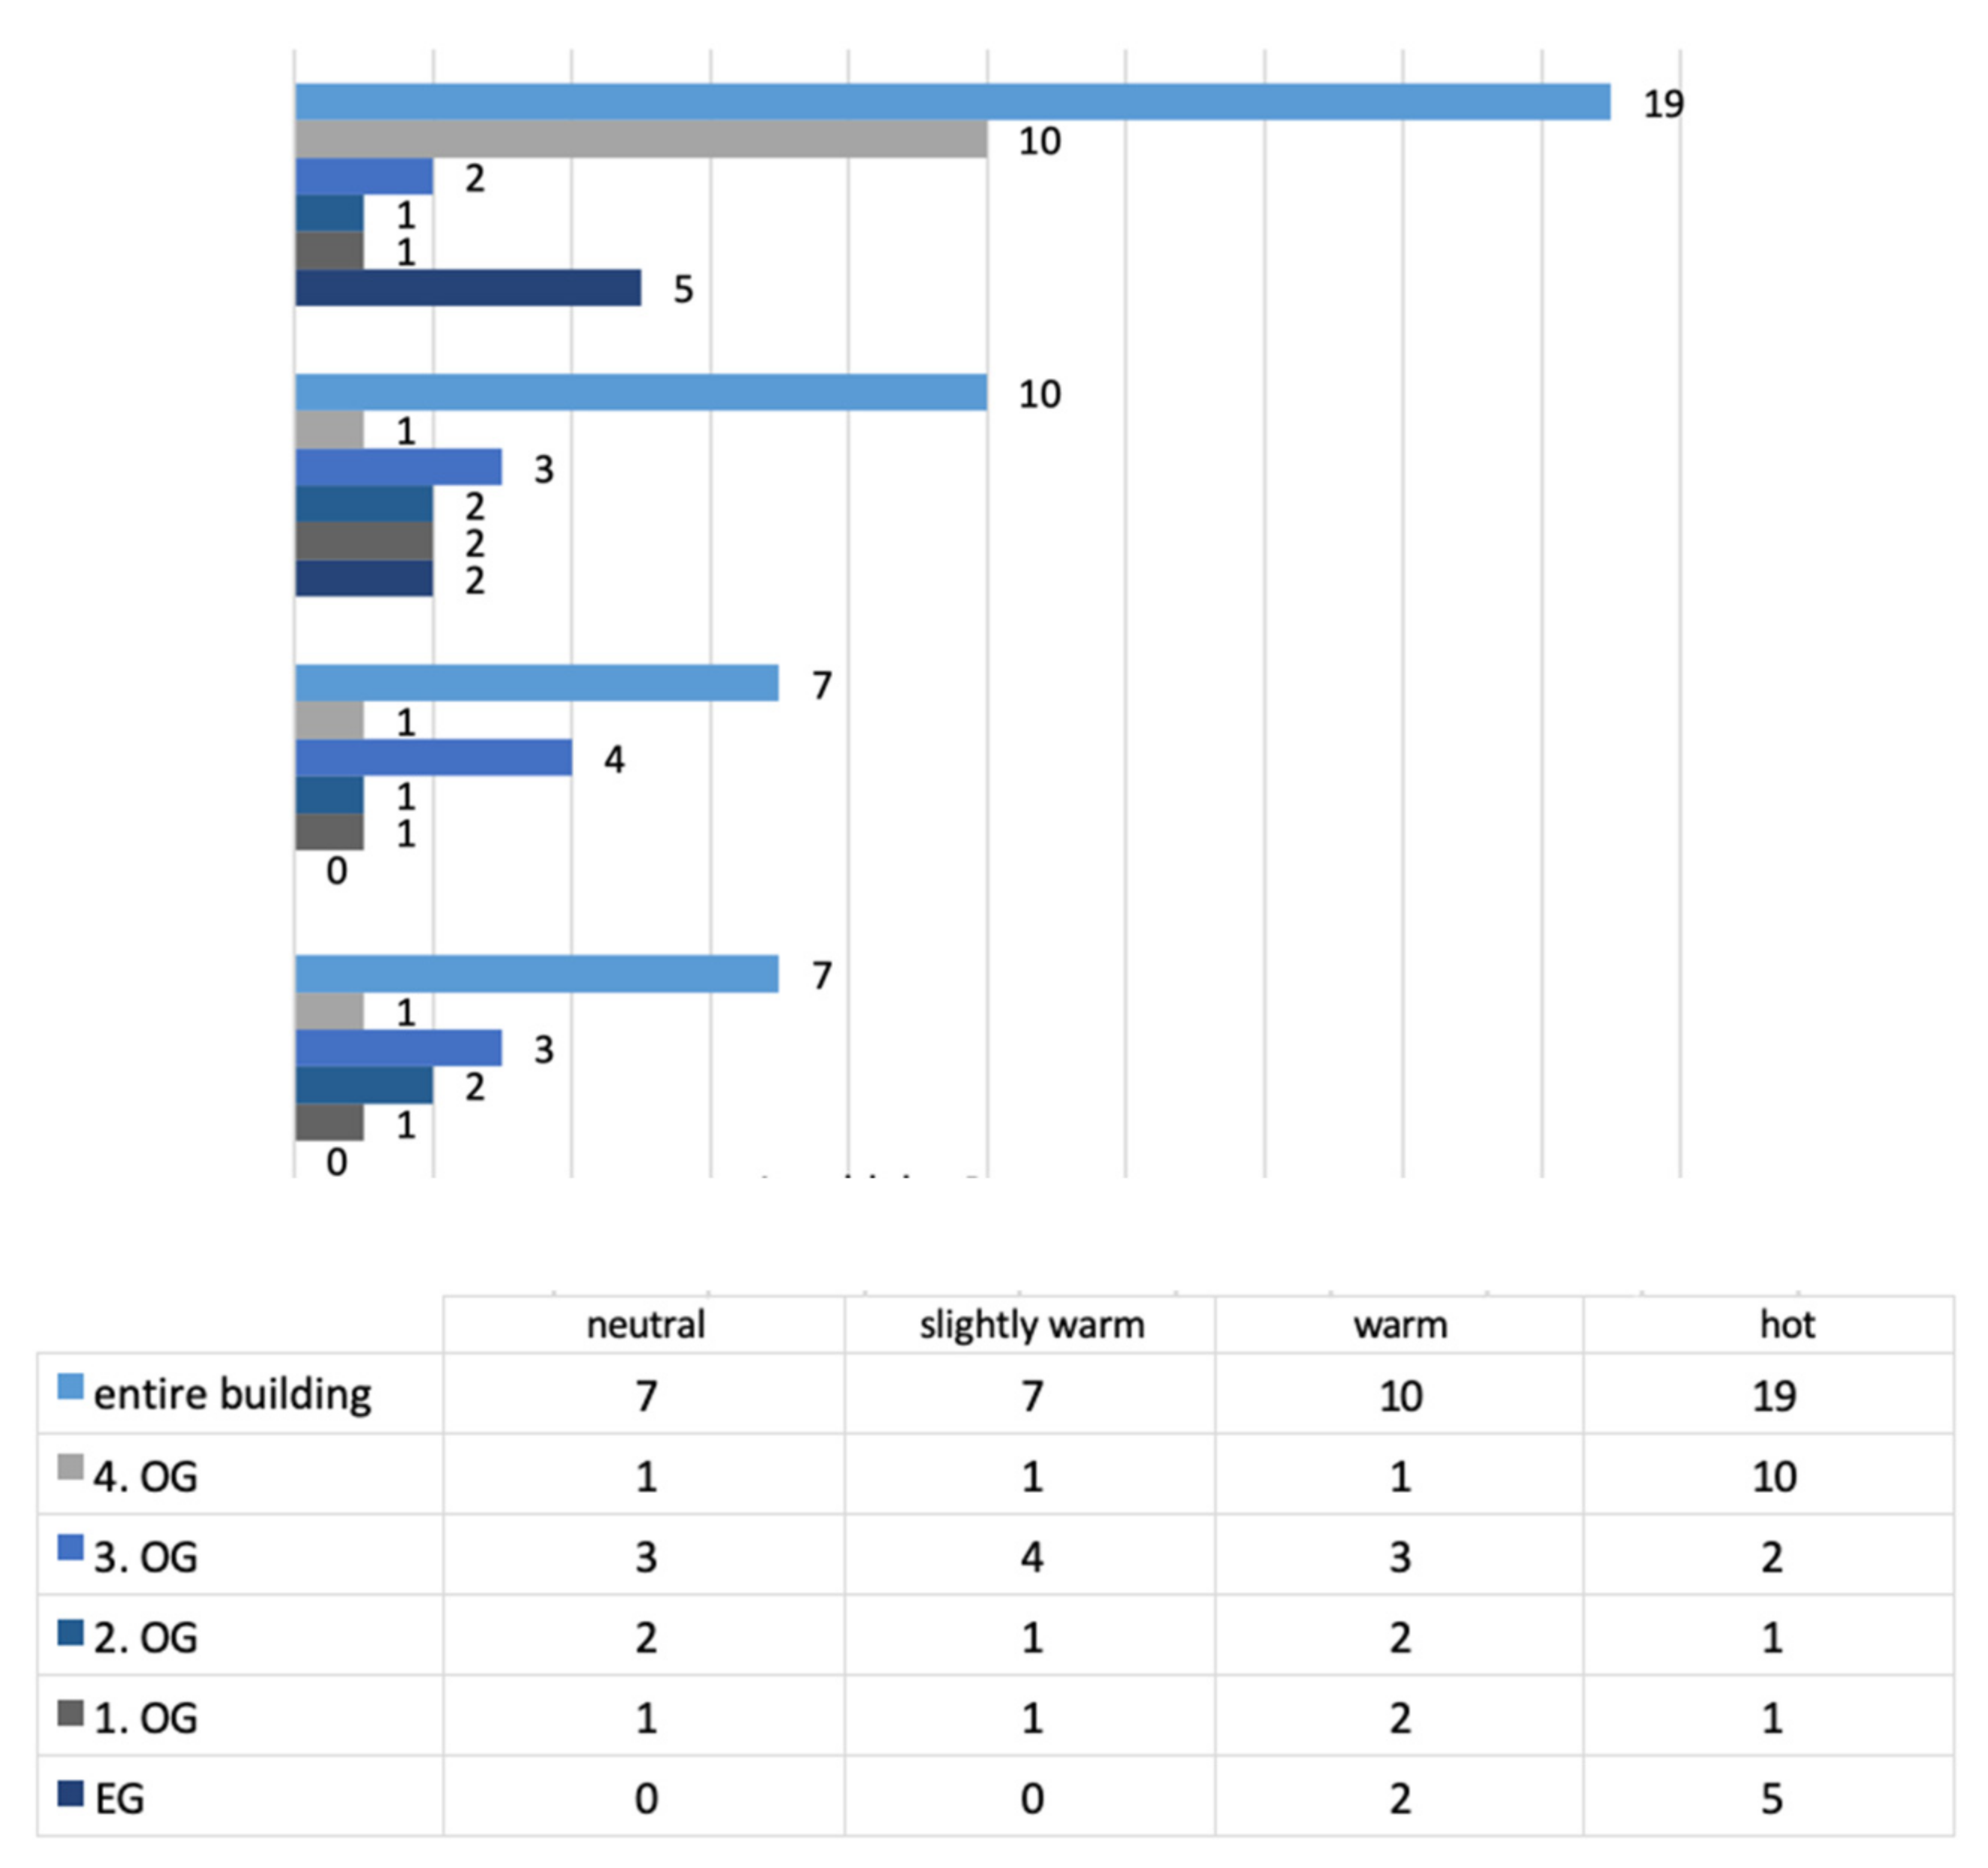
In a first step, the questionnaires were sorted according to floors so that the results of the survey could be better compared with the calculations of the respective floors. Seven employees with offices on the first floor (EG), five from the second floor (1. OG) and six employees working on the third floor (2. OG) completed the questionnaire. Twelve people from the fourth floor (3. OG) and thirteen from the fifth floor (4. OG) participated in the survey. In
Figure 14 it can be clearly seen that most of the employees (29 out of 43; 67%) perceive the temperature as ‘warm’ to ‘hot’. It should also be pointed out that 75% of the respondents with offices on the fifth floor rate the temperature as ‘hot’, whereas the ratings on the other floors are fairly evenly distributed among the statements ‘neutral’, ‘slightly warm’, and ‘warm’ as well as ‘hot’. No one rates the temperature in the building in summer as ‘cold’, ‘cool’, or ‘slightly cool’, so this is not shown in the graph below.
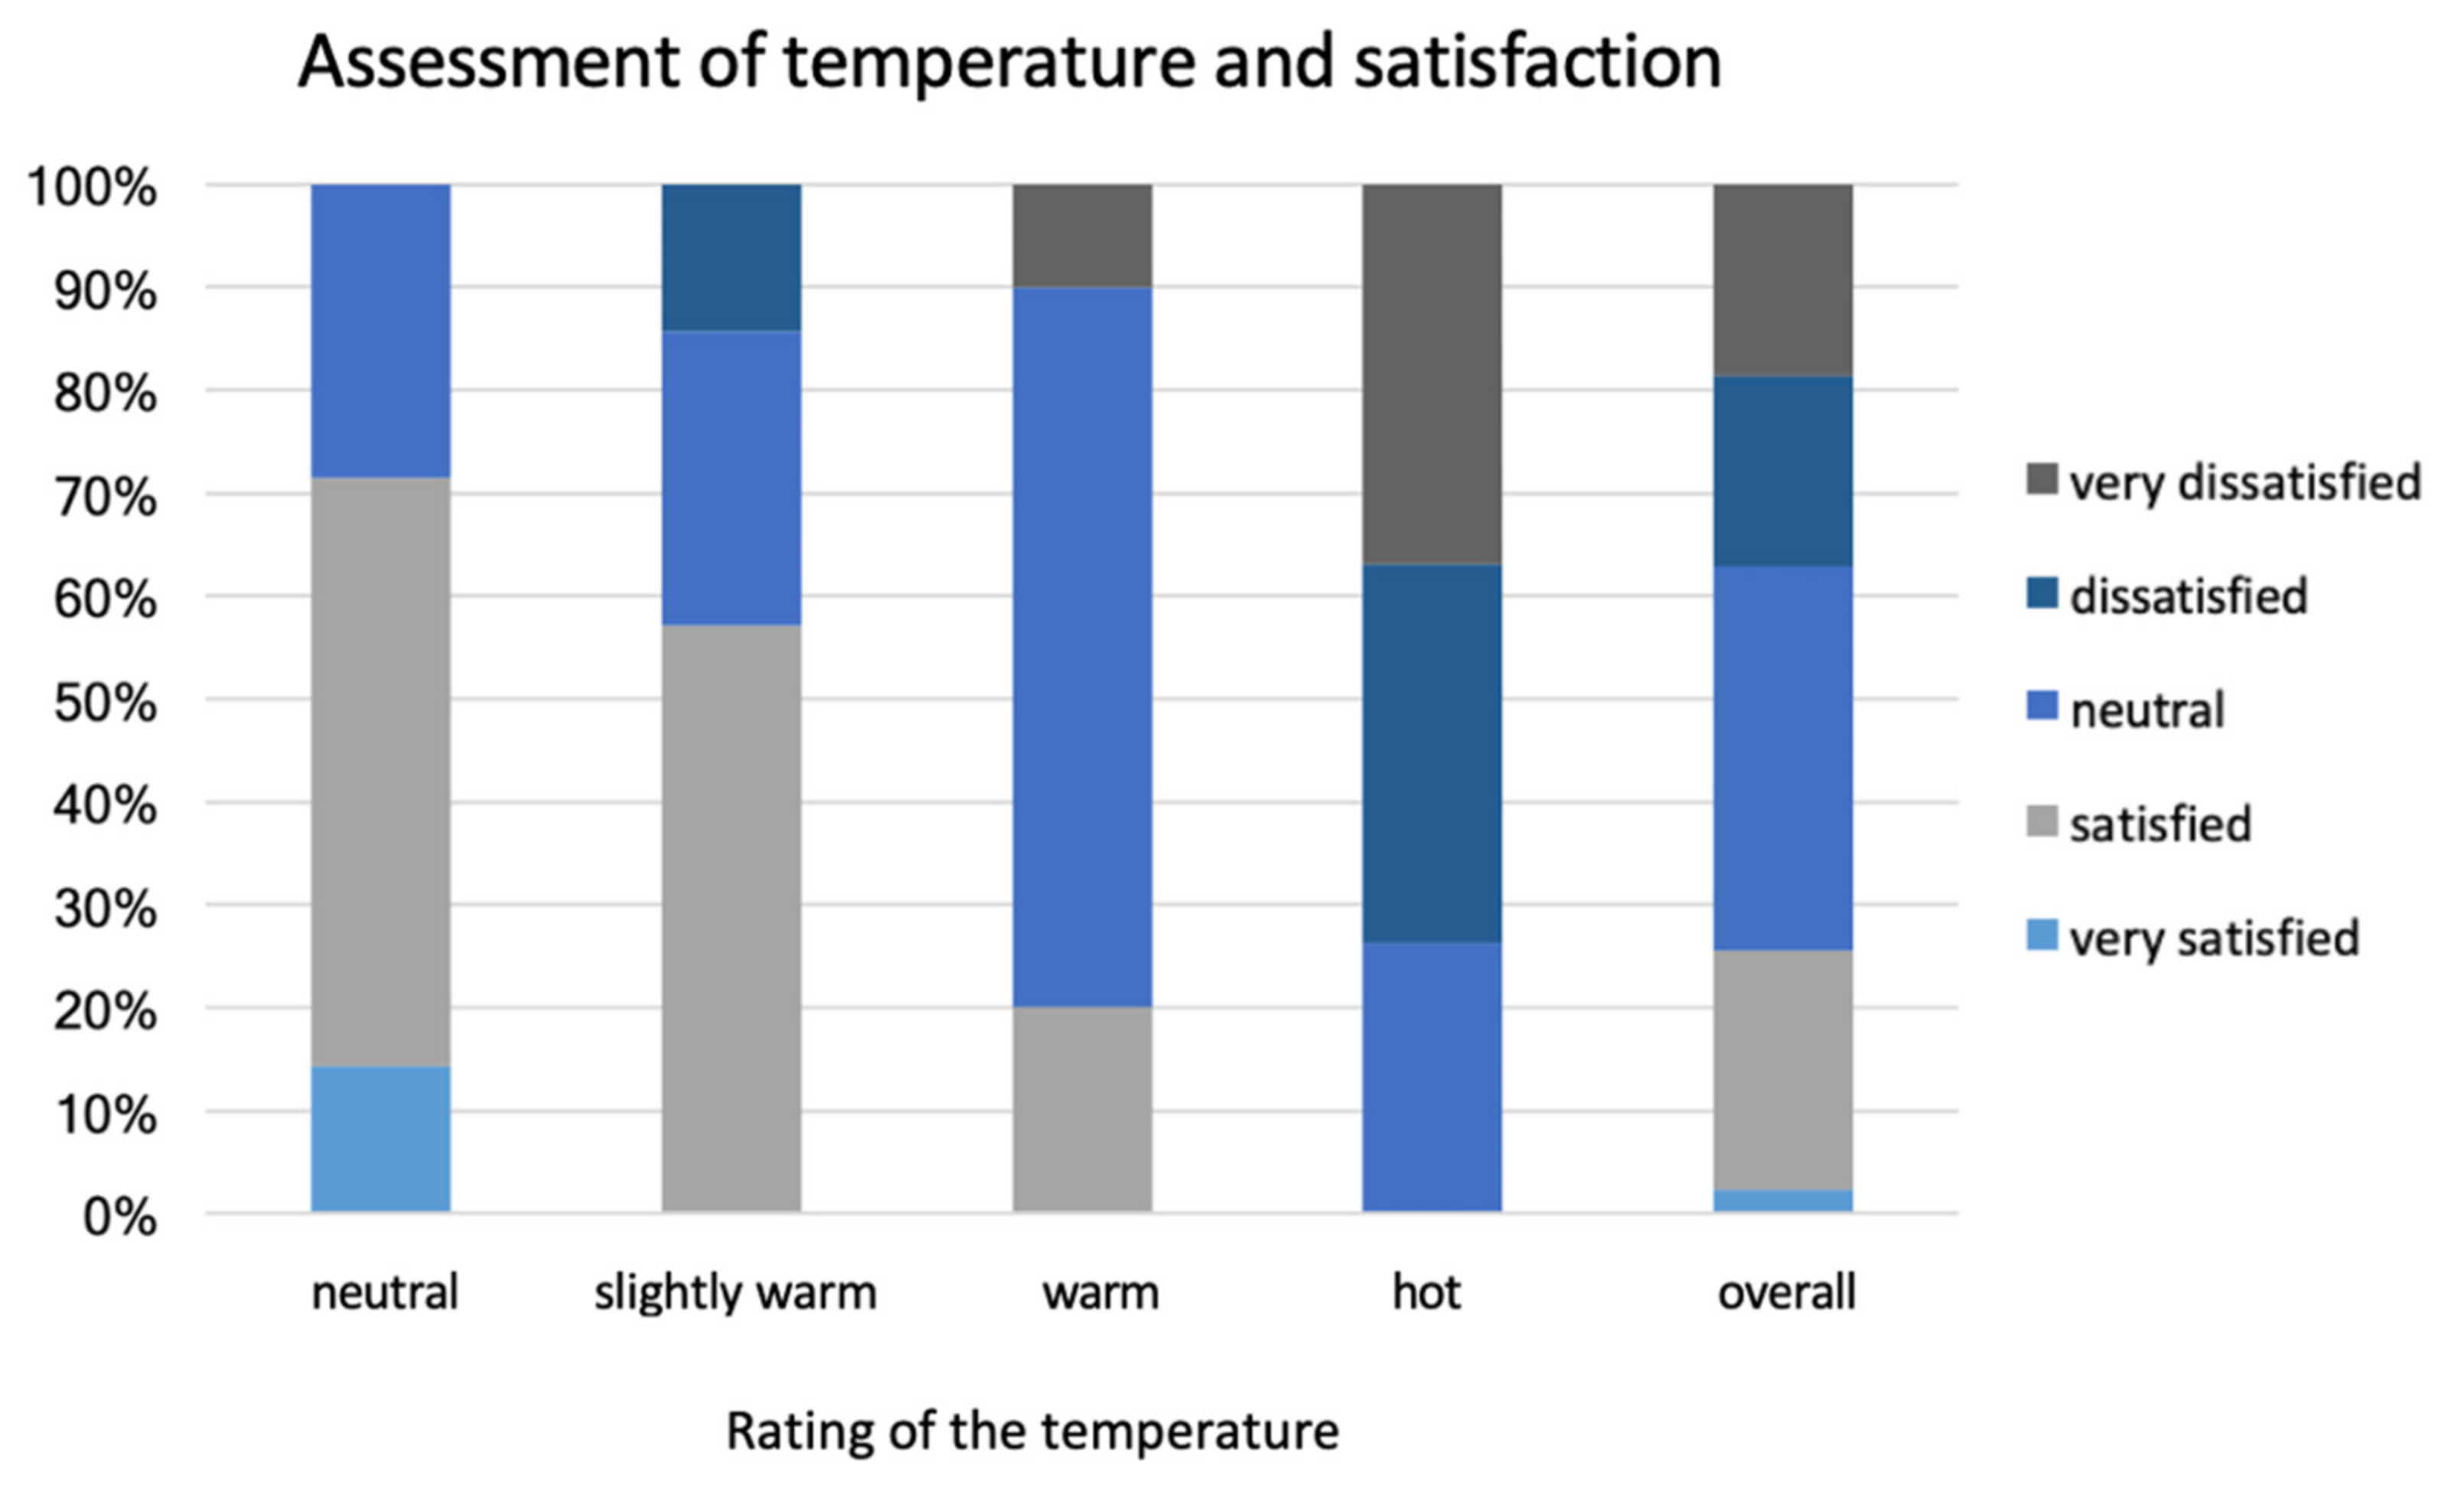
Figure 15 depicts the assessment of temperature and satisfaction. In terms of temperature satisfaction, 38% of respondents, equally divided between the two statements, say they are ‘dissatisfied’ or ‘very dissatisfied’ with the temperature, and 35% have a neutral attitude towards the temperature in their office space. It is striking that 5 out of 19 people who rate the temperature as ‘hot’ indicate a neutral attitude towards it. When the temperature is rated as ‘warm’, as many as 70% indicate neither satisfaction nor dissatisfaction. Nevertheless, 19 of the 43 respondents (44%) would prefer a slightly cooler temperature, and for 39% the temperature should be much cooler to cooler. This illustrates the subjective feeling and the subjective evaluation of the thermal situation in the room. Based on the calculated correlation coefficient according to Bravais–Pearson (r = 0.7), the linear relationship between satisfaction and perceived temperature can be established. This coefficient with values between −1 and +1 represents the extent to which the assessment of temperature is related to satisfaction. Accordingly, the evaluation of 0.7 confirms this correlation. In
Table 7, the relationship between the assessment of the temperature and the temperature satisfaction is represented using a cross table.
To change the temperature in summer, 33 of the 43 persons open the window, 18 of them additionally open the door, 67% of the respondents activate the sun protection, an individual interior blind in each office room, and 5 people indicate activating a fan as another measure. A total of 10 people did not answer the question about the usual clothing at work in the summer, 33 of the 43 respondents, i.e., all those who answered the question, state that they wear a short-sleeved top, 18 persons state that they come to work in long trousers, 7 persons usually wear short trousers, and 6 persons wear long or short trousers. The air quality as well as the humidity are perceived as neutral and there is no preference to change. No clear correlation can be found using the Bravais–Pearson coefficient (r = 0.4) between satisfaction with temperature and satisfaction with air quality based on the survey.
Table 8 shows the correlation of satisfaction with air quality and temperature using a cross table.
Out of 43 respondents, 39 state that they rarely or almost never feel drafts, and 3 of the interviewees state that they often feel drafts, although it should be noted that they also state that they ventilate 3–5 or more than 5 h a day.
Regarding both daylighting and artificial lighting conditions, the respondents state that they are satisfied or neutral with about 80%. It is clear that employees on the first floor and second floor rarely or almost never experience glare from sunlight, but this assessment changes as the number of floors increases and about half of those with offices on the fourth floor feel often or almost always blinded by sunlight. Nevertheless, more than 70% of these persons on the fourth floor state that they are satisfied or neutral with the sun and glare protection facilities.
Around 50% of the respondents are satisfied with the acoustic conditions, which can indirectly influence the evaluation of the indoor climate, and 45% rate them as neutral, from which it can be concluded that the acoustics do not have a negative influence on the evaluation of the temperature in the room. Likewise, the spatial conditions, such as the size of the office, the office furnishings, or even the position of the workstation in relation to the door and window, can have an indirect effect on the perception of thermal comfort. About half of the respondents are satisfied or very satisfied with this, and 10 of the 43 employees surveyed state that they are dissatisfied with the spatial conditions. It is striking here that 8 of these 10 people have their workplace on the fourth floor.
The question about suggestions for improvement was answered by a total of only eight persons, of which only four refer to the renovation measures. Two people state that they have no suggestions for improvement, and the answers to the remaining questions suggest that they are satisfied overall with the indoor climate. The two other persons see the installation of an air conditioning system in the building as the only possibility against the high temperatures.
3.3.2. Comparison before and after Building Renovation Based on the Survey
The comparison of the condition before the renovation to the condition after the renovation is based on the employees’ statements in response to the question of whether they already feel a change regarding temperature, brightness, noise pollution, or air quality. Satisfaction or dissatisfaction with the course of the construction work is also considered here, as this could have an indirect influence on the evaluation of the measures. Out of the 43 employees surveyed, 38 made statements about the noticeability of the remediation measures.
Table 9 contains all parts of the statements regarding the change in temperature in summer divided into three categories.
Out of 28 statements listed above, 20, i.e., 72%, express that a change can be felt as a result of the renovation measures. In most cases, minor changes are perceived regarding the summer temperature. However, a few also state that it is “much cooler in summer” or that the temperature is “much more pleasant in summer”. Five staff members indicate that they do not feel any change and that they continue to find the temperature hot. Three interviewees also stated that they could not assess the effects of the renovation measures on the temperature in their office space. This is explained by the fact that the renovation was only carried out the previous year and the assessment period was not yet long enough to make a statement. This is to be considered particularly under the aspect that many of the coworkers had already worked for a very long time in this building. Two other persons state that they are not able to make a statement about the change because there were lower outdoor temperatures in the summer of 2016 than in the summer of 2015.
With regard to the change in noise pollution, it can clearly be seen from the answers from the employees that it decreased as a result of the installation of the new windows (“Much quieter than before”, “The noise pollution is lower”, “Noise pollution has been reduced by the new Windows much better-no more street noise”, “Noise since renovation as good as not audible”). Six of the people surveyed find the air quality after renovation more pleasant. The subjectivity of the evaluation is particularly evident in the different opinions of the employees regarding the facade greening. Three employees state that there are now more annoying vermin in the room and that it is darker, while two others state that the greening is “very successful” and creates a “better atmosphere”.
One third of the respondents rated the course of the construction work as neutral, another third was satisfied with the course, and one third was dissatisfied or very dissatisfied. This distribution illustrates the high subjectivity of perception.
5. Conclusions and Outlook
Thermal discomfort is expressed in the calculations according to DIN EN ISO 7730 by the percentage of dissatisfied people. For the days considered in summer 2016, this is only just under 6% for the office room on the second floor, around 15% on the third floor, and up to 60% on the 4th floor. Even though the measurements in the different rooms were not carried out on the same days, which is why a direct comparison is not possible, it can still be seen that as the building height increases, the number of dissatisfied people also increases. This is due to the different irradiation and consequent different temperatures in the room on the different floors due to shading from the building on the opposite side, but also due to the different outdoor temperatures on the different days. This is particularly evident in the large difference between the values of the third and fourth floors. In order to enable an exact comparison of the individual floors, the measurements in further investigations would have to be carried out in the same period if possible. Long-term measurements would also be helpful in order to be able to make statements about the temperature curve. However, these are not absolutely necessary for assessing thermal comfort in summer.
For the exact and calculated determination of the thermal comfort, the local discomfort, for example caused by drafts or vertical temperature differences, should also be taken into account. For further investigations, it is necessary to consider which accuracy of the investigation results justifies which effort in terms of proportionality.
Based on the available evaluation, it can be stated that at the time of the measurements, strong thermal discomfort prevails on the fourth floor. On the second floor and the third floor, the percentage of dissatisfied people is quite low, which means that the condition is evaluated as thermally comfortable.
The evaluation of the completed questionnaires offers an unsatisfied to neutral impression of the employees of the indoor climate. In part, the answers of the respondents reflect a resignation towards the perceived hot temperature in the building, as for example in the statement “I don’t feel any change at all, only that it was too hot. It will never change.” Especially the possibility of individual influence on the regulation of the temperature is crucial [
40], which is only given to a limited extent in the considered office building. Every person is familiar with the conventional solution for room cooling via air conditioning. If this is not available, there may be a feeling in times of particular heat that not everything has been done to make the situation more bearable. This possibly results in more dissatisfaction [
34]. However, as already mentioned, filling out the questionnaire only gives a general impression; a personal interview could have provided more information about the individual situation. To obtain an optimal result of the survey and thus a sufficient basis for a comparison, this should be carried out in further investigations as a personal interview with the employees on the day on which the measurements also take place or immediately afterwards and should include an exact description of the situation (weather, mood, etc.) by the person carrying out the interview. In this way, the statements are much more likely to relate exactly to the period under consideration, and a more precise description of the users’ behavior would also be possible. Further questions related 35 to the time of perceived glare from sunlight and the associated behavior of the users regarding the artificial light could also be included. In addition to this, it is to be noted that certain limitations of the survey exist, due to the limited number of employees.
Among the other possible influences, lighting conditions were examined in addition to air quality and acoustics. Regarding daylight and artificial lighting conditions, a total of 80% of employees are neutral or satisfied. The majority also express neutrality or satisfaction regarding spatial conditions and air quality. Acoustic conditions are rated as satisfactory by 50% of the employees. It should be especially noted here that the positive change due to the new windows is mentioned very frequently. Interactions with thermal comfort of these three mentioned influences could be more clearly highlighted or refuted in a larger survey via further statistical analysis. Based on the existing small sample, this is not possible with great significance. The temperature in the office building is described as ‘warm’ to ‘hot’ both after evaluation of the measurement data for the fourth floor and the questionnaires. Due to the associated dissatisfaction of the users, the thermal comfort is not given.
However, it should be emphasized that about 70% of the employees’ statements speak about noticeable positive changes due to the renovation measures. In addition to that, the plants of the facade greening were quite small at the moment of investigation. It is to be expected that the density of the greening will increase in the coming years and that more meaningful results can be obtained after a renewed measurement with possibly a connected survey about the effect of the facade greening and its cooling and shading effect. Additionally, as described in
Section 2.1, the through-bound greening system was purposefully constructed in a manner such that particular segments have a different shading effect depending on the position of the sun, without impairing the free view through the windows. When it comes to the comparison of the greening system introduced in this work and other known vertical greening systems, there is no direct transferability given. In order to analyze the adequacy and compare the possible solutions, further investigation is required and planned in future work and assessments.
Furthermore, it is worth mentioning that the problem-solving of this topic indeed aligns with the expectations of goals of The Sustainable Development Agenda that were adopted by all UN Member States in 2015 [
41]. Nowadays, progress is being made in many places and the usage of vertical green living wall systems is indeed contributing to advancing towards more sustainable cities and communities, as well as lowering the energy use, by proposing alternatives for air conditioning.


