Article

How Compatible Are Western European Dietary Patterns to Climate Targets? Accounting for Uncertainty of Life Cycle Assessments by Applying a Probabilistic Approach

1
Institute of Geography, University of Cologne, 50923 Cologne, Germany
2
Wuppertal Institute for Climate, Environment and Energy, 42103 Wuppertal, Germany
*
Author to whom correspondence should be addressed.
Sustainability 2022, 14(21), 14449; https://doi.org/10.3390/su142114449
Submission received: 14 September 2022 / Revised: 27 October 2022 / Accepted: 29 October 2022 / Published: 3 November 2022
(This article belongs to the Special Issue Quantitative and Multi-Dimensional Assessment of Sustainable Diets)

Abstract

:
The food system plays a crucial role in mitigating climate change. Even if fossil fuel emissions are halted immediately, current trends in global food systems may prevent the achieving of the Paris Agreement’s climate targets. The high degree of variability and uncertainty involved in calculating diet-related greenhouse gas emissions limits the ability to evaluate reduction potentials to remain below a global warming of 1.5 or 2 degrees. This study assessed Western European dietary patterns while accounting for uncertainty and variability. An extensive literature review provided value ranges for climate impacts of animal-based foods to conduct an uncertainty analysis via Monte Carlo simulation. The resulting carbon footprints were assessed against food system-specific greenhouse gas emission thresholds. The range and absolute value of a diet carbon footprint become larger the higher the amount of products with highly varying emission values in the diet. All dietary pattern carbon footprints overshoot the 1.5 degrees threshold. The vegan, vegetarian, and diet with low animal-based food intake were predominantly below the 2 degrees threshold. Omnivorous diets with more animal-based product content trespassed them. Reducing animal-based foods is a powerful strategy to decrease emissions. However, further mitigation strategies are required to achieve climate goals.

1. Introduction

The objective of the Paris Agreement to restrict the global temperature increase to 1.5 or 2 degrees above pre-industrial levels demands a fast reduction of greenhouse gas emissions (GHGEs) [1]. Although reducing emissions from fossil fuels is essential to achieving this goal, a recent study shows that even if fossil fuel emissions are halted immediately, current trends in global food systems may prevent the achievement of global climate goals [2]. While the food system already contributes to emissions substantially, by 2050, absolute agriculture-related GHGEs are projected to more than double due to population rise and dietary shifts [3]. Scientific consensus exists that dietary changes can offer substantial reduction potentials [4,5,6]. Likewise, the EU’s Farm to Fork Strategy explicitly includes the promotion of sustainable diets, in addition to the objective of promoting sustainable practices in production and food processing [7]. The more a diet is based on plant-based rather than animal-based products, the lower that diet’s carbon footprint (CF) [8,9]. When comparing protein sources, all plant-based foods were found to underscore GHGEs of animal-based products [6]. Clear tendencies can be observed: Vegan diets display the lowest CFs, followed by vegetarian and pescetarian diets while increasing the proportion of meat in a diet results in higher CFs [10,11,12,13,14,15,16,17,18,19,20,21]. Shifting to (mainly) plant-based diets can lead to CF reductions of up to 60% [4,22].
The high degree of variability and uncertainty involved in different levels of calculating diet-related GHGEs limits the evaluation of reduction potentials. In life cycle assessments (LCAs), which often supply food item GHGE values feeding into diet CF calculation, variations arise, for instance, within data collection, aggregation, and processing [4,22,23]. Studies identified large ranges for GHGEs of animal-based foods (cf. [24,25]), indicating high variability and uncertainty. Variations in GHGEs calculated for animal-based foods appear to be much larger than those for plant-based commodities [24,25]. Also, food quantity data, feeding into diet CF calculation, can substantially influence outcomes [4]. Despite the uncertainty associated with CF results, upscaled and uncertain projections rely mainly on these results, which “is a bit like flying to Mars before having invented the wheel” as Finkbeiner et al. ([26], p. 92) state. Investigations that feed probability distributions for GHGEs of animal-based products into the calculation are required to quantify uncertainty and variability in diet CFs. Uncertainty assessment methods (probabilistic simulation [27], Bayesian statistics, fuzzy methods, non-parametric and robust statistics, neural networks [28], pedigree matrix [29], and Gaussian error propagation [30]) allow the quantification of the climate impact of dietary habits and the corresponding potential of reduction strategies. To enhance the reliability of results, diet CFs should be indicated and discussed with uncertainty outcomes rather than displaying them as discrete values [5]. One way of doing so is to create probabilistic simulations for diet CFs by feeding the probability distributions of parameters into the calculation [27]. Creating intervals of input values helps to overcome the limitations of (seemingly) exact values and aids in accommodating complex natural systems [31].
Many studies ignore uncertainty in their calculation processes, which can lead to error-prone results that do not reflect the spectrum of possible outcomes. Few studies display uncertainties in their results [15,17,32,33,34]; only one study has fed probabilistic distributions of food item GHGE ranges into their calculation [16]. There are studies benchmarking emissions of the food system to climate goals [2,35,36,37]. However, they only regarded average diets, they did not downscale climate targets to thresholds available for the food system or they did not regard both 1.5 and 2 degrees global warming limit. The question remains how to achieve these concrete, tangible, political goals when the impact of a sector, in this case, the food sector, is so uncertain? The same applies to GHGE mitigation strategies. Decision-makers can only develop impactful measures to achieve these goals when they have robust, consistent, transparent, and comprehensible information. Also, robust suggestions for adapted individual consumption patterns are only possible if more than one diet is quantitatively evaluated. While studies on evaluating individual consumption patterns against different climate goals are available for other sectors [38,39], they are lacking for the food sector.
Therefore, this study quantified the climate impact of diets with uncertainty as well as evaluated the gaps between them and global warming targets. The outcomes help to understand a dietary pattern’s climate impact and thus derive mitigation strategies to stay below global warming thresholds. Western dietary patterns, in particular, are characterised by comparatively high GHGEs and are important to target for emission reductions in the Global North [10,12,13,14,15,18]. This is why the study at hand focuses on Western European dietary patterns (Austria, Belgium, Luxemburg, France, Germany, Liechtenstein, Monaco, the Netherlands, and Switzerland [40]). Dietary shifts to more plant-based diets are regarded as adequate climate change mitigation measures for the Global North without endangering food security [41,42].
This study assesses the climate impact of Western European dietary patterns against global warming thresholds while accounting for uncertainty and variability in GHGEs of animal-based products. It identifies probabilistic distributions for CFs of Western European dietary patterns, namely three omnivorous types, differentiated according to meat consumption frequency, as well as a vegetarian and vegan dietary pattern. To serve decision-making targeted at GHGE reductions, the aim of this study is (I) to identify probabilistic ranges of annual diet CFs for Western Europe considering GHGE probability distributions for animal-based food categories, and (II) to compare the GHGE of diets to food system specific 1.5 and 2 degrees GHGE-thresholds per capita until the end of the 21st century. The outcomes serve as guidance toward GHGE mitigation measures. Based on this, innovative and effective policy recommendations can contribute to a more sustainable food system.

2. Background: Uncertainty and Variability

Both LCA and subsequent diet CF calculation can never fully and accurately represent the entire complexity of reality as they are based on models that depend on data inputs, methodologic choices [43], and simplifications [24]. Input data are already subject to uncertainty and variability, but modelling processes comprise uncertainty as well [25]. Uncertainty exists when the information about the correct value is lacking, e.g., if data or processes to determine a parameter are incorrect or missing [25,28]. Variability relates to the immanent heterogeneity of data [25,28].
Uncertainty and variability arise from three sources, respectively [23]: Parameter uncertainty is caused by empirical errors such as inaccurate measurements, leading to unrepresentative or outdated data or lack of measurements. Model uncertainty relates to information loss due to modelling choices like aggregation, e.g., when it comes to spatial or temporal features. It also arises because of simplification, inter alia induced by choosing a linear model for non-linear relationships [23]. Uncertainty due to choices or scenario uncertainty [44] emerges inter alia in relation to the selection of system boundaries, functional units, and allocation for the LCA at hand [23]. Spatial and temporal variability arise since chemical and physical processes vary across different localities and times and can never be fully known. Aggregation of spatially and temporally variable data can therefore create further model uncertainty [23]. In addition, there is variability between sources and objects. This refers to the inherent variation of input and emission sources evaluated in LCAs [23]. There can be variability due to uncontrollable reasons such as soil, weather, and plant health conditions [25]. Also, varying production systems lead to different GHGE quantities [22]. Compared to intensive systems, extensive beef production may quadruple GHGEs, for example. Packaging, storage type, and the extent to which a product has been processed also alter the GHGE inventory [45]. Frozen vegetables cause three times more emissions than unfrozen equivalents [22].
Despite standardisation and other measures possibly limiting the impact of uncertainty and variability, uncertainty can never be entirely reduced. So, when precise advice results from outcomes disregarding uncertainty a misleading feeling of certainty is caused [46]. Thus, rather than displaying results in the form of single, absolute numbers, diet CFs should be indicated and discussed with uncertainty outcomes to assess their reliability and enhance information on diet CFs [5]. Such procedures increase the outcome’s likelihood of containing the true value.
The majority of existing diet CF studies, however, calculated footprints deterministically and presented results as point values (cf. [13,19,47,48,49,50,51,52]). Only a few accounted for uncertainty or variability, some of which used top-down or hybrid approaches (cf. [53,54]). In LCA-based studies, some indicated results displaying standard deviations of diet CFs based on LCA data [32], or food consumption habits surveyed [15,17,33,34]. One study used uncertainty analysis via a pedigree matrix to retrieve probabilistic distributions for food item GHGEs but still indicated diet CFs as precise values [29]. Another investigation incorporated the variability of food item LCAs in diet CFs via probabilistic Monte Carlo (MC) simulation [16]. They allocated probability distributions to food item GHGE ranges, which they had compiled from the literature and databases. After conducting the MC simulation and interlinking data with surveyed French food consumption amounts, they retrieved a probability distribution for the French diet CF. However, in their study, the effects causing the variation cannot be traced to dietary patterns as they used unaggregated individual dietary consumption data. So, it cannot be determined if a high diet CF resulted, e.g., from eating large quantities of food, or from consuming food items with high carbon intensities. Therefore, our study quantitatively accounted for LCA-related uncertainty and variability in diet CF results, while distinguishing dietary patterns to create a meaningful CF analysis and enable the development of mitigation strategies.

3. Material and Methods

The procedures applied were derived from decision analysis approaches [31,44,55,56] and combined with the adjusted procedures of Vieux et al. [16]. A literature review for animal-based product GHGEs was conducted to create value ranges. Probability distributions were created from these ranges, feeding into diet CF calculation. An uncertainty analysis via MC simulation generated probability distributions for diet CFs. Finally, benchmarking to the 1.5 and 2 degrees global warming emission thresholds was conducted.

3.1. Data Preparation and Processing

The calculation of dietary pattern CFs was based on the SUSLA calculator. It was developed within the research project “The Sustainable Lifestyles Accelerator (SLA)” funded by the KR Foundation and can be found under https://susla.app/ (accessed on 23 February 2021). The annual food balance sheets of the Food and Agriculture Organisation of the United Nations (FAO) for Western Europe [57] provided food quantity data. They provide food amounts supplied to a region in a year. Domestic food production is combined with imported goods and altered according to stock changes and the share of food available for human diets [57]. The food balance sheet data was adjusted to match per capita consumption of different dietary patterns: A vegan diet (no animal-based products at all), a vegetarian diet (including eggs and dairy, but no meat and fish) as well as three diets differing in meat consumption frequencies (O_low: 1–2; O_medium: 3–4; O_high: 7 meat portions per week; for more details see Appendix A). The FAO food supply data does not indicate data for beverages such as soft drinks, fruit juices, plant-based milk, and bottled water. Therefore, for all drinks but milk, Swiss and German SUSLA user data [58] was used to estimate the average amount consumed per dietary pattern to ensure data coherence. In total, 1000 Swiss and German data sets from January 2020 until March 2021 were available: 81 for Vegan, 250 for Vegetarian, 421 for O_low, 191 for O_medium, and 57 for O_high. Even though SUSLA user data is not representative, this approach is regarded as a suitable compromise since it includes beverages, in contrast to some diet CF studies that either disregard drinks [16,18], or exclude certain beverages [12]. Table 1 displays the consumption amounts of O_medium (corresponding to the average Western European diet) and the percentual deviations of the other diet types from these amounts. In general, the more plant-based a diet, the higher the amounts of beans, nuts/seeds, rice, potatoes, cereals, vegetables, fruits, and milk alternatives. The opposite was the case for wine, beer, coffee, and juice, as well as oils/fats.
GHGEs for plant-based products were taken from Teubler & Bienge [59], while probability distributions derived from an extensive literature review (see below) provided GHGEs for animal-based products. The GHGE values were aggregated to match the categories of the food quantity data.

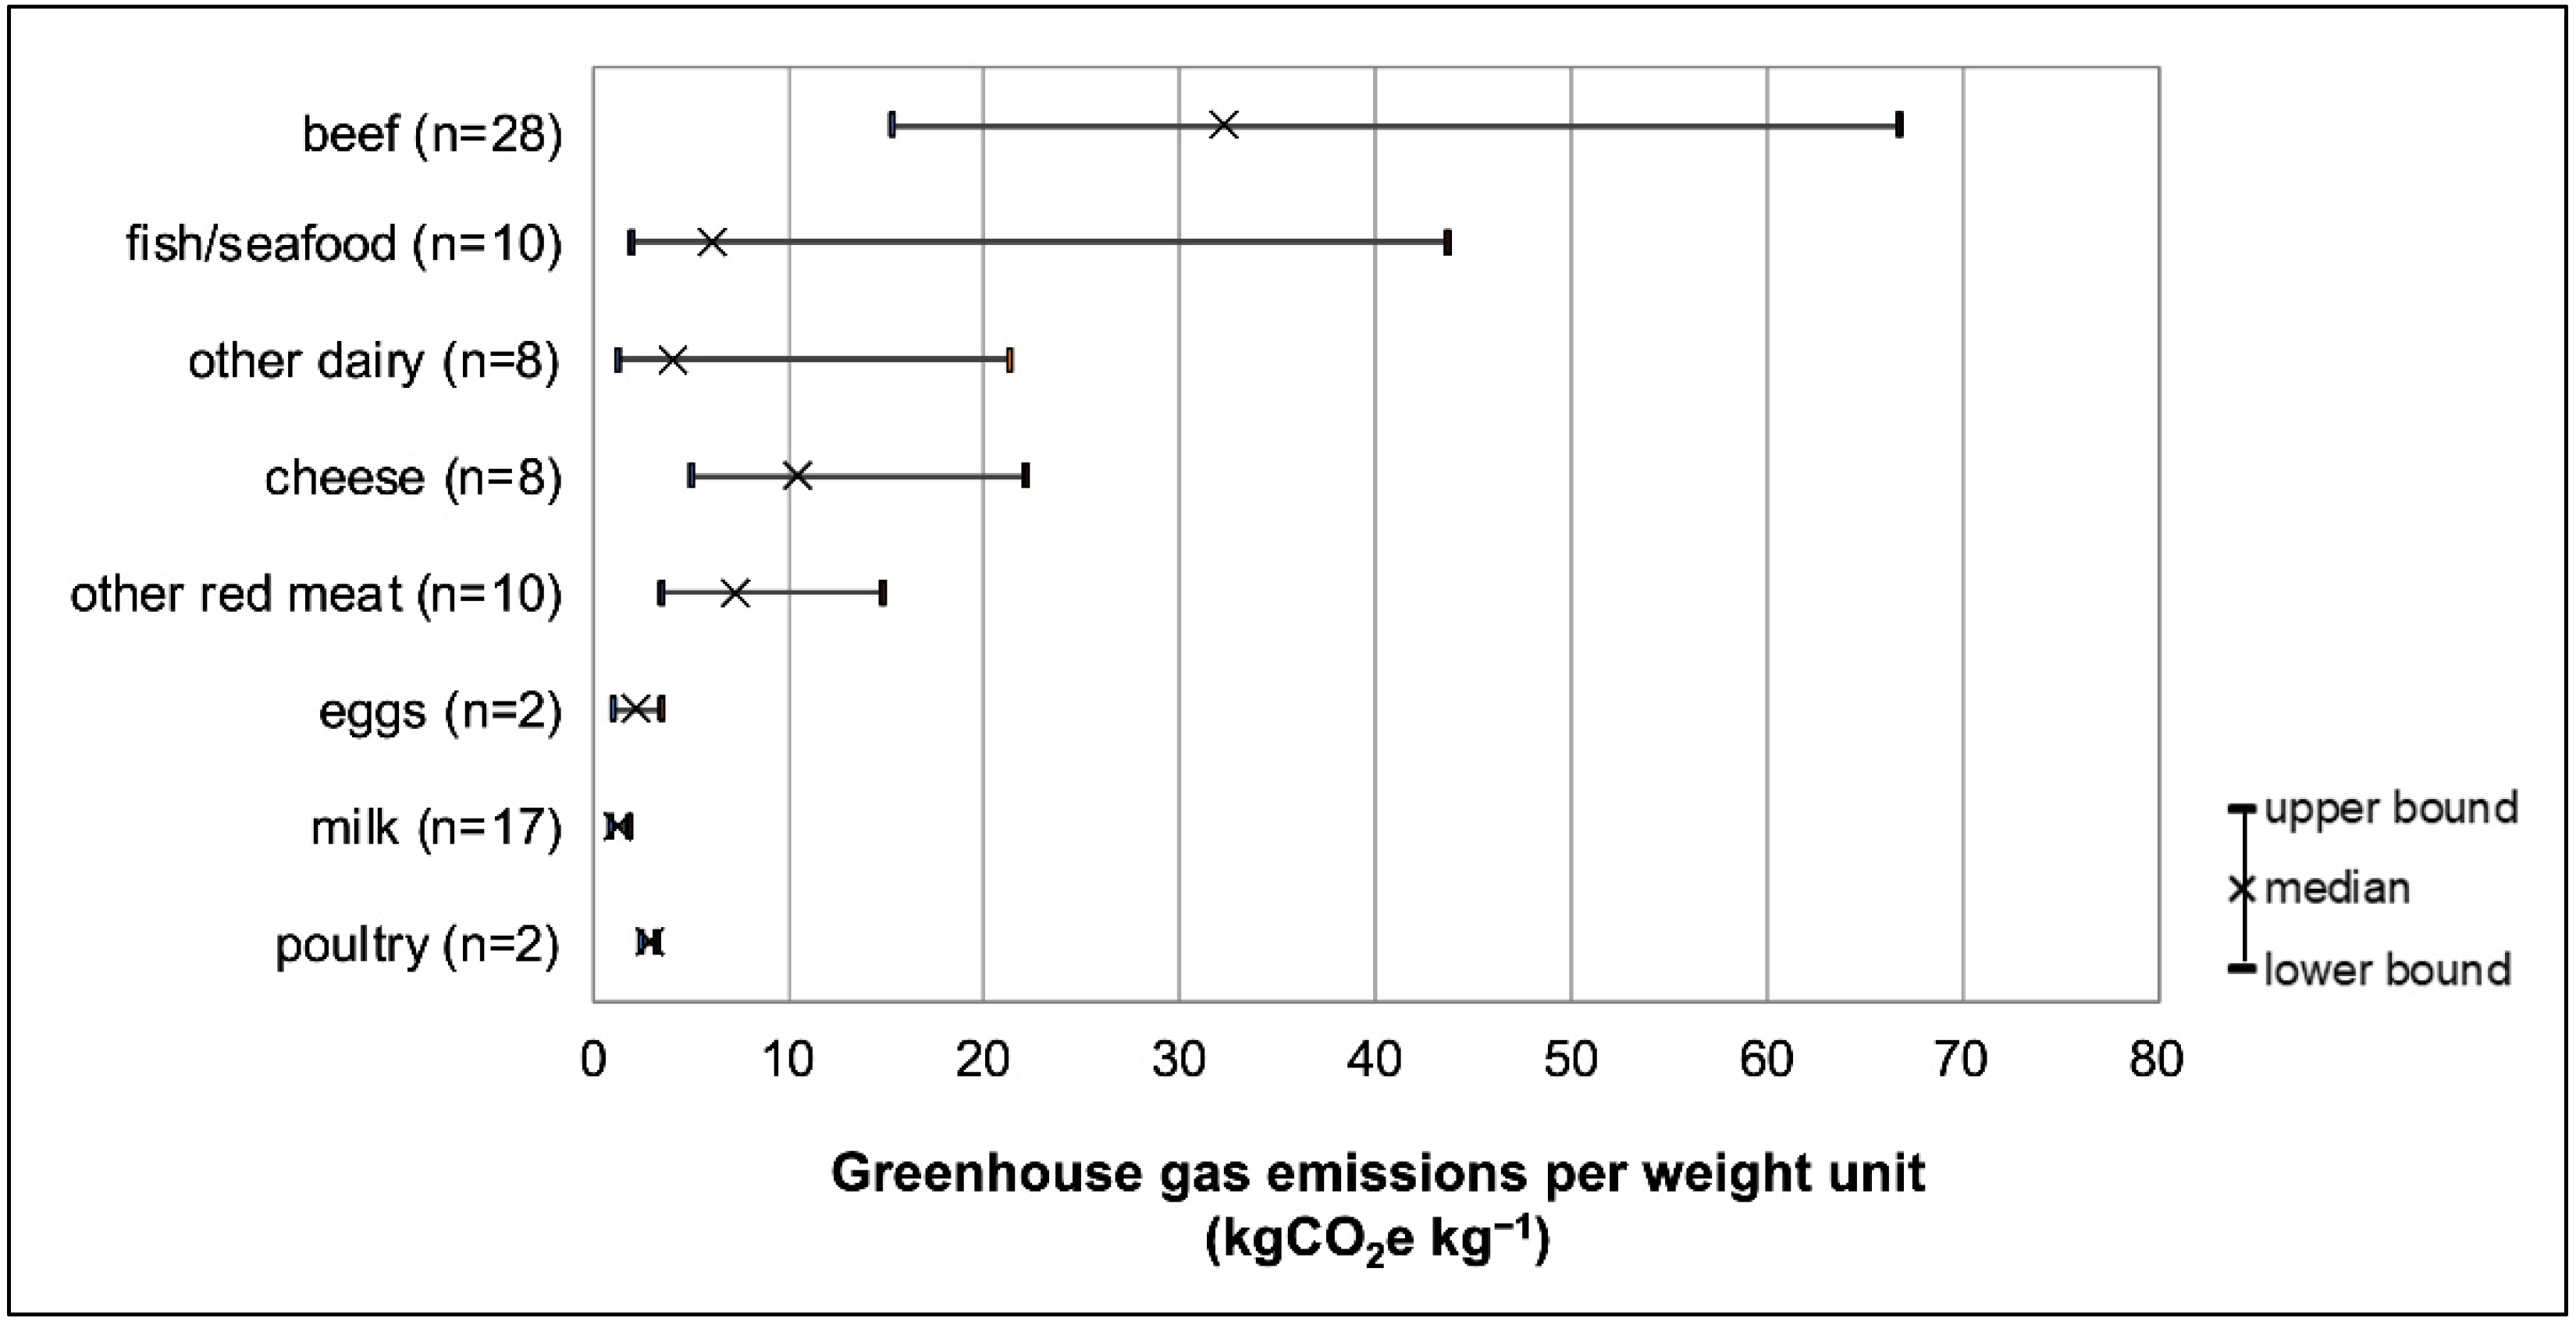
3.2. Determining Ranges for High-Impact Food Category GHGEs

As animal-based products have a high impact on the diet CF [4,13,16,20,48], LCA ranges were compiled for the categories beef, pork (representing other red meat), poultry, fish/seafood, eggs, cheese, milk, and other dairy products. Since GHGEs for plant-based products are comparatively low and less uncertain [61], they fed into the model as point values. A systematic literature review based on [62] was carried out to obtain multiple GHGE values per animal-based product category from LCA studies and reviews. Preferably, they were supposed to cover different production systems and differing food products within food categories to account for product diversity.
For the review, the online scientific literature databases Web of Science and ScienceDirect were used. The search inquiry was run in February 2021 and combined keywords regarding climate impact, food items, and the regional scope ((food* OR “animal-based product” OR “bovine meat” OR “ruminant meat” OR beef OR pork OR pig OR poultry OR chicken OR broiler OR egg OR dairy OR milk OR butter OR cheese OR fish OR seafood) AND (“GHG emission” OR “Life Cycle Assessment” OR LCA OR GHG* OR “greenhouse gas*” OR “climate impact” OR “carbon footprint” OR “greenhouse gas emission*”) AND (Austria* OR German* OR France OR French OR Monaco OR Netherlands OR Dutch OR Switzerland OR Swiss OR Belgium OR Belgian OR Luxemburg OR Liechtenstein OR Europe* OR “Western Europe”). Since the conversion factor for methane to carbon dioxide equivalents (CO2e) was updated in 2013, the review was limited to papers published from 2013 onwards. The search yielded 2718 results after removing duplicates. After filtering titles for relevance, the abstracts were scanned so that 78 articles were included for further revision. Checking these articles for relevant sources which they refer to identified a further 43 papers adding up to 121 papers available for final review.
The aim was to obtain GHGE data for which the underlying LCA methodology is as similar as possible since different method choices can have large effects on GHGE outcomes [63]. Articles retrieved then were filtered regarding adherence to the following criteria:
  • Spatial reference: Western Europe (based on selected countries).
    Since the diet CF is calculated for Western Europe, only LCA studies for Western European countries or regions were included.
  • LCA type: Attributional.
    To ensure comparability, LCAs following a consequential approach were excluded from the review. Many studies did not indicate explicitly that they apply an attributional approach but were assumed to do so for pragmatic reasons.
  • System boundaries: Cradle-to-farmgate.
    The scope was chosen because most food products’ GHGEs arise up to the farmgate [64]. Even though ideally, emissions from the entire life cycle should be regarded, data availability is limited for LCAs extending beyond the farmgate [65]. For cheese and other dairy products, dairy processing is also included in the GHGE values.
  • Emissions from land-use change and soil carbon sequestration: Not included.
    As most studies did not include emissions from land use change and soil carbon sequestration, only GHGE values that exclude these sources and sinks were incorporated to ensure comparability. When there was no clear indication, it was assumed that they disregarded these factors.
  • Functional unit: kgCO2e kg−1.
    Only studies indicating emissions per weight unit were chosen as this is the most widely used functional unit. If necessary, values were converted to kgCO2e kg−1. For meat and fish, units were adjusted to emissions per bone- and skin-free meat when carbon intensities were given per live- or carcass-weight (see Clune et al. [66] for conversion factors).
Applying these criteria, 11 studies were identified for compiling food category GHGE ranges. The main exclusion criterion was the conversion factors since many studies published after 2013 still used the old factor. Two studies [47,67] updated the food GHGEs from studies that had used the old factor. To include their converted values and cover a larger variety of production systems and food types, the review’s spatial scope was extended from Western European to all European countries. For those studies for which the conversion factor was updated, the limitation to only include studies from 2013 was removed. This process added 19 studies, which led to a total of 30 studies [47,68,69,70,71,72,73,74,75,76,77,78,79,80,81,82,83,84,85,86,87,88,89,90,91,92,93,94,95,96] (see Table S1, supplementary material). The smallest (largest) LCA value was assumed to be the lower (upper) bound of the GHGE range’s 90% confidence interval. Additionally, the median was calculated to fit the probability distribution assigned to this range.

3.3. Creation of High-Impact Food Category Probability Distributions and Benchmarking to Global Warming Targets

For model implementation, an uncertainty analysis via MC simulation was conducted, combining approaches from Vieux et al. [16] and decision analyses [31,46,55,56]. MC simulation has been frequently applied to quantify uncertainty in environmental contexts and complex natural systems [27,31]. From the literature review, a range of food item GHGE values were included to create a probability distribution and display the uncertainty and variability of inputs in the calculation. Therefore, the procedure increases the outcome’s likelihood of containing the true value.
MC simulations repeatedly select a random value from a given probability distribution to calculate as many output values as values that were retrieved [30]. This study allocated log-normal distributions to all ranges identified, simultaneous to the study of Vieux et al. [16], and ran the model 10,000 times. A generic formula was created in which food consumption data were multiplied by the food categories’ GHGE values and then summated to retrieve the diet CF. GHGEs for plant-based food items, MC simulation results for animal-based foods’ GHGEs and diet-specific consumption amounts fed into the generic formula to calculate the diet CF distribution for each dietary pattern (Vegan, Vegetarian, O_low, O_medium, and O_high). The CFs for all dietary patterns except the vegan scenario were displayed as probability distributions and thus gave the likelihood of different outcomes. The vegan diet CF was given deterministically since animal-based product consumption was zero. The uncertainty analysis was realised by applying the decisionSupport package [97], implemented in the R programming language and environment [98,99]. For visualisation, R package ggplot2 [100] was used.
The diet CFs were benchmarked to the average global per capita CO2e-thresholds for reaching the 1.5 and 2 degrees global warming targetsuntil the end of the century. Based on Clark et al. [2], the GHGE amount available for non-food emissions from 2020 to 2100 was subtracted from the total available GHGE thresholds for this timeframe. They compiled the thresholds assuming to meet the 1.5 and 2 degrees global warming target by a 50% or 67% chance, respectively. Non-food emissions were supposed to meet net-zero in the year 2050, which corresponds to EU targets [7]. This led to the 50% and 67% probability limits for global GHGEs available for the food system for the years 2020 to 2100. Dividing these thresholds by the average population projected from 2020 to 2100 [101] led to annual per capita thresholds, used for benchmarking previous modelling results.

4. Results

4.1. Ranges for Animal-Based Food GHGEs and Modelled Dietary Pattern CFs

Figure 1 illustrates the animal-based food GHGE ranges feeding into the model. Regarding the median, beef displayed the highest GHGE value which was three times higher than the median for cheese, showing the second highest median for carbon intensities in animal-based products. Their medians are followed by other red meat, fish/seafood, other dairy, poultry, eggs, and milk. The largest range was found per unit of beef (n = 28). Fish/seafood (n = 10) displayed the second-largest value span. Milk (n = 17), poultry (n = 2), and eggs (n = 2) displayed the narrowest ranges, feeding into the model.
The vegan diet (Vegan) had the lowest climate impact, amounting to 612 kgCO2e (Figure 2). For dietary patterns with a probabilistic simulation, Vegetarian had the smallest CF values and the narrowest 90% confidence interval (763 to 1282 kgCO2e), followed by O_low (917 to 1580 kgCO2e) and O_medium (1812 to 3491 kgCO2e), while O_high (2378 to 5110 kgCO2e) showed the highest CF values and the widest spread distribution (see Table A2 for details on the confidence intervals). The vegan diet was the diet with the lowest, and the omnivorous diet with daily meat consumption was the diet with the highest, climate impact. The confidence interval widths increased alongside the animal-based food content from Vegetarian to O_high. O_low and Vegetarian CF distributions were much narrower than O_medium and O_high because the highly varying ranges of meat products and fish/seafood were only present in low or no amounts. So, the variation was attributable to dairy and eggs, which also displayed much smaller GHGE ranges compared to meat and fish/seafood. O_low displayed a wider probability distribution than Vegetarian due to larger uncertainty feeding into the calculation. This was because of higher animal-based product content in the diet in general and the prevalence of meat products and fish/seafood, which were not present in the vegetarian diet at all. Both weight-contribution and the width of the respective food GHGE distribution were crucial for the width and absolute amount of final diet CF distributions. The range and the absolute values of a diet carbon footprint distribution become larger the higher the amount of products (such as beef, fish/seafood, cheese, and other dairy) with highly varying emission values in the diet.

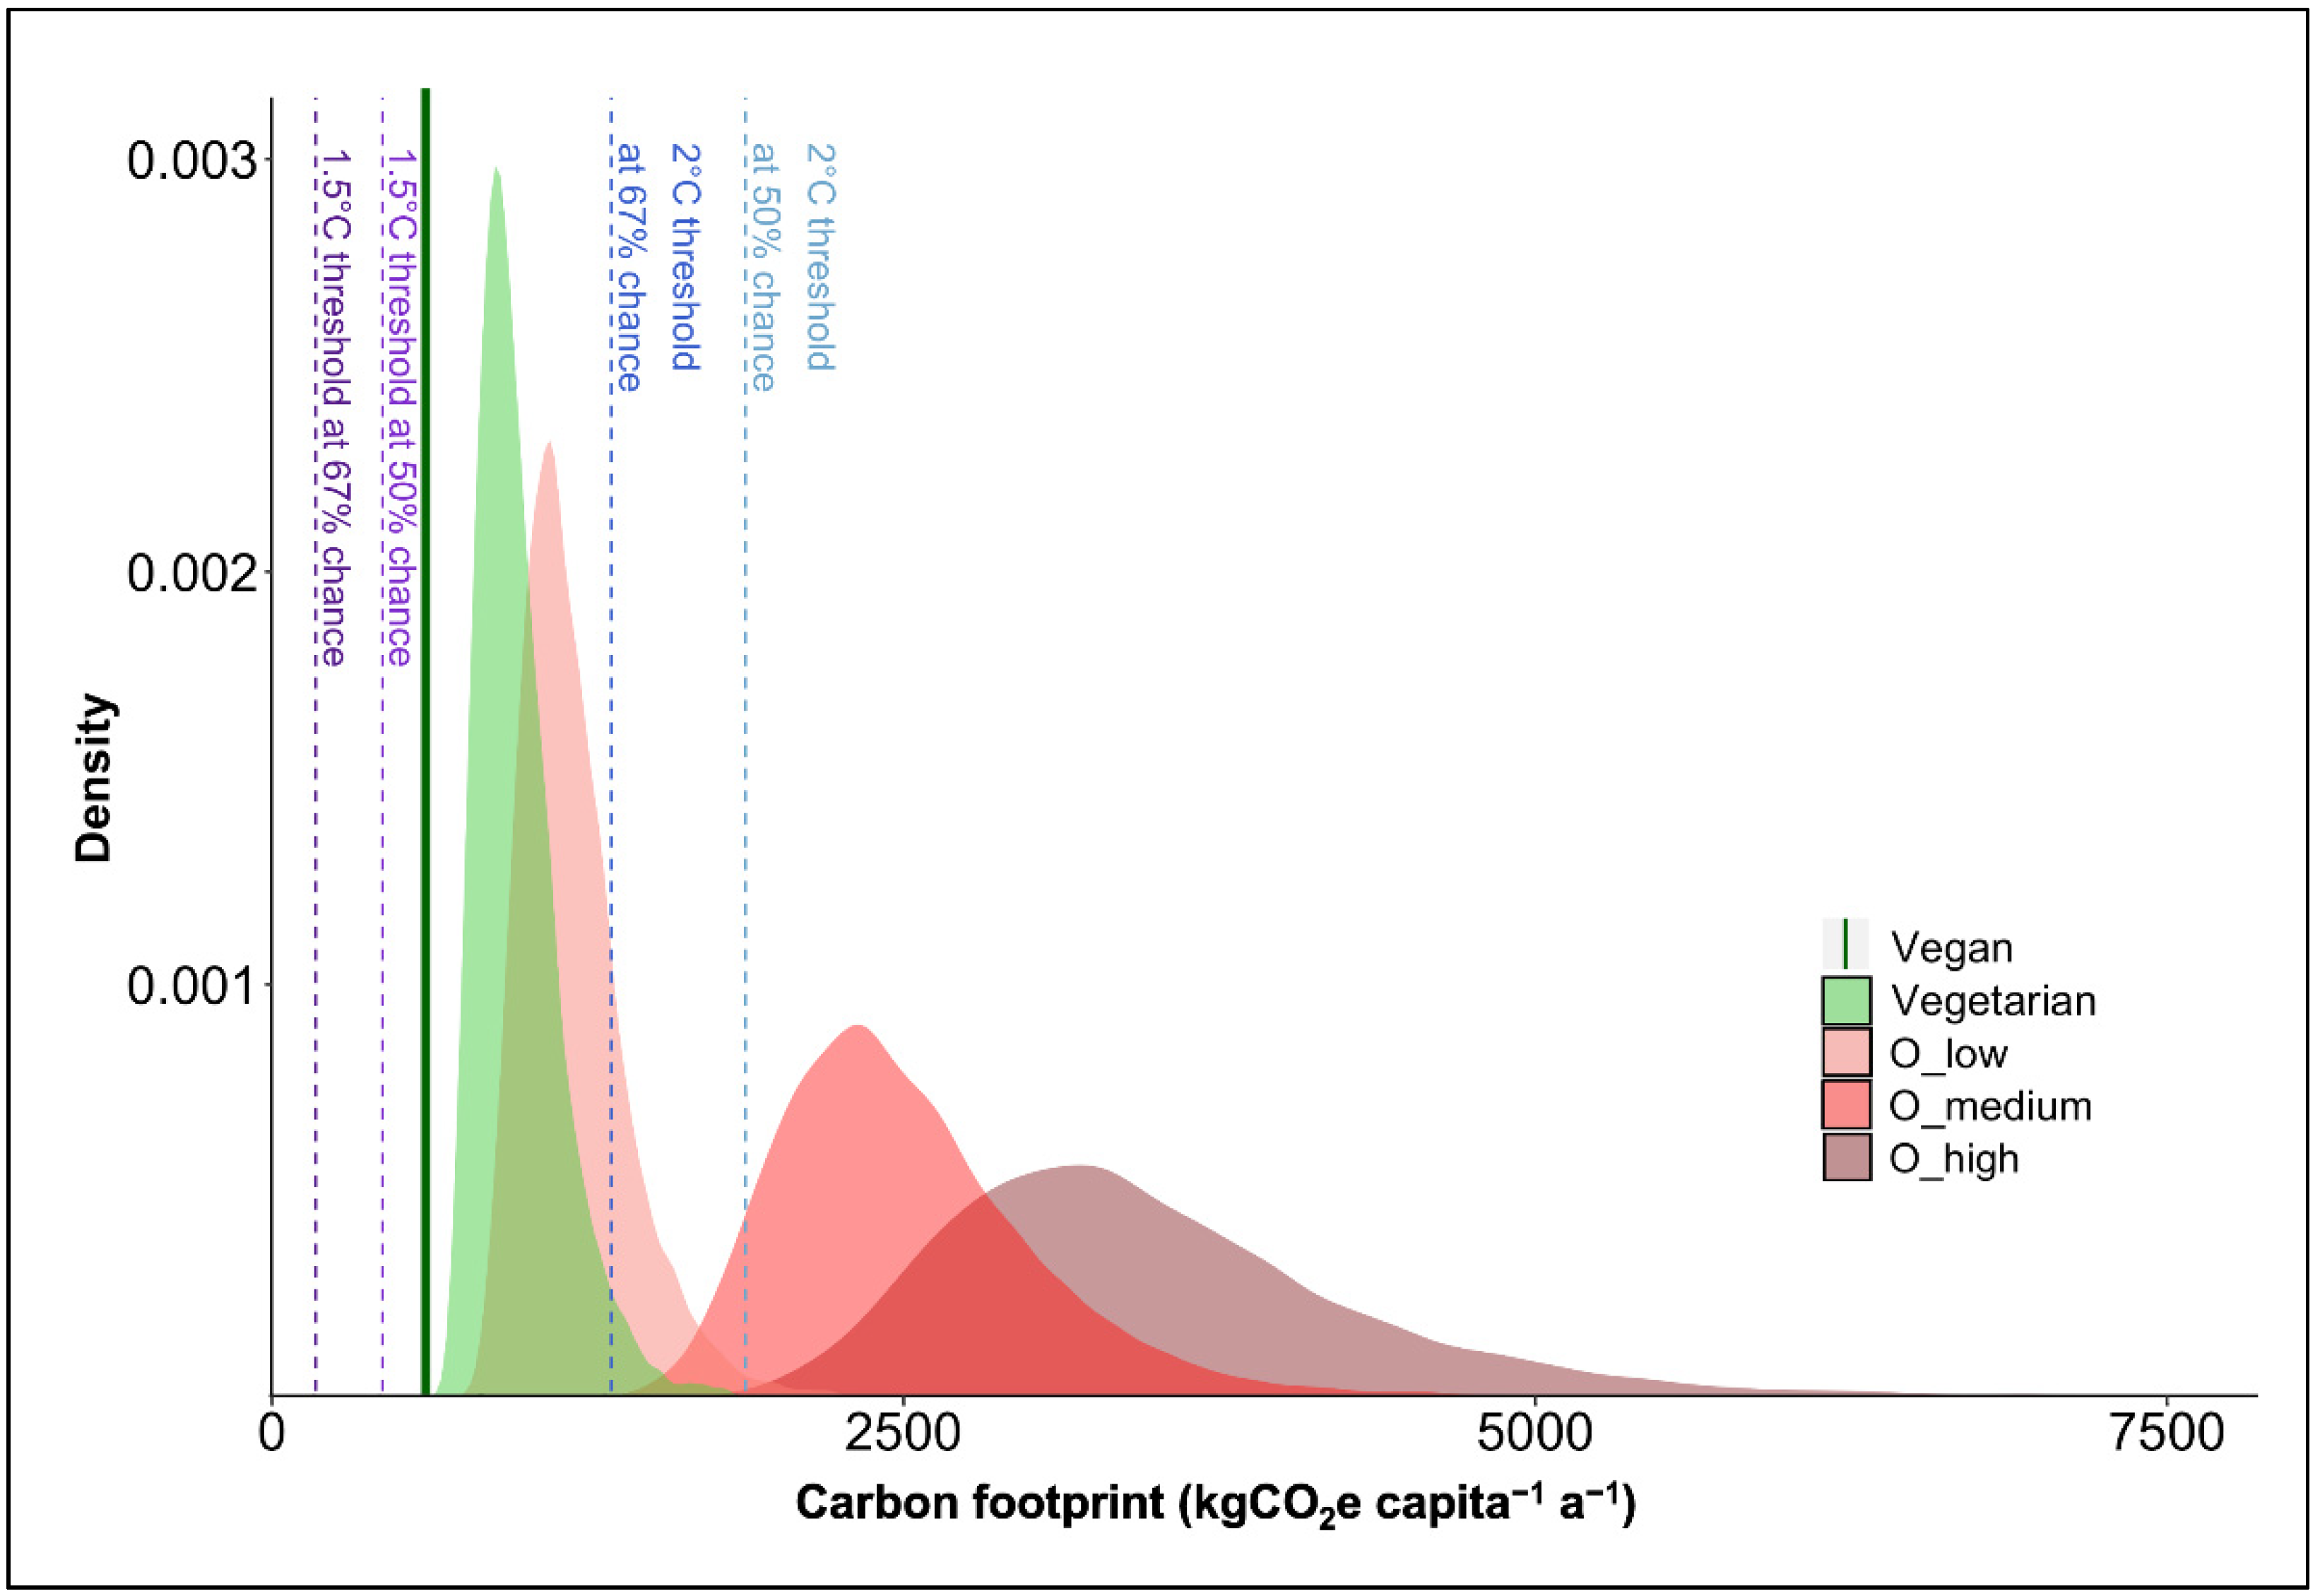
4.2. Benchmarking Dietary Patterns to Global Warming Thresholds

Figure 2 also displays the per capita threshold for the food system to maintain global warming below 1.5 degrees (2 degrees) until the end of the 21st century. The emissions allocated to the food system amount to 169 kgCO2e (1339 kgCO2e) when the chance of not exceeding the global warming threshold is set at 67% chance. The threshold increased to 434 kgCO2e (1870 kgCO2e) when the chance was reduced to 50%. All CFs exceeded the 50% chance 1.5 degrees global warming limit by at least 185 kgCO2e. O_high’s distribution and most of O_medium (93%) surpass the 50%-chance 2 degrees threshold while Vegan and Vegetarian as well as almost the entire O_low distribution (99%) were below the limit. For the 67% chance 2 degrees threshold, the Vegan CF distribution remains lower than the threshold as does most of Vegetarian (96%) and O_low (80%). The dietary patterns containing more animal-based products all exceed the limit entirely. This means that the average Western European diet (O_medium) and a high-meat diet (O_high) exceed the 2 degrees global warming thresholds. All current dietary patterns exceed the thresholds available for the food system to limit global warming below 1.5 degrees.

5. Discussion

5.1. Probabilistic Ranges of Modelled Dietary Pattern CFs

This study showed that the lower the animal-based, and the higher the plant-based, food content of a diet, the lower the CF. This is in line with the literature findings [10,11,12,13,14,15,16,17,18,19,20,21]. The increase in diet CFs, going from plant-based (Vegan) to diets with high animal-based product contents (e.g., O_high) arose from increased consumption of food categories with comparatively high GHGEs.
Even though O_low still contains some meat and fish/seafood (Table 1), it yielded substantial emission savings and displayed a similar CF to Vegetarian. Therefore, food categories must not be excluded entirely to achieve substantial emission reductions, confirming conclusions in the literature [18,102]. However, the findings of our calculations must be regarded cautiously since O_low displays very small amounts of meat consumption, translating to only occasional consumption, e.g., approximately one small beef steak per month.
Emissions from meat consumption arise directly from livestock farming, especially methane and nitrous oxide from cattle breeding. Also feed requirements contribute to high GHGEs. For one calorie of meat, multiple calories of feed have to be provided [9]. With few exceptions, plant-based products have lower GHGEs than those animal-based products with the lowest GHGEs, e.g., milk and eggs. Plant-based products with relatively high GHGEs are some vegetables grown in heated greenhouses, alcohol (which has a high processing intensity), and rice, whose wet cultivation causes high methane emissions [65,103]. Nevertheless, plant-based foods have comparatively low GHG intensities. Even if plant-based products with comparatively high GHGEs are consumed more in diets when switching from O_high to Vegan, they do not outweigh the effect caused by reducing animal-based foods.
Therefore, this study supports literature findings indicating that replacing animal-based foods with plant-based products contributes to climate goals [4,10,16,104,105]. Conversely, this study rejects findings of increased CFs due to larger vegetable and fruit quantities [16]. This is because the meat was substituted based on weight and not in an isocaloric way.
The diet CF probability distributions’ shapes evolved due to the log-normal probability distributions for animal-based product GHGE values that fed into the model. The literature and the model (when medians are regarded) agree that per weight unit beef, cheese, and other red meat cause the highest carbon emissions and that particularly beef displays by far the highest GHGEs [4,13,16,20,48]. The outcomes of this study confirm findings [61] in which beef displayed the largest GHGE range, followed by fish/seafood. Equivalent to our study, they found much narrower ranges for cheese, pork (comparable to other red meat), poultry, eggs, and other dairy. Additionally, another study [103] found particularly highly varying carbon intensity ranges for ruminant meat as well as fish/seafood and lower variations for other animal-based products. The reasons for the magnitude of GHGE ranges in animal-based products are very difficult to trace since the effects may level out or reinforce each other. Large ranges for both beef and fish/seafood GHGEs can emerge from high variability of emissions due to different production systems and, in the case of fish/seafood, distinct products included in these ranges. Aquaculture and trawling fishery for instance emit more GHGEs than non-trawling fishery, while more extensive beef production systems display far larger GHGEs than intensive systems or coupled dairy-beef systems [103]. So, ranges become narrower when disaggregated into product categories and/or production systems [61,103].
The increasing confidence interval widths from Vegetarian CF to O_high indicate that the more animal-based products were prevalent in a diet, the larger the 90% confidence interval (Figure 2). This is because only distributions for animal-based product GHGEs were used in the calculation. If value ranges for plant-based GHGEs are also fed into the model, the CF widths would increase for all diets. However, this effect would be much smaller compared to animal-based products since GHGE ranges for plant-based products are in general far lower than for animal-based products [61].
Comparing our diet CF results directly to other studies is challenging as there is a wide variety of possible methodological choices. Even if methods are similar, distinct data sources as well as the inherent uncertainty and variability may lead to substantially different results and, therefore, limited comparability [106]. For the average French diet, results are lower (1522 kgCO2e cap−1 a−1 [16]) than our result for O_medium. Calculations for the average diet in the European Union underscored our vegan diet (605 kgCO2e cap−1 a−1 [19]). The outcomes in a study regarding diet CFs of average Dutch women were much lower than our results for dietary patterns with higher meat consumption, while their vegan and vegetarian diet CFs were more in line with the modelled diet CFs [107].
The differences between those studies and the study at hand can be mainly attributed to three reasons: Firstly, the existing studies used outdated conversion factors for the global warming potential of methane and nitrous oxide. This results in lower carbon intensities for all product groups compared to the study at hand. In addition, this underestimation is more pronounced for animal-based products (methane being the main contributor). This is also why results increasingly diverge the more animal-based products were included (see [107]). Secondly, excluding fertiliser production from emission inventories lowered CFs [19]. Thirdly, CFs were lower because food consumption surveys were used for the calculation [16,107], which generally underestimate food quantities compared to statistical data [48]. In one case [16], individual variations in food consumption were translated to the variation in the diet CFs. So, their study was hardly comparable to the study at hand even though they calculated diet CFs with an MC simulation.
The distributions retrieved for the different dietary patterns were not supposed to deliver exact values, but ranges that contain the true value with a high probability. Therefore, when comparing these results to the literature, while considering the methodological differences, we think that this study’s results are situated in a plausible range.

5.2. Benchmarking Dietary Patterns’ Adherence to Global Warming Thresholds

The benchmarking displays that a higher prevalence of animal-based products reduces the likelihood of limiting global warming to 1.5 or 2 degrees. Our study is the first to show that all dietary patterns exceed the goal for the 1.5 degrees global warming target, even when quantifying uncertainty. This includes the vegan diet, which generated the lowest GHGEs. Therefore, even when 100% of the population follows a vegan diet right now, the food system’s emissions would still exceed the available threshold to limit climate change to a temperature rise of 1.5 degrees. O_medium and O_high for the most part exceeded both 2 degrees thresholds, while Vegan was below both limits. Vegetarian and O_low mainly adhered to both the 67% and 50% chance limits. Even though vegan and vegetarian diets could potentially offset high-emission diets, their current share in the population is too low. For instance, in Germany, the share is 8% [108].
No further studies are known that benchmark dietary pattern CFs which regard different shares of animal-based products against both the 1.5 and 2 degrees global warming target for the food system. Therefore, comparability remains limited. A study [37] benchmarked global dietary recommendations (World Health Organization, USA, Australia, Germany, China, and India) to total per capita emission thresholds available in 2050 for reaching the 1.5 and 2 degrees global warming targets. All recommendations were below the 2 degrees limit and all recommendations except the national Indian guideline, which was low in meat quantities, exceeded the 1.5 degrees global warming threshold. Another study [2] projected the global food system GHGEs under different emission reduction scenarios and assessed their compatibility with total GHGEs available to remain below the 1.5 and 2 degrees global warming targets. Their business-as-usual diet remained below the 2 degrees threshold and trespassed the 1.5 degrees global warming target. A mainly plant-based diet was able to cut emissions by half and thus did not trespass the 1.5 degrees emission limit. In contrast to our results, in both studies, dietary patterns with a much higher meat content than O_low are within the 2 degrees target (for comparison, most national recommendations include a meat content that falls between O_low and O_medium). However, both studies compare the emissions caused by the food system with the total available emissions threshold. The food sector already consumes a large portion of the budget, leaving little room for GHGEs arising from other sectors, such as mobility and housing.
Willet et al. [35] downscaled a 2 degrees global warming limit to the food system and assessed for a business-as-usual case and three other dietary patterns (pescetarian, vegetarian, and vegan) whether a healthy universal reference diet complies with this limit. In their model, all diets except the business-as-usual case were able to meet the target. The average amount of meat in this “planetary health diet” is twice as high as in our O_low scenario, while the amount of milk and milk products is 10 kg higher. The 2 degrees limit is still complied with as the authors assume a much higher threshold for food system GHGEs (5 GtCO2e a−1) emissions. A further study [36] proposed a scenario of a diet switch towards the planetary health diet [35]. This scenario leads to substantial emission reductions of the food system of up to 6.9 GtCO2e per year in 2050 (business-as-usual scenario: 16.1 GtCO2e). The authors, however, did not relate the scenarios’ GHGEs to food system-specific thresholds to achieve the 2 or 1.5 degrees global warming targets.
Even if these studies are not fully comparable with our approach, they clearly reflect what our results demonstrate: The reduction of animal products in the diet leads to drastic GHGE reduction potentials. Dietary shifts to more plant-based diets are necessary to achieve the global climate goals, but will not suffice. There is still a gap that must be closed. Firstly, even though one-fifth of all Europeans already consume animal-based products in moderation [18], it is not possible that the entire Western European population will switch to a vegan diet. Individual as well as cultural acceptance and the difficult shift in habits often prevent changing dietary patterns [109]. Secondly, emissions should be kept well below the 2 degrees threshold. To avoid adverse consequences of climate change it is crucial to adhere to the 1.5 degrees threshold, rather than the 2 degrees goal [1]. Thirdly, the thresholds themselves are optimistic estimates because other sectors were expected to reach net zero emissions in 2050 [2]. Fourthly, for each year between 2020 and 2100 in which GHGEs trespass the average annual limits for this timeframe, the emission reductions in the years to follow must be even larger. Fifthly, countries in the Global North are required to reduce their GHGEs more ambitiously than countries in the Global South due to “ the principle of common but differentiated responsibilities and respective capabilities”, stated in the Paris Agreement ([110], p. 22). Thus, the GHGE thresholds would be lower for Western Europe than the global GHGE thresholds we used in this study.
In addition to changing consumption patterns, therefore, a significant transformation on the production side is necessary. Reducing food waste as well as increasing yields and agricultural efficiency are further key drivers for approaching climate targets in the time from 2020 to 2100 [2]: Halving food waste can reduce total food system emissions by one quarter. Narrowing yield gaps and growing genetically modified crops are expected to reduce emissions by 15%. A decrease of 40% can be achieved by enhanced agricultural production (e.g., more efficient input application). However, Poore & Nemecek [6] show that producers face limitations on how extensively they can reduce the impacts of their production. They conclude that the impact of dietary changes exceeds those of technological improvements. Measures abating mainly carbon dioxide emissions, such as obtaining renewable energy and more efficient use of (fossil) energy sources, only have limited impact. This is because the food system primarily emits other GHGs than carbon dioxide [111]. Combining these findings with our results shows that diversified strategies in consumption and production are needed to achieve global warming targets. Future research should examine to what extent these mitigation measures offer pathways for individual dietary pattern carbon footprints to approach food system-specific climate targets.
When regarding dietary switches, health and nutrition aspects must also be considered. Animal-based product substitution and reduction must be carried out while maintaining adequate nutrition [102,112]. Our study cannot evaluate how plant-based products can replace animal-based commodities nutritionally adequately and vice versa. The dietary patterns cannot be compared nutrition-wise since they would overestimate average nutrient and calorie consumption. This is because diets included food waste figures as they were modelled based on mass balance averages supplied to a region [57]. The share of food waste in a category could not be identified from the data, so the actual energy and nutrient consumption per dietary pattern cannot be evaluated. In the literature, there is debate about to what extent animal protein can be replaced adequately. Several studies conclude that animal-based products can be both healthily and GHGE-effectively replaced by, for instance, a mix of legumes, grains, fruits, and vegetables [10,33,104]. Global studies found that switching from an omnivorous diet to a vegan, pescatarian, or Mediterranean diet reduces mortality, cancer, diabetes, and coronary disease risks [103]. Some studies stated that, e.g., iron deficiency can be avoided even for entirely plant-based diets [15]. Moreover, a general nutrient deficiency can be prevented by consuming fortified products [112]. Additionally, even if protein is often suspected to be lacking in plant-based diets, for most European diets protein-intake would still exceed requirements by 50% even when half of the animal-based foods were omitted [19]. However, some studies did not find a correlation between a diet’s health benefits and sustainability [10,16]. A recent study by Vieux et al. [113] even shows that reducing animal protein below 45–60% (depending on age and sex) of total protein intake avoids meeting an adequate nutrition. Since studies on the effects of a minimal intake of animal-based foods are rather controversial, there is a need for further research in this area.

5.3. Limitations

CFs are approximations of GHGEs, which depend on the conditions and constraints applied in the respective study [43]. This study’s results are no exception. Even though it yielded improved results for dietary patterns CFs, this investigation comes with a number of limitations. These limitations, as well as an expert guess on their influence on the results, are shown in Table 2. Out of seven identified problems, three limitations are deemed to be crucial in this regard: (1) missing variability in the applied scenario data; (2) restriction to cradle-to-farmgate datasets for animal-based European products; (3) the amount and variability of available GHGE values from different data sources.
However, it is assumed that these (and other) limitations do not overturn the overall conclusions of the study. In particular, the differences in CFs between animal-based and plant-based products are well-attested in the literature. This means that even with better data, diets with large amounts of animal-based products are expected obstacles to achieving climate mitigation goals (even if for example population growth is lower than expected or a better representation of the actual products would lead to lower CFs).

6. Conclusions

In this paper, probabilistic distributions for Western European dietary pattern CFs were calculated by using ranges of animal-based food GHGEs in the modelling process. Instead of ignoring the inherent variation of dietary pattern CFs, this work incorporated uncertainty regarding the variation of input data. Beef and fish/seafood had particularly large GHGEs and wide value ranges. Thus, reducing the amount of animal-based products with highly varying GHGE values (like beef, fish/seafood, cheese, and other dairy) already decreases the range of the corresponding diet CF distributions. It also reduces the probability of generating a high diet CF.
Our quantification of different dietary patterns’ uncertainty facilitates assessing gaps between individual consumption and climate targets to develop pathways toward GHGE mitigation measures. Our study finds that all dietary patterns cause more GHGEs than the 1.5 degrees global warming limit allows. Only the vegan diet was in line with the 2 degrees threshold, while all other dietary patterns trespassed the threshold partly to entirely.
Reducing animal-based products in the diet has the potential to significantly reduce emissions, as our results show. This strategy is an important element in achieving global climate goals. Therefore, initiating and promoting dietary shifts should be supported more actively. Reflecting hidden environmental and health costs in pricing could be one measure. Often, healthy, plant-based products are more expensive than their animal-based counterparts. Transforming taxes or subsidies to reshape market signals can support consumers to choose healthy and climate-friendly products [35]. Aligning dietary guidelines more strictly with environmental objectives and implementing them consistently facilitates dietary transformation within society. This can have direct impacts on promoting low-emission eating habits as such recommendations affect consumers of all ages and socio-economic classes. For example, in Germany, dietary guidelines provide quality standards for community catering (e.g., schools, companies, hospitals, and retirement homes) [114]. Education and information on climate-friendly choices as well as marketing measures (e.g., promoting low-emission products and reducing advertisement for GHGE-intensive commodities) can create a new awareness for healthy and sustainable nutrition in society at all ages [35,115]. Reducing animal-based products in diets contributes to climate change mitigation targets, but is not sufficient on its own, especially regarding the 1.5 degrees target. Diversified strategies are needed to close this gap. Further GHGE reduction measures must come from both the supply and the demand side [116]. This includes the reduction of food waste along the entire value chain, consuming locally- and seasonally-sourced products to both reduce emissions from cultivation (e.g., when grown in greenhouses) as well as from transport and storage (e.g., refrigeration and lightning). Also adapted agricultural production techniques are needed, such as using precision techniques for improved input (e.g., seeds and fertilisers) efficiency, applying nitrification inhibitors, or altering feeding techniques and manure management [41,117]. Combining strategies like shifting to more plant-based diets, increasing yields, reducing waste, and improving food production efficiency can drastically reduce food system emissions, even when only halfway implemented until 2050 [2]. In addition to reductions in the food sector, reaching an almost entire decarbonisation in all other areas is crucial to have a realistic chance to remain below global warming limits [2,37].
This paper investigated the consequences of different animal-based product consumption amounts for Western European dietary patterns assuming equal GHGEs thresholds for all humans. It is important to emphasise that in other regions of the world animal-based products are essential for food security, for example, when land is not suitable for crop cultivation. Also, reduced animal-based product consumption in western countries would have an impact on the world market and need to be considered.
Further research is required that includes uncertainty and variability of the entire food system to improve GHGE estimations. Future studies should consider the interplay of different measures to reduce GHGEs from both food supply and consumption so that the gap between current emissions and emission targets can be closed. Research in this field is crucial to guide and implement policies tackling climate change and associated consequences.

Supplementary Materials

The following supporting information can be downloaded at: https://www.mdpi.com/article/10.3390/su142114449/s1, Table S1: Greenhouse gas emission values of animal-based foods to compile value ranges for the calculation of diet carbon footprints.

Author Contributions

Conceptualization, J.R. and L.H.; methodology, J.R. and J.T.; software, J.R.; validation, J.R. and J.T.; formal analysis, J.R.; investigation, J.R.; resources, J.T. and B.B.; data curation, J.R.; writing—original draft preparation, J.R. and L.H.; writing—review and editing, L.H., J.R., J.T. and B.B.; visualisation, J.R.; supervision, B.B. and J.T.; funding acquisition L.H. and B.B. All authors have read and agreed to the published version of the manuscript.

Funding

We acknowledge financial support by Wuppertal Institut für Klima, Umwelt, Energie gGmbH within the funding programme Open Access Publishing and the University of Cologne.

Institutional Review Board Statement

Not applicable.

Informed Consent Statement

Not applicable.

Data Availability Statement

Data on the SUSLA calculation logic presented in this study are available on request from the corresponding author. The data are not publicly available because a number of underlying data sets of food products were calculated with help of a licensed database.

Conflicts of Interest

The authors declare no conflict of interest.

Appendix A

SUSLA Calculation Logic

The calculation of dietary pattern CFs is based on data for the food questionnaire in the SUSLA calculator. It provided annual food group quantities of different dietary styles and their corresponding CFs for the authors of the study at hand (Table A1).
Table A1. Annual food quantities of diets and corresponding carbon footprints. The system boundaries were cradle-to-farmgate for the greenhouse gas emission calculation. CO2e = carbon dioxide equivalents [59].
Dietary PatternAnnual Quantity Consumed
(kg capita−1 a−1)
Carbon Footprint
(kgCO2e capita−1 a−1)
Vegan637434
Vegetarian6991180
O_low7831617
O_medium8612496
O_high8612964
The results in Table A1 are based on GHGE calculations for food products (1) from the project NAHGAST that were matched (2) to the average food group consumption in Western Europe from food balance sheets [57]. As they only considers the average diet (3–4 times meat per week or O_medium), it was further necessary to develop attribution and allocation rules (3) for the additional dietary styles of Vegan, Vegetarian, O_low and O_high.
The GHGEs of food products (1) were estimated In the project NAHGAST (Development, Testing and the Distribution of Concepts for Sustainable Production and Consumption in the Field of Out-of-Home Catering (https://wupperinst.org/en/p/wi/p/s/pd/540, accessed on 12 January 2021) on a cradle-to-farmgate basis. The baseline of each food product consists of the upstream processes up to the farmgate (either based on life cycle inventories in ecoinvent 3.1 or own bottom-up estimates). Further product variations (fresh, dried, frozen, canned) then included cooling processes as well as material inputs (canned) and material losses if required. Distribution processes were considered for NAHGAST as well, but are not part of the data used in either SUSLA or the paper at hand.
Food products were then matched to the food groups found in [57] (2). If more than one product was suitable or one product was available in different conditions, these products were aggregated to an average GHGE value on a mass basis.
The third and final step (3) related to the food category quantity distribution for different diets. The average Western European food supply per capita [57] provided consumption amounts for each food category of the O_medium diet. The three diets Vegan, Vegetarian and O_low were calculated by altering O_medium’s consumption amounts based on a diet survey by Orlich et al. [60]. This survey enabled the comparison of the food groups in both data sets and to ascertain the relative differences between an average diet in the US and these three diets with lower meat consumptions. As no data was available for a diet with daily meat consumption (O_high), a numerical solution was developed for this diet. Using the overall food quantities of average meat consumption (861 kg a−1), all four meat food groups were scaled up by a factor of 7:4 (7 to 4 days per week) and all other food groups were scaled down, accordingly. As a result, overall food consumption remains the same for O_high as for O_medium, but meat consumption increases by 75% and non-meat product quantities decrease by 11%.

Appendix B

Table A2. Confidence intervals for probability distributions of modelled dietary pattern carbon footprints. CO2e = Carbon dioxide equivalents.
Dietary
Pattern
Confidence Interval for Carbon Footprints
(kgCO2e capita−1 a−1)
0%5%10%25%50%75%90%95%100%
Vegan612612612612612612612612612
Vegetarian6637637948519391053118612822037
O_low771917956103611481293146015802549
O_medium130218121923213324132774317634919235
O_high1564237825502874332139214575511015,285

References

  1. Hoegh-Guldberg, O.; Jacob, D.; Taylor, M.; Bindi, M.; Brown, S.; Camilloni, I.; Diedhiou, A.; Djalante, R.; Ebi, K.L.; Engelbrecht, F.; et al. 2018: Impacts of 1.5 °C Global Warming on Natural and Human Systems. In Global Warming of 1.5 °C; An IPCC Special Report on the impacts of global warming of 1.5 °C above pre-industrial levels and related global greenhouse gas emission pathways, in the context of strengthening the global response to the threat of climate change, sustainable development, and efforts to eradicate poverty; Masson-Delmotte, V., Zhai, H.-O.P., Pörtner, D., Roberts, J., Skea, P.R., Shukla, A., Pirani, W., Moufouma-Okia, C., Péan, R., Pidcock, S., et al., Eds.; Cambridge University Press: Cambridge, UK; New York, NY, USA, 2018; pp. 175–312. [Google Scholar] [CrossRef]
  2. Clark, M.A.; Domingo, N.G.G.; Colgan, K.; Thakrar, S.K.; Tilman, D.; Lynch, J.; Azevedo, I.L.; Hill, J.D. Global Food System Emissions Could Preclude Achieving the 1.5° and 2 °C Climate Change Targets. Science 2020, 370, 705–708. [Google Scholar] [CrossRef] [PubMed]
  3. Pradhan, P.; Reusser, D.E.; Kropp, J.P. Embodied Greenhouse Gas Emissions in Diets. PLoS ONE 2013, 8, 1–8. [Google Scholar] [CrossRef] [Green Version]
  4. González-García, S.; Esteve-Llorens, X.; Moreira, M.T.; Feijoo, G. Carbon Footprint and Nutritional Quality of Different Human Dietary Choices. Sci. Total Environ. 2018, 644, 77–94. [Google Scholar] [CrossRef]
  5. Hallström, E.; Carlsson-Kanyama, A.; Börjesson, P. Environmental Impact of Dietary Change: A Systematic Review. J. Clean. Prod. 2015, 91, 1–11. [Google Scholar] [CrossRef]
  6. Poore, J.; Nemecek, T. Reducing Food’s Environmental Impacts through Producers and Consumers. Science 2018, 360, 987–992. [Google Scholar] [CrossRef] [PubMed] [Green Version]
  7. European Commission. The European Green Deal; European Commission: Brussels, Belgium, 2019.
  8. Chai, B.C.; van der Voort, J.R.; Grofelnik, K.; Eliasdottir, H.G.; Klöss, I.; Perez-Cueto, F.J.A. Which Diet Has the Least Environmental Impact on Our Planet? A Systematic Review of Vegan, Vegetarian and Omnivorous Diets. Sustain. Switz. 2019, 11, 4110. [Google Scholar] [CrossRef] [Green Version]
  9. Cleveland, D.A.; Gee, Q. Plant-Based Diets for Mitigating Climate Change. In Vegetarian and Plant-Based Diets in Health and Disease Prevention; Elsevier: Amsterdam, The Netherlands, 2017; pp. 135–156. ISBN 978-0-12-803969-4. [Google Scholar]
  10. Biesbroek, S.; Bas Bueno-De-Mesquita, H.; Peeters, P.H.M.; Monique Verschuren, W.M.; Van Der Schouw, Y.T.; Kramer, G.F.H.; Tyszler, M.; Temme, E.H.M. Reducing Our Environmental Footprint and Improving Our Health: Greenhouse Gas Emission and Land Use of Usual Diet and Mortality in EPIC-NL: A Prospective Cohort Study. Environ. Health Glob. Access Sci. Source 2014, 13, 1–9. [Google Scholar] [CrossRef] [Green Version]
  11. Hertwich, E.G.; Peters, G.P. Carbon Footprint of Nations: A Global, Trade-Linked Analysis. Environ. Sci. Technol. 2009, 43, 6414–6420. [Google Scholar] [CrossRef] [Green Version]
  12. Meier, T.; Christen, O. Environmental Impacts of Dietary Recommendations and Dietary Styles: Germany as an Example. Environ. Sci. Technol. 2013, 47, 877–888. [Google Scholar] [CrossRef]
  13. Notarnicola, B.; Tassielli, G.; Renzulli, P.A.; Castellani, V.; Sala, S. Environmental Impacts of Food Consumption in Europe. J. Clean. Prod. 2017, 140, 753–765. [Google Scholar] [CrossRef]
  14. Seconda, L.; Baudry, J.; Allès, B.; Boizot-Szantai, C.; Soler, L.G.; Galan, P.; Hercberg, S.; Langevin, B.; Lairon, D.; Pointereau, P.; et al. Comparing Nutritional, Economic, and Environmental Performances of Diets According to Their Levels of Greenhouse Gas Emissions. Clim. Chang. 2018, 148, 155–172. [Google Scholar] [CrossRef] [Green Version]
  15. Temme, E.H.M.; Toxopeus, I.B.; Kramer, G.F.H.; Brosens, M.C.C.; Drijvers, J.M.M.; Tyszler, M.; Ocké, M.C. Greenhouse Gas Emission of Diets in the Netherlands and Associations with Food, Energy and Macronutrient Intakes. Public Health Nutr. 2015, 18, 2433–2445. [Google Scholar] [CrossRef] [PubMed]
  16. Vieux, F.; Darmon, N.; Touazi, D.; Soler, L.G. Greenhouse Gas Emissions of Self-Selected Individual Diets in France: Changing the Diet Structure or Consuming Less? Ecol. Econ. 2012, 75, 91–101. [Google Scholar] [CrossRef]
  17. Vieux, F.; Soler, L.; Touazi, D.; Darmon, N. High Nutritional Quality Is Not Associated with Low Greenhouse Gas Emissions in Self-Selected Diets of French Adults1-3. Am. J. Clin. Nutr. 2013, 97, 569–583. [Google Scholar] [CrossRef] [Green Version]
  18. Vieux, F.; Privet, L.; Soler, L.G.; Irz, X.; Ferrari, M.; Sette, S.; Raulio, S.; Tapanainen, H.; Hoffmann, R.; Surry, Y.; et al. More Sustainable European Diets Based on Self-Selection Do Not Require Exclusion of Entire Categories of Food. J. Clean. Prod. 2020, 248, 119298. [Google Scholar] [CrossRef]
  19. Westhoek, H.; Lesschen, J.P.; Rood, T.; Wagner, S.; De Marco, A.; Murphy-Bokern, D.; Leip, A.; van Grinsven, H.; Sutton, M.A.; Oenema, O. Food Choices, Health and Environment: Effects of Cutting Europe’s Meat and Dairy Intake. Glob. Environ. Chang. 2014, 26, 196–205. [Google Scholar] [CrossRef] [Green Version]
  20. Tukker, A.; Goldbohm, R.A.; De Koning, A.; Verheijden, M.; Kleijn, R.; Wolf, O.; Pérez-Domínguez, I.; Rueda-Cantuche, J.M. Environmental Impacts of Changes to Healthier Diets in Europe. Ecol. Econ. 2011, 70, 1776–1788. [Google Scholar] [CrossRef]
  21. Van Dooren, C.; Aiking, H. Defining a Nutritionally Healthy, Environmentally Friendly, and Culturally Acceptable Low Lands Diet. Int. J. Life Cycle Assess. 2016, 21, 688–700. [Google Scholar] [CrossRef]
  22. Grünberg, J.; Nieberg, H.; Schmidt, T.G. Treibhausgasbilanzierung von Lebensmitteln (Carbon Footprints): Überblick Und Kritische Reflektion. Landbauforschung 2010, 2, 53–72. [Google Scholar]
  23. Huijbregts, M.A.J. Application of Uncertainty and Variability in LCA. Part I: A General Framework for the Analysis of Uncertainty and Variability in Life Cycle Assessment. Int. J. Life Cycle Assess. 1998, 3, 273–280. [Google Scholar] [CrossRef]
  24. Jungbluth, N.; Nathani, C.; Stuckl, M.; Leuenberger, M. Environmental Impacts of Swiss Consumption and Production. Foen 2011, 54, 173. [Google Scholar]
  25. Röös, E.; Sundberg, C.; Hansson, P. Carbon Footprint of Food Products. In Assessment of Carbon Footprint in Different Industrial Sectors; Springer: Singapore, 2014; pp. 85–112. ISBN 978-981-4560-40-5. [Google Scholar]
  26. Finkbeiner, M. Carbon Footprinting-Opportunities and Threats. Int. J. Life Cycle Assess. 2009, 14, 91–94. [Google Scholar] [CrossRef] [Green Version]
  27. Deviatkin, I.; Kozlova, M.; Yeomans, J.S. Simulation Decomposition for Environmental Sustainability: Enhanced Decision-Making in Carbon Footprint Analysis. Socioecon. Plann. Sci. 2021, 75, 100837. [Google Scholar] [CrossRef]
  28. Heijungs, R.; Huijbregts, M.A.J. A Review of Approaches to Treat Uncertainty in LCA. In Proceedings of the iEMSs 2004 International Congress, Copenhagen, Denmark, 7–9 June 2004. [Google Scholar]
  29. Vázquez-Rowe, I.; Larrea-Gallegos, G.; Villanueva-Rey, P.; Gilardino, A. Climate Change Mitigation Opportunities Based on Carbon Footprint Estimates of Dietary Patterns in Peru. PLoS ONE 2017, 12, 1–25. [Google Scholar] [CrossRef] [Green Version]
  30. Heijungs, R.; Guinée, J.B.; Mendoza Beltrán, A.; Henriksson, P.J.G.; Groen, E. Everything Is Relative and Nothing Is Certain. Toward a Theory and Practice of Comparative Probabilistic LCA. Int. J. Life Cycle Assess. 2019, 24, 1573–1579. [Google Scholar] [CrossRef] [Green Version]
  31. Do, H.; Luedeling, E.; Whitney, C. Decision Analysis of Agroforestry Options Reveals Adoption Risks for Resource-Poor Farmers. Agron. Sustain. Dev. 2020, 40, 20. [Google Scholar] [CrossRef]
  32. Arrieta, E.M.; González, A.D. Impact of Current, National Dietary Guidelines and Alternative Diets on Greenhouse Gas Emissions in Argentina. Food Policy 2018, 79, 58–66. [Google Scholar] [CrossRef] [Green Version]
  33. Rosi, A.; Mena, P.; Pellegrini, N.; Turroni, S.; Neviani, E.; Ferrocino, I.; Di Cagno, R.; Ruini, L.; Ciati, R.; Angelino, D.; et al. Environmental Impact of Omnivorous, Ovo-Lacto-Vegetarian, and Vegan Diet. Sci. Rep. 2017, 7, 6105. [Google Scholar] [CrossRef] [Green Version]
  34. Scarborough, P.; Appleby, P.N.; Mizdrak, A.; Briggs, A.D.M.; Travis, R.C.; Bradbury, K.E.; Key, T.J. Dietary Greenhouse Gas Emissions of Meat-Eaters, Fish-Eaters, Vegetarians and Vegans in the UK. Clim. Chang. 2014, 125, 179–192. [Google Scholar] [CrossRef] [Green Version]
  35. Willett, W.; Rockström, J.; Loken, B.; Springmann, M.; Lang, T.; Garnett, T.; Tilman, D.; Wood, A.; DeClerck, F.; Jonell, M.; et al. Food in the Anthropocene: The EAT–Lancet Commission on Healthy Diets from Sustainable Food Systems. Lancet 2019, 393, 447–492. [Google Scholar] [CrossRef]
  36. Bodirsky, B.L.; Chen, D.M.-C.; Weindl, I.; Soergel, B.; Beier, F.; Molina Bacca, E.J.; Gaupp, F.; Popp, A.; Lotze-Campen, H. Integrating Degrowth and Efficiency Perspectives Enables an Emission-Neutral Food System by 2100. Nat. Food 2022, 3, 341–348. [Google Scholar] [CrossRef]
  37. Ritchie, H.; Reay, D.S.; Higgins, P. The Impact of Global Dietary Guidelines on Climate Change. Glob. Environ. Chang. 2018, 49, 46–55. [Google Scholar] [CrossRef] [Green Version]
  38. Millonig, A.; Rudloff, C.; Richter, G.; Lorenz, F.; Peer, S. Fair Mobility Budgets: A Concept for Achieving Climate Neutrality and Transport Equity. Transp. Res. Part D Transp. Environ. 2022, 103, 103165. [Google Scholar] [CrossRef]
  39. Miotti, M.; Supran, G.J.; Kim, E.J.; Trancik, J.E. Personal Vehicles Evaluated against Climate Change Mitigation Targets. Environ. Sci. Technol. 2016, 50, 10795–10804. [Google Scholar] [CrossRef] [Green Version]
  40. FAOSTAT (Food and Agriculture Organization Corporate Statistical Database). Definitions and Standards Used in FAOSTAT. Available online: http://www.fao.org/faostat/en/#definitions (accessed on 13 January 2021).
  41. Niles, M.T.; Ahuja, R.; Barker, T.; Esquivel, J.; Gutterman, S.; Heller, M.C.; Mango, N.; Portner, D.; Raimond, R.; Tirado, C.; et al. Climate Change Mitigation beyond Agriculture: A Review of Food System Opportunities and Implications. Renew. Agric. Food Syst. 2018, 33, 297–308. [Google Scholar] [CrossRef]
  42. Steiner, A.; Aguilar, G.; Bomba, K.; Bonilla, J.; Campbell, A.; Echeverria, R.; Gandhi, R.; Hedegaard, C.; Holdorf, D.; Ishii, N.; et al. Actions to Transform Food Systems under Climate Change; CGIAR Research Program on Climate Change, Agriculture and Food Security (CCAFS): Wageningen, The Netherlands, 2020. [Google Scholar]
  43. Röös, E.; Sundberg, C.; Tidåker, P.; Strid, I.; Hansson, P.A. Can Carbon Footprint Serve as an Indicator of the Environmental Impact of Meat Production? Ecol. Indic. 2013, 24, 573–581. [Google Scholar] [CrossRef]
  44. Röös, E.; Nylinder, J. Uncertainties and Variations in the Carbon Footprint of Livestock Products; Swedish University of Agricultural Sciences—Institutionen för energi och teknik: Uppsala, Sweden, 2013. [Google Scholar]
  45. Osterburg, B. Erfassung, Bewertung Und Minderung von Treib- Hausgasemissionen Des Deutschen Agrar- Und Er- Nährungssektors: Studie im Auftrag des Bundesministeriums für Ernährung, Landwirtschaft und Verbraucherschutz; Arbeitsberichte aus der vTI-Agrarökonomie, No. 03/2009; Johann Heinrich von Thünen-Institut (vTI): Braunschweig, Germany, 2009. [Google Scholar]
  46. Ruett, M.; Whitney, C.; Luedeling, E. Model-Based Evaluation of Management Options in Ornamental Plant Nurseries. J. Clean. Prod. 2020, 271, 122653. [Google Scholar] [CrossRef]
  47. Bryngelsson, D.; Wirsenius, S.; Hedenus, F.; Sonesson, U. How Can the EU Climate Targets Be Met? A Combined Analysis of Technological and Demand-Side Changes in Food and Agriculture. Food Policy 2016, 59, 152–164. [Google Scholar] [CrossRef] [Green Version]
  48. Berners-Lee, M.; Hoolohan, C.; Cammack, H.; Hewitt, C.N. The Relative Greenhouse Gas Impacts of Realistic Dietary Choices. Energy Policy 2012, 43, 184–190. [Google Scholar] [CrossRef]
  49. Castañé, S.; Antón, A. Assessment of the Nutritional Quality and Environmental Impact of Two Food Diets: A Mediterranean and a Vegan Diet. J. Clean. Prod. 2017, 167, 929–937. [Google Scholar] [CrossRef]
  50. Esteve-Llorens, X.; Darriba, C.; Moreira, M.T.; Feijoo, G.; González-García, S. Towards an Environmentally Sustainable and Healthy Atlantic Dietary Pattern: Life Cycle Carbon Footprint and Nutritional Quality. Sci. Total Environ. 2019, 646, 704–715. [Google Scholar] [CrossRef] [PubMed]
  51. Muñoz, I.; Milà I Canals, L.; Fernández-Alba, A.R. Life Cycle Assessment of the Average Spanish Diet Including Human Excretion. Int. J. Life Cycle Assess. 2010, 15, 794–805. [Google Scholar] [CrossRef]
  52. Saxe, H.; Larsen, T.M.; Mogensen, L. The Global Warming Potential of Two Healthy Nordic Diets Compared with the Average Danish Diet. Clim. Chang. 2013, 116, 249–262. [Google Scholar] [CrossRef]
  53. Wilting, H.C. Sensitivity and Uncertainty Analysis in MRIO Modelling; Some Empirical Results with Regard to the Dutch Carbon Footprint. Econ. Syst. Res. 2012, 24, 141–171. [Google Scholar] [CrossRef]
  54. Kim, D.; Parajuli, R.; Thoma, G.J. Life Cycle Assessment of Food Supply Chain Relative to Dietary Patterns in the United States. Sustainability 2020, 12, 1586. [Google Scholar] [CrossRef] [Green Version]
  55. Luedeling, E.; Oord, A.L.; Kiteme, B.; Ogalleh, S.; Malesu, M.; Shepherd, K.D.; de Leeuw, J. Fresh Groundwater for Wajir-Ex-Ante Assessment of Uncertain Benefits for Multiple Stakeholders in a Water Supply Project in Northern Kenya. Front. Environ. Sci. 2015, 3, 16. [Google Scholar] [CrossRef] [Green Version]
  56. Wafula, J.; Karimjee, Y.; Tamba, Y.; Malava, G.; Muchiri, C.; Koech, G.; De Leeuw, J.; Nyongesa, J.; Shepherd, K.; Luedeling, E. Probabilistic Assessment of Investment Options in Honey Value Chains in Lamu County, Kenya. Front. Appl. Math. Stat. 2018, 4, 6. [Google Scholar] [CrossRef] [Green Version]
  57. FAOSTAT (Food and Agriculture Organization Corporate Statistical Database) Food Supply—Crops Primary Equivalent. Available online: http://www.fao.org/faostat/en/#data/FBS (accessed on 21 February 2021).
  58. SUSLA. SUSLA Data Anonymous as of 30th March 2021. Internal Document for the SUSLA App.; Wuppertal Institut für Klima: Umwelt, Energie: Wuppertal, Germany, 2021. [Google Scholar]
  59. Teubler, J.; Bienge, K. FOOD Model Based on FAOSTAT & NAHGAST—Update JAN 2021—VER 2.3. Internal Document for the SUSLA App.; Wuppertal Institut für Klima, Umwelt, Energie: Wuppertal, Germany, 2021. [Google Scholar]
  60. Orlich, M.J.; Jaceldo-siegl, K.; Sabaté, J.; Fan, J.; Singh, P.N.; Fraser, G.E. Patterns of Food Consumption among Vegetarians and Non-Vegetarians. Patterns 2014, 112, 1644–1653. [Google Scholar] [CrossRef] [Green Version]
  61. Nijdam, D.; Rood, T.; Westhoek, H. The Price of Protein: Review of Land Use and Carbon Footprints from Life Cycle Assessments of Animal Food Products and Their Substitutes. Food Policy 2012, 37, 760–770. [Google Scholar] [CrossRef]
  62. Moher, D.; Liberati, A.; Tetzlaff, J.; Altman, D.G.; Altman, D.; Antes, G.; Atkins, D.; Barbour, V.; Barrowman, N.; Berlin, J.A.; et al. Preferred Reporting Items for Systematic Reviews and Meta-Analyses: The PRISMA Statement. PLoS Med. 2009, 6, e1000097. [Google Scholar] [CrossRef] [Green Version]
  63. Garnett, T. Where Are the Best Opportunities for Reducing Greenhouse Gas Emissions in the Food System (Including the Food Chain)? Food Policy 2011, 36, S23–S32. [Google Scholar] [CrossRef]
  64. Sandström, V.; Valin, H.; Krisztin, T.; Havlík, P.; Herrero, M.; Kastner, T. The Role of Trade in the Greenhouse Gas Footprints of EU Diets. Glob. Food Secur. 2018, 19, 48–55. [Google Scholar] [CrossRef]
  65. Schau, E.M.; Fet, A.M. LCA Studies of Food Products as Background for Environmental Product Declarations. Int. J. Life Cycle Assess. 2008, 13, 255–264. [Google Scholar] [CrossRef]
  66. Clune, S.; Crossin, E.; Verghese, K. Systematic Review of Greenhouse Gas Emissions for Different Fresh Food Categories. J. Clean. Prod. 2017, 140, 766–783. [Google Scholar] [CrossRef] [Green Version]
  67. Lynch, J. Availability of Disaggregated Greenhouse Gas Emissions from Beef Cattle Production: A Systematic Review. Environ. Impact Assess. Rev. 2019, 76, 69–78. [Google Scholar] [CrossRef]
  68. Abín, R.; Laca, A.; Lada, A.; Díaz, M. Environmental Assessment of Intensive Egg Production: A Spanish Case Study. J. Clean. Prod. 2018, 179, 160–168. [Google Scholar] [CrossRef]
  69. Badiola, M.; Basurko, O.C.; Gabiña, G.; Mendiola, D. Integration of Energy Audits in the Life Cycle Assessment Methodology to Improve the Environmental Performance Assessment of Recirculating Aquaculture Systems. J. Clean. Prod. 2017, 157, 155–166. [Google Scholar] [CrossRef]
  70. Biermann, G.; Geist, J. Life Cycle Assessment of Common Carp (Cyprinus Carpio L.)—A Comparison of the Environmental Impacts of Conventional and Organic Carp Aquaculture in Germany. Aquaculture 2019, 501, 404–415. [Google Scholar] [CrossRef]
  71. Buratti, C.; Fantozzi, F.; Barbanera, M.; Lascaro, E.; Chiorri, M.; Cecchini, L. Carbon Footprint of Conventional and Organic Beef Production Systems: An Italian Case Study. Sci. Total Environ. 2017, 576, 129–137. [Google Scholar] [CrossRef]
  72. Cederberg, C. Greenhouse Gas Emissions from Swedish Production of Meat, Milk and Eggs 1990 and 2005; SIK Institutet för livsmedel och bioteknik: Göteborg, Sweden, 2009. [Google Scholar]
  73. Clarke, A.M.; Brennan, P.; Crosson, P. Life-Cycle Assessment of the Intensity of Production on the Greenhouse Gas Emissions and Economics of Grass-Based Suckler Beef Production Systems. J. Agric. Sci. 2013, 151, 714–726. [Google Scholar] [CrossRef]
  74. Dentler, V.J.; Kiefer, L.; Hummler, T.; Bahrs, E.; Elsäßer, M. Wie Nachhaltig Und Konkurrenzfähig Ist Die Grünlandbasierte Milcherzeugung in Benachteiligten Mittelgebirgslagen Süddeutschlands? Berichte Über Landwirtsch. -Z. Für Agrarpolit. Landwirtsch. 2020, 98, 1–27. [Google Scholar]
  75. Djekic, I.; Miocinovic, J.; Tomasevic, I.; Smigic, N.; Tomic, N. Environmental Life-Cycle Assessment of Various Dairy Products. J. Clean. Prod. 2014, 68, 64–72. [Google Scholar] [CrossRef]
  76. Forleo, M.B.; Palmieri, N.; Salimei, E. The Eco-Efficiency of the Dairy Cheese Chain: An Italian Case Study. Ital. J. Food Sci. 2018, 30, 362–380. [Google Scholar] [CrossRef]
  77. González-García, S.; Castanheira, É.G.; Dias, A.C.; Arroja, L. Environmental Life Cycle Assessment of a Dairy Product: The Yoghurt. Int. J. Life Cycle Assess. 2013, 18, 796–811. [Google Scholar] [CrossRef]
  78. Gosalvitr, P.; Cuellar-Franca, R.; Smith, R.; Azapagic, A. Energy Demand and Carbon Footprint of Cheddar Cheese with Energy Recovery from Cheese Whey. Energy Procedia 2019, 161, 10–16. [Google Scholar] [CrossRef]
  79. Le Féon, S.; Thévenot, A.; Maillard, F.; Macombe, C.; Forteau, L.; Aubin, J. Life Cycle Assessment of Fish Fed with Insect Meal: Case Study of Mealworm Inclusion in Trout Feed, in France. Aquaculture 2019, 500, 82–91. [Google Scholar] [CrossRef]
  80. Liu, Y.; Rosten, T.W.; Henriksen, K.; Hognes, E.S.; Summerfelt, S.; Vinci, B. Comparative Economic Performance and Carbon Footprint of Two Farming Models for Producing Atlantic Salmon (Salmo Salar): Land-Based Closed Containment System in Freshwater and Open Net Pen in Seawater. Aquac. Eng. 2016, 71, 1–12. [Google Scholar] [CrossRef] [Green Version]
  81. Mogensen, L.; Hermansen, J.; Nguyen, L.; Preda, T. Environmental Impact of Beef: By Life Cycle Assessment (LCA)—13 Danish Beef Production Systems; DCA—Danish Centre for Food and Agriculture: Tjele, Denmark, 2015; ISBN 978-87-93176-70-6. [Google Scholar]
  82. Mondello, G.; Salomone, R.; Neri, E.; Patrizi, N.; Bastianoni, S.; Lanuzza, F. Environmental Hot-Spots and Improvement Scenarios for Tuscan “Pecorino” Cheese Using Life Cycle Assessment. J. Clean. Prod. 2018, 195, 810–820. [Google Scholar] [CrossRef]
  83. Nguyen, T.T.H.; Doreau, M.; Corson, M.S.; Eugène, M.; Delaby, L.; Chesneau, G.; Gallard, Y.; Van Der Werf, H.M.G. Effect of Dairy Production System, Breed and Co-Product Handling Methods on Environmental Impacts at Farm Level. J. Environ. Manag. 2013, 120, 127–137. [Google Scholar] [CrossRef]
  84. Noya, I.; Aldea, X.; Gasol, C.M.; González-García, S.; Amores, M.J.; Colón, J.; Ponsá, S.; Roman, I.; Rubio, M.A.; Casas, E.; et al. Carbon and Water Footprint of Pork Supply Chain in Catalonia: From Feed to Final Products. J. Environ. Manag. 2016, 171, 133–143. [Google Scholar] [CrossRef]
  85. Nunes, Ó.S.; Gaspar, P.D.; Nunes, J.; Quinteiro, P.; Dias, A.C.; Godina, R. Life-Cycle Assessment of Dairy Products-Case Study of Regional Cheese Produced in Portugal. Processes 2020, 8, 1182. [Google Scholar] [CrossRef]
  86. Pirlo, G.; Carè, S.; Casa, G.D.; Marchetti, R.; Ponzoni, G.; Faeti, V.; Fantin, V.; Masoni, P.; Buttol, P.; Zerbinatti, L.; et al. Environmental Impact of Heavy Pig Production in a Sample of Italian Farms. A Cradle to Farm-Gate Analysis. Sci. Total Environ. 2016, 565, 576–585. [Google Scholar] [CrossRef] [PubMed]
  87. Rudolph, G.; Hörtenhuber, S.; Bochicchio, D.; Butler, G.; Brandhofer, R.; Dippel, S.; Dourmad, J.Y.; Edwards, S.; Früh, B.; Meier, M.; et al. Effect of Three Husbandry Systems on Environmental Impact of Organic Pigs. Sustain. Switz. 2018, 10, 3796. [Google Scholar] [CrossRef] [Green Version]
  88. Salou, T.; Le Mouël, C.; van der Werf, H.M.G. Environmental Impacts of Dairy System Intensification: The Functional Unit Matters! J. Clean. Prod. 2017, 140, 445–454. [Google Scholar] [CrossRef]
  89. Smárason, B.Ö.; Ögmundarson, Ó.; Árnason, J.; Björnsdóttir, R.; Davíðsdóttir, B. Life Cycle Assessment of Icelandic Arctic Char Fed Three Different Feed Types. Turk. J. Fish. Aquat. Sci. 2017, 17, 79–90. [Google Scholar] [CrossRef]
  90. Samsonstuen, S.; Åby, B.A.; Crosson, P.; Beauchemin, K.A.; Bonesmo, H.; Aass, L. Farm Scale Modelling of Greenhouse Gas Emissions from Semi-Intensive Suckler Cow Beef Production. Agric. Syst. 2019, 176, 102670. [Google Scholar] [CrossRef]
  91. Sykes, A.J.; Topp, C.F.E.; Rees, R.M. Understanding Uncertainty in the Carbon Footprint of Beef Production. J. Clean. Prod. 2019, 234, 423–435. [Google Scholar] [CrossRef]
  92. Veysset, P.; Lherm, M.; Bébin, D. Energy Consumption, Greenhouse Gas Emissions and Economic Performance Assessments in French Charolais Suckler Cattle Farms: Model-Based Analysis and Forecasts. Agric. Syst. 2010, 103, 41–50. [Google Scholar] [CrossRef]
  93. Vellinga, T.V.; de Vries, M. Effectiveness of Climate Change Mitigation Options Considering the Amount of Meat Produced in Dairy Systems. Agric. Syst. 2018, 162, 136–144. [Google Scholar] [CrossRef]
  94. Winkler, T.; Schopf, K.; Aschemann, R.; Winiwarter, W. From Farm to Fork—A Life Cycle Assessment of Fresh Austrian Pork. J. Clean. Prod. 2016, 116, 80–89. [Google Scholar] [CrossRef] [Green Version]
  95. Winther, U.; Hognes, E.S.; Ellingsen, H.; Ziegler, F.; Emanuelsson, A.; Sund, V. Carbon Footprint and Energy Use of Norwegian Fisheries and Seafood Products. Environ. Econ. 2009, 32, 1036. [Google Scholar] [CrossRef]
  96. Zehetmeier, M.; Läpple, D.; Hoffmann, H.; Zerhusen, B.; Strobl, M.; Meyer-Aurich, A.; Kapfer, M. Is There a Joint Lever? Identifying and Ranking Factors That Determine GHG Emissions and Profitability on Dairy Farms in Bavaria, Germany. Agric. Syst. 2020, 184, 102897. [Google Scholar] [CrossRef]
  97. Luedeling, E.; Goehring, L.; Schiffers, K.; Whitney, C.; Fernandez, E. Decision Support: Quantitative Support of Decision Making under Uncertainty; Version: 1.111; Springer: New York, NY, USA, 2022. [Google Scholar]
  98. R Development Core Team. R: A Language and Environment for Statistical Computing; R Foundation for Statistical Computing: Vienna, Austria, 2021. [Google Scholar]
  99. RStudio Team. RStudio: Integrated Development for R; RStudio, PBC.: Boston, MA, USA, 2020. [Google Scholar]
  100. Wickham, H. Ggplot2: Elegant Graphics for Data Analysis; Version 3.3.6; Springer: New York, NY, USA, 2022. [Google Scholar]
  101. United Nations, Department of Economic and Social Affairs, Population Division World Population Prospects 2022, Online Edition. Available online: https://population.un.org/wpp/Download/ (accessed on 9 May 2022).
  102. Perignon, M.; Vieux, F.; Soler, L.G.; Masset, G.; Darmon, N. Improving Diet Sustainability through Evolution of Food Choices: Review of Epidemiological Studies on the Environmental Impact of Diets. Nutr. Rev. 2017, 75, 2–17. [Google Scholar] [CrossRef] [PubMed] [Green Version]
  103. Tilman, D.; Clark, M. Global Diets Link Environmental Sustainability and Human Health. Nature 2014, 515, 518–522. [Google Scholar] [CrossRef] [PubMed]
  104. Aleksandrowicz, L.; Green, R.; Joy, E.J.M.; Smith, P.; Haines, A. The Impacts of Dietary Change on Greenhouse Gas Emissions, Land Use, Water Use, and Health: A Systematic Review. PLoS ONE 2016, 11, e0165797. [Google Scholar] [CrossRef] [Green Version]
  105. Van de Kamp, M.E.; Van Dooren, C.; Hollander, A.; Geurts, M.; Brink, E.J.; van Rossum, C.; Biesbroek, S.; de Valk, E.; Toxopeus, I.B.; Temme, E.H.M. Healthy Diets with Reduced Environmental Impact?—The Greenhouse Gas Emissions of Various Diets Adhering to the Dutch Food Based Dietary Guidelines. Food Res. Int. 2018, 104, 14–24. [Google Scholar] [CrossRef]
  106. Werner, L.B.; Flysjö, A.; Tholstrup, T. Greenhouse Gas Emissions of Realistic Dietary Choices in Denmark: The Carbon Footprint and Nutritional Value of Dairy Products. Food Nutr. Res. 2014, 58, 1–16. [Google Scholar] [CrossRef] [Green Version]
  107. Tyszler, M.; Kramer, G.; Blonk, H. Just Eating Healthier Is Not Enough: Studying the Environmental Impact of Different Diet Scenarios for Dutch Women (31–50 Years Old) by Linear Programming. Int. J. Life Cycle Assess. 2016, 21, 701–709. [Google Scholar] [CrossRef]
  108. Federal Ministry of Food and Agriculture. Deutschland, Wie Es Isst. Ernährungsreport 2022; The Federal Ministry of Food and Agriculture is the Publisher: Berlin, Germany, 2022. [Google Scholar]
  109. Moschis, G.P.; Mathur, A.; Shannon, R. Toward Achieving Sustainable Food Consumption: Insights from the Life Course Paradigm. Sustainability 2020, 12, 5359. [Google Scholar] [CrossRef]
  110. United Nations Framework Convention on Climate Change. Adoption of the Paris Agreement; United Nations Framework Convention on Climate Change: Paris, France, 2015. [Google Scholar]
  111. Weber, C.L.; Matthews, H.S. Food-Miles and the Relative Climate Impacts of Food Choices in the United States. Environ. Sci. Technol. 2008, 42, 3508–3513. [Google Scholar] [CrossRef] [Green Version]
  112. Van Dooren, C.; Marinussen, M.; Blonk, H.; Aiking, H.; Vellinga, P. Exploring Dietary Guidelines Based on Ecological and Nutritional Values: A Comparison of Six Dietary Patterns. Food Policy 2014, 44, 36–46. [Google Scholar] [CrossRef]
  113. Vieux, F.; Rémond, D.; Peyraud, J.-L.; Darmon, N. Approximately Half of Total Protein Intake by Adults Must Be Animal-Based to Meet Non-Protein Nutrient-Based Recommendations with Variation Due to Age and Sex. J. Nutr. 2022, 11, nxac150. [Google Scholar] [CrossRef] [PubMed]
  114. DGE (German Nutrition Society). DGE Quality Standard for Meals in Schools, 5th ed.; DGE: Bonn, Germany, 2022. [Google Scholar]
  115. Wellesley, L.; Happer, C.; Froggatt, A. Changing Climate, Changing Diets: Pathways to Lower Meat Consumption; The Royal Institute of International Affairs, Chatham House: London, UK, 2015; ISBN 978-1-78413-055-8. [Google Scholar]
  116. Popp, A.; Lotze-Campen, H.; Bodirsky, B. Food Consumption, Diet Shifts and Associated Non-CO2 Greenhouse Gases from Agricultural Production. Glob. Environ. Chang. 2010, 20, 451–462. [Google Scholar] [CrossRef]
  117. Rosenzweig, C.; Mbow, C.; Barioni, L.G.; Benton, T.G.; Herrero, M.; Krishnapillai, M.; Liwenga, E.T.; Pradhan, P.; Rivera-Ferre, M.G.; Sapkota, T.; et al. Climate Change Responses Benefit from a Global Food System Approach. Nat. Food 2020, 1, 94–97. [Google Scholar] [CrossRef]
Figure 1. Greenhouse gas emission ranges of animal-based foods, including lower bound, median, and upper bound of 90% confidence intervals. n = number of values retrieved from the studies reviewed. Food items sorted by descending range. CO2e = carbon dioxide equivalents.
Sustainability 14 14449 g001
Figure 2. Probability density distributions (generated by 10,000 runs of a Monte Carlo simulation) for carbon footprints of the five Western European dietary patterns. They are benchmarked to the average global per capita CO2e-thresholds available for the food system for reaching the 1.5 and 2 degrees global warming targets until 2100 based on Clark et al. [2]. CO2e = carbon dioxide equivalents.
Sustainability 14 14449 g002
Table 1. Food quantities in O_medium and percentual differences of other dietary patterns.
Food ItemDifference
Vegan
to
O_medium *
Difference
Vegetarian
to
O_medium *
Difference
O_low
to
O_medium *
Amount
O_medium
kg cap−1 a−1
Difference
O_high
to
O_medium *
Beans+124%+58%+33%1.9 −11%
Beef−100%−100%−90%17.8 +75%
Beer−56%−42%−38%74.3 +40%
Bottled water−56%−61%−31%163.8 −4%
Cereals+42%+20%+16%110.7 −11%
Cheese−100%−16%+3%33.5 −11%
Coffee−31%−26%−11%134.7 +2%
Eggs−100%−45%−23%12.7 −11%
Fish/seafood−100%−100%−88%21.5 +75%
Fruits+78%+22%+18%107.7 −11%
Juice−37%−12%−5%36.8 +45%
Milk−100%−33%−13%52.8 +78%
Nuts/seeds+110%+49%+28%9.7 −11%
Oils/fats−11%−3%+1%24.6 −11%
Other alcohol+7%−7%−1%12.0+6%
Other dairy−100%−31%−12%11.1 −11%
Other foods−54%−14%−7%45.6 −11%
Other red meat−100%−100%−100%50.5 +75%
Potatoes+10%+5%+4%62.4 −11%
Poultry−100%−100%−76%19.7 +75%
Rice+42%+20%+16%4.1 −11%
Soft drinks−45%−46%−53%49.0 +12%
Milk
alternatives
+290%+188%+100%16.8−69%
Tea+5%+4%−25%119.5 −15%
Vegetables+48%+11%+9%99.2 −11%
Wine −47%−43%−25%44.8 +35%
* Calculation based on Orlich et al. [60] and SUSLA [58]. O_medium represents an omnivorous (3–4 meat portions per week) diet. Other dietary patterns are Vegan = vegan diet, Vegetarian = vegetarian diet, O_low = omnivorous (1–2 meat portions per week) diet, and O_high = omnivorous (7 meat portions per week).
Table 2. Limitations, their influence on results, and potential improvements of the study.
NoLimitationsInfluence on Results
(Expert Guess)
Potential Improvements
(Where Applicable)
1Results are benchmarked against (a) 50%/65% probabilities of achieving the climate targets with (b) all other sectors achieving net-zero in 2050 and (c) a projection on the population growth.high
(Dietary styles might be more (or less) in line with climate change mitigation targets, but overall tendencies remain true)
use of different scenarios accounting for changes in population and application of sectoral roadmaps
2The GHGE value ranges used are limited to (a) animal-based products, (b) cradle-to-farmgate system boundaries, and (c) European products.high
(Additional impacts and reduction potentials, but conclusions regarding diets are likely to persist)
integrating bottom-up calculations into top-down data (hybrid models) to account for different countries of origin, household consumption, and waste processing, extending the system boundaries
3The number of available GHGE values does not reflect the variety of available products in the market and thus (a) can skew data and add to uncertainty, particularly if only a few sources, but also when many data points are available. The data can also (b) be outdated in some cases, and thus do not account for improvements over time (e.g., increased input efficiency)high or low
(Actual effect is (by definition) unknown. Inherent uncertainty and variability (see 2. for details) of the different GHGE data sources can augment uncertainty and variability, but also increase the chance of containing the true value in the final result. Many products are more sensitive to farming practices and underlying resource use; but, also, differences between food categories are likely to persist)
using expert judgements to verify and/or estimate GHGE value ranges (cf. [31,46,55,56]), using additional data and re-modelling of LCA studies for products with low variety in data sets and/or possibility of high influence on overall results (e.g., by different farming practices)
4The GHGE values from literature research (LCA studies) depend (a) on different methodological choices (e.g., allocation of co-products from animal husbandry) and (b) sometimes on different global warming potential factors.low
(Range width and value peaks are heavily influenced, but the differences between food categories are likely to persist)
using additional data and applying different levels of uncertainty depending on availability and robustness of GHGE values
5The composition of diets was based on (a) average and (b) mass-based data and assumptions (e.g., calorific requirements were not considered).low
(Better coverage of personal preferences, but overall dietary conclusions are likely to persist)
additional use of dietary surveys throughout different European countries to determine average consumption amounts as well as energy and nutrient intakes in order to integrate the nutrition dimension
6The data for plant-based beverages are based (a) on an online-survey and (b) restricted to the responses of users from Switzerland and Germany.very low
(Beverages have only a small effect on the overall results)
additional use of dietary surveys throughout different European countries
7The ranges shown here are assumed to follow (a) a log-normal distribution and (b) are based on different levels of aggregation (e.g., in some cases only one or two products represented an entire category of products).very low
(Distribution width is generous and should cover most cases)
using dietary information with higher resolution and applying additional means of aggregation (e.g., calorific values)
Publisher’s Note: MDPI stays neutral with regard to jurisdictional claims in published maps and institutional affiliations.

