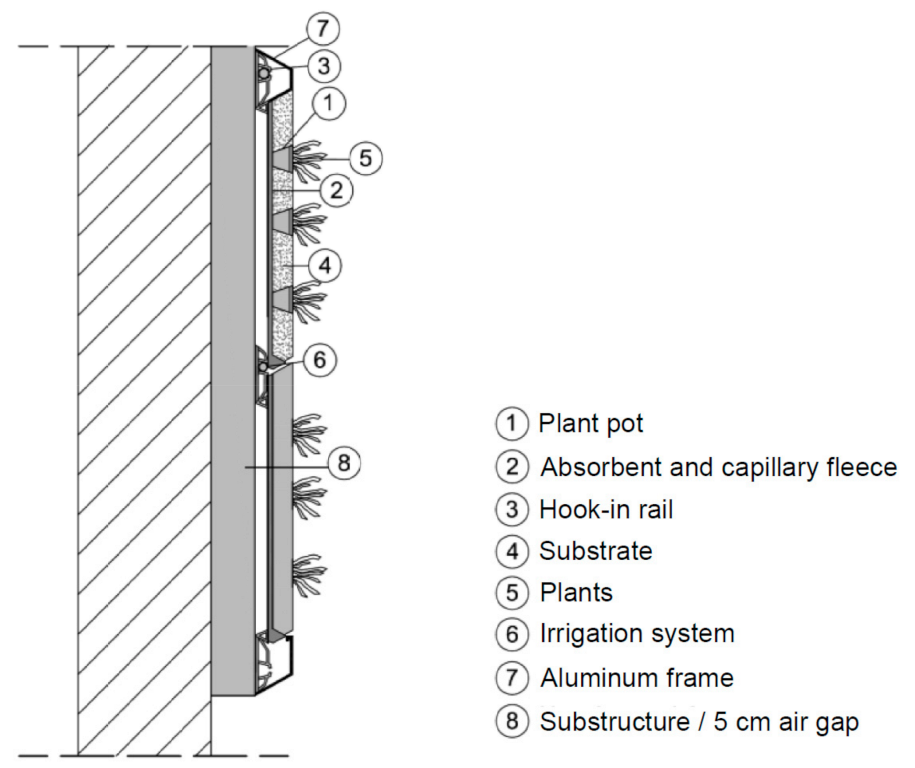
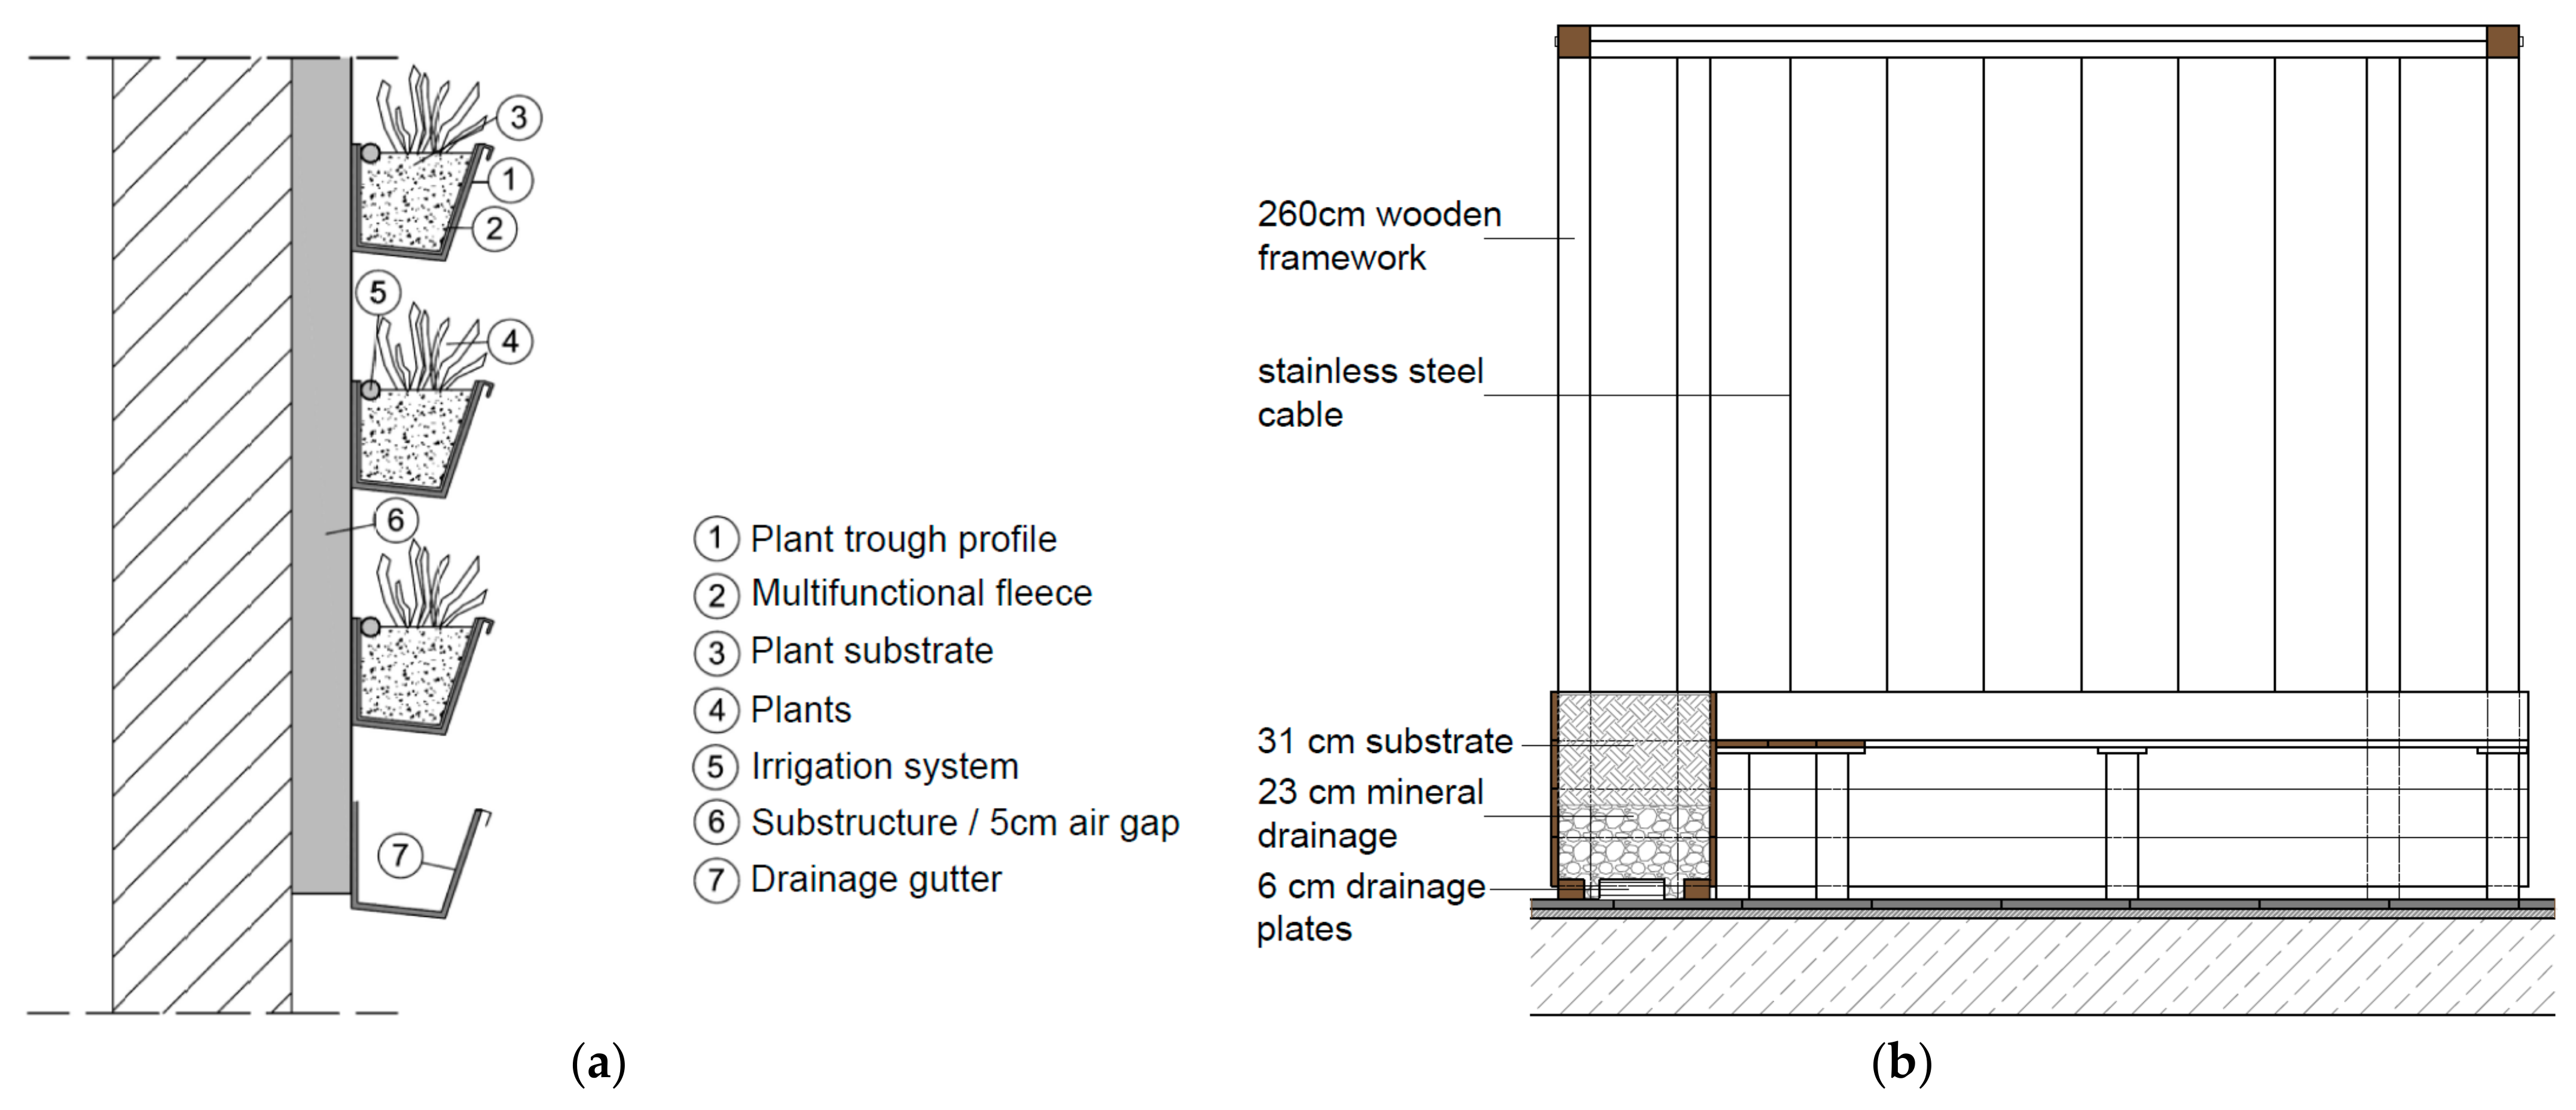
Figure 1.
Schematic vertical section [
31] of the living wall (cassette system) at Diefenbachgasse School, with the main elements given.
Figure 1.
Schematic vertical section [
31] of the living wall (cassette system) at Diefenbachgasse School, with the main elements given.
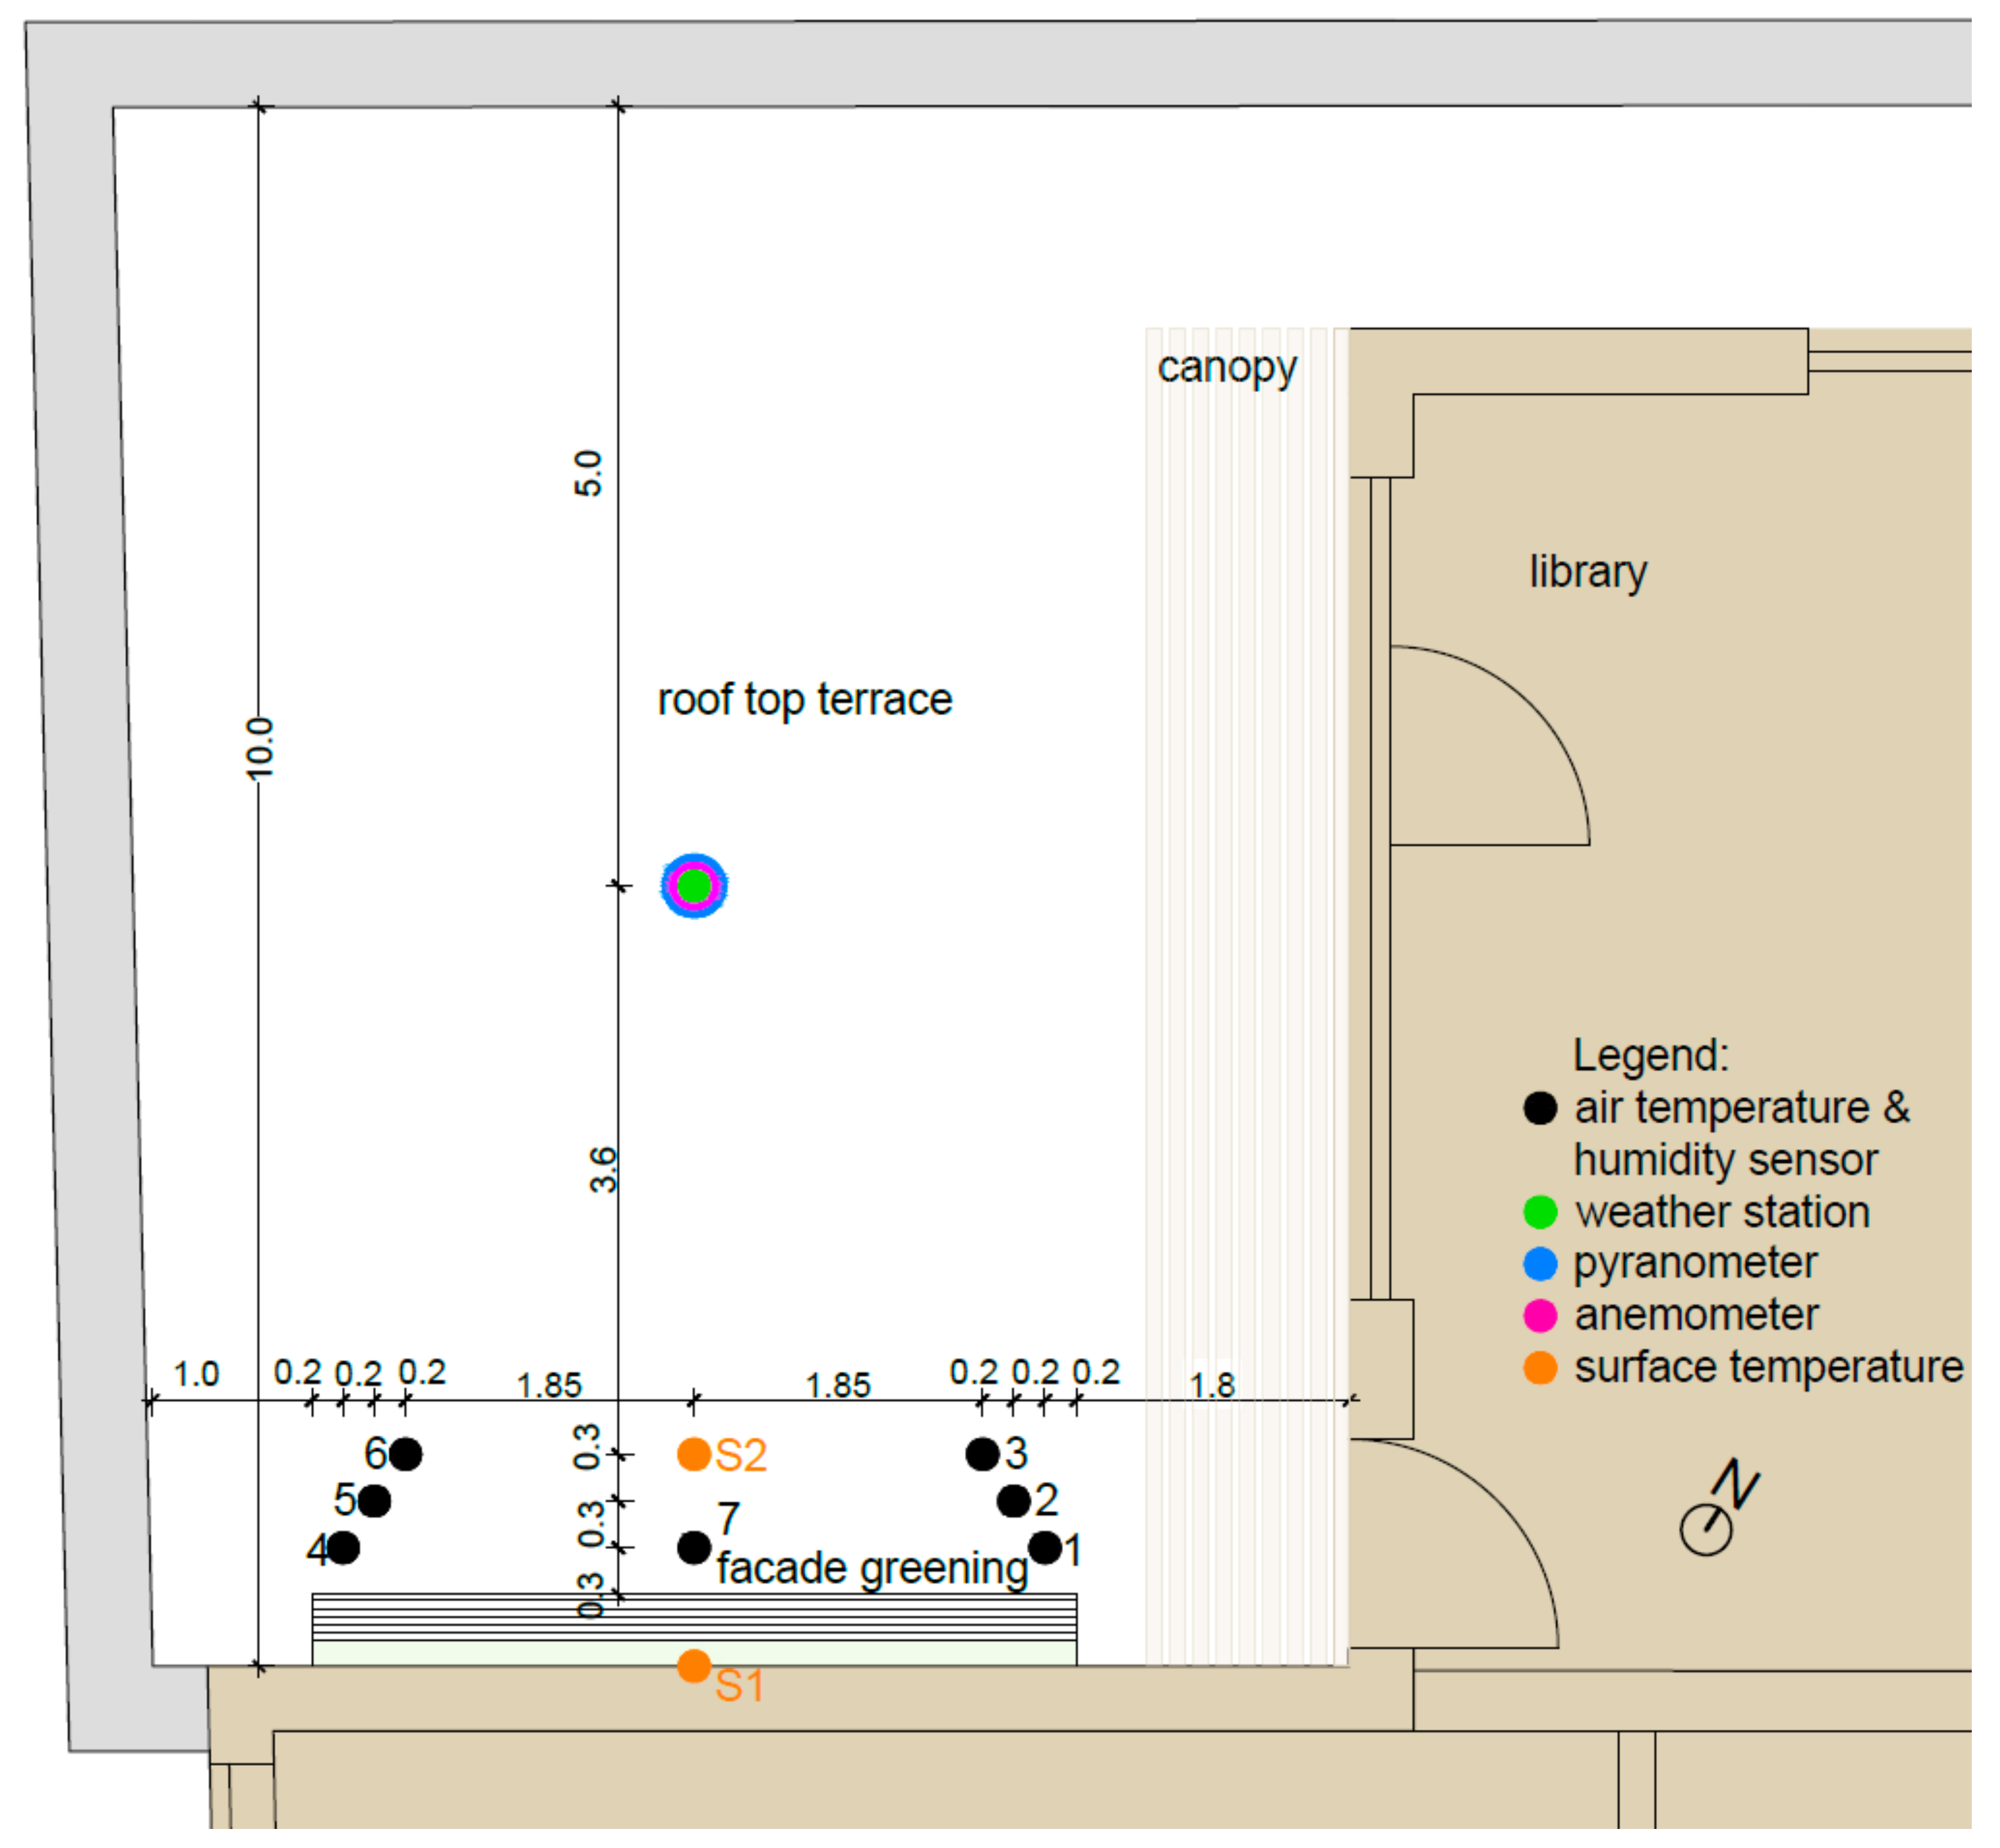
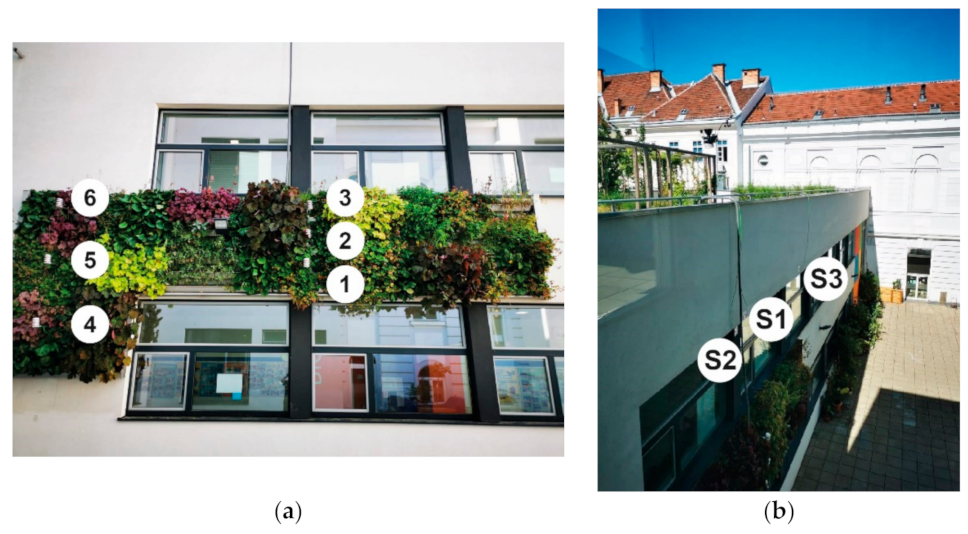
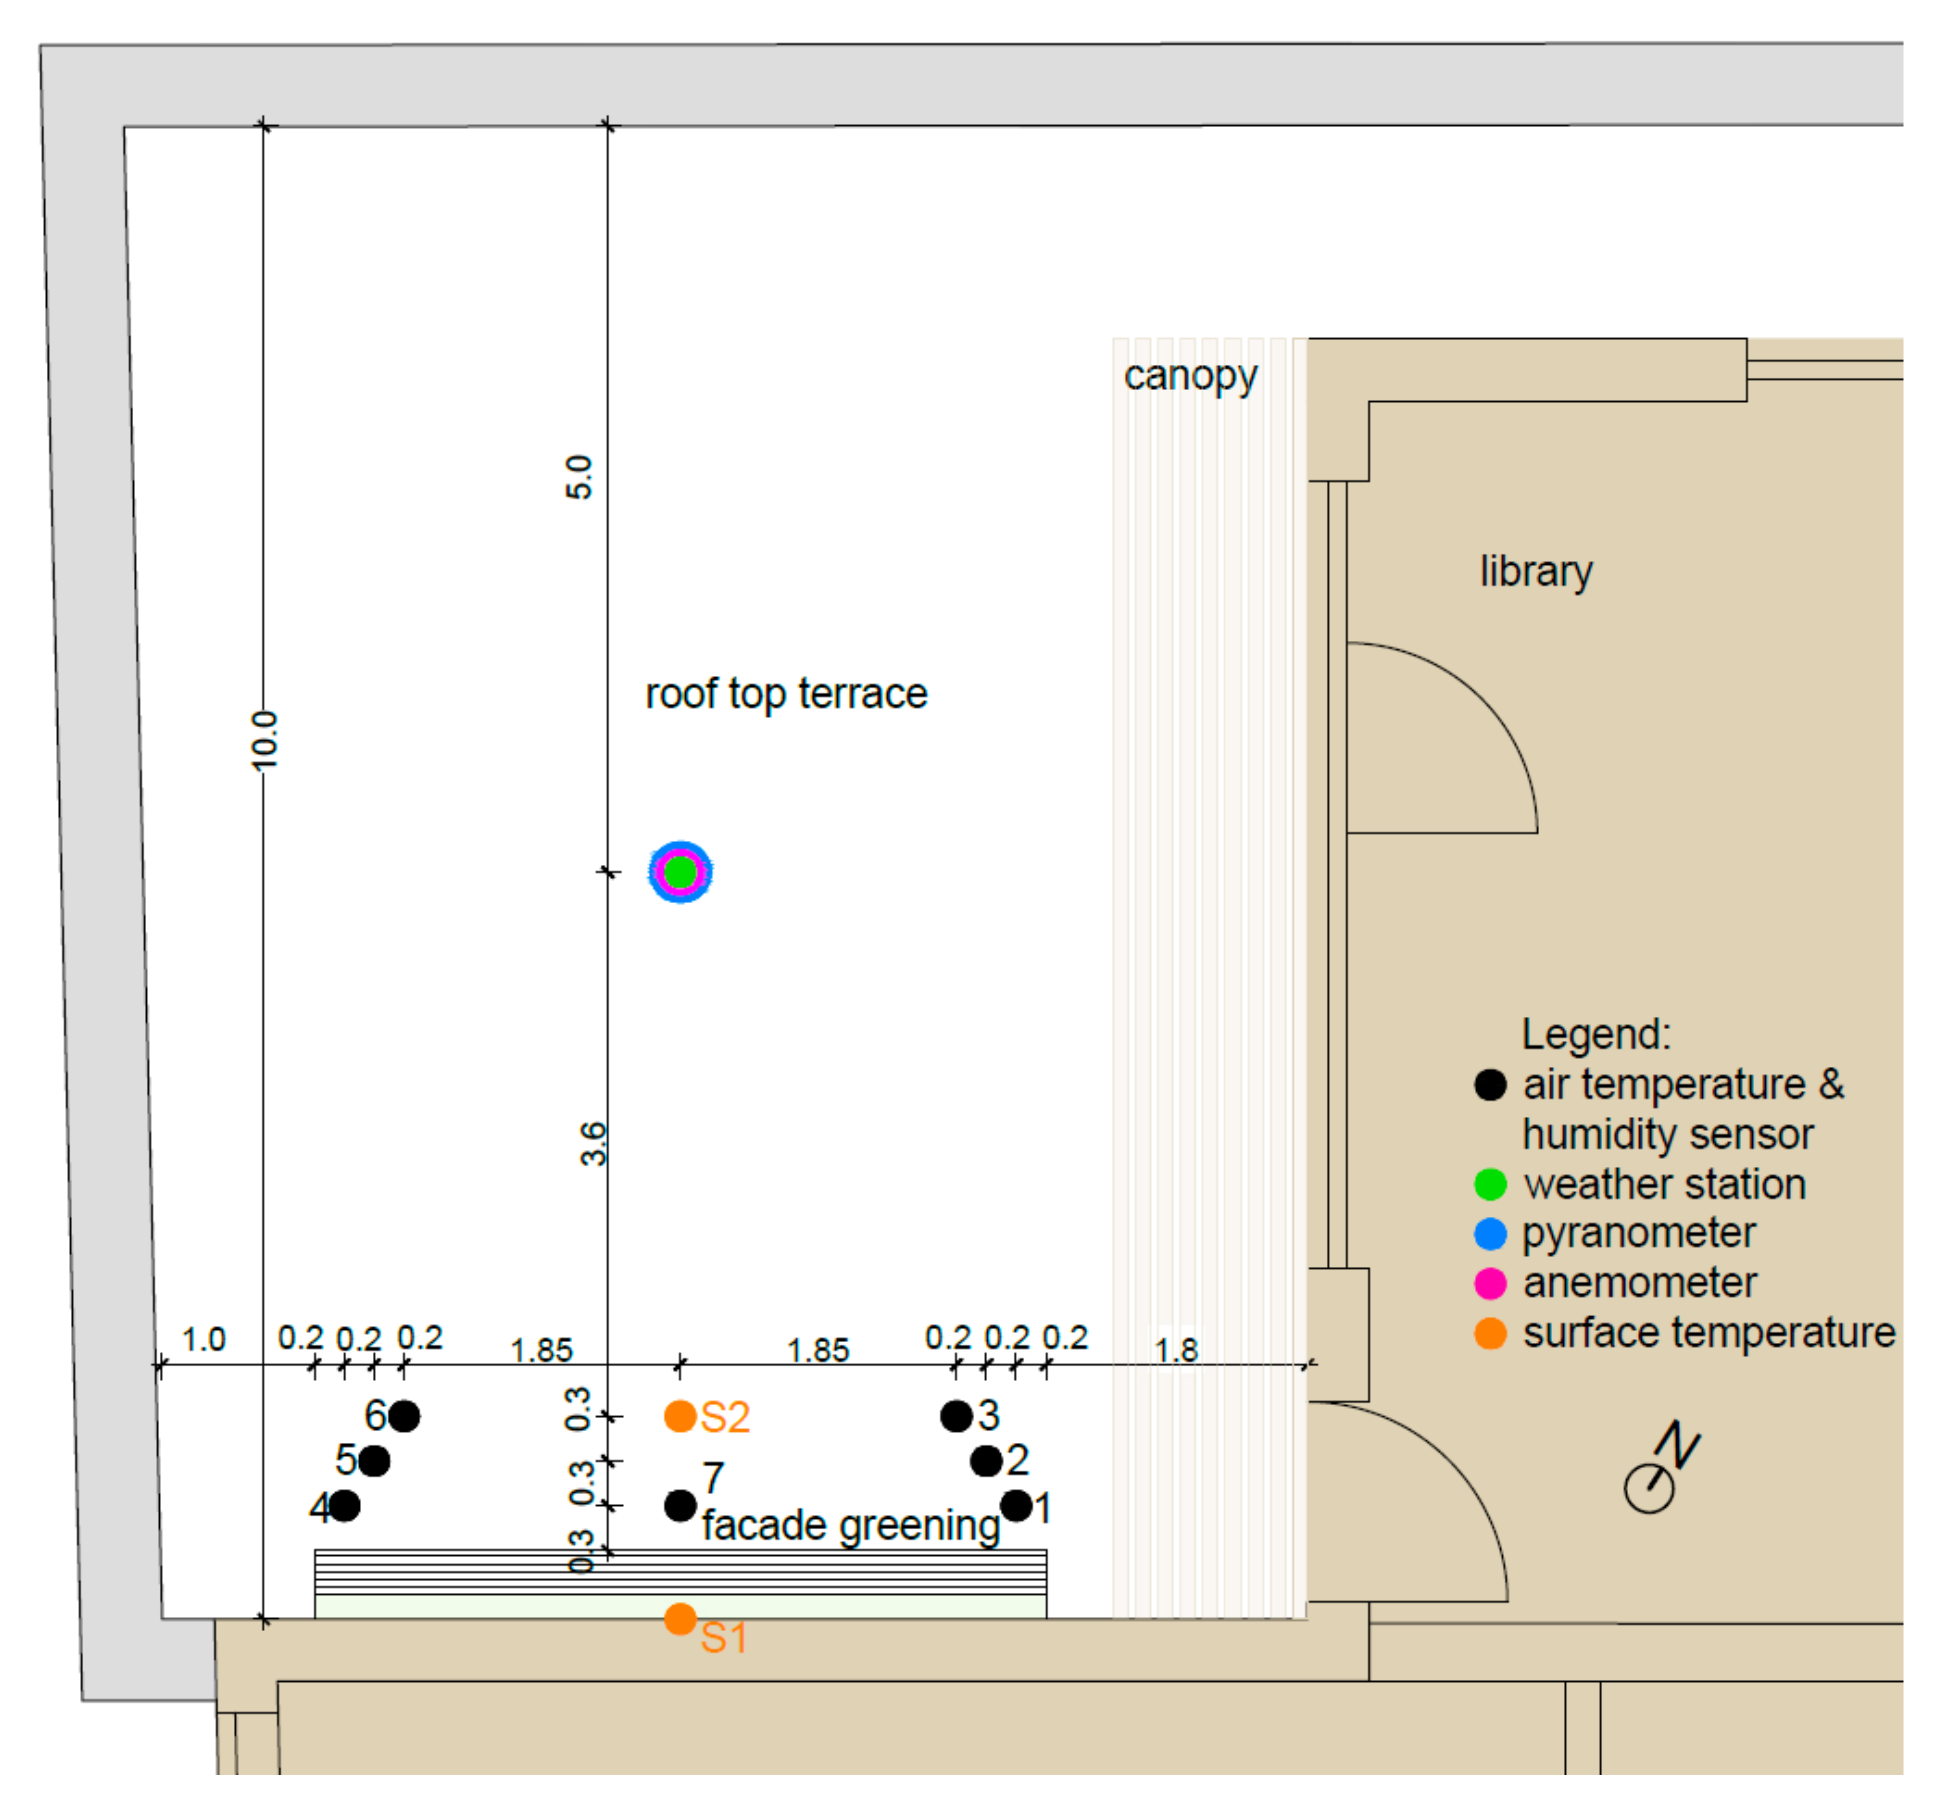
Figure 2.
Schematic representation of the positions of the installed sensors at Diefenbachgasse School with the air temperature and humidity sensors 1 to 7 and the surface temperature sensors S1 and S2.
Figure 2.
Schematic representation of the positions of the installed sensors at Diefenbachgasse School with the air temperature and humidity sensors 1 to 7 and the surface temperature sensors S1 and S2.
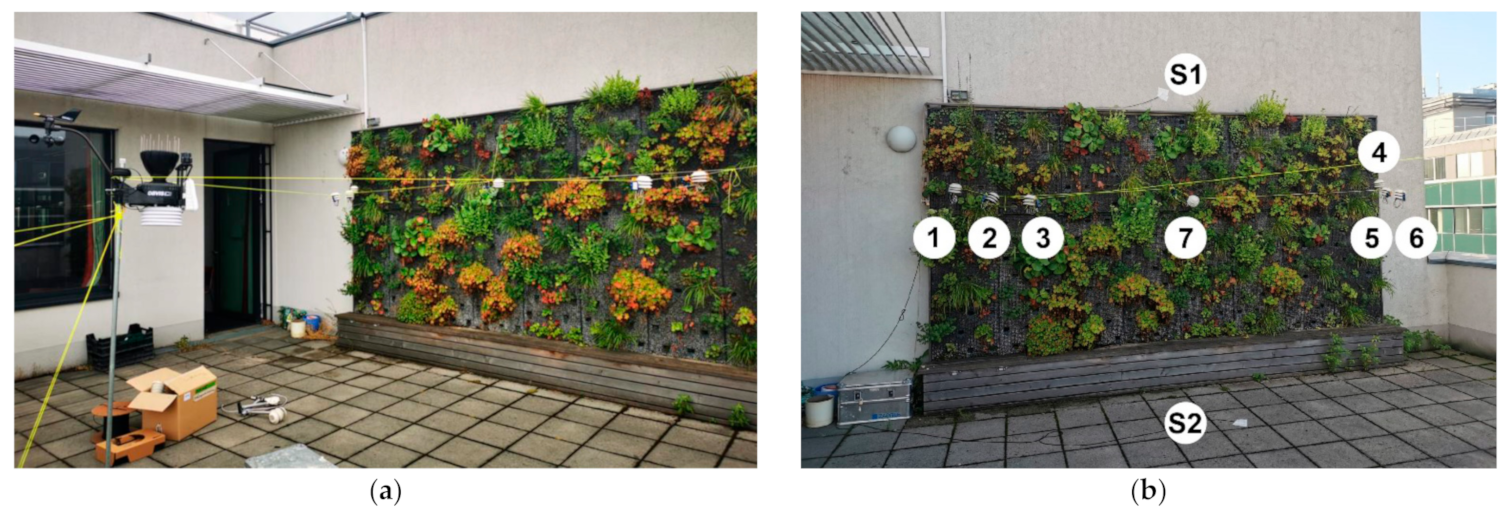
Figure 3.
Images of the installation of the sensors at Diefenbachgasse School: (a) position of the weather station; (b) position of the temperature and humidity as well as surface temperature sensors.
Figure 3.
Images of the installation of the sensors at Diefenbachgasse School: (a) position of the weather station; (b) position of the temperature and humidity as well as surface temperature sensors.
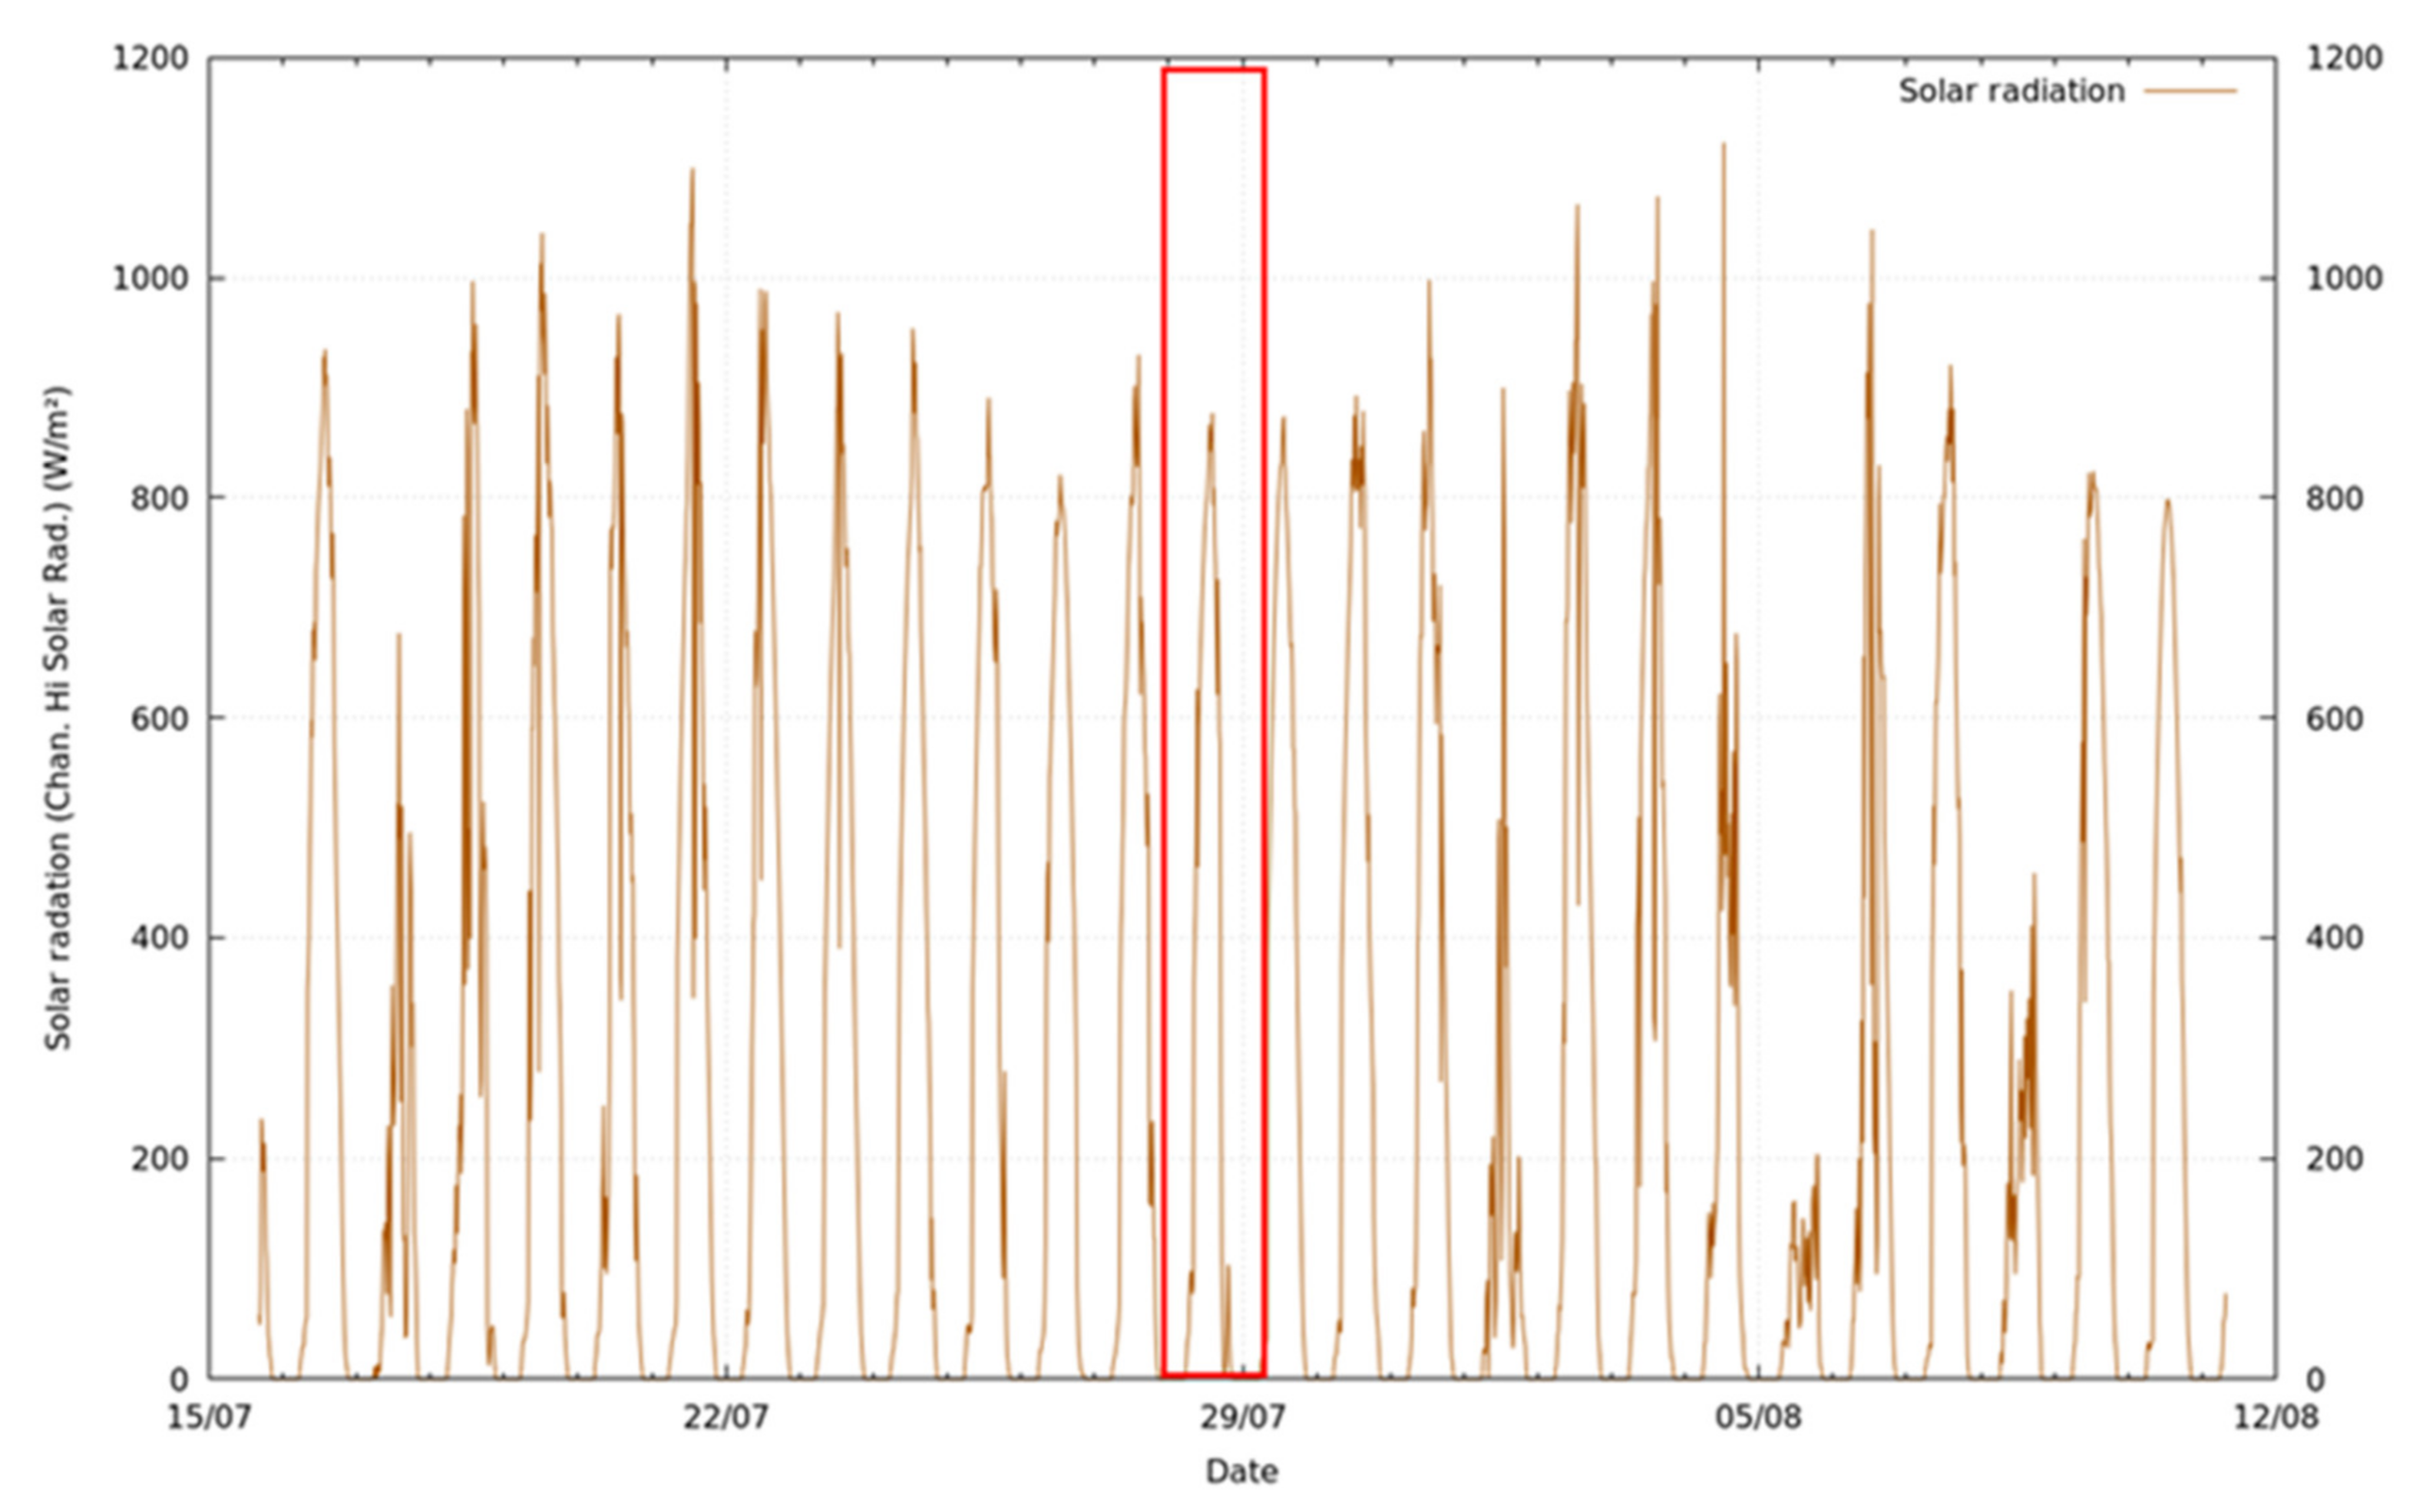
Figure 4.
Solar radiation measured by the weather station at Diefenbachgasse School during the entire measurement period in summer 2021, with the selected model day highlighted.
Figure 4.
Solar radiation measured by the weather station at Diefenbachgasse School during the entire measurement period in summer 2021, with the selected model day highlighted.
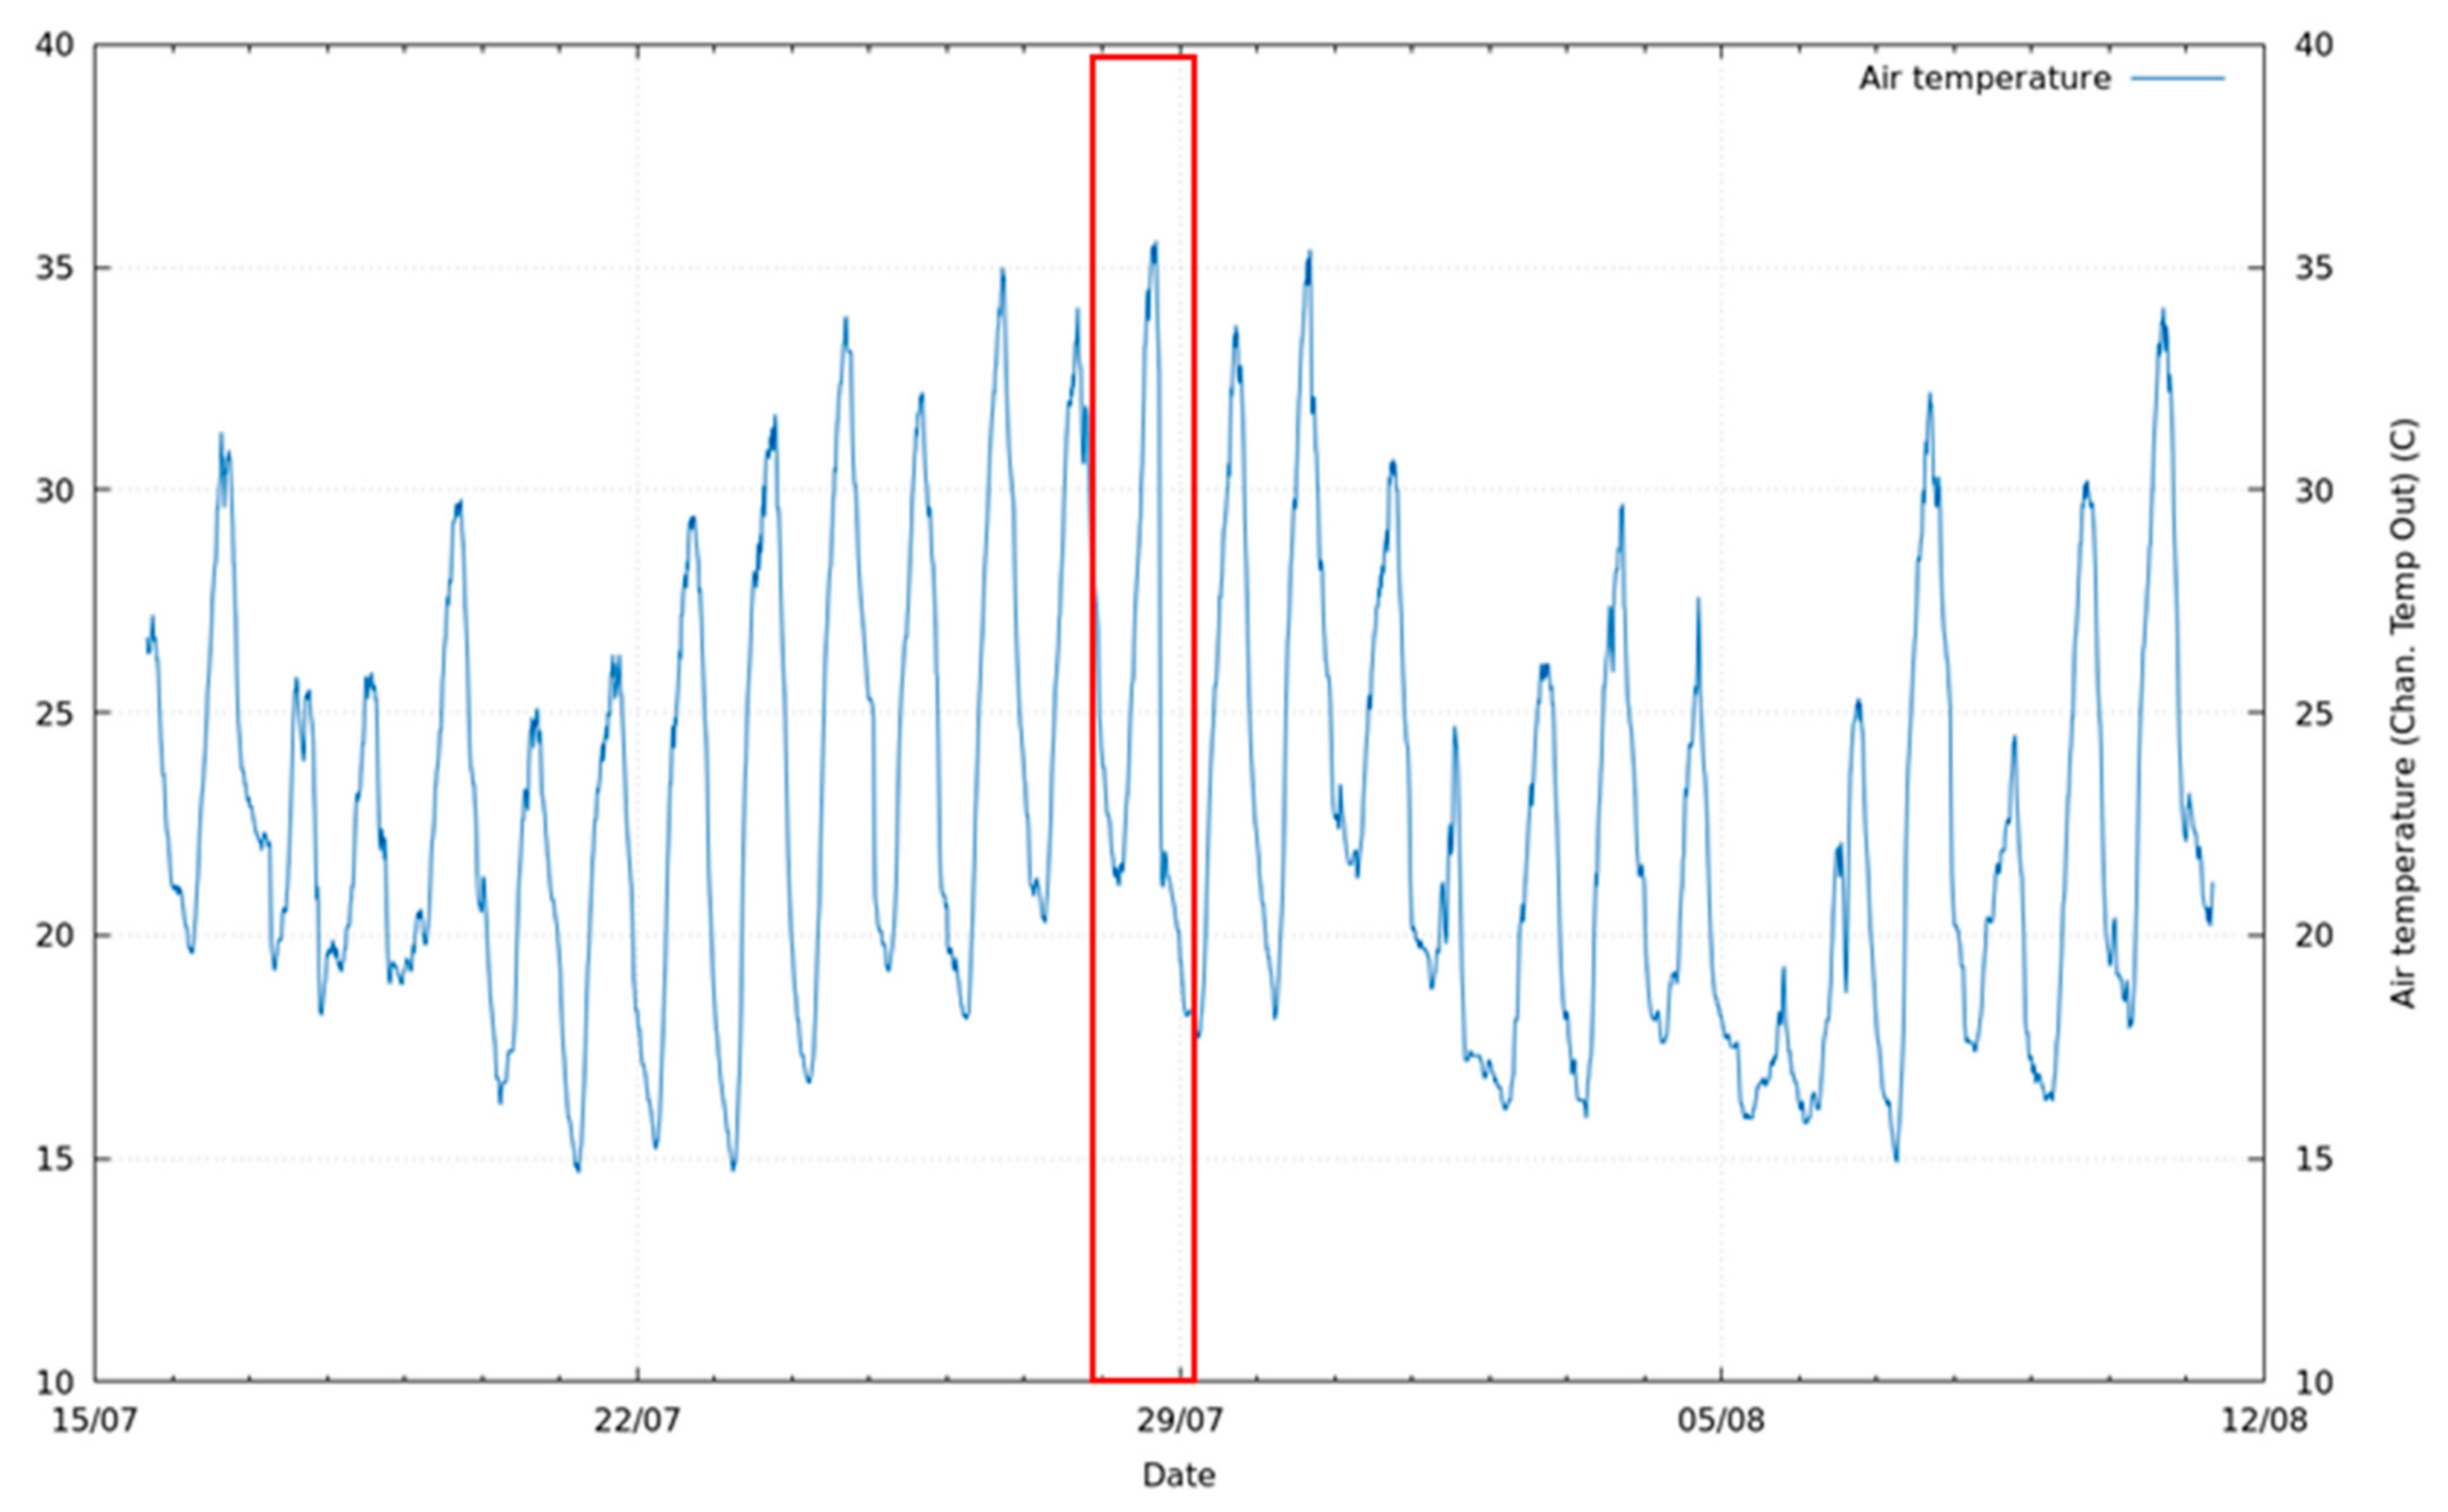
Figure 5.
Outdoor air temperature measured by the weather station at Diefenbachgasse School during the entire measurement period in summer 2021, with the selected model day highlighted.
Figure 5.
Outdoor air temperature measured by the weather station at Diefenbachgasse School during the entire measurement period in summer 2021, with the selected model day highlighted.
Figure 6.
Schematic vertical sections of the greenery systems at Schuhmeierplatz School, with their main elements given: (
a) living wall (trough system) [
31]; (
b) green pergola.
Figure 6.
Schematic vertical sections of the greenery systems at Schuhmeierplatz School, with their main elements given: (
a) living wall (trough system) [
31]; (
b) green pergola.
Figure 7.
Images of the installed sensors at Schuhmeierplatz School: (a) position of the temperature and humidity sensors in front of the living wall; (b) position of the surface temperature sensors above the living wall, and position of the weather station on the roof terrace.
Figure 7.
Images of the installed sensors at Schuhmeierplatz School: (a) position of the temperature and humidity sensors in front of the living wall; (b) position of the surface temperature sensors above the living wall, and position of the weather station on the roof terrace.
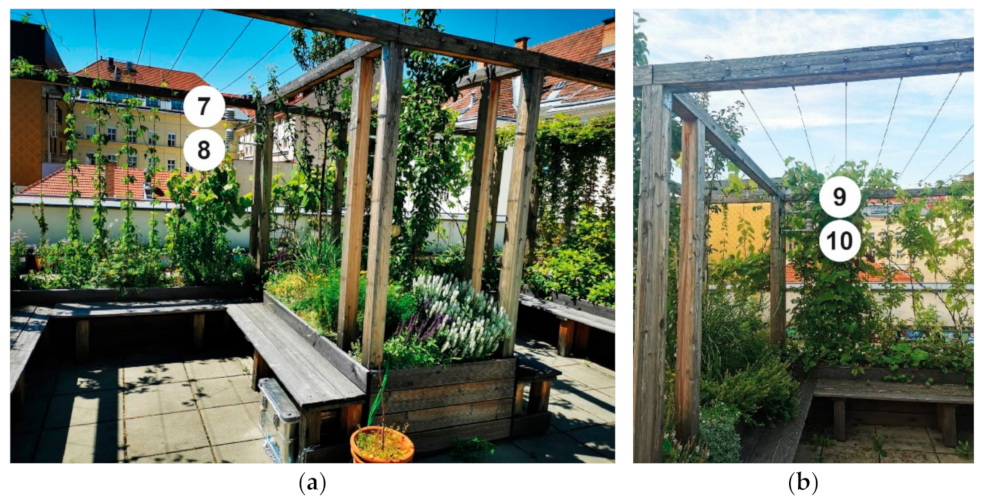
Figure 8.
Images of the installed sensors at the green pergola at Schuhmeierplatz School: (a) position of the temperature and humidity sensors on the left side of the pergola; (b) position of the temperature and humidity sensors on the right side of the pergola.
Figure 8.
Images of the installed sensors at the green pergola at Schuhmeierplatz School: (a) position of the temperature and humidity sensors on the left side of the pergola; (b) position of the temperature and humidity sensors on the right side of the pergola.
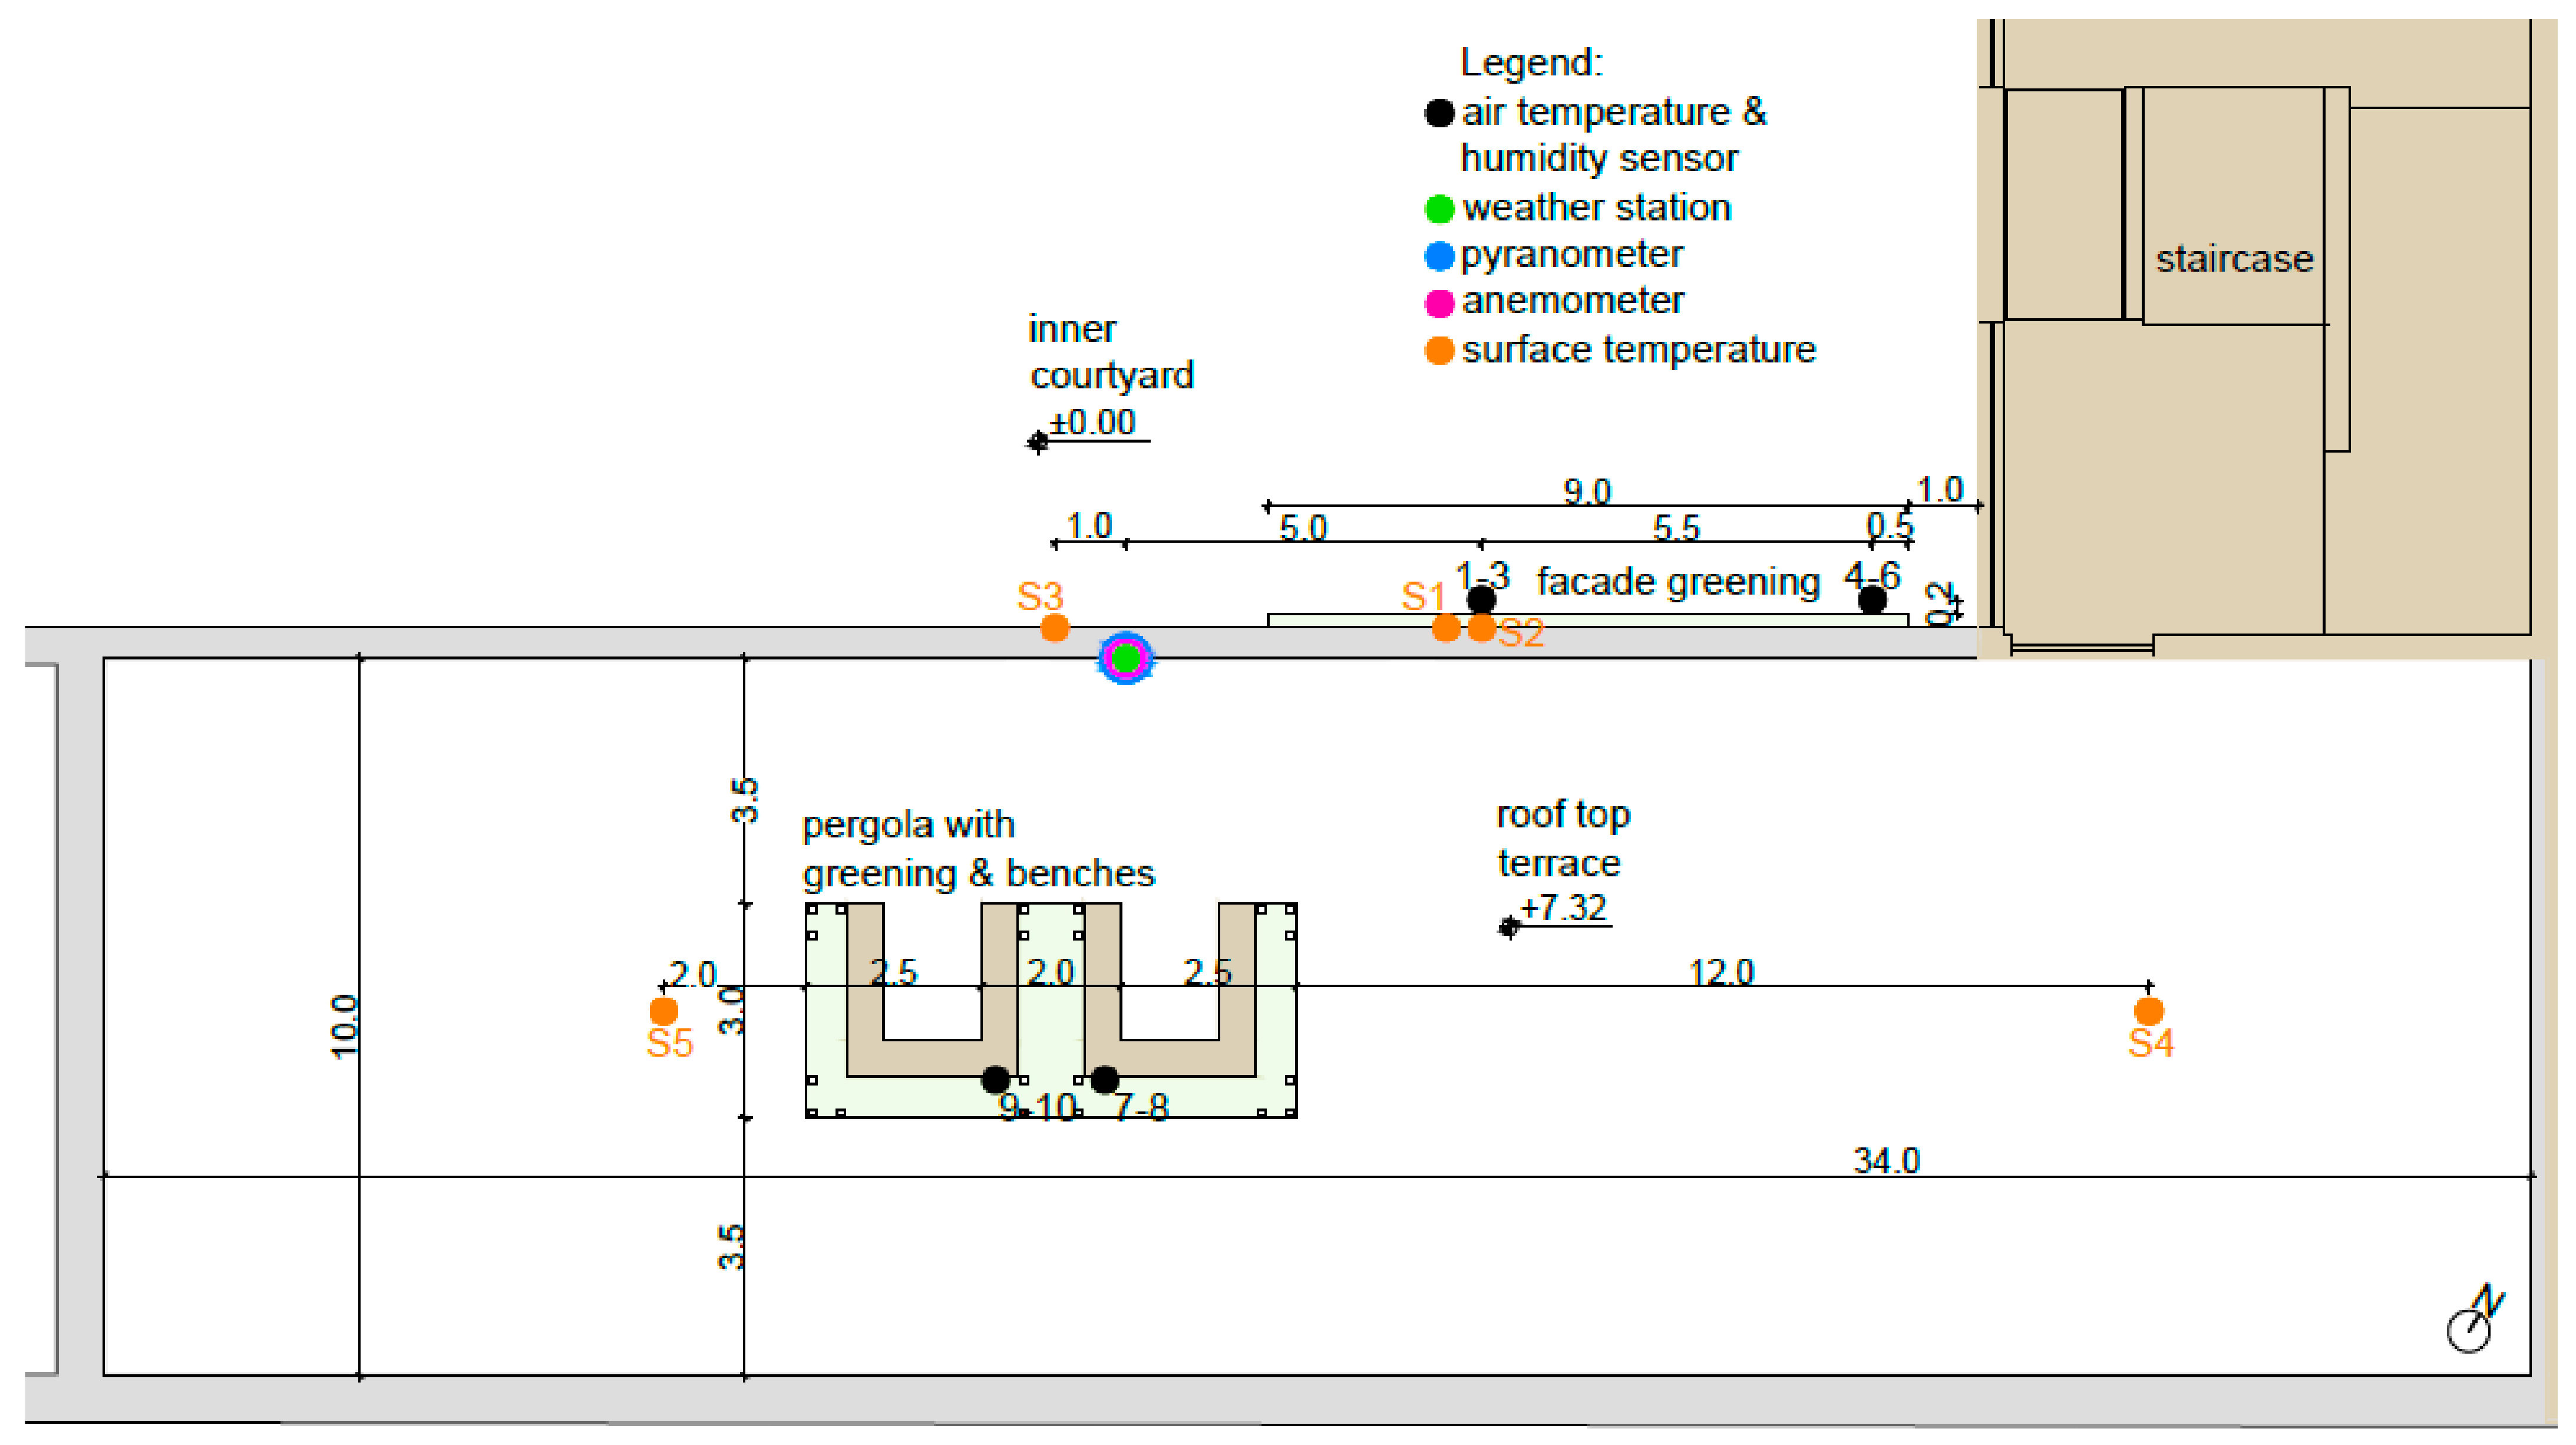
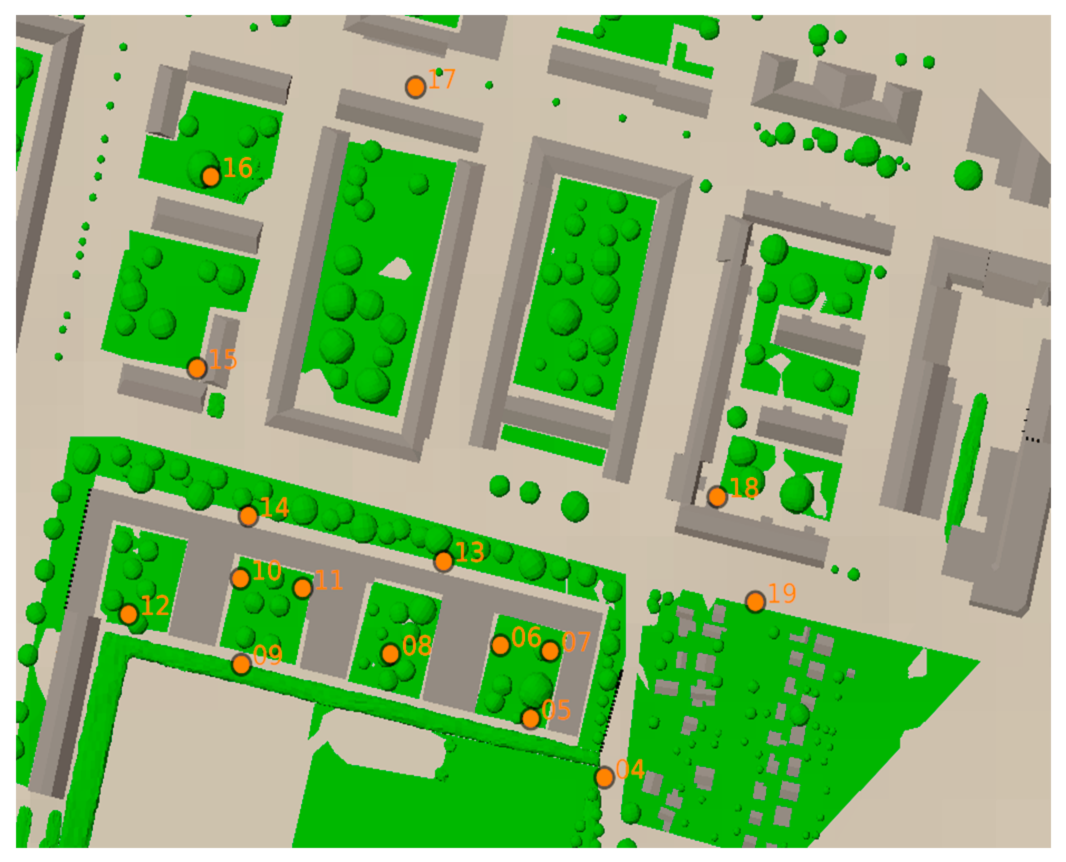
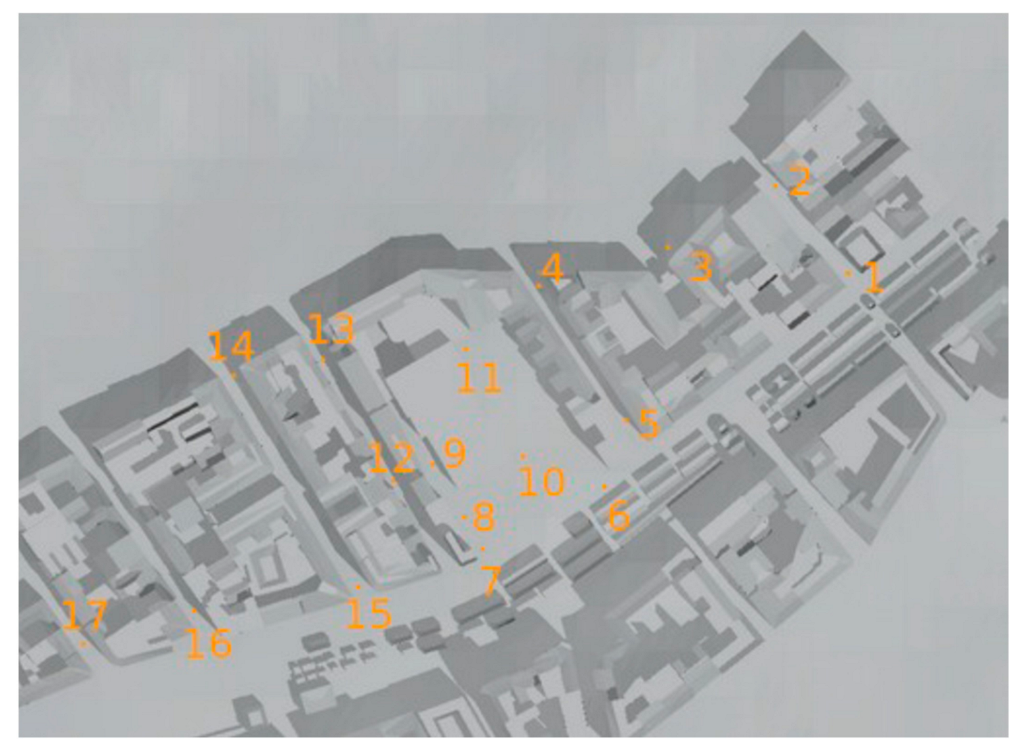
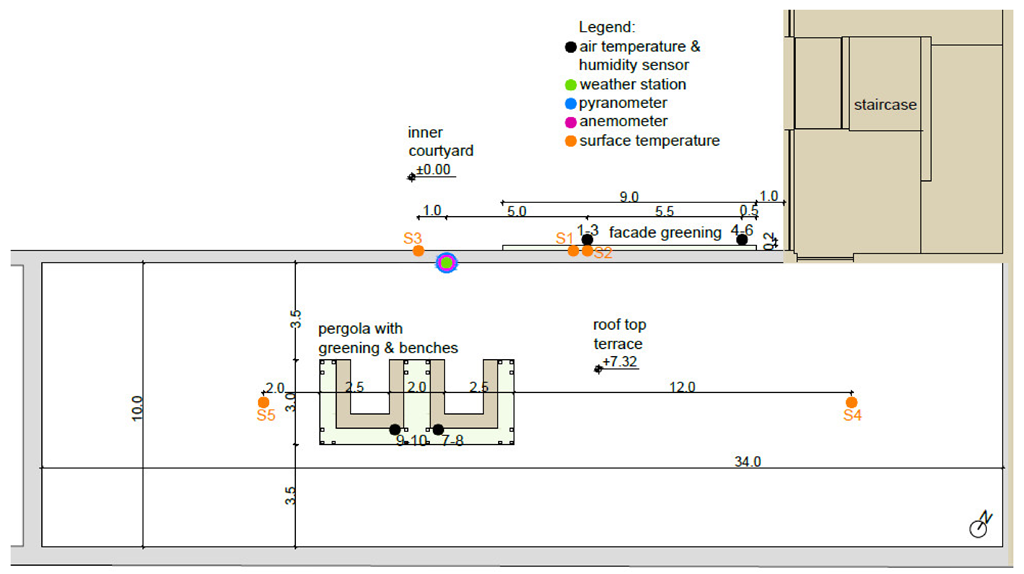
Figure 9.
Schematic representation of the positions of the installed sensors at Schuhmeierplatz School with the air temperature and humidity sensors 1 to 10 and the surface temperature sensors S1 to S5.
Figure 9.
Schematic representation of the positions of the installed sensors at Schuhmeierplatz School with the air temperature and humidity sensors 1 to 10 and the surface temperature sensors S1 to S5.
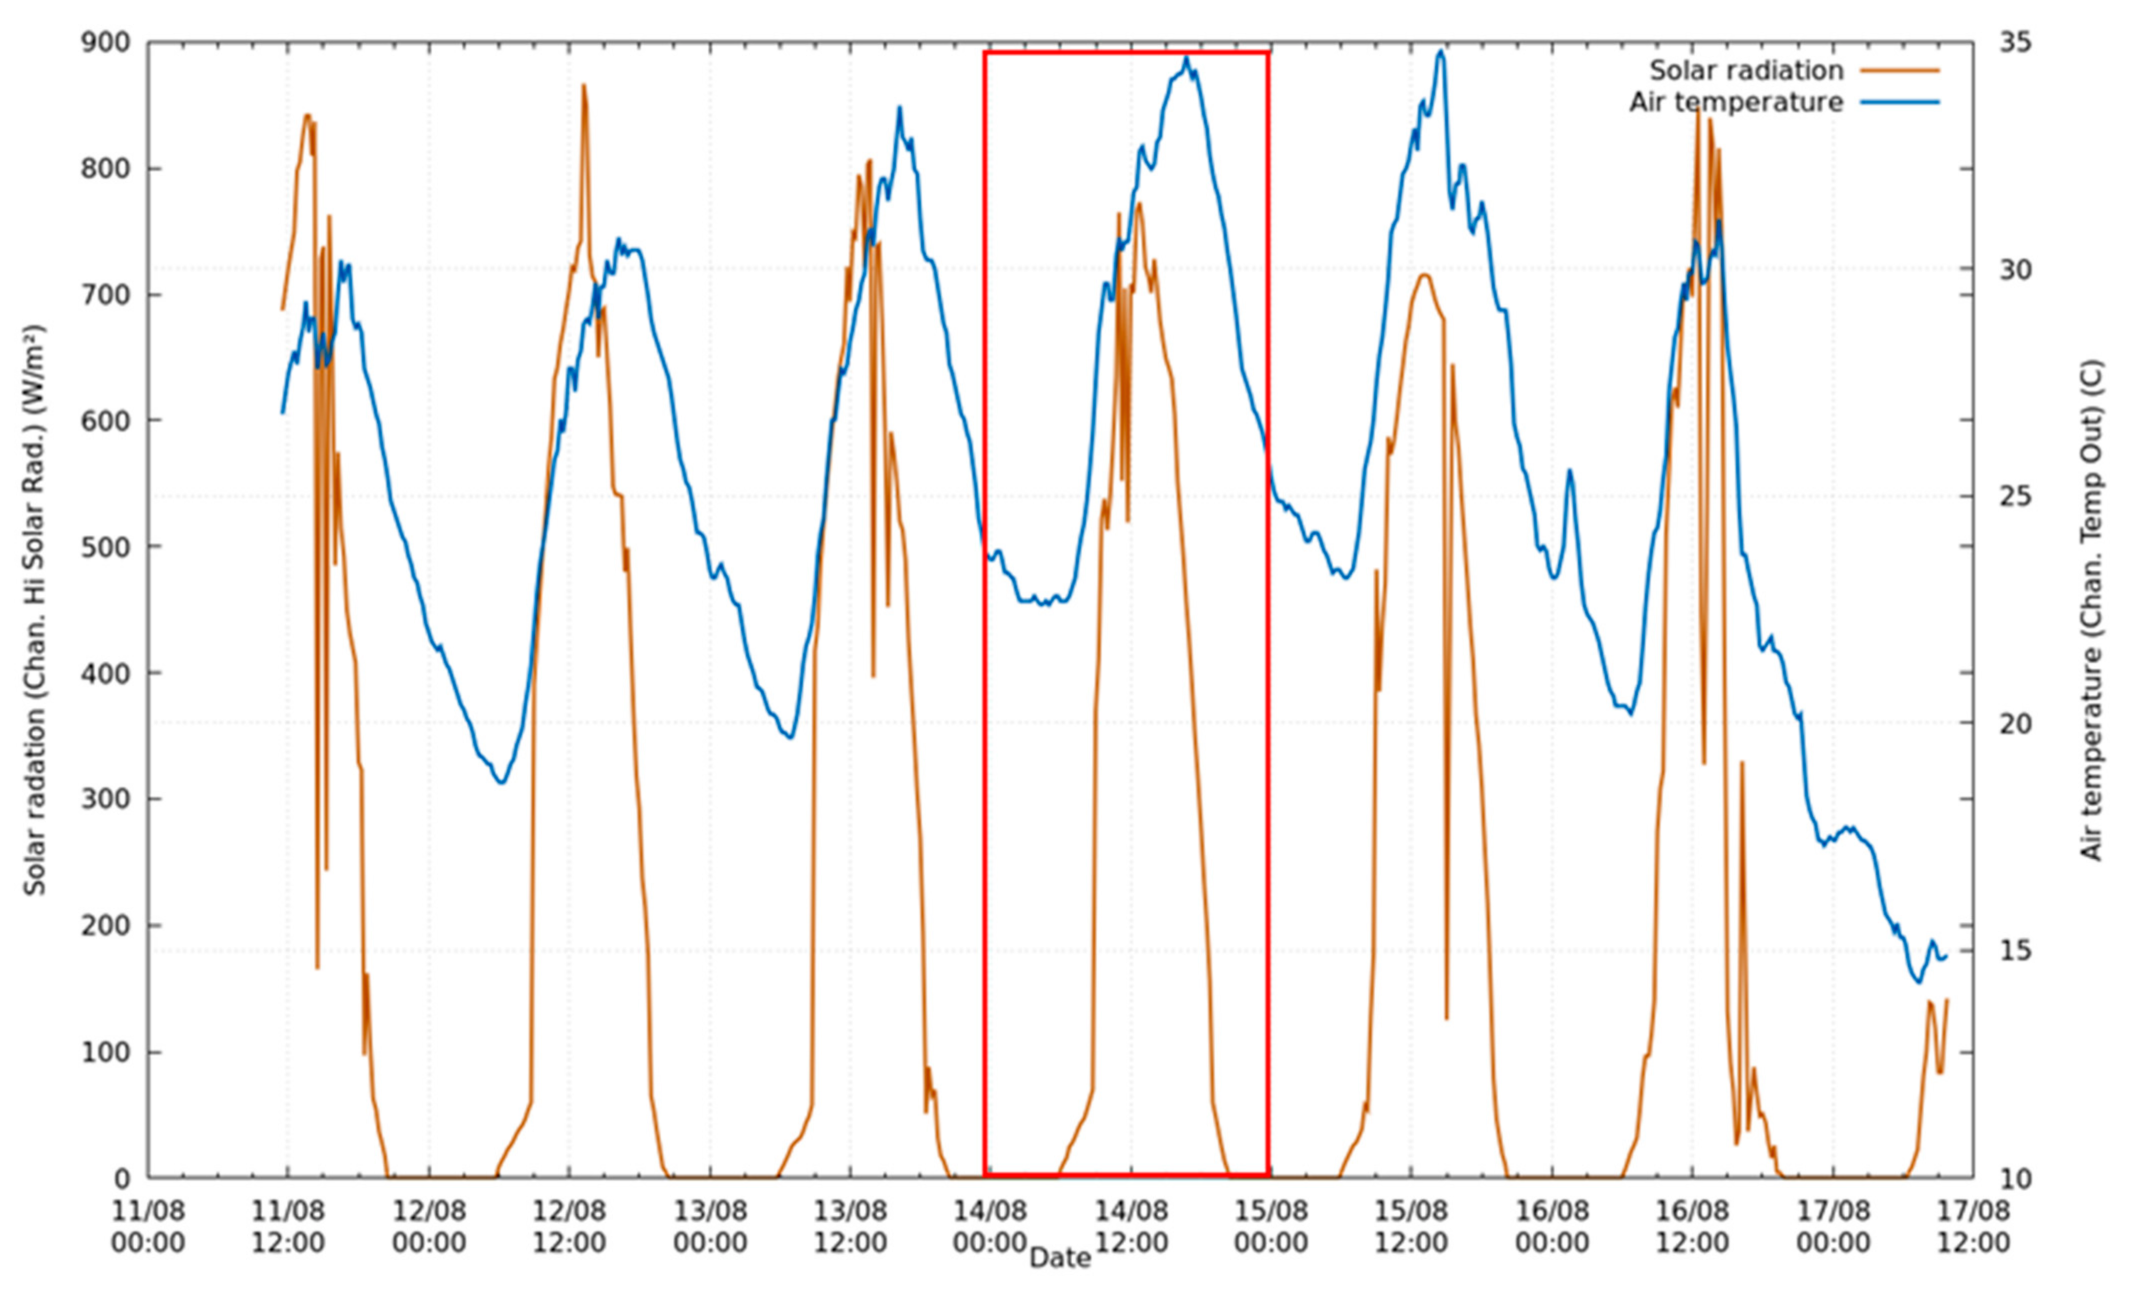
Figure 10.
Outdoor air temperature and solar radiation measured by the weather station at Schuhmeierplatz School in August 2021, with the selected model day highlighted.
Figure 10.
Outdoor air temperature and solar radiation measured by the weather station at Schuhmeierplatz School in August 2021, with the selected model day highlighted.
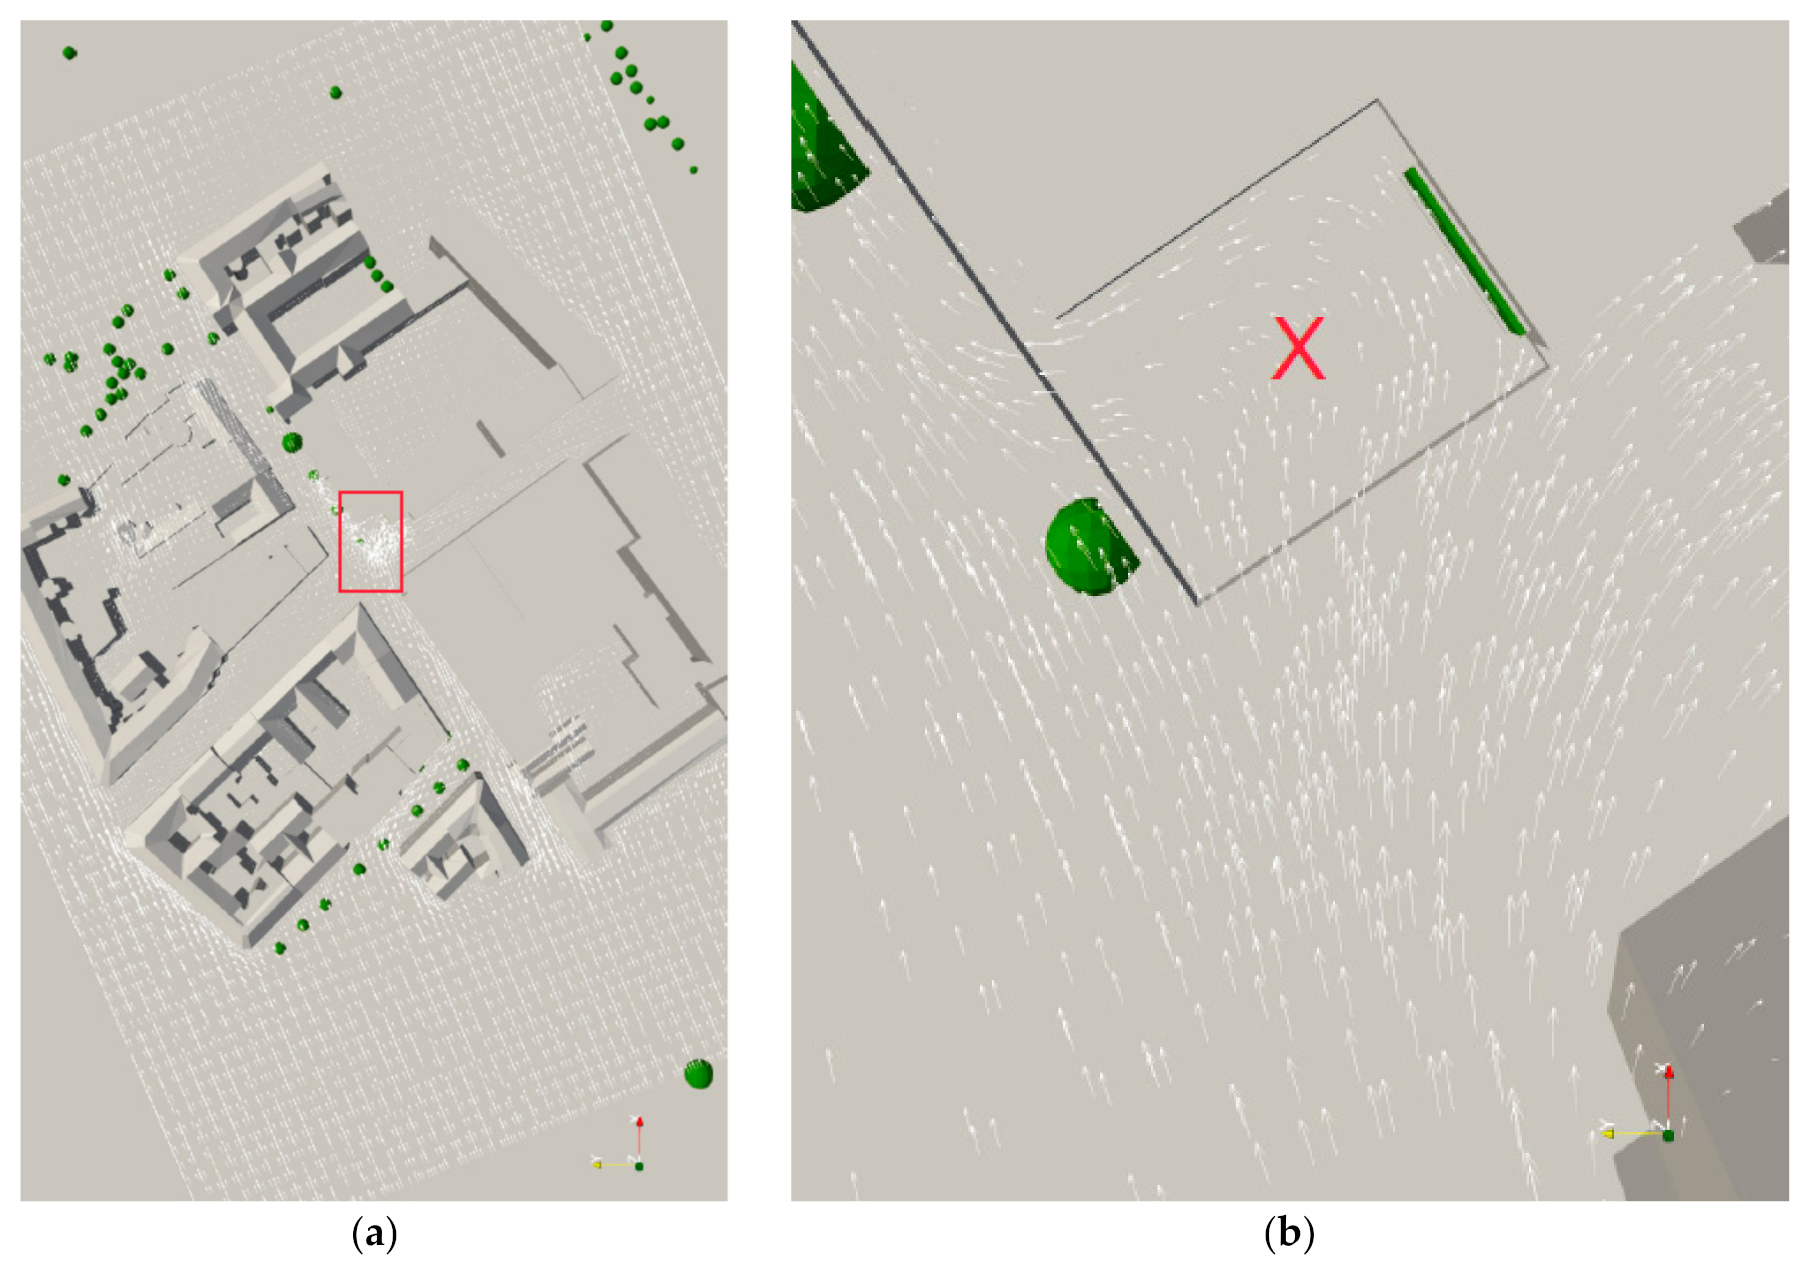
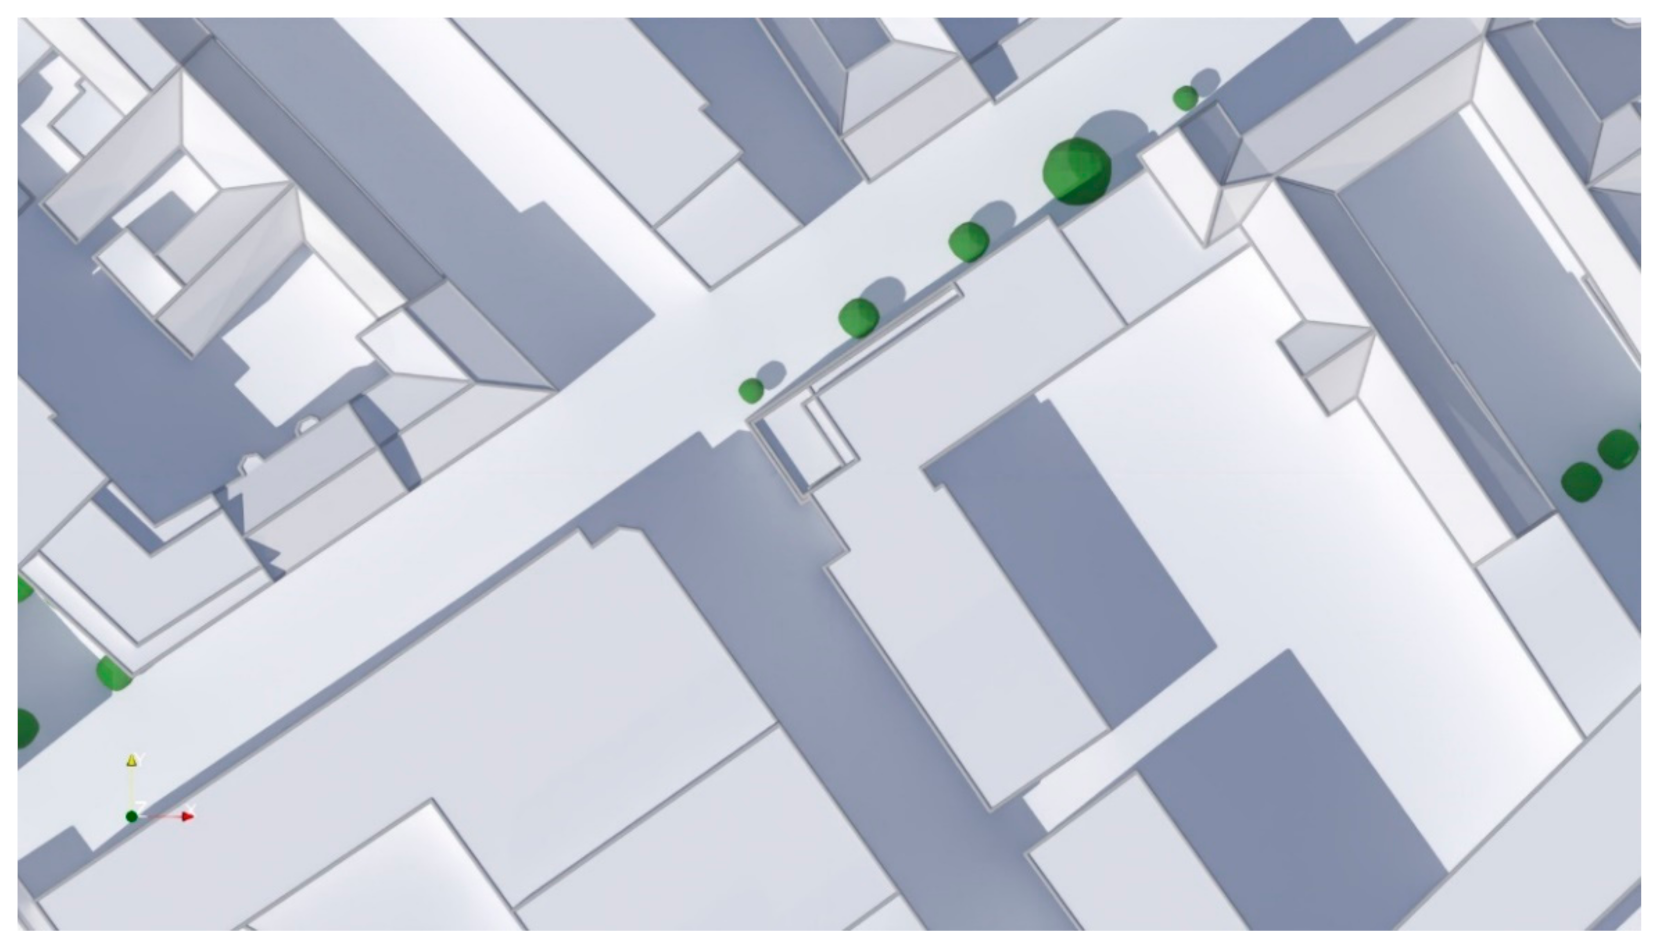
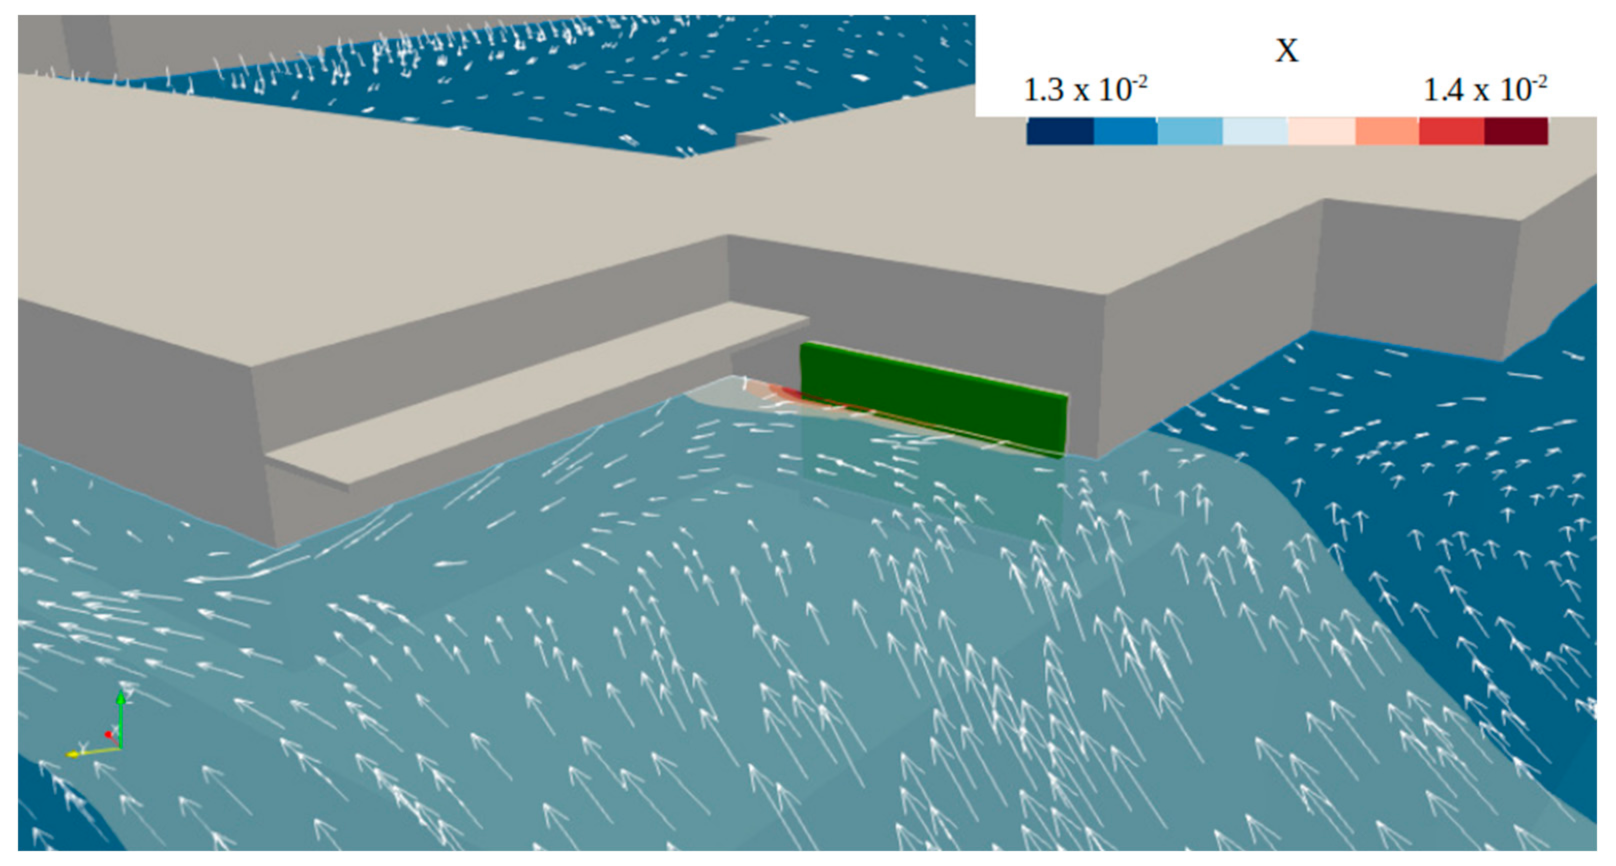
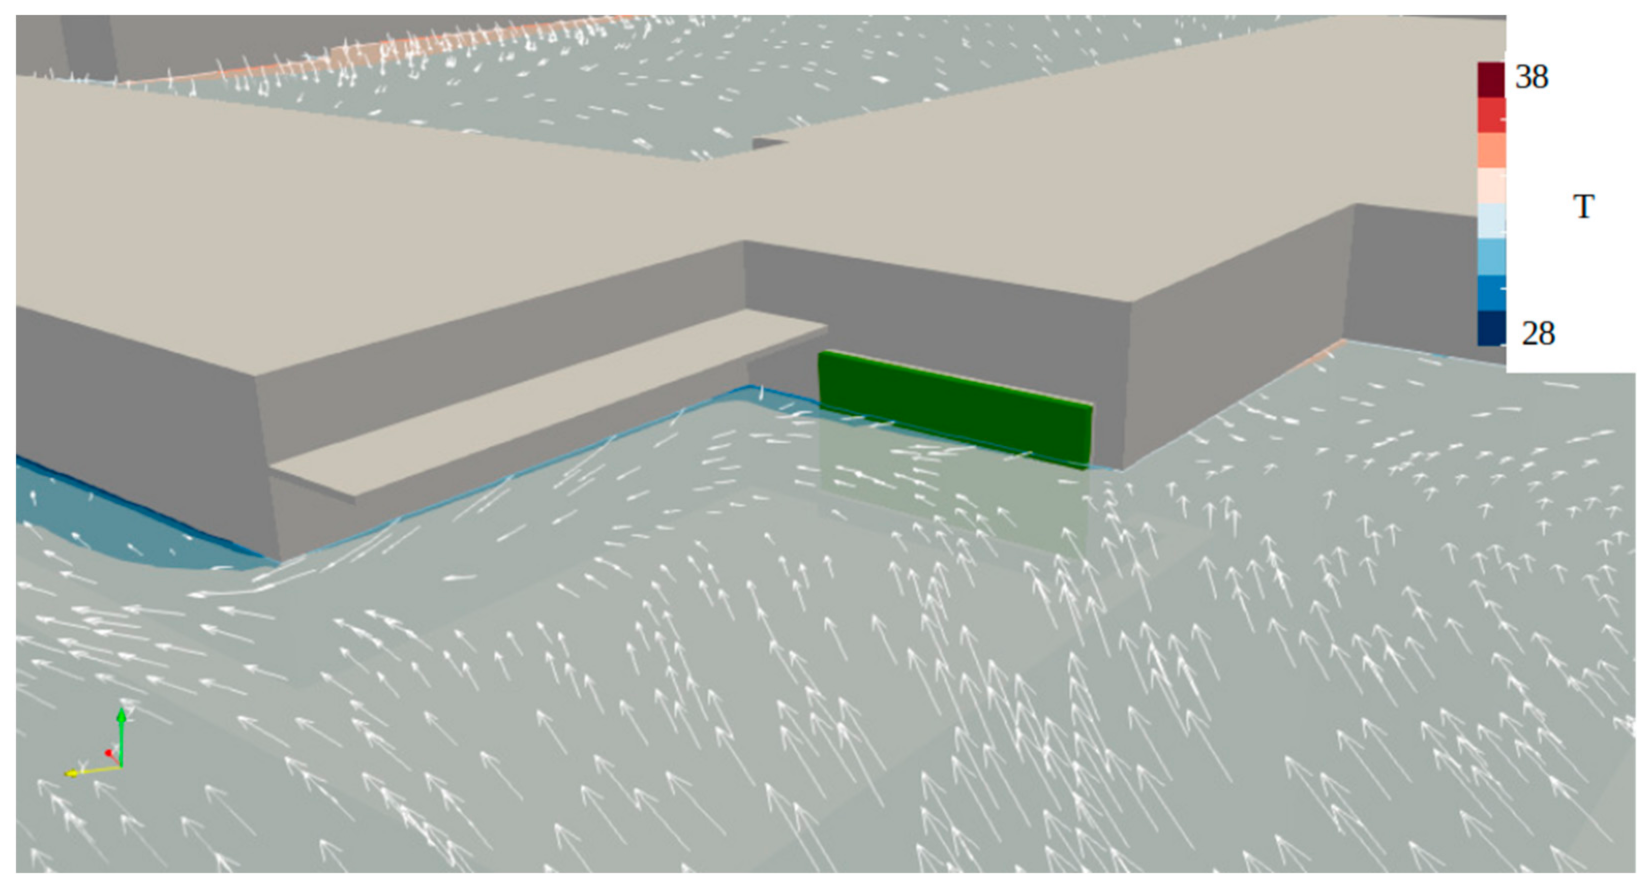
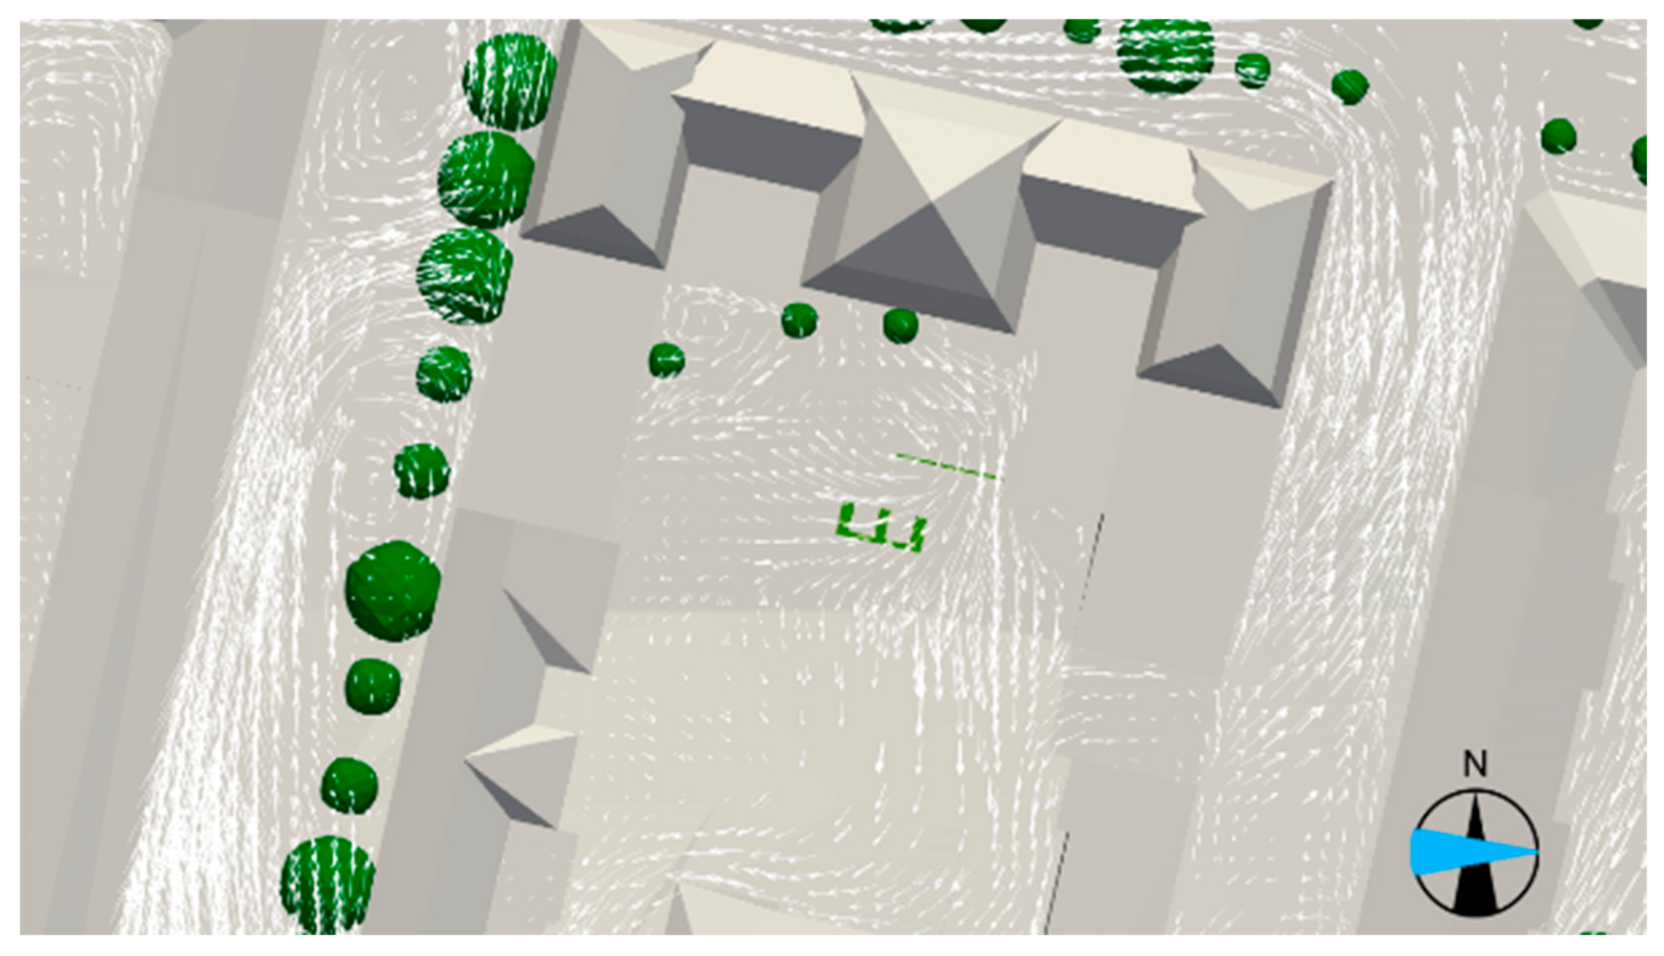
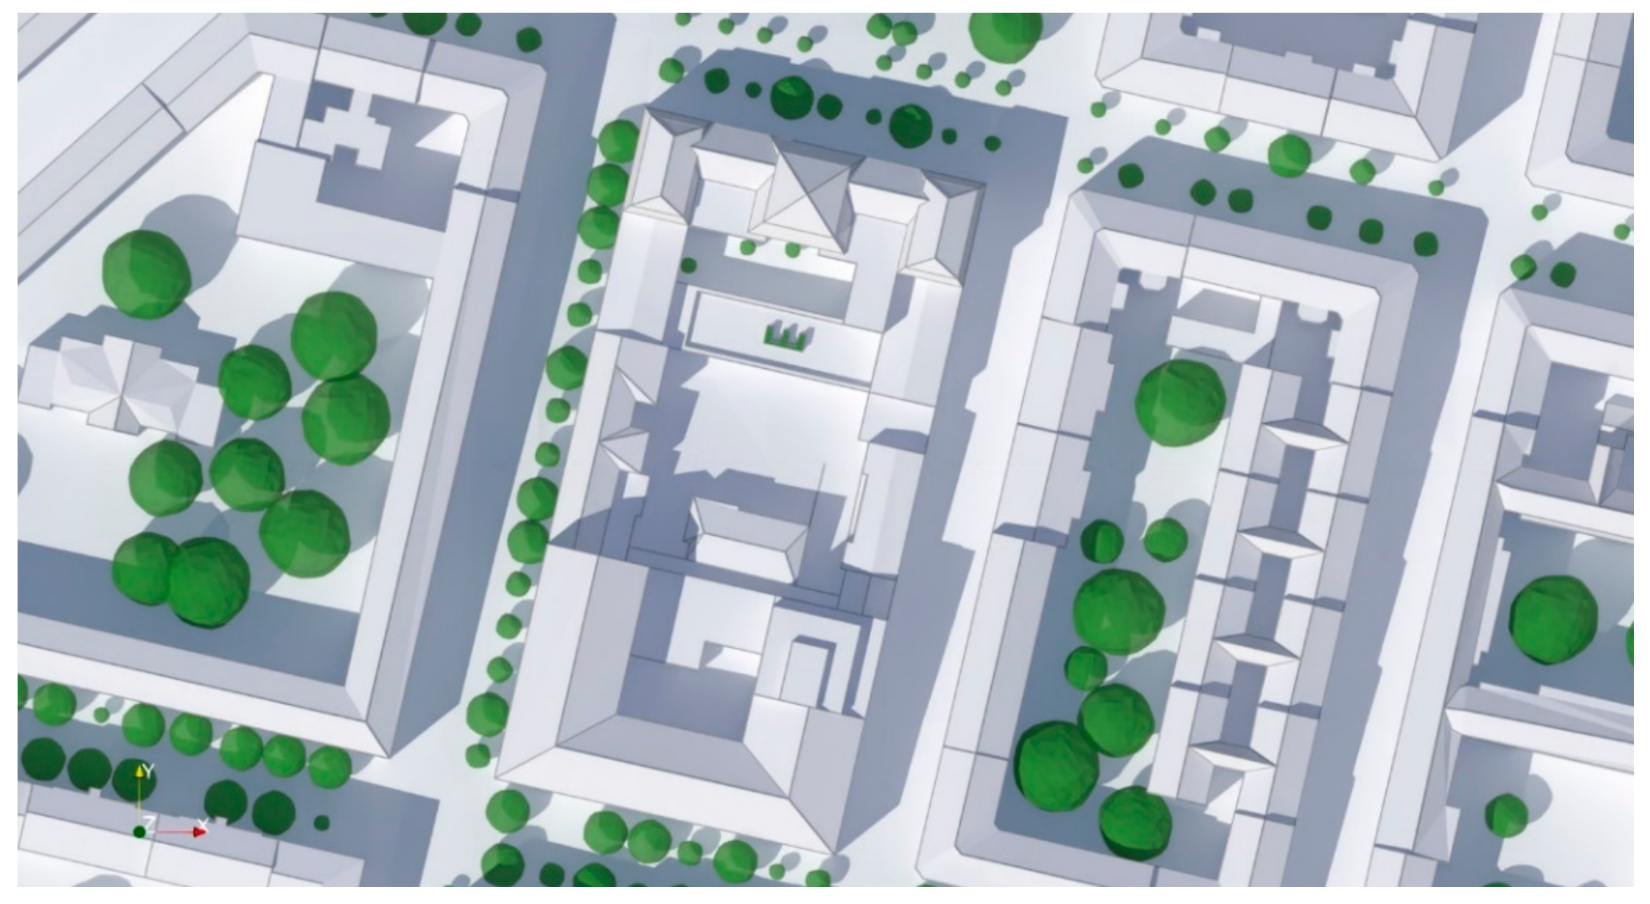
Figure 11.
Results of the wind simulation at Diefenbachgasse School: (a) representation of the entire simulation area with the roof terrace highlighted; (b) wind conditions and position of the weather station on the roof terrace.
Figure 11.
Results of the wind simulation at Diefenbachgasse School: (a) representation of the entire simulation area with the roof terrace highlighted; (b) wind conditions and position of the weather station on the roof terrace.
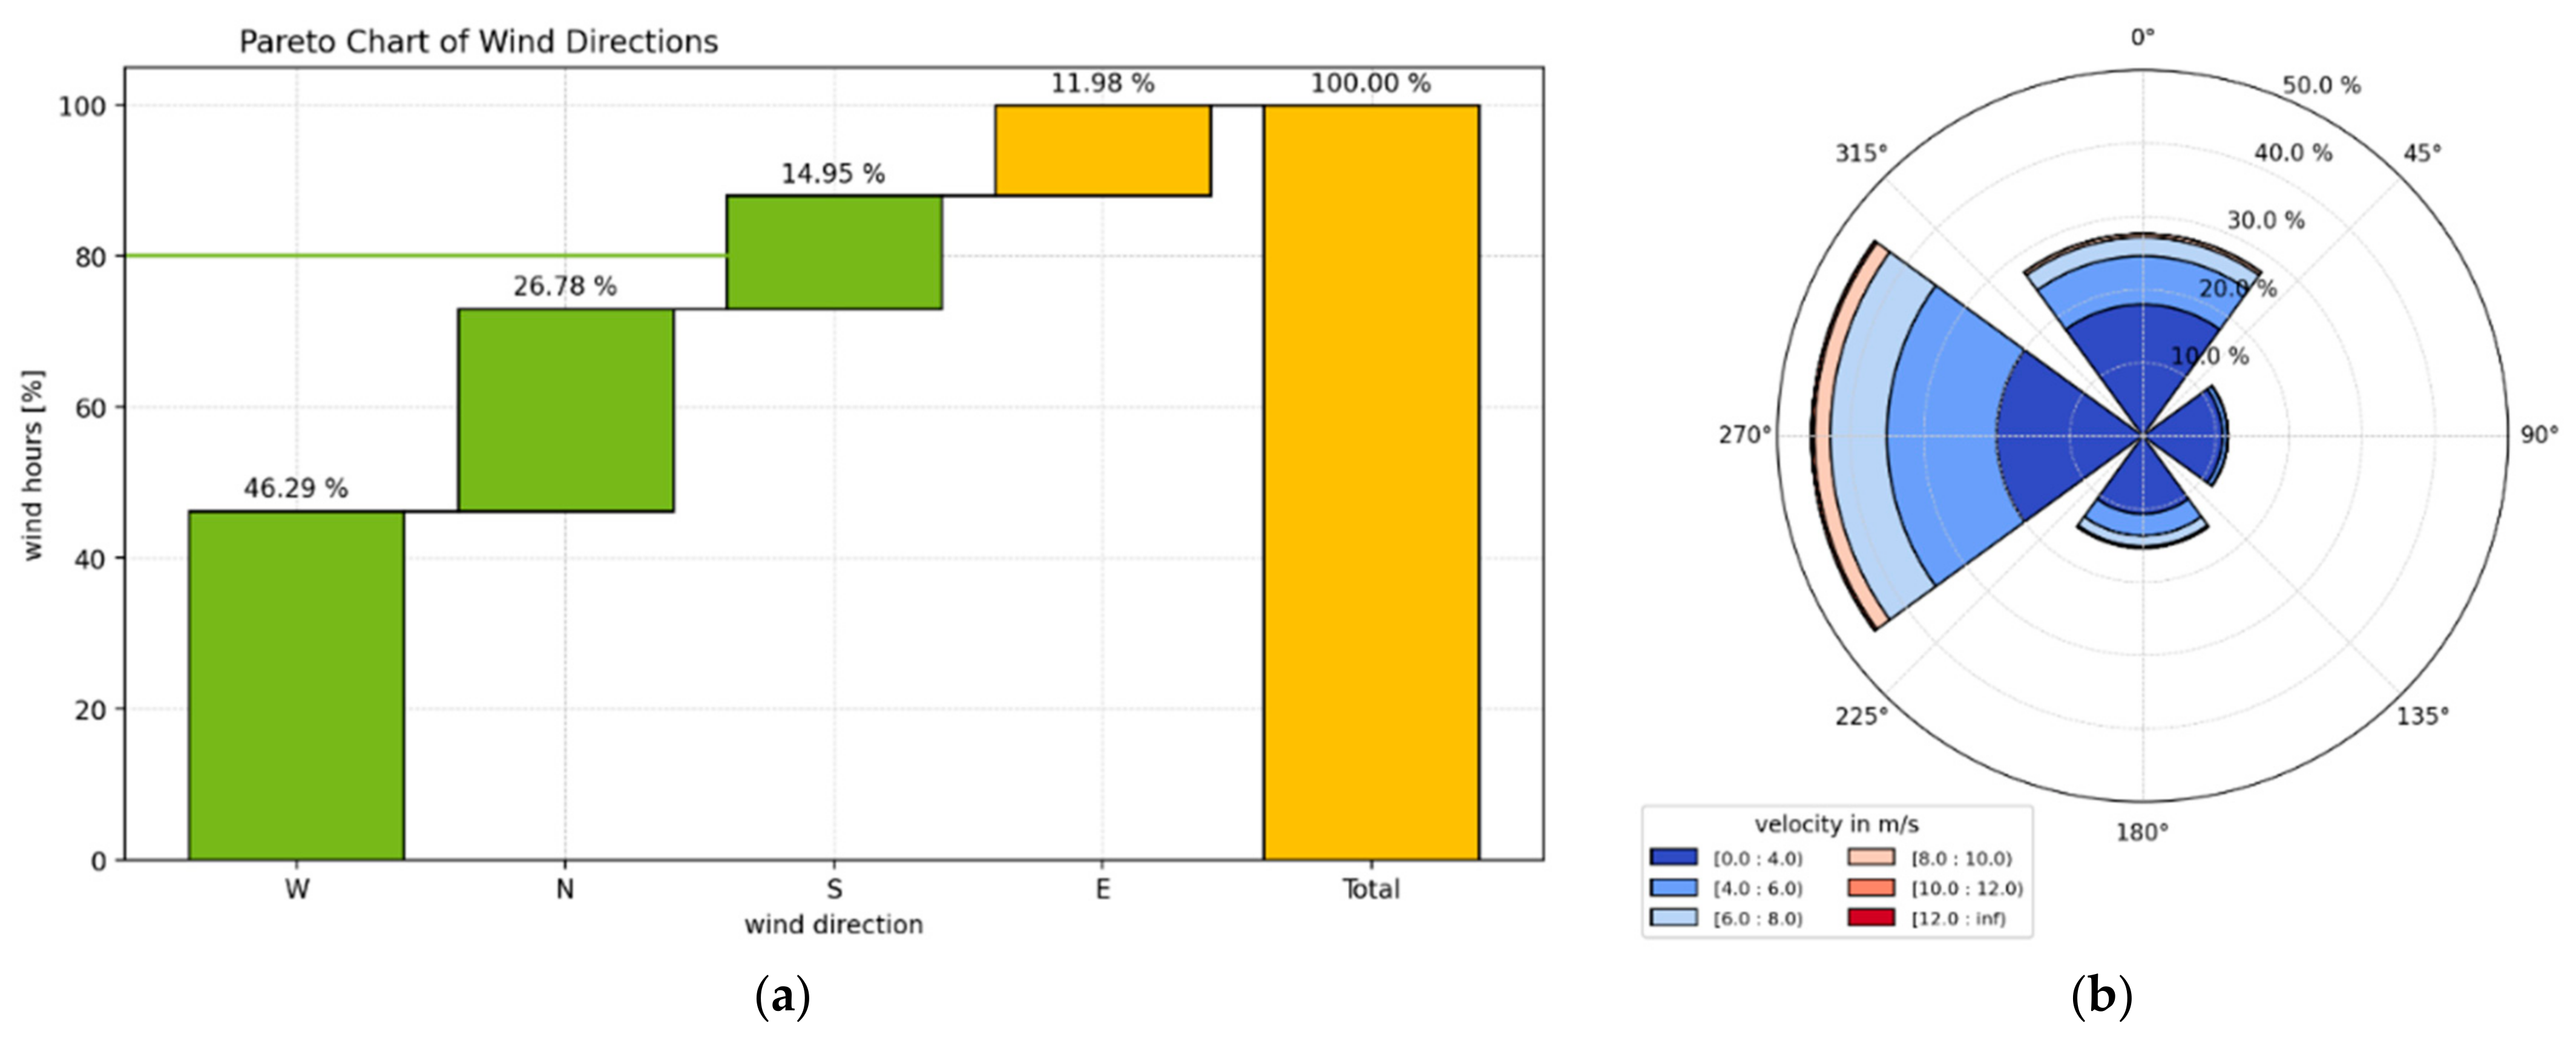
Figure 12.
Typical wind conditions in summer (July to September) in Vienna using hourly weather data from 26.8.2009 to 26.8.2019 [
32]: (
a) pareto chart of wind directions; (
b) wind rose diagram of wind velocities in each wind direction.
Figure 12.
Typical wind conditions in summer (July to September) in Vienna using hourly weather data from 26.8.2009 to 26.8.2019 [
32]: (
a) pareto chart of wind directions; (
b) wind rose diagram of wind velocities in each wind direction.
Figure 13.
Shadow cast at Diefenbachgasse School on the model day at 3:00 p.m. CEST, with the roof terrace highlighted.
Figure 13.
Shadow cast at Diefenbachgasse School on the model day at 3:00 p.m. CEST, with the roof terrace highlighted.
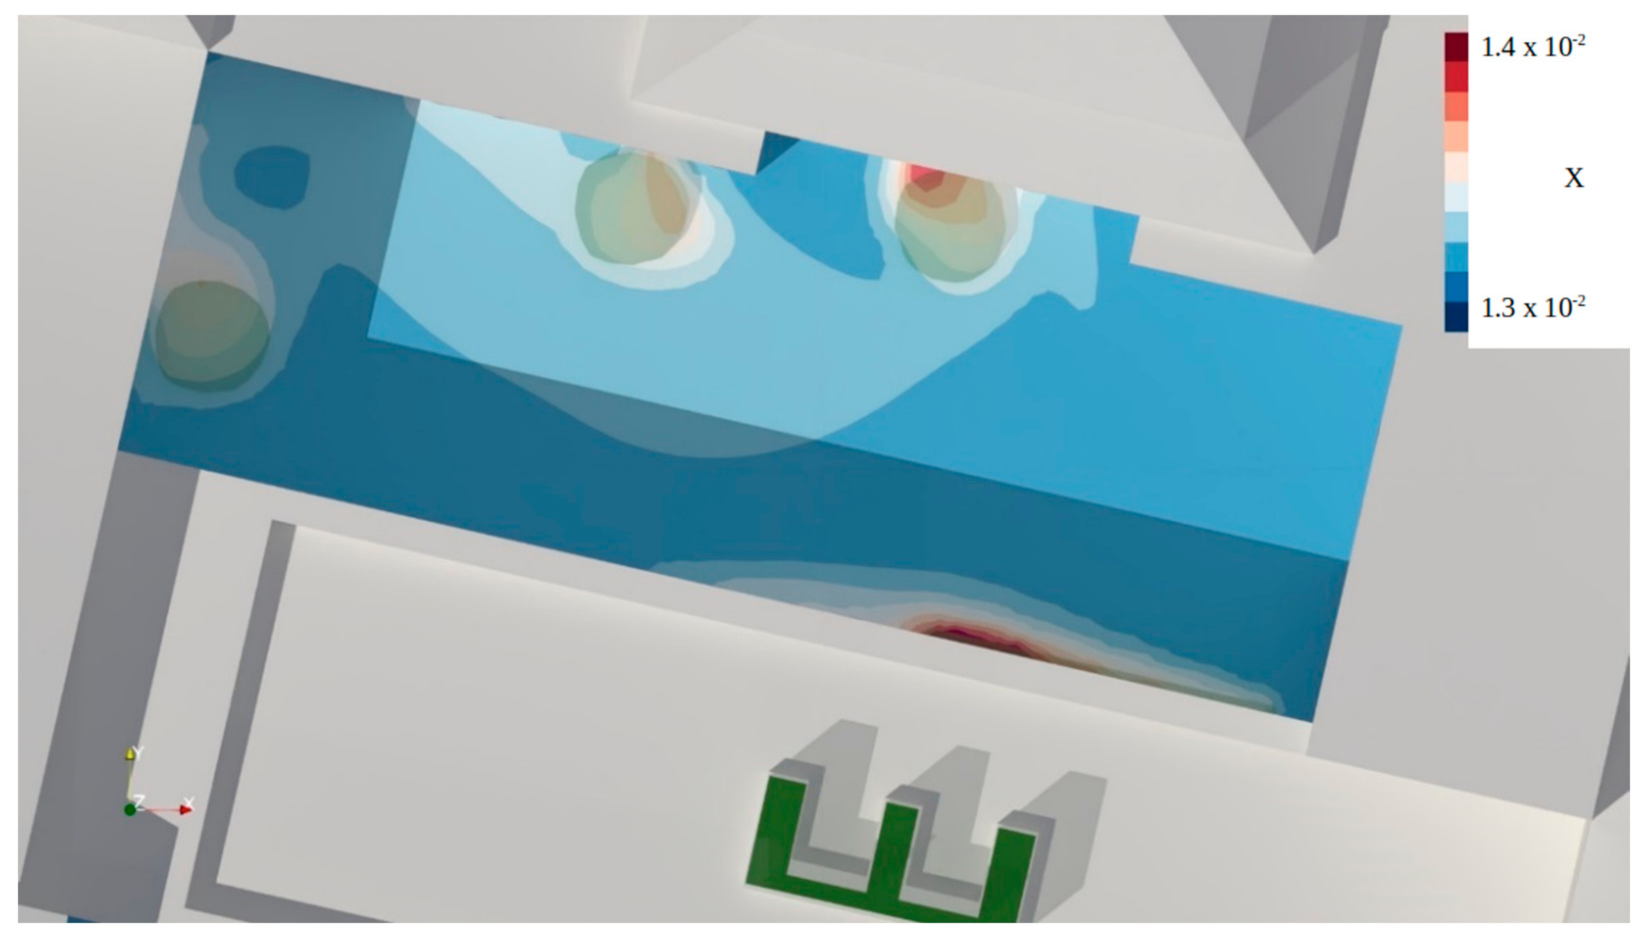
Figure 14.
Humidity load (kg/kg) at the level of the Diefenbachgasse School weather station on the model day at 3:00 p.m. CEST.
Figure 14.
Humidity load (kg/kg) at the level of the Diefenbachgasse School weather station on the model day at 3:00 p.m. CEST.
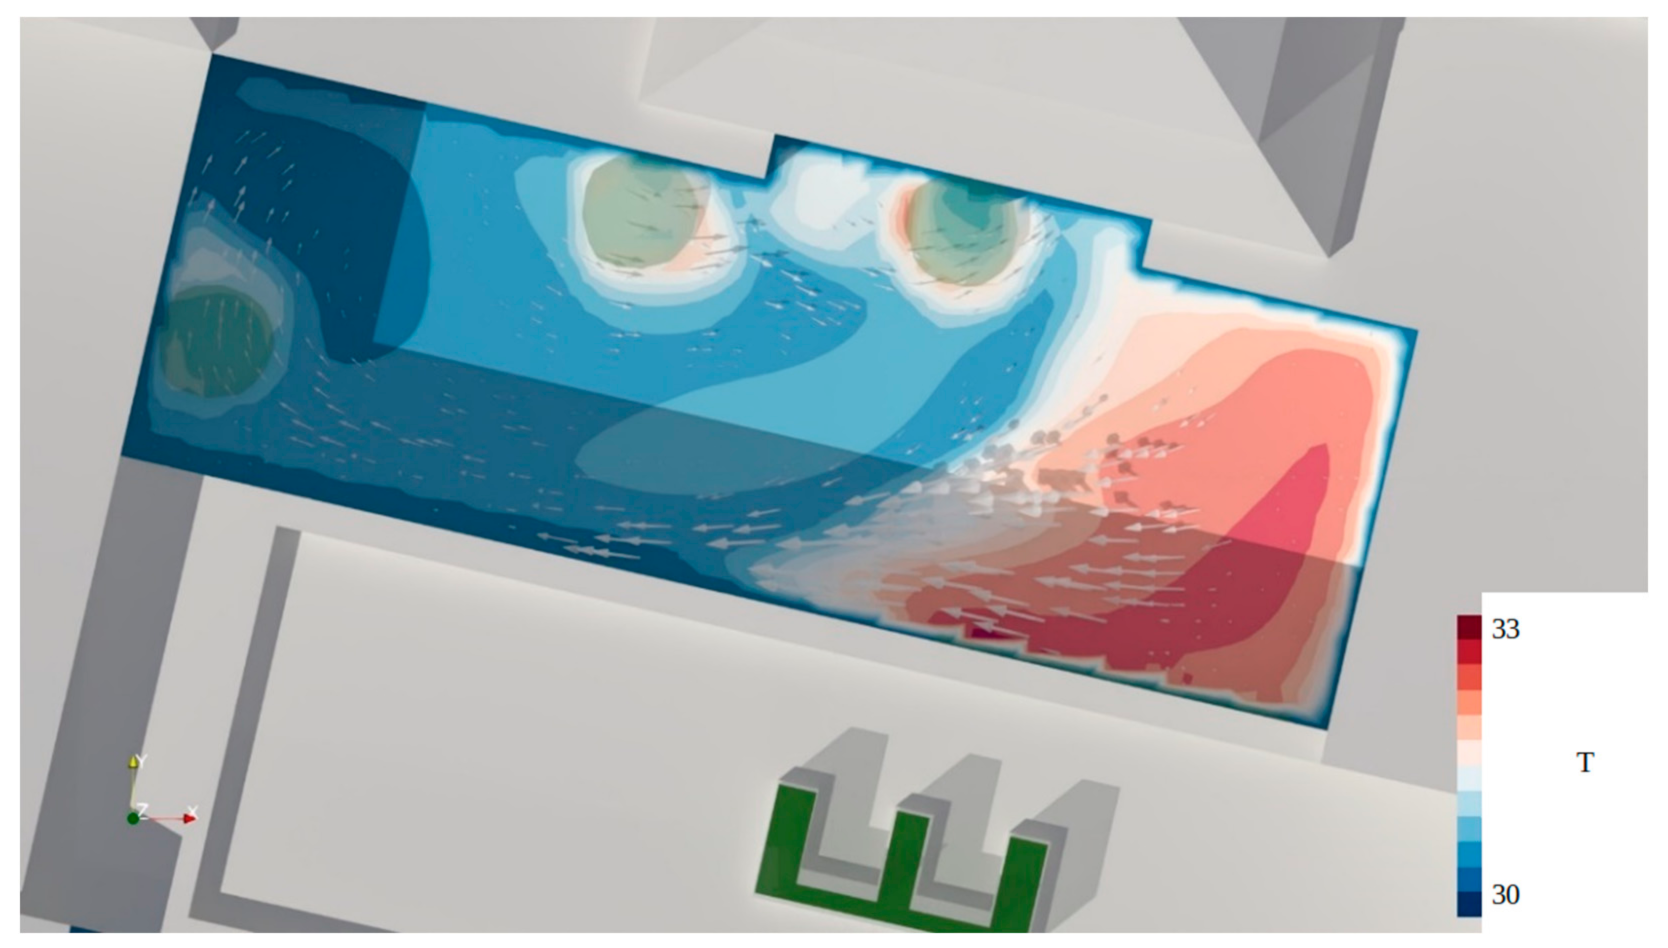
Figure 15.
Air temperature (°C) at the level of the Diefenbachgasse School weather station on the model day at 3:00 p.m. CEST.
Figure 15.
Air temperature (°C) at the level of the Diefenbachgasse School weather station on the model day at 3:00 p.m. CEST.
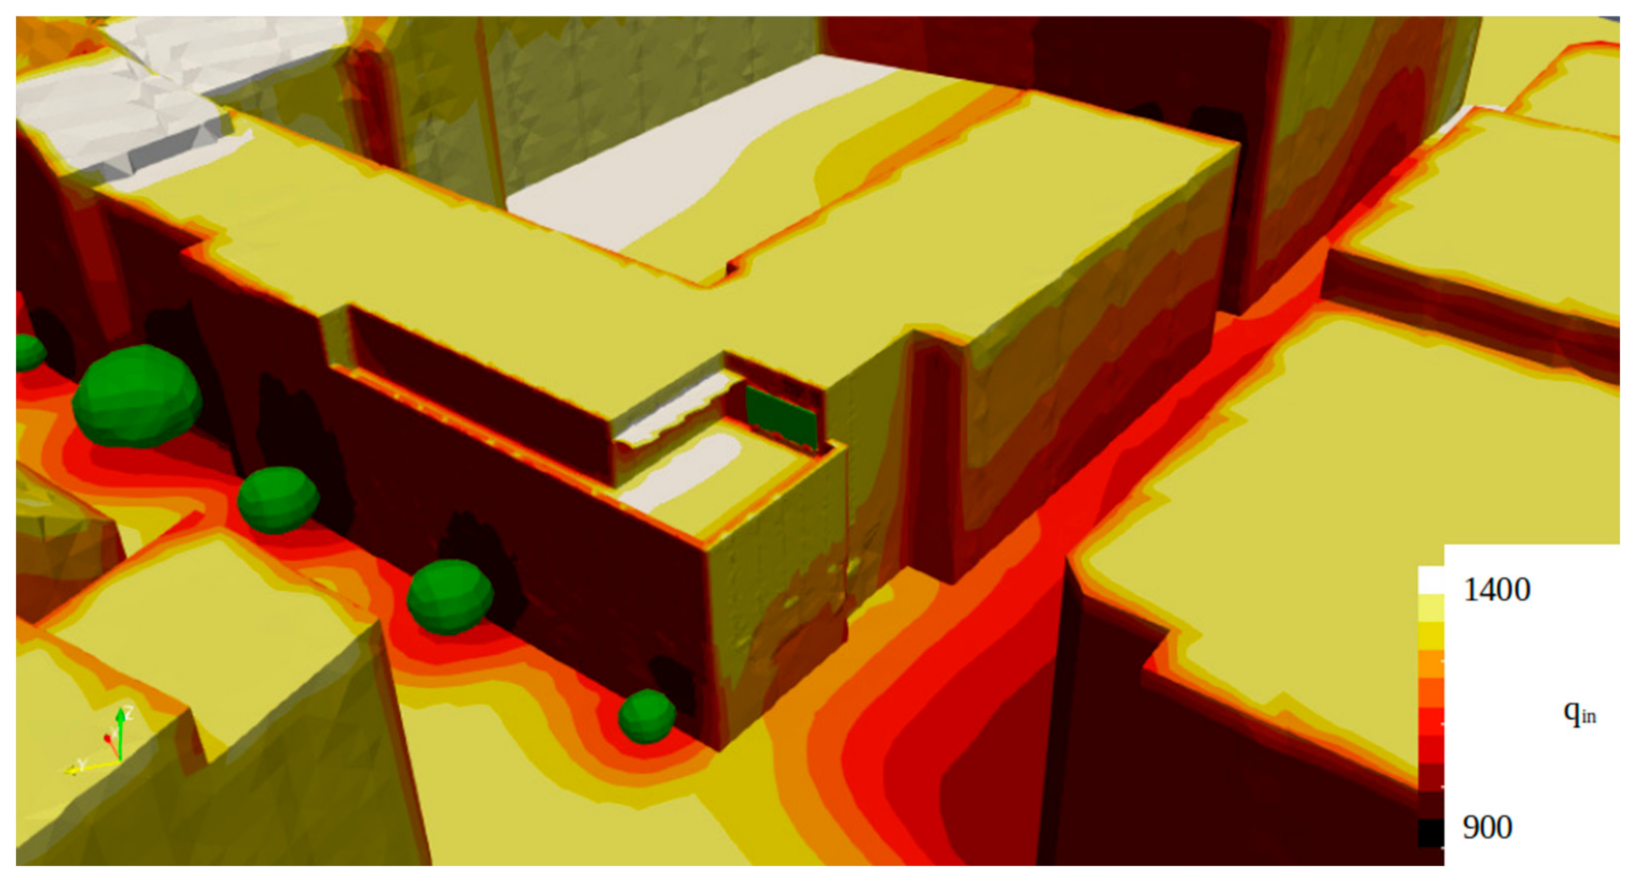
Figure 16.
Incident surface radiation intensity (W/m²) at Diefenbachgasse School on the model day at 3:00 p.m. CEST.
Figure 16.
Incident surface radiation intensity (W/m²) at Diefenbachgasse School on the model day at 3:00 p.m. CEST.
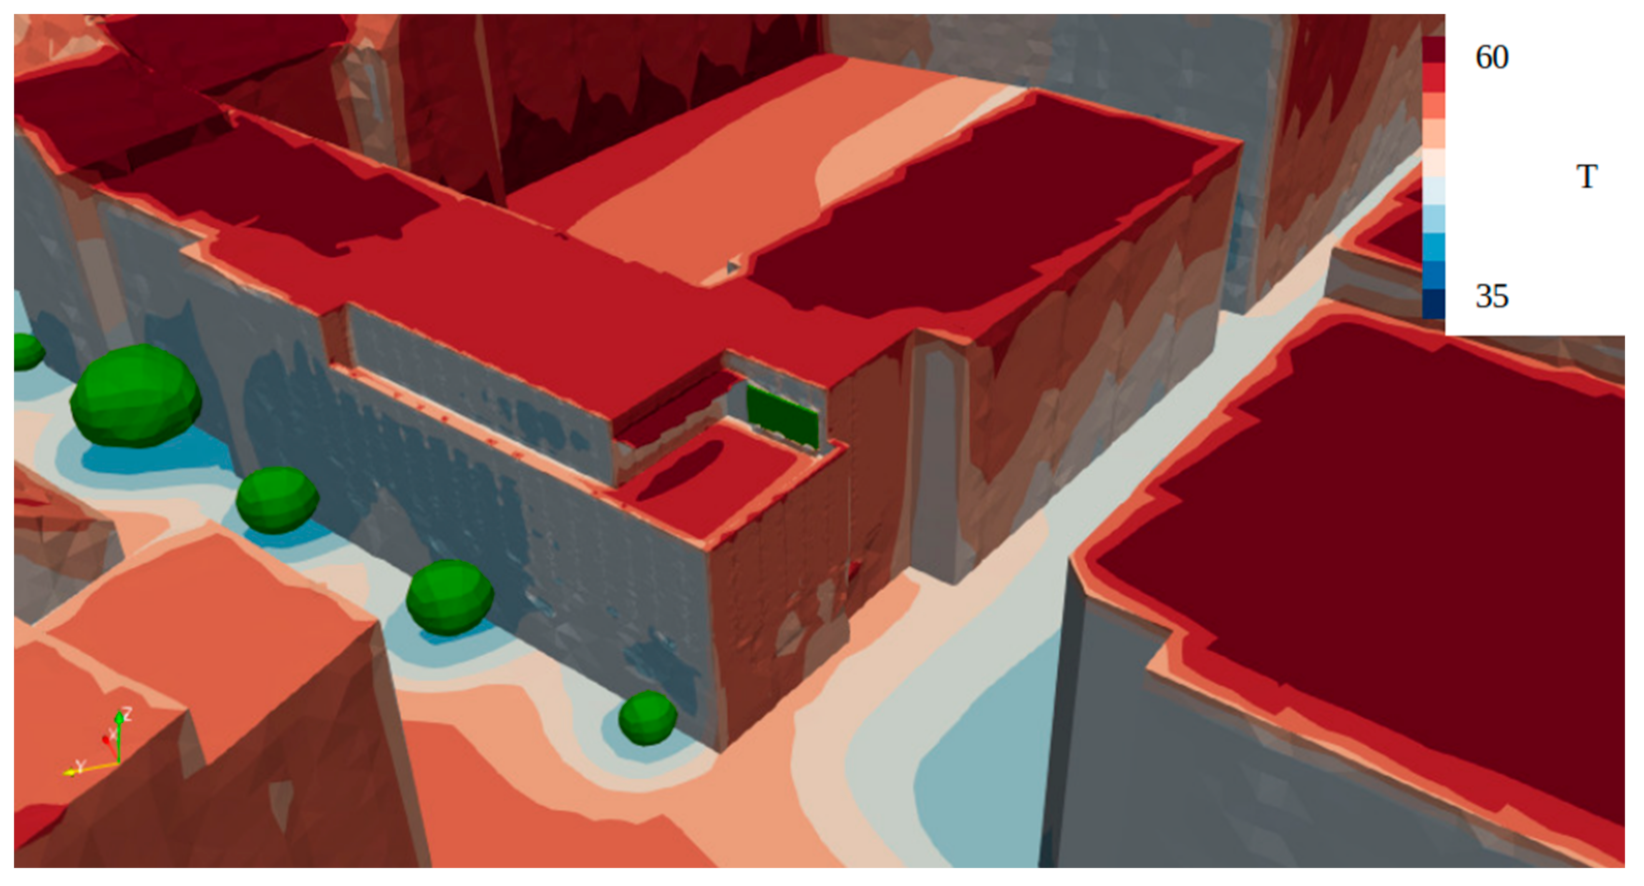
Figure 17.
Surface temperatures (°C) at Diefenbachgasse School on the model day at 3:00 p.m. CEST.
Figure 17.
Surface temperatures (°C) at Diefenbachgasse School on the model day at 3:00 p.m. CEST.
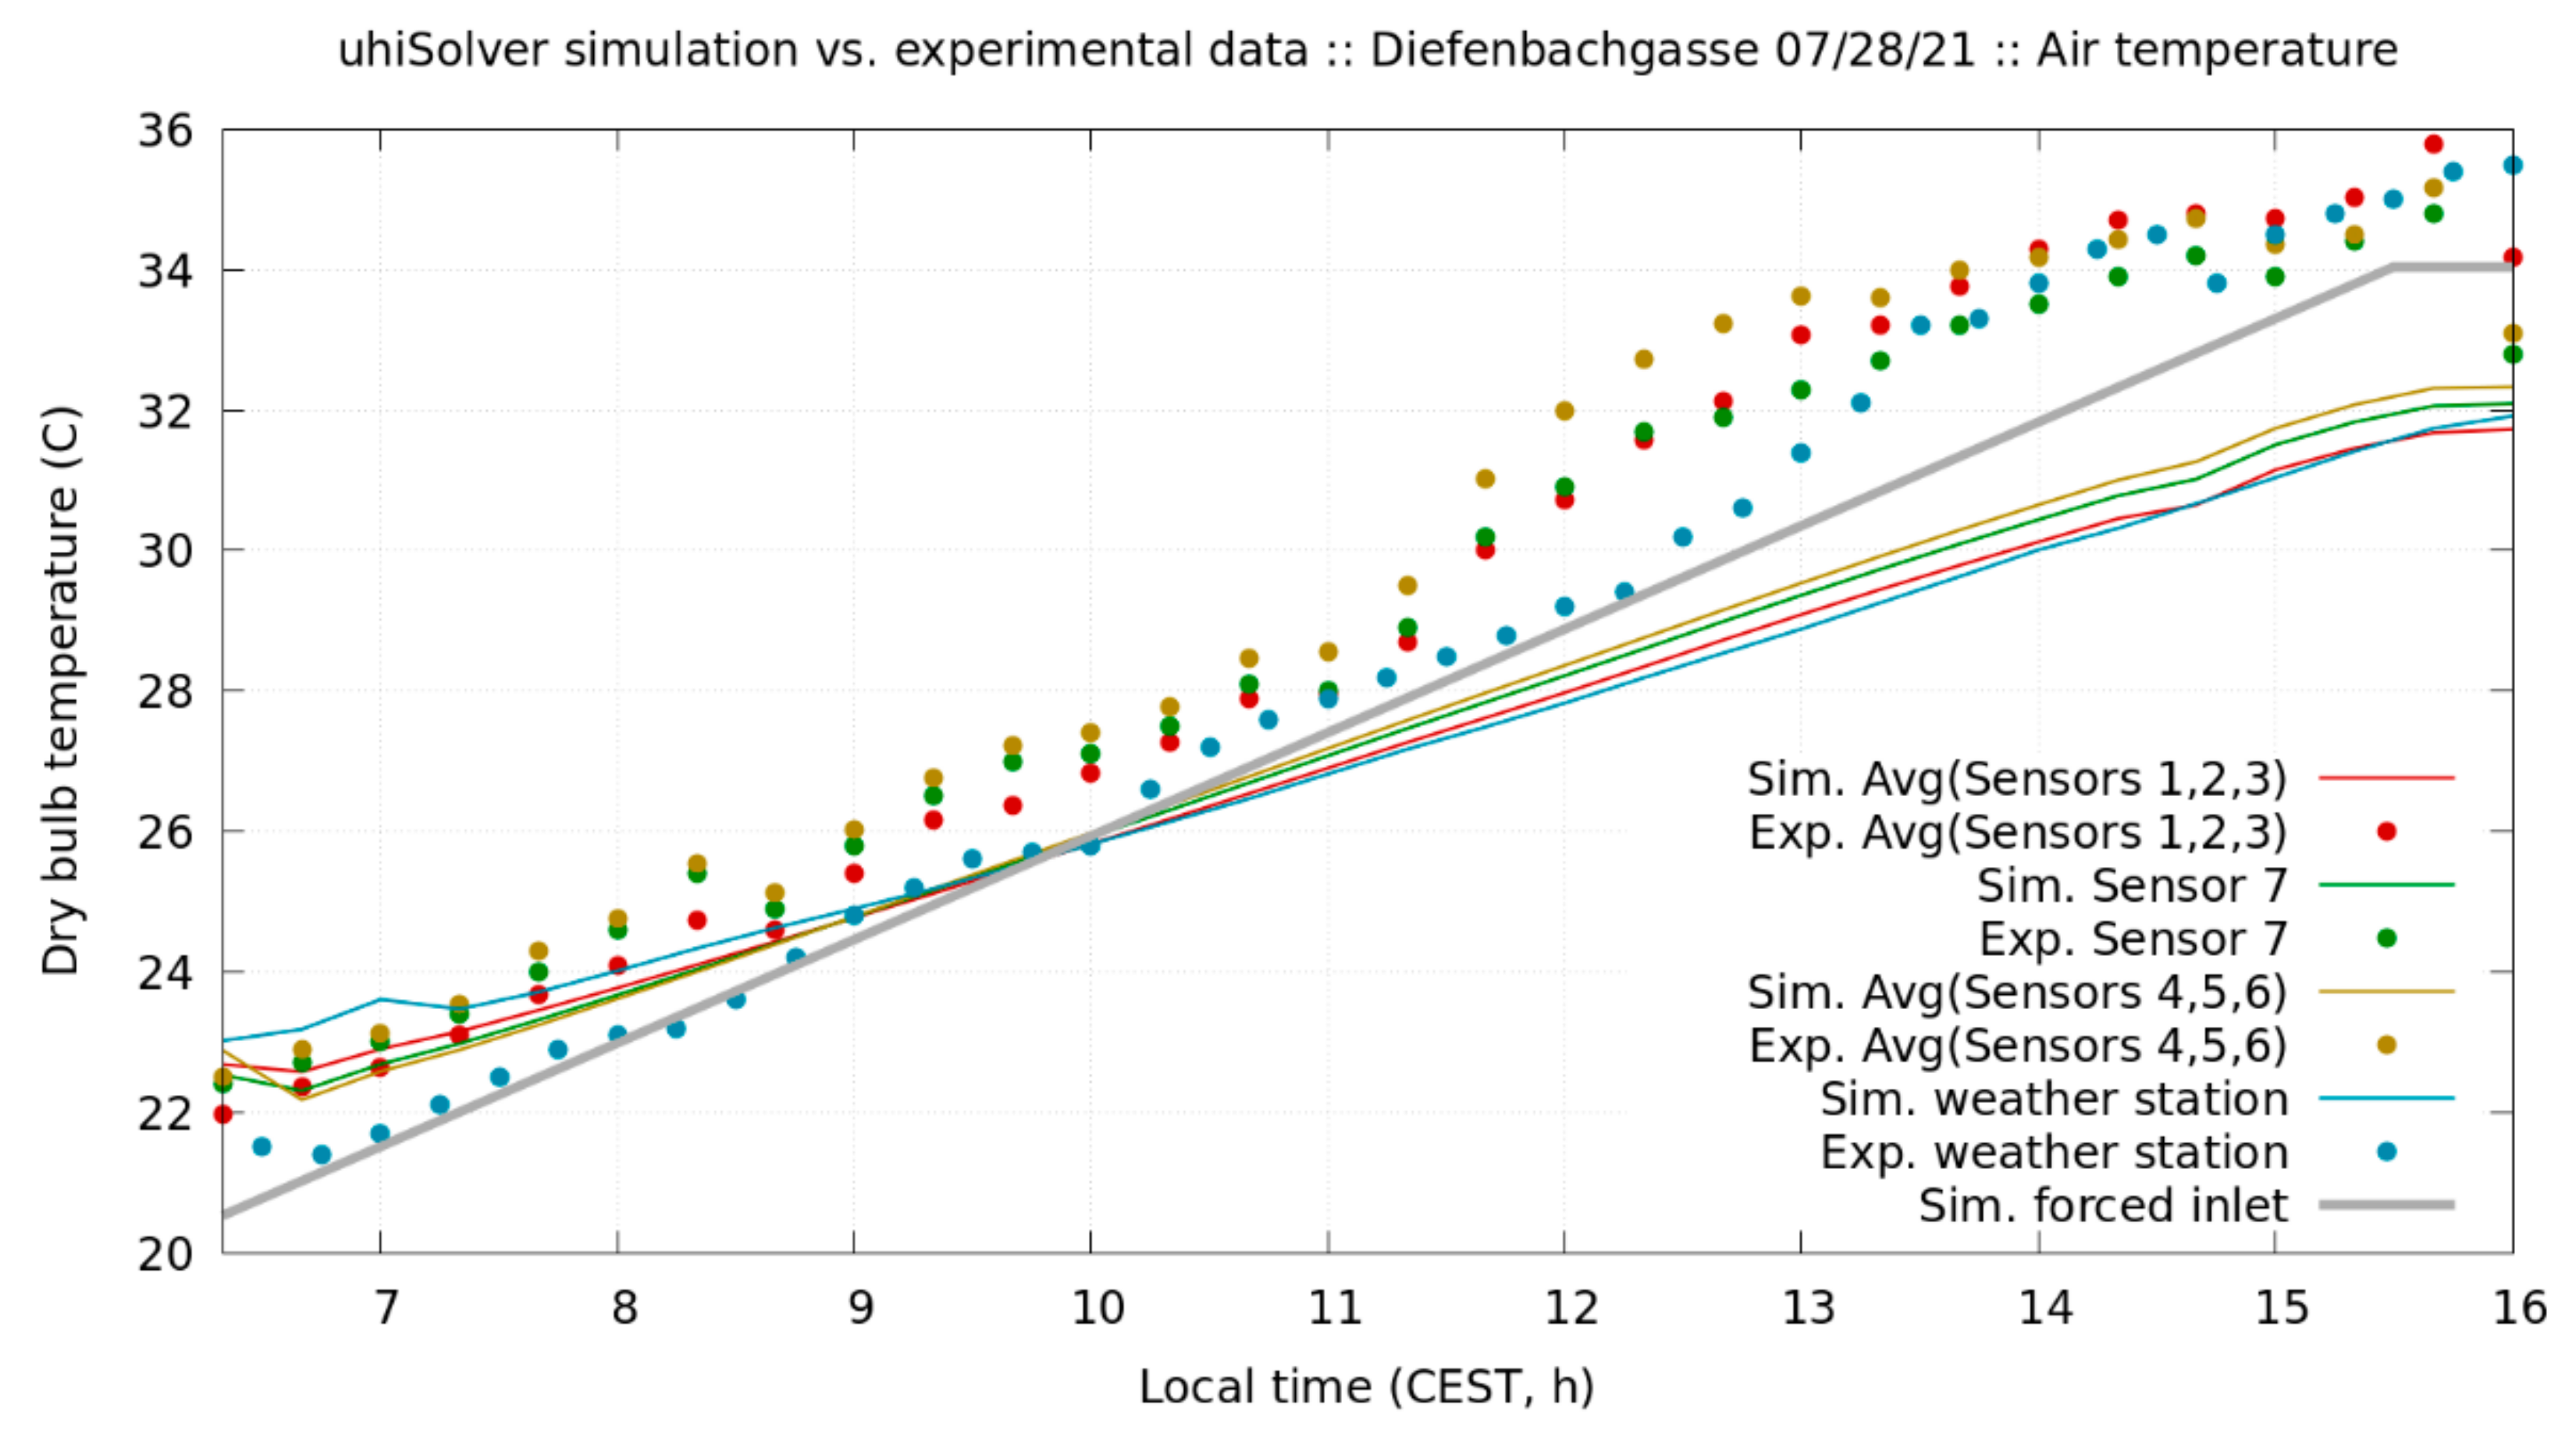
Figure 18.
Validation of simulated air temperature with measured data at Diefenbachgasse School on the model day from 06:20 a.m. to 4:00 p.m. CEST.
Figure 18.
Validation of simulated air temperature with measured data at Diefenbachgasse School on the model day from 06:20 a.m. to 4:00 p.m. CEST.
Figure 19.
Result of the wind simulation at Schuhmeierplatz School for large-scale westward wind direction, as indicated by the blue arrow.
Figure 19.
Result of the wind simulation at Schuhmeierplatz School for large-scale westward wind direction, as indicated by the blue arrow.
Figure 20.
Shadow cast at Schuhmeierplatz School on the model day at 3:00 p.m. CEST, with the position of the greenery systems highlighted.
Figure 20.
Shadow cast at Schuhmeierplatz School on the model day at 3:00 p.m. CEST, with the position of the greenery systems highlighted.
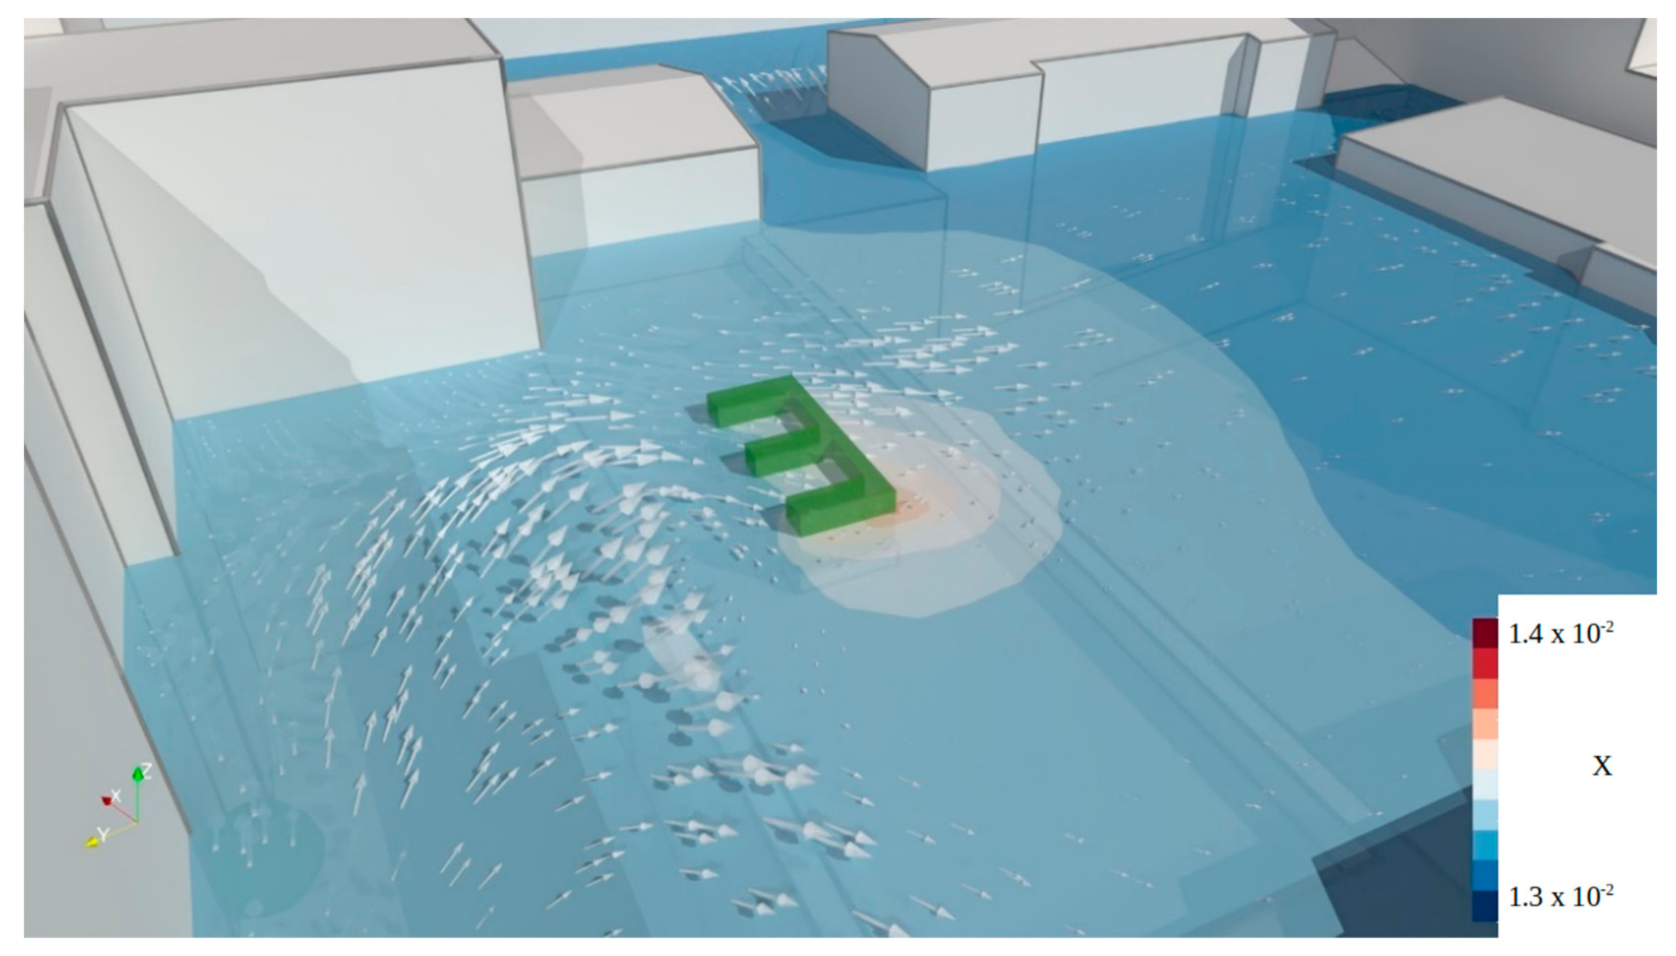
Figure 21.
Humidity load (kg/kg) at the level of the Schuhmeierplatz School living wall on the model day at 3:00 p.m. CEST.
Figure 21.
Humidity load (kg/kg) at the level of the Schuhmeierplatz School living wall on the model day at 3:00 p.m. CEST.
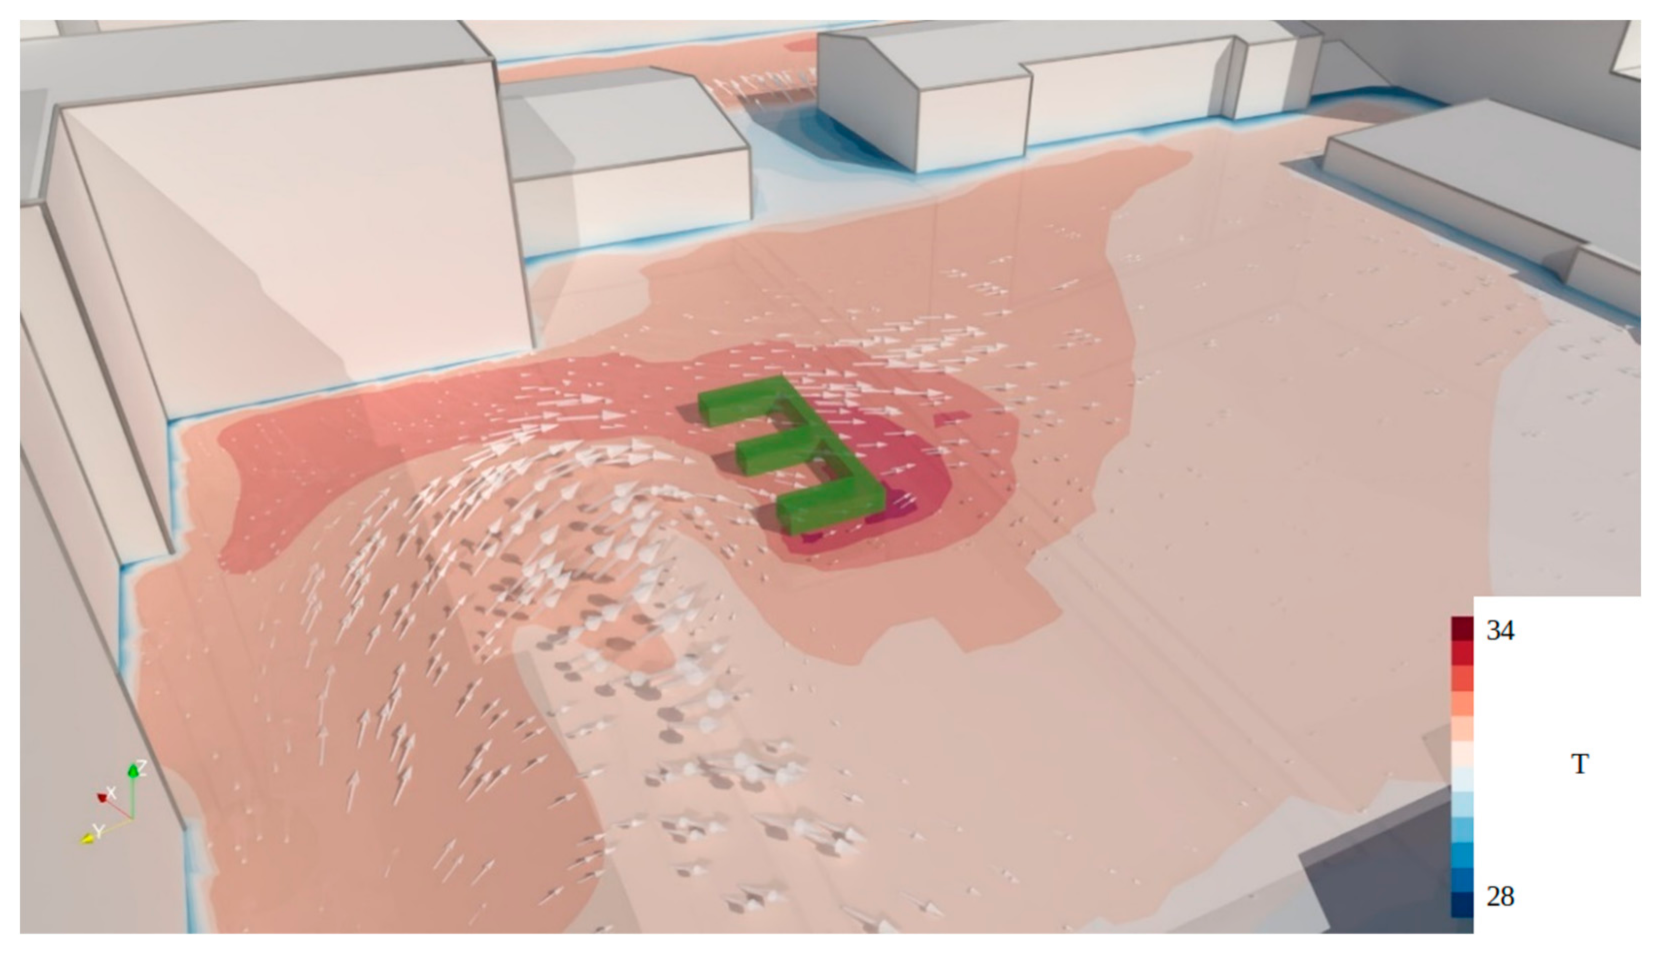
Figure 22.
Air temperature (°C) at the level of the Schuhmeierplatz School living wall on the model day at 3:00 p.m. CEST.
Figure 22.
Air temperature (°C) at the level of the Schuhmeierplatz School living wall on the model day at 3:00 p.m. CEST.
Figure 23.
Humidity load (kg/kg) at the level of the Schuhmeierplatz School green pergola, 1.6 m above the ground, on the model day at 3:00 p.m. CEST.
Figure 23.
Humidity load (kg/kg) at the level of the Schuhmeierplatz School green pergola, 1.6 m above the ground, on the model day at 3:00 p.m. CEST.
Figure 24.
Air temperature (°C) at the level of the Schuhmeierplatz School green pergola, 1.6 m above the ground, on the model day at 3:00 p.m. CEST.
Figure 24.
Air temperature (°C) at the level of the Schuhmeierplatz School green pergola, 1.6 m above the ground, on the model day at 3:00 p.m. CEST.
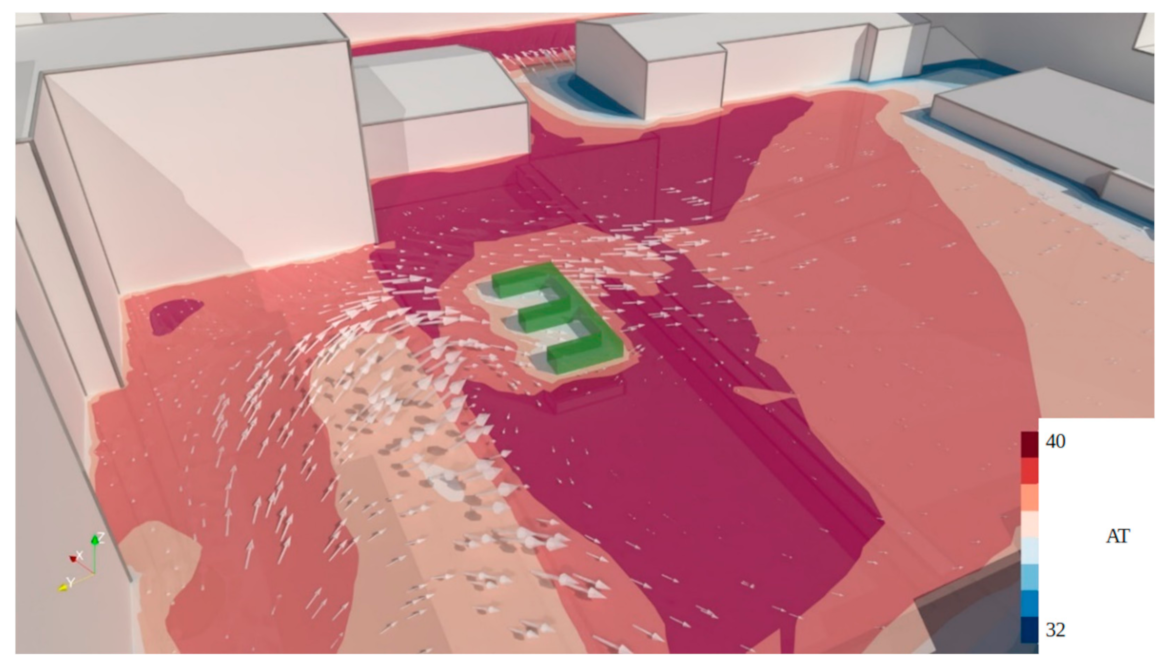
Figure 25.
Apparent temperature (°C) at pedestrian level on the roof terrace of Schuhmeierplatz School on the model day at 3:00 p.m. CEST.
Figure 25.
Apparent temperature (°C) at pedestrian level on the roof terrace of Schuhmeierplatz School on the model day at 3:00 p.m. CEST.
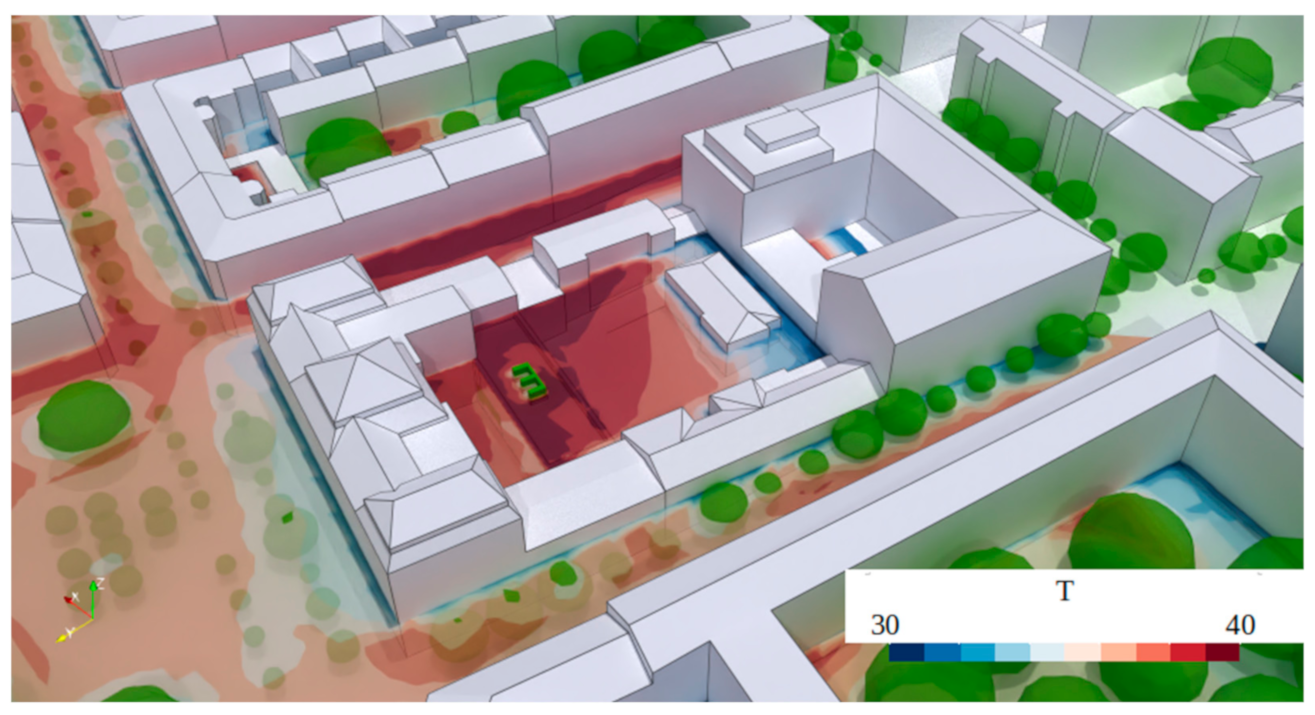
Figure 26.
Apparent temperature (°C) around Schuhmeierplatz School on the model day at 3:00 p.m. CEST.
Figure 26.
Apparent temperature (°C) around Schuhmeierplatz School on the model day at 3:00 p.m. CEST.
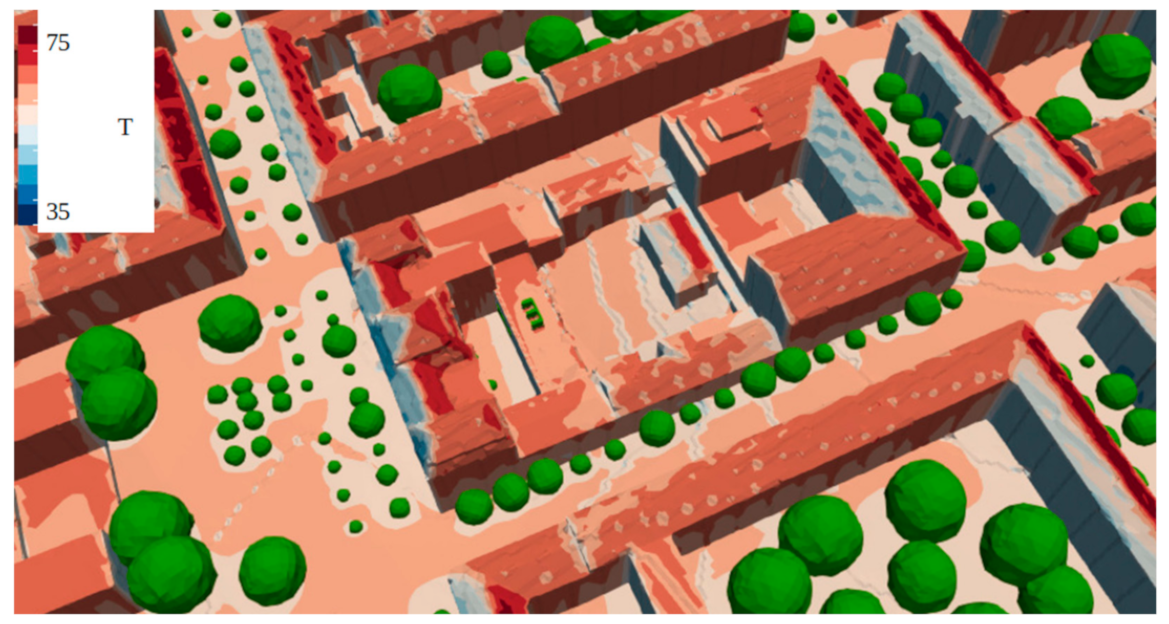
Figure 27.
Surface temperatures (°C) around Schuhmeierplatz School on the model day at 3:00 p.m. CEST.
Figure 27.
Surface temperatures (°C) around Schuhmeierplatz School on the model day at 3:00 p.m. CEST.
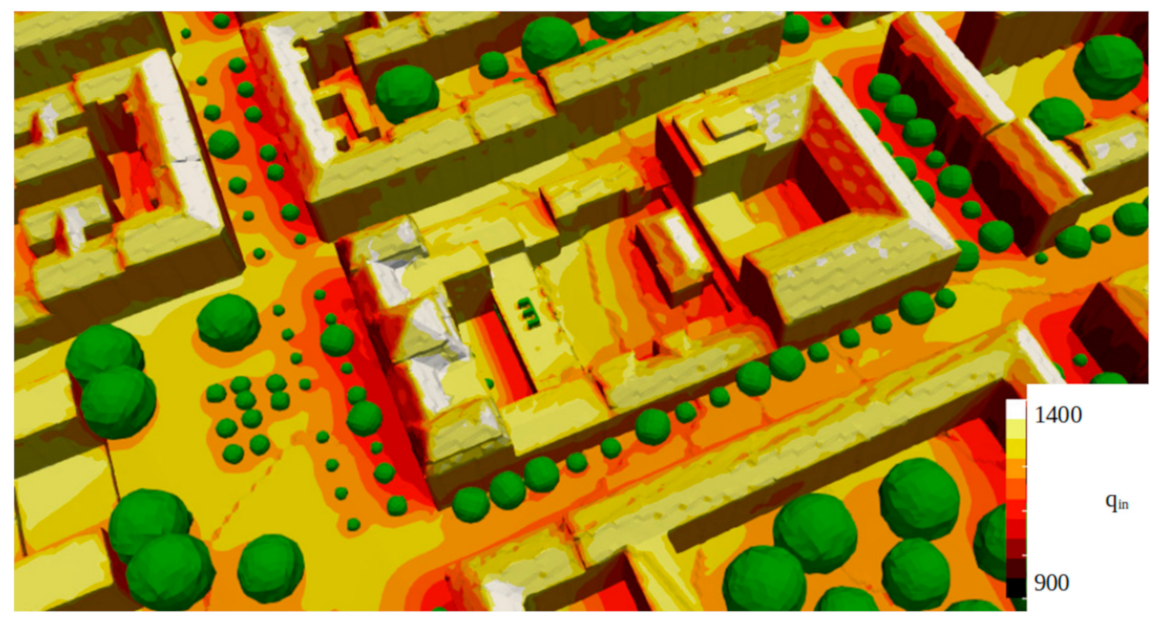
Figure 28.
Incident radiation intensity (W/m²) around Schuhmeierplatz School on the model day at 3:00 p.m. CEST.
Figure 28.
Incident radiation intensity (W/m²) around Schuhmeierplatz School on the model day at 3:00 p.m. CEST.
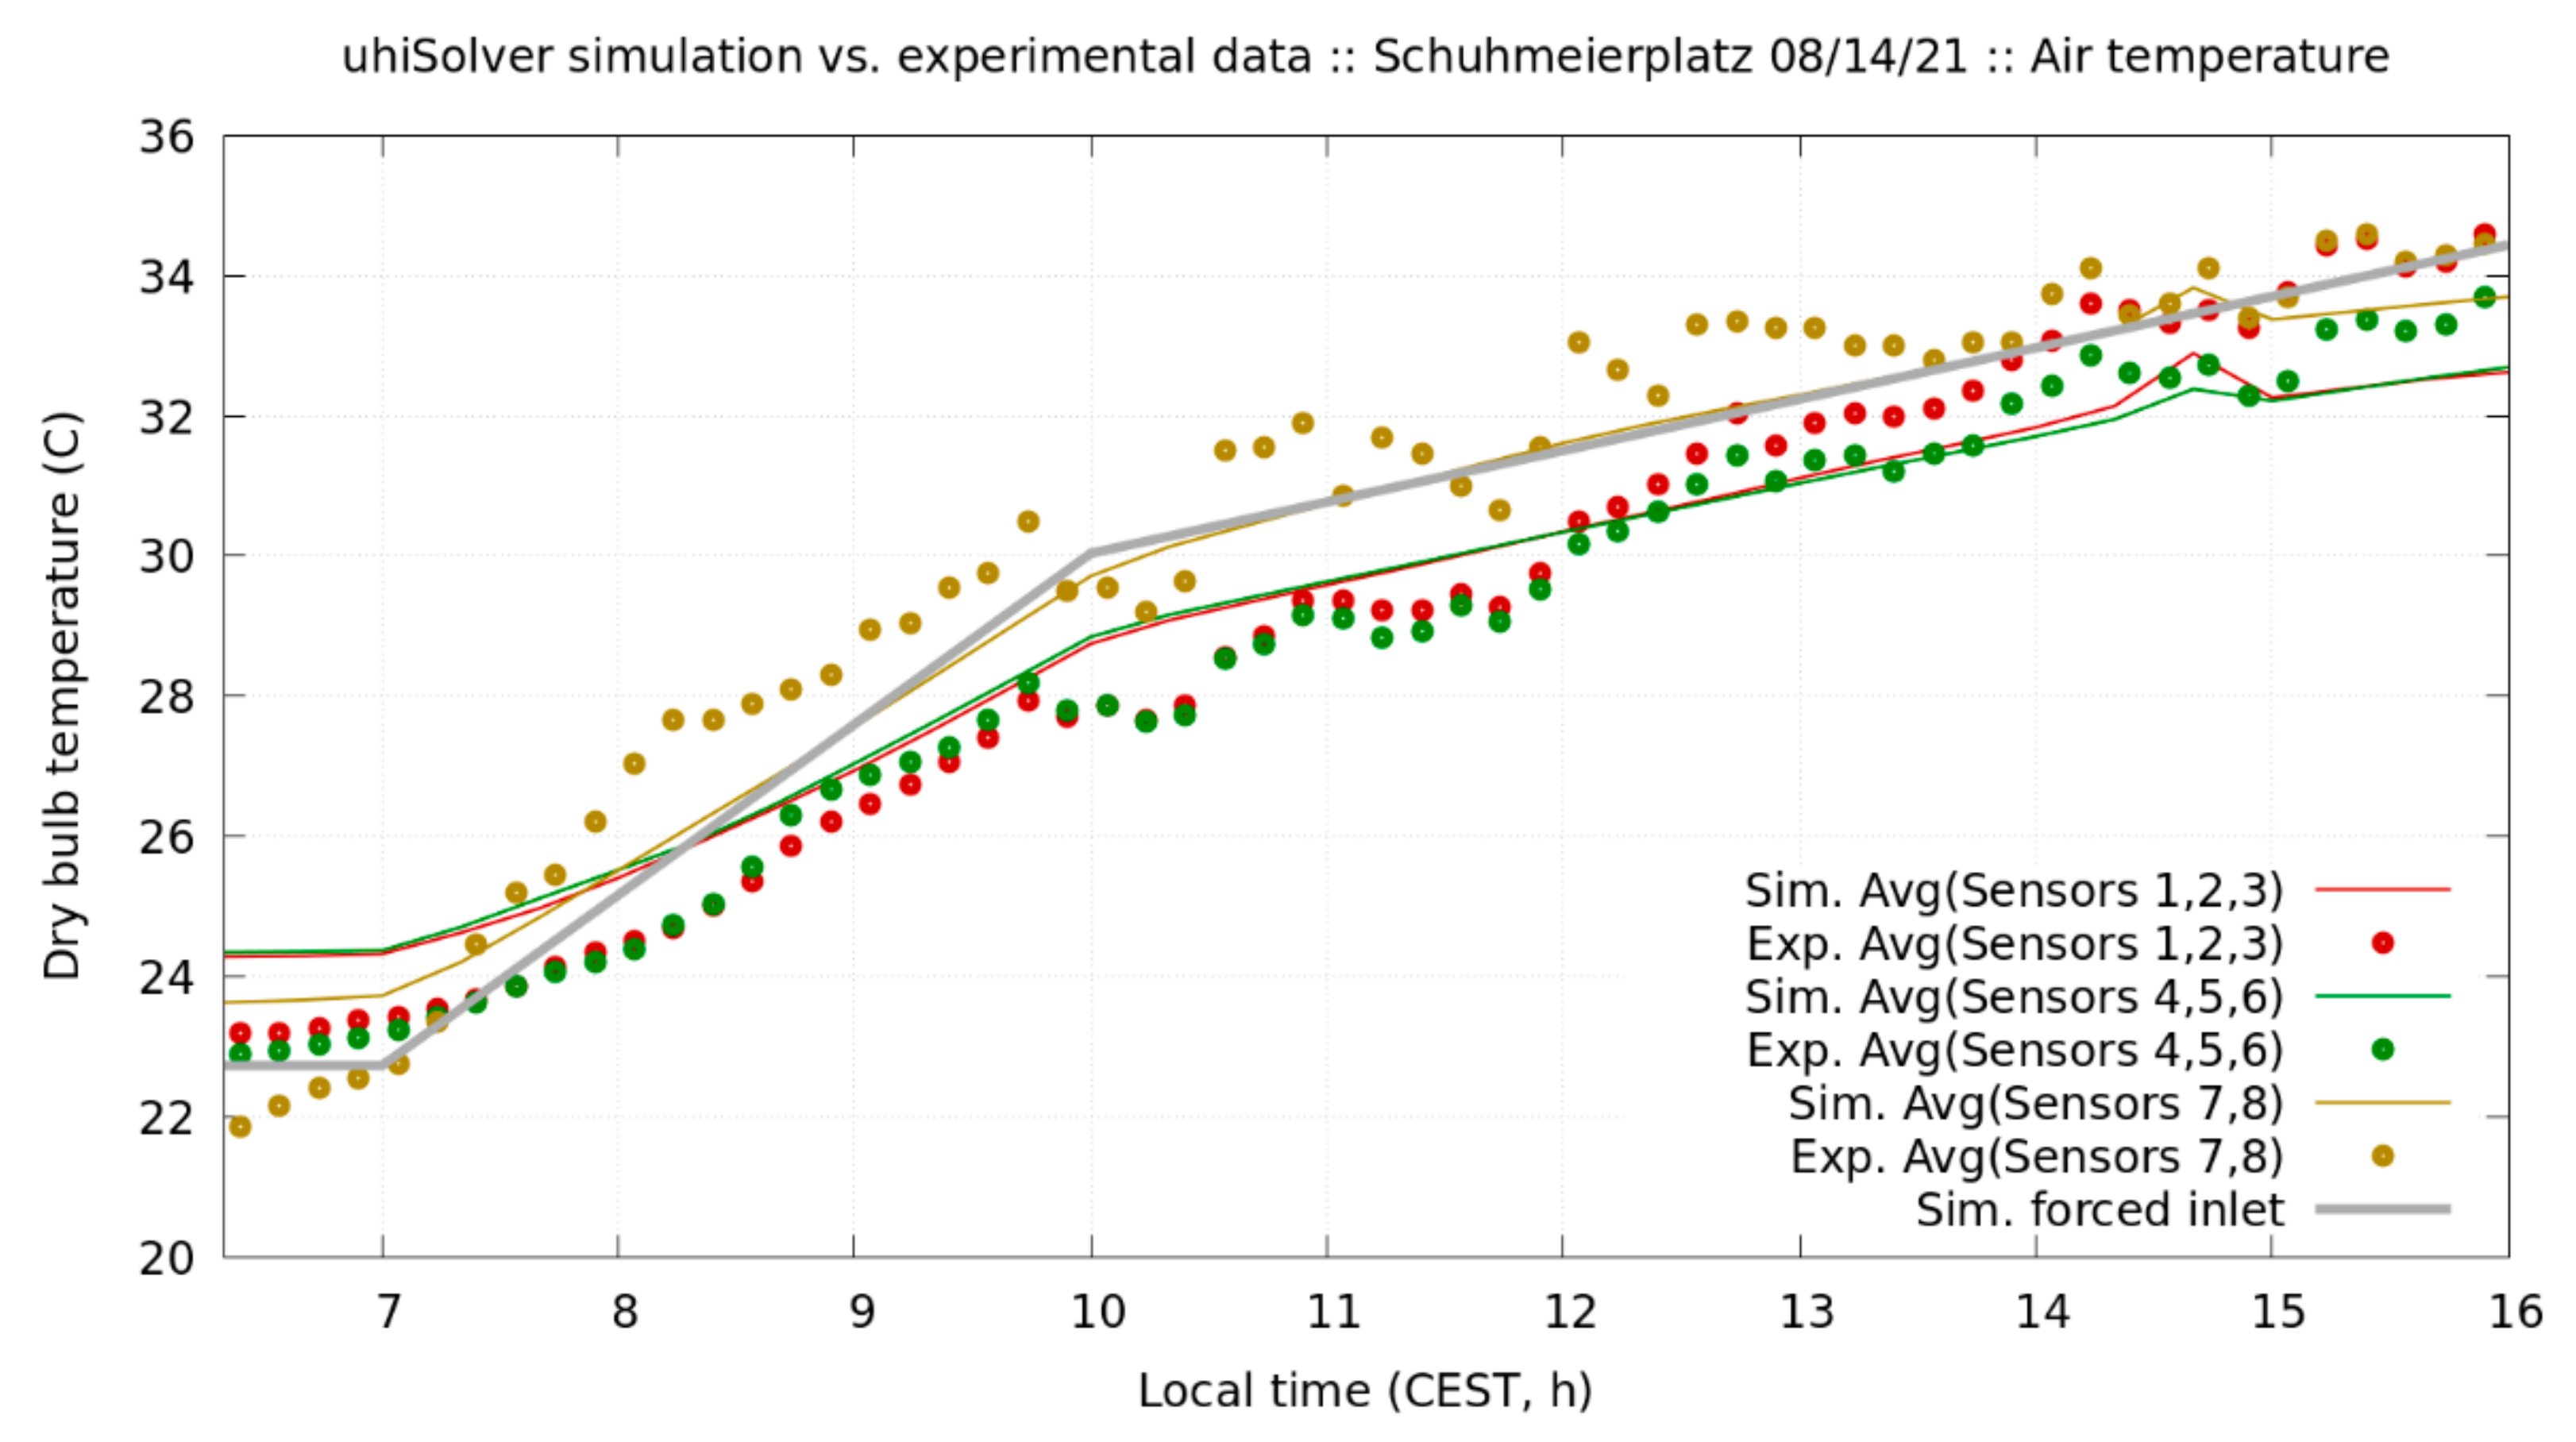
Figure 29.
Validation of simulated air temperature with measured data at Schuhmeierplatz School on the model day from 06:20 a.m. to 4:00 p.m. CEST.
Figure 29.
Validation of simulated air temperature with measured data at Schuhmeierplatz School on the model day from 06:20 a.m. to 4:00 p.m. CEST.
Table 1.
Average, maximum, and minimum values of air temperature [T in °C], absolute humidity [X in kg water vapor/kg dry air], wind velocity [U in m/s], wind direction, and total solar irradiance [TSI in W/m²] at the weather station of Diefenbachgasse School on the model day between 6:20 and 16:00 CEST.
| | T (°C) | X (kg/kg) | U (m/s) | Wind-Dir. (-) | TSI (W/m²) |
|---|
| Minimum | 21 | 0.0125 | 1.6 | ESE | 25 |
| Average | 28 | 0.0130 | 3.2 | W | 436 |
| Maximum | 35 | 0.0135 | 4.8 | WSW | 846 |
Table 2.
Average, maximum, and minimum values of air temperature [T in °C], absolute humidity [X in kg water vapor/kg dry air], wind velocity [U in m/s], wind direction, and total solar irradiance [TSI in W/m²] at the weather station of Schuhmeierplatz School on the model day between 6:20 and 16:00 CEST.
| | T (°C) | X (kg/kg) | U (m/s) | Wind-Dir. (-) | TSI (W/m²) |
|---|
| Minimum | 21.5 | 0.0120 | 0 | E | 0 |
| Average | 28.4 | 0.0128 | 2.4 | ESE | 367 |
| Maximum | 35.3 | 0.0135 | 4.8 | WSW | 735 |
Table 3.
Microclimatic effects of small-scale greenery on a hot summer day in Vienna.
Table 3.
Microclimatic effects of small-scale greenery on a hot summer day in Vienna.
| | Air Temp. | Abs. Humidity | Shade | AT 1 |
|---|
| Living wall | No | Yes | Yes | No |
| Green pergola | No | Yes | Yes | Yes |


