Article

The Impact of Factor Market Distortion on the Efficiency of Technological Innovation: A Spatial Analysis

School of Economics and Management, Nanjing University of Aeronautics and Astronautics, Nanjing 211106, China
*
Author to whom correspondence should be addressed.
Sustainability 2022, 14(19), 12064; https://doi.org/10.3390/su141912064
Submission received: 10 August 2022 / Revised: 15 September 2022 / Accepted: 17 September 2022 / Published: 23 September 2022
(This article belongs to the Special Issue Business, Innovation, and Economics Sustainability)

Abstract

:
The growth of scientific and technological innovation in China is facing a bottleneck under the influence of domestic and foreign environments. The economic internal circulation policy of China may explore new driving forces for innovation from the perspective of optimizing the efficiency of production factor allocation. This research applies the provincial data from 2001 to 2017 to empirically investigate the spatial effects of factor market distortions on the efficiency of technological innovation. The DEA (Data envelopment analysis) model with variable returns to scale is exploited to measure the efficiency of technological innovation. The production function approach can be harnessed to measure labor market distortions and capital market distortions. The spatial correlation test results and the spatial econometric results regressed with three spatial weight matrices draw the following conclusions: (1) No matter how the spatial connection is established, the efficiency of the scientific and technological innovation in China shows a strong positive spatial correlation. (2) Labor market distortion and capital market distortion lead to low factor allocation efficiency, which inhibits the improvement of scientific and technological innovation efficiency. (3) When considering inter-regional economic connections, the inhibitory effect of factor market distortions on the efficiency of technological innovation shows spillover effects on surrounding areas. (4) Human capital and advanced industrial structure are conducive to the improvement of scientific and technological innovation efficiency. Optimizing the efficiency of factor market allocation can become a significant path for China to release new room for improvement in scientific and technological innovation.

1. Introduction

The rapid economic development after the reform and opening up has brought abundant fiscal revenue to China. While strengthening infrastructure construction to improve people’s well-being, the Chinese government has always put scientific and technological innovation as the focus of development. In order to enhance the overall national strength, the Chinese government has continuously increased investment in R&D (research and development) and scientific and technological talents. According to the National Bureau of Statistics of China, the financial investment in R&D in China has continued to grow for many years [1]. From 1992 to 2018, the R&D investment in China increased by an average rate of 20% annually [1]. In 2018, China’s R&D spending ranked second in the world [1]. The United States continued to add impetus to economic development by attracting global scientific and technological talents and mastering a large number of advanced scientific and technological achievements in the world. As an intangible resource, talent has become the core driving force for sustainable economic development [2]. The number of R&D personnel in China has continued to grow over the past few decades, and in 2013, it surpassed the United States and ranked first in the world [1]. In recent years, due to changes in the domestic and foreign environment and the attraction of the talent policy, the brain drain in the past has been alleviated to a certain extent. In 2018, the total number of R&D personnel in China was 6.2 times that of 1991 [1]. China’s domestic talent training capabilities and attraction capabilities have been strengthened at the same time. With the continuous expansion of talent and capital investment, China’s scientific and technological innovation has achieved fruitful results. In 2018, the number of patent applications in China reached 4.323 million, and the number of patent authorizations reached 2.448 million [1]. Among them, invention patents reached 1.542 million, accounting for 35.7% of the total [1]. The higher proportion of invention patents in total patents shows a strong level of innovation. Although China has sufficient capital and talent investment, there may be room for further improvement in innovation efficiency. Chen [3] showed that although China and the United States have similar investments in technological innovation, there is still a certain gap between China’s input and output efficiency compared with that of the United States. China’s huge economic volume and population size have created certain economic policy costs.
Due to some special circumstances and institutional arrangements, the allocation efficiency of the production factor market in China still needs to be improved. The urgency of reforming the production factor market can be manifested in many aspects. First of all, China’s special urban–rural dual household registration system has led to the existence of a semi-urbanized population in Chinese cities. Data from the seventh census of China show that the semi-urbanization rate has reached 18.49% [4]. The semi-urbanized population does not enjoy the same conveniences in cities as city-registered dwellers. The semi-urbanized population usually has some restrictions in terms of education, medical care, and housing purchases [5]. The registering citizenization difficulties of the semi-urbanized population reduce the willingness of the rural population to enter the city to a certain extent. This hinders the marketization of labor in cities. In addition, the chaos of local government financing in China has also led to the destruction of the laws of the capital market. Some local governments with insufficient population growth have overfinanced real estate development. At the same time, some cities with a large population inflow have insufficient real estate supply, which leads to high housing prices and high living costs. The government’s unreasonable intervention has affected the free allocation of production factors following the law of marketization to a certain extent, resulting in serious factor market distortions [6].
In its 2020 Work Report, the Chinese government once again emphasized encouraging innovation as a core national strategy. The ability of scientific and technological innovation is the key support for the smooth development of China’s economy from high-speed development to high-quality development. However, the marginal product effect of directly increasing scientific research investment is no longer as significant as in the past. The drive for innovation in the future will depend on efficiency improvements. Zhang [7] believed that China’s future development should promote the innovation-driven model through the factor-driven model, and realize the upgrade from comparative advantage to competitive advantage. However, the phenomenon of factor market distortions can inhibit the process of factor marketization and limit the power of innovation. China has a vast territory and a huge economy, and the geographical connections between regions cannot be ignored. This research aims to verify the impact of factor market distortions on the efficiency of technological innovation through empirical analysis. To explore the direct effect of factor market distortions on local innovation efficiency and the spillover effects to surrounding areas considering the geographical connection between regions. The provincial governments of China should fully consider the flow of factors between regions in their local economic development, and strengthen collaborative management. This research hopes to explore the interaction of factor market distortions in various regions of China on the impact on innovation, and to provide a policy reference for the Chinese economic strategy of building a unified domestic national market [8].

2. Literature Review

This section summarizes the research achievements on innovation efficiency from four aspects: regional economy, financial capital, government intervention, and laws–regulations. The literature on factor market distortions can be summarized from three perspectives: Macro-economies, Meso-industry, and Micro-firm. Afterward, it then discusses existing research findings on the link between the efficiency of technological innovation and the factor market distortions. Finally, the contributions of this research based on existing research results are presented.

2.1. Definition, Calculation, and Extension of the Efficiency of Technological Innovation

Ray and Desli [9] defined technological innovation efficiency as the degree to which relevant activities are close to the current technological frontier. Technological innovation is the product of the accumulation of knowledge and capital, and often shows regional agglomeration. The measurement methods of scientific and technological innovation efficiency are now very mature [10,11]. Among them, SFA (Stochastic Frontier Analysis) [12] and DEA (Data Envelope Analysis) [13,14] are the most widely used. These two methods have some commonalities and also have their own characteristics. In principle, both SFA and DEA need to construct suitable production frontiers to measure innovation efficiency. The main difference between SFA and DEA is whether or not a specific production function is required. DEA is like an opaque container where chemical reactions take place. SFA is more like a programmed production process. The characteristics of the two methods determine their advantages and disadvantages. As a parametric method, the biggest advantage of SFA is that it considers the impact of random factors on output [10]. DEA is simpler and more effective as a non-parametric method based on linear programming techniques. Li [15] used Chinese provincial panel data to prove that industrial specialized agglomeration can be conducive to the improvement of regional innovation efficiency. Bai [16] applied the stochastic frontier method to measure China’s regional innovation efficiency from 1998 to 2007. The spatial distribution of the data showed that there was a higher innovation efficiency in the high agglomeration area of human capital in the eastern coastal areas. Chen, Wang, and Li [17] proved through empirical analysis that areas rich in natural resources could be more dependent on the economic effects of resource development causing a low level of innovation motivation. The experimental results also showed that the level of urbanization, education, and FDI (foreign direct investment) could be conducive to the improvement in the level of scientific and technological innovation. The level of urbanization directly provides a sufficient labor pool, and the quality of education ensures the proportion of talents in the population. Foreign direct investment can improve the level of innovation from a capital investment way. Chen, Liu, and Ma [18] harnessed the LMDI (Log-Mean Diesel Index) method to prove that it is not the economic level and R&D investment that contributes the most to the final innovation level, but innovation efficiency. They showed that the innovation model that blindly expands R&D investment while ignoring efficiency has been unable to meet the current needs of China’s innovation power. Financial capital can be one of the important inputs of technological innovation [19]. Alguezaui and Filieri [20] proved the important role of social capital in technological innovation through investigation. Dakhli and Clercq [21] argued that human capital could be strong support for innovation at the national level. The Chinese government adopts a controlled market economy model for the economy. The Chinese government’s intervention in the economy often affects the overall trend of the economy. Law enforcement supervision and financial support are commonly exploited intervention methods by the government. Shen et al. [22] once again proved that resource endowment can inhibit local innovation. At the same time, environmental regulation has been proven to be positively correlated with the efficiency of technological innovation. The government can also promote technological innovation through financial subsidies [23]. Broekel [24] confirmed the stimulation of regional innovation by R&D subsidies through data from Germany. Guan and Yam [25] exploited data from Beijing to empirically analyze the impact of government financial incentives on the innovation performance of Chinese enterprises. They found that while major government financial incentives such as Special Loans and Tax Credits are positively influential to the innovative economic performance of firms, Direct Earmarks, sometimes negatively affect it. Enterprises and scientific research institutes need to consider existing local laws and regulations when promoting technological innovation. Alexander [26] undertook multilevel modeling of 314 technology alliance portfolios located in Europe, North America, and the Asia-Pacific region to verify the impact of legal, normative, and cultural perception institutions on innovation. Blind, Petersen, and Riillo [27] held that laws and regulations can promote innovation in low-certainty markets, but not in high-certainty markets. Regional economic agglomeration provides high-quality talents and resources for technological innovation. The financial industry and government influence innovation output through capital factors. The investment in innovation factors has been relatively abundant, and the improvement in innovation efficiency is the driving force for future innovation. The improvement of the allocation efficiency of the factor market has become an important guarantee for the improvement in innovation efficiency. Existing research shows that talent labor and capital are important factors that affect the efficiency of technological innovation. Considering the cross-regional mobility of these factors.
Hypothesis 1.
The scientific and technological innovation efficiency in China has the attribute of positive spatial autocorrelation.

2.2. Definition, Calculation, and Extension of Factor Market Distortion

Research on factor market distortion dates back to the 1960s. Factor market distortion was introduced and classified by Bhagwati and Ramaswami [28]. Chacholiades [29] believed that factor market distortion refers to the phenomenon that the price and cost of production factors do not match due to information asymmetry. Such mismatches can result in inefficiencies in the allocation of factor markets. Ljungwall and Tingvall [30] claimed that China’s factor market distortions cause the economic growth effect of R&D investment to be lower than that of other countries. The estimation methods of factor market distortion normally include the Production Function Method [31], Frontier Technology Analysis Method [32], and Market Index Method [33]. The advantage of the Production Function Method is that it can measure the degree of distortion of different factors of production at the same time. At the macro level, some scholars have discussed the relationship between factor market distortions and the effects of economic efficiency and environmental pollution. Sun and Lin [34] confirmed through regional data that factor market distortions have inhibited the improvement of China’s coastal economic efficiency. Geng, Wu, and Zhao [35] analyzed the loss of economic efficiency caused by factor market distortions exploiting China’s 1998–2017 data as a sample. Bian et al. [36] believed that the distortion of the labor factor market and capital factor market promoted the development of high-polluting enterprises and inhibited the development of the green economy. At the meso-industry level, some scholars have explored the impact of factor market distortions on manufacturing and agriculture. Liu [37] used the quantile regression method to empirically examine the impact of factor market distortions on the high-quality development of manufacturing. It was concluded that labor and capital factor market distortions significantly reduce the efficiency of factor resource allocation in manufacturing enterprises. Wu and Yao [38] conducted extensive research on factor market distortions and agricultural development. They hold that factor market distortions not only hinder the improvement of agricultural total factor productivity, but also hinder the growth of farmers’ total income and income from different sources in different regions. Li and Liu [39] empirically proved that factor market distortions exert significant inhibitory effects on the cost markup of Chinese manufacturing enterprises based on micro-firm data. Fan, Zheng, and Ma [40] explored and concluded that the distortions of the factor market significantly inhibit the quality upgrading of enterprise export products. Wang and Hu [41] verified through the study of listed companies that factor market distortion can enhance the foreign investment tendency of enterprises but weaken the learning effect of enterprise investment. Factor market distortions play a discordant role in macro-economies, meso-industries, and micro-enterprises. For the efficiency of technological innovation, factor market distortions also play a role that cannot be ignored.
Hypothesis 2.
Factor market distortions lead to low factor allocation efficiency, inhibiting the improvement of innovation efficiency.

2.3. Research on the Nexus of Factor Market Distortion and Technological Innovation

At present, some literature has analyzed the impact of factor market distortions on innovation from certain industry perspectives. For example, Yi and Ji [42] explored the impact of factor market distortions on innovation performance in high-tech industries. Sen et al. [43] evaluated the impact of factor market distortions on innovation efficiency in the power sectors. There were also some articles considering that regional innovation can be affected by factor market distortions [44]. Shi, Zhang, and He [45] verified the influence of factor markets on regional innovation through partitioned regression. Li and Wang [46] proved the nonlinear relationship between factor market distortions and innovation efficiency without considering spatial spillover effects. This research harnesses a variety of spatial weight matrices to establish inter-regional connections and verify the spatial correlation of scientific and technological innovation efficiency. Spatial econometric models are availed to explore the spatial effects of factor market distortions on the efficiency of technological innovation.
Hypothesis 3.
Factor market distortions exert spatial spillover effects on the inhibitory impact on technological innovation efficiency.

3. Study Design

This research applies the spatial econometric model to empirically estimate the impact of factor market distortion on the efficiency of technological innovation and the spatial spillover effects. First, three spatial weight matrices based on different calculation methods are constructed and used to calculate the spatial correlation test index. The verification of the spatial correlation of scientific and technological innovation efficiency is the premise of the adoption of the spatial econometric model [47]. Then the three spatial weight matrices are exploited to construct the spatial econometric model. Finally, all involved variables and data are introduced in this section.

3.1. Spatial Correlation Test Method

The construction of a spatial weight matrix is a fundamental step in spatial econometrics. Both the spatial correlation test and the construction of the spatial econometric model require the participation of the spatial weight matrix. There is no unified conclusion in the existing academic circle on which spatial weight matrix can be more suitable [48,49]. When studying spatial effects, the spatial weight matrix is usually set in advance. To ensure the robustness of the research results, this study uses three spatial weights for comparative analysis [50].
Spatial geographic weight matrix ( W g ) is one of the most commonly used types of weighting matrices, established based on geographic distances between regions:
w g i j = { 0 , i = j 1 d i j 2 , i j
Lin et al. [48] believed that the economic development between regions can be closely related, and economic indicators can be used as an alternative basis to establish a spatial economic weight matrix ( W e ):
w e i j = { 0 , i = j 1 | e ¯ i e ¯ j | , i j
Li et al. [49] preferred a spatial gravitational matrix that combines geographic and economic factors ( W c ):
w c i j = { 0 , i = j   e i ¯ e j ¯ d i j 2 , i j
This study uses the global Moran’s I to test the spatial correlation of technological innovation efficiency. Refer to the formula expression of Hua et al. [51]:
G l o b a l   M o r a n s   I = n i = 1 n j = 1 n W i j ( X i X ¯ ) ( X j X ¯ ) i = 1 n j = 1 n W i j i = 1 n ( X i X ¯ ) 2
In Equations (1)–(4), d i j denotes the distance from region i to region j . e ¯ i is expressed as the average value of real GDP per capita in the region i from 2001 to 2017. e represents the average real GDP per capita in all regions of the country from 2001 to 2017. n indicates the number of regions. X i denotes technological innovation efficiency of region i , and X ¯ is the average value of technological innovation efficiency. W i j represents the spatial weight matrix.

3.2. Spatial Econometric Regression Model

Elhorst [52] holds that the spatial panel model includes three types: spatial panel error model (SEM), spatial panel lag model (SLM), and spatial panel Dubin model (SDM). SEM reflects the effect of the influencing factors of the explained variables on other areas through the spatial conduction mechanism, while SLM reflects the regional spillover effect from the random outflow [53]. SDM comprehensively considers the above two effects. SDM decomposition effects can further distinguish direct and indirect effects. Equations (5)–(7) represent the SDM considering three different matrices, respectively.
Y g = ρ j = 1 n W g i j Y g + θ X i t + λ j = 1 n W g i j X i t + μ i + ν t + ε i t
Y e = ρ j = 1 n W e i j Y e + θ X i t + λ j = 1 n W e i j X i t + μ i + ν t + ε i t
Y n = ρ j = 1 n W c i j Y n + θ X i t + λ j = 1 n W c i j X i t + μ i + ν t + ε i t
W g , W e , and W c represent three spatial weight matrices, respectively. Y g , Y e , and Y n denote the explained variables under the three spatial weight matrices, respectively. X i t represents the explanatory variable. μ i and ν t respectively represent individual effect and time effect. ε i t denotes the random error term. φ i t means the spatial autoregressive error term. ρ , θ , δ , and λ denotes the regression coefficients.

3.3. Variables and Data

This study looks forward to exploring the spatial effect of factor market distortions on the efficiency of technological innovation. The efficiency of technological innovation is the explained variable. The main explanatory variables are two factor market distortions. This study selects some appropriate control variables to help realize the empirical research.
In order to reduce the requirements for input–output data, this study draws on Chen et al. [11] to select the variable returns to scale DEA model to measure the efficiency of technological innovation. RDY (Innovation output) is represented by the number of patents granted. RDL (Labor input) is expressed by the full-time equivalent of scientific researchers, and RDK (Capital input) is expressed by the R&D capital stock.
M i n [ θ ε ( j = 1 m s + j = 1 r s + ) ] s . t . { j = 1 n x j λ j + s = θ x 0 j = 1 n y j λ j s + = y 0 λ j 0 ,   s + 0 ,   s 0 i = 1 n λ i = 1
where n denotes the number of decision-making units. There are m inputs and r outputs. θ indicates the efficiency value. ε is an infinitesimal amount. s indicates overinvestment. s + denotes insufficient output. λ is the weight variable.
This paper draws on the method of Zhao et al. [54] to estimate the output elasticity of China’s factors, and substitutes it into a function that measures the distortion of the labor and capital factor markets. Cobb–Douglas (C-D) production function must be built first [55]:
Y t = A t L t α K t β
Respectively calculate the First Derivatives of labor and capital to obtain the marginal products M P L t and M P K t :
M P L t = α Y t L t
M P K t = β Y t K t
Utilize the ratio of the marginal output of factors to the actual price of factors to express the degree of factor market distortions. Then Labor Market Distortion ( L D t ) and Capital Market Distortion ( C D t ) can be expressed as:
L D t = M P L t P L t = α Y t / L t P L t
C D t = M P K t P K t = β Y t / K t P K t
Among the Equations (9)–(13), Y t denotes the output, expressed by real GDP. A t represents total factor productivity. L t represents labor input, expressed by the number of employees at the end of the year. K t indicates capital investment, expressed by capital stock. The capital stock can be calculated with the depreciation rate calculated by Shan [56]. α and β respectively represent the output elasticity coefficients of labor factor and capital factor. P L t indicates the actual price of labor, denoted by wage income. P K t is the actual price of capital, expressed by the average interest rate of a one-year legal loan of a financial institution.
The control variables in this study include: Foreign direct investment (FDI). Human capital (HR) is a variable hard to quantify; the average number of years of education can be selected as a substitute variable. Industrial Structure Advanced (INDH) is expressed by the ratio of the tertiary industry to the secondary industry. Openness to the outside world (OPEN) can be expressed in terms of total import and export trade. Infrastructure level (INF) includes many aspects, this research uses road mileage as a substitute variable considering data availability. Table 1 presents the descriptive statistics of the variables designed in this study. The data in this study are compiled from the original data of the China Statistical Yearbook. In the calculation of innovation efficiency, the innovation output is represented by the number of patents granted (RDY). Labor input is expressed by the full-time equivalent of scientific researchers (RDL). Capital input is expressed by the R&D capital stock (RDK). Gross domestic product (GDP), Labor, and Capital are variables exploited in the calculation of factor market distortions. More details can be found in the quantification method part.

4. Results and Discussion

This section firstly presents the results of the spatial correlation test to provide support for the empirical analysis. The measurement results of some statistics are then provided to confirm a suitable spatial econometric model. Finally, regression results and decomposition effects analysis results are provided. To ensure the robustness of the experimental results, an endogeneity test and the instrumental variable regression are also performed in this study.

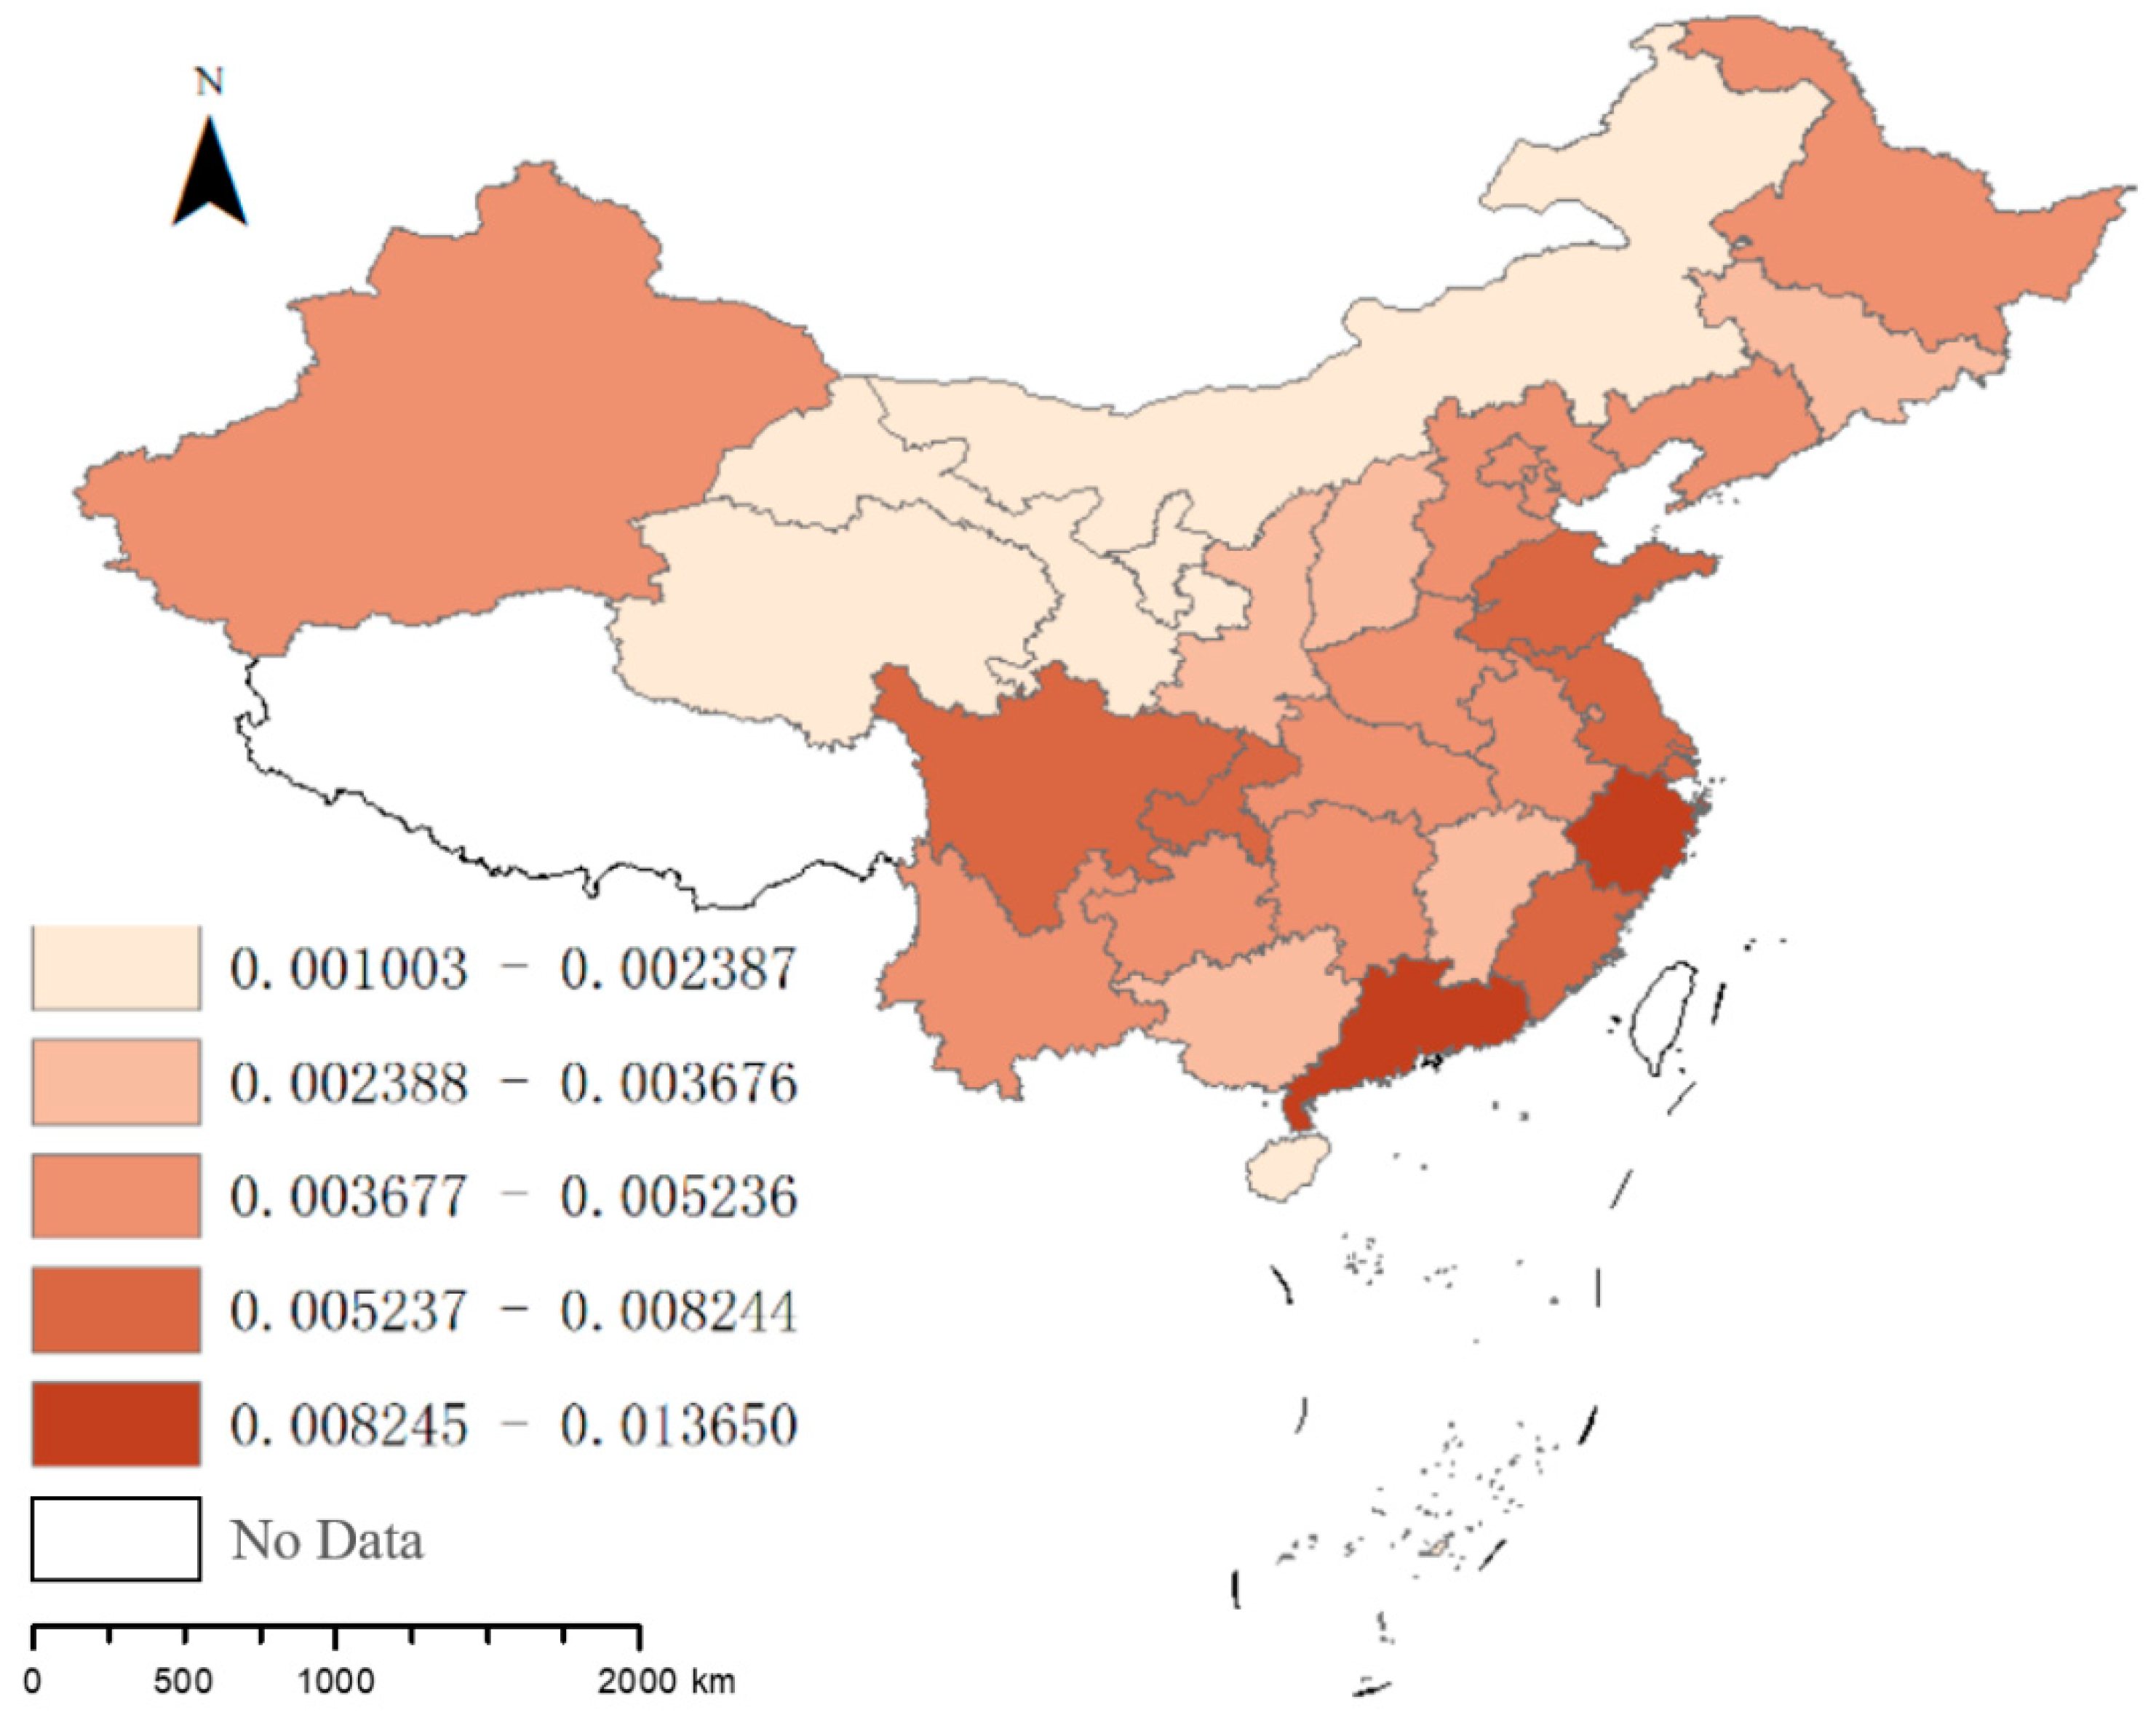
4.1. Geographical Distribution and Spatial Autocorrelation of Technological Innovation Efficiency

Figure 1 tells the spatial distribution characteristics of the average value of technological innovation efficiency in 2001–2017. In general, the efficiency of scientific and technological innovation shows a distribution trend of the low values in the northwest and the high values in the southeast.
Xinjiang exhibits better efficiency values than other regions in the northwest. Chongqing and Sichuan display higher efficiency values than surrounding areas. Guangdong and Zhejiang have the highest innovation efficiency. Shmelev [57] concluded that Shenzhen is one of the most sustainable cities in the whole of the Global South, which verifies the results of this research. It can be preliminarily guessed that the central provinces have received the radiation driving effects of Sichuan, Chongqing, and the southeast coast. This positive spatial autocorrelation can be tested by Moran’s I.
This research uses three spatial weight matrices to calculate Moran’s I and conduct a comparative analysis. The results in Table 2 show that there is a positive spatial autocorrelation in China’s inter-provincial technological innovation efficiency, which verifies Hypothesis 1. That is to say, high-efficiency areas tend to be surrounded by high-efficiency areas, and low-efficiency areas tend to be surrounded by low-efficiency areas. This verifies the conclusion of Zhu and Xia [58]. When a region lacks innovation enthusiasm, surrounding regions also lose the motivation to compete. In addition, it can be seen that Moran’s I values calculated with Wg and Wc show a more significant spatial correlation. This suggests that in this study, geographical linkages between regions play a more important role than economic linkages.

4.2. Identification of Spatial Econometric Model

Several statistical tests (Table 3) can be used to determine the appropriate spatial econometric model. First, the Lagrange Multiplier (LM) test and Robust Lagrange Multiplier (Robust LM) test are exploited to verify the validity of the spatial effects. When Wg and Wc participate in the model construction, the coefficients of LM-lag, Robust LM-lag, LM-err, and Robust LM-err pass the 1% significance test. When We participates in the model construction, the coefficients of LM-lag, Robust LM-lag, and Robust LM-err all pass the 1% significance test, but LM-err does not pass the significance test.
In this study, the model involving Wg and Wc can be used as the main experiment, and the model involving We can be seen as the control experiment. The SDM can be chosen for empirical analysis as panel data models without spatial effects are rejected. The Hausman test is used to choose a fixed-effects model or a random-effects model [52,53]. The SFE LR-test is used to test for spatial fixed effects, and the TFE LR-test is used to test for temporal fixed effects. LR and Wald are applied to determine whether SDM needs to be reduced to SLM or SEM. Wald-lag, Wald-err, LR-lag, and LR-err all pass the 1% significance test. This suggests that SDM should not be simplified and should be chosen as the model for this empirical research [52,53].

4.3. Empirical Regression Results

The regression results in Table 4 show that in the regression results involving the three spatial weight matrices, both R2 and log-like are in the appropriate range of values. However, W*dep.var. based on We fails the significance test, which verifies the conclusions in Table 3. The factor market distortions based on the three spatial weight matrices all show an inhibitory effect on the efficiency of technological innovation, which verifies Hypothesis 2. Based on the results of Wg and Wc, it can be seen that capital market distortion exerts a more significant inhibitory effect on the efficiency of technological innovation than labor market distortion. When the model considers economic linkages between regions, the regional effects of capital can be partially masked.
Guo and Xiao [59] showed through empirical research that labor market distortions have a stronger inhibitory effect on innovation efficiency in western China. On the contrary, the capital market distortion in eastern China has a more significant inhibitory effect on innovation efficiency. This article concludes that the influence of the capital market is stronger than that of the labor market distortion from the perspective of the whole country. Without considering the economic connection between regions, both human capital and the advanced industrial structure can significantly promote the efficiency of scientific and technological innovation. The results are consistent with the conclusions from Bai [16] and Li [15]. Li and Wang [60] believe that foreign direct investment can have a positive impact on technological innovation, but this study does not reach this conclusion. In order to further analyze the spatial spillover effects of factor market distortion on the efficiency of technological innovation, the decomposition effects of SDM need to be interpreted (Table 5).
When considering factor market distortion regression coefficients, the regression coefficients based on Wg and Wc cannot pass the significance test, and the regression coefficients based on We pass the 1% significance test. The results of the decomposition effects show that there are differences in the results of different spatial weight matrices [48,49,50]. When only considering the geographical distance factor, there is no spatial spillover effect in the inhibitory effect of factor market distortion on the efficiency of scientific and technological innovation. When only considering inter-regional economic connections, the inhibitory effect of factor market distortion on the efficiency of local technological innovation can spill over to surrounding areas, which verifies Hypothesis 2. In addition, the effects of human capital and industrial advancement on the efficiency of technological innovation both show spillover effects to surrounding areas. This is because areas with better economic development tend to be more attractive to capital and labor. The economy drives the flow of factors, thus forming cross-regional spatial effects.

4.4. Endogeneity Analysis

The existence of endogeneity can easily lead to biased empirical results [5]. On the one hand, the distortions of the factor market can inhibit the efficiency of technological innovation due to the inefficient allocation of the factor market. On the other hand, the efficiency of technological innovation may also affect the factor market due to technological output. To ensure the robustness of the results of this paper, the panel Granger method can be adopted to examine the bidirectional causal relationship between factor market distortions and technological innovation efficiency (Table 6).
Finally, the instrumental variable method is harnessed to verify the robustness of the conclusions of this article. Instrumental variables are required to be related to endogenous explanatory variables, but not to disturbance terms of the explained variables. The lagged first-order variables of labor market distortion and capital market distortion can be selected as instrumental variables. The results of Table 7 show that the weak instrumental variable test (Cragg–Donald Wald F statistics) passes the 1% significance test, rejecting the null hypothesis of the existence of weak instrumental variables. The regression results of the instrumental variable method verify the robustness of the inhibitory effects of factor market distortion on the efficiency of technological innovation.

5. Conclusions and Policy Implications

Despite China’s current high scientific research investment, it has encountered bottlenecks in some key technical fields. This study empirically analyzes the impact of factor market distortions on the efficiency of technological innovation from the perspective of factor market allocation efficiency. Considering that China is a vast territory composed of multiple inter-provincial administrative regions, this study introduces a variety of spatial weight matrices to establish inter-regional connections. Regional geographic distance and economic linkages are considered to verify the spatial correlation of technological innovation efficiency across regions. Finally, the spatial econometric models constructed by three spatial weight matrices are used to evaluate the regional spillover effects of factor market distortions on the efficiency of technological innovation. The main conclusions can be drawn: (1) This study uses three spatial weight matrices to participate in the construction of Moran’s I, and the results all show that China’s technological innovation efficiency presents a strong positive spatial correlation. This means that regions with higher technological innovation efficiency tend to be closer geographically or economically to other high-tech innovation regions. (2) The regression results of the spatial econometric models constructed with the participation of the three spatial weight matrices all verify that labor market distortion and capital market distortion inhibit the improvement of the efficiency of scientific and technological innovation. The improvement of factor market allocation efficiency has become one of the key issues that China needs to pay attention to in its current development. (3) When considering inter-regional economic linkages, the inhibitory effects of factor market distortions on technological innovation efficiency present spillover effects to surrounding areas. This suggests that such spatial spillovers depend on economic linkages rather than geographic linkages. (4) The advancements in human capital and industrial structure are proved to be beneficial to the improvement of the efficiency of scientific and technological innovation.
In conclusion, optimizing the efficiency of factor market allocation can become an important path for China to release new space for technological innovation and improvement. (1) Because of the existence of positive spatial autocorrelation, this paper suggests that the Chinese government establish innovation-driven demonstration regions in low-innovation agglomeration areas. With the support of government talents and financial policies, the innovative development of demonstration zones can radiate and enhance the innovation capabilities of surrounding areas, thereby weakening regional innovation differences. (2) Considering that the impact of capital market distortion on the efficiency of scientific and technological innovation appears more significant than that of labor market distortion, capital market reform should be the focus of releasing the vitality of scientific and technological innovation. The socialist market economic system with Chinese characteristics should think about how to maximize the vitality of the market economy while ensuring macro-control. Capital marketization reform requires sufficient vitality based on capital flows under the premise of ensuring that financial risks are controllable. Under the premise of not affecting the general strategy of the country and the fundamental interests of the people, the free competition between government capital and private capital should be fully guaranteed. Local governments can establish a more complete credit evaluation mechanism, ensuring that the government and private enterprises are on an equal base. Establish fair and indiscriminate loan rules strictly based on credit ratings. The labor market in China has a distinct urban–rural duality. The urban settlement policy has become an important factor affecting the direction of talent flow. Some high-level talents consider the cost of settling down and the cost of living and choose enterprises which are not very suitable for them. In order to avoid inefficient labor allocation, the reform of the household registration system should be accelerated to ensure equal distribution of the interests of urban and rural residents. (3) Since the inhibition of innovation efficiency by factor market distortions can spill over to surrounding areas, local governments should maintain their preference for areas with low factor distortions when conducting regional economic cooperation. (4) Local governments with low innovation efficiency need to improve the education talent supply system and basic education facilities to increase the local enrollment rate. At the same time, build local-brand higher education institutions to avoid brain drain. The local governments should also guide the development of the tertiary industry to provide a reasonable industrial structure that can be conducive to scientific and technological innovation. Regional governments should carefully study Hainan’s experience in household registration reform and consider the feasibility of local promotion.
A major novelty of this paper is the application of multi-weight spatial analysis to this topic. The quadratic and cubic terms of factor market distortions are not considered in the econometric models in this study, which makes the experiment lack discussions of the more complex nexus between variables. The factor market distortion in this paper only considers the two production factors of labor and capital, which is not comprehensive enough. In addition, the selection of control variables has the use of substitute variables, which is not perfect. Future research could take other production factors, such as land, into account. More complex nonlinear relationships can also be a direction for further discussion. In addition, considering the effect of factor market distortion correction rather than factor market distortion itself on technological innovation can also be a new perspective in future research.

Author Contributions

Supervision, J.M.; Writing—original draft, Q.L.; Writing—review & editing, C.H. All authors have read and agreed to the published version of the manuscript.

Funding

This research received no external funding.

Institutional Review Board Statement

Not applicable.

Informed Consent Statement

Not applicable.

Data Availability Statement

The data presented in this study are available on request from the corresponding author. The data are not publicly available due to privacy.

Conflicts of Interest

The authors declare no conflict of interest.

References

  1. National Bureau of Statistics of China. Available online: http://www.stats.gov.cn/ztjc/zthd/bwcxljsm/70znxc/201907/t20190723_1680978.html (accessed on 23 July 2019).
  2. Shmelev, S.E.; Sagiyeva, R.K.; Kadyrkhanova, Z.M.; Chzhan, Y.Y.; Shmeleva, I.A. Comparative Sustainability Analysis of Two Asian Cities: A Multidimensional Assessment of Taipei and Almaty. J. Asian Financ. Econ. Bus. 2018, 5, 143–155. [Google Scholar] [CrossRef]
  3. Chen, Y.P. Comparative Analysis of the Input-Output Efficiency of Science and Technology in China and the United States——Based on the Contribution of R&D Investment to Economic Growth. Technoecon. Manag. Res. 2019, 6, 20–24. [Google Scholar]
  4. You, J.H. Stages of Development, Government Functions and China’s Urbanization Process: Why Does China’s Urbanization Lag? Ind. Econ. Res. 2022, 2, 14–26+84. [Google Scholar]
  5. Han, J.W.; Miao JJShi, Y.; Miao, Z. Can the semi-urbanization of population promote or inhibit the Improvement of energy efficiency in China? Sustain. Prod. Consum. 2021, 26, 921–932. [Google Scholar] [CrossRef]
  6. Li, J.; Pan, Y.Z. Factor Market Distortion and China’s Innovation Capability—Based on China’s Provincial Panel Data Analysis. J. Cent. Univ. Financ. Econ. 2018, 3, 87–99. [Google Scholar]
  7. Zhang, E.Z. How China Climbs the Global Value Chain—Also Commentary on “China Climbing the Global Value Chain: Realization Mechanism and Strategic Adjustment”. Jianghai Acad. J. 2017, 1, 230–233. [Google Scholar]
  8. Wang, X.G.; Zhang, Y.W.; Liu, Y. Accelerate the construction of a unified national market. Enterp. Manag. 2022, 6, 18–21. [Google Scholar]
  9. Ray, S.C.; Desli, E. Productivity growth, technical progress, and efficiency change in industrialized countries: Comment. Am. Econ. Rev. 1997, 87, 1033–1039. [Google Scholar]
  10. Bai, J.H.; Bian, Y.C. Factor Market Distortion and Efficiency Loss of China’s Innovative Production. China Ind. Econ. 2016, 11, 39–55. [Google Scholar]
  11. Chen, Y.E.; Li, X.; Li, W. Analysis of Influencing Factors and Spatial Heterogeneity of China’s Provincial S&T Innovation Efficiency. China Soft Sci. 2021, 4, 137–149. [Google Scholar]
  12. Cinzia, D.; Kristiaan, K.; Thyago, N.; Robin, C.S. Empirical surveys of frontier applications: A meta-review. Int. Trans. Oper. Res. 2020, 27, 709–738. [Google Scholar]
  13. Li, L.S.; Bao, Y.F.; Liu, J. Research on the Impact of Intelligence on Total Factor Productivity of China’s Manufacturing Industry. Sci. Res. 2020, 4, 609–618+722. [Google Scholar]
  14. Shmelev, S.E.; Shmeleva, I.A. (Eds.) Sustainability Analysis: An Interdisciplinary Approach; Palgrave: London, UK, 2012; 335p. [Google Scholar]
  15. Li, D.H. Industrial specialization agglomeration, diversification agglomeration and regional innovation efficiency: An empirical investigation based on spatial econometric model. Technoecon. Manag. Res. 2022, 5, 111–117. [Google Scholar]
  16. Bai, J.H. On regional innovation efficiency: Evidence from panel data of China’s different provinces. Reg. Stud. 2013, 47, 773–788. [Google Scholar] [CrossRef]
  17. Chen, J.; Wang, L.; Li, Y. Natural resources, urbanization and regional innovation capabilities. Resour. Policy 2020, 66, 101643. [Google Scholar] [CrossRef]
  18. Chen, X.; Liu, Z.; Ma, C. Chinese innovation-driving factors: Regional structure, innovation effect, and economic development–Empirical research based on panel data. Ann. Reg. Sci. 2017, 59, 43–68. [Google Scholar] [CrossRef]
  19. Acharya, V.; Xu, Z. Financial dependence and innovation: The case of public versus private firms. J. Financ. Econ. 2017, 124, 223–243. [Google Scholar] [CrossRef]
  20. Alguezaui, S.; Filieri, R. Investigating the role of social capital in innovation: Sparse versus dense network. J. Knowl. Manag. 2010, 14, 891–909. [Google Scholar] [CrossRef]
  21. Dakhli, M.; De Clercq, D. Human capital, social capital, and innovation: A multi-country study. Entrep. Region. Dev. 2004, 16, 107–128. [Google Scholar] [CrossRef]
  22. Shen, T.; Chen, H.H.; Zhao, D.H.; Qiao, S. Examining the impact of environment regulatory and resource endowment on technology innovation efficiency: From the microdata of Chinese renewable energy enterprises. Energy Rep. 2022, 8, 3919–3929. [Google Scholar] [CrossRef]
  23. Gao, Y.; Hu, Y.; Liu XZhang, H. Can public R&D subsidy facilitate firms’ exploratory innovation? The heterogeneous effects between central and local subsidy programs. Res. Policy 2021, 50, 104221. [Google Scholar]
  24. Broekel, T. Do cooperative research and development (R&D) subsidies stimulate regional innovation efficiency? Evidence from Germany. Reg. Stud. 2015, 49, 1087–1110. [Google Scholar]
  25. Guan, J.C.; Yam, R.C.M. Effects of government financial incentives on firms’ innovation performance in China: Evidences from Beijing in the 1990s. Res. Policy 2015, 44, 273–282. [Google Scholar] [CrossRef]
  26. Alexander, E.A. The effects of legal, normative, and cultural–cognitive institutions on innovation in technology alliances. Manag. Int. Rev. 2012, 52, 791–815. [Google Scholar] [CrossRef]
  27. Blind, K.; Petersen, S.S.; Riillo, C. The impact of standards and regulation on innovation in uncertain markets. Res. Policy 2017, 46, 249–264. [Google Scholar] [CrossRef]
  28. Bhagwati, J.; Ramaswami, V.K. Domestic Distortions, Tariffs and the Theory of Optimum Subsidy. J. Political Econ. 1969, 77, 1011–1013. [Google Scholar] [CrossRef]
  29. Chacholiades, M. International Trade Theory and Policy; McGraw-Hill: Auckland, New Zealand; Singapore, 1978. [Google Scholar]
  30. Ljungwall, C.; Tingvall, P.G. Is China Different? A Meta-Analysis of the Growth-Enhancing Effect from R&D Spending in China. China Econ. Rev. 2015, 36, 272–278. [Google Scholar]
  31. Miao, J.J.; Han, J.W. Market Distortion of Factors of Production and China’s Industrial Structure Imbalance. Commer. Res. 2020, 12, 53–65. [Google Scholar]
  32. Zhao, Z.F.; Shi, J.C. Loss of Industrial Efficiency in China’s Factor Market Distortion: An Empirical Analysis Based on the DEA Method. China Ind. Econ. 2006, 10, 40–48. [Google Scholar]
  33. Zhang, J.; Zhou, X.Y.; Li, Y. Distortion of the factor market restrains the R&D of Chinese enterprises? Econ. Res. J. 2011, 8, 78–91. [Google Scholar]
  34. Sun, C.Z.; Lin, Y.Y. The impact of factor market distortion on marine economic efficiency in China’s coastal areas. Mar. Sci. Bull. 2021, 4, 369–378+386. [Google Scholar]
  35. Geng, X.H.; Wu, X.R.; Zhao, W. Distortion of China’s factor market and loss of economic efficiency: Decomposition and influence mechanism. Inq. Into Econ. Issues 2021, 6, 30–43. [Google Scholar]
  36. Bian, Y.C.; Wu, L.H.; Bai, J.H.; Yang, Y.Z. Does the distortion of factor market restrain the growth of green economy? World Econ. Pap. 2021, 2, 105–119. [Google Scholar]
  37. Liu, W.R. The impact of factor market distortions on the high-quality development of manufacturing. Econ. Probl. 2021, 9, 74–82. [Google Scholar]
  38. Wu, G.S.; Yao, S. Research on the measurement and effect of agricultural green total factor productivity under factor market distortion. Ecol. Econ. 2021, 1, 96–102+115. [Google Scholar]
  39. Li, L.; Liu, N.Q. Factor Market Distortion and Enterprise Cost Markup—An Empirical Analysis Based on Micro Data of Manufacturing Enterprises. Commer. Res. 2022, 1, 1–11. [Google Scholar]
  40. Fan, A.J.; Zheng, Z.Q.; Ma, Y.J. Factor Market Distortion and Enterprise Export Product Quality: Theoretical Mechanism and Empirical Test. Rev. Ind. Econ. (Shandong Univ.) 2021, 4, 119–143. [Google Scholar]
  41. Wang, K.; Hu, F. The influence of factor market distortions on the behavior of foreign direct investment of enterprises: Micro-evidence from Chinese listed companies. Int. Bus. (J. Univ. Int. Bus. Econ.) 2021, 3, 82–96. [Google Scholar]
  42. Yi, Y.Y.; Ji, N. Research on the influence of market distortion of R&D factors on innovation performance of high-tech industries. J. Beijing Univ. Posts Telecommun. (Soc. Sci. Ed.) 2021, 1, 60–68. [Google Scholar]
  43. Sen, Q.; Dong, H.Z.; Zi, X.G.; Zhang, T. Factor price distortions, environmental regulation and innovation efficiency: An empirical study on China’s power enterprises. Energy Policy 2022, 164, 112887. [Google Scholar]
  44. Luo, F.; Shi, J.L. Factor Market Distortion, Innovation and Regional Economic Growth: An Analysis Based on China’s Provincial Panel Data. Res. Dev. 2021, 3, 8–14. [Google Scholar]
  45. Shi, D.Q.; Zhang, W.D.; He, S. Does factor market distortion inhibit regional innovation efficiency? Forum Sci. Technol. China 2016, 6, 69–74. [Google Scholar]
  46. Li, X.S.; Wang, C. Does factor market distortion inhibit the improvement of innovation efficiency? Empirical analysis based on China’s inter-provincial dynamic panel data. J. Yunnan Univ. Financ. Econ. 2019, 3, 24–36. [Google Scholar]
  47. Zhou, J.; Gao, J.; Zhou, Y.W.Q. The theory of spatial econometrics model setting and its new progress. J. Econ. 2016, 2, 161–190. [Google Scholar]
  48. Lin, G.P.; Long, Z.H.; Wu, M. A Spatial Econometric Empirical Analysis of Regional Economic Convergence in China: 1978–2002. China Econ. Q. 2005, 4, 67–82. [Google Scholar]
  49. Li, L.; Tian, Y.X.; Zhang, G.X.; Zhang, H.L. Spatial Weight Matrix Construction and Economic Space Gravitational Effect Analysis—An Empirical Test in the Background of the European Debt Crisis. Syst. Eng.-Theory Pract. 2015, 8, 1918–1927. [Google Scholar]
  50. Han, J.W.; Miao, J.J.; Du, G.; Yan, D.; Miao, Z. Can market-oriented reform inhibit carbon dioxide emissions in China? A new perspective from factor market distortion. Sustain. Prod. Consum. 2021, 27, 1498–1513. [Google Scholar] [CrossRef]
  51. Hua, C.; Miao, J.J.; Liu, W.P.; Du, G.; Wang, X. The impact mechanism of industrial agglomeration on energy efficiency-Evidence from producer service industry in China. Energy Sources Part B Econ. Plan. Policy 2021, 16, 740–758. [Google Scholar] [CrossRef]
  52. Elhorst, J.P. Specification and estimation of spatial panel data models. Int. Reg. Sci. Rev. 2003, 26, 244–268. [Google Scholar] [CrossRef]
  53. Miao, J.J.; Hua, C.; Feng, J.C. The upgrading effect and carbon emission of industrial synergistic agglomeration: An empirical analysis based on a spatial econometric model. Ecol. Econ. 2020, 2, 28–33. [Google Scholar]
  54. Zhao, Z.Y.; Liu, X.L.; Lu, B.Y. Estimation of China’s Factor Output Elasticity. Econ. Theory Bus. Manag. 2006, 6, 5–11. [Google Scholar]
  55. Wang, X.; Hua, C.; Miao, J. The Spatial Effect of Factor Market Distortion on Green Agriculture Development in China. Energy Sources Part A Recovery Util. Environ. Eff. 2022, 1–17. [Google Scholar] [CrossRef]
  56. Shan, H.J. Re-estimation of China’s capital stock K: 1952~2006. J. Quant. Technol. Econ. 2008, 10, 17–31. [Google Scholar]
  57. Shmelev, S.E. (Ed.) Sustainable Cities Reimagined: Multidimensional Assessment and Smart Solutions; Routledge: London, UK, 2019; 335p. [Google Scholar]
  58. Zhu, J.; Xia, Y. Spatial econometric analysis of the spillover from the efficiency of scientific and technological innovation to the regional economy. J. Sci. Teach. Coll. Univ. 2021, 10, 16–20. [Google Scholar]
  59. Guo, J.; Xiao, H. A Study on the Impact of Factor Market Distortion on Regional Innovation Efficiency. Sci.-Technol. Manag. 2019, 5, 27–33. [Google Scholar]
  60. Li, X.S.; Wang, C. Does factor market distortion inhibit the improvement of innovation efficiency? Based on the perspective of regional differences. J. Nanjing Audit Univ. 2019, 1, 48–58. [Google Scholar]
Figure 1. Geographical distribution of the average technological innovation efficiency in China.
Sustainability 14 12064 g001
Table 1. Statistical description of variables.
VariableMeanStd. Dev.MinMax
FDI (Foreign direct investment, RMB 100 million)206.9635253.86560.44266561210.101
HR (Human capital, year)24.731889.7774926.71254766.88777
INDH (Advanced industrial structure)0.96520540.49586560.49437434.236677
OPEN (Openness, RMB 100 million)3690.568338.98111.6555684,195.82
INF (Infrastructure level, kilometer)113,606.272,853.936078329,950.5
RDY (Innovation output, pieces per item)23,439.1545,594.9870332,652
RDL (Innovative labor input, people per year)79,668.8597,562.6848565,287
RDK (Innovative capital investment, RMB 100 million)466.7934723.09641.9614820.477
GDP (Gross domestic product, RMB 100 million)14,002.2314,576.3300.1389,705.23
L (Labor, 10,000 people)2531.931684.572796767
K (Capital, RMB 100 million)21,576.7921,214.93753.07115,917.3
Table 2. Moran’s I calculated with three spatial weight matrices.
YearWgWeWc
Moran’s IZ-ValueMoran’s IZ-ValueMoran’s IZ-Value
20010.197 ***2.5090.146 **1.8210.212 ***2.731
20020.199 ***2.5270.145 **1.8050.214 ***2.746
20030.202 ***2.5430.143 **1.7880.216 ***2.761
20040.204 ***2.5600.142 **1.7720.218 ***2.776
20050.206 ***2.5770.141 **1.7560.220 ***2.790
20060.208 ***2.5930.140 **1.7390.222 ***2.804
20070.210 ***2.6090.138 **1.7230.224 ***2.818
20080.212 ***2.6250.137 **1.7070.226 ***2.832
20090.214 ***2.6400.136 **1.6910.227 ***2.845
20100.216 ***2.6560.135 **1.6750.229 ***2.858
20110.218 ***2.6710.133 **1.6600.231 ***2.871
20120.220 ***2.6860.132 *1.6440.232 ***2.884
20130.221 ***2.7010.131 *1.6280.234 ***2.896
20140.223 ***2.7160.130 *1.6130.236 ***2.908
20150.225 ***2.7300.128 *1.5980.237 ***2.920
20160.227 ***2.7450.127 *1.5820.239 ***2.932
20170.229 ***2.7590.126 *1.5670.240 ***2.943
Note that: The result is calculated by Stata software. ***, **, and * respectively denote significant at 1%, 5%, and 10% levels.
Table 3. Spatial econometric model specification test.
StatisticsWgWeWc
LM-lag498.1181 ***44.0582 ***486.4842 ***
Robust LM-lag732.8229 ***70.7428 ***673.6970 ***
LM-err62.5318 ***1.809266.7600 ***
Robust LM-err297.2366 ***28.4938 ***253.9728 ***
Wald-lag107.19 ***206.57 ***103.87 ***
Wald-err57.51 ***207.62 ***109.18 ***
LR-lag114.19 ***167.22 ***96.03 ***
LR-err97.25 ***167.73 ***94.98 ***
SFE LR-test1934.0749 ***2043.6645 ***1940.6092 ***
TFE LR-test86.2638 ***383.8302 ***57.6661 ***
Hausman test196.6666 ***320.2763 ***195.4008 ***
Note that: The result is regressed by MATLAB software. *** denotes significance at 1% levels.
Table 4. SDM regression results with three spatial weight matrices.
VariableWgWeWc
DL−0.003 **−0.0087 ***−0.0026 *
DK−0.0160 ***−0.0207 ***−0.0145 ***
FDI0.0030−0.0052−0.0019
HR0.0417 **−0.0601 ***0.0335 *
INDH0.0345 ***−0.0577 ***0.0686
OPEN0.0022−0.0239 ***−0.0108 **
INF0.0240 *0.0337 **0.0203
W*DL−0.0035−0.0109 ***0.0064
W*DK0.0048−0.0240 ***0.0217
W*FDI−0.0177 **0.0780 ***−0.0375 ***
W*HR0.1993 ***−0.04560.2667 ***
W*INDH0.0888 ***−0.0917 ***−0.0336
W*OPEN−0.01740.0598 ***−0.0921 ***
W*INF0.0968 ***0.1510 ***0.1363 ***
W*dep.var.0.9044 ***−0.09540.5794 ***
R20.97340.99750.9979
log-lik808.0711960.0760982.2676
Note that: The result is regressed by MATLAB software. ***, **, * respectively denote significance at 1%, 5%, and 10% levels.
Table 5. Decomposition effects with three spatial weight matrices.
VariableWgWeWc
Direct EffectIndirect EffectDirect EffectIndirect EffectDirect EffectIndirect Effect
DL−0.0060 **−0.0584−0.0085 ***−0.0094 ***−0.0020 **0.0104
DK−0.0207 ***−0.0873−0.0203 ***−0.0205 ***−0.0128 ***0.0288
FDI−0.0050−0.1565 *−0.006 *0.0736 ***−0.0074 *−0.0868 ***
HR0.0450 **1.6286 ***0.0595 ***−0.03770.00160.5539 ***
INDH−0.00450.5559 ***0.0559 ***−0.0804 ***0.0796 ***−0.1664 *
OPEN−0.0058−0.1545−0.0249 ***0.0574 ***−0.0248 ***−0.2209 ***
INF0.01620.7503 ***0.0301 *0.1385 ***0.00230.2801 ***
Note that: The result is regressed by MATLAB software. ***, **, * respectively denote significance at 1%, 5%, and 10% levels.
Table 6. Results of the endogeneity test.
VariableCoefficient and Significance
Constant0.192 ***0.124 ***−2.01366 ***0.81654 ***
DL −0.38095 ***
DL(−1)0.00718 ***
DL(−2)0.00548 ***
DK 0.05750 ***
DK(−1) −0.00777 ***
DK(−2) −0.02880 ***
Note that: The result is regressed by MATLAB software. *** denotes significance at 1% level.
Table 7. Regression results of the instrumental variable method.
VariableCoefficientVariableCoefficient
DL−0.0044 **W*DL0.0013
DK−0.0225 ***W*DK0.0174
FDI−0.0032W*FDI−0.0145 *
HR−0.0528 ***W*HR0.1605 ***
INDH−0.0442 ***W*INDH0.0219
OPEN0.0018W*OPEN−0.0345 ***
INF−0.0197W*INF0.0477 **
Uncentered Rsq0.9952
Cragg–Donald Wald F statistics119.943 ***
Note that: The result is regressed by MATLAB software. ***, **, * respectively denote significance at 1%, 5%, and 10% levels.
Publisher’s Note: MDPI stays neutral with regard to jurisdictional claims in published maps and institutional affiliations.

