Article

Mitigating Environmental Impact of Perishable Food Supply Chain by a Novel Configuration: Simulating Banana Supply Chain in Sri Lanka

by
Chethana Chandrasiri
1,
Subodha Dharmapriya
1,
Janappriya Jayawardana
1,
Asela K. Kulatunga
1,*,
Amanda N. Weerasinghe
2,
Chethana P. Aluwihare
2 and
Dilmini Hettiarachchi
2
1
Department of Manufacturing and Industrial Engineering, Faculty of Engineering, University of Peradeniya, Peradeniya 20400, Sri Lanka
2
National Institute of Post Harvest Management of Sri Lanka, Anuradhapura 50000, Sri Lanka
*
Author to whom correspondence should be addressed.
Sustainability 2022, 14(19), 12060; https://doi.org/10.3390/su141912060
Submission received: 2 August 2022 / Revised: 12 September 2022 / Accepted: 19 September 2022 / Published: 23 September 2022

Abstract

:
As the world is moving into a sustainable era, achieving zero hunger has become one of the top three Sustainable Development Goals, applying a considerable amount of pressure on the agri-food systems to make decisions contemplating the sustainability dimensions. Accordingly, making effective supply chain decisions holistically while achieving sustainability goals has become a major challenge faced by the present agri-food systems. Thus, to address the challenge, a novel supply chain configuration addressing multiple supply chain decisions to reduce global warming potential (GWP) and post-harvest losses have been presented by taking the banana supply chain in Sri Lanka as a case study. In the proposed approach, farmers have been clustered based on their geo positions using K-Means clustering followed by route planning within clusters using a heuristics approach. Retailer points are catered by assigning to wholesalers optimally modeling as an assignment model and then route planning executed using a heuristic approach. The solution generated from the above approaches has been implemented on a simulation platform to calculate the overall supply chain performance including the transportation component, in terms of the net GWP, post-harvest losses, and lead time including routing operations. Simulated supply chain performance has been compared with the existing system and verified the performance of the proposed supply chain configuration. The suggested configuration has reduced the net GWP by 15.3%, post-harvest loss by 2.1%, lead time by 28.2%, and travel distance by 20.47%. The proposed configuration can be further improved by adding dynamic characteristics to the model.

1. Introduction

The United Nations’ Sustainable Development Goals (SDGs) pay special attention to the sustainable food supply chain paving a path to major transformations in agriculture and food systems to achieve zero hunger, food security, and improve nutrition by 2030. A sustainable food supply chain aims to provide food security and nutrition for all, without compromising economic, social, and environmental bases [1]. Numerous studies have considered investigating approaches to the sustainability triple bottom line as a research hot spot [2,3].
In the perishable food supply chain, there are continuous changes in the quality of the product from the moment it leaves the farm until it reaches the consumer making economic, environmental, and social impacts throughout the supply [4]. The perishable nature and limited product shelf life have become critical factors in sustainability management [5]. Various studies have been performed on finding approaches to make the perishable food supply chain sustainable. Economic sustainability has been studied, focusing on productivity [6,7,8,9,10,11], profit [12,13,14,15,16,17,18,19,20,21,22,23], cost [24,25,26,27,28,29,30,31,32,33,34,35,36,37,38,39,40], and revenue optimization [41,42]. Social dimensions mainly consider service levels [12,25,35,43,44,45,46,47] and labor conditions [48]. The environmental pillar in an agri-food supply chain can be reflected in the amount of CO2eq/greenhouse gas (GHG) emissions due to the usage of fertilizers, energy usage in production, transportation, and inventory add to the food wastage generated throughout the supply chain due to the perishable characteristics [12]. GHG emission has been aimed to be minimized when determining the transport means, entry points, product flow [49], optimum location [50], logistic plans [51], vehicle routes [52] with time horizon [53], picking policy and pricing strategy [54] and optimal order quantity [12]. Carbon footprint and water footprint were considered when creating a supply chain network design [48].
In this study, the challenge of making configuration decisions while achieving sustainability dimensions has been focused on. Many studies have considered strategic, tactical, and operational levels independently, focusing on an individual entity of the supply chain. Some of the popular strategic level decisions are facility location [4,10,55,56,57,58], capacity planning [10,57], amount of product flow [10,55,56,58,59,60]. Tactical and operational level decisions are inventory planning [60,61] and routing [58,62,63]. Another observation in the literature is the limited consideration given to the environmental dimension, especially in terms of CO2 (GHG) emission and post-harvest losses (PHLs). Furthermore, lead-time has not been considered much, regardless of the importance of considering the perishability nature of food. Noticeably, banana SC has not been studied extensively. Considering the research gaps and the current practices, this study paid particular attention to the following research questions:
  • How to mitigate high GHG emissions and PHLs in the banana supply chain through configuration with due consideration to the perishability nature?
  • How to match demand and supply at the retailer points?
To address the aforementioned requirements, this study considers an end-to-end supply chain that consists of farmers, collection centers, wholesalers, and retailers. The current study proposes a configuration in relation to fruits collected from farmers and distributed between the retailer points. The farmers were clustered according to their geo-locations using the K—Means clustering technique in order to create collection routes among them. Then, the retailer points were assigned to the nearest wholesalers using the assignment problem. Taking a banana supply chain branch rooted in Thambuththegama and Embilipitiya in Sri Lanka, the improvements were implemented on a simulation platform to investigate the impact on the performance measures. The performance measures (GHG emission, PHL, and lead time) were calculated and compared with the existing banana supply chain and found that the suggested configuration can mitigate the environmental impact of the perishable supply chain. The contributions to this paper are as below:
  • Introducing a novel configuration to the banana supply chain in Sri Lanka, making multiple supply chain decisions.
  • Integrating both optimization and simulation modeling approaches in finding supply chain configurations optimizing the overall transportation and thereby reducing the environmental impact.
The rest of this paper is organized as follows. Section 2 outlines the literature review, where the studies were performed on different configurations under different techniques and the gaps were summarized. Section 3 emphasizes the way materials and methods were used for the study. Section 4 Discusses the results obtained from the model and the theoretical and practical implications of the study. Lastly, the Section 5 includes the conclusions, limitations, and future research directions.

2. Literature Review

Many techniques and approaches have been used to address different decision levels related to the perishable food supply chain. Supply chain configurations have been performed under network designing, distributing, and vehicle routing [64].
Mostly, the studies were conducted on strategic decisions considering network designing such as facility allocation, number of operational facilities, product flow, facility selection, area allocation for cultivation, and production capacity selection. Table 1 provides an information summary regarding the studies performed related to strategic decisions under network designing.
According to the summary table (Table 1), determining the number of facilities and their locations and the product flow between supply entities have been frequently studied under network designing, suggesting that mostly the strategic level decisions have been addressed under network designing. Some unique studies reported selected the packaging type based on the network design and determining the fairness among the drivers. Most of those studies conducted on facility locating have also decided the product flow, explaining the capability of addressing multiple decision levels at once. Almost all the studies performed on facility allocating have used mixed integer linear programming, making it the most common modeling technique. Goal programming techniques have also been used moderately not as much as mixed integer linear programming. Almost all the studies were performed considering multiple objective functions. The Ε—constraint method and particle swarm optimization are the two methods used often in reaching a near-optimal solution. Numerous studies have been carried out, taking lead time, transport cost, and CO2 emission as performance measures. Other than that, CO2 emission has been considered with a total cost, production cost, and set-up cost to achieve environmental and economic sustainability together. The studies that have been performed taking lead time as a performance measure often discussed lead time in the perishability and quality aspect. Almost all the studies which accounted for losses as a performance measure have taken the number of clients as a performance measure together. Only one study has considered CO2 emission with setting up cost and number of jobs to achieve the sustainable triple bottom line. Travel distance has been taken together with lead time and the number of routes. Out of the studies conducted under perishable supply network redesigning, no studies were found to take lead time, CO2 emission, and losses together as performance measures. Almost all the studies performed on facility allocation have found optimal allocations for distribution centers. Some studies have considered distribution centers and wholesalers together. Most of the studies which considered the retailer stage have also considered the production/farmer stage.
The studies performed under vehicle routing have mostly investigated the short-term operational decisions, mostly regarding logistics operations such as which vehicle to load, which route to travel, and shipping quantity. Table 2 Provides a summary of the studies conducted under the theme of vehicle routing.
According to the summary table (Table 2), the studies performed under vehicle routing have mainly focused on operational decisions such as route selection, vehicle selection, finding optimal shipping quantity, and some strategic decisions such as locating distribution vehicle depots. The highest considered decision is vehicle selection, followed by route selection and facility locating, suggesting that studies performed on vehicle routing have mostly addressed operational decisions and seldomly addressed strategic decisions. Similar to the network designing studies, mixed integer linear programming, and mixed integer non-linear programming techniques have been highly utilized in modeling vehicle routing-related problems, and most of the models were single objective models. The studies related to vehicle route planning have often used transport cost and total supply chain cost as performance measures focusing on the economic aspect. CO2 and PHL have been seldomly used as performance measures when planning vehicle routes. The models have been solved using a variety of techniques, such as particle swarm optimization, genetic algorithm, and ε-constraint method. The studies in which the decisions of the initial stages (farmer and collector) of the supply chain entities were addressed do not seem to address the decisions of the latter stages (distributor, wholesaler, vehicle depots and retailer). MILP: Mixed Integer Linear Programming, MINLP: Mixed Integer Non Linear Programming, GP: Goal Programming, RA: Route Analysis, COG: Center of Gravity, JIAP: Joint Inventory Allocation Problem, ILP: Integer Linear Programming, DA: Dominance Algorithm, WSM: Weighted Sum Method, VPA: Value Path Approach, NCM: Normal Constraint Method, SA: Scenario Analysis, AHP: Analytical Hierarchy Process, OWA: Ordered Weighted Averaging, CEA: Cross-Entropy Algorithm.
As a tropical perennial agricultural product, bananas are among the top 20 food commodities in the world, reaching a production of 102 megatons and corresponding to an income of US$ 28,209.5 million in 2012 [70]. Even with greater production and consumption of bananas, configurations of the banana supply chain have seldom been conducted. Most of the studies conducted on the banana supply chain in different countries have covered cradle-to-retail and have estimated the percentage PHLs, carbon footprint in terms of kg CO2eq/kg, and supply chain stakeholder-wise contribution. A study on the banana supply chain in Central and South America has found that per kilogram of banana, 1 kg CO2eq emits. A total of 36% of that is during transportation, 22% during farm production, and 22% occurs at the retail stage. The highest emission has been reported in the transportation stage due to overseas transportation [71]. A study conducted in Ecuador has analyzed different scenarios and has found 0.45 kg CO2eq emitted per 1 kg of banana in the best-case scenario and 1.06 kg CO2eq emitted per 1 kg of banana in the worst-case scenario. Here again, due to overseas transport, the transportation stage contributes between 27% and 67% of the emission, and production contributes between 23% to 53% of the total emission [72]. Another study performed in Ecuador [73] has found that per kilogram of banana, 1.28 CO2eq is emitted, and 22% and 31% of the total emission is contributed by the farm production and transport stage, respectively. A comparative study [70] conducted on two varieties of banana (Cavendish and Prata) supply chains in Brazil found that for 1 kg of Cavendish banana, 0.537 kg CO2eq emits and for 1 kg of Prata, 0.423 kg CO2eq emits. For both varieties, the emission occurs at the farm (52%), transport (24%), retail (14%), packaging (7%) and ripening stages (2%).
In the field of fruit and vegetables, a study performed on post-harvest losses in supply centers focused on wholesale and retailers, the highest rates of losses reported for fruits were bananas (22.22%) and papayas (22.22%), and for vegetables, the highest losses were for tomatoes (58.30%) and bell peppers (33.33%). Banana, papaya, and tomato are classified as climacteric fruits that are harvested before full ripening, and their maturation occurs after harvest, with the development of sensorial characteristics of each fruit. Factors such as improper packaging (at high room temperature) accelerate the ripening and aging process of climacteric fruits. Lack of advanced conservation and storage facilities and transportation vehicles not possessing adequate hygiene or refrigeration are the main reasons for this loss [74]. A study that focused on the environmental indicators of banana production in Brazil: Cavendish and Prata varieties, found that banana loss throughout the supply chain was accounted for by 35.7% for Cavendish bananas and 25.5% for Prata. The highest losses have been recorded from the wholesaler storage in the supply chain, 23% and 15%, respectively, for Cavendish and Prata [70]. A pilot study performed on the banana supply chain in Sri Lanka found that a loss of the banana net flow occurs at farmers (2.29%), collection centers (1.57%), wholesalers (6.22%) and retailers (7.89%), respectively. Additionally, it was found that the highest global warming potential (GWP) occurs at farmer-level banana production, followed by the transport stage from wholesaler to retailer [75]. The banana supply chain has been considered as a case study to investigate the environmental impact throughout the chain in terms of GHG emissions and PHLs.
The PHLs and GHG emissions can be mitigated by configuring the existing fruit and vegetable supply chain by optimizing the travel distance. Configuration of sustainable FSC is a process of spatial organization based on geographical concepts and products’ specific characteristics and is a result of constrained choice of facilities, locations associated with them transport modes and cargo flows that incorporate the triple bottom line of sustainability [50]. From the above facts, it is apparent that a new complex approach in supply chain configuring to deal with these challenges whereby core sustainability factors must be considered.
According to the literature study carried out, several gaps were identified in the field of studies of perishable food supply chain configuration. Addressing multiple level decisions at each stakeholder while mitigating the environmental impact has seldom been performed in supply chain configurations. Specifically, the perishable food products, with a high possibility of getting exposed to PHLs and thereby emitting CO2, have not been considered for the aforementioned configurations. Past studies have not attempted to reduce CO2 emission and PHLs during the food collecting phase and wholesaler distribution phase while reducing the lead time. The perishable food supply chain has been investigated emphasizing the environmental impact qualitatively and quantitatively, but the mitigation attempts are rarely conducted through configurations.

3. Materials and Methods

The current research has been carried out according to the methodology that is provided in the below schematic diagram in Figure 1. Accordingly, by the literature review, the existing research gap and a suitable case study were identified. Impactful study locations have been selected for the study. Data collection has been performed for the selected case study through field visits and interviewing the main stakeholders. Collected information was filtered considering the focused decisions and the model/simulation requirements of the study. With qualitative and quantitative information, the existing banana supply chain was modeled on a simulation platform. Then, the suggested improvements on multiple level decision levels were included in the model in deriving the novel supply chain configuration. Since the study aims to mitigate the environmental impact while addressing multiple level decisions, performance measures, GWP (CO2 emission) and PHLs were calculated at each supply chain stage. Here, not only the supply chain entities but also the transport stages were considered. The calculated performance measures were compared with the existing supply chain to prove the significance of the suggested configuration, which address the research gap found in the literature. The major steps after selecting the case study have been broadly explained below.

3.1. Introduction to Case Study

In this study, the banana supply chain in Sri Lanka has been selected as a suitable case study, two major banana supply chain branches; starting from farmer fields at Embilipitiya (Southern province) (Figure 2.) and Thambuththegama (North Central province) (Figure 3.), which terminates at the retail markets in Colombo, Gampaha (Western province), Kandy (Central province), Badulla (Uva province) and Balangoda (Sabaragamuwa province) were selected for the study. In the data collection phase, by observing the entire process of the banana supply chain, the major activities were identified as production, collection, storage, and distribution. The information regarding production, packing, dispatching frequency, mode of transportation and quantity, wastages, storage capacity, selling price, buying price, waiting time at each stakeholder, number of routes, vehicle capacity, and traveling distance at each stakeholder, and the daily weekly and monthly behavior of those activities were collected by interviewing the stakeholders of a selected segment. According to the completeness of the information provided, 20 and 10 farmers were selected from Embilipitiya (Figure 2.) and Thambuththegama (Figure 3.), respectively.

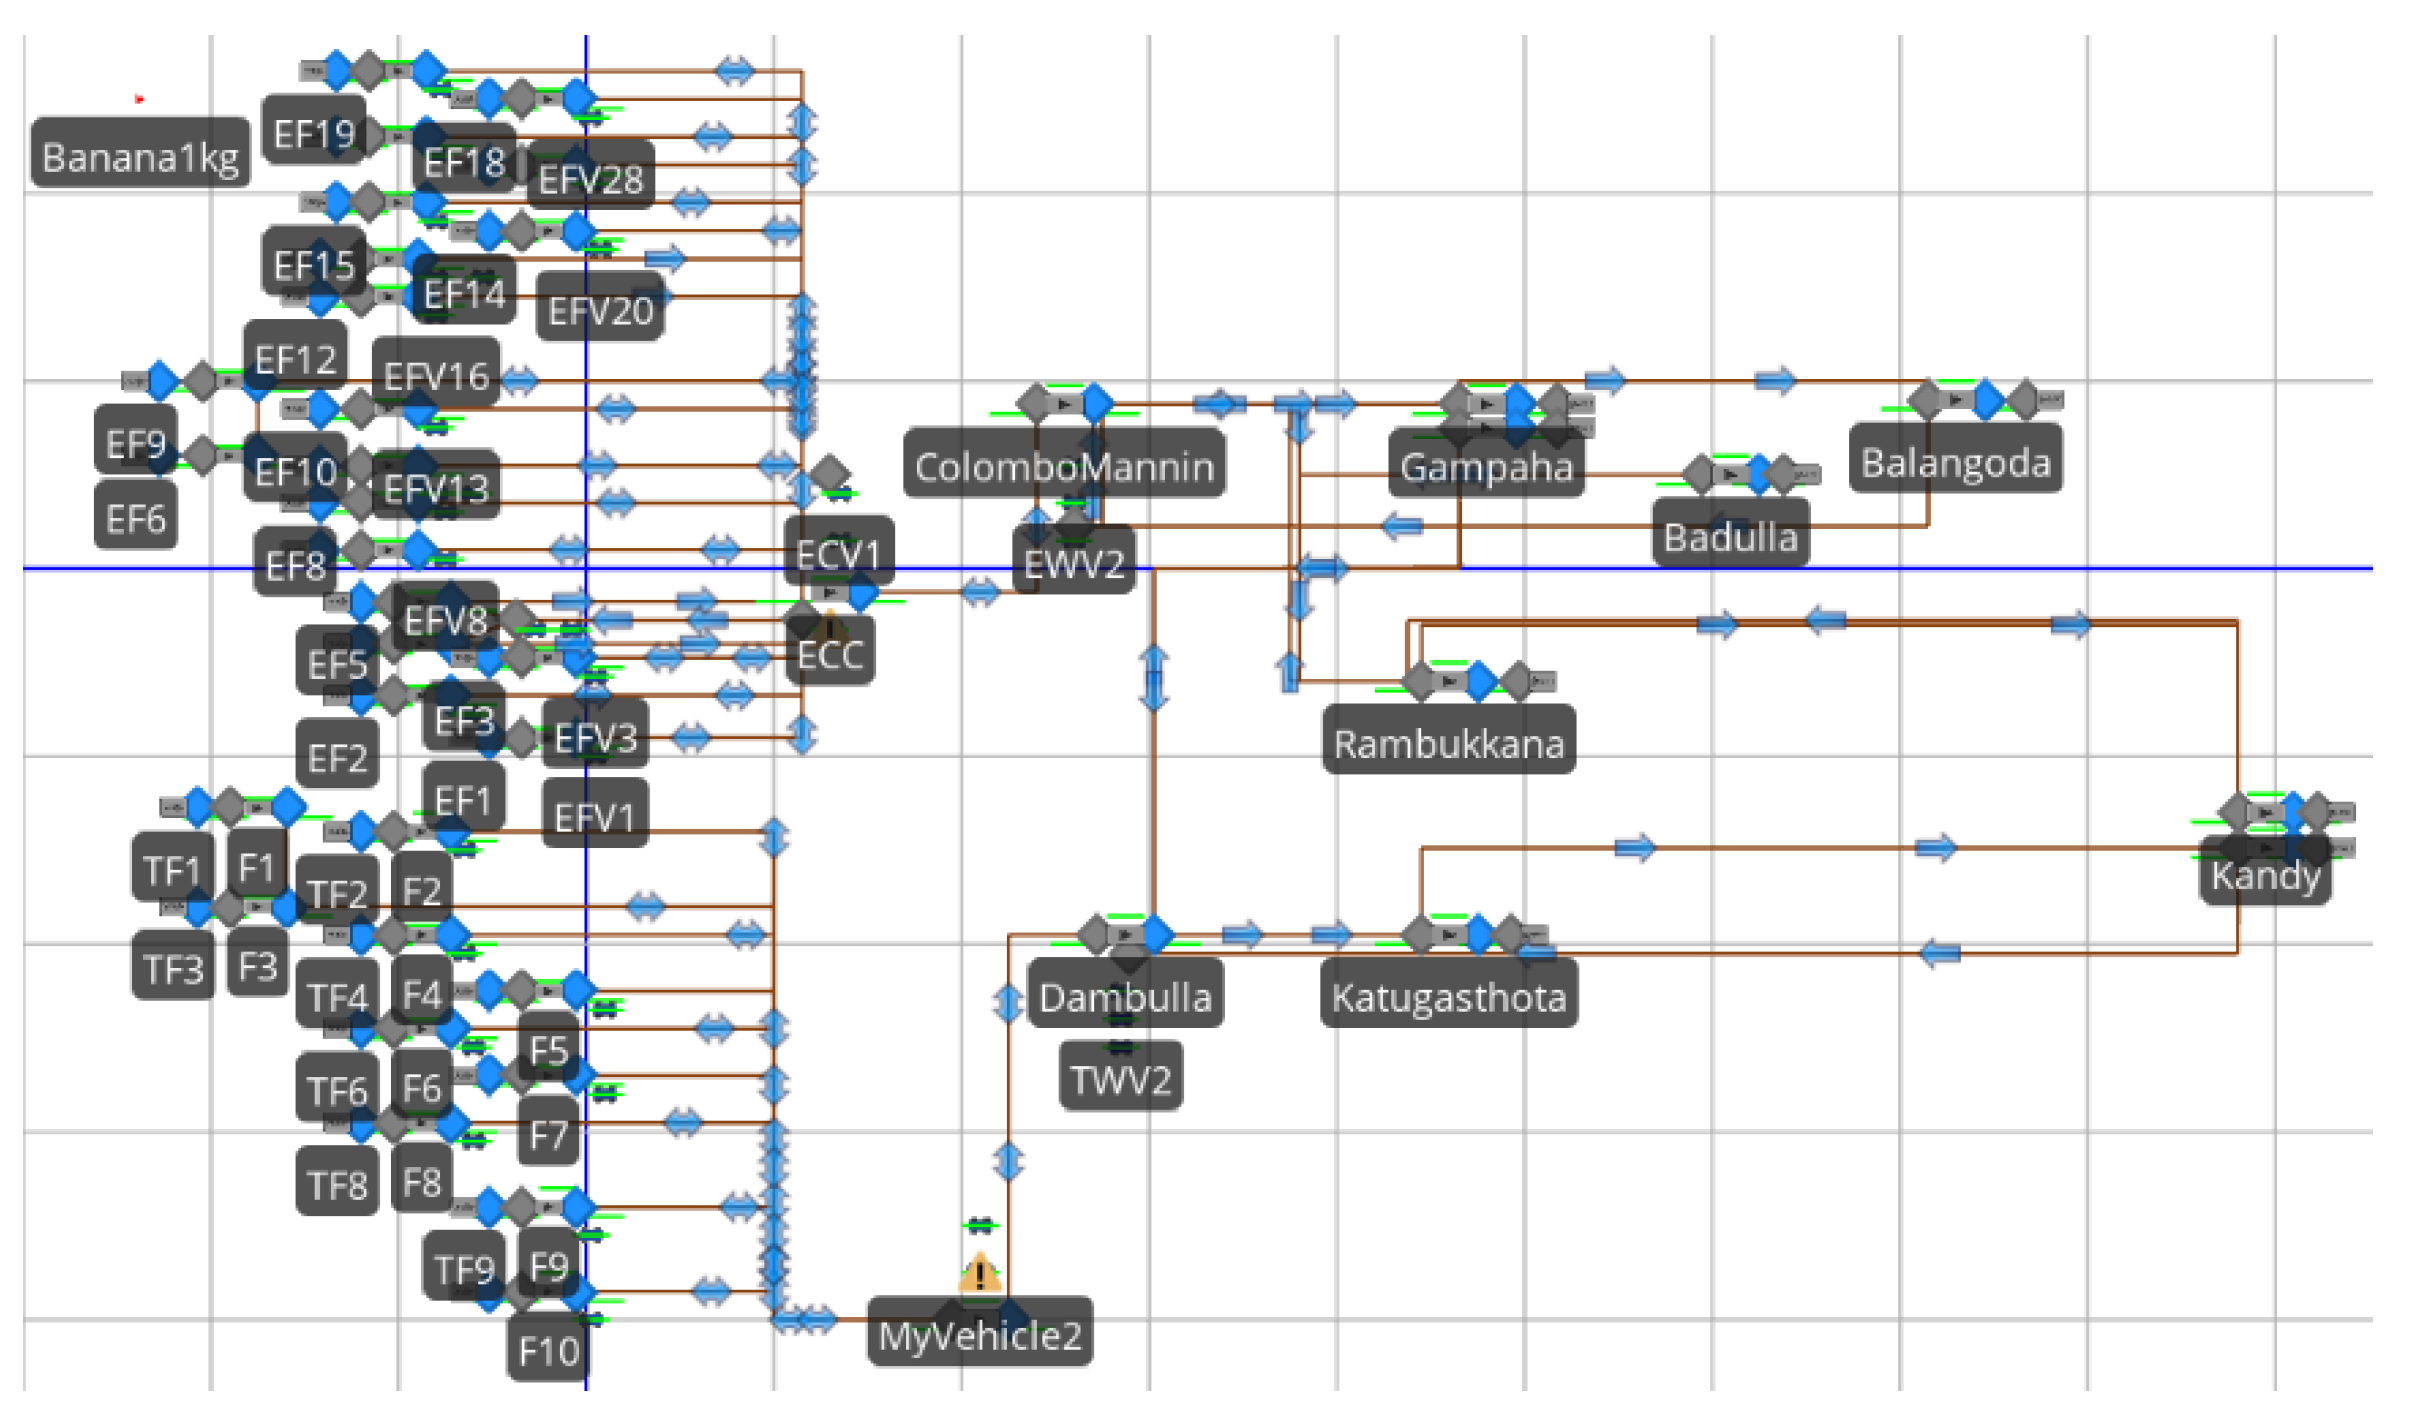
3.2. Simulating the Existing Supply Chain

When simulating the existing banana supply chain, to observe the impact of each supply chain entity, the existing operations, and where improvements are required, a simulation model can be adopted by taking farmers, collectors, DECs centers, wholesalers, and retailers as agents. One kilogram of banana is taken as an entity. Once harvested, banana lots wait in the farmer’s storage area until dispatching. Daily dispatching is performed according to the vehicle’s capacity. Three types of dispatching modes can be observed; delivery by farmer’s own vehicle, a rented vehicle (through a transport agent), or by a collection center vehicle. Since only two branches of the banana supply chain have been considered, two collection centers are included were located in Thambuththegama and Embilipitiya. Almost all the farmers deliver their banana lots to the corresponding collection centers. Collection centers store banana lots during the time while selling to the wholesalers. Once all the negotiations and selling processes have been completed, wholesalers collect the banana lots and take them to the wholesaler location either by collection center’s own vehicle or by wholesaler’s own vehicles. Once the banana lots are collected from the collection centers, wholesalers distribute banana lots to the retailer points across the country. Here, Thambuththegama wholesaler delivers to Katugasthota, Kandy, Gampaha, and Colombo retail points, while Embilipitiya wholesaler delivers to Balangoda, Gampaha, Badulla, Colombo, Rambukkana, and Kandy retail points.
Below abbreviations mentioned are used in simulating.
  • Fields, Farmers, and Vehicles
    Embilipitiya Fields—EF
    Thambuththegama Fields—TF
    Farmer—F
    Vehicles of Embilipitiya Farmer—EFV
    Vehicles of Thambuththegama Farmer—TFV
  • Collection Centers and Vehicles
    Embilipitiya Collection Center—ECC
    Thambuththegama Collection Center—TCC
    Vehicles of Embilipitiya Collection Center—ECV
    Vehicles of Thambuththegama Collection Center—TCV
  • Wholesalers and Vehicles
    Embilipitiya Wholesaler—Colombo Manning
    Thambuththegama Wholesaler—Dambulla
    Vehicles of Embilipitiya Wholesaler—EWV
    Vehicles of Thambuththegama Wholesaler—TWV
According to the observations, the existing banana supply chain is simulated on a simulation platform (Simio 14) as provided in Figure 4. The simulation model can be found in the Supplementary Materials. The farmers used to deliver their banana harvest to the collection center either by their own vehicle, by a rented vehicle, or by the collection center vehicles. Once the banana reaches the collection centers, after spending an average waiting time, they are delivered to wholesalers. Then, wholesalers deliver bananas to retailer points directly and in routes. Dambulla wholesaler delivers to Kandy through Katugasthota and to Colombo through Gampaha. Colombo Manning market delivers to Gampaha through Balangoda and to Kandy through Rambukkana, and to Badulla directly. The strategic and tactical/operational level improvements are considered after simulating the existing supply chain.

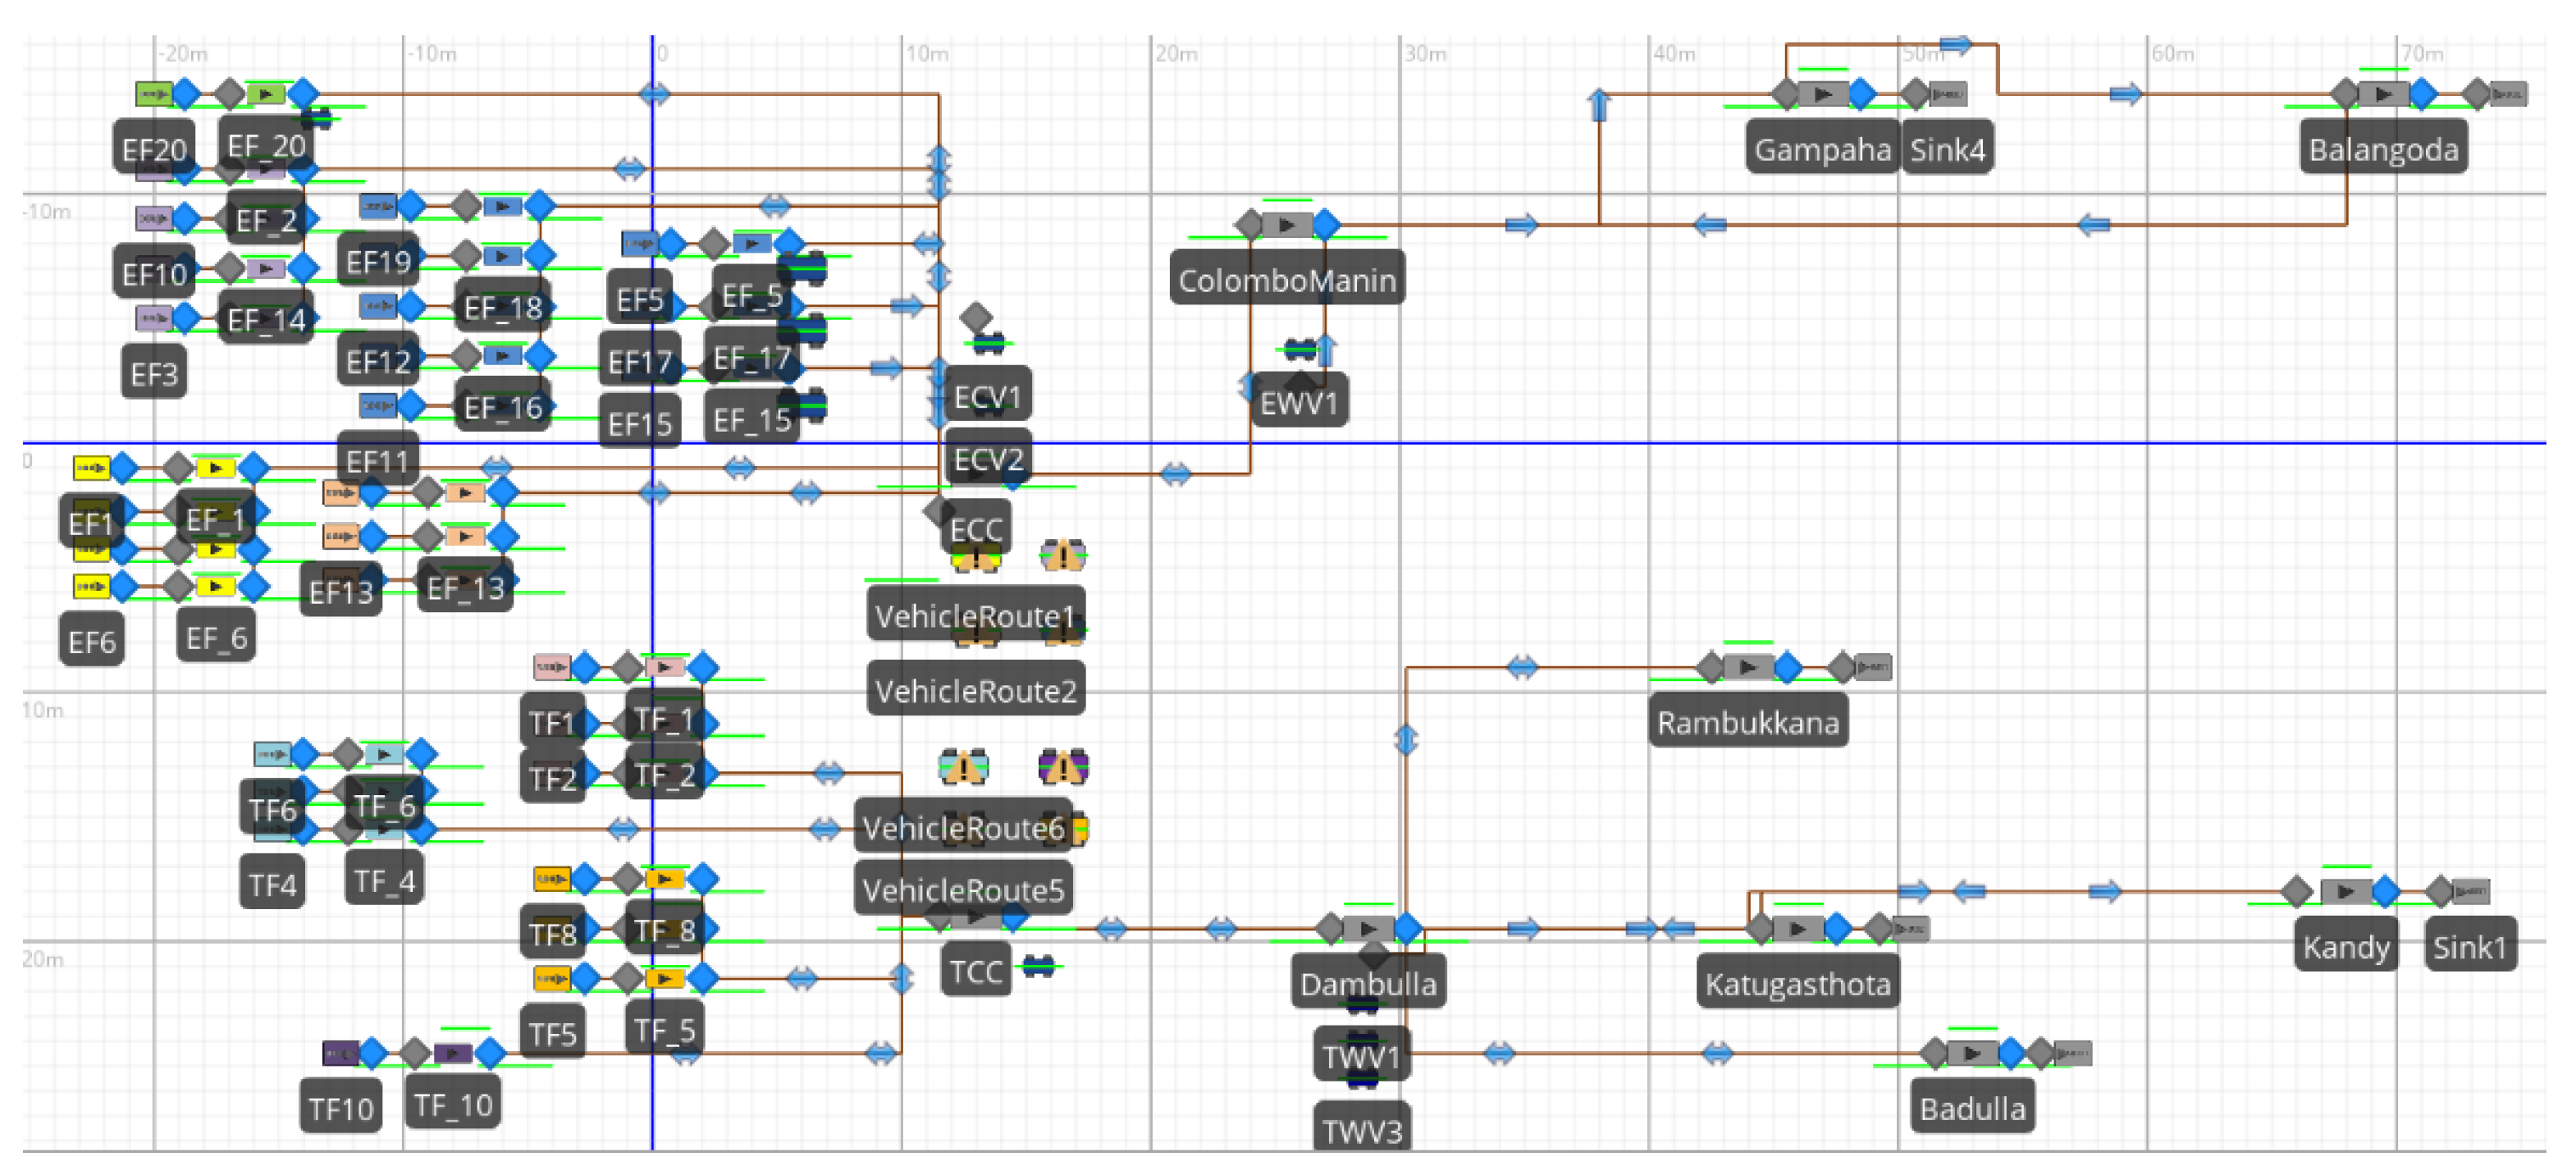
3.3. Improvements on Strategic Decision Level

Banana collection routes are intended to create by clustering the farmers according to their geo-locations. This has been performed for Thambuththegama farmers and Embilipitiya farmers separately. The K-means clustering is performed using R studio.
The optimal number of clusters is determined using the “Elbow method”. By performing K-means clustering for a range of K values; the average distance to the centroid across all the data points is calculated for each. The average distance is also taken as a sum of squares in each cluster. These values are plotted in a scatter plot to obtain the elbow shape. At the point where the elbow is placed or the place where it starts a uniform pattern, the corresponding K value is considered as the optimal number of clusters. After deriving the optimal number of clusters, the set of geo-locations is clustered considering the Euclidian distance to the centroid.
Under tactical decisions, the nearest farmers are clustered together, and a collection route is created so that each individual farmer does not need to deliver their bananas to the collection centers separately. Here, when creating the routes, the cluster and the geographical possibility of routing between the farmers were considered.

3.4. Improvements on Tactical/Operational Decision Level

It is intended to develop a banana distribution plan from wholesalers to retailers. Here, each wholesaler is given the responsibility to supply to the nearest retailers. To minimize the travel distance when distributing bananas to the retail points, an assignment model is created.

3.4.1. Notation

  • DDi—Distance between Dambulla wholesale to ith retailers
  • DCi—Distance between Colombo Manning Market to ith retailers
  • CD—Capacity of Dambulla wholesale
  • CC—Capacity of Colombo Manning Market
  • Ci—Capacity of each retailer point

3.4.2. Decision Variables

  • XDi—1 or 0 indicating whether Dambulla Wholesaler is supplying to the ith retailer
  • XCi—1 or 0 indicating whether Colombo Manning Market is supplying to the ith retailer

3.4.3. Decision Variables

In this model, the two wholesalers are assigned to the nearest retailers in such a way that the total distance is minimized.
M i n i m u m   D i s t a n c e = i = 1 6 D D i X D i + i = 1 6 D C i X C i

3.4.4. Constraints

XCi + XDi ≥ 1 for all i = 1,2,3,4,5,6
At least one wholesaler should supply to each retailer point.
i = 1 6 X C i C i C C  
i = 1 6 X D i C i C D  
All the demand capacities at retailer points should be less than or equal to the supplying wholesale supply capacity.
  • XDi, XCi—binary and non-negative

3.5. Calculation of Performance Measures

The two simulation models were simulated for 48 h and according to the results, the performance measures (GWP, PHL, and lead time) were calculated and compared. Here, the emission factor while transporting is considered according to the weight capacity of the vehicles. Since all the vehicles used were under the light commercial vehicle category in which the weight capacity is less than 3.5 metric tons, the emission factor is considered as 1.54 kgCO2(eq). The GWP of production and transportation and organic waste were calculated using the below formulas.
GWP of Transporting) = Transport distance (tkm) × Emission factor (kgCO2eq/tkm)
= Transport distance × 1.54 kgCO2(eq)
GWP of Organic waste) = Organic waste (kg) × Emission factor (kgCO2(eq)kg−1)
= Organic waste × 0.28 kgCO2(eq)
GWP of Production) = Production quantity (kg) × Emission factor (kgCO2(eq)kg−1)
= Production quantity × 0.206 kgCO2(eq)
According to the findings of the pilot study [75], the receiving quantities to collection centers and wholesales were multiplied by the percentage of waste and calculated the loss of each stakeholder.

4. Results

4.1. Results of the Strategic Level Decisions

To perform the Elbow method, the within-group sum of squares plot for Embilipitiya farmer geo-positions returned as below (Figure 5).
According to the Elbow method, the plot (Figure 5) starts its uniform behavior (Elbow is placed) after the fifth point. Therefore, the number of clusters needed is five clusters.
For Embilipitiya farmers, five different clusters were identified according to the clusters given in Figure 6. The numbers represent the Embilipitiya farmer indices. The X-axis represents the principal component of the longitude, and the Y-axis represents the principal component of latitude. Farmers EF1, EF6, EF7, and EF9 fell into the first cluster, EF4, EF8, and EF13 fell into the second cluster, EF11, EF12, EF15, EF16, EF17, EF18, and EF19 fell into the third cluster, EF2, EF3, EF5, EF10, and EF14 fell into the fourth cluster, and EF20 fell into the fifth cluster. These five clusters can be considered when creating the collection routes.
To perform the Elbow method, the within-group sum of squares plot for Thambuththegama farmer geo-positions returned as below (Figure 7).
As the plot of within groups sum of squares becomes uniform after the fourth point. Therefore, the optimal number of clusters needed is four clusters.
At Thambuththegama, the farmers set of geo-locations was clustered considering the Euclidian distance to the centroid into four different clusters (Figure 8) indicating the necessity of four different collection routes. Here, TF1, TF2, and TF3 were classified into the first cluster, TF10 fell into the second cluster alone, TF5, TF8, and TF9 fell into the third cluster, and TF4, TF6, and TF7 fell into the fourth cluster.

4.2. Results of the Tactical/Operational Level Decisions

According to the assignment model, the Colombo Manning market is assigned to supply to the Gampaha and Balangoda retailer points while the Dambulla wholesaler supplies to the Rambukkana, Katugasthota, Kandy, and Badulla retailer points. The simulation model has been altered accordingly as shown in the below Figure 9.
The way farmers used to deliver to the collection center and the way wholesalers used to distribute to the retailer points were changed in the suggested configuration. The suggested configuration and the existing banana supply chain are different in terms of their characteristics.
According to the simulation results, the quantities received at collection centers and wholesales and travel distances by the vehicles were taken into consideration. The calculated performance measures values of the new configuration were compared with the values of the existing scenario, as shown in Table 3.

5. Discussion

The suggested improvements were simulated as a simulation model. According to the simulation results, the performance measures; PHL (kg), GWP, and lead times were calculated and compared. Here, from the simulation results, the total distance traveled by the vehicles and their tonnage, the production amount, and allocated banana entities at each stakeholder were taken for the GWP and PHL calculations.

5.1. PHL (kg)

The production quantity is the same for both the existing and the new configurations, thus the amount of PHLs does not change. The banana quantity that needs to be delivered to the two collection centers in order to deliver 1000 kgs to the retailer points has been reduced by 19% in the new configuration. The new configuration collects bananas from the farmers by traveling through the routes, which eases the high congestion at the collection centers. Consequently, this reduces the PHL quantity at the collection center by 19%. The banana amount that needs to be delivered to the two wholesales in order to deliver 1000 kgs to the retailer points has been increased by 1%. Therefore, the PHL quantity at wholesalers has increased by 1% without making a significant increment in the total quantity of PHL in the entire banana supply chain. As the PHLs amount has been reduced at the previous entities, the receiving banana amount at the retailer is high. Therefore, the PHLs occurrence is slightly high than the amount in the existing supply chain. The total quantity of PHL throughout the banana supply chain when delivering 1000 kg of banana to the retailer points has been reduced by 2.1% in the new configuration.

5.2. GWP (kgCo2eq)

The production quantity and the quantity of PHLs are the same for both cases, thus the GWP (kgCO2eq) does not change during the production stage. The new model creates a route between the clustered farmers; therefore, the number of individual trips gets reduced, and the number of vehicles used is reduced. Consequently, the ton kilometer emission is reduced by 50%. Results show that the PHLs quantity has been reduced by 19%, hence the GWP (kgCO2eq) also has been reduced at collection centers. The travel pattern between the collection center and the wholesalers were not changed, but the amount traveled changed in the new configuration. The ton kilometer emission has increased by 4%. This increment has not made a significant increment in total GWP in the new configuration. The quantity of PHLs has increased by 1%; therefore, the GWP (kgCO2eq) due to PHLs at the wholesaler point has increased by 1%. When delivering from wholesalers to the retailer points, the new configuration has improved by assigning retailer points to each wholesaler. Therefore, the ton kilometer quantity has been reduced by 27.5% by reducing the GWP (kgCo2eq) amount by the same percentage. The quantity of PHLs has been slightly increased at the retailer point in the new configuration, therefore the amount of GWP (kgCo2eq) is equal both in the existing and the new configurations. The total GWP (kgCo2eq) throughout the banana supply chain has been reduced by 15.3% in the new configuration.

5.3. Lead Time (h) and Distance (km)

In the new configuration, the banana collection from farmers is performed by traveling through routes restricted to the corresponding formed farmer clusters, the individual number of trips has reduced. Therefore, the time taken and distance to pass in order to deliver to the collection center has been reduced. At the same time, the retailer points have been assigned to the wholesalers separately; thus, the wholesalers are supplying to the nearest retailer points making the travel time and distance reduced. Both these improvements conducted in the new configuration have reduced the average lead time by 28.9% and the total distance by 20.47% in the suggested configuration.

5.4. Implications

At present, almost all the agriculture systems are pressurized to achieve the triple bottom line of sustainability, and it is observed that numerous ongoing projects are focusing on this area. According to the literature, under the supply chain configuration theme, GWP, PHLs, and lead time have been seldom studied together. Even though, as a fruit product, the banana requires special attention in supply chain operations due to its unique physical structure, however, none of the supply chain studies have been performed taking the banana as a case study. The present study addresses this knowledge gap by configuring the banana supply chain by taking GHG emissions, PHLs, and lead time as performance measures together. Furthermore, the current study also can be considered as an effort to showcase ways to approach the SDGs.
Based on the analyzed results, the present study has proved by changing the collection route and the distribution route, the GHG emission, PHLs, lead time, and travel distance can be reduced by considerable amounts. Through farmer clustering, the number of individual trips gets reduced. The unnecessary competition between the farmers is also reduced by farmer clustering as a particular vehicle is always assigned for them to supply their harvest. As banana is a perishable fruit with a limited shelf life, the reduced lead time makes sure customers are getting the product before reaching its shelf life. Reducing the congestion at the collection centers reduces the probability of bananas getting exposed to PHLs. Generally, the wholesalers are used to supply to whichever retailer point they find. This makes the GHG emission high during the travel time and increases the lead time. Therefore, assigning retailer points to each wholesaler limits this unnecessary travel while at the same time reducing the GHG emission and lead time. This also reduces the ability to occur PHLs while traveling.
Statistical clustering methods are not often used under this theme. As the K-means clustering method is applied to create the farmer clusters, this study has proved the applicability of statistical analysis techniques in the field of supply chain management.

6. Conclusions

In the present study, the principal aim is to investigate how to achieve environmental and economic sustainability by configuring the product flow of the fruit and vegetable supply chain. To address the knowledge gap in the area of perishable food supply chain configuration, the banana supply chain has been configured, taking GHG emission, PHL, and lead time as performance measures. By creating the farmer clusters and routes within the clusters and assigning the nearest retailer points to each wholesaler, the banana supply chain has been improved at all three decision levels.
A previous study conducted in Ecuador has found that around 31% of the emission occurs in the transportation stage [73]; however, in the Sri Lankan context, almost 99.8% of the GHG emission occurs during transportation. This is acceptable as this study has not considered the production level operations, their PHs and emissions. Still, transportation has contributed to the majority of the GHG emission, as reported in studies performed in Ecuador [73] as well as in the central and South American context. Aligning with the study which focused on the environmental indicators of banana production in Brazil, which was performed on Cavendish and Prata varieties, the total banana loss (mix of all banana varieties) was 25.23%, slightly near to the range accounted for in the previous study, 35.7% for Cavendish bananas and 25.5% for Prata.
According to the analyzed results, the PHLs have been reduced by 19% at the collection center and by 1.9% throughout the entire banana supply chain. GWP has been reduced by 50% when delivering from farmers to collection centers, by 19% at the collection center due to PHLs, and by 27.5% while distributing among retailer points. An early study was performed on producer clustering, and route optimization [65] has reduced the number of routes by 68%, lead time by 48%, and distance by 50% without reducing the GHG emission. In the present study, the overall GWP has been reduced by 15.3%. Other than that, the lead time has been reduced by 28.9%, and the total travel distance has been reduced by 20.47%. This proves that the suggestions of farmer clustering and assigning nearest retailer points to dedicated wholesalers can improve the supply chain in terms of GHG emission, PHLs, lead time, and travel distance.
Limitations of this study are (i) a static model has been considered for the banana supply chain, (ii) the values depend on the context where the study has been carried out, (iii) only a small branch of the banana supply chain has been taken for the study, and (iv) this study achieves only the environmental and economic pillars of sustainability but not the social pillar.
These limitations can be improved in future studies by (i) making efforts to develop a dynamic model integrating scenario analysis and machine learning; (ii) validating the banana supply chain in a different region; (iii) simulating with an advanced technology that allows more libraries; and (iv) improvements can be made considering the social aspects such as the number of jobs created, customer satisfaction and reaching maximum retailers as performed in the study by Orjuela-Castro [4]. Furthermore, this study can be improved by using the vehicle routing concept to make the optimal routes to distribute among retailers. By integrating the multiple level decision-making approaches into a digital platform, a decision support system can be implemented to achieve the sustainable triple bottom line while sharing information, experiences and good practices [76].

Supplementary Materials

The following are available online at https://www.mdpi.com/article/10.3390/su141912060/s1, Software model.

Author Contributions

Conceptualization, C.C., S.D. and A.K.K.; methodology, software, investigation and writing—original draft preparation, C.C.; resources and data curation, A.N.W., C.P.A. and D.H.; writing—review and editing, J.J., S.D. and A.K.K.; visualization, C.C.; supervision, S.D. and A.K.K.; project administration and funding acquisition, A.K.K. All authors have read and agreed to the published version of the manuscript.

Funding

This research was partially funded by National Science Foundation, grant number RG/2021/EA&ICT/01 and the New Zealand Government to support the objectives of the Global Research Alliance on Agricultural Greenhouse Gases.

Institutional Review Board Statement

The study was conducted in accordance with the Declaration of Helsinki, and approved by the Institutional Review Board (or Ethics Committee) of Department of Industrial Engineering and Manufacturing, Faculty of Engineering, University of Peradeniya (protocol code: DMIE/ERC/2022/04 and date of approval: 22 September 2022).

Informed Consent Statement

Informed consent was obtained from all subjects involved in the study.

Data Availability Statement

Not applicable.

Acknowledgments

National Post Harvest management of Sri Lanka and Department of Manufacturing and Industrial Engineering, University of Peradeniya.

Conflicts of Interest

The authors declare no conflict of interest.

References

  1. Kalantari, F.; Hosseininezhad, S.J. A Multi-objective cross entropy-based algorithm for sustainable global food supply chain with risk considerations: A case study. Comput. Ind. Eng. 2022, 164, 107766. [Google Scholar] [CrossRef]
  2. Adamashvili, N.; State, R.; Tricase, C.; Fiore, M. Blockchain-based wine supply chain for the industry advancement. Sustainability 2021, 13, 13070. [Google Scholar] [CrossRef]
  3. Adamashvili, N.; Fiore, M.; Contò, F.; La Sala, P. Ecosystem for Successful Agriculture. Collaborative Approach as a Driver for Agricultural Development. Eur. Countrys. 2020, 12, 242–256. [Google Scholar] [CrossRef]
  4. Orjuela-castro, J.A.; Orejuela-cabrera, J.P.; Adarme-jaimes, W. Multi-objective model for perishable food logistics networks design considering availability and access. OPSEARCH 2022, 1–27. [Google Scholar] [CrossRef]
  5. Kumar, A.; Mangla, S.K.; Kumar, P.; Karamperidis, S. Challenges in perishable food supply chains for sustainability management: A developing economy perspective. Bus. Strategy Environ. 2020, 29, 1809–1831. [Google Scholar] [CrossRef]
  6. Fikry, I.; Gheith, M.; Eltawil, A. A New Integrated Mathematical Model for Agro-Food Supply Chain. In Proceedings of the 2021 IEEE 8th International Conference on Industrial Engineering and Applications, Kyoto, Japan, 27–29 April 2021; pp. 432–438. [Google Scholar]
  7. Flores, H.; Villalobos, J.R. A Stochastic Planning Framework for the Discovery of Complementary, Agricultural Systems. Eur. J. Oper. Res. 2019, 280, 707–729. [Google Scholar] [CrossRef]
  8. Gupta, M.; Kaur, H.; Singh, S.P. Multi-echelon agri-food supply chain network design integrating operational and strategic objectives: A case of public distribution system in India. Ann. Oper. Res. 2021, 1–58. [Google Scholar] [CrossRef] [PubMed]
  9. Abbas, H.; Zhao, L.; Faiz, N.; Ullah, H.; Gong, J.; Jiang, W. One belt one road influence on perishable food supply chain robustness. Environ. Dev. Sustain. 2022, 24, 9447–9463. [Google Scholar] [CrossRef]
  10. Jaigirdar, S.M.; Das, S.; Chowdhury, A.R.; Ahmed, S.; Chakrabortty, R.K. Multi-objective multi-echelon distribution planning for perishable goods supply chain: A case study. Int. J. Syst. Sci. Oper. Logist. 2022, 1–19. [Google Scholar] [CrossRef]
  11. Gong, W.; Zhou, L.; Ye, F. Multi-Agent GIS Simulation for Railway Logistics Optimization. In Proceedings of the 2019 4th International Conference on Intelligent Transportation Engineering (ICITE), Singapore, 5–7 September 2019; IEEE: New York, NY, USA, 2019; pp. 64–68. [Google Scholar]
  12. Amer, H.H.; Galal, N.M.; El-Kilany, K.S. A simulation study of sustainable agri-food supply chain. In Proceedings of the International Conference on Industrial Engineering and Operations Management, Bandung, Indonesia, 6–8 March 2018; Volume 2018, pp. 2264–2275. [Google Scholar]
  13. Aiello, G.; Enea, M.; Muriana, C. The expected value of the traceability information. Eur. J. Oper. Res. 2015, 244, 176–186. [Google Scholar] [CrossRef]
  14. Zhao, X.I.A.; Wu, F. Coordination of agri-food chain with revenue-sharing contract under stochastic output and stochastic demand. Asia-Pasific J. Oper. Res. 2011, 28, 487–510. [Google Scholar] [CrossRef]
  15. Albrecht, W.; Steinrücke, M. Coordinating continuous-time distribution and sales planning of perishable goods with quality grades grades. Int. J. Prod. Res. 2018, 7543, 2646–2665. [Google Scholar] [CrossRef]
  16. Zhang, Y.; Che, A.; Chu, F. Improved model and efficient method for bi-objective closed-loop food supply chain problem with returnable transport items. Int. J. Prod. Res. 2022, 60, 1051–1068. [Google Scholar] [CrossRef]
  17. Esteso, A.; Alemany, M.; Ortiz, A.; Iannacone, R. Collaborative plan to reduce inequalities among the farms through optimization. In Proceedings of the 22nd IFIP WG 5.5 Working Conference on VIRTUAL ENTERPRISES, Saint-Étienne, France, 22–24 November 2021. [Google Scholar]
  18. Chen, H.; Chen, Z.; Lin, F.; Zhuang, P. Effective Management for Blockchain-Based Agri-Food Supply Chains Using Deep Reinforcement Learning. IEEE Access 2021, 9, 36008–36018. [Google Scholar] [CrossRef]
  19. Violi, A.; Laganá, D.; Paradiso, R. The inventory routing problem under uncertainty with perishable products: An application in the agri-food supply chain. Soft Comput. 2019, 24, 13725–13740. [Google Scholar] [CrossRef]
  20. Chen, S.; Min, J.; Teng, J.; Li, F. Inventory and shelf-space optimization for fresh produce with expiration date under freshness- and-stock-dependent demand rate. J. Oper. Res. Soc. 2017, 5682, 884–896. [Google Scholar] [CrossRef]
  21. Esteso, A.; Alemany, M.M.E.; Ortiz, Á. Impact of product perishability on agri-food supply chains design. Appl. Math. Model. 2021, 96, 20–38. [Google Scholar] [CrossRef]
  22. Liang, Z.; Liu, H.; Zuo, M.; Zhu, H.; Zuo, Y. Optimal procurement strategy of fresh produce retailer under stochastic product qualification and market demand. J. Control Decis. 2021, 8, 192–200. [Google Scholar] [CrossRef]
  23. Cui, L.; Guo, S.; Zhang, H. Coordinating a green agri-food supply chain with revenue-sharing contracts considering retailers ’ green marketing eff orts. Sustainability 2020, 12, 1289. [Google Scholar] [CrossRef]
  24. Paam, P.; Berretta, R.; García-flores, R.; Paul, S.K. Multi-warehouse, multi-product inventory control model for agri-fresh products–A case study. Comput. Electron. Agric. 2022, 194, 106783. [Google Scholar] [CrossRef]
  25. Qasem, A.G.; Aqlan, F.; Shamsan, A.; Alhendi, M. A simulation-optimisation approach for production control strategies in perishable food supply chains. J. Simul. 2021, 1–17. [Google Scholar] [CrossRef]
  26. Bo, V.; Bortolini, M.; Malaguti, E.; Monaci, M.; Mora, C.; Paronuzzi, P. Models and algorithms for integrated production and distribution problems. Comput. Ind. Eng. 2021, 154, 107003. [Google Scholar] [CrossRef]
  27. Suryawanshi, P.; Dutta, P. Distribution planning problem of a supply chain of perishable products under disruptions and demand stochasticity. Int. J. Prod. Perform. Manag. 2021; Iahead-of-print. [Google Scholar] [CrossRef]
  28. Widener, M.J.; Metcalf, S.S.; Bar-yam, Y. Developing a mobile produce distribution system for low-income urban residents in food deserts. J. Urban Health Bull. N. Y. Acad. Med. 2012, 89, 733–745. [Google Scholar] [CrossRef] [PubMed]
  29. Bahinipati, B.K. The Procurement Perspectives of Fruits and Vegetables Supply Chain Planning. Int. J. Supply Chain Manag. 2014, 3, 111–131. [Google Scholar]
  30. Zhao, X.; Dou, J. A hybrid particle swarm optimization approach for design of agri-food supply chain network. In Proceedings of the 2011 IEEE International Conference on Service Operations, Logistics and Informatics, Beijing, China, 10–12 July 2011; pp. 162–167. [Google Scholar]
  31. Tao, Q.; Huang, Z.; Gu, C.; Zhang, C. Optimization of green agri-food supply chain network using chaotic PSO algorithm. In Proceedings of the 2013 IEEE International Conference on Service Operations and Logistics, and Informatics, Dongguan, China, 28–30 July 2013; pp. 462–467. [Google Scholar]
  32. El Yasmin, A.S.L.; Ghani, B.A.; Trentesaux, D.; Bouziane, B. Supply chain management using multi-agent systems in the agri-food industry. In Service Orientation in Holonic and Multi-Agent Manufacturing and Robotics; Springer: Berlin/Heidelberg, Germany, 2014; Volume 42, pp. 145–155. [Google Scholar] [CrossRef]
  33. Raba, D.; Juan, A.A.; Panadero, J.; Bayliss, C. Combining the Internet of Things with simulation-based optimization to enhance logistics in an agri-food supply chain. In Proceedings of the 2019 Winter Simulation Conference, National Harbor, MD, USA, 8–11 December 2019. [Google Scholar]
  34. Onggo, B.S.; Panadero, J.; Corlu, C.G.; Juan, A.A. Agri-Food Supply Chains with Stochastic Demands: A Multi-Period Inventory Routing Problem with Perishable Products. Simul. Model. Pract. Theory 2019, 97, 101970. [Google Scholar] [CrossRef]
  35. Raoui, H.E.; Oudani, M.; Pelta, D.A.; Alaoui, A.E.H. A Metaheuristic Based Approach for the Customer-Centric Perishable Food Distribution Problem. Electronics 2021, 10, 2018. [Google Scholar] [CrossRef]
  36. Wang, Y.; Yang, C.; Hou, H. Risk management in perishable food distribution operations whale optimization algorithm. Ind. Manag. Data Syst. 2020, 120, 291–311. [Google Scholar] [CrossRef]
  37. Patidar, R.; Venkatesh, B.; Pratap, S.; Daultani, Y. A Sustainable Vehicle Routing Problem for Indian Agri-Food Supply Chain Network Design. In Proceedings of the 2018 International Conference on Production and Operations Management Society (POMS), Peradeniya, Sri Lanka, 14–16 December 2018; IEEE: New York, NY, USA, 2018; pp. 1–5. [Google Scholar]
  38. Ge, H.; Canning, P.; Goetz, S.; Perez, A.; Li, J. Embedding economies of scale concepts in the model of optimal locations of fresh produce aggregation hubs. Agric. Resour. Econ. Rev. 2019, 3, 365–387. [Google Scholar] [CrossRef]
  39. Etemadnia, H.; Goetz, S.J.; Canning, P.; Tavallali, M.S. Optimal wholesale facilities location within the fruit and vegetables supply chain with bimodal transportation options: An LP-MIP heuristic approach. Eur. J. Oper. Res. 2015, 244, 648–661. [Google Scholar] [CrossRef]
  40. Pereze-Mesa, J.C.; Serrano-arcos, M.M.; Jimenez-Guerrero, J.F.; Sanchez-Fernandez, R. Addressing the location problem of a perishables redistribution center in the middle of europe. Foods 2021, 10, 1091. [Google Scholar] [CrossRef]
  41. Han, J.; Lin, N.; Ruan, J.; Wang, X.; Wei, W.; Lu, H. A Model for Joint Planning of Production and Distribution of Fresh Produce in Agricultural Internet of Things. IEEE Internet Things J. 2020, 8, 9683–9696. [Google Scholar] [CrossRef]
  42. Brulard, N.; Cung, V.; Catusse, N.; Dutrieux, C. An integrated sizing and planning problem in designing diverse vegetable farming systems. Int. J. Prod. Res. 2019, 7543, 1018–1036. [Google Scholar] [CrossRef]
  43. Perez-Salazar, M.d.R.; Aguilar-Lesserre, A.A.; Cedillo-Campos, M.G.; Posada-Gomez, R.; del Moral-Argumedo, M.J.; Hernandez-Gonzalez, J.C. An Agent-Based Model Driven Decision Support System for Reactive Aggregate Production Scheduling in the Green Coffee Supply Chain. Appl. Sci. 2019, 9, 4903. [Google Scholar] [CrossRef]
  44. Yuan, Y.; Viet, N.; Behdani, B. The impact of information sharing on the performance of horizontal logistics collaboration: A simulation study in an agri-food supply chhain. IFAC Pap. 2019, 52, 2722–2727. [Google Scholar] [CrossRef]
  45. Shi, H.; Quan, M.; Liu, H.; Duan, C. A Novel Integrated Approach for Green Supplier Selection with Interval-Valued Intuitionistic Uncertain Linguistic Information: A Case Study in the Agri-Food Industry. Sustainability 2018, 10, 733. [Google Scholar] [CrossRef]
  46. Galal, N.M.; El-Kilany, K.S. Sustainable agri-food supply chain with uncertain demand and lead time. Int. J. Simul. Model. 2016, 15, 485–496. [Google Scholar] [CrossRef]
  47. Kanchanasuntorn, K.; Techanitisawad, A. An approximate periodic model for fixed-life perishable products in a two-echelon inventory–distribution system. Int. J. Prod. Econ. 2006, 100, 101–115. [Google Scholar] [CrossRef]
  48. Allaoui, H.; Guo, Y.; Choudhary, A.; Bloemhof, J. Sustainable agro-food supply chain design using two-stage hybrid multi-objective decision-making approach. Comput. Oper. Res. 2018, 89, 369–384. [Google Scholar] [CrossRef]
  49. Zhang, Y.; Chu, F.; Che, A. Bi-objective optimization for closed-loop food supply chain involving returnable transport items. In Proceedings of the 2019 International Conference on Industrial Engineering and Systems Management (IESM), Shanghai, China, 25–27 September 2019; IEEE: New York, NY, USA, 2019; pp. 1–6. [Google Scholar]
  50. Yakavenka, V.; Mallidis, I.; Vlachos, D.; Iakovou, E.; Eleni, Z. Development of a multi-objective model for the design of sustainable supply chains: The case of perishable food products. Ann. Oper. Res. 2020, 294, 593–621. [Google Scholar] [CrossRef]
  51. Chan, F.T.S.; Wang, Z.X.; Goswami, A.; Singhania, A.; Tiwari, M.K. Multi-objective particle swarm optimisation based integrated production inventory routing planning for efficient perishable food logistics operations. Int. J. Prod. Res. 2020, 58, 5155–5174. [Google Scholar] [CrossRef]
  52. Derrouiche, R.; Moutaoukil, A.; Neubert, G. Integration of Social Concerns in Collaborative Logistics and Transportation Networks. In Working Conference on Virtual Enterprises; Springer: Berlin/Heidelberg, Germany, 2014. [Google Scholar]
  53. Giallanza, A.; Puma, G.L. Fuzzy green vehicle routing problem for designing a three echelons supply chain. J. Clean. Prod. 2020, 259, 730–738. [Google Scholar] [CrossRef]
  54. La Scalia, G.; Micale, R.; Miglietta, P.P.; Toma, P. Reducing waste and ecological impacts through a sustainable and efficient management of perishable food based on the Monte Carlo simulation. Ecol. Indic. 2019, 97, 363–371. [Google Scholar] [CrossRef]
  55. Orjuela-Castro, J.A.; Orjuela-Cabrera, J.P.; Adarme-Jaimes, W. Logistics network configuration for seasonal perishable food supply chains. J. Ind. Eng. Manag. 2021, 14, 135–151. [Google Scholar] [CrossRef]
  56. Bortolini, M.; Galizia, F.G.; Mora, C.; Botti, L.; Rosano, M. Bi-objective design of fresh food supply chain networks with reusable and disposable packaging containers. J. Clean. Prod. 2018, 184, 375–388. [Google Scholar] [CrossRef]
  57. Zhao, X.; Lv, Q. Optimal Design of Agri-Food Chain Network: An Improved Particle Swarm Optimization Approach. In Proceedings of the 2011 International Conference on Management and Service Science, Wuhan, China, 12–14 August 2011. [Google Scholar]
  58. Prajapati, D.; Chan, F.T.S.; Daultani, Y.; Pratap, S. Sustainable vehicle routing of agro-food grains in the e-commerce industry. Int. J. Prod. Res. 2022, 1–26. [Google Scholar] [CrossRef]
  59. Kailaku, S.I.; Arkeman, Y.; Purwanto, Y.A.; Udin, F. Logistics network configuration: The solution for quality-related problems in long-distance transportation of mango in Indonesia. In Proceedings of the IOP Conference Series: Earth and Environmental Science, West Java, Indonesia, 29 August 2019. [Google Scholar]
  60. Jonkman, J.; Barbosa-povoa, A.P.; Bloemhof, J.M. Integrating harvesting decisions in the design of agro-food supply chains. Eur. J. Oper. Res. 2018, 276, 247–258. [Google Scholar] [CrossRef]
  61. Gong, W.; Li, D.; Liu, X.; Yue, J.; Fu, Z. Improved two - grade delayed particle swarm optimisation ( TGDPSO ) for inventory facility location for perishable food distribution centres in Beijing. N. Zeal. J. Agric. Res. 2010, 8233, 771–779. [Google Scholar] [CrossRef]
  62. Dündar, A.O.; Tekin, M.; Peker, K.; Şahman, M.A.; Karaoǧlan, I. A mathematical model for multi-period multi-stage multi-mode multi-product capacitated wheat supply network design problem and a case study. J. Fac. Eng. Archit. Gazi Univ. 2022, 37, 265–281. [Google Scholar] [CrossRef]
  63. Zheng, Y.; Liu, B. Fuzzy vehicle routing model with credibility measure and its hybrid intelligent algorithm. Appl. Math. Comput. 2006, 176, 673–683. [Google Scholar] [CrossRef]
  64. Nguyen, C.; Goff, Z.; Accorsi, R. Mathematical modeling of food and agriculture distribution. In Sustainable Food Supply Chains; Academic Press: Cambridge, MA, USA, 2019; pp. 145–158. ISBN 9780128134115. [Google Scholar]
  65. Bosona, T.G. Cluster Building and Logistics Network Integration of Local Food Supply Chain. Biosyst. Eng. 2011, 108, 293–302. [Google Scholar] [CrossRef]
  66. Suraraksa, J.; Shin, K.S. Urban transportation network design for fresh fruit and vegetables using GIS–The case of Bangkok. Appl. Sci. 2019, 9, 5048. [Google Scholar] [CrossRef]
  67. Amorim, P.; Almada-Lobo, B. The impact of food perishability issues in the vehicle routing problem. Comput. Ind. Eng. 2014, 67, 223–233. [Google Scholar] [CrossRef]
  68. Estrada-moreno, A.; Hirsch, P.; Juan, A.A. A biased-randomized algorithm for redistribution of perishable food inventories in supermarket chains. Int. Trans. Oper. Res. 2019, 26, 2077–2095. [Google Scholar] [CrossRef]
  69. Orjuela-castro, J.A.; Sepulveda-garcia, D.A. Effects of Using Multimodal Transport over the Logistics Performance of the Food Chain of Uchuva Effects of Using Multimodal Transport over the Logistics Performance of the Food Chain of Uchuva. In Workshop on Engineering Applications; Springer: Berlin/Heidelberg, Germany, 2016. [Google Scholar] [CrossRef]
  70. Coltro, L.; Karaski, T.U. Environmental indicators of banana production in Brazil: Cavendish and Prata varieties. J. Clean. Prod. 2019, 207, 363–378. [Google Scholar] [CrossRef]
  71. Craig, A.J.; Blanco, E.E.; Craig, A.J.; Blanco, E.E.; Sheffi, Y. ESD Working Paper Series a Supply Chain View of Product Carbon Footprints: Results from the Banana Supply Chain ESD-WP-2012-25 a Supply Chain View of Product Carbon Footprints: Results from the Banana Supply Chain. 2012. Available online: https://dspace.mit.edu/handle/1721.1/102939 (accessed on 1 August 2022).
  72. Iriarte, A.; Almeida, M.G.; Villalobos, P. Carbon footprint of premium quality export bananas: Case study in Ecuador, the world’s largest exporter. Sci. Total Environ. 2014, 472, 1082–1088. [Google Scholar] [CrossRef]
  73. Roibás, L.; Elbehri, A.; Hospido, A. Evaluating the sustainability of Ecuadorian bananas: Carbon footprint, water usage and wealth distribution along the supply chain. Sustain. Prod. Consum. 2015, 2, 3–16. [Google Scholar] [CrossRef]
  74. dos Santos, S.F.; Cardoso, R.d.C.V.; Borges, Í.M.P.; Almeida, A.C.e.; Andrade, E.S.; Ferreira, I.O.; Ramos, L.d.C. Post-harvest losses of fruits and vegetables in supply centers in Salvador, Brazil: Analysis of determinants, volumes and reduction strategies. Waste Manag. 2020, 101, 161–170. [Google Scholar] [CrossRef]
  75. Kamalakkannan, S.; Wasala, W.M.C.B.; Kulatunga, A.K.; Gunawardena, C.R.; Bandara, D.M.S.P.; Jayawardana, J.; Rathnayake, R.M.R.N.K.; Wijewardana, R.M.N.A.; Weerakkody, W.A.P.; Ferguson, I.; et al. Life Cycle Assessment of Food Loss Impacts: Case of Banana Postharvest Losses in Sri Lanka. Procedia CIRP 2022, 105, 859–864. [Google Scholar] [CrossRef]
  76. Fiore, M.; Colantuono, F.; Conto, F.; Adamashvili, N. Investigating the role of community of practice for sharing knowledge in agriculture sector. J. Glob. Bus. Adv. 2020, 13, 162. [Google Scholar] [CrossRef]
Figure 1. Schematic Diagram of research methodology.
Sustainability 14 12060 g001
Figure 2. Dispersion of banana farmers (red) at Embilipitiya around the Dedicated Economic Center (blue marker inside yellow boundary box).
Sustainability 14 12060 g002
Figure 3. Dispersion of banana farmers (red) at Thambuththegama around the Dedicated Economic Center (blue marker inside yellow boundary box).
Sustainability 14 12060 g003
Figure 4. Thambuththegama and Embilipitiya branches of the banana supply chain in Sri Lanka.
Sustainability 14 12060 g004
Figure 5. Within cluster sum of squared error plot for Embilipitiya geo-locations.
Sustainability 14 12060 g005
Figure 6. Embilipitiya farmer clusters.
Sustainability 14 12060 g006
Figure 7. Within cluster sum of squared error plot for Thambuththegama geo-locations.
Sustainability 14 12060 g007
Figure 8. Thambuththegama farmer clusters.
Sustainability 14 12060 g008
Figure 9. Suggested banana supply configuration.
Sustainability 14 12060 g009
Table 1. Summary of studies performed related to strategic decisions under network designing.
SourceDecision AddressedModeling
Technique
Obj.Solution ApproachPerformance MeasuresEntities
Facility LocatingNo. of facilitiesProduct flowFacility capacitiesPacking methodRoute OptimizationProducer clusteringInventoryDemand distributionCost balancingArea allocationProduction quantityProcessed quantityWasteFacility availabilityTransport modeTravel timeTravel distanceFairness among driversMILPGPRA - COGJIAPILPMINLPSingleMultipleΕ-ConstraintDAWSMVPANCMRoute Logix softwarePSOSAGPMinmax WeightingAHPOWACEALossesLead timeNo. of clientsTransport costNo. of suppliersTotal costSetup costCo2 emissionDistanceNo. of routesGros marginProduction CostNo. of locationsCoverageNo. of jobsProducerCollectorProcessor/FactoryDistribution CenterWholesalerRetailer
[1]x x x x xx x x
[4]xx x xx xxx x x
[10]x xx x x xx x xx x xx
[50]x x x x x x xx x xxx
[55]xxx x xxx xxxxx xx x x
[56]x x x x x x x x x x x
[57]x x x x x x x x x xx
[59] x x x x x x xx xx x
[60]xxx x xxxxx x xx x x x x
[61]x xxx x x x x x
[65] x xx x x x x xx xx
[66] x xxx x x x xx x x
[48] x x x x xx x x xx x x
MILP: Mixed Integer Linear Programming, MINLP: Mixed Integer Non Linear Programming, GP: Goal Programming, RA: Route Analysis, COG: Center of Gravity, JIAP: Joint Inventory Allocation Problem, ILP: Integer Linear Programming, DA: Dominance Algorithm, WSM: Weighted Sum Method, VPA: Value Path Approach, NCM: Normal Constraint Method, SA: Scenario Analysis, AHP: Analytical Hierarchy Process, OWA: Ordered Weighted Averaging, CEA: Cross-Entropy Algorithm.
Table 2. Summary of studies performed related to tactical/operational decisions under vehicle routing.
SourceDecision AddressedModeling
Technique
Obj.Solution ApproachPerformance MeasuresEntities
Product FlowRoute SelectionVehicle SelectionVehicle SpeedFacility LocatingCustomer AllocatingFarmer AllocatingOptimal Parcel PickupPerishabilityFood safety RiskMINLPMILPFCCPFODSMLPSingleMultiplePSOSAFAE-ConstraintNSGA-IIDAMCDMBRTGAFSCLDWOAMOEALead timeTransport CostTotal CostPenalty CostDistanceNo. of VehiclesCo2 EmissionSupply CostProducer/FarmerCollector/pickup CenterProcessor/FactoryDistributor/WholesalerVehicle DepotRetailer
[37]x x x x x x x x xx
[52] x x x xx x
[53] x xx x x x x x x
[58]xxxxx x x xxx x xx xx
[62] x x x x x xx xx
[63] x x x xx x xx
[36] x x x x x x
[67] x x x x x x x
[68] x x x x x xx
[69] x x x x xxx
MILP: Mixed Integer Linear Programming, MINLP: Mixed Integer Non Linear Programming, FCCP: Fuzzy Chance Constrained Programming, PSO: Particle Swarm Optimization, SA: Simulated Annealing, FA: Fairfly Algorithm, FAWNA: Fairfly Algorithm with Neighborhood Attraction, DA: Data Analysis, MCDM: Multi Criteria Decision Making, BRT: Biased Randomized Technique, GA: Genetic Algorithm, DSM: Dynamic System Model, CDL: Casual Loop Diagram, WOA: Whale Optimization Algorithm, MOEA: Multi Objective Evolutionary Algorithm, FO: Fuzzy Optimization, FS: Fuzzy Simulation.
Table 3. Comparison of performance measures.
StageExistingNew Configuration
PHLNet GWPPHLNet GWP
(kg)Production (kgCo2eq)PHL
(kgCo2eq)
Transport (tCo2eq)(kg)Production (kgCo2eq)PHL
(kgCo2eq)
Transport tCo2eq
Farmer61.99557.6617.36 61.99557.6617.36
Farmer–Collector 36.35 18.27
Collector34.78 9.74 28.33 7.93
Collector–Wholesaler 296.56 308.93
Wholesaler82.30 23.04 83.09 23.27
Wholesaler-Retailer 390.57 285.51
Retailer64.82 22.09 65.22 22.22
Total243.89724.10 (tCo2eq)238.63613.47 (tCo2eq)
Total travel distance602,954.94 km479,526.55 km
Lead times47.39 h33.74 h
Publisher’s Note: MDPI stays neutral with regard to jurisdictional claims in published maps and institutional affiliations.

