1. Introduction
In October 2018, the United Nations stated that in order to avoid the catastrophic effects of climate change “the net anthropogenic global carbon emissions until 2030 must be reduced by 45% compared with 2010 level and around 2050 should become zero” [
1]. Lithuania is committed to reducing CO
2 emissions by 9% by 2030, compared with 2005 levels. In Lithuanian cities, the amount of particulate matter is the highest among neighboring countries, at 23 mg per cubic meter; this is more twice as high as that in Estonia (10 mg). In contrast to Lithuania, in both Latvia and Estonia, the amounts of these pollutants in the air have been declining over the last five years. In the last decade, cases of respiratory diseases in Lithuania have been increasing. For example, asthma has increased by more than 50% (although the number of smokers is steadily declining). According to data provided by the European Environment Agency [
2], compared to 1990 values, in 2017, Lithuania had reduced CO
2 emissions by 57%. It would be advantageous to exploit the common aspects of the facts that (i) sustainable development is essential for combating climate change, and (ii) climate change is a constraint on development. Such an approach will generate positive synergies when selecting solutions for combating climate change. Since the late 1960s, scientists have been aware of the enormous concentration of carbon dioxide (CO
2) and greenhouse gases (GHGs) such as methane (CH
4) and nitrogen oxides (N
2O in the atmosphere. Despite this, in recent years, the term “Greenhouse effect” has attracted the attention of scientists and the general public, as it concisely expresses the connection between greenhouse gases and climatic warming.
According to the authors of [
3], although the greenhouse effect occurs naturally and is necessary for survival on Earth, there is evidence that human activity has significantly intensified this natural process.
Economic and population growth compared to the pre-industrial era [
4,
5,
6,
7,
8,
9] has resulted in an increase of anthropogenic greenhouse gas (GHG) emissions, leading to atmospheric concentrations of carbon dioxide, methane, and nitrous oxide that are “unprecedented for at least the last 800,000 years” [
3].
Research motivation: Taking into account climate forecasts and the expectations that the amount of exhaust gases will increase and the majority of general transport emissions are attributable to road transport, the objective of the present study is to determine the main criteria that influence choices by transport companies to reduce pollution through switching to electric cars. These criteria could then be used in the future to encourage other transport companies to apply comparable strategies. At present, the number of electric cars in Lithuania is small, i.e., less than 0.3% of the total cars on the road.
For a long time, the scientific literature was limited of studies analyzing the impact of transport on climate change, i.e., mostly the dependence of the number of cars on a country’s GDP, economic activity or road accident statistics. Only in recent decades have a growing number of studies focused on the aforementioned problem. Chapman [
10] analyzed the principal contributors to greenhouse gas emissions within the transport sector and noted that new technological innovations will be the sole solution to the climate change problem. He summarized that, in the future, in order to provide sustainable transport, policy makers must combine short-term behavioral changes with long-term technological solutions. Meanwhile, other authors, such as Gonzales et al. [
11], have examined the dynamic relationship between passenger car CO
2 emissions in 13 EU countries between 1990–2015 and the dieselization of such vehicles, technological progress, fuel efficiency, mobility, economic activity and motorization rates. They estimated that CO
2 emissions have been reduced through technological innovations and fuel efficiency, while increased motorization rates, economic activity and the use of diesel have negated the positive impact.
Helmers et al. [
12] investigated CO
2 emissions from passenger cars in Europe in many EU countries during the 1995–2015 period, i.e., the so-called “diesel boom”. In this period, millions of consumers switched from petrol to diesel cars because of the lower price of diesel in many EU countries. Those authors analyzed whether this policy was efficient with respect to mitigating climate change; their results showed that switching from one fossil fuel to another does not yield any tangible benefit. They concluded that, in the future, a policy of introducing low-emissions vehicles, such as battery electric cars, must be applied.
Santos and Davies assessed the perceived impact of a range of incentives for using electric cars. They found that most respondents considered the “development of charging infrastructure” as most positive, while fewer respondents valorized incentives such as (reduced) “taxes” [
13].
The novelty of the present article is its evaluation of the influence of increased motorization and technological development in Lithuania on greenhouse gas emissions. Additionally, measures for further decreases are proposed. To this end, we defined the following tasks: to analyze the growth of motorization in the EU, to formulate hypotheses, to select a research methodology and to perform the relevant research.
2. Greenhouse Gas Sources and Effects
Greenhouse gases operate similarly to greenhouse glass in that they absorb solar energy and heat emitted from the Earth’s surface, retain it in the atmosphere, and do not release it into space. This process is the cause of the greenhouse effect, as it keeps the Earth’s temperature higher than it would be otherwise, allowing life to exist. The atmosphere produces naturally high levels of greenhouse gases, but human activities produce even higher levels, greatly amplifying the greenhouse effect and accelerating global warming.
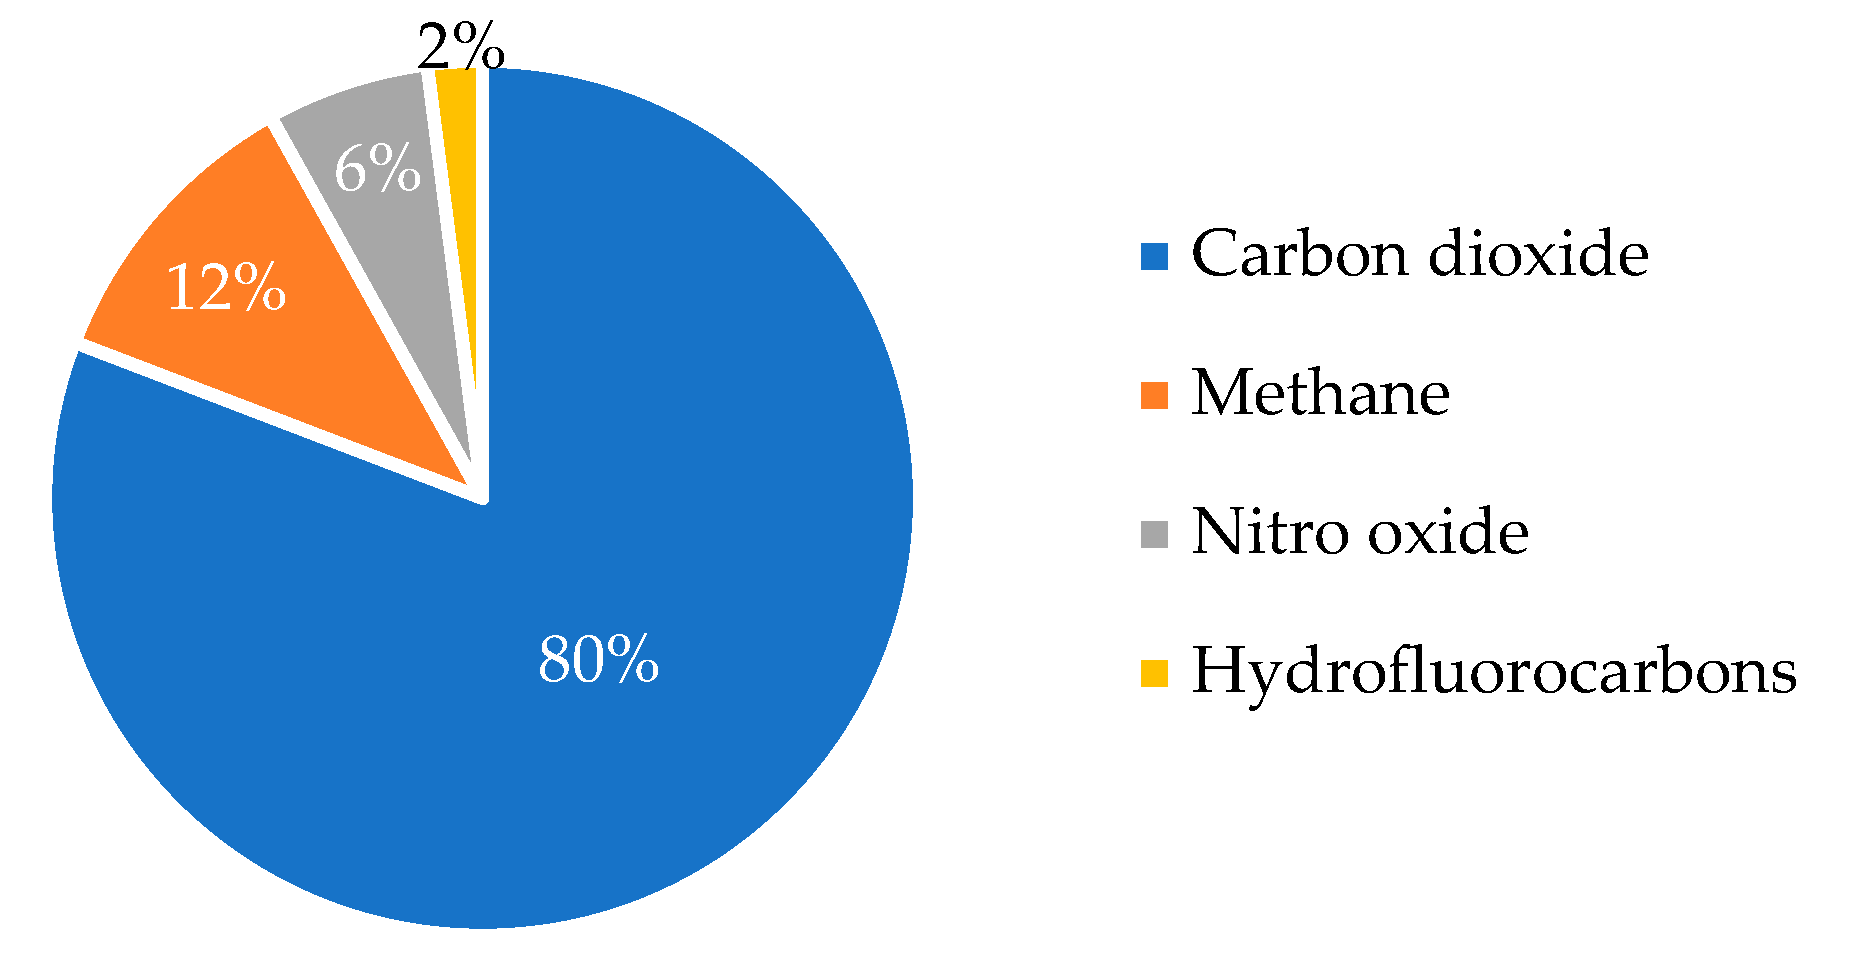
Figure 1 depicts 2019 GHG emissions in the EU by pollutant.
As shown in
Figure 1, the largest proportion of greenhouse gases is made up by CO
2, which is emitted by humans in the majority of EU countries. Other greenhouse gases are emitted in smaller quantities than CO
2, but they retain heat considerably more effectively. Over 20 years, methane was found to be more than 80 times stronger than CO
2 (EU/EP).
3. Transport Is a Significant Contributor to EU’s Greenhouse Gas Emissions
During the period between 2018 and 2019, the EU’s internal transport emissions rose by 0.8%. As a result of the pandemic’s observable impact on vehicle activity, it was determined that, in 2020, gas emissions decreased by 12.7%. Comparing how gas emissions changed a decade ago after the economic crisis, it was determined that gas emissions decreased by 1–3% per year [
14] in the years following the crisis. The total amount of GHG gases emitted by vehicles in the 32 EEA member states (excluding the international maritime and aviation sectors) increased by 25%, accounting for 19.5% of total emissions.
Taking into account the national projections of member states, it is anticipated that the amount of greenhouse gas emissions from transportation will increase significantly after 2022. Therefore, until 2025, an increase in emissions can be anticipated in the absence of additional measures. By 2030, it is anticipated that transportation emissions will have decreased further, but will still be approximately 10% higher than they were in 1990. However, if additional transport emissions mitigation measures were implemented in member states, it would increase until 2022 and then decline. Therefore, by 2030, pollutant emissions would be 6% lower than they were in 1990. The promotion of low-carbon fuels, the use of electric vehicles, and the transition to public transportation are the primary focuses of the planned transformation of the transportation sector’s policy.
In 2019, road vehicles accounted for 72% of all domestic and international transport greenhouse gas emissions. As road transport is the focus of the majority of applied and planned measures in the member states, this proportion will decrease, as the decarbonization process in road transport is more rapid than in other modes of transportation.
In Europe, the average new passenger vehicle produced 122 grams of carbon dioxide per kilometer in 2019. This amount can vary based on the vehicle’s fuel efficiency, annual mileage, and fuel consumption. The 2020/21 CO
2 target for the passenger car fleet of the European Union is 96 grams per kilometer [
15].
European policymakers revised CO2 emissions limits for passenger vehicles. In general, new vehicles are more fuel-efficient than used vehicles, and the recent EU regulations on cars and CO2 as well as other car regulations will influence future developments. The auto industry has a lengthy adoption curve for new technologies, however. Additionally, the anticipated increase in traffic volumes will mitigate the effect of technology. To reduce short-term greenhouse gas emissions and enhance energy consumption, additional measures must be considered.
It is especially important to note that fuel consumption directly affects CO
2 emissions, and that measures aimed at reducing the quantities of gases emitted by vehicles and causing the greenhouse effect would aid in reducing the significance of oil imports and dependence on them. Recent EU directives, such as the Low Carbon Economy Guidelines and the White Paper on Transport, support the implementation of these initiatives by taking into account the implementation process. The White Paper of 2011 [
16] outlined 10 objectives for a competitive and resource-efficient transport system, which serve as guidelines for a reduction of greenhouse gas emissions by 60%. In addition, the White Paper presents a strategy comprised of 40 initiatives that will aid in achieving these objectives over the next decade.
The European Green Deal [
17] aims to make the European Union carbon neutral by 2050. To reach this objective, all sectors must be decarbonized. In its proposal for the Climate Law [
18], the European Commission presented a 55% increase in the intermediate GHG reduction target by 2030, which was approved by the European Council at the end of 2020. Moreover, in December of 2020, the European Commission published the “Sustainable and Smart Mobility Strategy“ [
19], which outlined a plan for ensuring the green transformation of EU transportation systems.
4. Comparison of EU Motorization Rate Growth and Greenhouse Gas Emissions
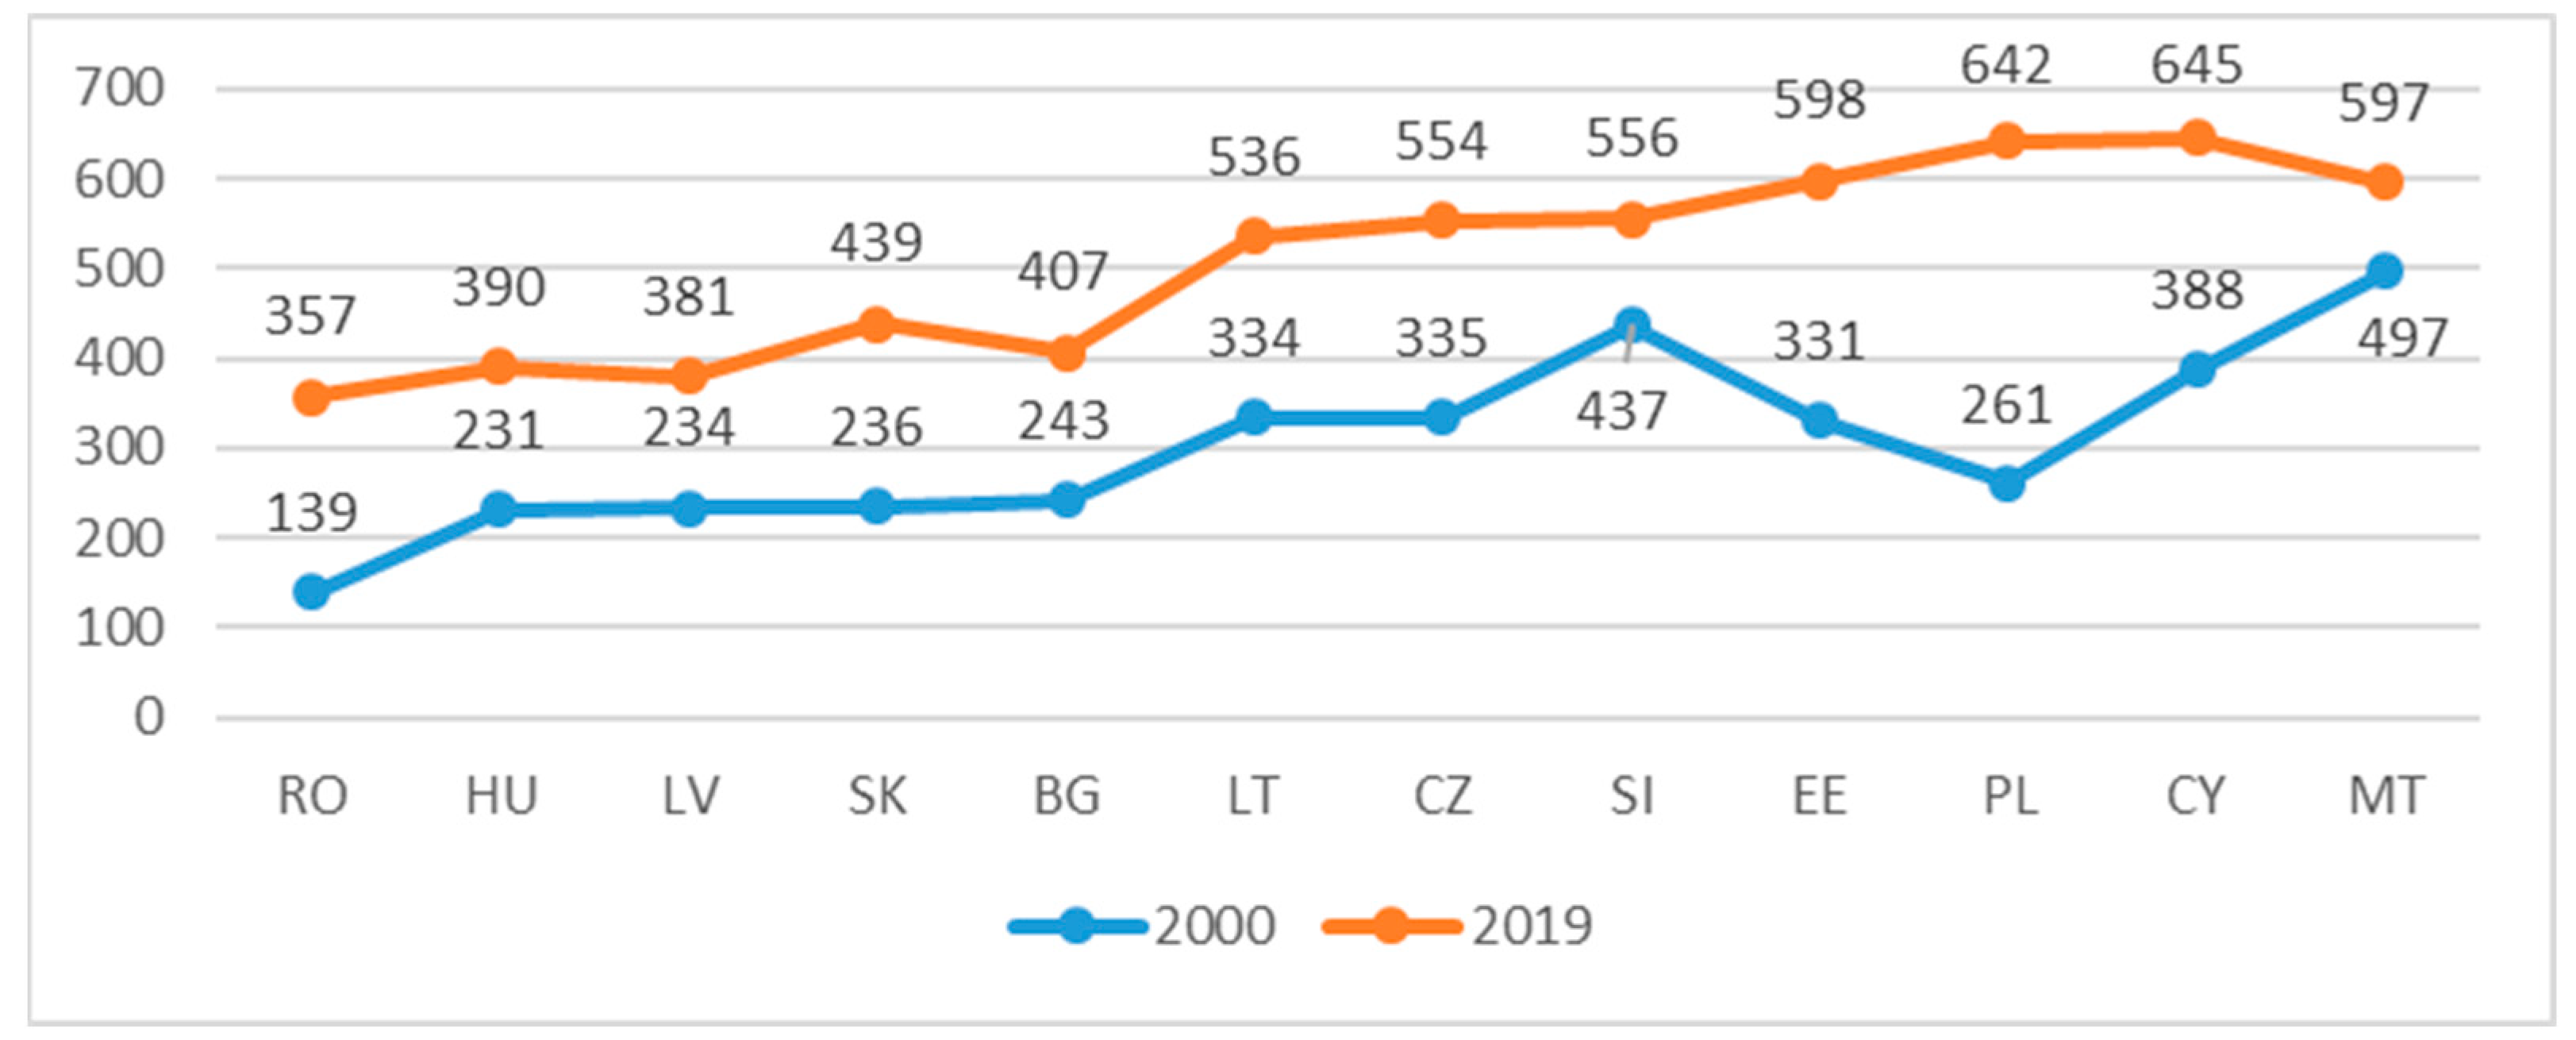
Figure 2 depicts the evolution of the level of motorization and its growth in the countries of the new EU member states over a 19-year period.
According to
Figure 2, the highest motorization growth rate was in Poland, at 146%, followed by Estonia, at 80.7%, and Cyprus, at 66.6%. The countries with the lowest motorization growth rates were Hungary (68.8%) and Lithuania (60%).
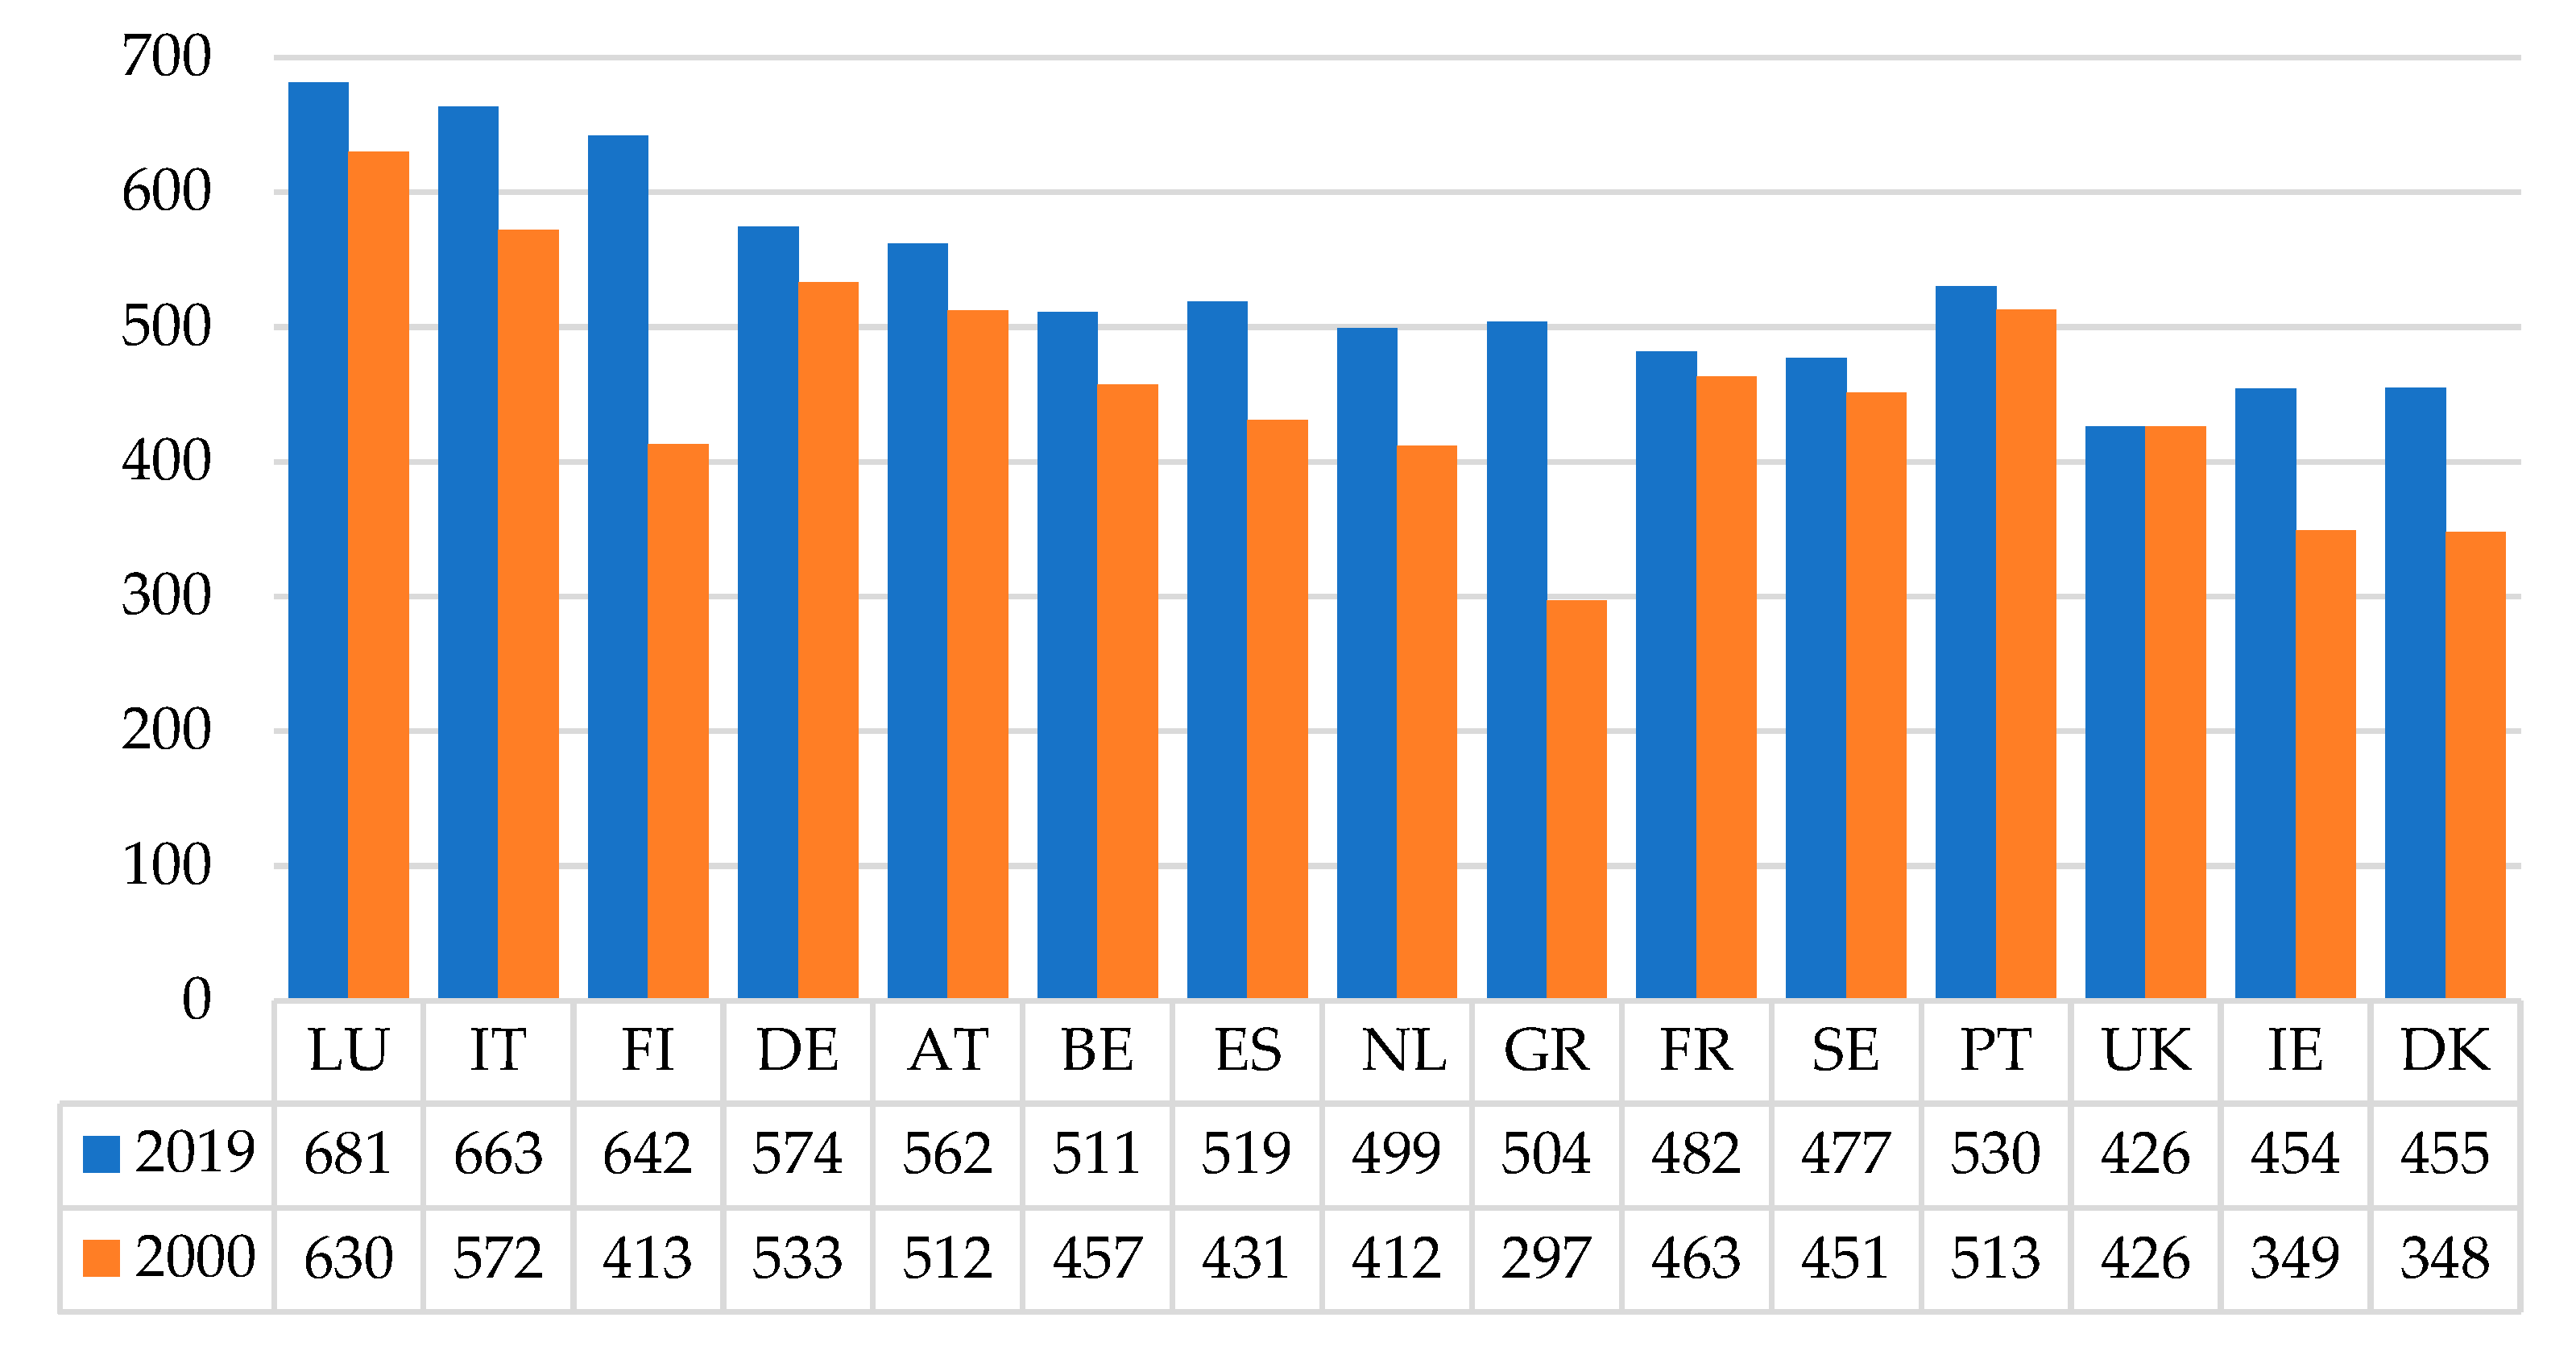
The level of motorization and its growth rates in the countries of the old EU member states over the past 19 years are depicted in
Figure 3. Luxemburg (681), Italy (663), and Finland (642) had the highest number of passenger cars per 1000 residents in 2019. The lowest numbers were in Denmark and Ireland, with 454 and 454, respectively. Greece had the highest motorization growth rate, at 69.7%, while Finland had 55.4%, and Denmark and Ireland 30.74%. The lowest rates are in Portugal (3.3%), France (4.1%), and Germany (7.7%).
Currently, the transportation market is fraught with obstacles. Due to a lack of necessary components and a slowdown in the supply of vehicles, the new car market is stagnating, while used cars are harder to find in European markets, so the volume of imported cars remains low. As the supply of automobiles decreases, car prices increase. Considering the unfavorable conditions created during the pandemic and quarantine periods, it became clear that the year 2020 cannot be objectively suitable for the analysis and definition of the criteria for the European 2030 goals. In order to have the most objective indicators for monitoring the progress and current situation of road traffic safety, the European Union decided to use 2019 as the base year and to use the average of the period from 2017 to 2019 for this purpose, which seems to be the most appropriate.
The highest number of electric cars in the world is in Norway, where for the first time in 2020 more electric cars than any other type were registered. In September 2021, more than 14% of all vehicles registered in Norway were electric vehicles [
21]. Lithuania is still a long way off from such numbers, with approximately 43,000 electric cars out of a total of 1.5 million automobiles [
22], or less than 0.3% of the entire fleet. In total, 75% of cars in Lithuania are older than 11 years [
23], and the average age of a car is 14 years, contributing significantly to air pollution. Unbelievable quantities of pollution are being released into the atmosphere. The amount of pollutants emitted into the atmosphere depends on the amount of fuel burned and the car’s design: 3 g/km if manufactured in 1983; 2.3 g/km if manufactured in 1996. The rate of automobile ownership in Lithuania is increasing rapidly, from 190 per 1000 inhabitants in 1995 to 456 in 2019.
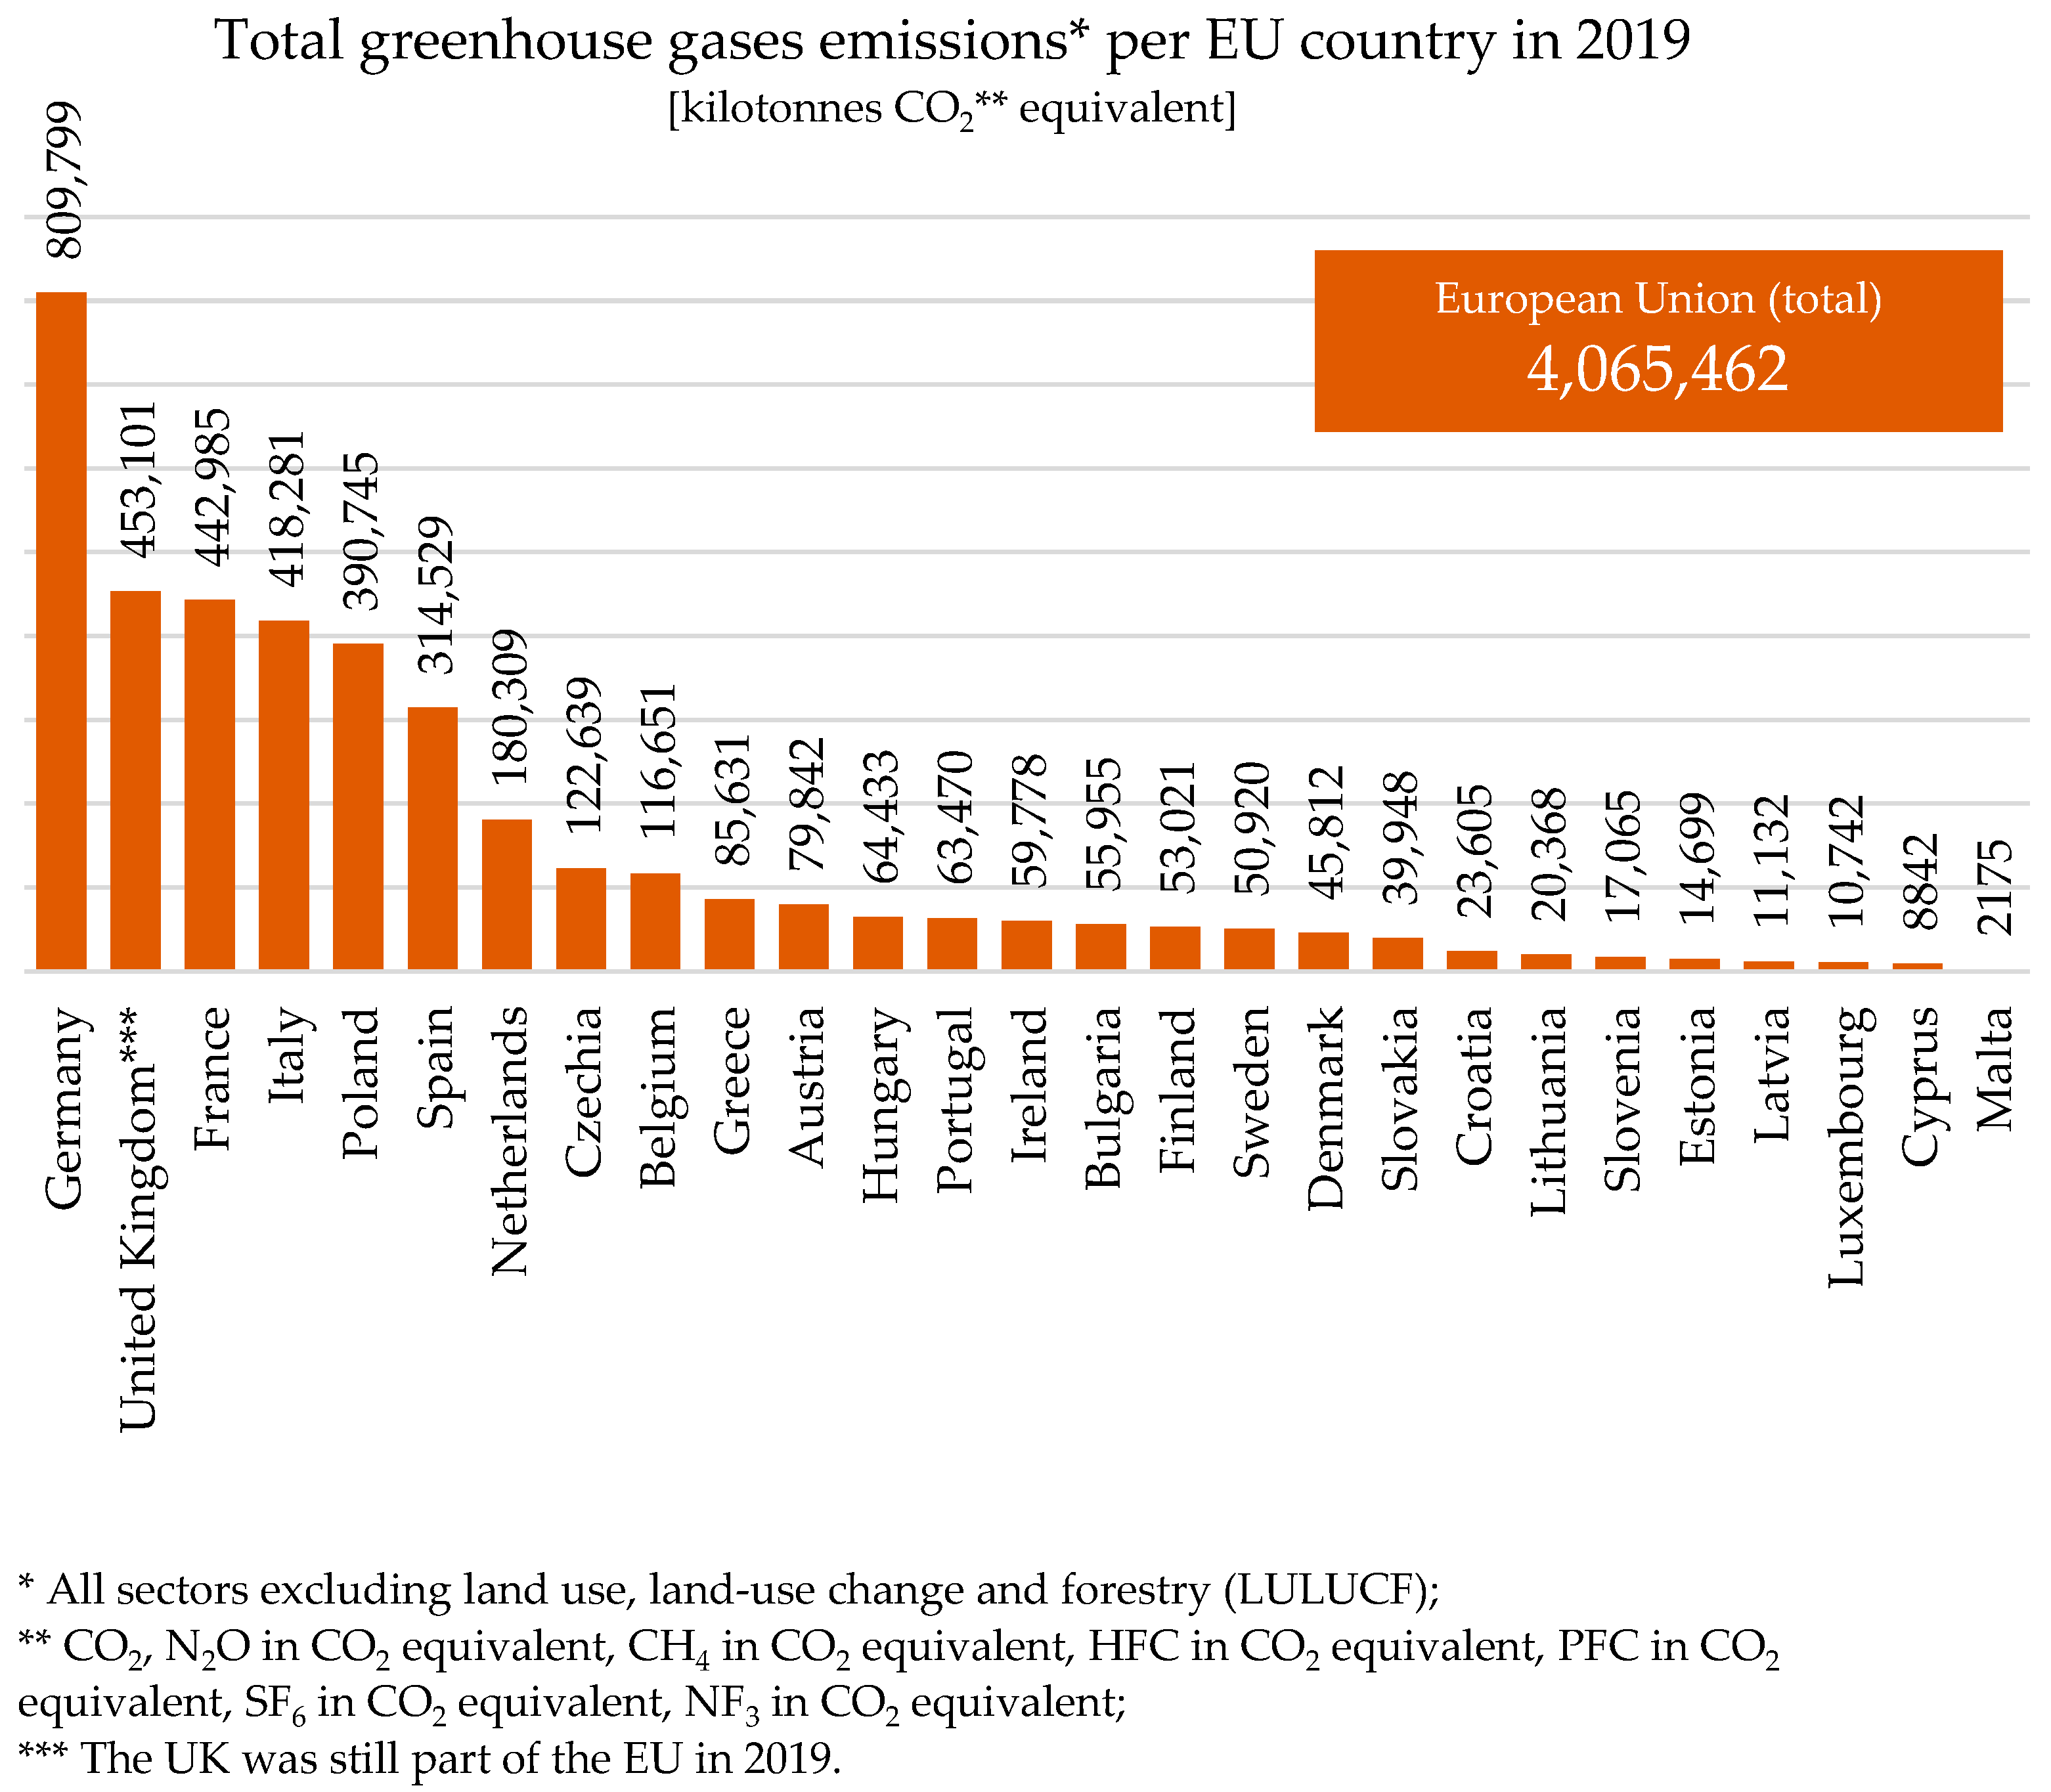
Figure 4 demonstrates that among the old EU member states, Germany, France, and Italy had the highest pollution (809.7; 442.9; 418.4 kilotonnes CO
2), but their motorization growth rate was low (7.7%, 19%, 15%), whereas in the new member states such as Poland and the Czech Republic, where pollution was high (390.7 and 122.6 kilotonnes CO
2), the motorization growth rate was correspondingly high (146%, 65%). This can be explained by the diversity of pollutant sources in the old EU member states and the quality of automobiles in the new EU member states. According to the 2019 report from the European Automobile Manufacturers Association (ACEA), the average age of passenger cars in the EU is 10.8 years [
21], while the average age of cars in Estonia, Lithuania, and Romania is over 16 years.
Battery electric vehicles (BEVs) and plug-in hybrid electric vehicles (PHEVs) are slowly penetrating the European Union market (PHEVs). Each year, a growing number of individuals purchase new electric vehicles. Their number increased from 700 in 2010 to approximately 550,000 in 2019, representing 3.5% of their new registrations. It should be emphasized that electric car registrations grew rapidly in the year 2020, accounting for approximately 11% of newly registered passenger vehicles.
There are 6440 electric cars in Lithuania, of which 3720 are pure electric and the remainder are plug-in hybrids. This number of electric cars represents 0.4% of the nation’s transportation vehicles. The goal of Lithuania is to increase the percentage of electric cars and other zero-emission cars powered by alternative fuels to 20% of the total proportion of cars by 2030 [
24].
To summarize: In 2019, the rate of motorization growth per 1000 inhabitants in Lithuania was −60.5%, which significantly augmented the greenhouse effect and accelerated global warming. Importantly, fuel consumption directly affects CO2 emissions, with road vehicles accounting for 72% of all greenhouse gas emissions from domestic and international transportation. Therefore, the development of technologies and investments by Lithuanian transport companies aimed at reducing the amount of gas emitted by vehicles that contribute to the greenhouse effect would aid in reducing the significance and reliance on oil imports. Electric vehicles emit half as much pollution as the average internal combustion engine, and this investment could reduce greenhouse gas emissions.
5. Research Methodology
One of the most common methods for determining the development of technologies is qualitative expert evaluation, the results of which serve as the foundation for subsequent quantitative calculations of commercial potential. Selected scientists evaluate the relationship between the improvement of the transport company’s management and its technological advancement [
25,
26,
27,
28].
Quantitative research proposed by researchers [
26,
27] and their method—a questionnaire—was chosen to measure the relationship between investments and technological innovation development at the transportation company. A questionnaire for expert evaluation was developed and prepared. The questionnaire provided experts with closed-ended questions. Then, a list of experts to be interviewed was compiled. It is believed that the most important quality of experts should be their competence; consequently, the experts were required to possess both competence and experience in the area of study. The concordance coefficient [
28] can be used to calculate the consistency of the opinions of more than two specialists. If there are more than two experts in a group, the concordance coefficient indicates the level of consensus among them. The evaluations of experts are derived from the questionnaires they completed and are displayed in
Table 1. n members of the expert group quantify m objects. The evaluations (
Table 1) constitute an n by m matrix [
28].
In a 10-point scale, evaluations can be based on indicator units, unit parts, or percentages. For calculating the concordance coefficient, the ranking of expert indicators is suitable. The most significant indicator is assigned a rank (
R) of one, the second indicator a rank of two, and the least significant indicator a rank of m (m is the number of benchmarks). The average of the accumulated ranks is determined [
29]:
In light of the evaluation indicators of the experts, the Kendal concordance coefficient is calculated to determine the credibility of their opinions. If S (variance) is the real sum of the squares determined by Formula (1), then the concordance Coefficient (2), if there are no related ranks, is calculated as the ratio of the resulting S to the corresponding maximum S
max (2):
The method for calculating the expert competence coefficient [
30] is used to determine each expert’s competency coefficient. In Formula (3), the same competence coefficient is assigned to all experts [
31]. Giving equal weight to all experts reveals whether their opinions are competent and shared. For this purpose, the experts’ competence factor is calculated:
here: n—number of experts,
—expert competence coefficient, j—coefficient = 1.
The initial competency coefficient is then multiplied by the sums of the initial rank values in each column. We obtained group estimates of alternative (4) and a new matrix for calculating the competence factor. Calculating the competence coefficient [
31] using Formulas (4)–(6):
—new matrix values;
—group assessments; x
ij = i—experts; j—the rank of the alternative.
λ
t lambda—which is all matrices—
—the sum of the values, n—number of experts, m—number of alternatives.
In the direct method weighting of criteria, c
ik the sum of the weights of all the evaluations of each expert must be equal to one (or 100%). The method used to indirectly determine the weights of the criteria uses the chosen scoring system (5, 10, 20, etc.). Evaluations may be repeated. The weights w (11) of the criteria are calculated by the direct and indirect estimation method according to the formula [
29]:
Expert evaluations are noted as cik (i = 1, …, M; k = 1, …, R), where m—is the number of applied criteria, r—is the number of experts.
6. Research Results
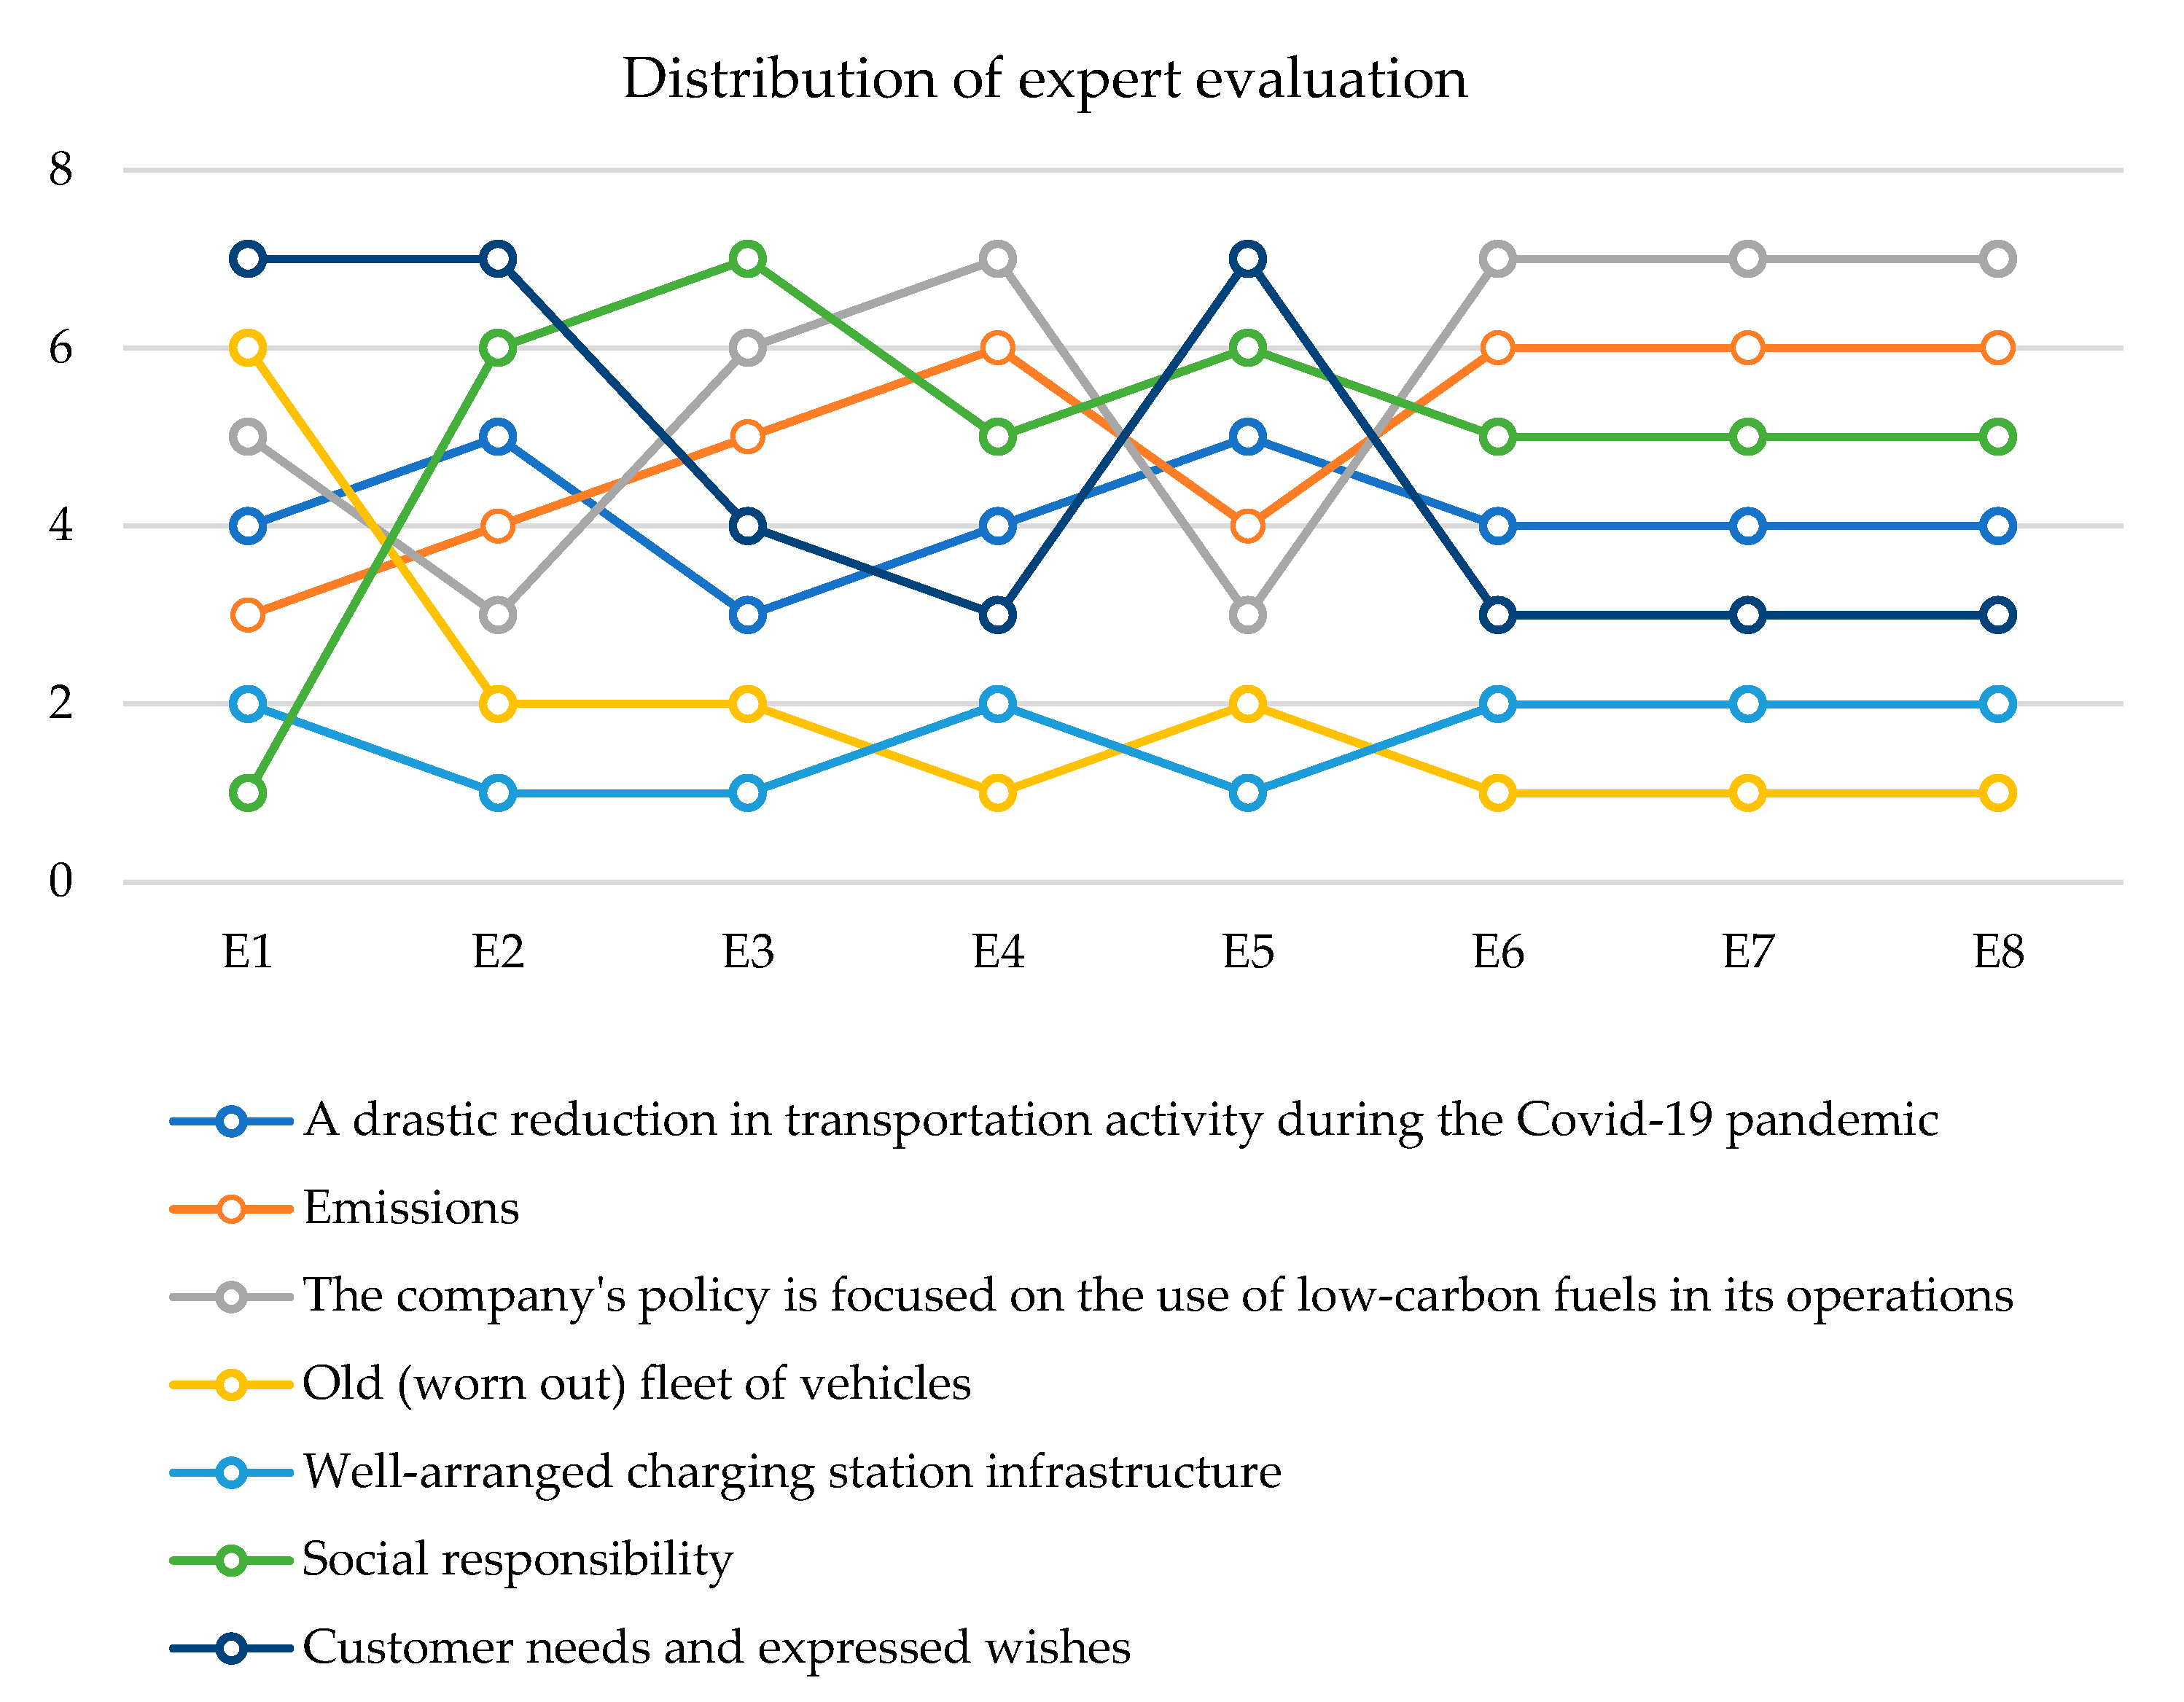
During the process of the study, it was hypothesized that the decrease in pollution in Lithuania is correlated with transportation companies’ investments in technological advancement. Eight professionals with five to ten years of managerial experience in transportation organizations participated in the study. Experts were tasked with evaluating the following primary factors influencing the selected transport company’s contribution to the technological advancement of the transition to electric vehicles in Lithuania: a drastic decrease in transportation activity during the COVID-19 pandemic; emissions; the company’s policy is to use low-carbon fuels in its operations; an aging fleet of vehicles; well-organized infrastructure for charging stations; social responsibility; customers’ expressed desires.
Figure 5 illustrates the distribution of rankings.
The analytical data and calculation of the rankings distribution on the expert questionnaires are presented in
Table 2.
The concordance coefficient W was calculated as stated by Formula (8) in the absence of associated ranks.
The number of (most) important factors determining the efficiency of the technological development of the transport company’s transition to electric vehicles is seven, i.e., m > 7. Then, the weight of the concordance coefficient
2 is calculated according to Formula (9) to obtain a random variable:
2 calculated value of 25.178 was obtained above the critical value (equal to 12.5916), As a result, the respondents’ opinions are thought to be harmonized, and the average ranks show the general opinion of the experts.
The lowest value of the concordance W
min coefficient was determined by Formula (10), where W
min = 0.2623 < 0.5245 is positive, and it means that the opinions of all eight experts on the seven critical factors determining the significance of technological advancement for the success of transportation companies during the transition to electric vehicles. The importance of main factors determining the efficiency of technological development of the transport company in the transition to electric vehicles are calculated—Q
j. The obtained data are presented in
Table 3.
Expert evaluations and calculations resulted in rankings of importance for the critical factors influencing the efficiency with which a transportation company transitions to electric vehicles for technological advancement.
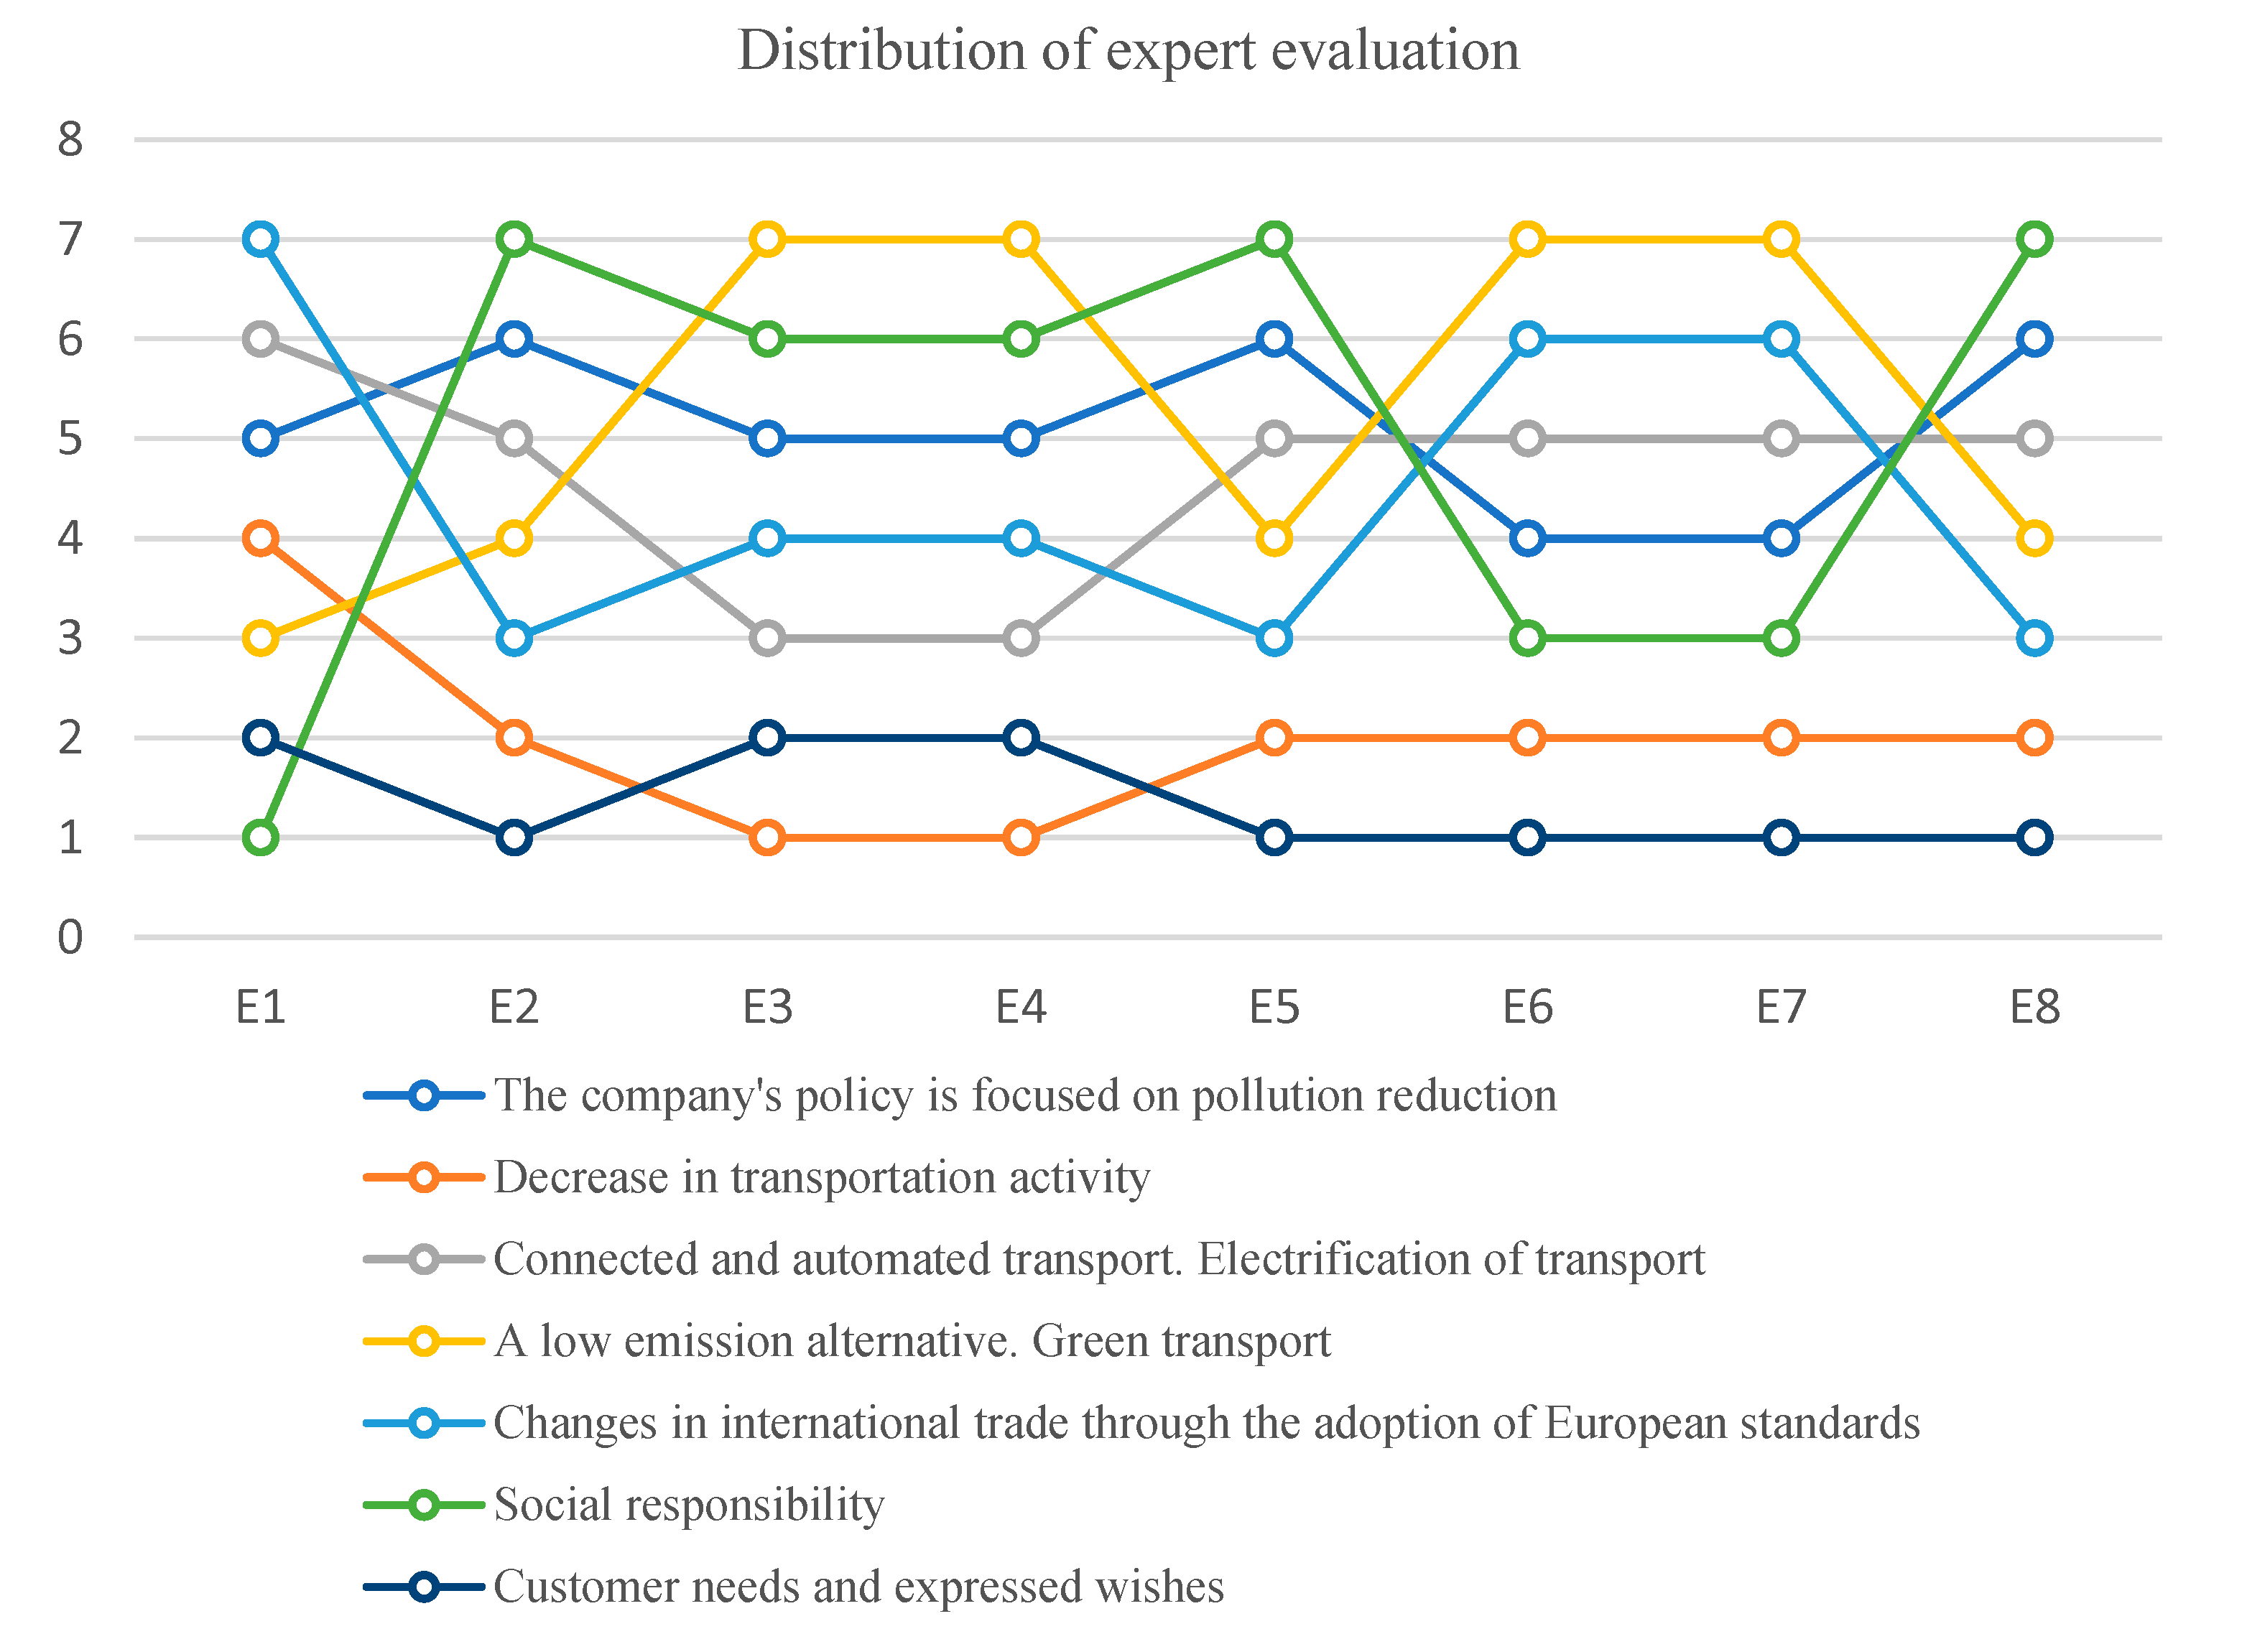
The experts were tasked with evaluating the following primary evaluation criteria for the components of a transport company’s investment measures to reduce pollution through technological innovation: the company’s policy focuses on reducing emissions, reducing transportation activity, and implementing connected and automated transportation; transport electrification—a low-emissions alternative; green transportation; changes in international trade resulting from the adoption of European standards; social responsibility; customer requirements and desires.
Figure 6 depicts the distribution of ranking positions.
Table 4 summarizes the analysis data and calculation of the distribution of the expert’s answers.
The concordance coefficient W was calculated by Formula (11) without associated ranks:
The number of important components of the main investment measures of a transport company that reduce pollution through technological development (m) is 7, i.e., m > 7. The concordance coefficient χ
2 is then calculated by Formula (12) to obtain a causal variable:
χ
2 calculated value of 26.89 was obtained above the crucial value (equal to 12.5916); as a result, the experts’ opinions are assumed to be coherent, and medium ranks reflect the mutual opinion of them.
In accordance with the Equation (13), the lowest value of the concordance W
min coefficient was calculated where positive W
min = 0.2623 < 0.560, meaning the opinions of all eight experts aligned on the seven main investment values of the transport company, and technological components that reduce pollution through technological development are still considered to be harmonized. The indicators of the components of investment measures of a transport company that reduce pollution during technological development are defined as Q
j. The received data are presented in
Table 5.
According to the report of expert evaluations, the following is the order of importance of the elements of the primary investment measures of the transportation company that reduce pollution during technological advancement:
Alternatives with low-emissions green transport.
The company’s policy prioritizes pollution reduction.
Social accountability.
Automated and connected transportation and the electrification of vehicles.
The analysis of the application of investment measures by transport companies to reduce pollution in their operations reveals a correlation with technological advancement within the company. Currently, the greatest barrier to the use of electric vehicles is the high cost and lack of infrastructure for them.
The Kendall concordance coefficient does not identify experts whose opinions may differ from those of others. Calculating the competence coefficient [
31] using Formulas (3)–(7).
In this respect:
. The sums of the initial values in the columns of
Table 4 are then multiplied by the initial competency coefficient. Group estimates of alternatives (4) and a new matrix for calculating the competence factor were obtained. To calculate the final Kendall expert competence coefficients, the sum of each row of the matrix is divided by lambda (5), the size of which is 2089. It is important to note that the sum of the competence estimates thus calculated must be equal to one. According to the analysis and the obtained results in
Table 6, it can be stated that the 8th and 7th experts have the highest (equal) competence in comparison with all the experts who participated in the survey.
To check that all experts are competent, we calculated according to formula , where is the average of the competence coefficients and s is the standard deviation, and we obtained intervals [0.0935; 0.1565].
The competence of the second expert in this group is the lowest (0.1075), but not so low that the expert assessment should be omitted from the study. In summary, the most experienced experts are those who have been in charge for more than five years, and the highest competence coefficient was 0.1474. Other experts were sufficiently qualified for their evaluations to be considered.
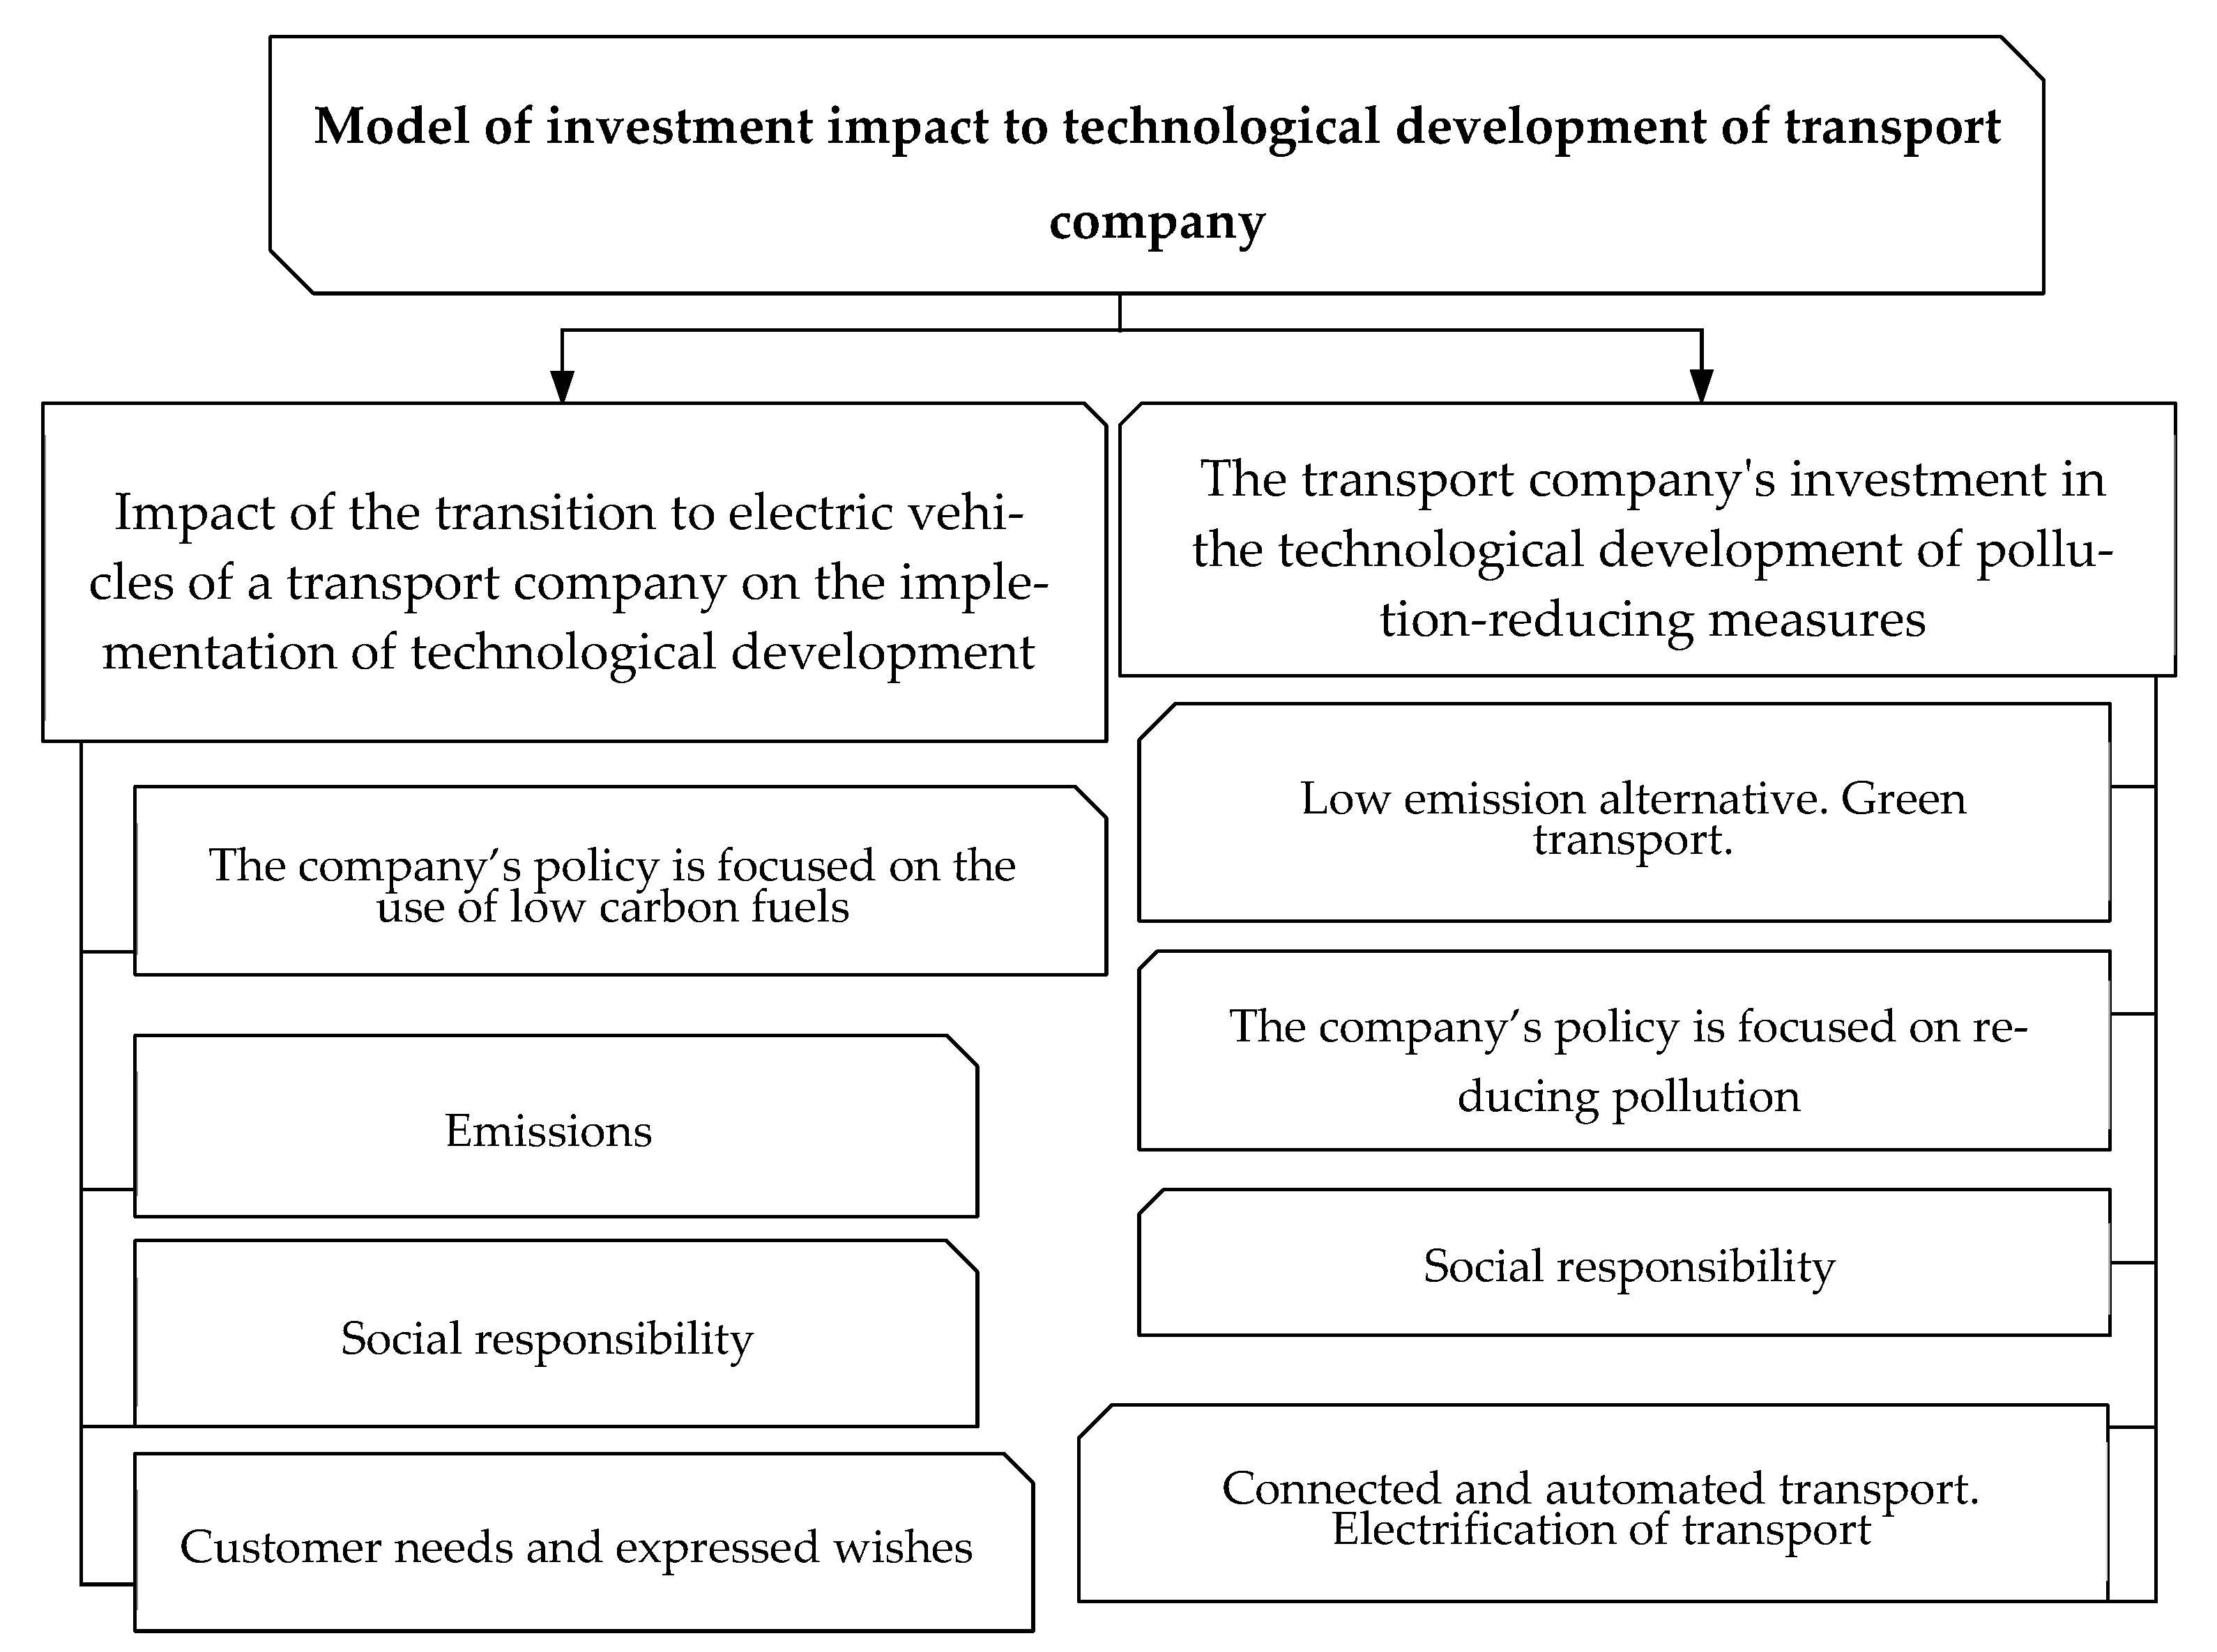
Figure 7 illustrates the impact that implementing technological innovations has on the transition to electric vehicles.
7. Discussion
Considerations from our study on the role of technological development in climate change indicate that its significance must be acknowledged. Insufficient scientific literature exists on this topic. Only in recent decades have scientists paid attention to the relationship between greenhouse gases and climatic warming, known as the “Greenhouse effect.” In spite of the fact that the greenhouse effect occurs naturally and is essential for life on Earth, there is evidence that human activity has significantly amplified this natural process.
Since the pre-industrial era, anthropogenic greenhouse gas (GHG) emissions have increased, primarily due to economic and population growth. Compared to the pre-industrial era, economic and population growth influenced the increase in anthropogenic greenhouse gas (GHG) emissions. Newer vehicles have greater energy efficiency than older ones, and the recent EU regulations on cars and CO
2 emissions, along with other passed legislation, should accelerate these improvements. However, it takes decades for new technologies to permeate the entire vehicle fleet [
4,
7,
32]. Additionally, the anticipated increase in traffic volumes will mitigate the effect of technology. In 2019, Luxemburg had the highest number of passenger cars per 1000 inhabitants, with 681.
An average passenger vehicle emits approximately 4.6 tons of carbon dioxide annually. In general, newer vehicles are more energy efficient than older ones [
6]. Norway has the highest concentration of electric vehicles in the world. Thus, the development of new technologies has a significant impact on greenhouse gas emissions. Li L. and Li W. [
33] argued that the green technology innovation of transportation companies promotes the development of SSC in a direct manner. Transport companies’ technological innovation increased by 1%, while their carbon dioxide emissions decreased by 0.23%. Carbon dioxide emissions can vary depending on a vehicle’s fuel consumption and fuel economy. [
15]. The findings of this article’s authors are an analysis of the relationship between investment in technological development and pollution reduction. According to the evaluations of experts, the components of investment measures in the transportation industry that reduce pollution during technological advancement are crucial. The research has demonstrated, based on the evaluations of experts, the significance of the elements of investment measures in transportation companies that reduce pollution during technological advancement.
Despite the fact that the results of this study are novel and intriguing, there are also some limitations. The generalizability of this study is a limitation. The article examined public opinion by surveying employees of Lithuanian transportation companies.
According to R. Curtale et al. [
34], it is crucial to examine how city municipalities could organize public transportation to reduce the use of private automobiles and to prepare infrastructure for the use of electric vehicles. To this end, it is essential to determine whether the proportion of car owners and their satisfaction with public transportation can impede the implementation of infrastructure for electric car services.
In addition, regarding the psychological aspect of drivers, the adoption of new technologies for the use of more energy-efficient cars and their trust in electric car services that meet the requirements of hygiene standards are being discussed.
Future research should use a method of selecting a probability sample to increase the study’s generalizability by analyzing the effects of motorization on climate change in various nations. Consequently, future studies may incorporate additional moderators, such as electric car prices, infrastructure, people’s expectations, and others.
8. Conclusions
The purpose of the study was to determine the primary factors that influence the selection of transport companies to reduce pollution. Having a set of dependable criteria, it will be possible in the future to use them to encourage other transportation companies to improve their strategy for vehicles using renewable sources of energy in terms of reducing pollution and mitigating climate change.
The relationship between greenhouse gases and climate change has captured the interest of scientists. They analyzed the major contributors to greenhouse gas emissions from the transportation sector [
10] and concluded that technological advancements are the only solution to the climate change problem. Scientists estimate that technological innovations and fuel efficiency have had the greatest impact on CO
2 emissions [
12].
Road vehicles account for the largest portion of general transport emissions (in 2019, they accounted for 72% of all domestic and international transport GHG emissions). In 2019, the average new passenger car sold in Europe emitted 122 grams of carbon dioxide per kilometer. The 2020/21 CO
2 target for the passenger car fleet of the European Union has been set at 96 g per kilometer [
15].
Initially, we analyzed the growth of passenger cars per 1000 inhabitants between old and new EU countries, identifying the highest and lowest rates of motorization growth and comparing them with total greenhouse gas emissions per EU country. The interaction between the improved management of a transportation company and its technological advancement was evaluated using a defined hypothesis and quantitative research methodology. Experts were tasked with evaluating the primary factors that determine the technological development effectiveness of the selected transport company of Lithuania’s transition to electric vehicle development measures.
Based on expert evaluations and calculations, the relative importance of the components of the primary investment measures of the transportation company that reduce pollution during technological development was determined.
Lastly, the hypothesis was validated. According to the evaluations of experts, a model was developed based on an analysis of the application of investment measures by transport companies to reduce pollution in the company’s operations. This analysis reveals a correlation between the technological development applied in the company and the investment measures.
The limitations of the current research may serve as a guide for future investigations. The generalizability of this study is a limitation. Using data collected from employees of Lithuanian transportation companies, this article examined employee perceptions. Future research should employ a method of selecting a probability sample to increase the study’s generalizability by analyzing the effects of motorization on climate change in various countries. Future research must examine how city governments could organize public transportation to reduce the use of private cars and prepare infrastructure for the use of electric vehicles. Adoption of new technologies for the use of more energy-efficient automobiles and their trust in electric car services that meet hygiene requirements.


