1. Introduction
Relevance of this topic is associated with the need to understand the shifts in the manufacturing business markets of recent years, the new economic and business organization challenges they have recognized, the directionality of the most recent changes, which are increasingly manifested in a broader impact on business processes, their efficiency, and, finally, increasing the sustainability of the economic competitiveness of business entities, in the presence of a distorted market environment. Therefore, the novelty of this topic can be characterized by the need to create, on the basis of scientific research, a multi-criteria evaluation methodology of the factors that encourage the competitiveness of manufacturing companies to achieve a sustainable economy and the obstacles to economic competitiveness, allowing for the evaluation of the conditions of the competitiveness of the sustainable market and the competitive position of the participants, thereby facilitating the creation of a competitive environment.
This article focuses on the concentration impact in market competition, one of the most significant instruments for studying and assessing competition issues in order to balance worldwide corporate competitiveness. Unfortunately, research on the impacts of concentration in the manufacturing sector is inadequate, and the factors that define concentration in a distorted market are treated differently. Analysis of market dominance [
1,
2,
3,
4] proved the significance of concentration factors description in assessing the concentration of the manufacturing market and its effect on competition; it can be stated that market concentration description is a necessary component for determining the manufacturing market power of business entities in distorted markets and their impact on competition. Sustainability in the manufacturing industry refers to a company’s ability to continue operations over the long term [
5]. A manufacturing business must be able to ensure that it will have appropriate resources, labor, and consumers for its products well into the distant future in order to remain economically viable. At this time, the impact of market concentration on competition is significant.
For a preliminary appraisal of the extent of competition on a specific market, competition agencies rely on the imperfect indicator of market concentration [
4]. Due to the ambiguous relationship between market structure and competition intensity in a specific market, this is done with caution. Likewise, it will likely be impractical to assess changes in the competitiveness of an industry or the economy as a whole in order to determine the real intensity of competition. This can be demonstrated by examining the reference point as the general market concentration or industrial concentration measurements. However, if market concentration is a poor measure of competition intensity, it is even less apparent what industry concentration can tell us about competition intensity in that industry [
5].
Analysis conducted on the concept of market power uncovered the significance of market concentration factors in assessing the concentration of manufacturing businesses and their effect on competition. It might be argued that market concentration considerations are essential for establishing the market power of distorted manufacturing market business entities and their impact on competition. Market concentration factors have been integrated into competition law to aid competition authorities in assessing manufacturing market dominance, allowing them to determine anticompetitive implications and enforce competition law [
6]. This instrument was created in answer to the question of the presence, formation, and consolidation of market power in a historical context, with a specific vision of existing competition issues and how they should be studied. This article provides an overview of the market concept, its significance for assessing market concentration and its effect on competition, the intensity of competition restrictions faced by manufacturing companies, and an analysis of the extent to which market concentration factors are integral to the law. This study contributes to the corpus of knowledge by revealing that market concentration factors in corporate competition may vary across countries.
Fuzzy VIKOR (VlseKriterijuska Optimizacija I Komoromisno Resenje) is a commonly used decision-making technique; under the fuzzy VIKOR decision-making paradigm, all decision-makers use the same evaluation criteria to all schemes [
7]. This paper proposes a fuzzy VIKOR-based decision-making model and applies it to the selection of a firm in a competitive manufacturing setting in order to assess the opinions of all decision-makers and obtain the ideal response in less time. This paper presents a decision-making model based on fuzzy VIKOR that enables diverse decision-makers to evaluate all schemes based on diverse evaluation criterion systems. This study provides a decision-making paradigm that effectively avoids making decisions based on the same set of criteria. Moreover, because the coefficient of selection mechanism, the weight of decision-making, and the weight of assessment criteria are not sensitive in this decision-making model, the decision results are quite stable. This paper suggests an approach to decision-making that can provide the best possible outcome while avoiding inferior choices. In this study, the fuzzy VIKOR approach to problem-solving was used to evaluate the concentration of enterprises that influence the economic environment’s competitiveness. For 2016–2021, 15 economic performance metrics from 18 manufacturing companies in Lithuania and Slovenia were selected for analysis. Due to the variety of factors addressed in the competition issues, a multi-criteria analysis was conducted with the assistance of specialists.
Regardless of the study methodology, the market definition may significantly influence the results. If the fundamental concept of the topic under consideration is misunderstood, it may be hard to achieve the desired outcomes. Even if the object is fully comprehended, adequate evaluation methods are required, and we plan to apply a multi-criteria approach for this goal. This study will attempt to address the following issues:
What significance do market concentration variables play in evaluating market competitiveness in the manufacturing sector?
What are the different methodologies for assessing manufacturing sector competition?
Is it possible to estimate the degree of market concentration in the manufacturing sector using the fuzzy multicriteria method?
The purpose of this paper is to investigate the viability of evaluating the HHI in the implementation of business strategies to avoid market distortions in the manufacturing sector.
Consequently, the critical study and evaluation of the elements encouraging sustainable economy and limiting economic competitiveness in manufacturing businesses would be a new and significant field of scientific research in economics and management.
It is anticipated that manufacturing businesses and society will benefit from the project’s study findings. The operation of production companies in the least distorted market can be significant for enhancing competitiveness not only at the national level, but also at the international level, particularly by enhancing reputation, reducing costs, responding to market demands, and adapting to market demands. The results will be relevant for policymakers responsible for regulating market distortions and fostering sustainable economic projects.
Examining the key economic factors of the manufacturing market, this article is novel since it describes the capabilities of the fuzzy VIKOR method for evaluating the HHI in order to prevent market distortion. This study contributes to the development of the HHI evaluation system in the manufacturing sector, identifies the market condition of the business entity, and assists in achieving sustainable market competition.
In the empirical portion, the model was implemented and assessed in an effort to facilitate the formulation of firm strategies based on market concentration estimates. The manufacturing sector was utilized to test the fuzzy VIKOR model. The model was utilized to examine market concentration, make strategic decisions, and evaluate market concentration. Due to the high number of issues addressed by the competition problems, a multi-criteria analysis was performed with the assistance of experts. Two of the five ideas were finally selected as the most suitable. Unfortunately, the performance of the remaining three options was inadequate. The robustness of the solution derived from this model was assessed, rendering it scientific and capable of avoiding suboptimal outcomes. In conclusion, the model described here is quite scientific and robust, and it may be utilized to pick a strategy for constructing a manufacturing-sector business plan in order to get the optimal outcome.
There is a shortage of methods that can evaluate the concentration of business entities in the manufacturing sector, which affects the manufacturing sector’s competitiveness and sustainability.
The following tasks have been assigned in
Figure 1 to address the research challenge.
Further, we will examine the methods for determining the effect of concentration factors on competition, as well as their practical application.
2. Means of Assessing the Effect of the Concentration Factors on Competition
Methods for evaluating the influence of concentration parameters on competitiveness and the use of these methods [
1,
2,
3,
4,
5,
6,
7,
8,
9,
10,
11]. In rare situations, however, industrial market mergers can result in dominant market dynamics that have a negative influence on consumer welfare and market equilibrium. The macroeconomic picture of concentration is one of the most crucial factors to consider when evaluating a competitive manufacturing market. In this regard, Su and Dresner [
12] describe the theoretical and practical issues of taxation and commission income in the European Union. Return on average capital, gross domestic product, and operational income are crucial factors that contribute to the viability of operations and strategies for some low-cost businesses. Regarding the reaction to monetary shocks and lending channels, Tsoulfidis [
13] describe the function of competition in selected ASEAN nations. Werden et al. [
14] investigates a set of variables, characterized by system concentration and unemployment in developing countries. Yeh and Liao [
15] demonstrates the impact of credit pooling on loans and market concentration in emerging nations. Yung and Nguyen [
16] examines FDI and the influence of cross-border entrepreneurship on market concentration and competition. Zhang et al. [
17] reflect the connection between concentration and transparency in risk disclosure regulations. In contemporary literature, competition and concentration studies are understudied. Existing research focuses on a variety of issues relating to risk management, business strategies, constraints, remittances, efficiency, pricing, unemployment, volatility, inter-national and local markets, transparency, and industrial growth, although the majority of studies focus on macroeconomic variables affecting competition and concentration. Typically, the survey variables consist of assets, loans, deposits, equity, operational revenue, and costs. The Competition Council adopts a resolution after examining the supplied papers and the markets impacted by the concentration [
18]:
- (1)
allow the concentration to be implemented;
- (2)
allow the concentration to be implemented in accordance with the conditions and obligations for the implementation of the concentration established by the Competition Council so as not to create or strengthen a dominant position or significantly restrict competition in the manufacturing market;
- (3)
do not allow the concentration to be implemented. It will not be permitted if it results in the establishment of a dominating position in manufacturing markets or if there are clear indicators that such behavior may restrict competition.
The development of retail chains is not constrained in any way. According to the concept of unconstrained economic activity, every business has a natural growth potential. And organic expansion ensures the manufacturing company functions efficiently and succeeds in the market [
18]. If the government monopolizes the market, economic activities may be restricted. If the natural expansion of retail chains is restricted, the answer is difficult. Merger models have been applied in antitrust studies for close to twenty years. The merger model is an oligopoly model whose non-cooperative Nash equilibrium is calibrated to resemble observed industry prices and quantities; the merger’s effects are modeled by calculating the new non-cooperative Nash equilibrium prices and quantities [
19]. The effect of a unilateral merger is characterized by the equilibrium between pre-merger and post-merger price and quantity disparities.
There is a connection between merger models and price pressure indices, although they differ in numerous significant ways [
20]:
First, price pressure indices only show whether a merger can result in price rises if merger models predict the magnitude of price increases. When price pressure indicators are paired with the demand function or bandswidth coefficient, it is possible to evaluate the magnitude of price rises.
Second, price pressure indices are based on the premise that non-merging companies do not react to any changes in the pricing of the merged entity, i.e., there is no equilibrium method when in the merger model the reactions of non-merging rivals are clearly accounted for. A balanced strategy is utilized here.
Thirdly, merger modeling is a far more versatile tool than price pressure indices, since it permits the evaluation of the competitive actions of combined businesses in more dimensions than simply price and quantity.
In addition, the model may incorporate competition responses, such as product change, market entrance, or market exit. In addition to examining different forms of competition, such as in Cournot-type markets, merger modeling may also be used to mimic auctions [
17,
18,
19]. In addition, merger modeling can be used to analyze the effects of diverse policies, such as partial transfers. For full merger modeling, a great deal of data is necessary. To explain consumer demand behavior, demand systems must be evaluated economically, or assumptions must be made; the final description should be as close as possible to the observed consumer demand behavior. On the basis of the data, the model must be calibrated, and the supply must be integrated, i.e., assumptions about the competitive process and the pricing functions of businesses must be formed. Before the final post-merger balance is computed, the model’s internal and external sufficiency and consistency must be validated using current and historical industry data. This suggests that comprehensive merger modeling is a time-consuming and difficult endeavor that must be based on market data. Therefore, it is essential to do a comprehensive merger investigation when early inspections suggest a possibility for a major competition issue. Merger modeling study cannot be viewed as an alternative to or replacement for market definition, since it just serves as a basic initial impression, thus we will not analyze them further [
20]. Similar to the case of pricing pressure, the question arises as to whether or not a streamlined version of a merger model can serve as the initial diagnostic test. Although there appears to be a fundamental difference between price pressure indices and full-fledged merger modeling—a gap exists between the band-width rates—a typical equilibrium technique is rejected for merger models, allowing rivals’ prices to remain unchanged. The reason for this is that the bandwidth ratio in the merger model is indirectly controlled by the selection of the demand system and is thus identical to the bandwidth generated from the backdrop of rising price pressure indices as long as the primary demand function remains unchanged [
19,
20].
Pollitt and Dale [
20] suggests two simulations, one with a linear function and the other with an isoelastic demand function, to identify the bottom and upper bounds of price increases by simulating mergers according to the recognized demand system and simultaneously calculating the throughput rate. As he explains, the product pricing of asymmetric enterprises can fluctuate. He suggests that a price increase should be considered in terms of market share, and that concern should only be expressed if the average price of products must increase. This demonstrates that basic merger patterns and pricing pressure indices are equivalent. Therefore, merger models may supplant or supplement market definition. In the case of similarly differentiated products, market share information can be linked with information on margins and aggregate demand elasticity, which may lead to better results than using market share information alone. For the sake of simplicity, it is not anticipated that these models can analyze the impact of merger pricing with precision. However, they may be valuable as a signal of mergers that require closer examination.
When assessing circumstances of abuse of dominance under EU law, the significance of defining a market serves a twofold purpose: it is used to determine if a corporation has significant market power, i.e., a dominant position or monopoly. In examining the conduct of enterprises in light of the market definition, market shares are studied if a company is deemed to have a dominating market position or significant market power [
20]. Under EU competition law, a corporation is considered to have a dominant position if it has the power to impede effective competition on the relevant market by acting in a manner that disregards competitors, customers, and ultimately consumers. Dominant position or monopolistic power is not unlawful in and of itself if superior items are developed or if rivals simply surpass rivals through other permissible ways [
21]. Nonetheless, powerful firms typically have more resources to abuse their market dominance and remove competitors. In addition, the duration of a dominant position or monopolistic power must be evaluated in light of market entry and development restrictions, as well as the buying power of competing firms. If, for example, entry barriers are low and smaller businesses are able to increase their supply, dominance may not be sustainable, and attempts to increase prices above competitive levels would be ineffective.
The HHI is often used to analyze mergers in competitive industries [
17,
19]. Measuring the concentration of the manufacturing sector’s market is essential to comprehending the extent of diversification and systemic risk. The impact of the market on the performance of a merger should be measured by a concentration index. HHI was developed to assess diversification. Regulators frequently utilize HHI to examine the effect of concentration on competitiveness and hidden behavior. HHI allows one to comprehend the structure of disagreement and competitive behavior. HHI determines the degree of market concentration and its geographic location. It is based on the sum and square of market share. Determine the values of the indexes: HHI 0.1: the market is not concentrated. HHI = 0.1–0.18; fairly concentrated. HHI > 0.18 indicates a highly concentrated market. Predictions are not possible with HHI, which is its major weakness. It is difficult to establish the size of the market because it fluctuates so frequently. If the number of manufacturing sector participants and their market shares are known, predictions can be made. All organizations should be included in the computation of the HHI, and the lack of information regarding extremely tiny businesses may be inconsequential because it does not have a substantial impact on the conclusion [
21].
Market concentration and HHI developments are not always accurate indicators of (possible) detrimental effects on the competitiveness of the manufacturing industry [
21]. This is particularly true for competitive markets with diverse products, where closeness to competitors is more important than concentration level and change. In instances of abuse, defining the relevant market is especially difficult since it is closely tied to the theory of damage, where it is essential to determine whether the analysis is scarce retroactively. In addition, there is frequently no correlation between market share and the specific effects of a company’s operations on the competition. As a result, new metrics have been developed that, under certain circumstances, offer a more exact evaluation of the effects of competition than a concentration-based method. Diverse price pressure indices have been established, which may more effectively describe mergers in diverse product markets than the market definition/market share method, which typically provides poor results since it disregards competition intensity. In recent years, there has been a growing concern regarding the development of less competitive and more centralized global industrial markets. This is typically associated with the increasing digitalization and globalization of many markets and the enterprises operating within them [
16,
19,
20]. In other instances, increasing concentration led to claims of slack antitrust law enforcement or overzealous regulation. Despite all of its disadvantages, concentration ratios continue to be a reason for concern, as numerous indications point to an average increase in manufacturing market dominance. This encouraged even modest professionals to monitor the implementation of massive mergers and increase their sensitivity to out-of-the-ordinary conduct. However, it remains unclear what exactly influences the expansion of market power.
3. The Importance of Defining the Elements of Market Concentration in Order to Assess Its Impact on Market Competition
To determine if a manufacturing business maintains a dominating position or monopolistic power, its market share must be considered, and the relevant market must be defined [
21]. As previously noted, when anticompetitive outcomes are suspected, demonstrating market dominance, and defining the market entails a change in market definition. In the majority of studies, the efficiency of the identified factors is prioritized over a scientific approach to concentration and competition. Using data packet analysis, Qiu [
22] investigate the effect of market concentration for efficiency.
Recent scholarship on globalization, systemic risk, and crises focuses extensively on competitiveness and concentration [
22,
23,
24,
25]. Lee and Sung [
26] evaluate credit portfolio concentration in light of systemic risks in several industries. In the suggested model, nonperforming loans, assets, loan-to-deposit ratios, the equity ratio, and highly concentration-related systemic risks are identified. According to Lee and Sung [
26], the pre-crisis sector had a negligible impact on concentration under monopolistic competition. Li et al. [
27] explain the links between income volatility, scale, and concentration in the manufacturing sector. Marshall et al. [
28] depict the competitive market circumstances in regional, national, and global manufacturing industries. Moul and Miller [
29] investigate the connection between market concentration, risk-taking and BRIC performance.
Regarding the anticompetitive effects, if the dominant firm is already abusing its position in the manufacturing market, raising the price above the competitive level, i.e., if competitive harm has already been done, makes it difficult to define the market because a new price must be set to evaluate HMT [
29]. Otherwise, product replacement would be valued beyond the level of competition, markets would be defined too broadly, and the firm’s market share would be underestimated. In cases of future damage, however, the examination would focus on the effects of the allegedly anti-competitive behavior in the future, and the existing pre-vailing price should be considered when defining the relevant market. When a company’s market share in the EU hits 40 to 50 percent, it is sometimes considered dominant. In Germany, the restrictions are far lower, as a corporation is deemed dominant if its market share exceeds 33 percent. Considered that corporations whose market share surpasses certain criteria, i.e., they are dominant firms, have a “particular obligation to prevent such conduct that would be damaging to undistorted competition in the common market”.
Certain sorts of conduct, such as loyalty discounts, lower-than-variable rates, price discrimination, etc., are illegal for some businesses [
29,
30]. In the majority of instances, a comprehensive analysis of the ramifications of this activity was judged unnecessary, and illegality determinations were primarily based on practice cases. This strategy is premised on the assumption that a dominant company’s anti-competitive practices cannot be avoided. Therefore, dominance was handled as a binary variable—if the market share above the threshold, the firm has a dominant position; otherwise, it has no substantial market power, and its practices have no anticompetitive impact.
In the meanwhile, the approach to Article 102 of the Treaty on the Functioning of the European Union has shifted and an evaluation of abusive behavior for determining dominance has been developed [
30]. However, dominance is dependent on the extent of exposure to particular techniques, which can vary significantly based on the enterprise’s market power. For example, firms with a 50% market share have different effects on competitors and customers than firms with a 90% market share. With a dominant position, the company’s market strength is proportional to the potential and incentives for abuse. In rare instances, a company with a market share of less than 50 percent may also possess significant market domination. In certain markets, but not all, structural indicators, which are usually evidence of “dominance”, can be used to determine market power [
28,
29,
30]. In a market where these signs are insufficient to assess a company’s power to inflict mistreatment on others, it is conceivable that the involvement of competition authorities under standard methods would be inappropriate, too stringent in some circumstances, or excessively lax in others. Consequently, a simple market share criterion to determine whether a company occupies a dominant position or has monopolistic power does not appear to be adequate to solve the problem of dominance. The EU implicitly acknowledges the significance of market power in terms of dominance through the concept of “hyper dominance”, which refers to extraordinarily huge market shares that are close to monopoly. This indicates that market definition/market share alone is insufficient to determine market dominance or monopolistic power. Large market share may be the most significant signal, but other factors, such as market entry, supply expansion, alternatives, competitive supply of replacements, and countervailing buyer power, must also be considered. Direct market power measurement is accessible as an alternative to indirect dominance or the assessment of monopolistic power. Typically, it is challenging to detect direct evaluation of manufacturing market power, examine the elasticity of the (residual) demand function, or study a company’s profitability to determine if a competitive surplus has been generated.
It is not likely to be an accurate or trustworthy substitute for the conventional method of defining the relevant market and then analyzing market shares and market access conditions to establish if a business has monopolistic power [
30]. Therefore, it is problematic to consider market definition and market share as indicators of the impact of a company’s practices on competition. There may be a correlation between market share and the influence of business practices in some circumstances. For instance, a company’s reluctance to finish a contract with a 35 percent market share would typically have less of an effect than if it dominated the market. However, certain business operations frequently have both pro- and anti-competitive effects, and which effect prevails depending on the circumstances. For example, a dominant company may utilize rebates as a strategy to eliminate competitors by generating a suction effect, which reduces competition demand. On the other hand, the same discount might be a result of an incentive system designed to provide effective sales preconditions for a firm that manufactures things for retail. Therefore, the economic impact does not depend on the amount of the market share, but rather on the features of the market where this approach is employed, and market share is a poor predictor of the influence on competition. A method focused on the economic impact of the activity seems more acceptable. Relevant markets and market share definitions provide vital information for determining dominance or monopolistic power. However, such information is inadequate to establish the existence of a dominant position or monopoly; it must be complemented with additional signals, such as the availability of substitutes, barriers to entrance, etc., in order to appropriately assess dominance or monopolistic power. Regarding the evaluation of the economic effect of company operations, market share values are not predetermined. A “direct impact technique” has been offered as an alternative to indirectly analyzing monopolistic strength or dominance by identifying the relevant market, quantifying market shares, and combining it with information on market specifics. The direct exposure method allows you to bypass the market definition analysis stage and deduce the existence of market dominance based on the obviously abusive direct behavior. “If it can be demonstrated that the dominant firm’s conduct is anti-competitive, it is permissible to rely solely on that evidence and abandon the market definition requirement entirely in the European context, where it was first proposed an integrated two-step procedure for defining the relevant market in order to assess dominance and combining the economic consequences of the practice into a single unified methodology. The Economic Advisory Group on Competition Policy (EAGCP) of DG Competition has advocated a similar strategy [
30]: “If the effect is founded on consistent and verified reports of considerable competitive harm, this is proof of dominance in and of itself”. Traditional ways of assessing “dominance” rely on market structure knowledge, which is a chance to exert control and inflict abuses on other market players. It is evidence of dominance if the effect is justifiable based on a consistent and verifiable evaluation defining severe competitive damage. Traditional methods of defining “dominance” using market structure data are only preconditions for determining “dominance” in any scenario, which is the potential to exercise authority and inflict abuses on other market participants. A persuasive tactic based on a conceptual approach to effect may raise legal difficulties in practice.
Whether the direct effect method, abandoning the market definition entirely, will be a viable alternative to assess the indirect approach of dominance, based on market definition and market share assessments, depends on whether an abuse can be identified, whether the evidence is sufficient, and whether it can be interpreted differently if there is direct evidence of anti-competitive effects than it could be using the market definition. This is entirely possible in a number of markets due to the existence of robust competitive dynamics that enable the survival and expansion of dominant manufacturing companies. Concentration is a technique for evaluating market structure. This may be a valuable tool for analyzing the possible consequences of a specific activity or merger, as well as the efficacy of competition policy as a whole in protecting and fostering competition throughout the economy [
31]. In the first instance, market concentration (market concentration) of various enterprises, activities, capacities, or value components may be an imprecise measure of the intensity of competition on a well-defined market. For a homogeneous product, for example, a simple technique of characterizing the effect may be offered when a prospective merger is anticipated to have an effect on the level of competition on the relevant market. As a result, it is widely used as a screening technique to identify mergers or markets that need further investigation. In the second scenario, it may be used to derive imperfect assessments of the competitive intensity of industries and economies. For instance, researchers can aggregate market concentration indicators over a whole industry or economy, or calculate the manufacturing industry’s or economy’s proportion of activity or value. Opportunity to properly measure, track, and compare the competitive intensity of the economy or business would give a comprehensive picture that would be extremely beneficial and comprehensible to policymakers who are interested in determining how competitive their market economy or sector is. Nevertheless, this is typically not practicable. To comprehend the genuine degree of industrial or economic competition, we must assess the competitive restrictions of every manufacturing organization. Modern competition analysis measures market power in terms of the responsiveness of demand to changes in the value of a firm’s supply, hence determining the firm’s motive to compete. In order to appreciate the scope and intensity of market competition, a complex and time-consuming economic analysis is required.
For a preliminary evaluation of the level of competition in a specific market, competition agencies sometimes depend on the imperfect indicator of market concentration. This is done with caution due to the uncertain link between market structure and competition intensity in a given market. Similarly, it will likely be impracticable to measure changes in the competitiveness of a sector or the economy as a whole in order to gauge the genuine intensity of competition. This can be shown by analyzing the reference point as the general market concentration or industrial concentration data. Nonetheless, if market concentration is an unreliable indicator of competition intensity, it is even less clear what industry concentration may tell us about competition intensity in that business [
31]. For example, it may reflect the degree of additionality between the numerous markets included by the definition of this industry. To assess if competition intensity has changed in a sector or the economy as a whole, it is required to study not only concentration measurements but also other imprecise indications of competition intensity. For instance, without a common market concentration or industry concentration, measuring instruments, we should also consider changes in production, price, markup, and profit of industrial or economic enterprises and attempt to determine the extent to which these changes are attributable to the intensity of competition (rather than changes in other factors). There are several methods for measuring concentration [
31]:
In what entity are the components to be measured?
Which components make up the entity?
How is the concentration of these components measured?
The first question in estimating market share is which unit to employ; activity, capacity, or revenue are all possible alternatives. If market-level concentration measures are to be linked at the industrial or economic level, the choice may rely on the nature of competition in each market and need not be identical across all markets. If, however, concentration is to be calculated throughout the entire sector or economy, the proportion of revenue or value must be used, exactly as it is when computing the GDP. Calculating which entity’s market share is the second question. A specific market would be desirable for hypothetical monopolist testing. Even so, the relevant market may vary depending on the test’s beginning point, resulting in asymmetric markets. Even if it were possible to define tens of millions of relevant markets, which is not the case, this would not always be the case. However, mistakes caused by disregarding asymmetries will be minor compared to those caused by too consolidated markets [
32]. Consequently, the computation of market share using administrative market definitions may be a far more realistic option, albeit if understood in isolation it may incur substantial mistake costs. These administratively designated market concentration metrics can be noted. These measurements would also be susceptible to the same difficulties as estimating the proportions of administratively designated industries, particularly in the case of arbitrary definitions that do not account for substitutability. This will further diminish the already low ratio between market share concentration and competition intensity on the relevant market. As a result, assessing market shares using administrative market definitions can be a more accurate approach, but it might be costly if read in isolation due to the possibility of inaccuracy. Economic operators engage in competition for market share in pursuit of predetermined objectives. Generally, competition among producers, sellers, and other providers of goods and services is advantageous since it benefits consumers. In most situations, individuals sense the benefits of having wider access to cheaper, higher-quality products [
32]. Various market types (perfect competition, monopoly competition, oligopoly, monopoly) are determined by the level of competition on the market. Each market type is characterized by a distinct behavior of economic entities. Consequently, the most advantageous market for the buyer is the one with perfect competition. However, this derivation is more theoretical and seldom occurs in practice. As with monopoly, perfect competition is only an economic model. Research typically defines market concentration as the combination of the biggest market shares held by enterprises [
32]. A market is more concentrated, and hence less competitive, when there are fewer firms and they are larger. The smaller the market share of the major corporations, the more the market rivalry, indicating that price strategy has a greater impact on demand [
33]. When competing with other manufacturers, a large corporation has certain benefits over a small one.
Primarily, it is a large-scale production economy. Due to the advantages larger corporations have over smaller ones, businesses are expanding. Converged companies are able to outcompete competitors. Consequently, the overall number of enterprises in the sector may decrease, and the relative weight of a single company’s production on the market may increase, resulting in greater market power and a greater potential to influence price. As costs increase, consumers will consume less of the proposed product, with some abandoning it entirely. According to Hou and Xu [
33], market power should not be stressed, and competition policy should not oppose the domination of enterprises, if such a scenario is established via successful investment, product development, etc.
The focus of competition regulators should be on corporations that abuse their position [
34]. This event should not be considered unfavorably if the company’s current market concentration does not create or strengthen a dominant position that inhibits competition on the market or a segment of the market. Vice versa—if the concentration generates or strengthens a dominant position, it impedes effective competition—it should be declared incompatible with the common market [
35] if this occurs. Concentration control is implemented to limit the expansion of market dominance, which hinders effective competition.
The compatibility of a concentration with the common market is assessed by determining whether or not the concentration restricts effective competition. The evaluation is carried out by defining the market and calculating the market shares of competing companies. Prior to conducting a complete review of the concentration [
36], the consumer benefits and economic viability must be explained. In order to determine the effects of a concentration on competition, the market is defined. This is crucial information regarding market concentration and buyer influence. During the examination, emphasis is placed on demand-side and supply-side substitutability—if the customer may pick product alternatives and how quickly and risk-free providers can replace the product with suitable substitutes.
A necessary condition is to define the market as narrowly as possible so that enterprises’ market shares are not underestimated. To establish the compatibility of the concentration with the common market, it is also necessary to assess consumer and rival attitudes, trade flows, and market entry barriers [
37]. Absolute and relative concentration measurement indices are typically utilized to evaluate market concentration. Absolute concentration indices are suitable for measuring the number and size of businesses in a market, whereas relative concentration indices are suitable for evaluating differences in the size of enterprises operating in an industry. Market concentration has negative implications. It can expand as manufacturing efficiency rises. Nonetheless, when market concentration is severe, huge corporations utilize their economic power to stifle competition and have substantial sway over political choices. Therefore, it is vital to establish norms that prohibit economic operators from allowing excessive concentration. Also, after analyzing the scientific literature [
37,
38,
39,
40,
41,
42], it is vital to develop pertinent ideas for future use:
Competition—one of the essential elements of economic policy, the foundation for the proper operation of the market, and the guarantor of economic progress in the country.
Active competition increases the quality of goods and services, innovation, and technological progress, which in turn decreases prices and increases consumer prosperity [
42]. It is crucial, therefore, that the state create a conducive environment for the growth of competition, give adequate consideration to the formulation of competition policy, establish clear objectives and priorities, and allocate the Competition Council’s limited resources to the most important competition issues. The following merger definitions will be utilized in our next assessment of bargaining power balance.
Competitors are economic entities that face or expect to face competition on the same relevant market.
Dominant position—the position of one or more operators in the relevant market when not directly confronted by competition or which permits them to exert a unilaterally restrictive impact on the relevant market. In the absence of contrary evidence, it is believed that the firm holds a dominant position on the relevant market if its market share is at least 40 percent [
42]. Unless otherwise demonstrated, each of the three or fewer operators having the biggest market shares on the relevant market must be regarded to have participated jointly in holding a dominating position on the market.
Market share is the ratio of the amount purchased or sold by an entity or group of affiliated entities to the total quantity purchased or sold in a given market.
Concentration is:
- (1)
A merger of one or more economic operators that cease activities as independent operators and an entity that continues to operate, or the development of a new firm from two or more enterprises that cease operations as separate operators.
- (2)
Acquisition of control, where the same natural person or persons have control of one or more economic operators or the entity or entities, acting under an agreement, jointly establish a new entity or acquire control of another entity by acquiring a portion of an enterprise, all or a portion of an undertaking’s assets, shares or other securities, voting rights, concluding contracts, or otherwise.
In light of the review of the scientific literature in this chapter, which examines the effects of a concentration on competition, its assessment tools, and their application practices, it can be stated that EU competition authorities and other institutions use a variety of concentration indices to determine the market power of business entities; accordingly, the following section will discuss the application of multi-criteria methods in the manufacturing sector.
4. Implementation of Multi-Criteria Methods in Manufacturing Sector
Many MCDM techniques are utilized effectively to handle numerous decision-making issues in various study fields. These techniques are appropriate for studying industrial market dominance in a market economy with distortions. These methods permit the consideration of expert opinion, but can also be used to assess the relationship between several criteria. Some of the most well-known MCDM approaches, such as AHP and TOPSIS, are only capable of identifying linear correlations between decision-making components. In fact, it was inadequate to evaluate the link between criterion and sub-criteria in a linear fashion, ignoring any interactions or interdependencies. Therefore, academics have begun to construct holistic methods that take into account the interrelationships between parts of decision-making. Methods such as ANP, DEMATEL, ISM, Fuzzy tools and integrals, and IBA are explored. The analytic network process (ANP) is a more generalized version of the analytic hierarchy process (AHP) that is utilized in multi-criteria decision analysis. AHP organizes a decision problem as a hierarchy comprised of a goal, decision criteria, and options, whereas ANP organizes it as a network. Then, both employ a set of pairwise comparisons to quantify the weights of the structure’s components and, lastly, to rank the decision’s possibilities. Commonly, the DEMATEL approach is used to establish a cause-and-effect relationship between the dependent variables. This method is preferable to standard methods since it reveals interfaces between criteria. Based on the nature of the relationship, the criteria are evaluated according to the severity of their mutual impacts. Inasmuch as a single methodology is insufficient to identify occupational risks in the midst of uncertainty and ambiguity, an integrated strategy is required to address the issue at hand. Interpretive structural modelling (ISM): The ISM learning process is participatory. In this method, a variety of directly and indirectly related elements are arranged into a comprehensive systemic model. This model depicts the structure of a complex issue or problem in a meticulously crafted pattern that includes both images and text. Therefore, fuzzy linguistic modeling is used to represent and process flexible information. The investigation of the proposed approaches demonstrates that they yield more trustworthy findings when analyzing the aggregation of criteria as a nonlinear structure whose parts are interdependent. When designing complicated decision-making models, the majority of MCDM techniques saw criteria as separate pieces. In many complicated solutions to real-world situations, however, there exist interdependencies and relationships between the criteria. In addition, a variety of circumstances outside the decision-making system and outside the decision-control maker’s might alter the significance of the criterion for appropriate action. Traditional MADM ranks possibilities in order to determine the optimal solution. However, Simon, who was given the Nobel Prize in Economics in 1978, stated that decision-making did not adhere to “rational man” postulates [
43]. People do not solve issues in the most advantageous manner, but there are “satisfied” who establish aspirational standards that must be met by the choice. People make a choice if they can locate a choice that satisfies their stated degrees of want. Using the new concept, the decision maker creates the target level as a benchmark, which may not be available in the current apple basket. Therefore, decision makers will comprehend the distance between each option and the desired level. Therefore, decision-makers may develop and implement a plan to close the gaps. The current trend in decision-making is to refine the traditional concept of selecting the best option from inferior options. The new idea is that decision-makers should use ambition level as a benchmark and alter the procedure to prevent this issue [
44]. Tzeng created a DEMATEL-based ANP (DANP) model that can account for varied degrees of impact while developing INRM. In this hybrid MCDM model, DEMATEL illustrates a network of impacts between several variables and capture interdependence and feedback dynamics [
45].
The selection of the MCDM technique. To apply the methodology to the industrial market, the authors considered all available applicable method-ologies: rating agency methodologies, statistical methods, subgroup operations, operational research (OR) techniques, and multi-criteria decision-making methods [
46]. Features of the TOPSIS method [
47] led to the selection of this method from a variety of MCDM methods used by various authors in assessing socioeconomic objects [
47]. In the decision-making issue domain, if there are influences/dependencies across criteria that are not offset by AHP, then applying AHP might result in a less optimum solution. In such instances, it is preferable to employ an analytical network technique (ANP). Using ANP, we may model the interdependencies and feedback between decision-making elements and generate a more precise weighting of criteria and local and global alternatives’ priority. Researchers [
47,
48,
49] investigated distorted market economy circumstances in which oligopolies in marketplaces and their features were evaluated using multi-criteria approaches (VS, SAW, KPM (COPRAS), TOPSIS, and VIKOR) and correlated with the HHI index. According to them, oligopoly is characterized by the dominance of a few large firms over the majority of the supply, as well as by barriers to market entry and exit that ensure a constant number of competitors. Due to the substantial interdependence of competing business entities, when the actions of one company directly affect market demand and price and indirectly affect the performance of other companies, each market participant can expect a response from competitors [
50]. Traditionally, oligopoly is an inefficient market structure that is frequently connected with company coordination and cartels [
50]. The fact that manufacturing market cartels are based on businesses’ pursuit of maximum profits by limiting competition among a restricted and reasonably steady set of rivals leads in comparatively cheap costs for monitoring their conclusion and enforcement. Depending on the oligopoly model, commodities or services may be homogenous or differentiated [
50]. In practice, weakly differentiated items generate severe price competition (such as in the mobile telephone services market); goods or services viewed as exclusive or distinctive enable enterprises to anticipate larger earnings and a more secure competitive position in the manufacturing market. In a stagnant or declining market, the enormous size of the company and the considerable sunk costs associated with it (barriers to departure) also contribute to a more active struggle for survival by giving up a share of profits or even operating at a loss. High corporate concentration in an oligopolistic market often provides advantages in negotiations with less concentrated suppliers and distribution channels; nevertheless, continuous analysis of vertically interconnected sectors and appropriate strategic initiatives are required to reap these benefits. Due to the threat posed by future cartel agreements and other types of harmonization, oligopolies deserve special public attention. Moreover, a large number of oligopolistic markets are indirectly regulated by the state; hence, state regulation is undeniably a substantial component of the competitive environment. The peculiarities of oligopolistic market structures indicate that the competitive environment in an oligopolistic market is complex and intricate, attracting the attention of the public and government officials. This justifies the importance of the scientific problem raised and emphasizes the need to employ scientific methods in the study of oligopolistic markets. In the selection of evaluation indicators, determination of their significance, and creation of a scale for measuring qualitative indicators in the development and approval of a multi-criteria assessment model of the competitive environment, the characteristics of an oligopolistic market are utilized. Because it is by definition a complicated and detailed phenomenon, it is necessary to establish a collection of indicators (evaluation criteria) that describe a company’s competitive environment in order to analyze it. Using quantitative criteria, which in the model under development include market development indicators, the number of competing businesses, and the distribution of their market shares, boosts the evaluation’s reliability. A system of criteria must be supplemented by qualitative indicators (such as output differentiation, entry barriers, state control, etc.) notwithstanding their inherent subjectivity in order to provide a comprehensive evaluation of the phenomena in question. The selection of indicator weights is a further critical stage in the development of a multi-criteria evaluation model. At this stage, it is necessary to investigate the impact of selected factors on the phenomenon of interest in sufficient detail. To strengthen the trustworthiness of the conclusions, it is also necessary to strike a balance between the value of quantitative and qualitative indicators. The remaining phases of a multicriteria evaluation are the selection of evaluation methods, calculations, and interpretation of outcomes. Quantitatively diminished criterion is the number of oligopolistic competitors on the market. In an oligopolistic market, several large companies often control the majority of the available supply and establish an oligopoly. In addition, there may be a significant number of smaller businesses with less market power. The minimal quantitative criterion is the number of remaining (non-oligopolistic) businesses.
Market growth in monetary terms (quantitative maximizing criteria) indicates the average yearly increase in market sales in monetary terms. An expanding market offers the organization with extra chances to expand, boost production and sales (mainly as a result of new clients), generate greater profits in the present time, or lay the groundwork for future profit expansion. A mature or declining market, on the other hand, provides the conditions for a fierce competitive struggle, as a company’s revenue can only increase at the expense of its competitors’ sales. Market growth in natural units (quantitative maximum criteria) indicates the average yearly growth rate of the quantity of items sold on the market (or the number of market users). The indicator corresponds with monetary market expansion, although it cannot be identified.
Consideration is given to the correlation between indicators while determining their respective weights. In the analysis of highly concentrated markets, the Herfindahl-Hirschman index was calculated based on the sales data of the majority of market companies, with only a slight deviation from the index calculated with the participation of all market participants, as its significance is most strongly influenced by the largest business entities. The sale of smaller companies will have a negligible impact on the indicator’s value.
Barriers to entry (qualitative maximizing criterion): Higher barriers to entry reduce the probability of entry for new market participants, create a more stable and predictable competitive environment, and permit the formation and maintenance of “rules of the game” acceptable barriers to market entrants.
Leave the market (qualitative minimized criterion). Lower exit barriers are associated with moderate competition in the context of steady or declining demand.
Specialization of output (qualitative maximizing criterion). The need for consumers to purchase a variety of products motivates businesses to improve their quality, advertise their goods and services, and increase their value to consumers, while providing opportunities to anticipate higher profits and ensuring the dependable protection of their competitive positions.
Market segmentation (qualitative maximizing criterion). The presence of market segments creates the circumstances for the formation and maintenance of more solid competitive positions, which in some cases determines the success of smaller market participants.
Supplier market dominance (qualitative minimized criterion). Weakly concentrated suppliers market enables enterprises in the examined market to get a more advantageous negotiation position and a larger share of the value-added structure of the final product.
Sellers (distribution routes) market concentration (qualitative minimized criterion). The statistic reflects market businesses’ evaluated negotiation positions with distributors of products or services, as well as their impact on market sales and ultimate product pricing.
Potential danger from alternatives (qualitative minimized criterion). The indicator indicates if market sales are influenced by replacements provided in other markets that potentially satisfy consumers’ wants in the investigated market (in some cases, the development of superior, more advanced substitutes not only reduces sales in the analyzed market, but also threatens the very existence of the market).
Development of further markets (qualitative maximizing criterion). Sales in the researched market are stimulated by favorable conditions in tertiary markets (industry).
State regulation is described as state-authorized restrictions on the consumption of products or services, licensing procedures, specific control of market activities, exclusive taxation of items on the examined market, and other measures that have a direct or indirect impact on market sales. Economic processes can be evaluated at three levels: the enterprise, the economic sector, and the state. Reputable international organizations have devised methodology for worldwide comparisons based on competitiveness, innovation, etc.
Despite this, sector comparison remains a nearly unexplored field, since only research on energy consumption efficiency and international trade has been conducted. Appropriate financial indicators reflect the effectiveness and competitiveness of economic sectors at the national level. These indicators, generated from a company’s financial statements, can be used to guarantee that the business is operating properly, completing its obligations, etc. Thus, the aggregated data allowed for the examination of these characteristics at the cross-sectoral level or their sectoral evolution.
The following financial indicators were selected for examination based on expert opinion and correlation analysis: gross profit margin, return on assets, leverage ratio, short-term ratio, receivables turnover ratio, and equity turnover ratio. Clear-cut values are incapable of resolving ambiguities and uncertainties, which fuzzy approaches can resolve. In reality, a single financial measure is insufficient to conduct a full analysis and aid in decision-making. The utilized fuzzy MCDM approaches enable the elimination of uncertainties and ambiguities typical of company performance analysis. Due to the implementation of fuzzy MCDM approaches, time series analysis is possible.
As a result, the triangular fuzzy figures were comparable not only to cross-sectional data over a period of time, but also to the overall trend of all variables evaluated across the whole research period. Keeping in mind that different sectors are reflective of different financial indicator values, coefficients of significance were assigned to each indicator based on the variance across sectors. However, future research may apply more sophisticated weight estimation methods, such as those based on linear programming. The introduction of a fictitious alternative (the entire economy) enables the defining of two sets of sectors, one consisting of relatively efficient sectors and the other of relatively inefficient sectors. There are other avenues for additional research.
Decision making testing and evaluation laboratory (DEMATEL) and analytical network process (ANP) approaches may be applied to the proposed WIRN-based COPRAS model in order to account for certain interdependencies and impacts of criteria and more properly reflect their relative relevance. Also interesting would be a comparison of the proposed model to the rough process of analytical hierarchy [
51] and rough DE-MATEL [
52].
The nature of the recommendations for one of these techniques, selection, ranking, or sorting, is dependent on the nature of the problem being addressed. The choice of models/methods may also be based on evaluation criteria such as internal consistency and logical robustness, transparency, ease of use, data requirements proportional to the significance of the issue under consideration, realistic time and manpower requirements for the analysis process, the ability to submit an audit sequence, and the availability of software when needed.
Several multi-criteria strategies exist to aid in the selection of conditions for multi-criteria problems. When alternatives are ranked based on their relative likeness to the optimal solution, the TOPSIS method prevents the similarity index from having both positive and negative ideal assessments. The TOPSIS method is a useful and effective technique for ranking and selecting alternatives. In this paper, the TOPSIS approach for discrete and interval data concepts was the primary focus. Additionally, the technological expansion of TOPSIS in the context of collective decision making was investigated. High adaptability of the TOPSIS concept permits the selection of the ideal solution in a range of situations.
In reality, TOPSIS and its variations are applied to the solution of several theoretical and real-world issues. Additionally, the TOPSIS approach permits the combination of the preferences of several decision-makers. Given the diverse requirements of real-world decision-making problems, the traditional TOPSIS has been expanded to include support for modeling intervals or fuzzy criteria, intervals or fuzzy weights, inaccuracies, uncertainties, information gaps or uncertainties, such as TOPSIS with interval data, Fuzzy TOPSIS, Fuzzy AHP and TOPSIS, and group TOPSIS.
Specifically, the selection of the best technology or investment project or the establishment of a business is based on the best financial and commercial activities or strategic potential, etc. In addition, the above difficulties may include areas of the state or several states, etc. None of these processes or events can be quantified in a single dimension, as it is extremely unlikely that a single characteristic could encompass all pertinent features of the topic under investigation. Complex economic or social processes have been evaluated quantitatively using multi-criteria approaches more often in recent years.
The FUZZY VIKOR method is frequently used to build a cause-and-effect factor scheme. This methodology is superior to conventional ways because it presents the relationship between the criteria by ranking them according to the type of relationship, so highlighting the extent of their impact on each criterion. In order to address the issue at hand, an integrated strategy is necessary because a single technique is insufficient to identify occupational risk in the presence of uncertainty and inconsistency. Fuzzy linguistic modeling is employed in order to represent and manage external information. Combining the linguistic variables of a triangle with fuzzy numbers enables the FUZZY VIKOR method to reveal the causes and consequences of criteria and increase the model’s applicability. As it is useful to have an overview of which methodologies are utilized in which regions of the world, multicriteria approaches and the research fields of scientists that employ them are presented in
Table 1.
The Fuzzy VIKOR approach was designed in order to solve problems in a fuzzy environment where both criteria and weights may be fuzzy sets. Triangular fuzzy numbers are employed to represent inaccurate numerical quantities. Fuzzy VIKOR is based on the fuzzy merit aggregation that indicates the distance between an option and the optimal answer. Using fuzzy operations and processes for ranking fuzzy numbers, the fuzzy VIKOR algorithm was developed. Fuzzy VIKOR (VlseKriterijuska Optimizacija I Komoromisno Resenje) is a frequently employed decision-making technique; under the fuzzy VIKOR decision-making model, all decision-makers apply the same assessment criteria to all schemes [
56]. This study presents a decision-making model that employs a fuzzy VIKOR and applies it to the selection of a firm in a competitive environment in the real energy industry in order to take into account the opinions of all decision-makers and acquire an optimal answer in less time. This study provides a decision-making model based on fuzzy VIKOR that permits diverse decision-makers to evaluate all schemes using distinct evaluation criterion systems. This research provides a decision-making model that can successfully prevent decisions from being made using the same criteria system. Moreover, because the coefficient of selection mechanism, the weight of decision-making, and the weight of assessment criteria are not sensitive in this decision-making model, the decision results are quite stable. This paper proposes a decision-making approach that can get the greatest potential outcome while avoiding inferior solutions.
Several scholars employ multicriteria techniques in economics, as seen in the table above. Diverse economic sectors display a significant amount of interest in the Fuzzy VIKOR approach among scholars.
5. Methods and Data
This research aims to help in the development of firm strategies based on fuzzy VIKOR market analysis. It has been modified for use inside the manufacturing sector. The examination was performed with the assistance of experts. The experts were chosen based on the following criteria:
- –
Management qualifications of a manufacturing firm.
- –
At least 10 years of experience in the manufacturing industry.
- –
The competency of the manufacturing industry is affected by uneven market competitiveness.
In this inquiry, 10 experts were chosen. The number of experts was determined by the qualitative research method; when the number of experts exceeds ten, it has no influence on the precision and dependability of the findings.
Evaluations of market power in the energy business and the impact of the energy sector on the GDP are crucial. Utilizing the fuzzy VIKOR approach, the market strength of manufacturing enterprises in Slovenia and Lithuania was analyzed. Moreover, characteristics for 18 manufacturing enterprises from 2016 to 2021 were provided.
The following are the paper’s hypotheses:
The fuzzy VIKOR technique may investigate the most efficient ways of balancing the power of corporate entities in a distorted market by employing the HHI index to discover viable solutions.
Due to the unique peculiarities of the energy market, HHI is an excellent approach for doing competitive analysis.
Over time, HHI has impacted the capability of businesses to avoid market distortions caused by rivals.
A number of illegal cartels have been discovered in recent years, negatively impacting market competition. Given the significance of this sector to the economies of Lithuania and Slovenia, it makes sense to evaluate the market strength of corporate entities in the manufacturing sectors of Lithuania and Slovenia using the provided approach. From 2016 through 2021, the performance indicators of firms in the manufacturing industry are presented below.
The fuzzy VIKOR approach was used to evaluate 15 criteria [
52] and 5 market concentration alternatives in this study. The Fuzzy VIKOR approach was created to solve problems in a fuzzy environment where both criteria and weights may be fuzzy sets. Triangular fuzzy numbers are utilized to represent inaccurate numerical quantities. Fuzzy VIKOR is based on the aggregating fuzzy merit that indicates the distance from the optimal solution to an alternative. In the development of the fuzzy VIKOR algorithm, fuzzy operations and processes for ranking fuzzy integers are used. Fuzzy VIKOR (VlseKriterijuska Optimizacija I Komoromisno Resenje) is a frequently utilized decision-making technique; in the fuzzy VIKOR decision-making model, all decision-makers apply the same assessment criteria to all schemes [
56]. This study presents a decision-making model that employs a fuzzy VIKOR and applies it to the selection of a firm in a competitive environment in the real energy industry in order to take into account the opinions of all decision makers and acquire an optimal answer in less time. This study provides a decision-making model based on fuzzy VIKOR that enables diverse decision-makers to evaluate all schemes using distinct evaluation criterion systems. This study provides a decision-making paradigm that effectively avoids making decisions based on the same set of criteria. In addition, because the coefficient of selection mechanism, the weight of decision-making, and the weight of assessment criteria are insensitive in this decision-making model, the decision outcomes are quite stable. This paper proposes a decision-making model that can provide the greatest possible outcome while avoiding suboptimal solutions. In
Figure 2 are presented the main steps of the fuzzy VIKOR method.
Table 2 displays the type of criteria and weight allocated to each criterion, which is the arithmetic mean of all experts.
Table 3 shows the fuzzy scale used in the model.
The decision matrix reflects the consequences of weighing the options against several criteria. Due to the participation of several experts in the evaluation, the matrix (
Table 4) below reflects the arithmetic mean of all experts.
6. Results
The optimum positive and negative answers for each criterion are listed below. If the criteria is positive, the following relations can be utilized to get the positive optimal solution (
) and the negative ideal solution (
):
If the criteria are negative, the optimum answer is positive (
) and negative ideal solution (
) utilizing the following relationships:
Table 5 displays the optimal positive and negative values.
Based on the positive and negative ideal solutions, the following equation may be used to generate a normalized choice matrix:
where
The normalized values of the evaluation matrix are shown in
Table 6.
Prior to calculating the values, it is important to transform the normalized matrix to the weighted normalized decision matrix,
and
as follows:
Calculating the value of
Q may be done as follows.
where
This analysis reveals that the variable v, which reflects the greatest group utility, is equal to 0.5.
Using the following formula, the values of the fuzzy numbers
S,
R, and
Q may be converted into crisp numbers.
The following
Table 7 displays the fuzzy values
S,
R, and
Q.
Table 8 displays the crisp values
S,
R, and
Q and ranks the choices according to these values.
As illustrated in the picture, the decision is made based on the values R, S, and Q for the possibilities that are sorted in decreasing order. In order to achieve a conclusion, two conditions must be met, and a variety of compromise solutions may be provided once these conditions have been met. The first condition is an acceptable benefit. where is the alternative with first position and is the option that ranks second in the ranking list according to Q, where m is the number of alternatives. The second condition is acceptable stability in decision-making: The alternative must also be the best-ranked option by S and/or R in order to be acceptably stable in decision-making. If one of the prerequisites is not met, a set of compromise alternatives is provided, which includes the following options:
First solution. Alternatives if Condition 1 is not satisfied; alternative is determined by for maximum M (the positions of these alternatives are ‘‘in closeness’’).
Second solution. Alternatives and if only condition 2 is not satisfied.
Third solution. If the alternative with the lowest
Q value is selected as the best option after verifying that all conditions are satisfied, the alternative with the greatest
Q value is selected as the best alternative according to
Table 9 of the survey results.
Therefore, Option 4, Option 5, Option 3, Option 2, Option 1, are selected as the final options.
7. Discussion
The purpose of analyzing market concentration variables is to precisely characterize the processes, occurrences, and obstacles associated with manufacturing company competition. The manufacturing industry is marked by distorted competition market conditions that make it difficult to achieve competition power equilibrium. This exacerbates the difficulty of assessing the concentration of business entities and players in the manufacturing industry, as well as modeling and facilitating strategic business decisions. This situation necessitates the development of new modeling tools, the balancing of market power, and a deeper comprehension of the competitive landscape.
It is not likely to be an accurate or trustworthy substitute for the conventional method of defining the relevant market and then analyzing market shares and market access conditions to establish if a business has monopolistic power. It is therefore troublesome to use market definition and market share as indications of the effect of specific company practices on competition. In some instances, there may be a positive association between market share and the influence of business practices. For instance, a company’s unwillingness to close a contract that has a 35 percent market share would often have less of an impact than if the company were dominating. However, particular corporate activities frequently have both pro- and anti-competitive impacts, and it depends on the circumstances as to which effect predominates. Analysis undertaken on the idea of market power revealed the significance of market concentration elements in evaluating the concentration of manufacturing businesses and their effect on competition. It may be claimed that market concentration considerations are vital in determining the market power of distort-ed-manufacturing market business entities and the effect they have on competition.
This study also includes a sensitivity analysis to confirm that the proposed solution is the best one. The results of the analysis validate the scientific nature of this model. This paper describes a fuzzy VIKOR-based method for choosing a design plan for a defective tender. Due to the fact that the model permits various decision-makers to evaluate all schemes using distinct sets of evaluation criteria, it can be used to balance the perspectives of all decision-makers in a given situation. It is more adaptable to the company’s actual decision-making process. The most significant limitation of this study is that the HHI score values for the relevant time period were calculated using only current data, with no forecasts for the relevant time period available. It is difficult to estimate the size of a constantly reorganizing market due to the frequency with which it undergoes change. When a significant number of manufacturing companies and their respective market shares are available for analysis, precise estimates can be made. All business criteria should be included in the calculation of the HHI index, and the absence of data on extremely small businesses should be disregarded due to their negligible impact on the bottom line of the organization. The change in the HHI index over time influences a company’s ability to prevent long-term market distortions relative to its competitors. The use of the fuzzy VIKOR approach and the choice of expert groups are two additional limitations of this study. In selecting professionals for scientific and corporate networks, subjective bias will always exist. Given the objective of the study and the care taken to ensure the consistency and complementarity of the selected profiles, it is difficult to eliminate these limitations entirely.
The obtained results can be used in practice in preparing, implementing, and supporting the strategies of business entities of manufacturing companies in distorted markets in both the long and short term, planning the proper use of their resources, which is important for business sustainability. The application of the proposed method in the sense of management allows to evaluate the importance and uncertainty of various criteria, saving time and costs, respectively, by analyzing the importance of various criteria determining the activity of a business entity for its competitiveness and opportunities to operate in a distorted market economy.
Future study should utilize the fuzzy VIKOR approach to extend the remaining concentration indices in order to analyze the competitive scenario in the manufacturing business. Additionally, the applicability of these strategies to various market levels should be tested. Future research should thoroughly evaluate and compare the findings, interviewing not only industry representatives but also field researchers and undertaking a comprehensive data analysis. According to the authors, despite the extensive use of the HHI in a distorted industry, further research is required to examine the competitive environment in the manufacturing sector using the fuzzy VIKOR technique. Additionally, it is vital to examine the applicability of these tactics to various market levels.
8. Conclusions
Market concentration factors have been incorporated into competition law to assist competition authorities in evaluating market strength, thereby enabling them to identify anticompetitive effects and enforce competition law. This instrument was created as a response to the question of the presence, emergence, and consolidation of market power in a historical context, with an emphasis on how competition issues should be investigated.
In this paper, 15 criteria and 5 market concentration alternatives were rated using the fuzzy VIKOR method. Positivity and negativity were obtained as ideal criteria solutions. Option 4 and Option 5 are selected as the final two most suitable solutions. Unfortunately, the performance of alternatives 3, 2, and 1 was unacceptable. Taking into account the fragmented competitive nature of the market, Options 4 and 5 could be used to create final business plans based on the recommendations of the experts. Option 3 produced mediocre results; thus, it was excluded from consideration. The first hypothesis was so confirmed.
Similar to our investigation, earlier authors have successfully applied the fuzzy VIKOR method to multi-criteria situations. Ng and Chuah [
56] examined the weight determination and aggregating function for classic fuzzy VIKOR in the evaluation of eco-industrial thermal power plants, which involved subjective evaluations of qualitative attributes in an uncertain situation. Similar to our analysis, their methodology incorporated the most important economic business entity characteristics. Pamucar et al. [
53] integrated fuzzy AHP and VIKOR/DEA for the multicriteria evaluation of investments in sustainable manufacturing. This author also studied the applicability of AHP and DEA methodologies for analyzing the HHI index. In their research, Islam et al. [
54] created a method for evaluating sustainable manufacturing systems that combines PFS divergence and entropy data with the VIKOR. Combining the fuzzy rough number, AHP, and VIKOR, Kadoi et al. [
59] developed a fuzzy rough number extended multi-criteria group decision-making technique to create a more reasonable ranking of failure modes. The objective of this strategy is to establish a more equitable ranking of failure modes. In addition, the efforts of these authors illustrate that the fuzzy VIKOR method may be used to determine the optimal solution to challenging issues.
Competition agencies rely on the imperfect indicator of market concentration for a preliminary evaluation of the level of competition on a particular market. This is done with caution due to the ambiguous relationship between market structure and competition intensity in a particular market. Likewise, it will likely be impractical to assess changes in the competitiveness of a sector or the economy as a whole to determine the true intensity of competition. This can be demonstrated by analyzing the reference point as market concentration data or industrial concentration data. Nevertheless, if market concentration is an unreliable indicator of competition intensity, it is even less clear what industry concentration can tell us about competition intensity in a particular industry. As causal variables, this study examines Operating costs, Business entities, and the HHI ratio. Turnover, Gross profit from operations, hours worked by employees, Number of potential employees, Total amount spent on goods and services Profits derived from subcontracting, Sold tangible property, Sales revenue, sales cost, company liabilities, Investment in construction companies, Capital assets, The debt ratio is regarded as a factor.
The model was used and assessed in the empirical part, and it is intended to facilitate the construction of business strategies based on market concentration analyses. The fuzzy VIKOR approach was evaluated in a typical corporate setting, namely the manufacturing services business. Using the fuzzy VIKOR method, market concentration, strategic activity, and strategic decisions are evaluated. A multi-criteria analysis was undertaken with the assistance of industry professionals due to the high number of elements considered while evaluating competition risks. From a pool of five eligible applicants, the best-suited options were finally picked. Positive and negative ideal criterion solutions were obtained. Options 4 (Rank in Q is 1; Crisp value of Q is 0.005; Rank in S is 1; Crisp value of Q is 0.816; Rank in R is 1; Crisp value of Q is 0.215) and 5 (Rank in Q is 2; Crisp value of Q is 0.074; Rank in S is 2; Crisp value of Q is 0.771; Rank in R is 2; Crisp value of Q is 0.165) are picked as the final most appropriate alternatives. Unfortunately, options 3 (Rank in Q is 3; Crisp value of Q is 0.142 Rank in S is 3; Crisp value of Q is 1.005; Rank in R is 4; Crisp value of Q is 0.243), 2 (Rank in Q is 4; Crisp value of Q is 0.23 Rank in S is 4; Crisp value of Q is 1.404; Rank in R is 5; Crisp value of Q is 0.261), and 1 (Rank in Q is 5; Crisp value of Q is 0.244 Rank in S is 5; Crisp value of Q is 1.639; Rank in R is 3; Crisp value of Q is 0.241) performed unacceptably poorly. Based on the opinions of the experts, choices 4 and 5 might be employed to develop final company plans, taking into account the market’s fragmented competitive environment, in order to have ability to continue its operations over a long-term horizon maintaining its sustainability in the sector. Unfortunately, the performance of the other three solutions was much worse and unacceptable.
Since this model has been evaluated, one can rely on it to provide a scientifically sound response that will prevent the acquisition of a suboptimal solution in the future. In conclusion, the model is highly scientific and sound, and it can be applied extensively to the selection of a scheme for constructing a business plan in the manufacturing industry in order to achieve the best results. A new and significant area of scientific research in economics and management would be the study and evaluation of the factors that promote a sustainable economy and those that limit economic competitiveness in manufacturing companies. It is believed that manufacturing companies and society will profit from the study’s conclusions. The operation of manufacturing businesses in the least distorted market can be significant for strengthening competitiveness not only at the national level, but also at the worldwide level, especially by improving reputation, decreasing costs, responding to market demands, and adapting to market demands. The findings will be significant to policymakers responsible for regulating market distortions and promoting sustainable economic projects. The study’s primary flaw is that the HHI score findings for the relevant time period are based solely on current data, with no projections. It is difficult to determine the size of a market that undergoes constant restructuring due to the frequency with which it changes. When a substantial number of manufacturing companies and their market shares are known, accurate estimates can be made. The absence of data on extremely small businesses may be disregarded due to their negligible impact on the bottom line, but when calculating the HHI index, all company criteria should be included. The evolution of the HHI index affects a company’s ability to avoid market distortions relative to its competitors. The imprecise VIKOR methodology and the selection of the expert panel are additional flaws of the study. Subjective bias is always prevalent in the selection of specialists for scientific and business networks.


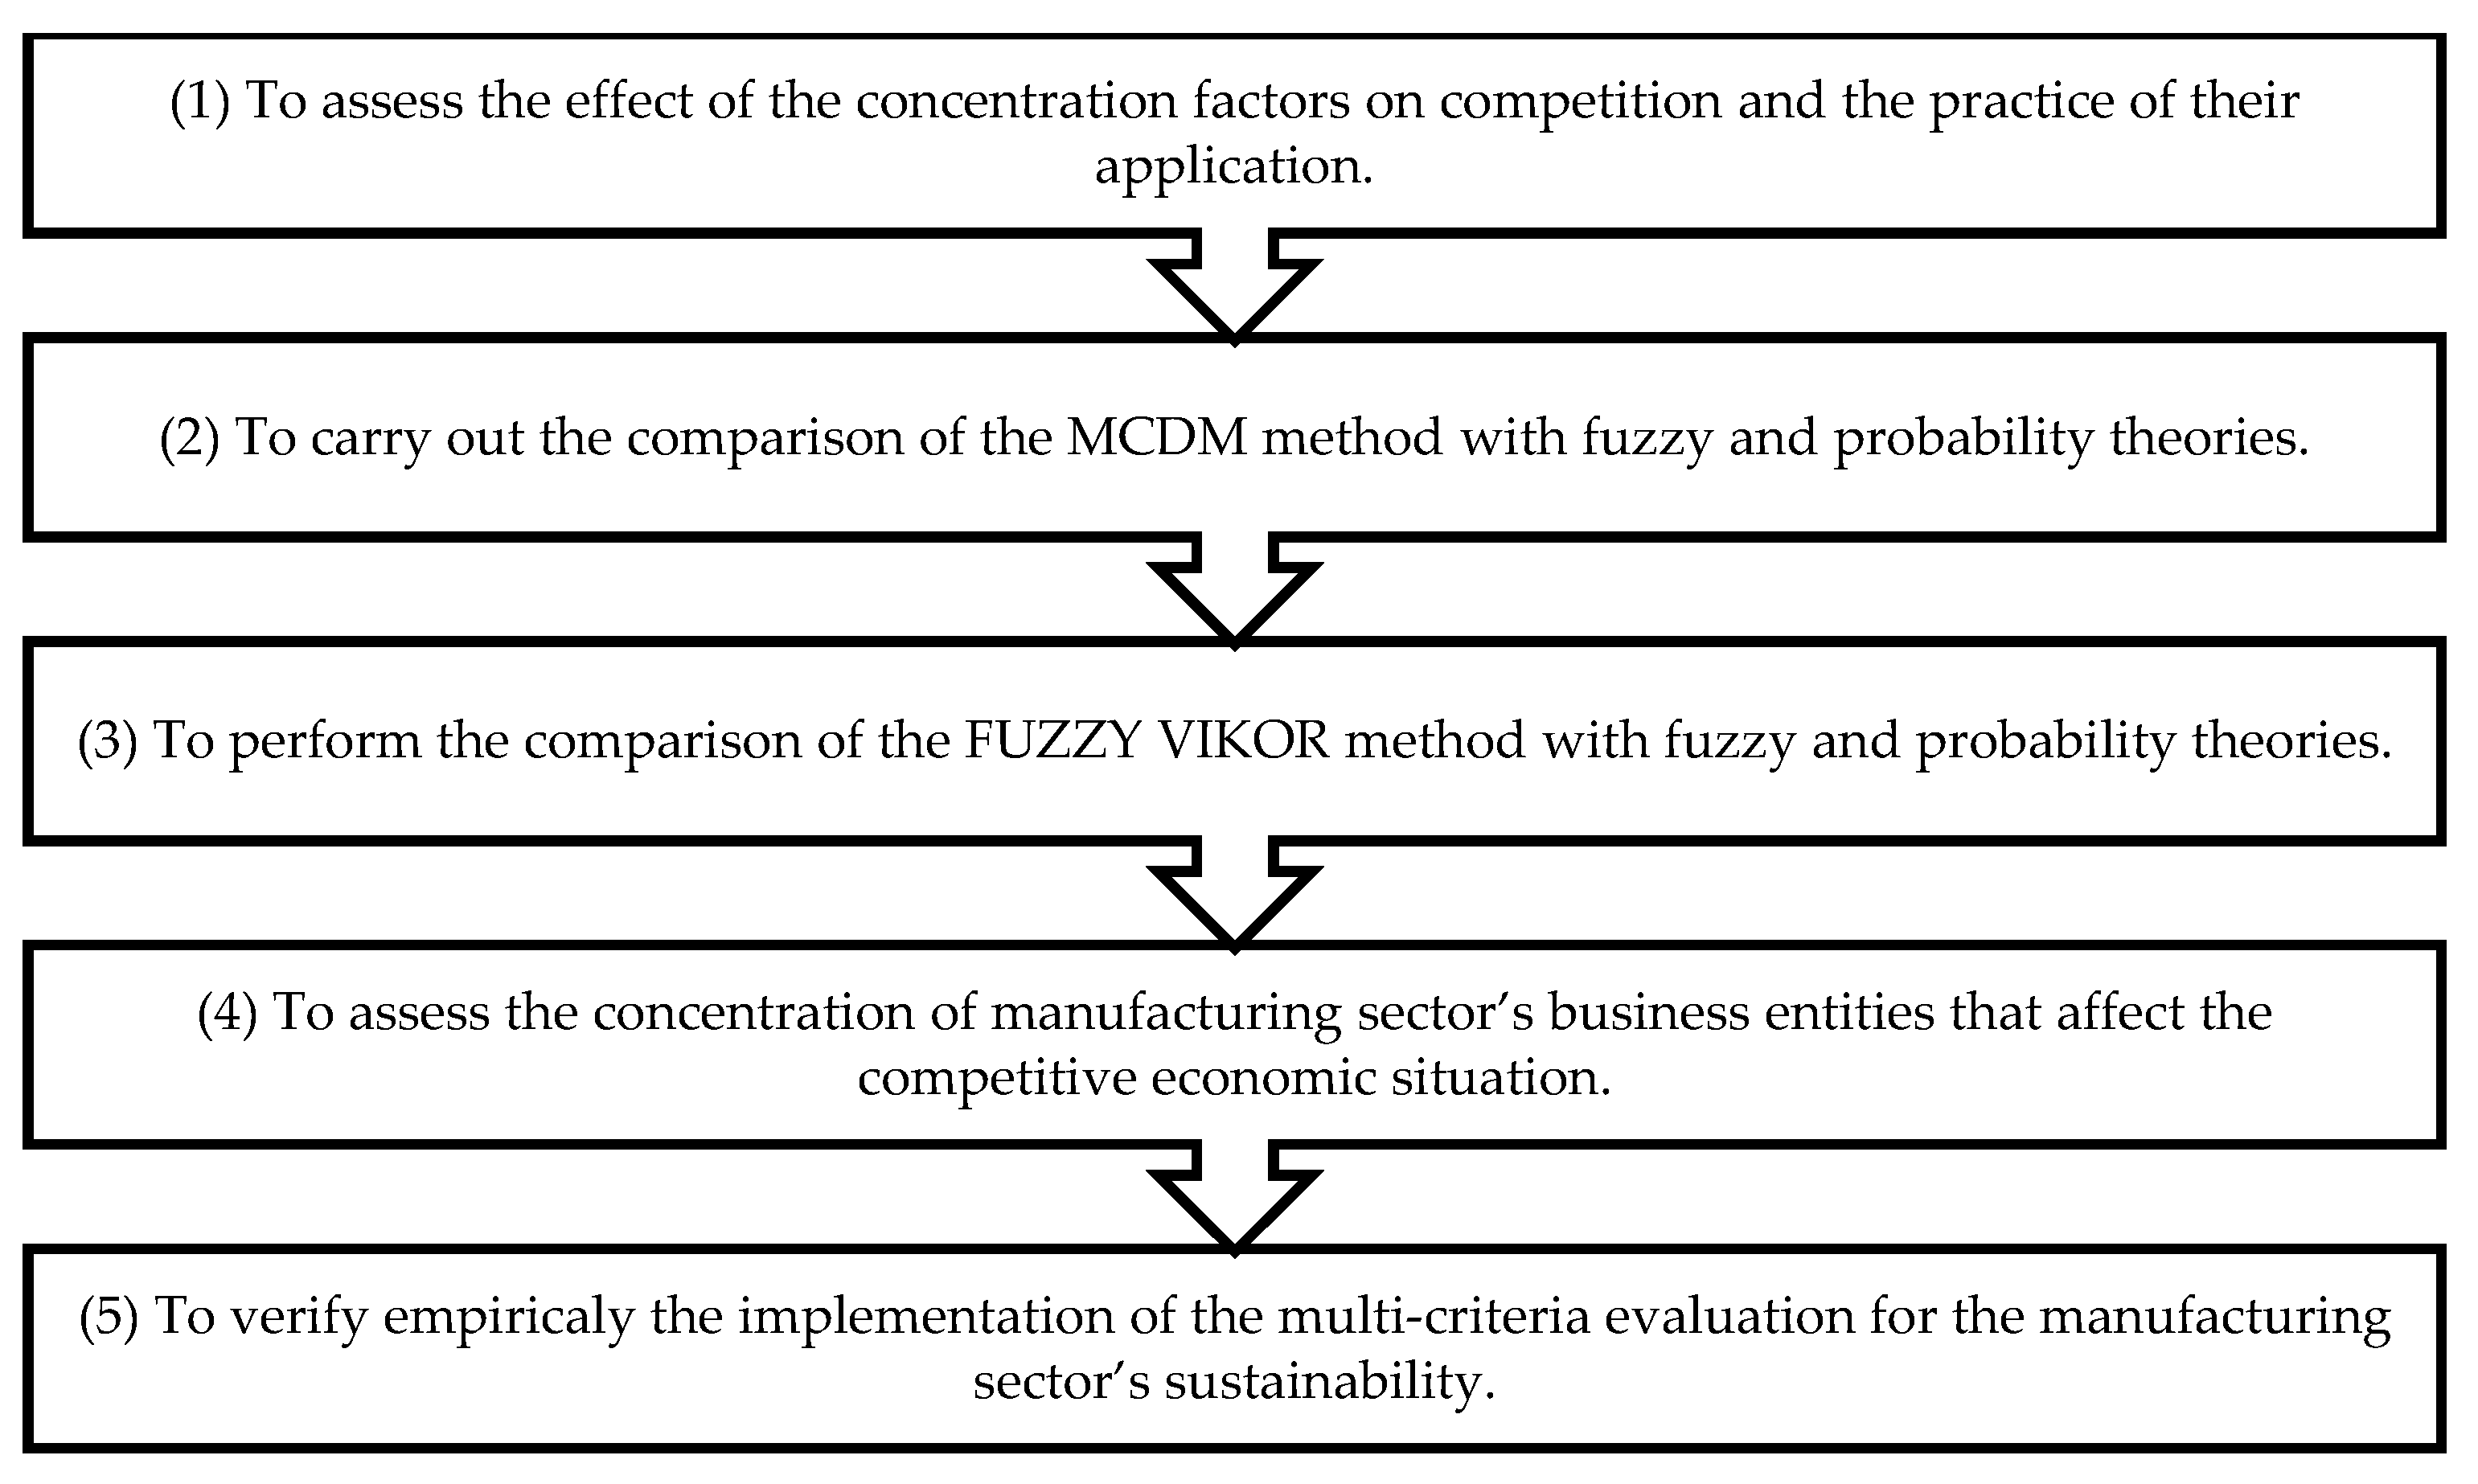
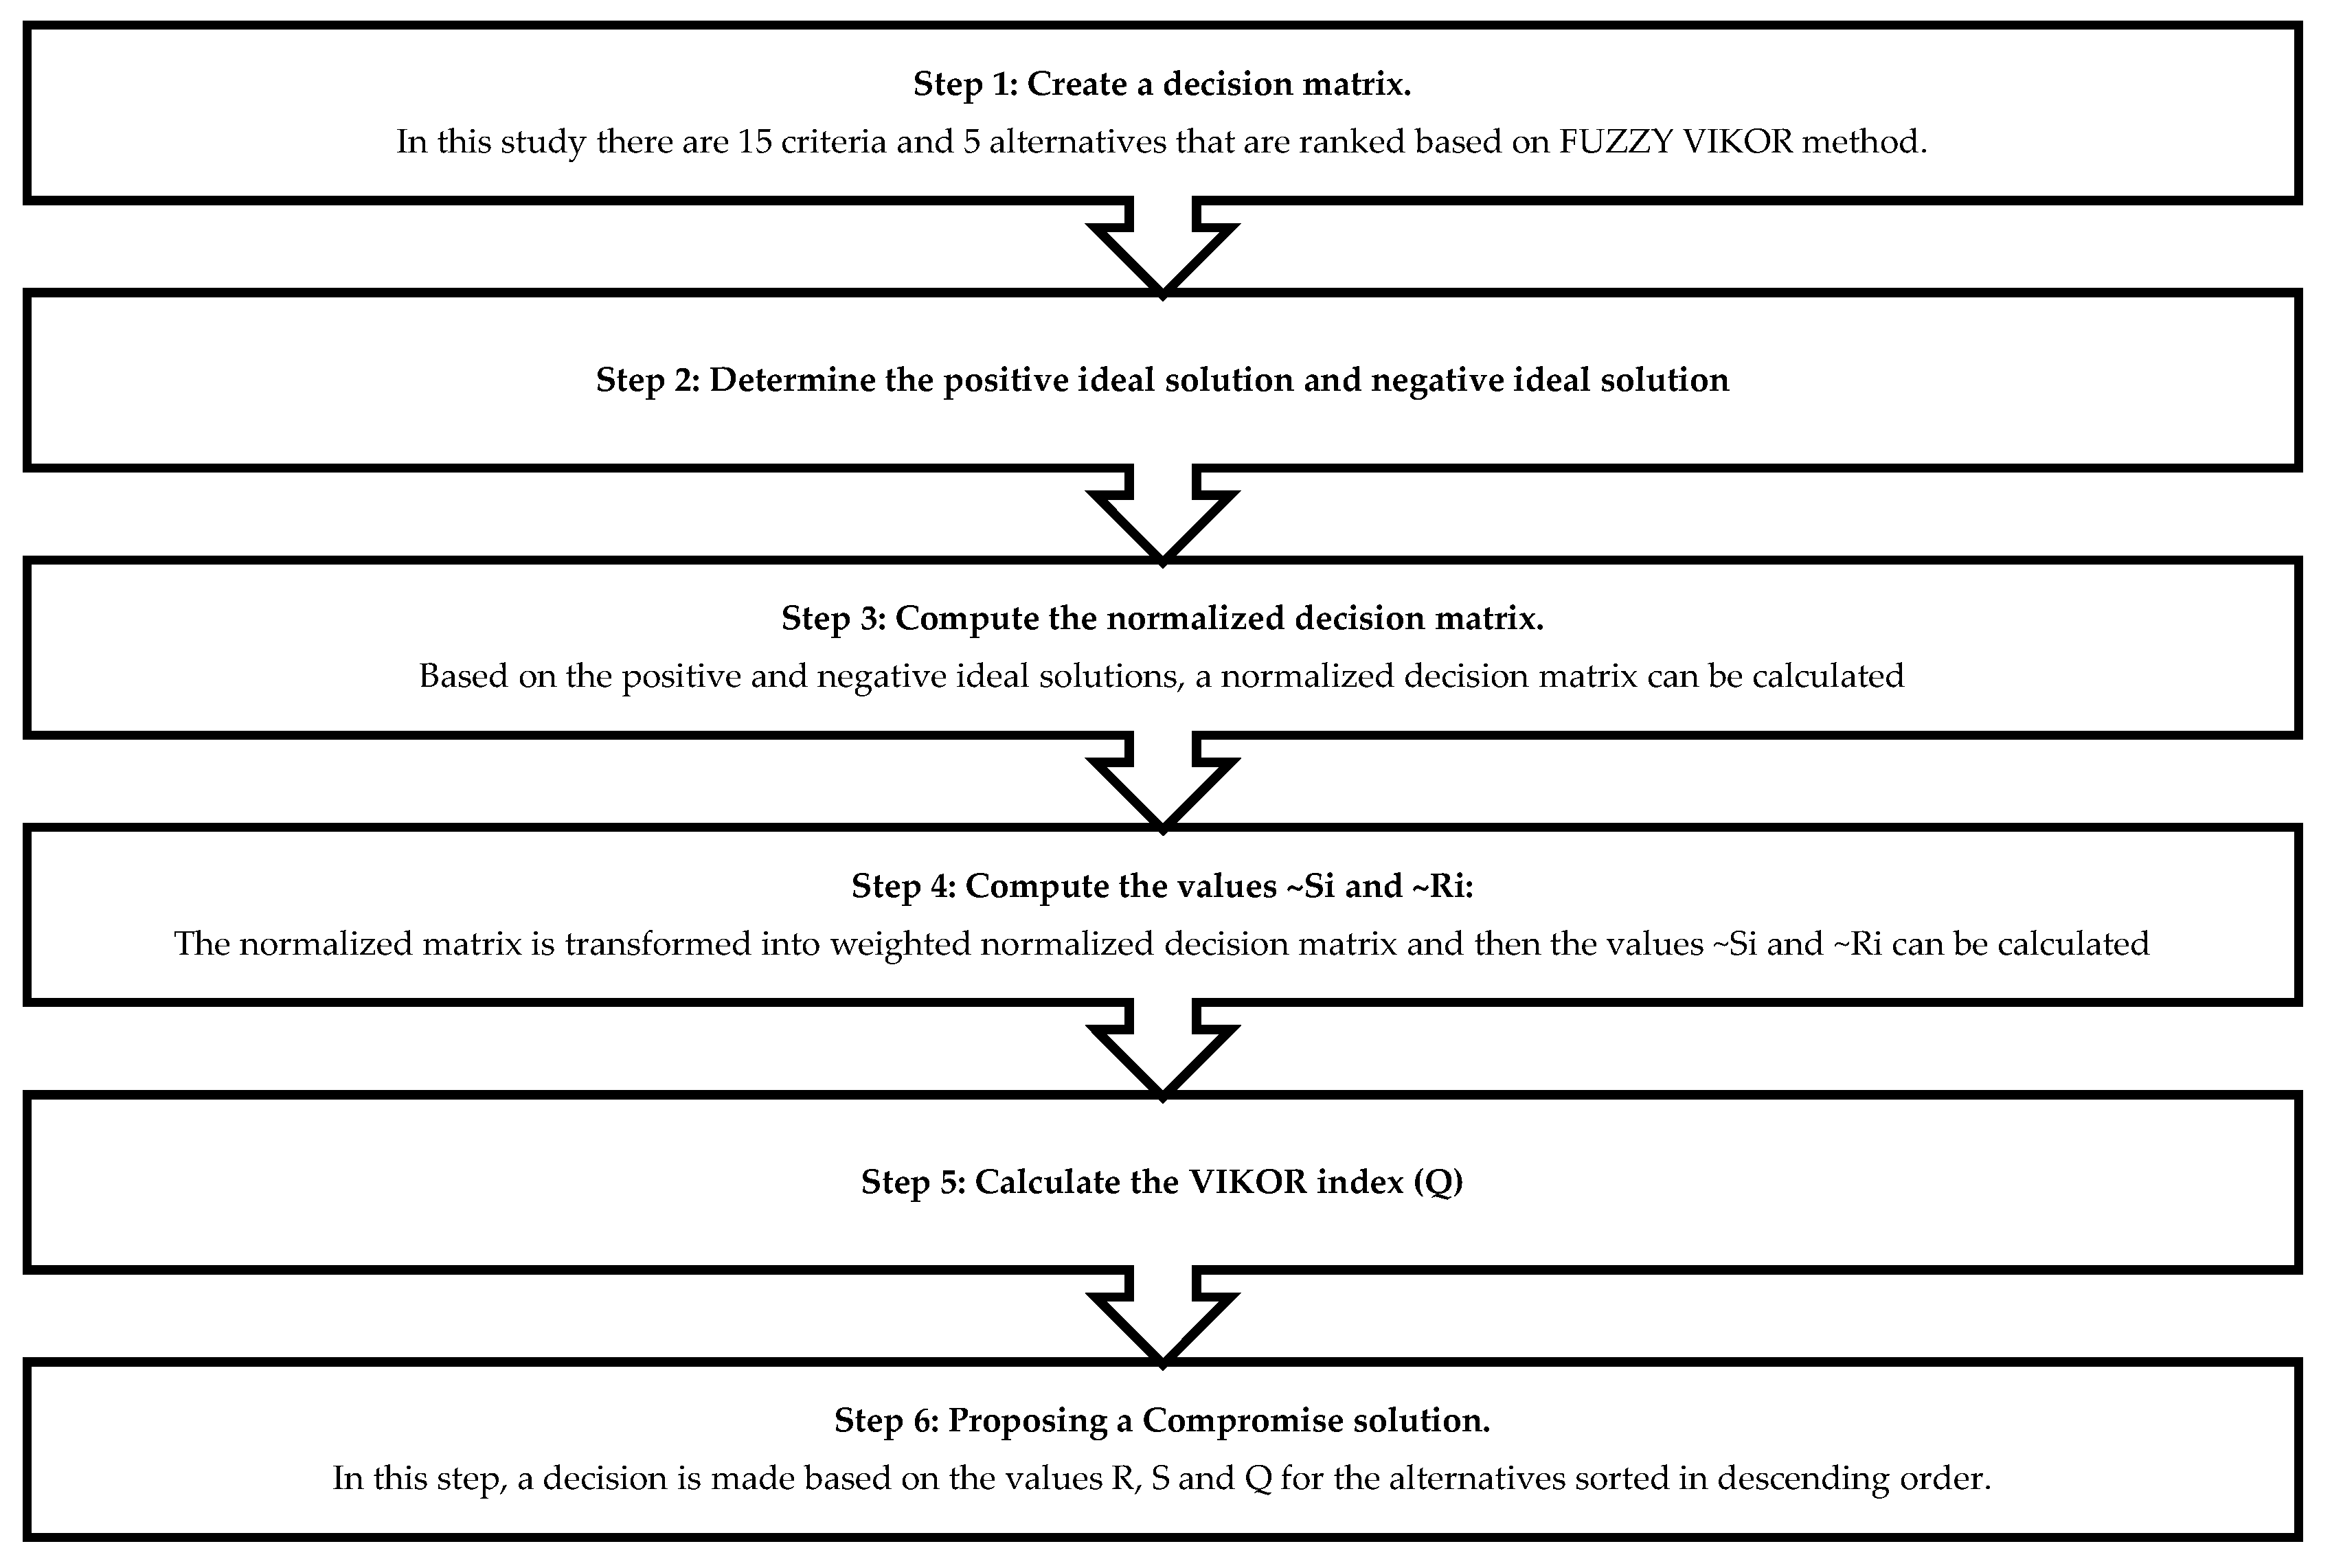