Article

Comprehensive Sustainable Assessment and Prioritization of Different Railway Projects Based on a Hybrid MCDM Model

School of Civil Engineering, Central South University, Changsha 410018, China
*
Author to whom correspondence should be addressed.
Sustainability 2022, 14(19), 12065; https://doi.org/10.3390/su141912065
Submission received: 20 August 2022 / Revised: 17 September 2022 / Accepted: 20 September 2022 / Published: 23 September 2022
(This article belongs to the Special Issue Evaluation of Sustainable Transportation Infrastructure)

Abstract

:
Railways play an essential role in China’s development, driving economic and social progress while negatively impacting the environment. Assessing different railway projects’ sustainability can maximize the positive effects and minimize the side effects. This article aims to propose a methodological framework containing a series of indicators to evaluate the sustainability of four railway projects in China. A hybrid MCDM (multi-criteria decision-making) method was adopted to analyze the interrelationships among the dimensions and indicators and then present the projects’ differences. The weights of each indicator in the research were studied according to experts’ advice, and the same indicators were of different importance when placed in different research environments, such as developing and developed countries. This helps to establish a developing-country-centered evaluation indicator system. After comparison, it can be seen that Railway A is the best in terms of sustainability, mainly because it is in an economically developed region of China that is rich in construction resources, and is less constrained by natural conditions than other projects. The results show that although environmental sustainability has been improved over the past few years, its low level of influence still urges people to invest more attention and take more actions with significant effects in this respect. Furthermore, railways show significant differences in economic sustainability, while the differences in social sustainability have reduced considerably. This study provides further insight into the investigated measures and proposes recommendations for improving railway transport in China.

1. Introduction

Transportation plays a vital role in the development of society, and railways are generally considered to be among the most sustainable developments for ground transportation [1]. The railway industry is developing rapidly and has made remarkable achievements in China. By 2020, China’s railway operating mileage had reached 146,300 km. The national railway network density is 152.3 km/million square kilometers, ranking first in the world [2]. Railways have genuinely become the nation’s bloodlines. However, railways promote economic growth by transporting people and goods and providing access to employment, while they inevitably affect the environment and society. According to the United Nations, the transport sector in individual countries accounts for about one-quarter of all their energy-related greenhouse gas emissions. To minimize the side effects of railways, the Chinese government has proposed a series of documents urging people to make efforts to achieve sustainable transportation and presenting some specific requirements involving social development, economic development, and environmental protection [3,4]; thus, the sustainable development of the railways has become a national strategy.
The transports system’s holistic sustainability assessment and optimization are essential for making the most of its positive effects and reducing its negative ones [5,6]. Many organizations and scholars have proposed standardized approaches to measure sustainability, and establishing an appropriate indicator system is the basis for such assessment. These organizations and scholars are mainly based in developed countries with high standard-of-living requirements in recent years. However, there are still non-negligible gaps between developed and developing countries, with differences in their development strategies and goals. This raises the question of whether developing countries should slow down their economic development to pursue the more demanding ecological goals of environmental protection. Therefore, in selecting indicators, it is essential to pay attention to the applicability of these indicators in developing countries such as China.
Many methods and models have been used for the sustainable assessment of transportation, such as BP neural networks, TOPSIS, DEA, Pearson correlation, etc. [7,8]. Some methods focus on analyzing the interrelationships between indicators rather than the sustainability assessment of railway projects, while other methods only present the weights of indicators or the ranking of different projects instead of giving actual optimization suggestions. Therefore, choosing an appropriate method is significant in proposing practical recommendations for policymakers and other stakeholders.
This study aims to develop a methodological framework for assessing the sustainability of railway projects. The implementation of this framework requires three stages: indicator selection, weighting and ranking, and empirical application. Numerous indicators were found in the literature, but only 13 key indicators attributed to three dimensions—economic, environmental, and social—were finally selected. These indicators are representative and available in developing countries and could help to establish a new developing-country-centered indicator system. In the next stage, a hybrid MCDM model was implemented. The DEMATEL method was used to find the degree of influence of each indicator and dimension. The DANP was used to obtain the global and local weights of dimensions and indicators. Finally, the performance scores and the gaps in the aspiration levels of alternatives were derived via the VIKOR method. The advantage of the VIKOR method is that not only can the ranking of the options be obtained, but their potential improvements can also be presented with this method, which could provide guidance for policymakers. In the last stage, four railway projects in different regions in China were chosen to validate the reliability of the proposed framework. The study’s results illustrate the differences in the sustainable development of railway projects in different areas, which could help policymakers, construction companies, and other stakeholders to optimize the sustainable development of transport and eliminate the inequity of railway development in different regions of China.

2. Literature Review

Sustainable development (SD) is a new trend that meets the world’s development needs and provides a new development direction for transportation. The WCED defines sustainable development as development that “meets the needs of the present without compromising the ability of future generations to meet their own needs”. According to the 2030 Agenda for Sustainable Development, one of the top priorities in the next decade is to achieve sustainability in transportation. Sustainable transportation can be defined as the transportation of goods and people to ensure economic and social development while reducing undesirable impacts on the environment and society [9,10,11]. Sustainability in transportation has been widely recognized to consist of three dimensions: environmental, social, and economic sustainability [12]. Even though railways are considered to be among the most promising sustainable transport modes, their performance still needs to improve—especially in developing countries. Given such a need, the question of achieving sustainable goals for the railway industry remains very worthwhile.
To achieve sustainability goals, transportation systems should be assessed and quantified through helpful indicators [13]. Litman proposed a method for the selection of comprehensive indicators for sustainable transport planning [14]. Awasthi et al. [15,16,17] developed a series of indicators to assess the sustainability of urban transportation. The United Nations proposed 17 Sustainable Development Goals (SDGs) in 2015, and each SDG was subdivided into a few targets that could be quantified and monitored through a series of indicators, some of which are directly related to transportation. As for the railway industry, previous studies on indicator systems play a very positive role in reference and guidance. Rao used some synthetic sustainability indices for evaluating high-speed intercity railways [18]. Garg and Kashav established a framework to assess the sustainability of initiatives in the containerized freight railways of India using indicators [19], Azzouz and Jack developed a benchmarking and reporting framework for HSRs through indicators [20]. Due to the complexity of transport systems, assessing their sustainability using a comprehensive set of indicators—the number of which varies in different studies—is more scientifically valid.
On the other hand, the sustainability indicator systems differ between developed countries and developing countries. Many scholars and organizations reside in developed countries with a high standard of living. Some sustainability indicators underestimate developing countries’ sustainability performance. For example, Esty et al. pointed out that the Environmental Sustainability Index (ESI) favors developed countries due to their economic status and high income support for environmental pollution control [21]. Mori and Christodoulou also observed a similar trend in the Environmental Policy Index (EPI) [22]. Esty et al. found that the indicator “environmental health” is highly related to wealth, which may lead to an underestimation of sustainable performance in developing countries that have not invested enough in pollutant control or water clean-up [21]. In this case, good economic performance can offset bad environmental performance, and vice versa.
Developed countries likely tend to be highly evaluated because of their high income. This principle is also valid for railway sustainability assessment. Thus, it is necessary to establish a suitable sustainability indicator system for developing countries. Scholars have made some progress in China, especially in the sustainability of urbanization [23,24,25]. As for railways, Liu et al. formalized an integrated metric system measuring the performance of urban sustainability in China [26]. Qiu et al. established a sustainable evaluation indicator system for railway tunnels in China [27]. Li et al. conducted a sustainable competitiveness analysis of China Railway in the context of the Belt and Road Initiative through some indicators covering a few dimensions [28].
A variety of methods and tools have been used to analyze the indicators, see Table 1. MCDM provides a framework for constructing decision problems and methods for generating preferences for alternative solutions, and has attracted consistent attention from researchers in transport sustainability assessments [12,15]. AHP/ANP and their hybrids are the most frequently used methods [29,30,31,32,33,34,35]. Moreover, some other MCDM methods have been adopted in research, such as PROMETHEE [36,37], ELECTRE [38,39], DEA [8], etc. In addition to MCDM methods, other approaches have also been used in transport sustainability assessment. Liu et al. adopted EFA and CFA to measure the performance of urban sustainability [26]. Al-Thawadi et al. used life-cycle assessment (LCA) to evaluate passenger transport sustainability [40]. Sharma et al. adopted data mining scaffolding (DMS) to improve the efficiency of railway reservation [41]. These methods and tools contribute to complete data mining and allow an excellent and specific analysis of the interrelationships between the factors and the weighting ratios.
Based on the literature review above, it is apparent that there remain two significant research gaps:
(1)
The topic of measuring the sustainability of Chinese railway projects on a national scale has not been well explored, and an indicator system has not yet been established. Many frameworks for the evaluation and analysis of transport sustainability originated from Western-civilization-oriented concepts of modernization and development. There is a considerable gap in GDP per capita between developing and developed countries, so the indicator systems in different countries should pay attention to the choice of each indicator or its weight according to the actual situation. Moreover, some indicator systems include dozens or even hundreds of indicators, which are difficult to manipulate for comparison in real-life cases. The indicators should be crucial, representative, and easy to apply.
(2)
Some research has only assessed railways’ sustainability or ranked different alternatives, without highlighting ideas and paths for optimization. However, in real-life cases, policymakers and stakeholders value these optimization suggestions more than the study process. Thus, the results of the evaluation need to be explained clearly, and policy suggestions need to be proposed to help promote sustainable development.
To fill in the research gaps above, a methodological framework was established for assessing multiple railway projects in different areas of China. The framework consists of the indicators most frequently used in the literature and screened or recreated according to China’s development needs and the actual situation. DEMATEL and ANP were used to determine the interrelationships among dimensions and indicators. Furthermore, the VIKOR method was adopted to rank the railway projects and provide some improvement strategies by comparing the gaps to aspiration levels, which could help in furthering the sustainable development of railway projects in developing countries.

3. Materials and Methods

As mentioned above, previous studies generally used MCDM methods such as AHP/ANP and their hybrids, TOPSIS, PROMETHEE, ELECTRE, etc. Some studies did not suggest improvement strategies for optimization. However, in real-world cases, policymakers, industry practitioners, and related stakeholders take these suggestions very seriously. Therefore, this article uses a framework that combines the DANP method with a modified VIKOR method.
DEMATEL is a fast-developing decision-making method that has been adopted in many fields. Chang et al. used fuzzy DEMATEL to improve performance in SCM supplier selection [42]. Yazdi et al. used an integrated DEMATEL method in safety management in the high-tech industry [43]. Dalvi-Esfahani et al. analyzed social media addiction using DEMATEL [44]. Garg applied the DEMATEL technique to determine the interdependence among e-waste mitigation strategies (MSs) by cause–effect analysis [45]. Singh et al. analyzed barriers to Green Lean practices in manufacturing industries using DEMATEL [46]. In recent years, DEMATEL has also been widely used in combination with traditional ANP methods because it can compensate for some shortcomings and deficiencies of the traditional ANP method. DANP has received widespread recognition. Khan et al. analyzed critical success factors for circular economy transition through a DANP approach [47]. Gigović et al. adopted a hybrid DANP model to identify the locations of wind farms [48]. Hamedi et al. used DANP to find and prioritize human factors affecting entrepreneurial resilience [49]. Kumar and Anbanandam used grey DANP to analyze interrelationships and prioritize the factors influencing sustainable intermodal freight transport systems [50].
However, like other MCDM methods, DANP only provides the ranking of objectives, without any detailed optimization direction for improvement. A modified VIKOR method has been used to solve this problem. The introduction of the modified VIKOR method is based on the nature of decision-making. The alternatives often show inconsistent performance in different criteria when facing complex evaluations. Decision-makers have to compromise to reach a final decision. For example, Railway A might outperform Railway B in indicator j, but Railway A might have worse performance in indicator i. The modified VIKOR method aims to determine the desired solution and choose the alternative with the shortest distance to the aspiration level. The DANP–VIKOR method can give both the ranking of railway projects and the optimization direction for each project, which are crucial for policymakers. DANP–VIKOR has become a major method for decision-makers to evaluate multiple objectives. Hsu et al. selected the best vendor for conducting recycling of materials based on a hybrid MCDM model [51]. Chiu et al. used the DANP–VIKOR method to improve e-store business [52]. Rao used the DANP–VIKOR method to analyze the sustainability indicators in high-speed railways [18]. Lin et al. evaluated smart office buildings from a sustainability perspective through the modified VIKOR method [53].
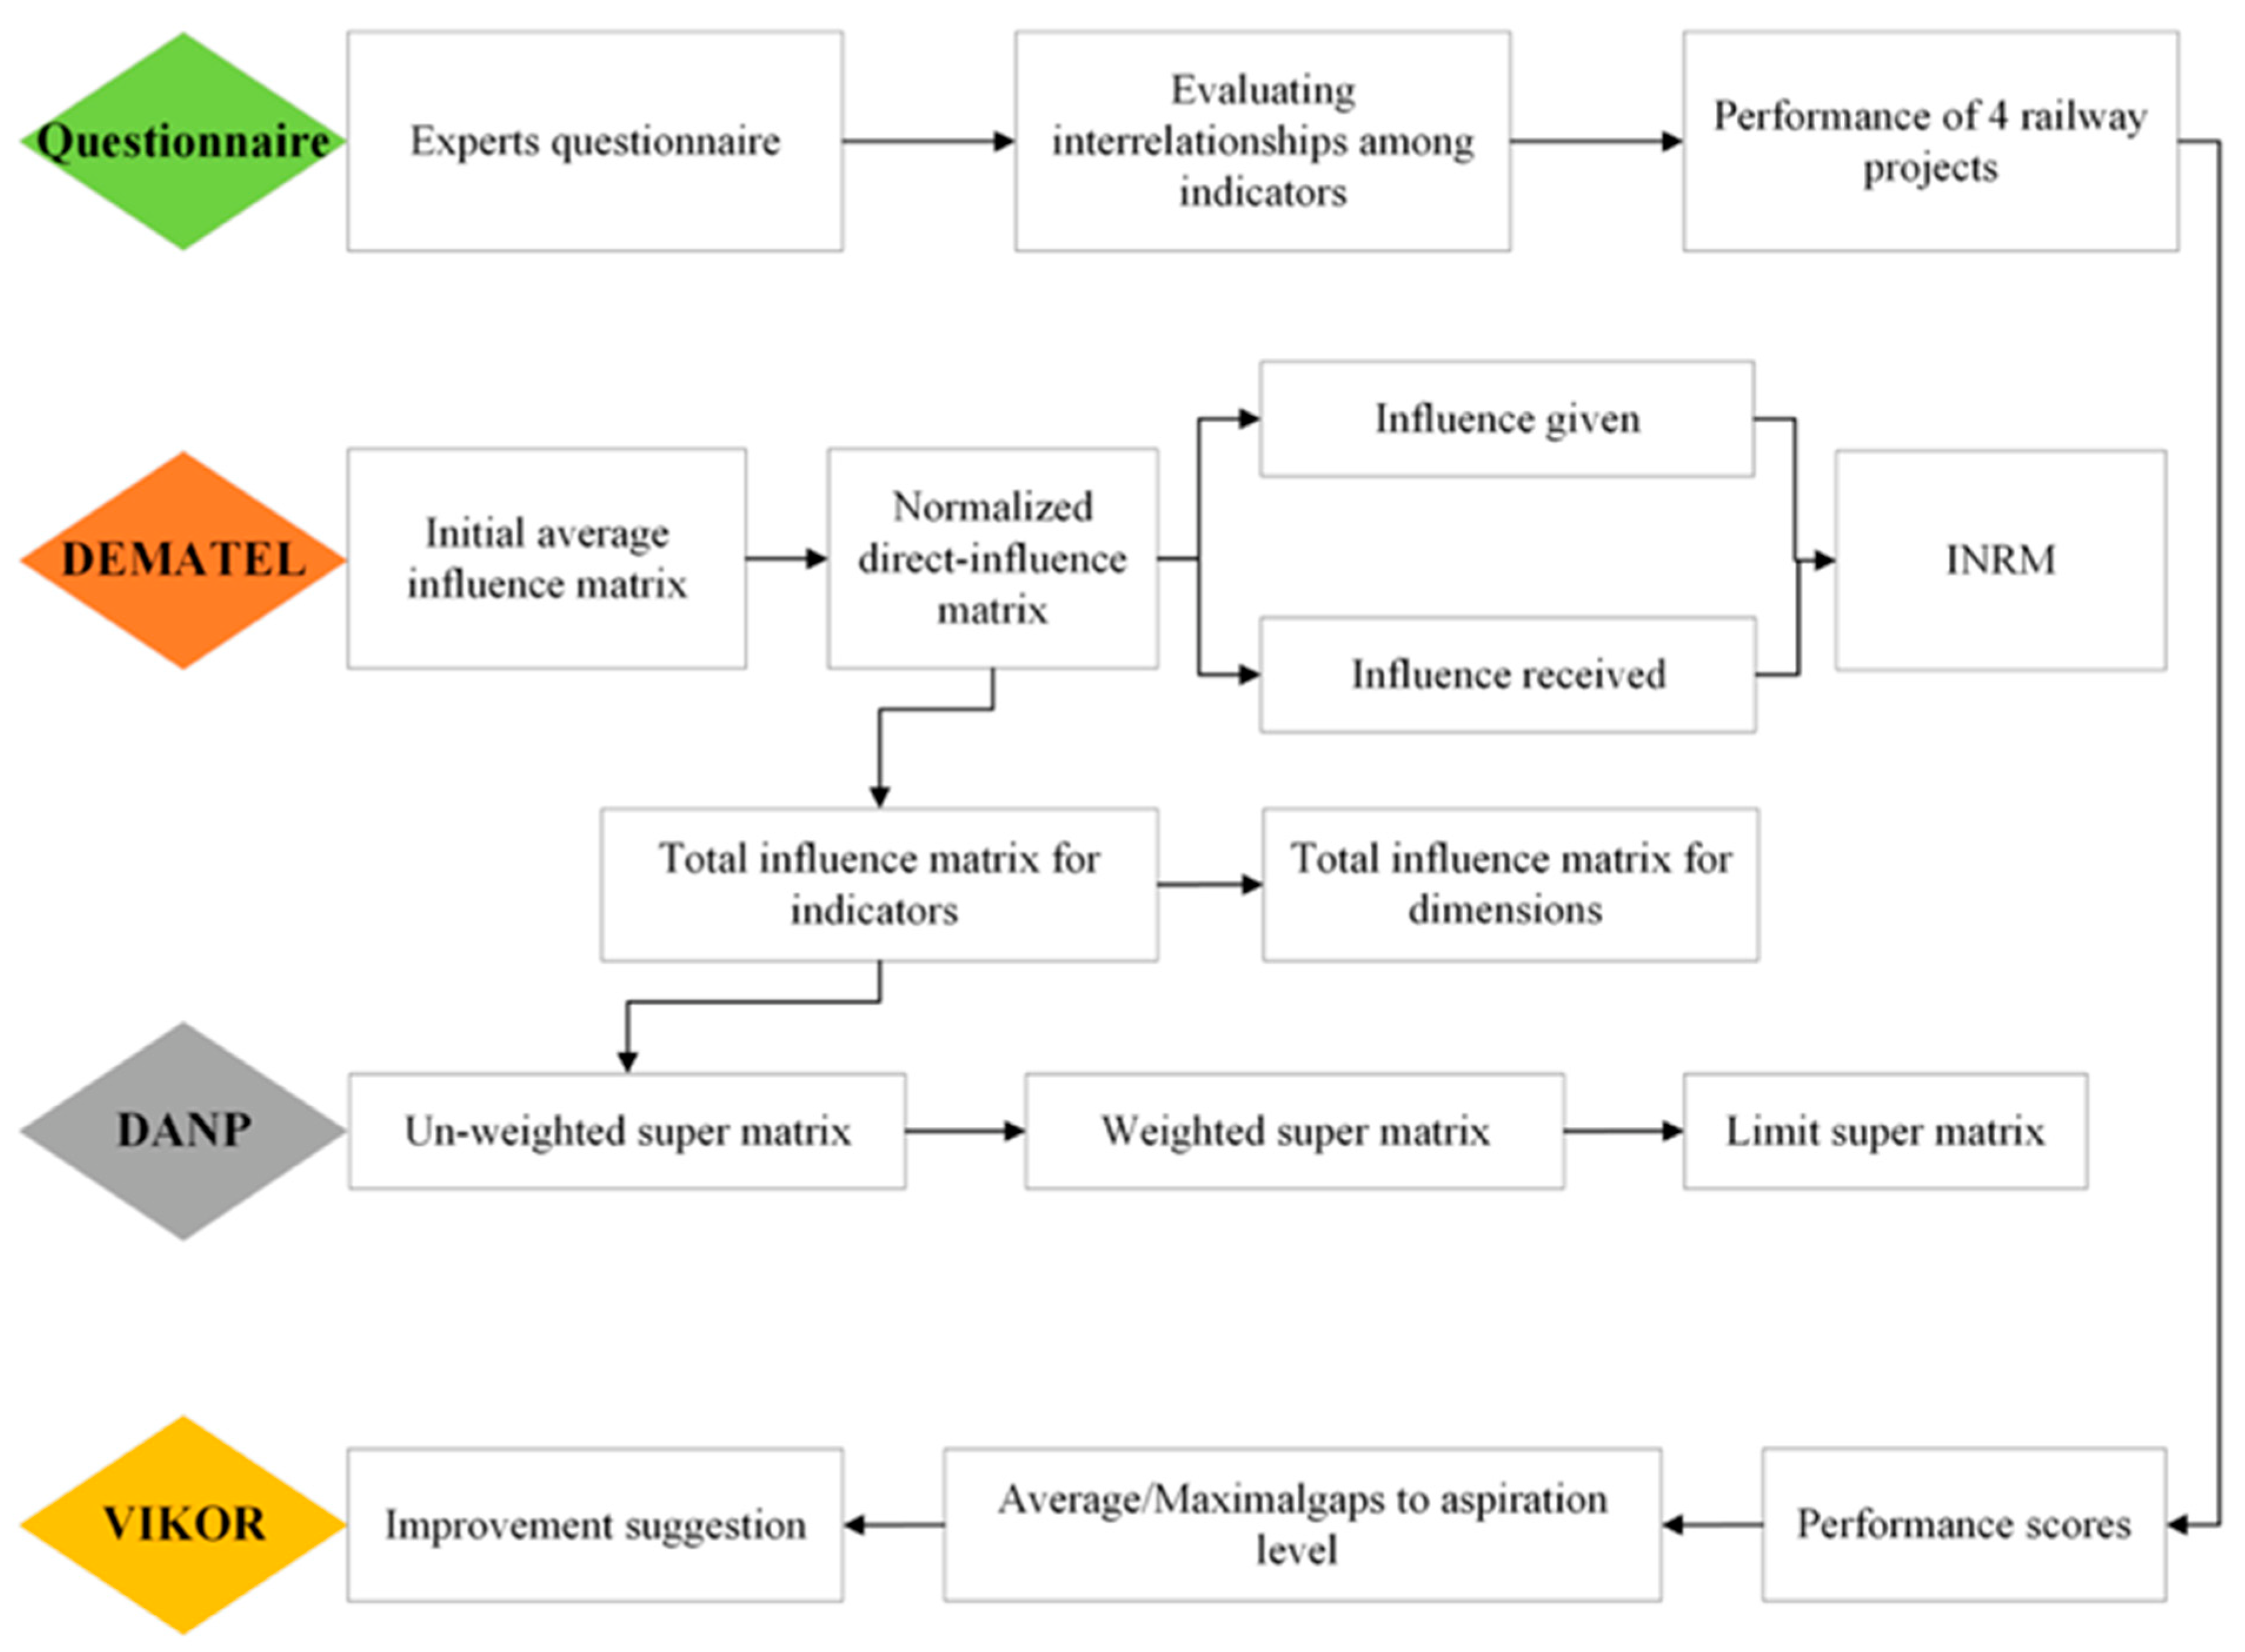
The proposed methodological framework can be divided into several steps: The first step is to select the key indicators. The next step is to use a hybrid MCDM model combining the DEMATEL method with the ANP method to determine the interrelationships and the weights of the indicators and dimensions. Finally, the modified VIKOR method ranks railway projects and provides improvement strategies for each project. The modeling processes are shown in Figure 1.

3.1. Exploration of Indicators

Indicators are fundamental in building a systemic assessment framework, because they can quantify evaluation and translate abstract concepts into concrete criteria [13]. The indicators should be clearly defined, accessible, quantifiable, standardized for comparison purposes, and reflective of various aspects of the study [54,55,56]. This study collated relevant railway sustainability assessment indicators from previous literature and used the top 20% of the most cited indicators. Considering the actual research situation and the difficulty of data collection, and after careful screening, 13 key indicators were finally selected.

3.1.1. Economic Dimension

The analysis of economic impacts has always been taken as the central part of assessing the sustainability of transportation. Some indicators have become standard measures that are used by many scholars, such as average fee, total investment, passenger loading factor, satisfaction, construction fee, cost-to-benefit ratio, income, etc. [8,18,20,57,58,59]. Punctuality and reliability are widely considered among economic effects [18,60,61], while Djordjević et al. regarded them as aspects of service quality in social consequences [8].

3.1.2. Environmental Dimension

Environmental indicators are significant, since there is some controversy about the impact of transportation on the environment. Generally, environmental indicators are divided into three main aspects: pollution production, energy consumption, and protection. Greenhouse gas emissions are the main cause of global warming—the primary environmental challenge in the 21st century—so it is crucial to monitor the emissions of CO2, NO2, and other gases. Moreover, other pollution emitted by vehicles—such as PM2.5, PM10, CH4, SO2, Nox, and noise pollution—should be seriously considered. Energy consumption has mainly referred to fossil fuel consumption in the past, but with people’s growing awareness of using clear and eco-friendly energy, electricity and other new energy sources are becoming important energy alternatives and analyzing their impacts on energy consumption is a growing trend [6,62,63]. Furthermore, to assess the protection of the environment, many indicators—including biodiversity, land use, impacts on habitats, vegetation coverage, soil erosion rates, and others—should be considered.

3.1.3. Social Dimension

Social impacts are related to people more directly, covering almost every activity in people’s daily lives. Security and safety are two key indicators that are vital in transit to improve the safety of transportation users, including drivers, passengers, pedestrians, etc. Accessibility and transportation efficiency (sometimes including punctuality and reliability) are taken to make all transportation more accessible and user-friendly and to improve service quality. In addition to these indicators that are relevant to people’s daily lives, many indicators consider the cultural aspects of preserving monuments and heritage, such as cultural heritage preservation. Moreover, transportation is evaluated to estimate its impacts on promoting social equity. Thus, affordability, accessibility for disabled people, and transportation subsidy rates in remote areas are important indicators [6,14,18,57].

3.2. Key Indicators and Their Classifications

According to the 2/8 rules, we chose the top 20% of the most frequent indicators for further analysis [64]. Not all of these indicators are helpful, due to the lack of data, the different situations in the study setting, etc. Therefore, the determination of indicators should use the following criteria [8]:
  • Indicators can describe railway objectives or issues.
  • Data for indicators are available in databases or can be collected from railway undertakings or operators.
  • Indicators can be classified into any dimension of sustainability (i.e., economic, environmental, and social).
  • Indicators should be relevant to the study case and its location.
  • Indicators should be understandable and readable to all potential users.
Based on the above principles, the indicators in the literature were screened and classified, and 13 key indicators falling into three dimensions were finally chosen, as shown in Table 2.

3.3. DEMATEL

DEMATEL (decision-making trial and evaluation laboratory) is a decision-making method developed by the Science and Human Affairs Program of the Battelle Memorial Institute of Geneva (United Nations) from 1972 to 1976. With DEMATEL, the causality and correlation between various factors are expected to emerge, and the indicators with substantial weighting or significant correlations can be tracked when reviewing key indicators. According to Gabus and Fontela [71] and other researchers [42,43,44,45,46], the DEMATEL method involves five steps (see Appendix B.1, stage 1).

3.4. DANP (DEMATEL-Based ANP)

The sustainability of a railway project usually consists of multiple dimensions/clusters, and the weight of influence of each indicator and dimension should be calculated. In the traditional ANP method, normalization is achieved by dividing indicators in the column by clusters so that each cluster can reach the same weight. However, the influence of one cluster on another might differ, so the assumption that each cluster is of equal weight is not suitable. The combination of DEMATEL and ANP can improve the traditional ANP method, since DEMATEL can determine the causality between indicators. DANP is a scientific tool to analyze the interaction and interdependence among the dimensions and indicators in real-world problems. DANP consists of two steps [47,48,49,50] (see Appendix B.2, stage 2).

3.5. Modified VIKOR

The VIKOR (Vlse Kriterijumska Optimizacija Kompromisno Resenje) method was developed to solve multi-criteria optimization problems of complex systems. The traditional VIKOR method mainly focuses on selecting and sorting alternatives. It can present the positive solution (represented by 1) and negative solution (represented by 0) while measuring how closely the alternatives can achieve the ideal solution. Thus, it might be hard to propose reasonable improvement strategies, due to the specific features of the traditional VIKOR method. Therefore, in 2007, Opricovic and Tzeng proposed an extended VIKOR method to improve the traditional VIKOR method based on the “aspiration level” research [72]. This optimized method allows decision-makers to assess the performance of different systems on a scale of 0–10, and has been used in a wide variety of applications. The modified VIKOR method is conducted in three steps [18,51,52,53,72] (see Appendix B.3, stage 3).

4. Case Study

4.1. Background and Problem Description

The construction of railways has developed rapidly in China, and China has become the pioneer in the railway industry—especially in terms of high-speed railways. Four railway projects in different regions of China were chosen to conduct a case study. Railway A is a high-speed railway that passes through the north and east of China; the area through which it passes is one of the areas with active socioeconomic development in China. Railway B is one of the four major projects of the new century in China, and has the highest altitude and longest line of any plateau railway in the world, connecting the central part of China with the southwest region. Railway C is the world’s longest completed high-speed railway that is open to traffic at this time, and is located in Northwest China; it is the critical project of China’s medium- and long-term railway network planning and an essential part of the railway corridor of the Asia–Europe Continental Bridge. Railway D is a high-speed railway located in Northeast China, and is the first in China and the world to put a new high-speed railway in an alpine region. The locations and routes of the railways are presented in Table 3.

4.2. Data Collection

Various resources were used to collect the data related to these four railway projects, such as feasibility reports of railways, environmental evaluation reports, news reports, the Railway Statistical Bulletin released by the National Railway Administration, etc. Moreover, a questionnaire was designed and allocated to experts to determine their opinions about the interrelationships among indicators and dimensions as well as the performance scores in each indicator. The experts who participated in the questionnaire were a mix of academics and people with extensive working experience in the railway industry.

4.3. Measuring Relationships among Dimensions and Indicators Using DEMATEL

In this study, the DEMATEL method was adopted first, and the experts (information listed in Appendix A) were asked to determine the degree of influence of each indicator on the other indicators. The average initial influence matrix A could be obtained pairwise by comparing indicators, see Table 4. The significance reached the 97.4% confidence level—greater than 95%—so the experts’ opinions were consistent and credible. Then, the initial average matrix was normalized from Equations (A1)–(A3) to obtain the normalized direct influence matrix Z, see Table 5.
Next, the total influence matrices TC and TD were derived using Equation (A4), TC is shown in Table 6. After that, the r and c in the total influence matrix were calculated using Equations (A7) and (A8), illustrating the cause and effect values of the indicators and dimensions, and the INRM (Figure 2, Figure 3, Figure 4 and Figure 5) was drawn to visualize the complex relationships.
Table 7 demonstrates how the cause and effect relationships impact the indicators. Taking the economic dimension as an example, the indicators can be prioritized as Ec1 > Ec2 > Ec4 > Ec3 based on the (r + c) values. The most important indicator in the economic dimension is cost, with a value of 21.015, while reliability in the economic dimension influences the other indicators the least, with a value of 19.634. Additionally, the values of Ec2 and Ec3 are negative. These two indicators are most likely affected by other indicators and belong to the affected group.
Likewise, Table 8 shows the cause and effect relationships between dimensions. The three dimensions can be prioritized in the order economic > social > environmental based on their (r + c) values. The economic dimension has the most substantial influence in term of the strength of its relationships, with a value of 4.733, while the environmental dimension influences other dimensions to the lowest degree, with a value of 4.172. When considering the value of (r − c), the social dimension is more likely to be affected by other dimensions, which means that it belongs to the affected group.

4.4. Weighting Each Indicator and Dimension Using the DANP Technique

Our research combined the DEMATEL and ANP methods to obtain the adjusted influence weights. By using Equations (A9)–(A11), the total influence matrix TC was normalized to obtain the T C n o r and the unweighted supermatrix W c . Then, the normalized total matrix T D N o r and the weighted supermatrix W D α could be obtained by Equations (A12) and (A13), respectively. Finally, the limit supermatrix W = lim φ W D α φ was converted into a long-term and stable supermatrix. Through this matrix, the global and local weights of all indicators and their ranks could be confirmed.
The weights and priority of the dimensions and indicators of the railways were obtained by using the DANP method, and the detailed calculation process is shown in Table 9, Table 10, Table 11, Table 12 and Table 13.
Table 14 lists the global and local weights of all indicators and dimensions. It can be seen that the economic dimension ranks first in the local weighting, followed by the social and environmental dimensions. Moreover, the priority of indicators in each dimension was extended from the local weights. Taking the economic dimension as an example, mobility is the priority.

4.5. Evaluating the Performance of Railways Based on the VIKOR Method

Experts were asked to score each railway project’s performance according to related data on these projects. They gave the scores on a scale of 0–10, with 0 indicating very bad and 10 indicating the best. Then, the average scores were used and applied with the VIKOR model to determine the gaps from the intended level, total gap, average gap, and maximal gaps of different railway projects, as shown in Table 14.

4.6. Sensitivity Analysis

Sensitivity analysis was conducted to verify the stability and validity of the proposed framework in different scenarios. According to previous research [33,73], it is necessary to change the value of α in the range of 0–1 to examine the effect of the comprehensive index on the result and the optimal answer. The results of the sensitivity analysis are presented in Table 15. The results are consistent in all scenarios, demonstrating that the proposed approach is robust and efficient in dealing with MCDM problems.

4.7. Comparative Analysis

It is very important to be sure of whether or not the results are valid, and the calculations should be performed using other methods. We selected TOPSIS and COPRAS, consistent with some previous articles [74,75,76]. TOPSIS and VIKOR are based on an aggregating functions representing ‘‘closeness to the ideal’’, which originate in the compromise programming method. COPRAS is one of the most frequently used MCDM methods. The results in Table 16 and Table 17 show that the ranking of TOPSIS and COPRAS is consistent with that of VIKOR, which could prove the robustness of the results in this research.

5. Results and Discussion

As the existing indicators formed a relatively standardized system, a corresponding standard procedure was developed for data disclosure. Still, there were some discoveries. According to the results of DANP, the weights of the three dimensions are as follows: economic (0.347), social (0.342), and environmental (0.311)—which means that experts still regard the economic dimension as the most important part of the evaluation, and that the economic dimension has more influence over the other two dimensions, which is consistent with some previous findings [18,77]. However, in this study, the experts considered the social dimension to be an affected dimension, meaning that the economic and environmental factors would influence it. Meanwhile, in some other research, the environmental dimension was the affected one [18]. The indicators with high weights were mobility (0.092), satisfaction (0.092), safety (0.088), reliability (0.086), and productivity (0.086). This indicates that the average velocity of railways is very important in different regions. This differs from the findings of a previous study [18], and may be closely related to the huge size of China’s territory, as people travel a long distance from the departure to their destination, and the speed determines the efficiency of travel.
Moreover, transportation is developed with the goal of serving people, and satisfaction is an intuitive feedback indicator, so it occupies a rather important position in the assessment. Safety, reliability, and productivity had similar importance compared with other evaluation research [8,14,18]. The indicators in the environmental dimension had a low degree of influence. This indicates two facts: First, people are now considering the economic and social dimensions more because they are more directly related to people’s daily lives. Although the railway industry has begun to emphasize the importance of environmental sustainability, as China is still a developing country, the focus of railway development remains on the economic dimension. Second, the environmental dimension is influenced more by the features of railway operation and the energy structure at present, so people can only urge the adoption of new energy and reduction in GHG emissions, meaning that the effectiveness of the adoption of environmental measures may not be achieved for a short period.
According to the results of VIKOR, the total performance scores of the four railway projects (A–D) were 8.243, 6.433, 6.354, and 7.616. Railway A was the best, followed by railways D, B, and C. This may relate to the spatial distribution of each project. The performance of the railway projects was similar to the findings of some previous studies, but new discoveries were also made. Railway A passes through China’s eastern and central regions, while railway B is in the west. These two railway projects showed a significant difference in economic sustainability but a slight difference in social sustainability. Additionally, according to Stefaniec et al., in 2015, the inland transport in the eastern and western zones were very polarized in terms of social sustainability, while the central zone contained provinces with a medium level of social sustainability [78]. The border regions without access to the sea present very low economic sustainability, and the innermost areas are generally rather low. The results of this research confirm the part of economic sustainability. However, the differences between the east and west regions in terms of social sustainability have been widely reduced in the past seven years. Moreover, Railway C runs through the northwest area of China, while Railway D is in the northeast. Stefaniec et al. pointed out that inland transport in the west and northeast parts of China is characterized by low performance in environmental sustainability. Still, Railways C and D demonstrate that environmental sustainability is promoted in both regions [
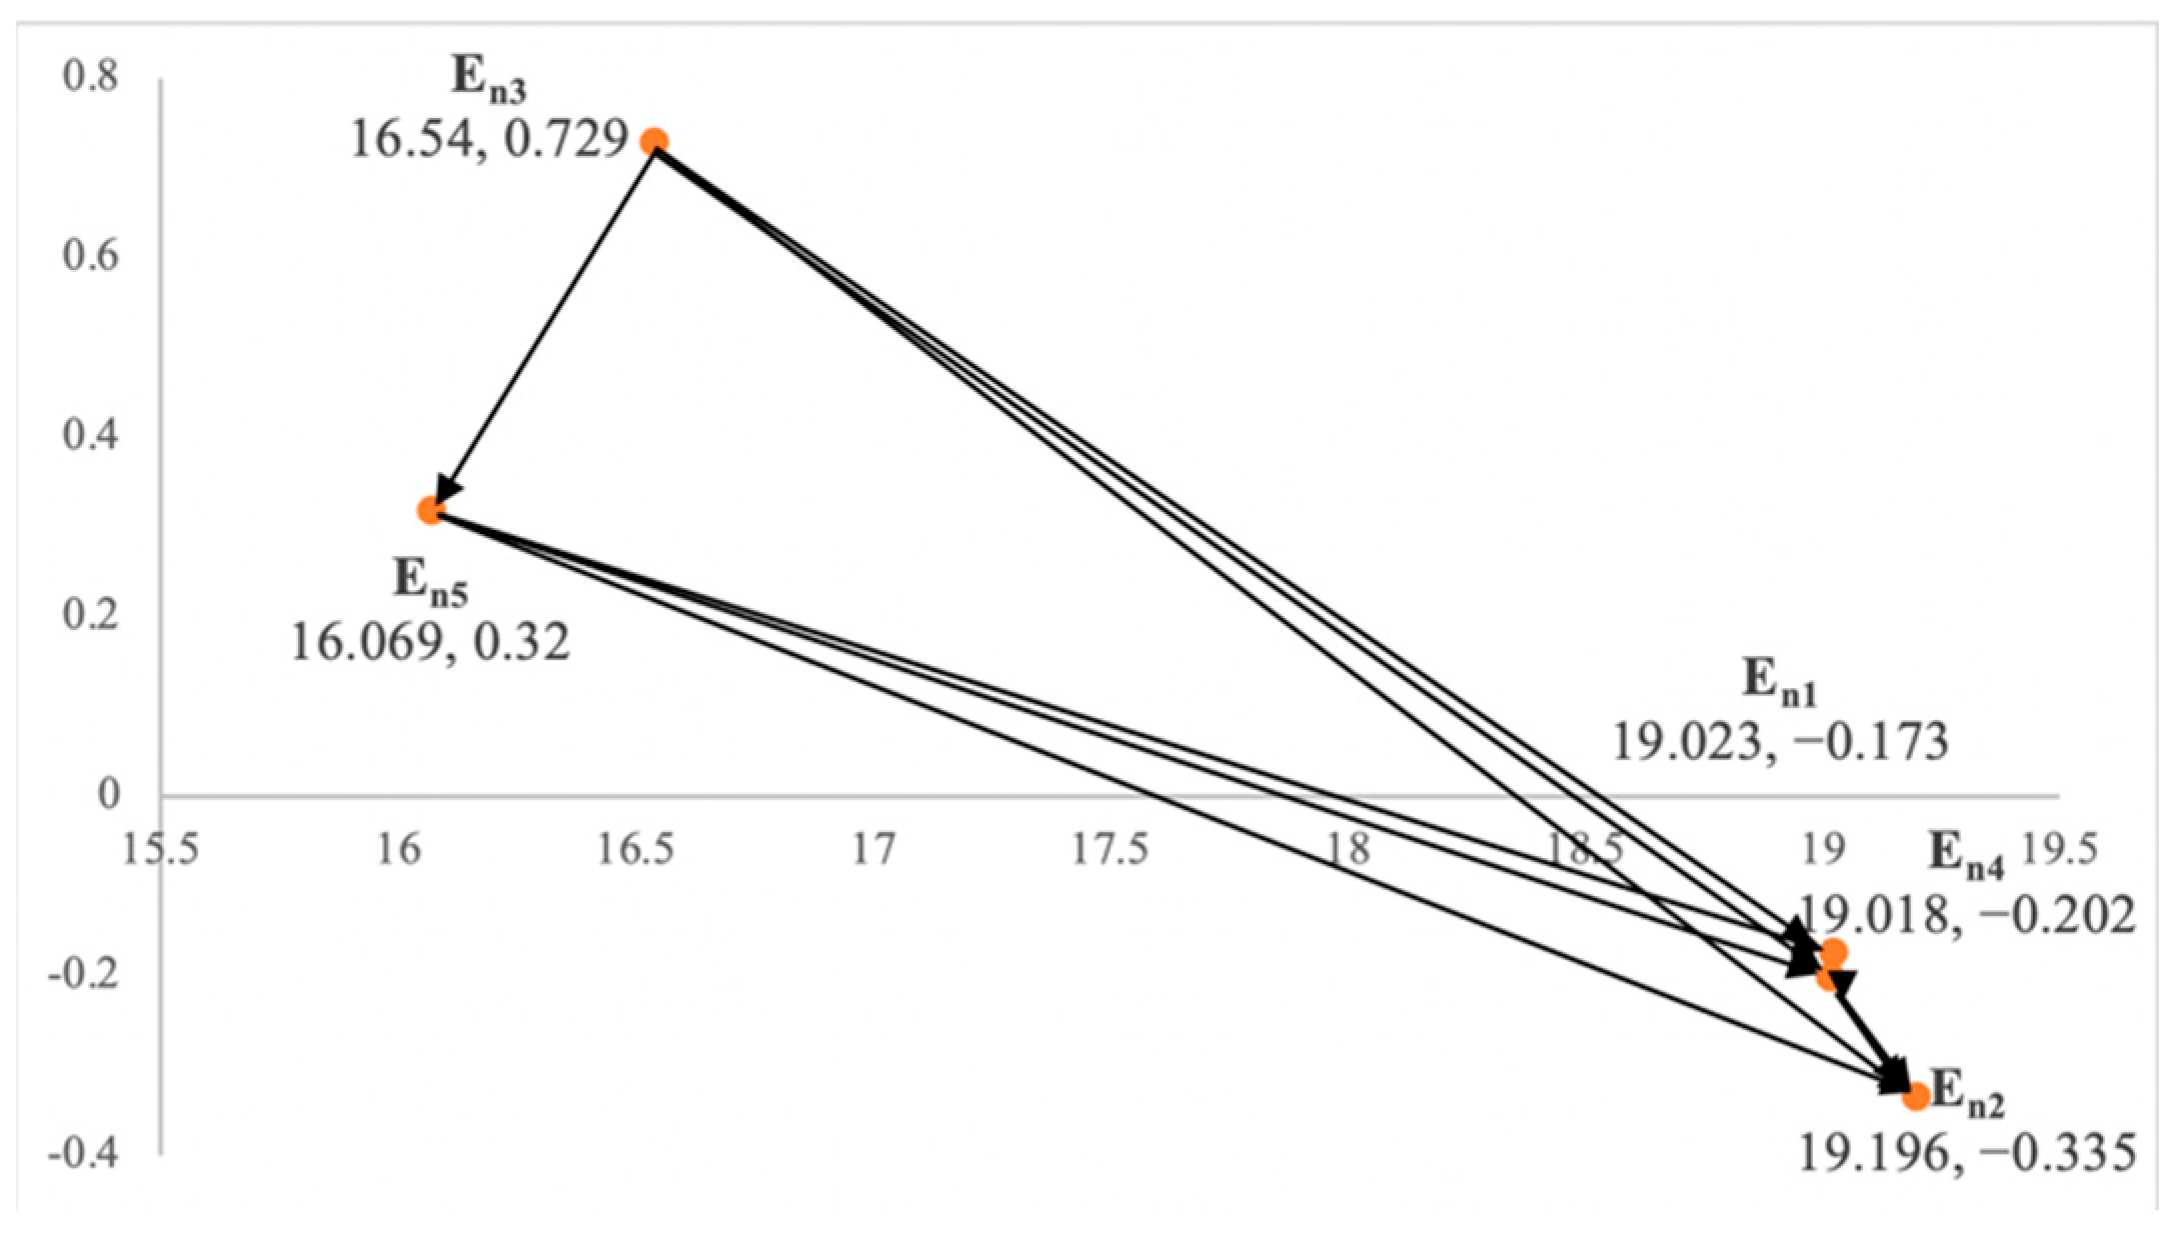
78]. Despite the ranking of the four railway projects, their gaps from their desired levels could provide detailed improvement suggestions for each railway. For example, although Railway A was the best in the assessment, the average gap to its aspiration level was 0.110. To minimize this gap, some improvement suggestions can be adopted, such as promoting the use of new energy sources (En4), reducing total energy consumption (En2), reducing GHG emissions (En1), etc. The maximum gaps all occur in renewable energy, which could be the most crucial indicator for improving railways’ sustainability.
Based on the above results, some managerial and policy implication suggestions can be proposed. In selecting indicators, many indicators characteristic of developing countries could not be used for the sustainability evaluation of railway projects due to missing data. These missing data may cause many valuable indicators to lose their research significance, especially when establishing a developing-country-centered indicator system. Government departments should urge relevant parties to disclose valid and real data promptly to provide feedback to policymakers and facilitate adjustments to improve applicable development policies.
The interplay between the three dimensions was explored in this study, and some new ideas were provided, such as increasing investment in ecological and environmental protection, improving railway capacity, promoting the use of new energy, etc. The low level of influence of the environmental dimension deserves to be considered, as it indicates that the consideration of environmental protection is still lacking in current railway construction. There is still a need to constantly update railway development policies, construction concepts, purposes, and measures. Second, the DANP weights implied the degree of influence of the indicators. Optimizing indicators with high impact weights may have a more critical effect on the sustainability of overall railway projects.
Moreover, the sustainability assessment of the four projects reflected the sustainable development of transportation in different regions of China. With the introduction of a series of national policies focusing on supporting and developing the western region over the past few years, transport sustainability in the western region has made some progress. However, there is still plenty of room for improvement in the western region—especially in terms of economic sustainability—compared to the central and eastern areas. The railway development policy of each site should be tailored to the regional characteristics, considering the actual situation. The above recommendations could help to eliminate the disparities in regional railway development and, finally, achieve the Sustainable Development Goals.

6. Conclusions

This study adopted a hybrid MCDM model to evaluate the sustainability of railway projects in different regions of China. The indicators used in the study were those that appear very frequently in the existing literature and apply to developing countries. The weights of each indicator were initially investigated and subsequently calculated based on the questionnaire results in the follow-up expert interviews. It is worth noting that some common indicators have already formed a standardized system in developed-country-oriented evaluations, which may be reflected in their different weights in the assessment of developing countries. The findings of this study could provide a practical and comprehensive guideline for policymakers in evaluating and improving transportation systems. This research indicates some regions’ current situation and characteristics of sustainable transportation development, and could help to eliminate regional inequalities in railway development, achieve sustainability goals, and promote synergistic development across regions in developing countries.
There are also some limitations to this study. One is that only a small number of experts were surveyed, rather than an industry-wide survey covering all levels. Although the consistency of the survey passed the test, there are inevitably some subjective differences in awareness. Future research should expand the scope of the survey and solicit more people’s opinions so that the whole assessment can be more objective, professional, and scientific. Secondly, this study only compares railway projects’ sustainability in different regions and does not consider differences in the construction time, construction techniques, or construction purpose. Furthermore, the access to data is limited because much information was unavailable due to confidentiality issues. In future studies, adding indicators that consider construction time, construction technology, and construction purpose for further sustainability assessment would be significant.

Author Contributions

Conceptualization, Z.L.; methodology, Z.L.; data curation, Z.L.; writing—original draft preparation, Z.L.; writing—review and editing, Z.L.; supervision, Y.Z. All authors have read and agreed to the published version of the manuscript.

Funding

This research was supported by the China Railway Group Limited and Central South University (Grant No. 21-Major-06).

Conflicts of Interest

The authors declare no conflict of interest.

Appendix A. Experts’ Information

BackgroundNo.Job TitleAffliction
Academic1ProfessorSchool of Energy Science and Engineering at the university
2ProfessorSchool of Civil Engineering at the university
3Associate professorSchool of Civil Engineering at the university
4Associate professorSchool of Energy Science and Engineering at the university
5PHDDepartment of Industrial and Systems Engineering at the university
6PHDDepartment of Industrial and Systems Engineering at the university
7PHDSchool of Energy Science and Engineering at the university
8PHDSchool of Civil Engineering at the university
Railway construction9Group leaderRailway construction company
10Section chiefRailway construction company
11DirectorRailway construction company
12ManagerRailway construction company
13Deputy directorRailway construction company
14ManagerRailway construction company
15EngineerRailway construction company

Appendix B. Detailed Calculation Process

Appendix B.1. Stage 1: DEMATEL

Step 1: Define key indicators and determine the degree of impact.
The degree of influence is divided into a 5-point scale, with the degree of correlation being 0 (no influence), 1 (very low influence), 2 (low influence), 3 (influence), or 4 (major influence).
Step 2: Construct the initial average influence matrix A.
The knowledge-based experts are required to determine the direct influence by comparing pairs of indicators. If they believe that the indicator i influences the indicator j, they should indicate this by b i j . Thus, the initial average influence matrix A can be obtained as follows:
A = b i j n × n
Step 3: Normalize the initial average influence matrix A to construct the normalized direct influence matrix Z.
Z = k A
k = m i n 1 max i j = 1 n b i j , 1 max j i = 1 n b i j ,   i , j 1 , 2 , n
Step 4: Attain the total influence matrices TC (indicators) and TD (dimensions/clusters).
T C = Z + Z 2 + Z 3 + + Z l = Z I Z 1 ,   lim l Z l = 0 n × n
where i , j 1 , 2 , n ,   I presents the identity matrix Z = z c i j n × n , 0 z c i j < 1 , 0 < j = 1 n z c i j 1 , and 0 < i = 1 n z c i j 1 , and at least one row or column of the summation equals one—in this case, lim l Z l = 0 n × n can be guaranteed.
That is,
Sustainability 14 12065 i001
where D m is the mth dimension, c m m is the nth indicator of the mth dimension, j = 1 m m j = n , and T c i j is the m i × m j matrix in the indicator.
The total influence matrix for dimension T D is obtained as follows:
T D = T D 11 T D 1 j T D 1 m T D i 1 T D i j T D i m T D m 1 T D m j T D m m n × n m < n , j = 1 m m j = n
Step 5: Compute the cause and effect values.
The rows and columns are summed up separately to obtain the sum vectors r (rows) and c (columns).
r = j = 1 n t i j n × 1 = t c i n × 1 = r 1 , , r i , , r n
c = i = 1 n t i j 1 × n = t c j n × 1 = c 1 , , c j , , c n
The horizontal axis vector (r + c) is defined by adding r to c, representing the indicator’s importance. Similarly, (rc), the vertical axis vector, is determined by subtracting r from c, and separates the indicators into a cause cluster and an affected cluster. Generally, as (rc) is positive, this indicator is part of the cause cluster. In contrast, if (rc) is negative, the indicator is part of the affected group.

Appendix B.2. Stage 2: DANP

Step 1: Attain the normalized total influence matrices T C n o r (indicators) and T D n o r (dimensions/clusters), along with the supermatrices.
The normalization of the total influence matrix T C is to divide each element by the sum of the row. Therefore, the normalized total influence matrix can be represented as T C n o r .
Sustainability 14 12065 i002
If we take T c N o r 11 as an example to display the normalization solution, d i 11 = j = 1 m t c i j 11 , i = 1, 2, …, m1:
T c N o r 11 = t c 11 11 d 1 11 t c 1 j 11 d 1 11 t c 1 m 1 11 d 1 11 t c i 1 11 d i 11 t c i j 11 d i 11 t c i m 1 11 d i 11 t c m 1 1 11 d m 1 11 t c m 1 j 11 d m 1 11 t c m 1 m 1 11 d m 1 11
Then, the unweighted supermatrix W c is obtained as follows:
Sustainability 14 12065 i003
The normalized total influence matrix for dimension T D N o r is obtained by normalizing T D , d i = j = 1 n t D i j , i = 1, 2, …, n:
T D N o r = t D 11 d 1 t D 1 j d 1 t D 1 m d 1 t D i 1 d i t D i j d i t D i m d i t D m 1 d m t D m j d m t D m m d m
and then T D N o r is applied with W c to attain the weighted supermatrix W D α , where j = 1 m m j = n and t D α i j is a scalar:
W D α = T D N o r × W c = t D 11 d 1 × W c 11 t D 1 j d 1 × W c i 1 t D 1 m d 1 × W c m 1 t D i 1 d i × W c 1 j t D i j d i × W c i j t D i m d i × W c m j t D m 1 d m × W c 1 m t D m j d m × W c i m t D m m d m × W c m m n × n m < n , j = 1 m m j = n
Step 2: Obtain the weights of DANP.
Finally, the weighted supermatrix will self-multiply 100 times until it converges and becomes a long-term and stable supermatrix, and this new matrix is called the limit supermatrix. Eventually, through this matrix, the overall priority order vector W = W 1 , , W j ,   W n will be obtained from W = lim φ W D α φ , which defines the influence weight.

Appendix B.3. Stage 3: Modified VIKOR

Step 1: Find the normalized gap y k j
y k j = f j * f k j f j * f j
where f j * is the best value, and the aspiration level while f j is the worst value, also called the tolerable level of all indicators, j = 1, 2, , n.
Step 2: Compute the average and maximal gaps to the aspiration level.
The general form of L p m e r t i c can be represented as L p k = j = 1 n w j × y k j p 1 p , where 1 p ; k = 1 , 2 , , k . To apply the L p m e r t i c , the average gap S k and maximal gap Q k to aspiration level are computed as follows:
S k = L k p = 1 = j = 1 n W j × f j * f k j f j * f j
Q k = L k p = = max j f j * f k j f j * f j | j = 1 , 2 , , n
where W j represents the influential weight in DANP, while f k j represents the socre of the indicator j.
Step 3: Obtain the comprehensive index H k .
In order to obtain the optimized solution, a decision-making parameter α is set to attain the comprehensive index H k .
H k = α S k S * S S * + 1 α Q k Q * Q Q *
The principle of minimizing the integration gap—i.e., m i n k L k p —is adopted here, and at the smallest p (i.e., p = 1 )—that is, m i n k S k —the group benefits are emphasized, meaning that the maximum group utility is utilized. Hence, S * = m i n k S k —i.e., ( S * = 0 )—and S = m a x k S k —i.e., ( S = 1 )—are set. On the other hand, the individual benefit is emphasized when p is approaching infinity (i.e., p = )—that is, m i n k Q k —which means that the fewest individual regrets are utilized. Hence, Q * = m i n k Q k —i.e., ( Q * = 0 )—and Q = m a x k S k —i.e., ( Q = 1 )—are set. The parameter α is set to be 0.5 by default.

References

  1. Ai, B.; Briso-Rodriguez, C.; Cheng, X.; Kürner, T.; Zhong, Z.; Guan, K.; He, R.; Xiong, L.; Matolak, D.W.; Michelson, D.G. Challenges Toward Wireless Communications for High-Speed Railway. IEEE Trans. Intell. Transp. Syst. 2014, 15, 2143–2158. [Google Scholar] [CrossRef]
  2. Ministry of Transport of the People’s Republic of China. Statistical Bulletin on the Development of the Transport Sector in 2020. 2021. Available online: https://xxgk.mot.gov.cn/2020/jigou/zhghs/202105/t20210517_3593412.html (accessed on 19 May 2021).
  3. Ministry of Transport of the People’s Republic of China (MOT). Green Transportation Standards System 2016; MOT: Beijing, China, 2016.
  4. The State Council Information Office of the People’s Republic of China. Sustainable Development of Transportation in China 2020. Available online: http://www.scio.gov.cn/zfbps/32832/Document/1695297/1695297.htm (accessed on 22 December 2020).
  5. Liddle, B.; Moavenzadeh, F. The Sustainability Challenge for Climate Change: Balancing Inter- and Intragenerational Equity; Springer: Berlin/Heidelberg, Germany, 2002; Volume 1, pp. 195–214. [Google Scholar]
  6. Illahi, U.; Mir, M.S. Assessment of transport sustainability using a hybrid approach: A comparison of four metropolitan cities of India. Case Stud. Transp. Policy 2021, 9, 703–714. [Google Scholar] [CrossRef]
  7. Yi, C.; Zhang, Q. Evaluation Model of Sustainable Development for Railway Transportation Based on BP Neural Network. In Proceedings of the 2013 Sixth International Symposium on Computational Intelligence and Design, Washington, DC, USA, 28–29 October 2013. [Google Scholar]
  8. Djordjević, B.; Mane, A.S.; Krmac, E. Analysis of dependency and importance of key indicators for railway sustainability monitoring: A new integrated approach with DEA and Pearson correlation. Res. Transp. Bus. Manag. 2021, 41, 100650. [Google Scholar] [CrossRef]
  9. Greene, D.L.; Wegener, M. Sustainable transport. J. Transp. Geogr. 1997, 5, 177–190. [Google Scholar] [CrossRef]
  10. Janic, M. Sustainable Transport in the European Union: A Review of the Past Research and Future Ideas. Transp. Rev. 2006, 26, 81–104. [Google Scholar] [CrossRef]
  11. Litman, T.; Burwell, D. Issues in sustainable transportation. Int. J. Glob. Environ. Issues 2006, 6, 331–347. [Google Scholar] [CrossRef]
  12. Zhao, X.; Ke, Y.; Zuo, J.; Xiong, W.; Wu, P. Evaluation of sustainable transport research in 2000–2019. J. Clean. Prod. 2020, 256, 120404. [Google Scholar] [CrossRef]
  13. Leal, I.C.; D’Agosto, M.d.A. Modal choice evaluation of transport alternatives for exporting bio-ethanol from Brazil. Transp. Res. Part D Transp. Environ. 2011, 16, 201–207. [Google Scholar] [CrossRef]
  14. Litman, T. Developing Indicators for Comprehensive and Sustainable Transport Planning. Transp. Res. Rec. J. Transp. Res. Board 2007, 2017, 10–15. [Google Scholar] [CrossRef]
  15. Awasthi, A.; Omrani, H. A goal-oriented approach based on fuzzy axiomatic design for sustainable mobility project selection. Int. J. Syst. Sci. Oper. Logist. 2017, 6, 86–98. [Google Scholar] [CrossRef]
  16. Awasthi, A.; Omrani, H.; Gerber, P. Multicriteria Decision Making for Sustainability Evaluation of Urban Mobility Projects; LISER Working Paper Series; Institute of Socio-Economic Research (LISER): Luxembourg, 2013. [Google Scholar]
  17. Awasthi, A.; Govindan, K.; Gold, S. Multi-tier sustainable global supplier selection using a fuzzy AHP-VIKOR based approach. Int. J. Prod. Econ. 2018, 195, 106–117. [Google Scholar] [CrossRef]
  18. Rao, S.-H. A hybrid MCDM model based on DEMATEL and ANP for improving the measurement of corporate sustainability indicators: A study of Taiwan High Speed Rail. Res. Transp. Bus. Manag. 2021, 41, 100657. [Google Scholar] [CrossRef]
  19. Garg, C.; Kashav, V. Assessment of Sustainable Initiatives in the Containerized Freight Railways of India using Fuzzy AHP Framework. Transp. Res. Procedia 2020, 48, 522–539. [Google Scholar] [CrossRef]
  20. Azzouz, L.; Jack, A. Benchmarking the sustainability reporting of High-Speed Railways (HSRs): Towards a state-of-the-art benchmarking and reporting framework for HSRs. J. Clean. Prod. 2019, 250, 119505. [Google Scholar] [CrossRef]
  21. Esty, D.C.; Levy, M.; Srebotnjak, T.; Sherbinin, A. Environmental sustainability index: Benchmarking national environmental stewardship. New Haven. Yale Cent. Environ. Law Policy 2005, 47, 60. [Google Scholar]
  22. Mori, K.; Christodoulou, A. Review of sustainability indices and indicators: Towards a new City Sustainability Index (CSI). Environ. Impact Assess. Rev. 2012, 32, 94–106. [Google Scholar] [CrossRef]
  23. Shen, L.; Zhou, J. Examining the effectiveness of indicators for guiding sustainable urbanization in China. Habitat Int. 2014, 44, 111–120. [Google Scholar] [CrossRef]
  24. Liu, H.; Zhou, G.; Wennersten, R.; Frostell, B. Analysis of sustainable urban development approaches in China. Habitat Int. 2014, 41, 24–32. [Google Scholar] [CrossRef]
  25. Tan, Y.; Xu, H.; Zhang, X. Sustainable urbanization in China: A comprehensive literature review. Cities 2016, 55, 82–93. [Google Scholar] [CrossRef]
  26. Liu, B.; Yang, Z.; Xue, B.; Zhao, D.; Sun, X.; Wang, W. Formalizing an integrated metric system measuring performance of urban sustainability: Evidence from China. Sustain. Cities Soc. 2022, 79, 103702. [Google Scholar] [CrossRef]
  27. Qiu, W.; Liu, Y.; Lu, F.; Huang, G. Establishing a sustainable evaluation indicator system for railway tunnel in China. J. Clean. Prod. 2020, 268, 122150. [Google Scholar] [CrossRef]
  28. Li, S.; Lang, M.; Yu, X.; Zhang, M.; Jiang, M.; Tsai, S.; Wang, C.-K.; Bian, F. A Sustainable Transport Competitiveness Analysis of the China Railway Express in the Context of the Belt and Road Initiative. Sustainability 2019, 11, 2896. [Google Scholar] [CrossRef]
  29. Kijewska, K.; Torbacki, W.; Iwan, S. Application of AHP and DEMATEL Methods in Choosing and Analysing the Measures for the Distribution of Goods in Szczecin Region. Sustainability 2018, 10, 2365. [Google Scholar] [CrossRef]
  30. Moslem, S.; Duleba, S. Sustainable Urban Transport Development by Applying a Fuzzy-AHP Model: A Case Study from Mersin, Turkey. Urban Sci. 2019, 3, 55. [Google Scholar] [CrossRef]
  31. Moslem, S.; Ghorbanzadeh, O.; Blaschke, T.; Duleba, S. Analysing Stakeholder Consensus for a Sustainable Transport Development Decision by the Fuzzy AHP and Interval AHP. Sustainability 2019, 11, 3271. [Google Scholar] [CrossRef]
  32. Singh, A.; Gurtu, A.; Singh, R.K. Selection of sustainable transport system: A case study. Manag. Environ. Qual. 2020, 32, 100–113. [Google Scholar] [CrossRef]
  33. Seker, S.; Aydin, N. Sustainable Public Transportation System Evaluation: A Novel Two-Stage Hybrid Method Based on IVIF-AHP and CODAS. Int. J. Fuzzy Syst. 2020, 22, 257–272. [Google Scholar] [CrossRef]
  34. Rivero Gutiérrez, L.; De Vicente Oliva, M.A.; Romero-Ania, A. Managing Sustainable Urban Public Transport Systems: An AHP Multicriteria Decision Model. Sustainability 2021, 13, 4614. [Google Scholar] [CrossRef]
  35. Sharma, H.; Roy, J.; Kar, S.; Prentkovskis, O. Multi Criteria Evaluation Framework for Prioritizing Indian Railway Stations Using Modified Rough AHP-Mabac Method. Transp. Telecommun. 2018, 19, 113–127. [Google Scholar] [CrossRef]
  36. Manzolli, J.A.; Trovão, J.P.; Henggeler Antunes, C. Scenario-Based Multi-criteria Decision Analysis for Rapid Transit Systems Implementation in An Urban Context. eTransportation 2021, 7, 100101. [Google Scholar] [CrossRef]
  37. Morfoulaki, M.; Papathanasiou, J. Use of PROMETHEE MCDA Method for Ranking Alternative Measures of Sustainable Urban Mobility Planning. Mathematics 2021, 9, 602. [Google Scholar] [CrossRef]
  38. Bojkovic, N.; Anić, I.; Pejcic-Tarle, S. One solution for cross-country transport-sustainability evaluation using a modified ELECTRE method. Ecol. Econ. 2010, 69, 1176–1186. [Google Scholar] [CrossRef]
  39. Romero-Ania, A.; Rivero Gutiérrez, L.; De Vicente Oliva, M.A. Multiple Criteria Decision Analysis of Sustainable Urban Public Transport Systems. Mathematics 2021, 9, 1844. [Google Scholar] [CrossRef]
  40. Al-Thawadi, F.E.; Weldu, Y.W.; Al-Ghamdi, S.G. Sustainable Urban Transportation Approaches: Life-Cycle Assessment Perspective of Passenger Transport Modes in Qatar. Transp. Res. Procedia 2020, 48, 2056–2062. [Google Scholar] [CrossRef]
  41. Sharma, H.K.; Majumder, S.; Biswas, A.; Prentkovskis, O.; Kar, S.; Skačkauskas, P. A Study on Decision-Making of the Indian Railways Reservation System during COVID-19. J. Adv. Transp. 2022, 2022, 7685375. [Google Scholar] [CrossRef]
  42. Chang, B.; Chang, C.-W.; Wu, C.-H. Fuzzy DEMATEL method for developing supplier selection criteria. Expert Syst. Appl. 2011, 38, 1850–1858. [Google Scholar] [CrossRef]
  43. Yazdi, M.; Khan, F.; Abbassi, R.; Rusli, R. Improved DEMATEL methodology for effective safety management decision-making. Saf. Sci. 2020, 127, 104705. [Google Scholar] [CrossRef]
  44. Dalvi-Esfahani, M.; Niknafs, A.; Kuss, D.J.; Nilashi, M.; Afrough, S. Social media addiction: Applying the DEMATEL approach. Telemat. Inform. 2019, 43, 101250. [Google Scholar] [CrossRef]
  45. Garg, C.P. Modeling the e-waste mitigation strategies using grey-theory and DEMATEL framework. J. Clean. Prod. 2021, 281, 124035. [Google Scholar] [CrossRef]
  46. Singh, C.; Singh, D.; Khamba, J.S. Analyzing barriers of Green Lean practices in manufacturing industries by DEMATEL approach. J. Manuf. Technol. Manag. 2021, 32, 176–198. [Google Scholar] [CrossRef]
  47. Khan, S.; Maqbool, A.; Haleem, A.; Khan, M.I. Analyzing critical success factors for a successful transition towards circular economy through DANP approach. Manag. Environ. Qual. 2020, 31, 505–529. [Google Scholar] [CrossRef]
  48. Gigović, L.; Pamučar, D.; Božanić, D.; Ljubojević, S. Application of the GIS-DANP-MABAC multi-criteria model for selecting the location of wind farms: A case study of Vojvodina, Serbia. Renew. Energy 2017, 103, 501–521. [Google Scholar] [CrossRef]
  49. Hamedi, H.; Mehdiabadi, A. Entrepreneurship resilience and Iranian organizations: Application of the fuzzy DANP technique. Asia Pac. J. Innov. Entrep. 2020, 14, 231–247. [Google Scholar] [CrossRef]
  50. Kumar, A.; Anbanandam, R. Analyzing interrelationships and prioritising the factors influencing sustainable intermodal freight transport system: A grey-DANP approach. J. Clean. Prod. 2020, 252, 119769. [Google Scholar] [CrossRef]
  51. Hsu, C.H.; Wang, F.-K.; Tzeng, G.-H. The best vendor selection for conducting the recycled material based on a hybrid MCDM model combining DANP with VIKOR. Resour. Conserv. Recycl. 2012, 66, 95–111. [Google Scholar] [CrossRef]
  52. Chiu, W.-Y.; Tzeng, G.-H.; Li, H.-L. A new hybrid MCDM model combining DANP with VIKOR to improve e-store business. Knowl. Based Syst. 2013, 37, 48–61. [Google Scholar] [CrossRef]
  53. Lin, S.-H.; Zhang, H.; Li, J.-H.; Ye, C.-Z.; Hsieh, J.-C. Evaluating smart office buildings from a sustainability perspective: A model of hybrid multi-attribute decision-making. Technol. Soc. 2022, 68, 101824. [Google Scholar] [CrossRef]
  54. Haghshenas, H.; Vaziri, M. Urban sustainable transportation indicators for global comparison. Ecol. Indic. 2012, 15, 115–121. [Google Scholar] [CrossRef]
  55. Huang, S.-L.; Yeh, C.-T.; Budd, W.W.; Chen, L.-L. A Sensitivity Model (SM) approach to analyze urban development in Taiwan based on sustainability indicators. Environ. Impact Assess. Rev. 2009, 29, 116–125. [Google Scholar] [CrossRef]
  56. Santos, A.S.; Ribeiro, S.K. The use of sustainability indicators in urban passenger transport during the decision-making process: The case of Rio de Janeiro, Brazil. Curr. Opin. Environ. Sustain. 2013, 5, 251–260. [Google Scholar] [CrossRef]
  57. Shiau, T.-A.; Liu, J.-S. Developing an indicator system for local governments to evaluate transport sustainability strategies. Ecol. Indic. 2013, 34, 361–371. [Google Scholar] [CrossRef]
  58. Buzási, A.; Csete, M. Sustainability Indicators in Assessing Urban Transport Systems. Period. Polytech. Transp. Eng. 2015, 43, 138–145. [Google Scholar] [CrossRef]
  59. World Bank. Railway Reform: Toolkit for Improving Rail Sector Performance; World Bank: Washington, DC, USA, 2018. [Google Scholar]
  60. Awasthi, A.; Chauhan, S.S.; Omrani, H. Application of fuzzy TOPSIS in evaluating sustainable transportation systems. Expert Syst. Appl. 2011, 38, 12270–12280. [Google Scholar] [CrossRef]
  61. Schumann, T. Increase of capacity on the Shinkansen high-speed line using Virtual Coupling. In Proceedings of the COMPRAIL 2016 15th International Conference on Railway Engineering Design and Operation, Madrid, Spain, 19–21 July 2016. [Google Scholar]
  62. de Campos, R.; Simon, A.; Martins, F. Assessing the impacts of road freight transport on sustainability: A case study in the sugar-energy sector. J. Clean. Prod. 2019, 220, 995–1004. [Google Scholar] [CrossRef]
  63. Sdoukopoulos, A.; Pitsiava-Latinopoulou, M.; Basbas, S.; Papaioannou, P. Measuring progress towards transport sustainability through indicators: Analysis and metrics of the main indicator initiatives. Transp. Res. Part D Transp. Environ. 2019, 67, 316–333. [Google Scholar] [CrossRef]
  64. Rao, S.-H. Transportation synthetic sustainability indices: A case of Taiwan intercity railway transport. Ecol. Indic. 2021, 127, 107753. [Google Scholar] [CrossRef]
  65. Ollivier, G.; Bullock, R.; Jin, Y.; Zhou, N. High-Speed Railways in China; World Bank: Beijing, China, 2014. [Google Scholar]
  66. Awasthi, A.; Chauhan, S. Using AHP and Dempster-Shafer theory for evaluating sustainable transport solutions. Environ. Model Softw. 2011, 26, 787–796. [Google Scholar] [CrossRef]
  67. UIC. Gri G4 Indicators Handbook, Guidelines for Railway Companies. In Proceedings of the 2016 International Union of Railways, Paris, France, 26–28 January 2016. [Google Scholar]
  68. UIC. UIC Safety Report-Significant Accidents 2017. In Proceedings of the 2018 International Union of Railways, Paris, France, 6 December 2018. [Google Scholar]
  69. Marimon, F.; Alonso-Almeida, M.; García, M.D.P.; Cortez Alejandro, K. The worldwide diffusion of the Global Reporting Initiative: What is the point? J. Clean. Prod. 2012, 33, 132–144. [Google Scholar] [CrossRef]
  70. GRI. GRI 401: Employment. In Global Reporting Initiative; International Sustainability Standards Board: Amsterdam, The Netherland, 2016. [Google Scholar]
  71. Gabus, A.; Fontela, E. World Problems, An Invitation to Further Thought within the Framework of DEMATEL; Battelle Geneva Research Centre: Geneva, Switzerland, 1972. [Google Scholar]
  72. Opricovic, S.; Tzeng, G.-H. Extended VIKOR method in comparison with outranking methods. Eur. J. Oper. Res. 2007, 178, 514–529. [Google Scholar] [CrossRef]
  73. Zamani, A.A.; Abbasi, H.R.; Alipour, V.; Peyravi, M.; Shojaei, P.; Goli, A.; Mohammadinia, L. Alternative Water Resources Selection to Supply Drinking Water in Flood Disasters by Multicriteria Decision-Making Techniques (DANP and VIKOR). J. Environ. Public Health 2022, 2022, 5445786. [Google Scholar] [CrossRef]
  74. Opricovic, S.; Tzeng, G.-H. Compromise solution by MCDM methods: A comparative analysis of VIKOR and TOPSIS. Eur. J. Oper. Res. 2004, 156, 445–455. [Google Scholar] [CrossRef]
  75. Fakhrehosseini, S.F. Selecting the optimal industrial investment by multi-criteria decision-making methods with emphasis on, TOPSIS, VIKOR, and COPRAS (case study of Guilan province). Int. J. Res. Ind. Eng. 2019, 8, 312–324. [Google Scholar] [CrossRef]
  76. Sałabun, W.; Wątróbski, J.; Shekhovtsov, A. Are MCDA Methods Benchmarkable? A Comparative Study of TOPSIS, VIKOR, COPRAS, and PROMETHEE II Methods. Symmetry 2020, 12, 1549. [Google Scholar] [CrossRef]
  77. de Almeida Guimarães, V.; Leal Junior, I. Performance assessment and evaluation method for passenger transportation: A step toward sustainability. J. Clean. Prod. 2016, 142, 297–307. [Google Scholar] [CrossRef]
  78. Stefaniec, A.; Hosseini, K.; Xie, J.; Li, Y. Sustainability assessment of inland transportation in China: A triple bottom line-based network DEA approach. Transp. Res. Part D Transp. Environ. 2020, 80, 102258. [Google Scholar] [CrossRef]
Figure 1. The modeling processes.
Sustainability 14 12065 g001
Figure 2. The influential NRM of relationships between dimensions.
Sustainability 14 12065 g002
Figure 3. The influential NRM of the economic dimension.
Sustainability 14 12065 g003
Figure 4. The influential NRM of the environmental dimension.
Sustainability 14 12065 g004
Figure 5. The influential NRM of the social dimension.
Sustainability 14 12065 g005
Table 1. Summary of the methods and tools used in the literature.
AuthorYearStudy LocationMethod/ToolResearch Topic
Kijewska et al. [29]2018Szczecin, PolandAHP and DEMATELDistribution of goods
Moslem, Sarbast, and Szabolcs Duleba [30]2019Mersin, TurkeyFuzzy AHPUrban transport development
Moslem et al. [31]2019Mersin, TurkeyFuzzy AHP and Interval AHPTransport development decision
Singh et al. [32]2020Delhi, India.AHPSelection of a sustainable transport system
Seker, Sukran, and Nezir Aydin [33]2020TurkeyIVIF-AHP and CODASSustainable public transportation system
Rivero Gutiérrez et al. [34]2021Madrid, SpainAHPSustainable urban public transport systems
Sharma et al. [35]2018IndiaAHP-MABACSmart railway stations
Manzolli et al. [36]2021EuropePROMETHEEUrban mobility
Morfoulaki, Maria, and Jason Papathanasiou [37]2021GreecePROMETHEESustainable urban mobility planning
Bojković, Nataša, Ivan Anić, and Snežana Pejčić-Tarle [38]2010Bulgaria, the Czech Republic, Latvia, Lithuania, Hungary, Poland, Romania, Slovakia, Croatia & TurkeyELECTRETransport sustainability evaluation
Romero-Ania et al. [39]2021Madrid, SpainELECTRESustainable urban public transport Systems
Djordjević et al. [8]2021EuropeCorrelation analysis and DEARailway sustainability monitoring
Liu et al. [26]2022ChinaEFA and CFAUrban sustainability
Al-Thawadi et al. [40]2020QatarLCASustainable urban transportation
Sharma et al. [41]2022IndiaDMSRailway reservation system
Table 2. Key indicators and dimension.
DimensionItemIndicatorsMeasurementReferences
Economic dimensionEc1CostsAverage operation cost (CNY·km−1) [59,65]
Ec2MobilityAverage velocity (km·h−1) [54,66]
Ec3ReliabilityAverage punctuality rate (%) [61,66]
Ec4ProductivityDaily ridership of railway (passengers·day−1) [18,57]
Environmental dimensionEn1GHG (greenhouse gas) emissionsThe emissions of CO2/NOX/SOX and other GHGs (g·passenger-km−1) [14,54,57,60,67]
En2Total energy consumption Total energy consumption rate (kJ·passenger-km−1) [14,57,60,66,67]
En3Land useLand space used for running the transportation service (passenger-km·land-use area−1) [14,57,60]
En4Renewable
energy
The portion of renewable energy consumption of total energy (%) [14,66]
En5NoiseNoise levels at the railway operation area (dBA) [14,60,66]
Social dimensionSo1AccessibilityAccess to residential areas, activity areas, and other transportation modes [54,60,66]
So2SafetyTotal number of fatalities/injuries caused to people [14,57,66,68]
So3SatisfactionOverall customer satisfaction rate (%) [14,60,66]
So4EmploymentTotal number and rate of newly hired staff [45,69,70]
Table 3. Locations and routes of the railway projects.
Railway ARailway BRailway CRailway D
LocationEast ChinaCentral and Southwest ChinaNorthwest ChinaNortheast China
RouteBeijing–Langfang–Tianjin–Cangzhou–Dezhou–Jinan–Tai’an–Qufu–Tengzhou–Zaozhuang–Xuzhou–Suzhou–Bengbu–Chuzhou–Nanjing–Zhenjiang–Changzhou–Wuxi–Suzhou–ShanghaiXining–Golmud–Nagqu–LhasaXining–Zhangye–Jiuquan–Jiayuguan–Hami–Turpan–UrumqiBeijing–Chengde–Chaoyang–Fuxin–Jinzhou–Shenyang
Table 4. The initial average influence matrix A .
IndicatorsEc1Ec2Ec3Ec4En1En2En3En4En5So1So2So3So4
Ec10.0003.3162.4742.7503.0003.0002.8952.7892.4212.2632.8332.9443.111
Ec22.5260.0003.0002.6502.5262.7891.9472.0532.0002.7373.1112.8891.333
Ec32.5263.0530.0002.1501.6321.4741.3681.5261.0002.3682.1113.8331.222
Ec42.6322.3682.8420.0002.0002.1581.7891.9472.2112.6842.3892.8332.444
En12.8422.2111.7371.4000.0003.3681.4213.1581.0531.1051.2222.1111.500
En23.1582.2631.6321.7002.8420.0001.1053.1051.2631.0531.6112.4441.000
En33.2631.8421.4741.4501.7371.5260.0001.2111.4212.2111.5562.0561.333
En43.0531.7371.5261.0503.2632.9471.2110.0001.3681.6321.7222.1671.500
En52.3162.1051.3681.7501.1581.2631.2631.4210.0001.4211.5563.1671.222
So12.7372.7372.0532.5001.1581.5792.0531.4211.2110.0002.6113.2221.722
So23.2632.8421.8422.2001.2111.3681.4211.4211.2112.6320.0003.8332.611
So32.4742.8953.1582.7001.8421.6841.5791.8952.4742.7893.1670.0002.556
So43.0001.4741.5792.0001.1581.1581.0001.4211.4211.5792.3332.8890.000
Note: 1 n n 1 i = 1 n j = 1 n a i j n a i j n 1 a i j n × 100 % = 2.6 % < 5 % , where a i j n and a i j n 1 denote the average influence of criterion i on criterion j according to experts p and p − 1, respectively; n denotes the number of criteria. Thus, the results above are significant at the 97.4% confidence level, which is greater than the 95% level that is used to test for significance.
Table 5. The normalized direct influence matrix Z.
IndicatorsEc1Ec2Ec3Ec4En1En2En3En4En5So1So2So3So4
Ec10.0000.0980.0730.0810.0890.0890.0860.0830.0720.0670.0840.0860.092
Ec20.0750.0000.1010.0900.0850.0940.0660.0690.0680.0930.1050.0840.045
Ec30.0750.1060.0000.0880.0670.0610.0560.0630.0410.0970.0810.1110.050
Ec40.0780.0820.1150.0000.0710.0760.0630.0690.0780.0950.0840.0820.086
En10.0840.0770.0700.0580.0000.1390.0610.1350.0460.0450.0470.0610.065
En20.0930.0780.0660.0700.1210.0000.0480.1330.0550.0430.0610.0710.043
En30.0970.0640.0600.0600.0740.0630.0000.0520.0670.0900.0590.0600.062
En40.0900.0600.0620.0430.1390.1210.0520.0000.0590.0670.0660.0630.065
En50.0690.0730.0550.0720.0490.0520.0630.0610.0000.0580.0590.0920.057
So10.0810.0950.0820.1000.0460.0630.0820.0570.0480.0000.1000.0940.069
So20.0970.0990.0750.0850.0470.0530.0550.0550.0470.1020.0000.1110.101
So30.0730.0990.1080.0920.0630.0580.0540.0650.0850.0950.1080.0000.087
So40.0890.0510.0640.0820.0490.0480.0480.0610.0680.0650.0890.0840.000
Table 6. The total influence matrix TC for the indicators.
IndicatorsEc1Ec2Ec3Ec4En1En2En3En4En5So1So2So3So4
Ec10.8080.8930.8350.8300.8200.8330.6860.8160.6730.8130.8520.8900.763
Ec20.8650.7940.8490.8270.8060.8260.6610.7940.6590.8250.8590.8790.713
Ec30.8110.8370.7080.7780.7400.7470.6130.7370.5970.7800.7890.8490.673
Ec40.8670.8680.8600.7450.7910.8080.6580.7910.6680.8260.8420.8780.748
En10.8030.7900.7520.7290.6700.8030.6020.7900.5860.7130.7370.7830.667
En20.8100.7930.7500.7400.7780.6810.5910.7880.5940.7120.7510.7930.650
En30.7520.7210.6860.6770.6740.6760.5010.6570.5600.6980.6920.7240.616
En40.8060.7760.7430.7160.7890.7870.5930.6690.5960.7290.7520.7840.667
En50.6930.6950.6520.6570.6220.6340.5330.6320.4730.6410.6610.7180.584
So10.8280.8380.7940.7980.7320.7580.6430.7410.6120.7030.8160.8450.699
So20.8490.8490.7950.7930.7380.7560.6260.7460.6170.8020.7340.8680.734
So30.8710.8910.8630.8380.7900.7990.6560.7930.6800.8360.8710.8110.756
So40.7400.7060.6870.6930.6470.6560.5420.6580.5580.6740.7150.7410.556
Table 7. The cause and effect values for TC.
Indicatorsrcr + cr − c
Ec110.512 10.503 21.015 0.010
Ec210.357 10.450 20.807 −0.093
Ec39.660 9.974 19.634 −0.314
Ec410.349 9.821 20.170 0.528
En19.425 9.598 19.023 −0.173
En29.431 9.765 19.196 −0.335
En38.634 7.905 16.540 0.729
En49.408 9.610 19.018 −0.202
En58.194 7.875 16.069 0.320
So19.808 9.752 19.560 0.056
So29.908 10.072 19.979 −0.164
So310.455 10.562 21.017 −0.108
So48.572 8.826 17.397 −0.254
Table 8. The total influence matrix TD for the dimensions and their cause and effect values.
DimensionsEconomicEnvironmentalSocialrr + cr − c
Economic0.8230.7360.8112.3714.7330.008
Environmental0.7370.6510.7042.0924.1720.011
Social0.8020.6930.7602.2554.530−0.020
c2.3622.0812.275---
Table 9. The normalized total influence matrix T C n o r .
IndicatorsEc1Ec2Ec3Ec4En1En2En3En4En5So1So2So3So4
Ec10.240 0.265 0.248 0.247 0.214 0.218 0.179 0.213 0.176 0.245 0.257 0.268 0.230
Ec20.259 0.238 0.255 0.248 0.215 0.221 0.176 0.212 0.176 0.252 0.262 0.268 0.218
Ec30.259 0.267 0.226 0.248 0.216 0.218 0.178 0.215 0.174 0.252 0.255 0.274 0.218
Ec40.260 0.260 0.257 0.223 0.213 0.218 0.177 0.213 0.180 0.251 0.256 0.266 0.227
En10.261 0.257 0.245 0.237 0.194 0.233 0.174 0.229 0.170 0.246 0.254 0.270 0.230
En20.262 0.256 0.242 0.239 0.227 0.198 0.172 0.230 0.173 0.245 0.258 0.273 0.224
En30.265 0.254 0.242 0.239 0.220 0.220 0.163 0.214 0.183 0.256 0.254 0.265 0.226
En40.265 0.255 0.244 0.235 0.230 0.229 0.173 0.195 0.174 0.249 0.256 0.267 0.227
En50.257 0.258 0.242 0.243 0.215 0.219 0.184 0.218 0.163 0.246 0.254 0.276 0.224
So10.254 0.257 0.244 0.245 0.210 0.217 0.185 0.212 0.176 0.230 0.266 0.276 0.228
So20.258 0.258 0.242 0.241 0.212 0.217 0.180 0.214 0.177 0.256 0.234 0.277 0.234
So30.251 0.257 0.249 0.242 0.212 0.215 0.177 0.213 0.183 0.255 0.266 0.248 0.231
So40.262 0.250 0.243 0.245 0.211 0.214 0.177 0.215 0.182 0.251 0.266 0.276 0.207
Table 10. The unweighted supermatrix W c .
IndicatorsEc1Ec2Ec3Ec4En1En2En3En4En5So1So2So3So4
Ec10.240 0.259 0.259 0.260 0.261 0.262 0.265 0.265 0.257 0.254 0.258 0.251 0.262
Ec20.265 0.238 0.267 0.260 0.257 0.256 0.254 0.255 0.258 0.257 0.258 0.257 0.250
Ec30.248 0.255 0.226 0.257 0.245 0.242 0.242 0.244 0.242 0.244 0.242 0.249 0.243
Ec40.247 0.248 0.248 0.223 0.237 0.239 0.239 0.235 0.243 0.245 0.241 0.242 0.245
En10.214 0.215 0.216 0.213 0.194 0.227 0.220 0.230 0.215 0.210 0.212 0.212 0.211
En20.218 0.221 0.218 0.218 0.233 0.198 0.220 0.229 0.219 0.217 0.217 0.215 0.214
En30.179 0.176 0.178 0.177 0.174 0.172 0.163 0.173 0.184 0.185 0.180 0.177 0.177
En40.213 0.212 0.215 0.213 0.229 0.230 0.214 0.195 0.218 0.212 0.214 0.213 0.215
En50.176 0.176 0.174 0.180 0.170 0.173 0.183 0.174 0.163 0.176 0.177 0.183 0.182
So10.245 0.252 0.252 0.251 0.246 0.245 0.256 0.249 0.246 0.230 0.256 0.255 0.251
So20.257 0.262 0.255 0.256 0.254 0.258 0.254 0.256 0.254 0.266 0.234 0.266 0.266
So30.268 0.268 0.274 0.266 0.270 0.273 0.265 0.267 0.276 0.276 0.277 0.248 0.276
So40.230 0.218 0.218 0.227 0.230 0.224 0.226 0.227 0.224 0.228 0.234 0.231 0.207
Table 11. The normalized total influence matrix T D N o r .
DimensionsEconomicEnvironmentalSocial
Economic0.347 0.311 0.342
Environmental0.352 0.311 0.336
Social0.356 0.307 0.337
Table 12. The weighted supermatrix W c .
IndicatorsEc1Ec2Ec3Ec4En1En2En3En4En5So1So2So3So4
Ec10.083 0.090 0.090 0.090 0.092 0.092 0.093 0.093 0.091 0.090 0.092 0.089 0.093
Ec20.092 0.083 0.093 0.090 0.091 0.090 0.089 0.090 0.091 0.091 0.092 0.091 0.089
Ec30.086 0.089 0.078 0.089 0.086 0.085 0.085 0.086 0.085 0.087 0.086 0.089 0.086
Ec40.086 0.086 0.086 0.077 0.083 0.084 0.084 0.083 0.086 0.087 0.086 0.086 0.087
En10.066 0.067 0.067 0.066 0.060 0.071 0.068 0.072 0.067 0.065 0.065 0.065 0.065
En20.068 0.069 0.068 0.068 0.073 0.062 0.068 0.071 0.068 0.067 0.067 0.066 0.066
En30.056 0.055 0.055 0.055 0.054 0.054 0.051 0.054 0.057 0.057 0.055 0.054 0.054
En40.066 0.066 0.067 0.066 0.071 0.072 0.067 0.061 0.068 0.065 0.066 0.065 0.066
En50.055 0.055 0.054 0.056 0.053 0.054 0.057 0.054 0.051 0.054 0.054 0.056 0.056
So10.084 0.086 0.086 0.086 0.083 0.082 0.086 0.084 0.083 0.078 0.086 0.086 0.085
So20.088 0.090 0.087 0.088 0.085 0.087 0.085 0.086 0.085 0.090 0.079 0.090 0.090
So30.092 0.092 0.094 0.091 0.091 0.092 0.089 0.090 0.093 0.093 0.093 0.084 0.093
So40.079 0.075 0.075 0.078 0.077 0.075 0.076 0.076 0.075 0.077 0.079 0.078 0.070
Table 13. The limit supermatrix W = lim φ W D α φ .
IndicatorsEc1Ec2Ec3Ec4En1En2En3En4En5So1So2So3So4
Ec10.091 0.091 0.091 0.091 0.091 0.091 0.091 0.091 0.091 0.091 0.091 0.091 0.091
Ec20.090 0.090 0.090 0.090 0.090 0.090 0.090 0.090 0.090 0.090 0.090 0.090 0.090
Ec30.086 0.086 0.086 0.086 0.086 0.086 0.086 0.086 0.086 0.086 0.086 0.086 0.086
Ec40.085 0.085 0.085 0.085 0.085 0.085 0.085 0.085 0.085 0.085 0.085 0.085 0.085
En10.066 0.066 0.066 0.066 0.066 0.066 0.066 0.066 0.066 0.066 0.066 0.066 0.066
En20.068 0.068 0.068 0.068 0.068 0.068 0.068 0.068 0.068 0.068 0.068 0.068 0.068
En30.055 0.055 0.055 0.055 0.055 0.055 0.055 0.055 0.055 0.055 0.055 0.055 0.055
En40.066 0.066 0.066 0.066 0.066 0.066 0.066 0.066 0.066 0.066 0.066 0.066 0.066
En50.055 0.055 0.055 0.055 0.055 0.055 0.055 0.055 0.055 0.055 0.055 0.055 0.055
So10.084 0.084 0.084 0.084 0.084 0.084 0.084 0.084 0.084 0.084 0.084 0.084 0.084
So20.087 0.087 0.087 0.087 0.087 0.087 0.087 0.087 0.087 0.087 0.087 0.087 0.087
So30.091 0.091 0.091 0.091 0.091 0.091 0.091 0.091 0.091 0.091 0.091 0.091 0.091
So40.076 0.076 0.076 0.076 0.076 0.076 0.076 0.076 0.076 0.076 0.076 0.076 0.076
Table 14. The performance scores and gaps to the aspiration levels of different railways.
Dimension and IndicatorsLocal Weight Global Weight Performance ScoreGap to Aspiration Level
ABCDABCD
Economic0.347 8.443 5.315 5.645 7.956 0.156 0.469 0.435 0.204
Ec1. Costs0.2400.083 8.815 6.930 7.633 6.861 0.119 0.307 0.237 0.314
Ec2. Mobility0.2650.092 9.125 6.344 8.103 7.334 0.088 0.366 0.190 0.267
Ec3. Reliability0.2480.086 9.126 7.938 8.827 7.146 0.087 0.206 0.117 0.285
Ec4. Productivity0.2470.086 9.518 6.310 6.433 7.100 0.048 0.369 0.357 0.290
Environmental0.311 8.643 7.512 6.215 7.423 0.136 0.149 0.248 0.258
En1. GHG emissions0.2140.066 8.521 7.561 6.354 7.112 0.148 0.244 0.365 0.289
En2. Total energy consumption0.2180.068 7.613 6.215 6.656 7.164 0.239 0.379 0.334 0.284
En3. Land use0.1790.056 8.714 6.935 5.441 6.243 0.129 0.307 0.456 0.376
En4. Renewable energy0.2130.066 7.312 5.234 4.314 5.808 0.269 0.477 0.569 0.419
En5. Noise0.1760.055 9.313 7.452 6.314 5.912 0.069 0.255 0.369 0.409
Social0.342 9.213 8.314 7.245 7.313 0.079 0.169 0.276 0.269
So1. Accessibility0.2450.084 9.213 6.412 7.312 7.564 0.079 0.359 0.269 0.244
So2. Safety0.2570.088 9.412 8.907 7.322 8.009 0.059 0.109 0.268 0.199
So3. Satisfaction0.2680.092 9.465 7.313 7.153 5.812 0.054 0.269 0.285 0.419
So4. Employment0.2300.079 8.789 6.314 7.213 8.012 0.121 0.369 0.279 0.199
Total performance 8.243 6.443 6.354 7.616
Total gap 0.176 0.356 0.365 0.238
Scores (ranking)
Average   gap   ( S k ) 0.110 0.306 0.302 0.301
Max gap ( Q k ) 0.269 0.477 0.569 0.419
H k ( α = 0.5 ) 0.1896 (1) 0.3914 (3) 0.4353 (4)0.3603 (2)
Table 15. The results of the sensitivity analysis.
Railway ARailway BRailway CRailway D
Average gap ( S k )0.110 0.306 0.302 0.301
Max gap ( Q k )0.269 0.477 0.569 0.419
Scenario 1 α = 0.1 0.2530 (1) 0.4596 (3) 0.5419 (4) 0.4074 (2)
Scenario 2 α = 0.2 0.2371 (1) 0.4425 (3) 0.5153 (4) 0.3957 (2)
Scenario 3 α = 0.3 0.2213 (1) 0.4255 (3)0.4886 (4)0.3839 (2)
Scenario 4 α = 0.4 0.2055 (1) 0.4085 (3) 0.4620 (4) 0.3721 (2)
Scenario 5 α = 0.6 0.1738 (1) 0.3744 (3) 0.4087 (4) 0.3486 (2)
Scenario 7 α = 0.7 0.1580 (1) 0.3574 (3)0.3820 (4)0.3368 (2)
Scenario 8 α = 0.8 0.1421 (1) 0.3403 (3) 0.3554 (4) 0.3250 (2)
Scenario 9 α = 0.9 0.1263 (1) 0.3233 (3) 0.3287 (4)0.3132 (2)
Table 16. The results of the TOPSIS method.
Railway ARailway BRailway CRailway D
C i 0.504836280.43620.43600.4373
Rank1342
Table 17. The results of the COPRAS method.
Railway ARailway BRailway CRailway D
Q i 0.2994 0.2332 0.2330 0.2349
U i 10.77890.77820.7846
Rank1342
Publisher’s Note: MDPI stays neutral with regard to jurisdictional claims in published maps and institutional affiliations.

