Article

Microbiota Modulation in Blueberry Rhizosphere by Biocontrol Bacteria

by
Sara Rodriguez-Mena
1,2,*,
María Camacho
2,
Berta de los Santos
2,
Luis Miranda
2 and
Miguel Camacho-Sanchez
2
1
CSIC, Institute of Sustainable Agriculture, Av. Menéndez Pidal, S/N, 14004 Córdoba, Spain
2
IFAPA—Instituto de Investigación y Formación Agraria, Pesquera, Alimentaria y de la Producción Ecológica, Centro Las Torres-Tomejil, Ctra. Sevilla-Cazalla de la Sierra, 12.2 Km, 41200 Alcalá del Río, Spain
*
Author to whom correspondence should be addressed.
Microbiol. Res. 2022, 13(4), 809-824; https://doi.org/10.3390/microbiolres13040057
Submission received: 15 September 2022 / Revised: 4 October 2022 / Accepted: 5 October 2022 / Published: 12 October 2022

Abstract

:
Microbial interactions in agricultural soils can play important roles in the control of soil-borne phytopathogenic diseases. Yields from blueberry plantations from southern Spain have been impacted by the pathogenic fungus, Macrophomina phaseolina. The use of chemical fungicides has been the common method for preventing fungal infections, but due to their high environmental impact, legislation is increasingly restricting its use. Biocontrol alternatives based on the use of microorganisms is becoming increasingly important. Using the metabarcoding technique, fungi and bacteria were characterized (via 16S and ITS regions, respectively) from rhizosphere soils of healthy and dead blueberry plants infected by M. phaseolina, and which had undergone three different treatments: two biocontrol strategies—one of them a mix of Pseudomonas aeruginosa and Bacillus velezensis and the other one with Bacillus amyloliquefaciens—and a third treatment consisting of the application of a nutrient solution. The treatments produced changes in the bacterial microbiota and, to a lesser extent, in the fungi. The abundance of Fusarium was correlated with dead plants, likely favoring the infection by M. phaseolina. The presence of other microorganisms in the soil, such as the fungi Archaeorhizomyces or the bacteria Actinospica, were correlated with healthy plants and could promote their survival. The different genera detected between dead and healthy plants opens the possibility of studying new targets that can act against infection and identify potential microorganisms that can be used in biocontrol strategies.

1. Introduction

Blueberry (Vaccinium corymbosum) is one of the most consumed berries around the world, with increasing trends in production and sales [1]. Spain is ranked the third-highest country worldwide in terms of blueberry production, with 50,000 tons of berries—with production concentrated in the southwest of its territory [2].
Stem blight is a major disease in blueberries. This fungal disease leads to the fast degradation of the vascular system, thereby causing foliage death and brown discoloration of internal vascular stem tissues, which eventually provoke plant death [3,4]. It is produced by fungi, principally members of the Botryosphaeriacerae family, and can lead to plant death [5]; there is ample biogeographic variability. For example, in Florida, Lasiodiplodia theobromae and Neofusicoccum ribisson are the main fungi responsible for stem blight [6], meanwhile in Chile, N. arburi and N. parvum have the greatest impact [7]. In the past, N. parvum, N. australe, L. theobromae, and N. clavispora were considered the major infection-causing fungi pathogens in Huelva [7]. However, between 2015 and 2017, the phytopathogenic fungus, Macrophomina phaseolina—the principal cause of strawberry crop losses—was also reported [3,8]. This fungus is plastic and has a wide range of targets [9]. Furthermore, M. phaseolina can persist in soil for many months by adopting resistance forms called sclerotia [10].
M. phaseolina is an anamorphic ascomycete belonging to the Botryosphaeriaceae family and is the cause of the stem blight and charcoal rot in red fruits, as well as other illnesses in a diversity of plants [11]. It is an endophytic fungus that enters the plant by using two methods, one physical and the other mechanical. Through the mechanical method, it enters the plant by exerting pressure on the roots that are proximal to the growing germ tubes. For the chemical method, the fungus dissolves the cell wall through the secretion of toxins (botryodiplodin toxin) and enzymes (cellulases and polyglacturonase) [10,11,12]. The infection can be favored by biotic and abiotic stresses, as well as high temperatures (29–35 °C) [13], hydric stress [14], damage to the cell wall, or the presence of nematodes [15] and other fungi, such as Fusarium [16].
There are chemical methods that can prevent the infection caused by M. phaseolina. In strawberries, for example, treating the soil with methyl bromide or Dazomet prior to cultivation have been a common practice. Both were recently banned due to their high environmental impact [17,18]. Other synthetic phytochemicals, such as 1,3-dichloropropene:chloropicrin, are being used, but legislation is becoming stricter in Europe, and a ban is probable [19]. Therefore, farmers are increasingly demanding alternative environmentally friendly methods to combat this as well as other pathogens. Disinfection by biosolarization (a technique that combines biofumigation with soil solarization), the use of plastics covers, the selection of pathogen-resistant plants, or the use of microorganisms for biocontrol are starting to be used [20]. Bacteria with PGP (Plant Growth Promoting) activities promote plant growth through various mechanisms, such as iron and phosphorus solubilisation, nitrogen fixation, or phytohormone production. Some of these can act directly or indirectly against crop pathogens. When acting directly, they can secrete antibiotics or produce metabolites that suppress other metabolites, such as siderophores, hydrolytic enzymes, or hydrogen cyanide. When acting indirectly, they can activate the plant’s molecular defense mechanisms (induced systemic resistance), thereby triggering the plant’s resistance to infection [21]. Previous studies have shown the efficacy of using this type of bacteria against M. phaseolina in strawberries crops [22,23].
Most fungal phytopathogenic diseases affecting berries are soil-borne. The persistence of resistance latent structures in the soil can boost these fungal diseases, while the native microbiota in agricultural soils can have a suppressive effect [24,25,26]. Thus, studying the soil’s microbiota from an agriculture perspective is becoming increasingly important [27]. The traditional way of characterizing microbiota is through the culture-isolation of strains from soil samples in the lab. This technique does not provide a full spectrum of the microbial diversity in the soil since many microorganisms cannot be cultured under laboratory conditions. The advent of NGS (Next Generation Sequencing) allows for the characterization of the microbial diversity from complex soil samples [28]. This fact has led to great advances in the study of plant-associated microbiomes [29]. Specifically, the “metabarcoding” technique permits the characterization of biological communities through a gene region that serves as a “barcode”. For the soil microbiota, the Internal Transcribed Spacer (ITS) intergenic region is often used for fungi and the 16S rRNA coding region of the ribosome is used for bacteria [30]. The taxonomic classification of these sequences against curated databases has allowed for the taxonomic characterization of the samples [31].
The aim of this work was to study the changes in the microbial community of rhizospheric soils in blueberries suffering from infection—and death—by M. phaseolina compared to healthy plants. We also evaluated the effect of three proposed environmentally friendly prevention strategies for fungi disease control on the soil microbiota; two of them were based on bacteria-mediated biocontrol, and the third one was based on a nutrient solution. We expect to find differences in the microbial composition of the rhizosphere of healthy and dead plants, including a higher proportion of M. phaseolina in the dead ones. As for the treatments, we expect that they will modify the soil microbiota by decreasing the presence of pathogens and increasing the microorganisms with PGP and pathogen antagonistic properties.

2. Materials and Methods

2.1. Treatments

Trials were carried out at the IFAPA institute experimental farm, El Cebollar—which is located at Moguer (Huelva, 37°14′25.4″ N 6°48′09.2″ W)—in two 50 m long high plastic tunnels with 2 beds each. Three soil treatments based on environmentally friendly strategies for controlling fungal disease were assayed: the first consisted of two bacteria belonging to the IFAPA collection, which had shown in vitro inhibition of M. phaseolina growth (A), the second contained a commercial strain of Bacillus amyloliquefaciens (B), and the third one contained a nutrient solution (C). We also included a control plot. Each treatment was tested on four beds inside two different high plastic tunnels. Each of the beds was divided into six sections of equal length. The end sections were not planted since they were least homogeneous in terms of irrigation and exposure to climatic conditions. The treatments were applied to the remaining four sections.
Treatment A consisted of bacterial strains AC17 and ACH16, which correspond to Pseudomonas aeruginosa and Bacillus velezensis, respectively. Both strains had been isolated from blueberry rhizospheric soil and shown to inhibit the growth of M. phaseolina in vitro [32]. Treatment B was a commercial biological fungicide containing Bacillus amyloliquefaciens. This product had been shown to be effective against a wide range of both biotrophic and necrotrophic pathogens [33]. Treatment C was a commercial nutrient solution containing nitrogen, phosphate, potassium, and amino acids. These minerals promote plant development, and the amino acids should stimulate the formation of new absorbing hairs, thereby enhancing the assimilation of water and minerals. The treatments were applied every 21 days by drip irrigation. In treatments A and B, 2 × 10¹⁰ cfu were applied to each plant, and C was treated as established in the technical data sheet of the product. The bacterial application started on 2 July 2020—after pruning—and was repeated 4 more times until 24 September 2020 with the following application dates: 2 July, 23 July, 13 August, 3 September, and 24 September. At that time, application was ceased for harvesting.

2.2. Sampling

A stratified sampling was carried out in February 2021 by taking soil samples that were adjacent to the blueberry plants in the bed. In each treatment, we selected a dead blueberry plant affected by M. phaseolina and a healthy plant. The samples were taken with an auger with a 4 cm diameter and up to a 20 cm depth at 4 different points in the vicinity of the plant within the section corresponding to the treatment in question, and then they were poured into a plastic bag and homogenized by manual shaking. The samples were stored and transported at 4 °C to the laboratory where they were frozen at −80 °C until handling.

2.3. DNA Extraction

Prior to DNA extraction, samples were freeze-dried in the Telstar® LyoQuest freeze-dryer. Lyophilisation took place in 2–15 mL tubes with a perforated parafilm covering the mouth of the tube for a minimum of 8 hr at 0.1 mbar at −80 °C, which ensured the complete dehydration of the sample. Dehydration paralyzes all microbial activity and ensures that the microbiota remains unchanged during processing [34], and standardises the subsequent DNA content to a comparable dry weight between samples.
DNA was then extracted from approximately 0.25 g of freeze-dried soil using the Qiagen® DNeasy PowerSoil kit according to the manufacturer’s instructions. The negative controls were included in each extraction batch of 13 soil samples—in addition to 2 technical replicates. We included a positive control (ZymoBIOMICS™ Microbial Community DNA Standard II, Log Distribution, #D6311) consisting of genomic DNA from a known mock community with decreasing concentrations of different bacterial strains and two fungi, Cryptococcus neoformans and Saccharomyces cerevisiae. All soil samples were inoculated with a known amount of an internal control of bacteria and fungi known as spike-in. For bacteria, a commercial control (ZymoBIOMICS™ Spike-in Control I # D6320) containing the halophilic bacteria, Imtechella halotolerans and Allobacillus halotolerans, was used. The Yarrowia lipolytica strain, CECT 1240, was chosen as the fungus, which was grown in our laboratory at high concentrations and quantified in Petri dishes. The internal control and the mock community allowed us to validate the downstream methodological flow and the sensitivity of the method. The amount of extracted DNA was determined using a UV spectrophotometer (NanoDrop2000 ThermoFisher).

2.4. DNA Metabarcoding Library Preparation and Sequencing of Samples

The genetic characterization by metabarcoding of the bacterial and fungal communities was carried out based on target amplicon libraries that were sequenced in Illumina. For bacteria, primers 515-F [35] and 806-P [36], which are specific to the V3-V4 region of bacterial 16S rRNA—and were recommended in the Earth Microbiome Project protocol [37]—were used, thereby generating a product of about 292 bp. For fungi, primers ITS3 and ITS4, which are specific to the ITS2 regions of the fungal genome and produce an amplicon of about 330 bp [38], were used (Table 1). All primers contained Illumina tails at their 3′ ends that were complementary to the Illumina adaptors, which were added in a second PCR.
PCRs were carried out at a final volume of 12.5 µL containing 4–20 ng of DNA, 0.5 µM of oligonucleotides, 6.25 µL of Supreme NZYTaq 2x Green master mix (NYZTech), and ultrapure water. The PCR reaction consisted of a preliminary denaturation step at 95 °C for 5 min, followed by 25 cycles of a denaturation step at 95 °C for 30 s, annealing at 46/50 °C (16S/ITS, respectively) for 30 s, and then elongation at 72 °C for 45 s, with a final extension for 7 min at 72 °C. A negative control with the reaction reagents and no DNA was included in all PCR reactions. Libraries were run on a 2% agarose gel with GreenSafe (NYZTech) and visualised under UV light.
The oligonucleotide indices required in the multiplexed libraries were added in a second PCR with the same PCR conditions as above, but with 5 cycles and an annealing temperature of 60 °C. Library preparation was carried out following the process described by Vierna et al. [39]. They were purified using Mag-Bind RXNPure Plus magnetic beads (Omega Biotek) by following the supplier’s instructions. The libraries were combined in equimolar concentrations following Qubit dsDNAHS assay quantification (ThermoFisher Scientific) and sequenced on a fraction of an Illumina NovaSeq PE250 lane by AllGenetics & Biology SL (La Coruña, Spain).

2.5. Bioinformatics Analysis

The primers that were used for library preparation and sequences with unidentified nucleotides (“N”) were removed with Cutadapt 3.6.9 [40]. The rest of the sequence processing was carried out in R 4.1.2 [41] using dada2 [42], with some modifications to accommodate the quality encoding of the NovaSeq system [43]. The sequences were classified into ASVs (Amplicon Sequence Variants), thereby treating each variant individually, as opposed to the traditional OTU (Operational Taxonomic Unit) classification system in which sequences within a similarity threshold (often 97%) are clustered together. The OTU-related system ignores the variation that can occur from just a single nucleotide between close taxa (within genus or species). ASVs provide higher resolution, sensitivity, specificity, and reproducibility [44]. The SILVA database for bacteria [45] and UNITE for fungi [46] were used for taxonomic classification.
For the rest of the analysis, the R package, phyloseq [47], was used. The internal controls (spike-in and ZymoResearch mock community), ASVs that were not classified at the phylum level, low prevalence (presence in only one sample) with the phyloseq_filter_prevalence function of the MetagMisc package [48], and low relative abundance (less than 1.5 × 10⁻⁶ in bacteria and less than 4 × 10⁻⁶ in fungi) were removed. In addition, sequences that corresponded to eukaryotic sequences (chloroplasts and mitochondria) and contaminations present in controls were removed with the isContaminant function of the decontam package [49].

2.6. Alpha and Beta Diversity

For statistical analyses, R was used. The alpha diversity was estimated with the observed diversity (number of different ASVs) and Shannon and Simpson index using the estimate_richness function and plotted with plot_richness from the phyloseq package [50]. The observed diversity only considers the number of different taxa in the samples, and the other two indices also measure the evenness and dominance [51]. The relationship between alpha diversity and the different treatments was tested with an ANOVA test using the stat package of R. Subsequently, pairwise comparisons were made with Tukey’s test. The relationship between the alpha diversity and plant condition (healthy/dead plant) was determined with the generalised linear model from the lme4 package, assuming that the data follow a binomial distribution (healthy = 1; death = 0) [52].
To evaluate the effect of the treatments and plant condition on the microbiota structure, the beta diversity was explored based on the Bray–Curtis distance [53]. Then, it was visualized in a Principal Coordinate Analysis (PCoA) that was run with the ordinate function in the phyloseq package. A PERMANOVA (Permutational Analysis of Variance) test using the adonis function of the vegan package allowed us to partition the variance of the observed dissimilarity between the treatments and plant condition, and test its significance after 999 permutations [54].
To characterize the relationship between the treatments and plant death/survival in the presence of specific genera, the DESeq package was used. This package calculates the normalised change in abundance (fold change) and the associated statistical significance (p-value). To this end, we contrasted the differences between the treatments and plant condition. The negative fold change values indicated a higher presence of the genus in dead plants or control soils and the positive values indicated a higher presence in healthy plants and after a given treatment. DESeq performed an internal normalisation of the data in which it detected the possible outliers and reduced the dispersion of the data, which provided stability to the model [55].
For relative abundance plots, the microbiome package was used [56], whereas ggplot2 was chosen for the other representations [57].

3. Results

A total of 2,436,437 fungal sequence reads were produced, which yielded 237 ASVs and detected 91 genera across all samples. For bacteria, 2,748,369 reads were analyzed, identifying 2291 ASVs and 215 different genera.

3.1. Sensitivity of the Method

The detection of the microorganisms of the mock community allowed us to establish the sensitivity of the method. In the case of bacteria, Lactobacillus fermentum was detected, but not those bacteria found in lower concentrations, which means that the detection limit for bacteria was at least 0.012%. In the case of fungi, Cryptococcus neoformans was detected, so the sensitivity for fungi is at least 0.0014%.

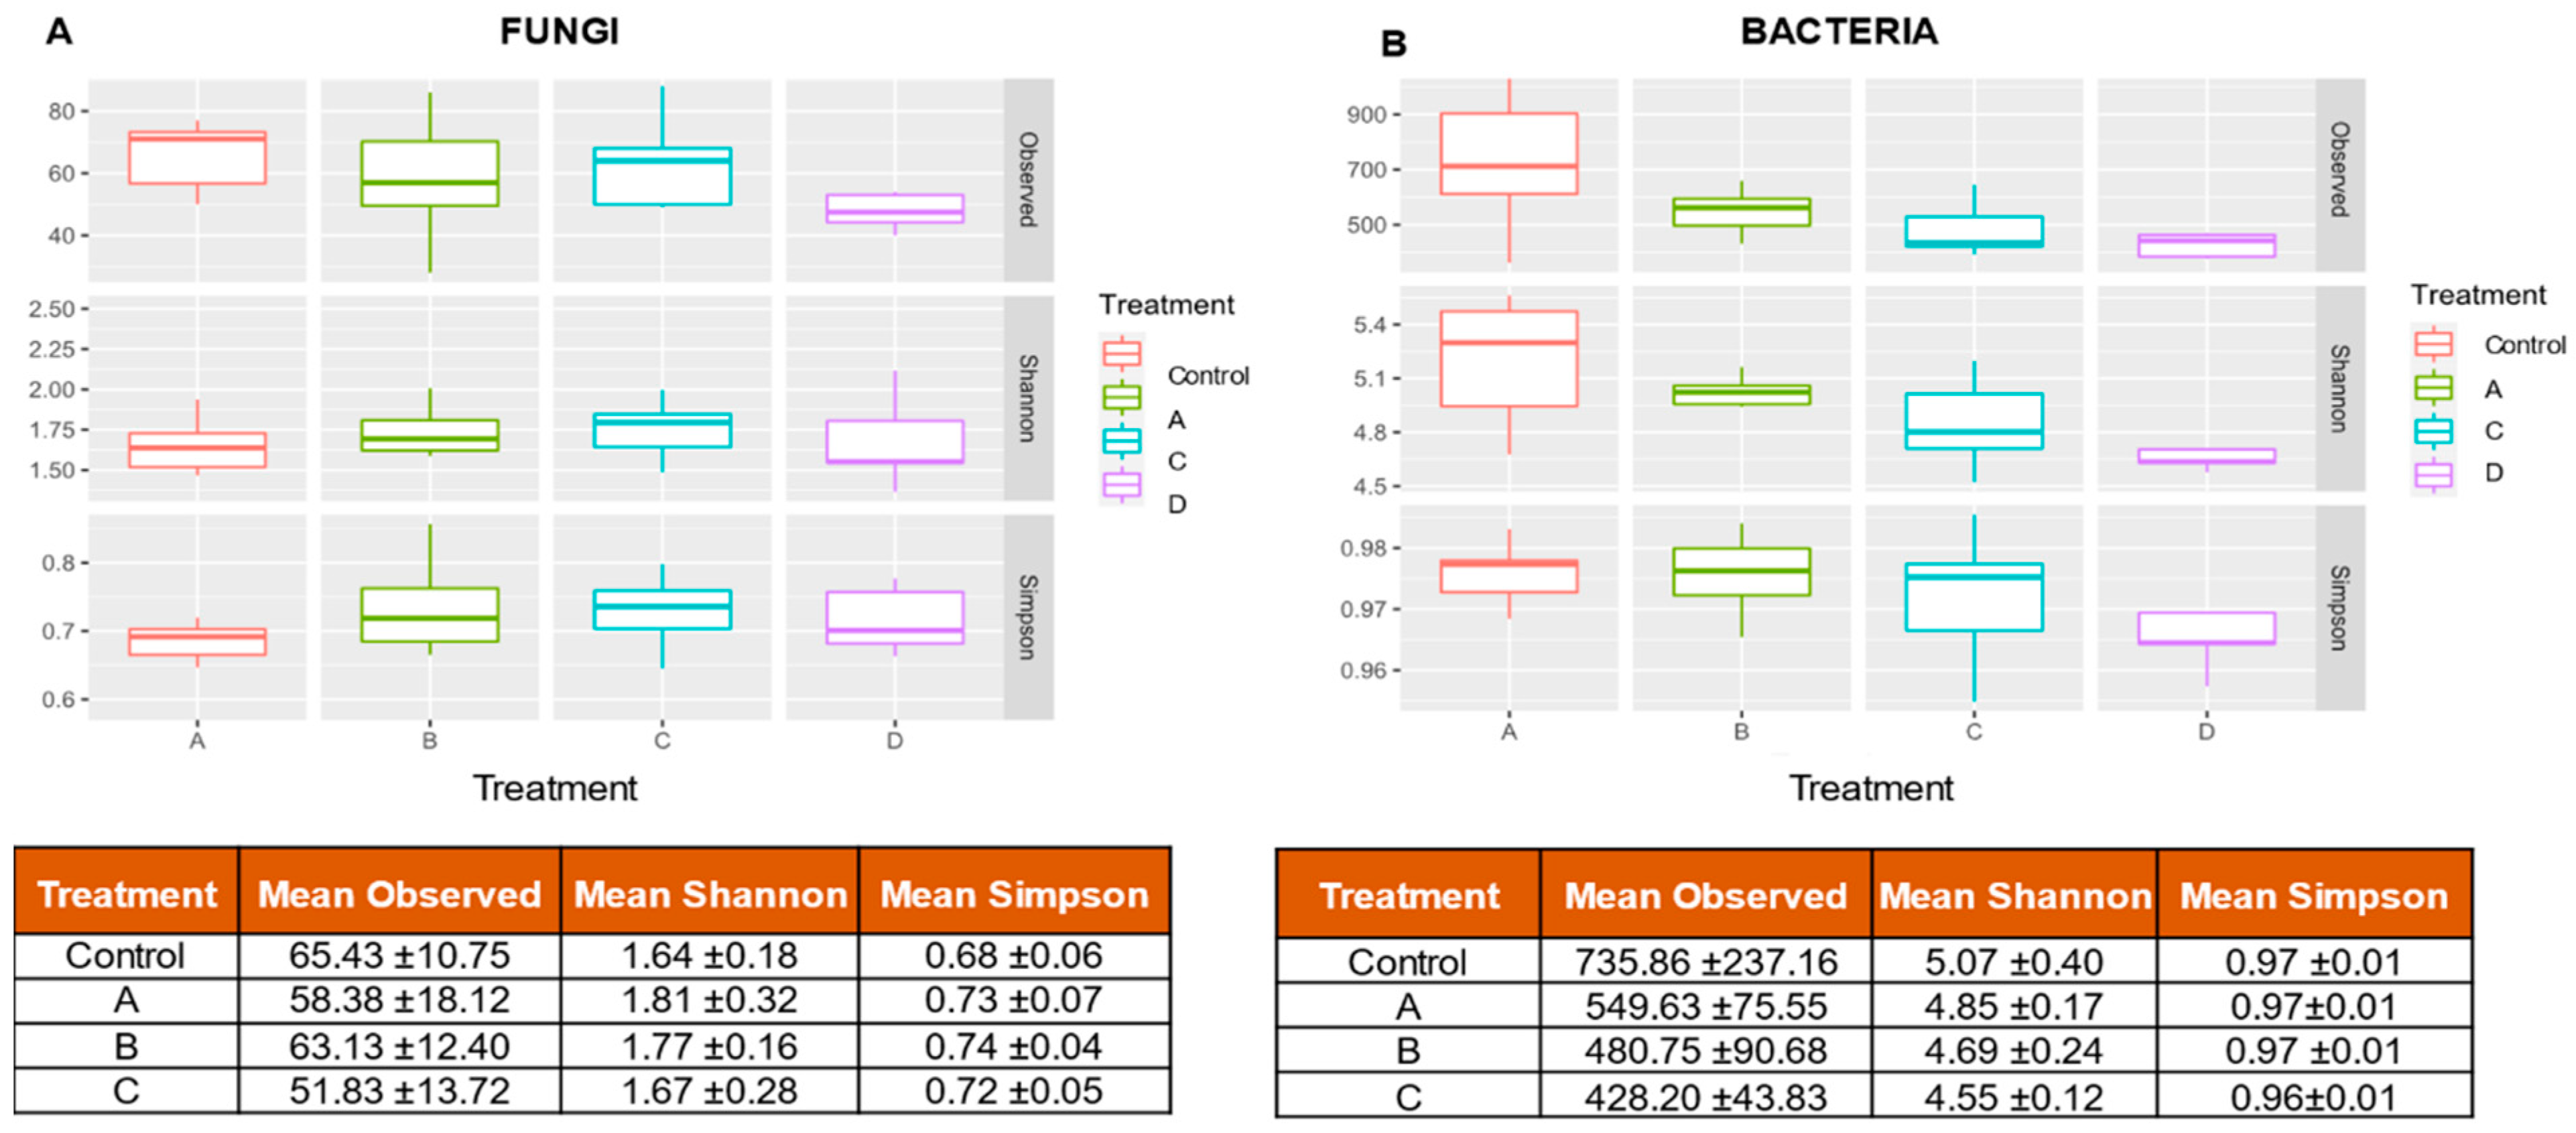
3.2. Alpha Diversity

The observed diversity for fungi was low (around 50–70) (Figure 1A). The one-way ANOVA test for the comparison of the effect of the treatments on the alpha diversity pointed to non-significant differences (F(3,27) = 1.931, p = 0.267).
All diversity indices had higher values for bacteria than for fungi (Figure 1B). In all cases, the values close to unity for the Simpson’s diversity indicate dominance within the community. The observed and Shannon’s diversity indicate a higher diversity in the control and for treatment A (P. aeruginosa + B. velezensis) than in the other two treatments. Furthermore, the differences in diversity between healthy and dead plants were studied, and the Shannon diversity was observed to be 0.16 points higher in healthy plants (PrChisq = 0.066). The one-way ANOVA used to study the relationship between the alpha diversity and the treatments revealed a significant effect (F(3,24) = 6.41, p = 0.002). Tukey’s HSD test revealed that the alpha diversity differed between treatments B (B. amyloliquefaciens) and C (nutrient solution) with respect to the control (PB-control = 0.006 and PC-control = 0.004). There were differences between the alpha diversity and the rest of the treatments (PA-control = 0.06, PB-A = 0.74, PC-A = 0.41 and PC-B = 0.90).

3.3. Diversity between Conditions

The Adonis test indicated that the differences in diversity due to the treatments or plant condition were not significant for fungi (R2treatments = 0.36, Ptreatments = 0.21, R2condition = 0.40, Pcondition = 0.32) (Figure 2A). In bacteria, there was no evidence of the state of the plant (healthy/dead) influencing the community (R2condition = 0.03, Pcondition = 0.51). However, the treatments did seem to exert some influence (R2treatment = 0.17, Ptreatment = 0.011) given that treatments B (B. amyloliquefaciens) and C (nutrient solution) were the ones that produced the greatest changes (Figure 2B).

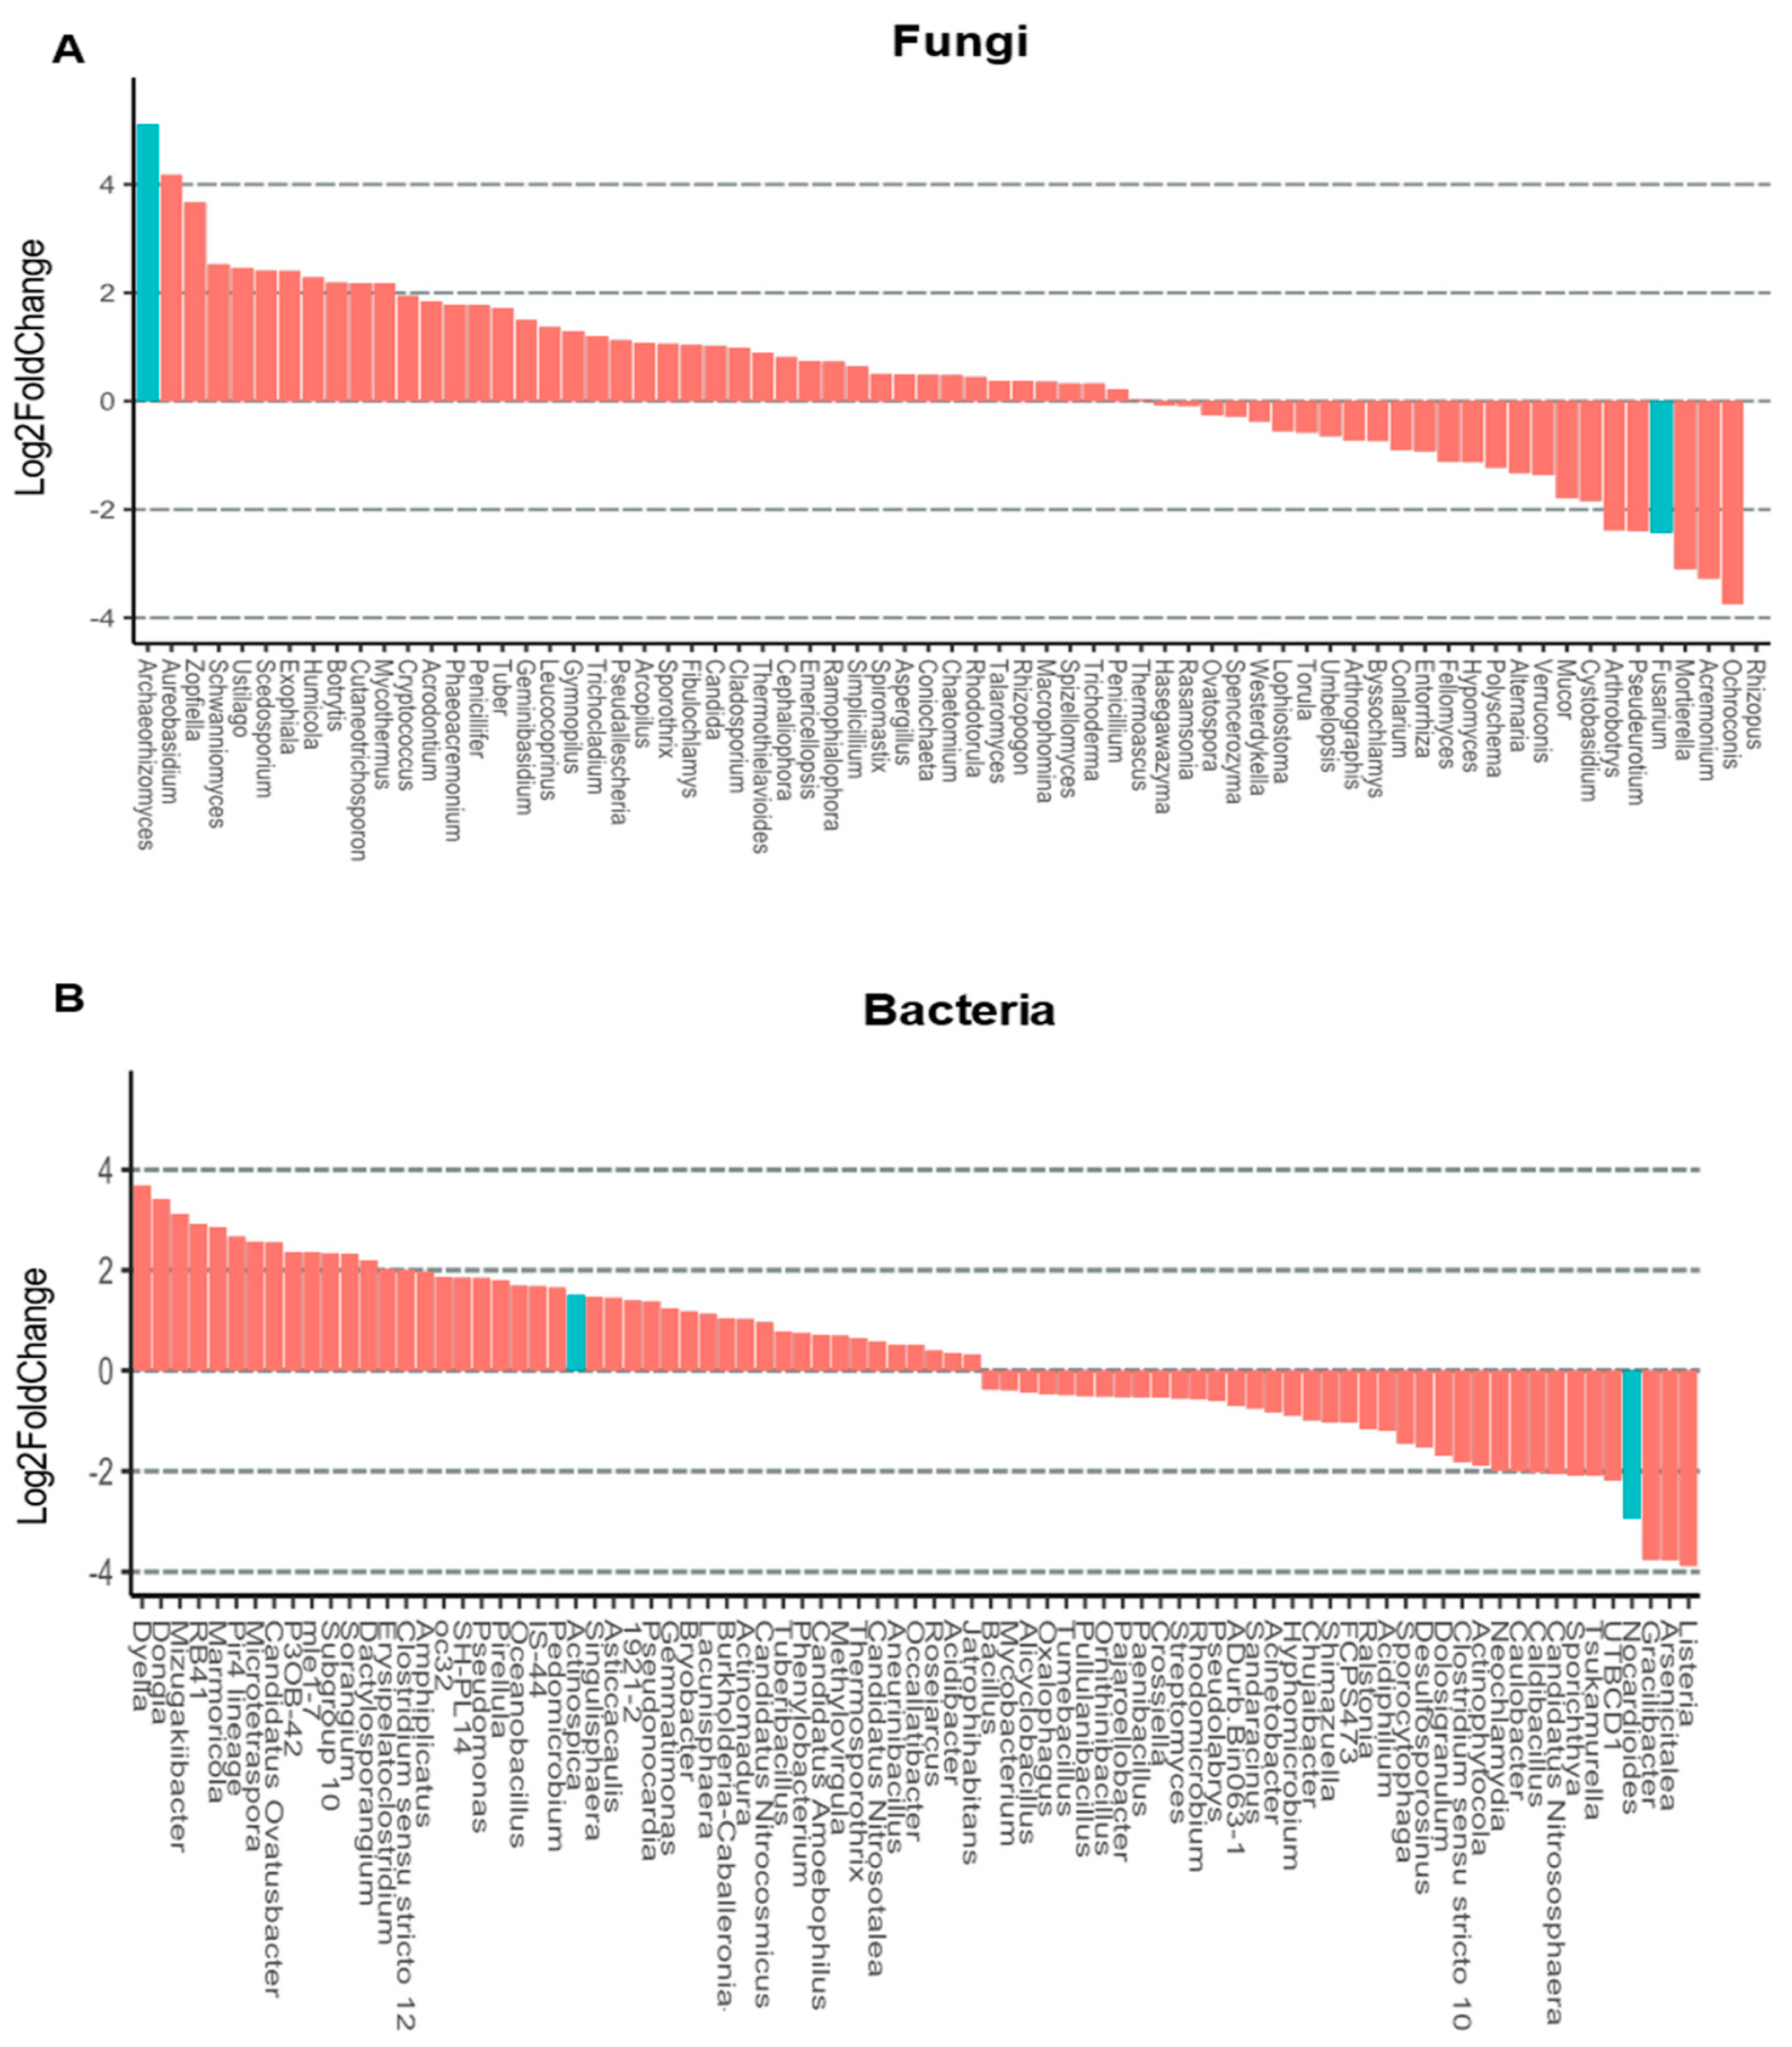
3.4. Rhizosphere Microbiota of Blueberry Crops

In fungi, the orders, Pleosporales and Hypocreales, were more abundant in dead plants and the order, Capnodiales, was more abundant in the healthy ones. The treatments produced changes at the order level, thereby increasing the presence of Capnodiales in all cases, especially in treatment A (P. aeruginosa + B. velezensis). This treatment also produced an increase in the orders Eurotiales and Pleosporales, and treatment B produced an increase in Hypocreales, which showed a decreased concentration in samples from treatment C (nutrient solution) (Figure 3A,B). The phyla, Actinobacteria and Proteobacteria, were the most abundant in healthy plants, while in dead plants we found a higher proportion of Firmicutes (Figure 3C). Regarding treatments, the phyla, Myxococcota, Acidobacteria, and Proteobacteria, were the most abundant in the control, while Actinobacteriota dominated the soil from treated plants. Furthermore, the phylum, Firmicutes, was increased in soils from treatments B (B. amyloliquefaciens) and C (nutrient solution) (Figure 3D).
The genera, Archaeorhizomyces and Fusarium, varied in abundance depending on the plant condition: Archaeorhizomyces prevailed on healthy plants (p < 0.001, log2FoldChange = 5.1) while Fusarium did well on dead plants (p = 0.01, log2FoldChange= −2.43) (Figure 4A). For bacteria, the sole significant differences were found in the genera, Actinospica and Nocardioides, given that the former is more abundant in healthy plants (p = 0.028, Log2FoldChange = 1.51) and the latter is more abundant in dead plants (p = 0.029, log2FoldChange = −2.95) (Figure 4B).
The soil microbiota was affected by the treatment. There were three genera of fungi and eight genera of bacteria that differed from the samples from treatment A (P. aeruginosa + B. velezensis) with respect to the control. In fungi, the genera, Talaromyces and Archaeorhizomyces, were more abundant in the treated samples, while Rasamsonia prevailed in the control (Figure 5A). In bacteria, eight genera changed abundances significantly, with two of them being found in greater abundances in the control than in the treated samples (Pedomicrobium, and Nocardioides) and the other six being the opposite case (Nocardia, Pedosphaera, Roseiarcus. Anaeromyxobacter, FCPS473, and Burkholderia-Caballeronia-Paraburkholderia) (Figure 6A).
For treatment B (B.amyloliquefaciens), two genera of fungi differed with respect to the control: Polyschema, given that it was more abundant in the control than in the treated plants, and Fusarium, given that it was more abundant in the treated plants than in the control (Figure 5B). For bacteria there were 18 associated genera for all of the treatments. In the treated samples, the taxa Conexibacter, Tumebacillus, Pullulanibacillus, Mycobacterium, FCPS473, Nocardia, Paenibacillus, Alicyclobacillus, and Acidothermus were at higher proportions; while Koribacter, Hyphomicrobium, Pedomicrobium, Sphingomonas, Gemmatimonas, Solirubrobacter, and Actinomadura were more abundant in the control samples (Figure 6B).
Treatment C (nutrient solution) produced changes in 2 fungal and 21 bacterial taxa. In fungi, Archaeorhizomyces was more abundant in the treated plants and Rasamsonia was more abundant in the control ones (Figure 5C). In bacteria, the less abundant genera, with respect to the control, were Gemmatimonas, Solirubrobacter, Nocardioides, MND1, Roseisolibacter, Candidatus Koribacter, Sphingomonas, Pedomicrobium, Hyphomicrobium, Candidatus Nitrososphaera, and Geodermatophilus; while the most abundant taxa in the treated samples were Tumebacillus, Anaeromyxobacter, Ammoniphilus, Nocardia, Conexibacter, Burkholderia-Caballeronia-Paraburkholderia, Mycobacterium, Acidibacter, Acidothermus, and Pullulanibacillus (Figure 6C).

4. Discussion

The pathogens that are present in soil can cause crop losses, but other microorganisms, such as PGP bacteria, can exert a suppressive effect. A better knowledge of the microbiota interactions in the soil can help to inform sustainable strategies for pathogen control. The use of metabarcoding allowed us to identify the differences in soil microbiota between healthy and dead plants that were infected with M. phaseolina, and to evaluate the changes in the soil microbiota that were associated with the different control strategies assayed.
High soil microbial diversity has been associated with increased crop yield and resistance to pathogen attacks [58,59]. The higher diversity observed in live plants with respect to dead plants supports this hypothesis. Fungal diversity was low, and it was not influenced by either plant condition or treatment (Figure 1), meanwhile the bacterial microbiota was responsive to treatments (Figure 2).
Healthy and dead plants differed in their microbiota composition. The fungal order, Capnodiales, was more abundant around healthy plants; it includes diverse fungi with different lifestyles and nutrition pathways [60] (Figure 3A). The bacterial phyla, Proteobacteria and Actinobacteria, were predominant in healthy plants (Figure 3C). Many groups within these phyla have been associated with PGP activities and are related to plant development [61]. In dead plants, the fungal orders, Pleosporales, which contains parasites, epiphytes, or endophytes, and Hypocreales, which harbours genera that have been employed for biocontrol [62,63] (Figure 3A), were the most abundant. The bacterial phylum, Firmicutes, was slightly more abundant in dead plants (Figure 3C). That fact could contrast with the PGP activities associated with some of the strains that belong to this phylum, which are well known and have been used as biocontrol microorganisms [64].
At the genus level, Fusarium, a blueberry pathogen [65], was the most abundant in dead plants, and Archaeorhizomyces, a non-pathogen ubiquitous fungus commonly associated with plant roots [66], was most common in healthy plants (Figure 4A). The high presence of Fusarium in dead plants is cohesive with the positive interaction that this pathogen establishes with M. phaseolina; the latter could enhance the severity of the former [16]. We did not report a larger abundance of M. phaseolina in dead plants, contrary to our expectations. Perhaps, it could be explained by the fact that this pathogen is an endophyte and the studied samples were collected from soil [10]. For bacteria, the genus Nocardioides, which is most abundant in dead plants, is related to mineral fixation and organic material degradation [67]. It has also been associated with the resistance of Fusarium oxysporum and M. phaseolina since it contains strains with PGP activities and antifungal producers [68,69]. The larger presence of this genus in dead plants seems contradictory to what is known about this genus, although there may be undescribed functions that could explain this fact. On the contrary, the genus Actinospica, which has been used as a biocontrol [70], was the most abundant in healthy plants (Figure 4B).
The treatments produced changes in the soil microbial composition, especially treatments B (B. amyloliquefaciens) and C (nutrient solution) (Figure 2B). Biocontrol approaches have been described as effective strategies for the prevention of pathogen infections in many crops, and other studies support the use of the microorganisms employed in treatments A and B. Pseudomonas aeruginosa, the microorganism employed in treatment A, has been shown to have PGP activities and a strong antagonism against worldwide pathogens, such as M. phaseolina and F. oxysporum [71]. Furthermore, the genus Bacillus, which was used in treatments A and B, has been employed as a biocontrol against M. phaseolina, Fusarium spp., and Rhizoctonia solani, and has had good results in other crops [72].
At the fungal level, all treatments led to an increase in Capnodiales, which predominated in healthy plants. Soils under treatment A (P. aeruginosa + B. velezensis) were also abundant in the orders, Eurotiales and Pleosporales, given that the latter was very abundant in dead plants. Eurotiales harbors species from Penicillium or Aspergillus, which contain strains used in biocontrol [73,74,75]. Treatment B (B. amyloliquefaciens) increased the abundance of Hypocreales, which was also very abundant in dead plants (Figure 3B). At the genus level, treatment A (P. aeruginosa + B. velezensis) produced an increase in Talaromyces, which contains strains with PGP and biocontrol activities [76,77,78], and in Archaeorhizomyces, which was the most abundant in healthy plants (Figure 5A). Archaeorhizomyces was also increased in soils under treatment C (nutrient solution) (Figure 5C). Treatment B (B. amyloliquefaciens) led to a remarkable increase in Fusarium, whose presence was also higher in dead plants (Figure 5B).
The bacterial soil composition was also modified after the treatments employed. In all treated soils, Actinobacteriota were observed in larger abundances (Figure 3D). The abundance of Actinobacteriota was also greater in healthy plants, so some of their strains could have favorable properties for plant development or resistance. In treatment A (P. aeruginosa + B. velezensis), Pedomicrobium—which contains strains related to nitrogen fixation [79]—and Nocardioides reduced their presence with respect to the control soils. Six genera were increased in soils under treatment A, two of them (Roseiarcus and Anaeromyxobacter) with strains related to nitrogen fixation [79,80], two FCPS473 and Pedosphaera) with strains able to degrade xenobiotics or organic material [81,82], and two with strains that could act as pathogen antagonists: Nocardia, which can inhibit Fusarium and also has PGP activities [83], and Burkholderia-Caballeronia-Paraburkholderia, which can act against other pathogens [84] (Figure 6A). Treatment C significantly reduced the abundance of five genera with strains implicated in N-fixation (MND1, Roseisolibacter, Pedomicrobium, Hyphomicrobium, Candidatus Nitrososphaera, and Geodermatophilus) [79,85,86,87], three with strains that could act as PGP (Gemmatimonas, Solirubrobacter, and Sphingomonas) [88,89,90], and one that could act as a pathogen antagonist (Nocardioides). On the contrary, in treated soils there were two genera with strains implicated in nitrogen fixation (Anaeromyxobacter and Acidothermus) [79], two strains that could act as PGP (Conexibacter and Acidibacter) [91,92], two that contain potential pathogen antagonists (Nocardia and Burkholderia-Caballeronia-Paraburkholderia), one with strains that could degrade xenobiotics (Mycobacterium) [93], a genus that contains extremophiles (Pullulanibacillus) [94], and another with strains that can use oxalacetate (Ammoniphilus) [95] (Figure 6C).
The presence of bacteria that degrade xenobiotics in any of the treatments compared to the control and the disappearance of bacteria with functions involved in nitrogen fixation in the case of treatment C (nutrient solution) is striking. This treatment contains assimilable nitrogen in its composition, which may be related to the displacement of nitrogen fixers in the treated samples. As indicated by the β-diversity, treatments B (B. amyloliquefaciens) and C (nutrient solution) were the ones that modified bacterial composition the most. Given the changes and the characteristics attributed to the genera, it seems that treatment A (P. aeruginosa + B. velezensis) is the most favorable at both predicted fungal and bacterial activities. The results presented here indicate the short-term effect of the treatments. To know the true effect of the tested treatments, we should extend the trial over time, as it has only been applied during one season, and the blueberry is a perennial crop. Furthermore, this study has shown the positive relation between M. phaseolina and Fusarium. The biochemical fundamentals of this relation should be studied for developing a better understanding and for establishing good methods for the control of both infections.

5. Conclusions

A higher diversity was observed in healthy plants when compared with dead ones. Dead plants, all of which were infected with M. phaseolina, had a larger abundance of Fusarium spp., another blueberry pathogen, suggesting a synergy of both pathogens in plant infection. Some taxa changed in abundance according to the health state of the plant, although the treatments had the strongest effect on the microbiota, especially biocontrol treatment A. Our work has revealed the fungal and bacterial diversity patterns associated with blueberry crop soils. Future steps could be directed at elucidating the biocontrol mechanisms of some of the proposed bacteria or from newly screened bacteria, and could also contribute to understanding the complex microbial interactions that occur in the rhizosphere and in the interior of the plant tissues by using metagenomics or metatranscriptomics.

Author Contributions

Conceptualization, M.C., B.d.l.S. and L.M.; Data curation, S.R.-M. and M.C.-S.; Formal analysis, S.R.-M.; Funding acquisition, B.d.l.S.; Methodology, M.C.-S.; Project administration, M.C. and B.d.l.S.; Supervision, M.C. and M.C.-S.; Visualization, S.R.-M.; Writing—original draft, S.R.-M.; Writing—review & editing, S.R.-M., M.C., B.d.l.S., L.M. and M.C.-S. All authors have read and agreed to the published version of the manuscript.

Funding

This work has been supported by grant IFAPA PP.AVA. AVA2019.034, financed by the Junta de Andalucía with 80% FEDER funds from the European Union.

Institutional Review Board Statement

Not applicable.

Informed Consent Statement

Not applicable.

Data Availability Statement

Genetic data was deposited in GenBank under the BioProject PRJNA883611. Raw sequences were deposited in the Sequence Read Archive: accessions for 16S, SRR21713273-282, 284-287, 308-314, 316-325, and for ITS2, SRR21736139-48, 150-159, 161-166, 239-243. The filtered phyloseq R objects used in the analysis are available in FigShare (https://doi.org/10.6084/m9.figshare.21269091) (accessed on 10 October 2022).

Acknowledgments

This work has been financially supported by IFAPA grant PP.AVA.AVA2019.034, financed by the Junta de Andalucía with 80% FEDER funds from the European Union. MC-S has a postdoctoral contract from the Plan Andaluz de Investigación, Desarrollo e Innovación (PAIDI 2020). Part of the analysis was done in the High Performance Computing cluster hosted by the Centro Informático Científico de Andalucía, CICA (https://www.cica.es/) (accessed on 27 November 2021).

Conflicts of Interest

The authors declare no conflict of interest. The founding sponsors had no role in the design of the study; in the collection, analyses, or interpretation of data; in the writing of the manuscript, and in the decision to publish the results.

References

  1. FAO. FAO (Food and Agriculture Organization of United Nations). Available online: https://www.fao.org/faostat (accessed on 30 August 2022).
  2. Pérez, R.; Laca, A.; Laca, A.; Díaz, M. Environmental Behaviour of Blueberry Production at Small-Scale in Northern Spain and Improvement Opportunities. J. Clean. Prod. 2022, 339, 130594. [Google Scholar] [CrossRef]
  3. Zhao, L.; Cai, J.; He, W.; Zhang, Y. Macrophomina vaccinii Sp. Nov. Causing Blueberry Stem Blight in China. MycoKeys 2019, 55, 1–14. [Google Scholar] [CrossRef] [PubMed]
  4. Kunwar, I.K.; Singh, T.; Machado, C.C.; Sinclair, J.B. Histopathology of Soybean Seed and Seedling Infection by Macrophomina phaseolina. Phytopathology 1986, 76, 532–535. [Google Scholar] [CrossRef]
  5. Avilés, M.; de los Santos, B.; Borrero, C. Increase of Canker Disease Severity in Blueberries Caused by Neofusicoccum parvum or Lasiodiplodia Theobromae Due to Interaction with Macrophomina phaseolina Root Infection. Eur. J. Plant Pathol. 2021, 159, 655–663. [Google Scholar] [CrossRef]
  6. Wright, A.F.; Harmon, P.F. Identification of Species in the Botryosphaeriaceae Family Causing Stem Blight on Southern Highbush Blueberry in Florida. Plant Dis. 2010, 94, 966–971. [Google Scholar] [CrossRef] [Green Version]
  7. Borrero, C.; Castaño, R.; Avilés, M. First Report of Pestalotiopsis clavispora (Neopestalotiopsis clavispora) Causing Canker and Twig Dieback on Blueberry Bushes in Spain. Plant Dis. 2018, 102, 1178. [Google Scholar] [CrossRef]
  8. De los Santos, B.; Aguado, A.; Borrero, C.; Viejobueno, J.; Avilés, M. First Report of Charcoal Rot, Caused by Macrophomina phaseolina, on Blueberry in Southwestern Spain. Plant Dis. 2019, 103, 2677. [Google Scholar] [CrossRef]
  9. Viejobueno, V.; de los Santos, B.; Camacho-Sanchez, M.; Aguado, A.; María, C.; Salazar, S.M. Phenotypic Variability and Genetic Diversity of the Pathogenic Fungus Macrophomina phaseolina from Several Hosts and Host-Specialization in Strawberry. Curr. Microbiol. 2022, 189, 1–15. [Google Scholar] [CrossRef]
  10. Ijaz, S.; Sadaqat, H.A.; Khan, M.N. A Review of the Impact of Charcoal Rot (Macrophomina phaseolina) on Sunflower. J. Agric. Sci. 2013, 151, 222–227. [Google Scholar] [CrossRef]
  11. Reichert, I. On Research and Cooperation of Mediterranean Phytopathologists. Phytopathol. Mediterr. 1960, 1, 1–4. [Google Scholar]
  12. Ramezani, M.; Shier, W.T.; Abbas, H.K.; Tonos, J.L.; Baird, R.E.; Sciumbato, G.L. Soybean Charcoal Rot Disease Fungus Macrophomina phaseolina in Mississippi Produces the Phytotoxin (−)-Botryodiplodin but No Detectable Phaseolinone. J. Nat. Prod. 2007, 70, 128–129. [Google Scholar] [CrossRef]
  13. Dhingra, O.D.; Sinclair, J.B. Biology and Pathology of Macrophomina phaseolina. Australas. Plant Pathol. 1978, 7, 25. [Google Scholar] [CrossRef]
  14. Mirza, M.S.; Beg, A. Diseases of Sunflower in Pakistan. FAO Bull. Helia 1983, 6, 55–56. [Google Scholar]
  15. Ross, J.P. Predispositions of Soybeans to Fusarium Wilt by Heterodera Glycines and Meloidogyne Incognita. Phytopathology 1965, 55, 361–364. [Google Scholar]
  16. Khamari, B.; Beura, S.K.; Sushree, A.; Monalisa, S.P. Assessment of Combined Effect of Macrophomina Phaseolina and Fusarium Oxysporum on Disease Incidence of Sesame (Sesamum Indicum L.). Int. J. Curr. Microbiol. Appl. Sci. 2017, 6, 1135–1139. [Google Scholar] [CrossRef]
  17. ECHA, (European Chemical Agnecy). Available online: https://echa.europa.eu/es/substance-information/-/substanceinfo/100.007.798 (accessed on 20 December 2021).
  18. Gareau, B. Sociology in Global Environmental Governance? Neoliberalism, Protectionism and the Methyl Bromide Controversy in the Montreal Protocol. Environments 2017, 4, 73. [Google Scholar] [CrossRef] [Green Version]
  19. Guthman, J. Land Access and Costs May Drive Strawberry Growers’ Increased Use of Fumigation. Calif. Agric. 2017, 71, 184–191. [Google Scholar] [CrossRef] [Green Version]
  20. Holmes, G.J.; Mansouripour, S.M.; Hewavitharana, S.S. Strawberries at the Crossroads: Management of Soilborne Diseases in California without Methyl Bromide. Phytopathology 2020, 110, 956–968. [Google Scholar] [CrossRef] [PubMed] [Green Version]
  21. Goswami, D.; Thakker, J.N.; Dhandhukia, P.C. Portraying Mechanics of Plant Growth Promoting Rhizobacteria (PGPR): A Review. Cogent Food Agric. 2016, 2, 1127500. [Google Scholar] [CrossRef]
  22. Viejobueno, J.; Albornoz, P.L.; Camacho, M.; de los Santos, B.; Martínez-Zamora, M.G.; Salazar, S.M. Protection of Strawberry Plants against Charcoal Rot Disease (Macrophomina phaseolina) Induced by Azospirillum brasilense. Agronomy 2021, 11, 195. [Google Scholar] [CrossRef]
  23. Viejobueno, J.; Rodríguez-Berbel, N.; Miranda, L.; de los Santos, B.; Camacho, M. Potential Bacterial Antagonists for the Control of Charcoal Rot (Macrophomina phaseolina) in Strawberry. Horticulturae 2021, 7, 457. [Google Scholar] [CrossRef]
  24. Liu, H.; Li, J.; Carvalhais, L.C.; Percy, C.D.; Prakash Verma, J.; Schenk, P.M.; Singh, B.K. Evidence for the Plant Recruitment of Beneficial Microbes to Suppress Soil-borne Pathogens. New Phytol. 2021, 229, 2873–2885. [Google Scholar] [CrossRef]
  25. De Corato, U. Disease-Suppressive Compost Enhances Natural Soil Suppressiveness against Soil-Borne Plant Pathogens: A Critical Review. Rhizosphere 2020, 13, 100192. [Google Scholar] [CrossRef]
  26. Niu, B.; Wang, W.; Yuan, Z.; Sederoff, R.R.; Sederoff, H.; Chiang, V.L.; Borriss, R. Microbial Interactions Within Multiple-Strain Biological Control Agents Impact Soil-Borne Plant Disease. Front. Microbiol. 2020, 11, 585404. [Google Scholar] [CrossRef]
  27. Khoshru, B.; Moharramnejad, S.; Gharajeh, N.H.; Asgari Lajayer, B.; Ghorbanpour, M. Plant Microbiome and Its Important in Stressful Agriculture. In Plant Microbiome Paradigm; Springer International Publishing: Cham, Switzerland, 2020; pp. 13–48. [Google Scholar] [CrossRef]
  28. van Elsas, J.D.; Boersma, F.G.H. A Review of Molecular Methods to Study the Microbiota of Soil and the Mycosphere. Eur. J. Soil Biol. 2011, 47, 77–87. [Google Scholar] [CrossRef]
  29. Ruiz Gómez, F.J.; Navarro-Cerrillo, R.M.; Pérez-de-Luque, A.; Oβwald, W.; Vannini, A.; Morales-Rodríguez, C. Assessment of Functional and Structural Changes of Soil Fungal and Oomycete Communities in Holm Oak Declined Dehesas through Metabarcoding Analysis. Sci. Rep. 2019, 9, 5315. [Google Scholar] [CrossRef] [Green Version]
  30. Xu, J. Fungal DNA Barcoding. Genome 2016, 59, 913–932. [Google Scholar] [CrossRef] [Green Version]
  31. Pauvert, C.; Buée, M.; Laval, V.; Edel-Hermann, V.; Fauchery, L.; Gautier, A.; Lesur, I.; Vallance, J.; Vacher, C. Bioinformatics Matters: The Accuracy of Plant and Soil Fungal Community Data Is Highly Dependent on the Metabarcoding Pipeline. Fungal Ecol. 2019, 41, 23–33. [Google Scholar] [CrossRef]
  32. Rodríguez-Cárdenas, S. Caracterización de una Colección Bacteriana Aislada de Frutos Rojos en Base a sus Propiedades PGP y de Biocontrol. Ensayo de Promoción del Crecimiento en Plantas de Fresa. Master’s Thesis, University of Pablo de Olavide, Sevilla, Spain, 2020. [Google Scholar]
  33. Rotolo, C.; De Miccolis Angelini, R.M.; Pollastro, S.; Faretra, F. A TaqMan-Based QPCR Assay for Quantitative Detection of the Biocontrol Agents Bacillus subtilis Strain QST713 and Bacillus amyloliquefaciens Subsp. plantarum Strain D747. BioControl 2016, 61, 91–101. [Google Scholar] [CrossRef]
  34. Weißbecker, C.; Buscot, F.; Wubet, T. Preservation of Nucleic Acids by Freeze-Drying for next Generation Sequencing Analyses of Soil Microbial Communities. J. Plant Ecol. 2017, 10, 81–90. [Google Scholar] [CrossRef] [Green Version]
  35. Parada, A.E.; Needham, D.M.; Fuhrman, J.A. Every Base Matters: Assessing Small Subunit RRNA Primers for Marine Microbiomes with Mock Communities, Time Series and Global Field Samples. Environ. Microbiol. 2016, 18, 1403–1414. [Google Scholar] [CrossRef]
  36. Apprill, A.; McNally, S.; Parsons, R.; Weber, L. Minor Revision to V4 Region SSU RRNA 806R Gene Primer Greatly Increases Detection of SAR11 Bacterioplankton. Aquat. Microb. Ecol. 2015, 75, 129–137. [Google Scholar] [CrossRef]
  37. Earth Microbiome Project. Available online: https://earthmicrobiome.org/protocols-and-standards/16s/ (accessed on 12 December 2021).
  38. White, T.J.; Bruns, T.; Lee, S.; Taylor, J. Amplification and Direct Sequencing of Fungal Ribosomal RNA Genes for Phylogenetics. In PCR Protocols, a Guide to Methods and Applications; Academic Press, Inc.: New York, NY, USA, 1990; pp. 315–322. [Google Scholar] [CrossRef]
  39. Vierna, J.; Doña, J.; Vizcaíno, A.; Serrano, D.; Jovani, R. PCR Cycles above Routine Numbers Do Not Compromise High-Throughput DNA Barcoding Results. Genome 2017, 60, 868–873. [Google Scholar] [CrossRef] [Green Version]
  40. Martin, M. Cutadapt Removes Adapter Sequences from High-Throughput Sequencing Reads. EMBnet J. 2011, 17, 10. [Google Scholar] [CrossRef]
  41. Team, R.C. R: A Language and Environment for Statistical Computing; R Foundation for Statistical Computing: Vienna, Austria, 2021. [Google Scholar]
  42. Callahan, B.J.; McMurdie, P.J.; Rosen, M.J.; Han, A.W.; Johnson, A.J.A.; Holmes, S.P. DADA2: High-Resolution Sample Inference from Illumina Amplicon Data. Nat. Methods 2016, 13, 581–583. [Google Scholar] [CrossRef] [Green Version]
  43. Dada2 Tutorial with NovaSeq Dataset for Ernakovich Lab. Available online: https://github.com/ErnakovichLab/dada2_ernakovichlab (accessed on 16 November 2021).
  44. Callahan, B.J.; McMurdie, P.J.; Holmes, S.P. Exact Sequence Variants Should Replace Operational Taxonomic Units in Marker-Gene Data Analysis. ISME J. 2017, 11, 2639–2643. [Google Scholar] [CrossRef] [Green Version]
  45. Yilmaz, P.; Parfrey, L.W.; Yarza, P.; Gerken, J.; Pruesse, E.; Quast, C.; Schweer, T.; Peplies, J.; Ludwig, W.; Glöckner, F.O. The SILVA and “All-Species Living Tree Project (LTP)” Taxonomic Frameworks. Nucleic Acids Res. 2014, 42, D643–D648. [Google Scholar] [CrossRef] [Green Version]
  46. Kõljalg, U.; Nilsson, H.R.; Schigel, D.; Tedersoo, L.; Larsson, K.-H.; May, T.W.; Taylor, A.F.S.; Jeppesen, T.S.; Frøslev, T.G.; Lindahl, B.D.; et al. The Taxon Hypothesis Paradigm—On the Unambiguous Detection and Communication of Taxa. Microorganisms 2020, 8, 1910. [Google Scholar] [CrossRef]
  47. Callahan, B.J.; Sankaran, K.; Fukuyama, J.A.; McMurdie, P.J.; Holmes, S.P. Bioconductor Workflow for Microbiome Data Analysis: From Raw Reads to Community Analyses. F1000Research 2016, 5, 1492. [Google Scholar] [CrossRef]
  48. Vmikk/MetagMisc:, V. Vmikk/MetagMisc: V.0.0.0.9000. Available online: https://doi.org/10.5281/ZENODO.571403 (accessed on 5 December 2021).
  49. Davis, N.M.; Proctor, D.M.; Holmes, S.P.; Relman, D.A.; Callahan, B.J. Simple Statistical Identification and Removal of Contaminant Sequences in Marker-Gene and Metagenomics Data. Microbiome 2018, 6, 226. [Google Scholar] [CrossRef] [Green Version]
  50. McMurdie, P.J.; Holmes, S. Phyloseq: An R Package for Reproducible Interactive Analysis and Graphics of Microbiome Census Data. PLoS ONE 2013, 8, e61217. [Google Scholar] [CrossRef]
  51. Thukral, A.K. A Review on Measurement of Alpha Diversity in Biology. Agric. Res. J. 2017, 54, 1–10. [Google Scholar] [CrossRef]
  52. Bates, D.; Mächler, M.; Bolker, B.; Walker, S. Fitting Linear Mixed-Effects Models Using Lme4. J. Stat. Softw. 2015, 67, 1–48. [Google Scholar] [CrossRef]
  53. Whittaker, R.H. Vegetation of the Siskiyou Mountains, Oregon and California. Ecol. Monogr. 1960, 30, 279–338. [Google Scholar] [CrossRef]
  54. Oksanen, J.; Guillaume Blanchet, F.; Friendly, M.; Kindt, R.; Legendre, P.; McGlinn, D.; Minchin, P.R.; O’Hara, R.B.; Simpson, G.L.; Solymos, P.; et al. Vegan: Community Ecology Package. 2020. Available online: https://CRAN.R-project.org/package=vegan (accessed on 6 December 2021).
  55. Love, M.I.; Huber, W.; Anders, S. Moderated Estimation of Fold Change and Dispersion for RNA-Seq Data with DESeq2. Genome Biol. 2014, 15, 550. [Google Scholar] [CrossRef] [Green Version]
  56. Lahti, L.; Shetty, S. Microbiome R Package. 2019. Available online: https://github.com/microbiome/microbiome (accessed on 20 December 2021).
  57. Wickham, H. Ggplot2: Elegant Graphics for Data Analysis; Springer: New York, NY, USA, 2016; Available online: https://ggplot2.tidyverse.org (accessed on 20 December 2021).
  58. Bardgett, R.D.; van der Putten, W.H. Belowground Biodiversity and Ecosystem Functioning. Nature 2014, 515, 505–511. [Google Scholar] [CrossRef]
  59. van der Heijden, M.G.A.; Bardgett, R.D.; van Straalen, N.M. The Unseen Majority: Soil Microbes as Drivers of Plant Diversity and Productivity in Terrestrial Ecosystems. Ecol. Lett. 2008, 11, 296–310. [Google Scholar] [CrossRef]
  60. Crous, P.W.; Schoch, C.L.; Hyde, K.D.; Wood, A.R.; Gueidan, C.; de Hoog, G.S.; Groenewald, J.Z. Phylogenetic Lineages in the Capnodiales. Stud. Mycol. 2009, 64, 17–47. [Google Scholar] [CrossRef]
  61. Liu, C.; Lin, H.; He, P.; Li, X.; Geng, Y.; Tuerhong, A.; Dong, Y. Peat and Bentonite Amendments Assisted Soilless Revegetation of Oligotrophic and Heavy Metal Contaminated Nonferrous Metallic Tailing. Chemosphere 2022, 287, 132101. [Google Scholar] [CrossRef]
  62. Kepler, R.M.; Maul, J.E.; Rehner, S.A. Managing the Plant Microbiome for Biocontrol Fungi: Examples from Hypocreales. Curr. Opin. Microbiol. 2017, 37, 48–53. [Google Scholar] [CrossRef]
  63. Zhang, Y.; Crous, P.W.; Schoch, C.L.; Hyde, K.D. Pleosporales. Fungal Divers. 2012, 53, 1–221. [Google Scholar] [CrossRef]
  64. Hashmi, I.; Bindschedler, S.; Junier, P. Firmicutes. In Beneficial Microbes in Agro-Ecology; Elsevier: Amsterdam, The Netherlands, 2020; pp. 363–396. [Google Scholar] [CrossRef]
  65. Pérez, B.A.; Murillo, F.; Divo de Sesar, M.; Wright, E.R. Occurrence of Fusarium solani on Blueberry in Argentina. Plant Dis. 2007, 91, 1053. [Google Scholar] [CrossRef]
  66. Rosling, A.; Cox, F.; Cruz-Martinez, K.; Ihrmark, K.; Grelet, G.-A.; Lindahl, B.D.; Menkis, A.; James, T.Y. Archaeorhizomycetes: Unearthing an Ancient Class of Ubiquitous Soil Fungi. Science 2011, 333, 876–879. [Google Scholar] [CrossRef]
  67. Ayangbenro, A.S.; Babalola, O.O. Reclamation of Arid and Semi-Arid Soils: The Role of Plant Growth-Promoting Archaea and Bacteria. Curr. Plant Biol. 2021, 25, 100173. [Google Scholar] [CrossRef]
  68. Zhao, F.; Zhang, Y.; Dong, W.; Zhang, Y.; Zhang, G.; Sun, Z.; Yang, L. Vermicompost Can Suppress Fusarium Oxysporum f. Sp. Lycopersici via Generation of Beneficial Bacteria in a Long-Term Tomato Monoculture Soil. Plant Soil 2019, 440, 491–505. [Google Scholar] [CrossRef]
  69. Lazcano, C.; Boyd, E.; Holmes, G.; Hewavitharana, S.; Pasulka, A.; Ivors, K. The Rhizosphere Microbiome Plays a Role in the Resistance to Soil-Borne Pathogens and Nutrient Uptake of Strawberry Cultivars under Field Conditions. Sci. Rep. 2021, 11, 3188. [Google Scholar] [CrossRef] [PubMed]
  70. Qi, G.; Ma, G.; Chen, S.; Lin, C.; Zhao, X. Microbial Network and Soil Properties Are Changed in Bacterial Wilt-Susceptible Soil. Appl. Environ. Microbiol. 2019, 85, e00162-19. [Google Scholar] [CrossRef] [Green Version]
  71. Gupta, C.P.; Sharma, A.; Dubey, R.C.; Maheshwari, D.K. Pseudomonas aeruginosa (GRC1) as a Strong Antagonist of Macrophomina phaseolina and Fusarium oxysporum. Cytobios 1999, 1999, 183–189. [Google Scholar]
  72. Dawar, S.; Wahab, S.; Tariq, M.; Zaki, M.J. Application of Bacillus Species in the Control of Root Rot Diseases of Crop Plants. Arch. Phytopathol. Plant Prot. 2010, 43, 412–418. [Google Scholar] [CrossRef]
  73. Bhattacharyya, D.; Basu, S.; Chattapadhyay, J.P.; Bose, S.K. Biocontrol of Macrophomina Root-Rot Disease of Jute by an Antagonistic Organism, Aspergillus versicolor. Plant Soil 1985, 87, 435–438. [Google Scholar] [CrossRef]
  74. Khan, I.H.; Javaid, A. In Vitro Screening of Aspergillus Spp. for Their Biocontrol Potential against Macrophomina phaseolina. J. Plant Pathol. 2021, 103, 1195–1205. [Google Scholar] [CrossRef]
  75. Houbraken, J.; Kocsubé, S.; Visagie, C.M.; Yilmaz, N.; Wang, X.-C.; Meijer, M.; Kraak, B.; Hubka, V.; Bensch, K.; Samson, R.A.; et al. Classification of Aspergillus, Penicillium, Talaromyces and Related Genera (Eurotiales): An Overview of Families, Genera, Subgenera, Sections, Series and Species. Stud. Mycol. 2020, 95, 5–169. [Google Scholar] [CrossRef]
  76. Fahima, T.; Henis, Y. Quantitative Assessment of the Interaction between the Antagonistic Fungus Talaromyces flavus and the Wilt Pathogen Verticillium dahliae on Eggplant Roots. Plant Soil 1995, 176, 129–137. [Google Scholar] [CrossRef]
  77. Khalmuratova, I.; Kim, H.; Nam, Y.J.; Oh, Y.; Jeong, M.J.; Choi, H.R.; You, Y.H.; Choo, Y.S.; Lee, I.J.; Shin, J.H.; et al. Diversity and Plant Growth Promoting Capacity of Endophytic Fungi Associated with Halophytic Plants from the West Coast of Korea. Mycobiology 2015, 43, 373–383. [Google Scholar] [CrossRef] [Green Version]
  78. McLaren, D.L.; Huang, H.C.; Rimmer, S.R.; Kokko, E.G. Ultrastructural Studies on Infection of Sclerotia of Sclerotinia sclerotiorum by Talaromyces flavus. Can. J. Bot. 1989, 67, 2199–2205. [Google Scholar] [CrossRef]
  79. Black, M.; Moolhuijzen, P.; Chapman, B.; Barrero, R.; Howieson, J.; Hungria, M.; Bellgard, M. The Genetics of Symbiotic Nitrogen Fixation: Comparative Genomics of 14 Rhizobia Strains by Resolution of Protein Clusters. Genes 2012, 3, 138–166. [Google Scholar] [CrossRef] [Green Version]
  80. Masuda, Y.; Yamanaka, H.; Xu, Z.-X.; Shiratori, Y.; Aono, T.; Amachi, S.; Senoo, K.; Itoh, H. Diazotrophic Anaeromyxobacter Isolates from Soils. Appl. Environ. Microbiol. 2020, 86, e00956-20. [Google Scholar] [CrossRef] [PubMed]
  81. Kavitha, A.; Prabhakar, P.; Narasimhulu, M.; Vijayalakshmi, M.; Venkateswarlu, Y.; Venkateswara Rao, K.; Balaraju Subba Raju, V. Isolation, Characterization and Biological Evaluation of Bioactive Metabolites from Nocardia Levis MK-VL_113. Microbiol. Res. 2010, 165, 199–210. [Google Scholar] [CrossRef]
  82. Nisrina, L.; Effendi, Y.; Pancoro, A. Revealing the Role of Plant Growth Promoting Rhizobacteria in Suppressive Soils against Fusarium Oxysporum f.Sp. Cubense Based on Metagenomic Analysis. Heliyon 2021, 7, e07636. [Google Scholar] [CrossRef]
  83. Ghodhbane-Gtari, F.; Nouioui, I.; Hezbri, K.; Lundstedt, E.; D’Angelo, T.; McNutt, Z.; Laplaze, L.; Gherbi, H.; Vaissayre, V.; Svistoonoff, S.; et al. The Plant-Growth-Promoting Actinobacteria of the Genus Nocardia Induces Root Nodule Formation in Casuarina glauca. Antonie Leeuwenhoek 2019, 112, 75–90. [Google Scholar] [CrossRef]
  84. Luo, L.; Wang, L.; Deng, L.; Mei, X.; Liu, Y.; Huang, H.; Du, F.; Zhu, S.; Yang, M. Enrichment of Burkholderia in the Rhizosphere by Autotoxic Ginsenosides to Alleviate Negative Plant-Soil Feedback. Microbiol. Spectr. 2021, 9, e01400-21. [Google Scholar] [CrossRef]
  85. Kumar, U.; Kumar Nayak, A.; Shahid, M.; Gupta, V.V.S.R.; Panneerselvam, P.; Mohanty, S.; Kaviraj, M.; Kumar, A.; Chatterjee, D.; Lal, B.; et al. Continuous Application of Inorganic and Organic Fertilizers over 47 Years in Paddy Soil Alters the Bacterial Community Structure and Its Influence on Rice Production. Agric. Ecosyst. Environ. 2018, 262, 65–75. [Google Scholar] [CrossRef]
  86. Franke-Whittle, I.H.; Manici, L.M.; Insam, H.; Stres, B. Rhizosphere Bacteria and Fungi Associated with Plant Growth in Soils of Three Replanted Apple Orchards. Plant Soil 2015, 395, 317–333. [Google Scholar] [CrossRef]
  87. Schleper, C.; Nicol, G.W. Ammonia-Oxidising Archaea—Physiology, Ecology and Evolution. Adv. Microb. Physiol. 2010, 57, 1–41. [Google Scholar] [CrossRef]
  88. Zhang, H.; Sekiguchi, Y.; Hanada, S.; Hugenholtz, P.; Kim, H.; Kamagata, Y.; Nakamura, K. Gemmatimonas aurantiaca Gen. Nov., Sp. Nov., a Gram-Negative, Aerobic, Polyphosphate-Accumulating Micro-Organism, the First Cultured Representative of the New Bacterial Phylum Gemmatimonadetes Phyl. Nov. Int. J. Syst. Evol. Microbiol. 2003, 53, 1155–1163. [Google Scholar] [CrossRef]
  89. Asaf, S.; Numan, M.; Khan, A.L.; Al-Harrasi, A. Sphingomonas: From Diversity and Genomics to Functional Role in Environmental Remediation and Plant Growth. Crit. Rev. Biotechnol. 2020, 40, 138–152. [Google Scholar] [CrossRef]
  90. Grady, E.N.; MacDonald, J.; Liu, L.; Richman, A.; Yuan, Z.-C. Current Knowledge and Perspectives of Paenibacillus: A Review. Microb. Cell Fact. 2016, 15, 203. [Google Scholar] [CrossRef] [PubMed] [Green Version]
  91. Chen, X.; Wang, J.; You, Y.; Wang, R.; Chu, S.; Chi, Y.; Hayat, K.; Hui, N.; Liu, X.; Zhang, D.; et al. When Nanoparticle and Microbes Meet: The Effect of Multi-Walled Carbon Nanotubes on Microbial Community and Nutrient Cycling in Hyperaccumulator System. J. Hazard. Mater. 2022, 423, 126947. [Google Scholar] [CrossRef] [PubMed]
  92. Ren, H.; Wang, H.; Yu, Z.; Zhang, S.; Qi, X.; Sun, L.; Wang, Z.; Zhang, M.; Ahmed, T.; Li, B. Effect of Two Kinds of Fertilizers on Growth and Rhizosphere Soil Properties of Bayberry with Decline Disease. Plants 2021, 10, 2386. [Google Scholar] [CrossRef]
  93. Child, R.; Miller, C.D.; Liang, Y.; Narasimham, G.; Chatterton, J.; Harrison, P.; Sims, R.C.; Britt, D.; Anderson, A.J. Polycyclic Aromatic Hydrocarbon-Degrading Mycobacterium Isolates: Their Association with Plant Roots. Appl. Microbiol. Biotechnol. 2007, 75, 655–663. [Google Scholar] [CrossRef] [PubMed]
  94. Ueki, A.; Kaku, N.; Ueki, K. Role of Anaerobic Bacteria in Biological Soil Disinfestation for Elimination of Soil-Borne Plant Pathogens in Agriculture. Appl. Microbiol. Biotechnol. 2018, 102, 6309–6318. [Google Scholar] [CrossRef] [PubMed]
  95. Sahin, N. Oxalotrophic Bacteria. Res. Microbiol. 2003, 154, 399–407. [Google Scholar] [CrossRef]
Figure 1. Alpha diversity. Graphic representation of the alpha diversity as a box plot and values in tables (median with 0.25 and 0.75 quantiles). (A) Observed diversity and the Shannon and Simpson indices for fungi. (B) Observed diversity and the Shannon and Simpson indices for bacteria.
Microbiolres 13 00057 g001
Figure 2. Beta diversity. The graphic shows the differences and the similarities between the samples due to the treatment and the condition: (A) PCoA (Principal Coordinates Analysis) for fungi; (B) PCoA for bacteria.
Microbiolres 13 00057 g002
Figure 3. Relative abundances: (A) the relative abundance of fungi orders depending on the plant condition; (B) relative abundance of fungi depending on the treatment; (C) relative abundance of bacterial phyla depending on the plant condition; and (D) relative abundance of bacterial phyla depending on the treatment.
Microbiolres 13 00057 g003
Figure 4. Changes in the relative abundance of the genera as a function of plant condition for fungi (A) and bacteria (B). The Y-axis represents the log2 of fold change. Red bars indicate p-value ≥ 0.05 and blue bars indicate p-value < 0.05. Only genera whose p-values were below 0.6 are depicted.
Microbiolres 13 00057 g004
Figure 5. Changes in the relative abundance of the fungi genera as a function of treatments A (A), B (B), and C (C). The Y-axis represents the log2FoldChange. Only genera with p-values < 0.6 are depicted.
Microbiolres 13 00057 g005
Figure 6. Changes in the relative abundance of the bacteria genera as a function of treatments A (A), B (B), and C (C). The Y-axis represents the log2FoldChange. Only genera with p-values < 0.6 are depicted.
Microbiolres 13 00057 g006
Table 1. Locus-specific primer sequences.
PrimersSEQUENCE (5′–3′)
Bacterial 16S515F-YGTGYCAGCMGCCGCGGTAA
806RGGACTACNVGGGTWTCTAAT
Fungal ITS2ITS3GCATCGATGAAGAACGCAGC
ITS4RTCCTCCGCTTATTGATATGC
Publisher’s Note: MDPI stays neutral with regard to jurisdictional claims in published maps and institutional affiliations.

