Article

Viral and Host Small RNA Response to SARS-CoV-2 Infection

1
Department of Diabetes Complications & Metabolism, Arthur Riggs Diabetes & Metabolism Research Institute, Beckman Research Institute of City of Hope National Medical Center, Duarte, CA 91010, USA
2
Division of Stem Cell Biology Research, Department of Stem Cell Biology and Regenerative Medicine, Beckman Research Institute of City of Hope National Medical Center, Duarte, CA 91010, USA
3
Department of Molecular and Medical Pharmacology, University of California Los Angeles, Los Angeles, CA 90095, USA
4
Eli and Edythe Broad Center of Regenerative Medicine and Stem Cell Research, University of California Los Angeles, Los Angeles, CA 90095, USA
*
Authors to whom correspondence should be addressed.
Microbiol. Res. 2022, 13(4), 788-808; https://doi.org/10.3390/microbiolres13040056
Submission received: 8 September 2022 / Revised: 4 October 2022 / Accepted: 6 October 2022 / Published: 10 October 2022
(This article belongs to the Topic Host–Parasite Interactions)

Abstract

:
After two years into the pandemic of the coronavirus disease 2019 (COVID-19), it remains unclear how the host RNA interference (RNAi) pathway and host miRNAs regulate severe acute respiratory syndrome coronavirus 2 (SARS-CoV-2) infection and impact the development of COVID-19. In this study, we profiled small RNAs in SARS-CoV-2-infected human ACE2-expressing HEK293T cells and observed dysregulated host small RNA groups, including specific host miRNAs that are altered in response to SARS-CoV-2 infection. By comparing dysregulated miRNAs in different SARS-CoV-2-infected samples, we identified miRNA-210-3p, miRNA-30-5p, and miR-146a/b as key host miRNAs that may be involved in SARS-CoV-2 infection. Furthermore, by comparing virally derived small RNAs (vsmRNAs) in different SARS-CoV-2-infected samples, we observed multiple hot spots in the viral genome that are prone to generating vsmRNAs, and their biogenesis can be dependent on the antiviral isoform of Dicer. Moreover, we investigated the biogenesis of a recently identified SARS-CoV-2 viral miRNA encoded by ORF7a and found that it is differentially expressed in different infected cell lines or in the same cell line with different viral doses. Our results demonstrate the involvement of both host small RNAs and vsmRNAs in SARS-CoV-2 infection and identify these small RNAs as potential targets for anti-COVID-19 therapeutic development.

1. Introduction

Two years into the global coronavirus disease 2019 (COVID-19) pandemic, caused by severe acute respiratory syndrome coronavirus 2 (SARS-CoV-2), a new zoonotic coronavirus strain with humans as a host [1], many aspects of this disease are still unknown. Questions that remain to be answered include what is the origin of SARS-CoV-2, how the broad range of symptoms is induced in response to SARS-CoV-2 infection, and what is the contribution of genetic background to the development of COVID-19. One intriguing question is whether this virus interacts with the host endogenous RNA interference (RNAi) pathway during infection and COVID-19 pathogenesis. Additional related questions include whether the host can use RNAi to control SARS-CoV-2-induced pathogenesis, whether SARS-CoV-2 encodes viral suppressors of RNAi (VSR) to antagonize the host RNAi response, whether SARS-CoV-2 encodes viral small RNAs (vsmRNAs), and if yes, whether these vsmRNAs play a role in the infectious cycle of SARS-CoV-2. COVID-19 is a disease associated with complicated immune reactions from the host immune system, including hyperinflammation. In addition to modulating the life cycle of the virus, the host RNAi system may also play an important role in regulating the immune system in response to SARS-CoV-2 infection [2,3]. Answers to these questions could reveal novel mechanisms underlying SARS-CoV-2 infectiousness and COVID-19 pathogenesis and facilitate the development of RNAi-based therapies for COVID-19 [4].
RNAi, an endogenous gene silencing mechanism in eukaryotic cells, was first recognized as an antiviral mechanism in plants, nematodes, and insects, and is the major antiviral mechanism by which non-vertebrates control viral infection [5,6]. Since the beginning of the current pandemic, there has been tremendous interest in determining how SARS-CoV-2 interacts with the host RNAi pathway as well as how to control SARS-CoV-2 infection using RNAi reagents [7,8]. It has been reported that the N protein of SARS-CoV-2 may act as a viral suppressor of RNAi [9]. Several publications have reported results of small RNAs and SARS-CoV-2-infection related studies, and potential vsmRNAs have been identified [10,11,12,13,14,15,16,17,18,19]. However, a consensus has not been reached yet. For example, the ORF7a-encoded miRNA-like vsmRNA (vmiRNA-ORF7a or vmiR-ORF7a) was identified and validated by two independent groups [17,18], but other published studies failed to identify it. The above two groups also reported that SARS-CoV-2 infection has marginal effects on host miRNA expression in the same datasets that they used to identify vmiR-ORF7a, whereas other reports have shown that some host miRNAs are significantly altered in SARS-CoV-2-infected cell lines and COVID-19 patients [10,14,20]. These conflicting data may result from different experimental conditions or due to the complexity of SARS-CoV-2 infection. Here we present our small RNA profiling data of SARS-CoV-2-infected human ACE2 (hACE2)-expressing HEK293T cells (HEK293T-hACE2) using an smRNA sequencing (smRNAseq) protocol we developed previously [21,22].
HEK293T cells have very low levels of immune response due to a defect in innate immunity to allow cell survival during long-term infection [23,24], thus, providing a platform for observing changes in transcriptome or small RNA profiles during SARS-CoV-2 infection that may be masked by a strong immune response in experiments using immune reaction-prone cells or patient samples [25]. We found that SARS-CoV-2 infection of HEK293T-hACE2 cells induced significant changes in many small host RNAs, including miRNAs. Specifically, our data, together with published data, support a potential role for several host miRNAs, including miR-210-3p, miR-146a/b, and miR-30-5p, in the pathogenesis of COVID-19. These miRNAs could aid our understanding of COVID-19 pathogenesis and serve as potential targets for developing effective anti-COVID-19 therapies.
Consistent with published data, we also observed that the SARS-CoV-2 infection in HEK293T-hACE2 cells produced vsmRNAs from many hot spots across the SARS-CoV-2 genome. Based on their biogenesis, vsmRNAs can be classified as virally encoded miRNAs (vmiRNA is generated from structure segments of viral RNAs processed by the Drosha/DGCR8 complex and then the Dicer/TRBP complex in the canonical miRNA biogenesis pathway; viral RNAs need to enter the nucleus or the Drosha/DGCR8 complex needs to be redistributed to the cytoplasm for vmiRNA generation), and viral small interfering RNAs (vsiRNA—generated from Dicer-processed viral double-stranded replication intermediates formed by positive and negative viral RNA strands). SARS-CoV-2, a positive, single-stranded RNA (+ssRNA) virus, also produces a negative single-stranded RNA (−ssRNA) genome during replication. Several truncated forms of subgenomic mRNA (sgmRNA) also exist in both positive (+sgmRNA) and negative (−sgmRNA) forms. Importantly, all viral proteins are encoded by +sgmRNA, and all positive and negative transcripts share the same 5′ and 3′ sequences with the +ssRNA and −ssRNA genomes, respectively [26]. While the double-stranded viral RNA formed by ±ssRNA or ±sgmRNA may be chopped by the Dicer/TRBP complex into vsiRNA, hairpin RNA structures formed by both genomes and sgmRNAs may become favorable substrates of the Drosha/DGCR8 complex and be processed into vmiRNAs [27,28]. It is also possible that some hairpin structures that are formed by sgmRNAs may be processed by the Dicer/TRBP complex into vmiRNAs directly, thus, bypassing the Drosha/DGCR8 process step. It is conceivable that both vmiRNA and vsiRNA can play roles in SARS-CoV-2 infection by targeting viral RNAs or host genes. The coding sequence of the nucleocapsid (N) protein and the open reading frame 10 (ORF10) followed by the N gene at the 3′ ends of the SARS-CoV-2 genome serve as the 3′ untranslated regions (UTR) for other positive viral transcripts. These sequences are also the shared sequence for all viral transcripts, and it is likely that the prime region will be targeted by RNAi or used for encoding vsmRNAs.
Our data from HEK293T-hACE2 and published data indicate that the SARS-CoV-2 infection can produce abundant putative vmiRNAs but much fewer vsiRNAs, and similar to vsiRNAs, the biogenesis of vmiRNAs can be dependent on the antiviral isoforms of Dicer (aviD). Moreover, the reanalysis of datasets used to clone vmiR-ORF7a indicates that the abundance of vmiR-ORF7a varies largely with different infection doses and cell lines, and the abundance does not always correlate with the potential scale of immune response of the cell lines [17,18]. Hence, more studies are needed to unveil the biogenesis and function of vsmRNAs, including vmiR-ORF7a, in SARS-CoV-2 infection, and their role in COVID-19 pathogenesis.

2. Results

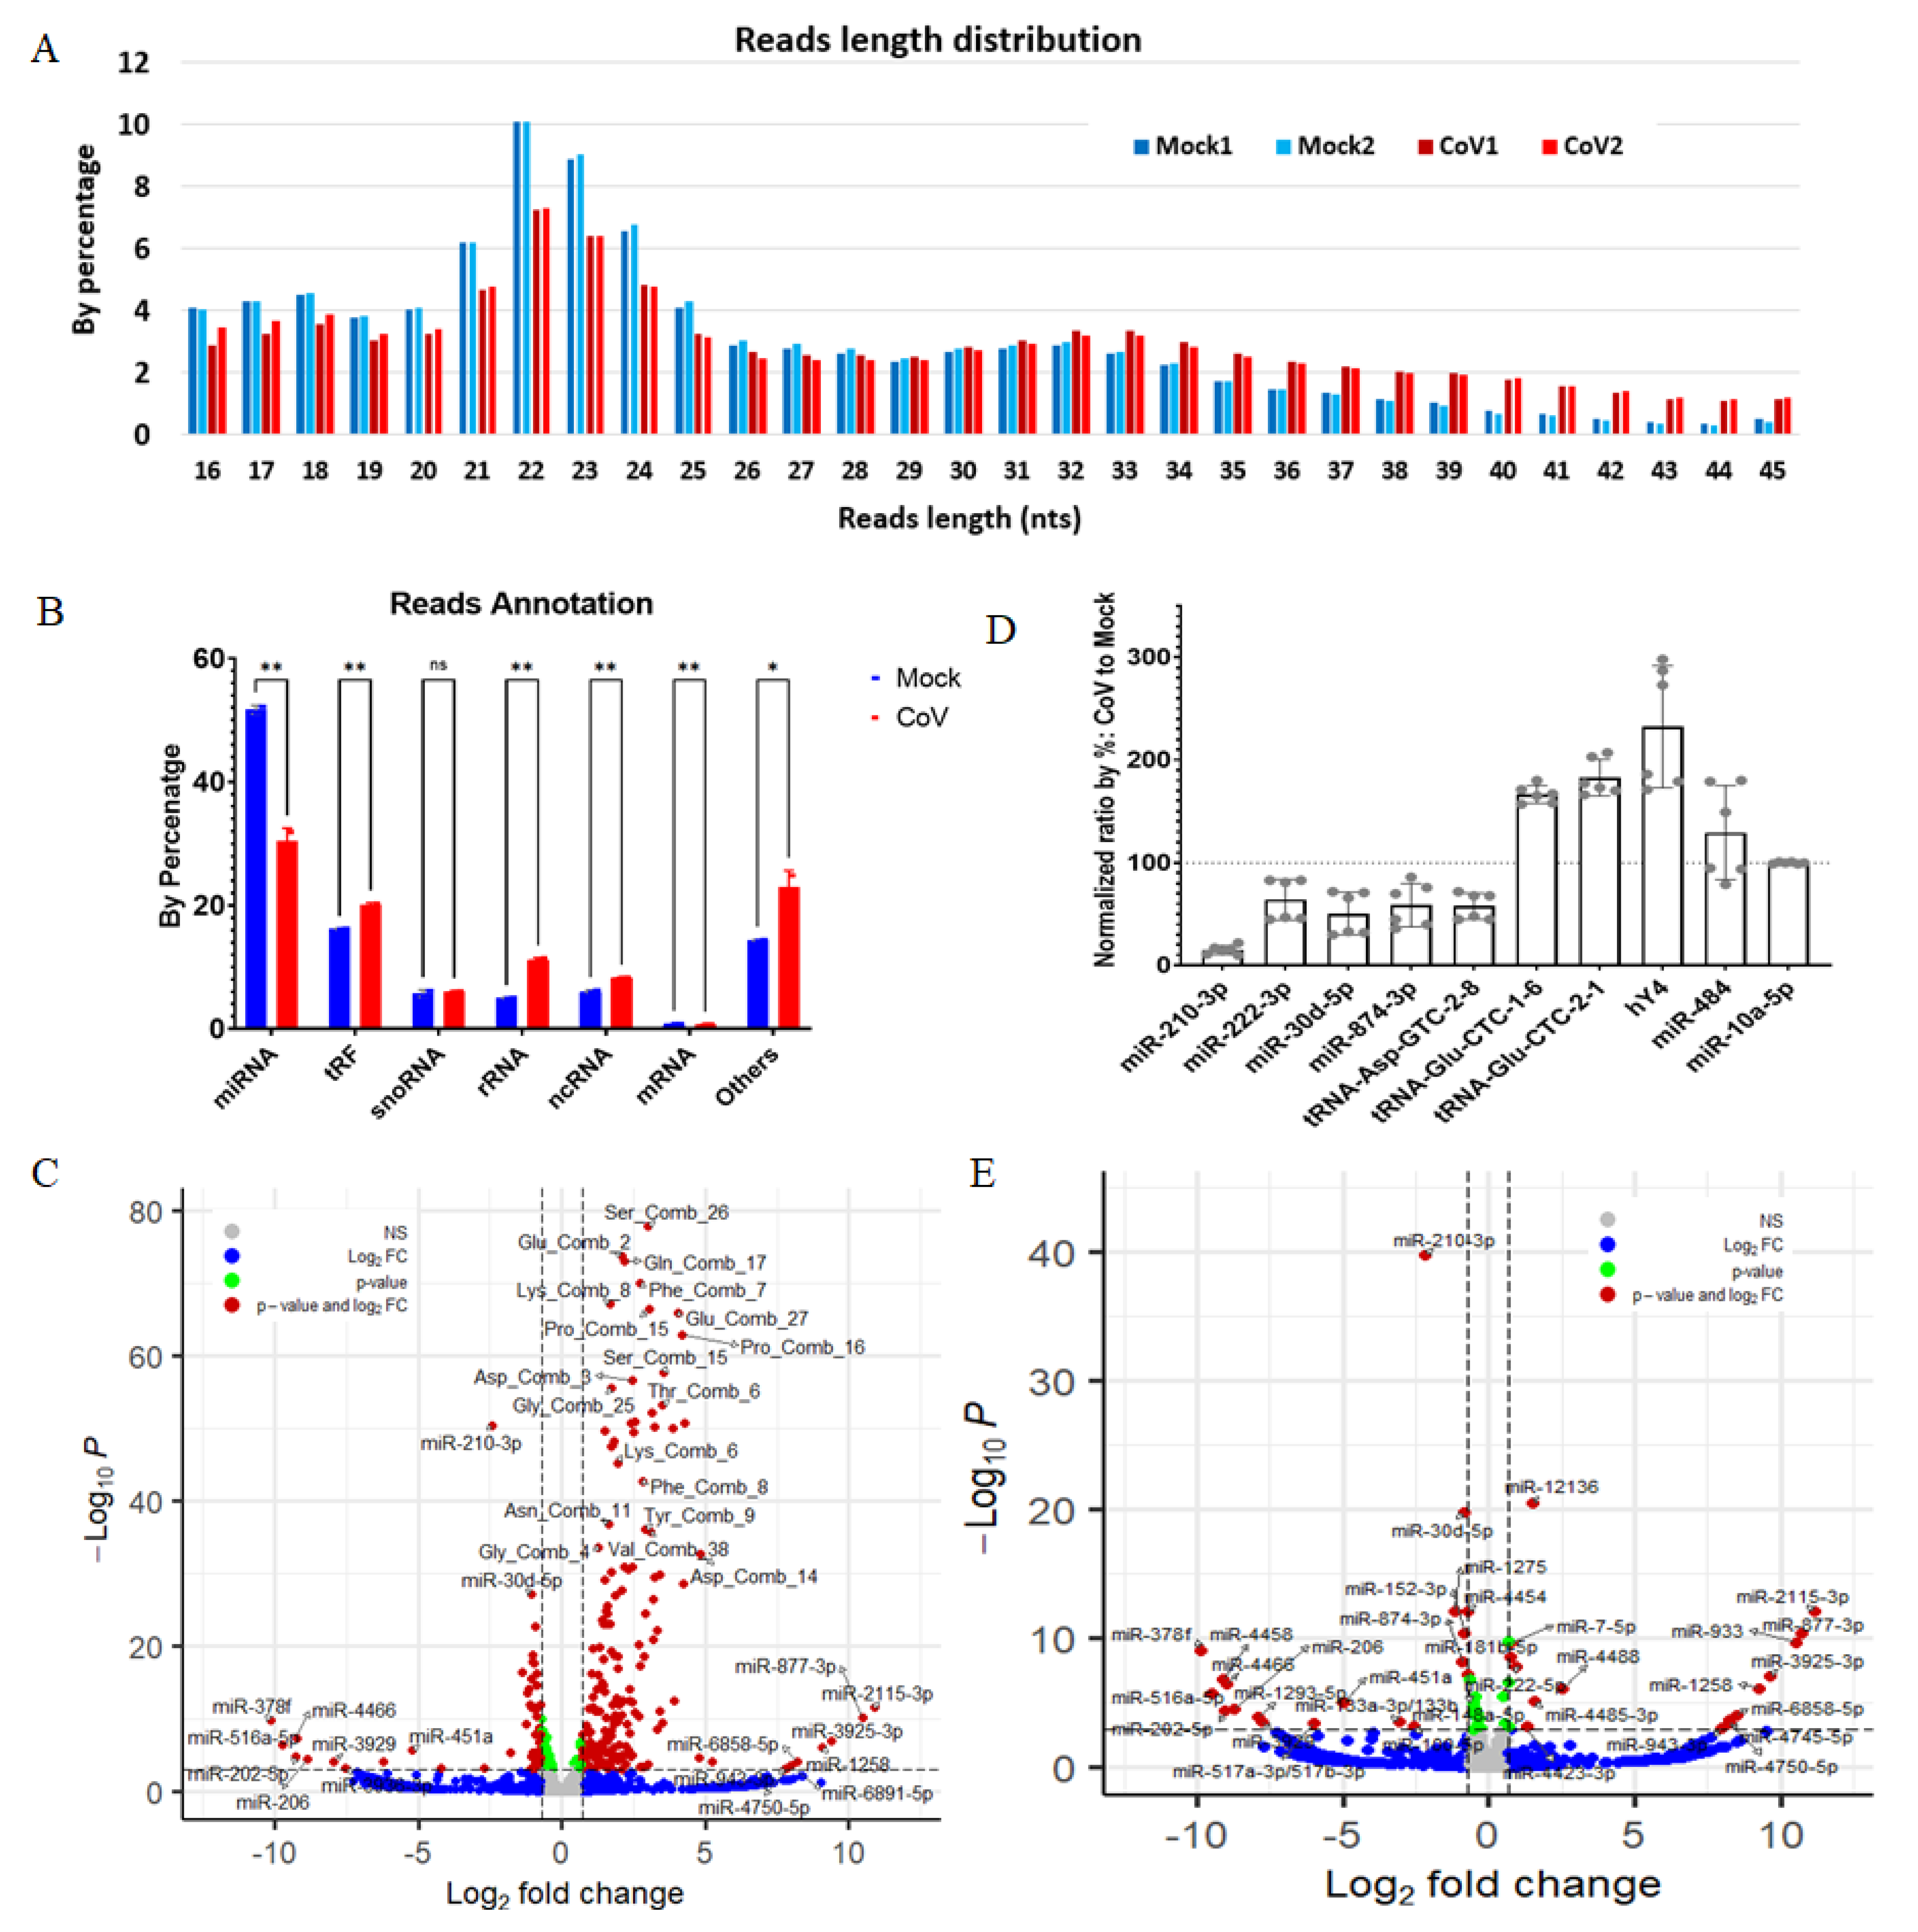
2.1. SARS-CoV-2 Infection Dysregulates Host Small RNAs in HEK293T-hACE2 Cells

To achieve a high infection rate and maintain high viability of infected cells to better detect small RNA changes that may be overshadowed by strong host immune response-induced cell death or viral RNA degradation, we chose HEK293T cells that have a low level of immune response to SARS-CoV-2 infection. HEK293T cells have low hACE2 expression. We addressed this limitation by overexpressing the hACE2 gene in HEK193T cells, which allowed potent SARS-CoV-2 infection, resulting in up to 50% of RNA sequencing reads mapped to the viral genome at 72 h post-infection (hpi) [25]. In the current study, we present our smRNAseq data in the SARS-CoV-2-infected HEK293T-hACE2 cells.
We first observed that read length distribution was altered upon SARS-CoV-2 infection in HEK293T-hACE2 cells. The percentage of reads with lengths shorter than 27 nucleotides (nts) was reduced, while the percentage of reads with lengths longer than 32 nts was increased (Figure 1A). Next, we compared small RNA population distribution between SARS-CoV-2-infected and mock-infected samples. We found that the relative amounts of several small RNAs in the total small RNA population were significantly dysregulated in SARS-CoV-2-infected samples. The statistical analysis of reads annotation showed that there was a significant change in most small RNAs after SARS-CoV-2 infection. Specifically, the percentage of host miRNAs in total small RNAs was significantly reduced, whereas the amount of ribosome RNA-derived fragments (rRNAs), tRNA-derived fragments (tRFs), non-coding-RNA-derived fragments from ncRNAs, and other smRNAs (such as signal recognition particle RNAs --srpRNAs, small nuclear RNAs--snRNAs, small conditional RNAs--scRNAs, and vsmRNAs) was significantly increased (Figure 1B). Since small RNAs other than miRNAs generally do not have a specific process that can control their biogenesis and produce consistent mature sequences, it is hard to know which sequences derived from them were differentially changed unless one looks at each sequence individually. Using the small RNA analysis tool miRge3 that can combine all tRFs mapped to a tRNA to produce a combined-tRF read (tRFcomb), we performed a differential expression analysis of tRFcombs and miRNAs by DESeq2. There were 181 upregulated and 44 downregulated host tRFs and miRNAs with a fold change ≥2 [abs(log2FC) ≥ 1] and an adjusted p-value (p-adj) < 0.05. This analysis also showed that there are more tRFs than miRNAs with significant changes, as shown by the volcano plot, for which only miR-210-3p and miR-30d-5p made it into the list with -log10(p-value) > 20. (Figure 1C, Supplementary File S1A,B). Next, using small RNA qRT-PCR, we measured the amounts of several highly expressed and significantly altered miRNAs, tRFs, and rRNAs, relative to two highly expressed host miRNAs in HEK293T cells, miR-10a-3p, and miR-484 (miR-10a-3p and miR-484 showed similar amounts between SARS-CoV-2-infected and mock-infected samples, therefore they were used as the normalization controls). The qRT-PCR data agreed with the sequencing results in general (Figure 1D). In summary, our data indicate that the relative amounts of tRFs, rRNAs, and other small RNAs were increased in SARS-CoV-2-infected HEK293T-hACE2 cells, which could have resulted from the SARS-CoV-2-infection-induced cell stress response that leads to the cleavage or degradation of their parental RNAs. The increase in tRFs, rRNAs, and other small RNAs in relative amounts to the total small RNA population could contribute to the decrease in the relative amount of miRNA population in the total small RNA population.

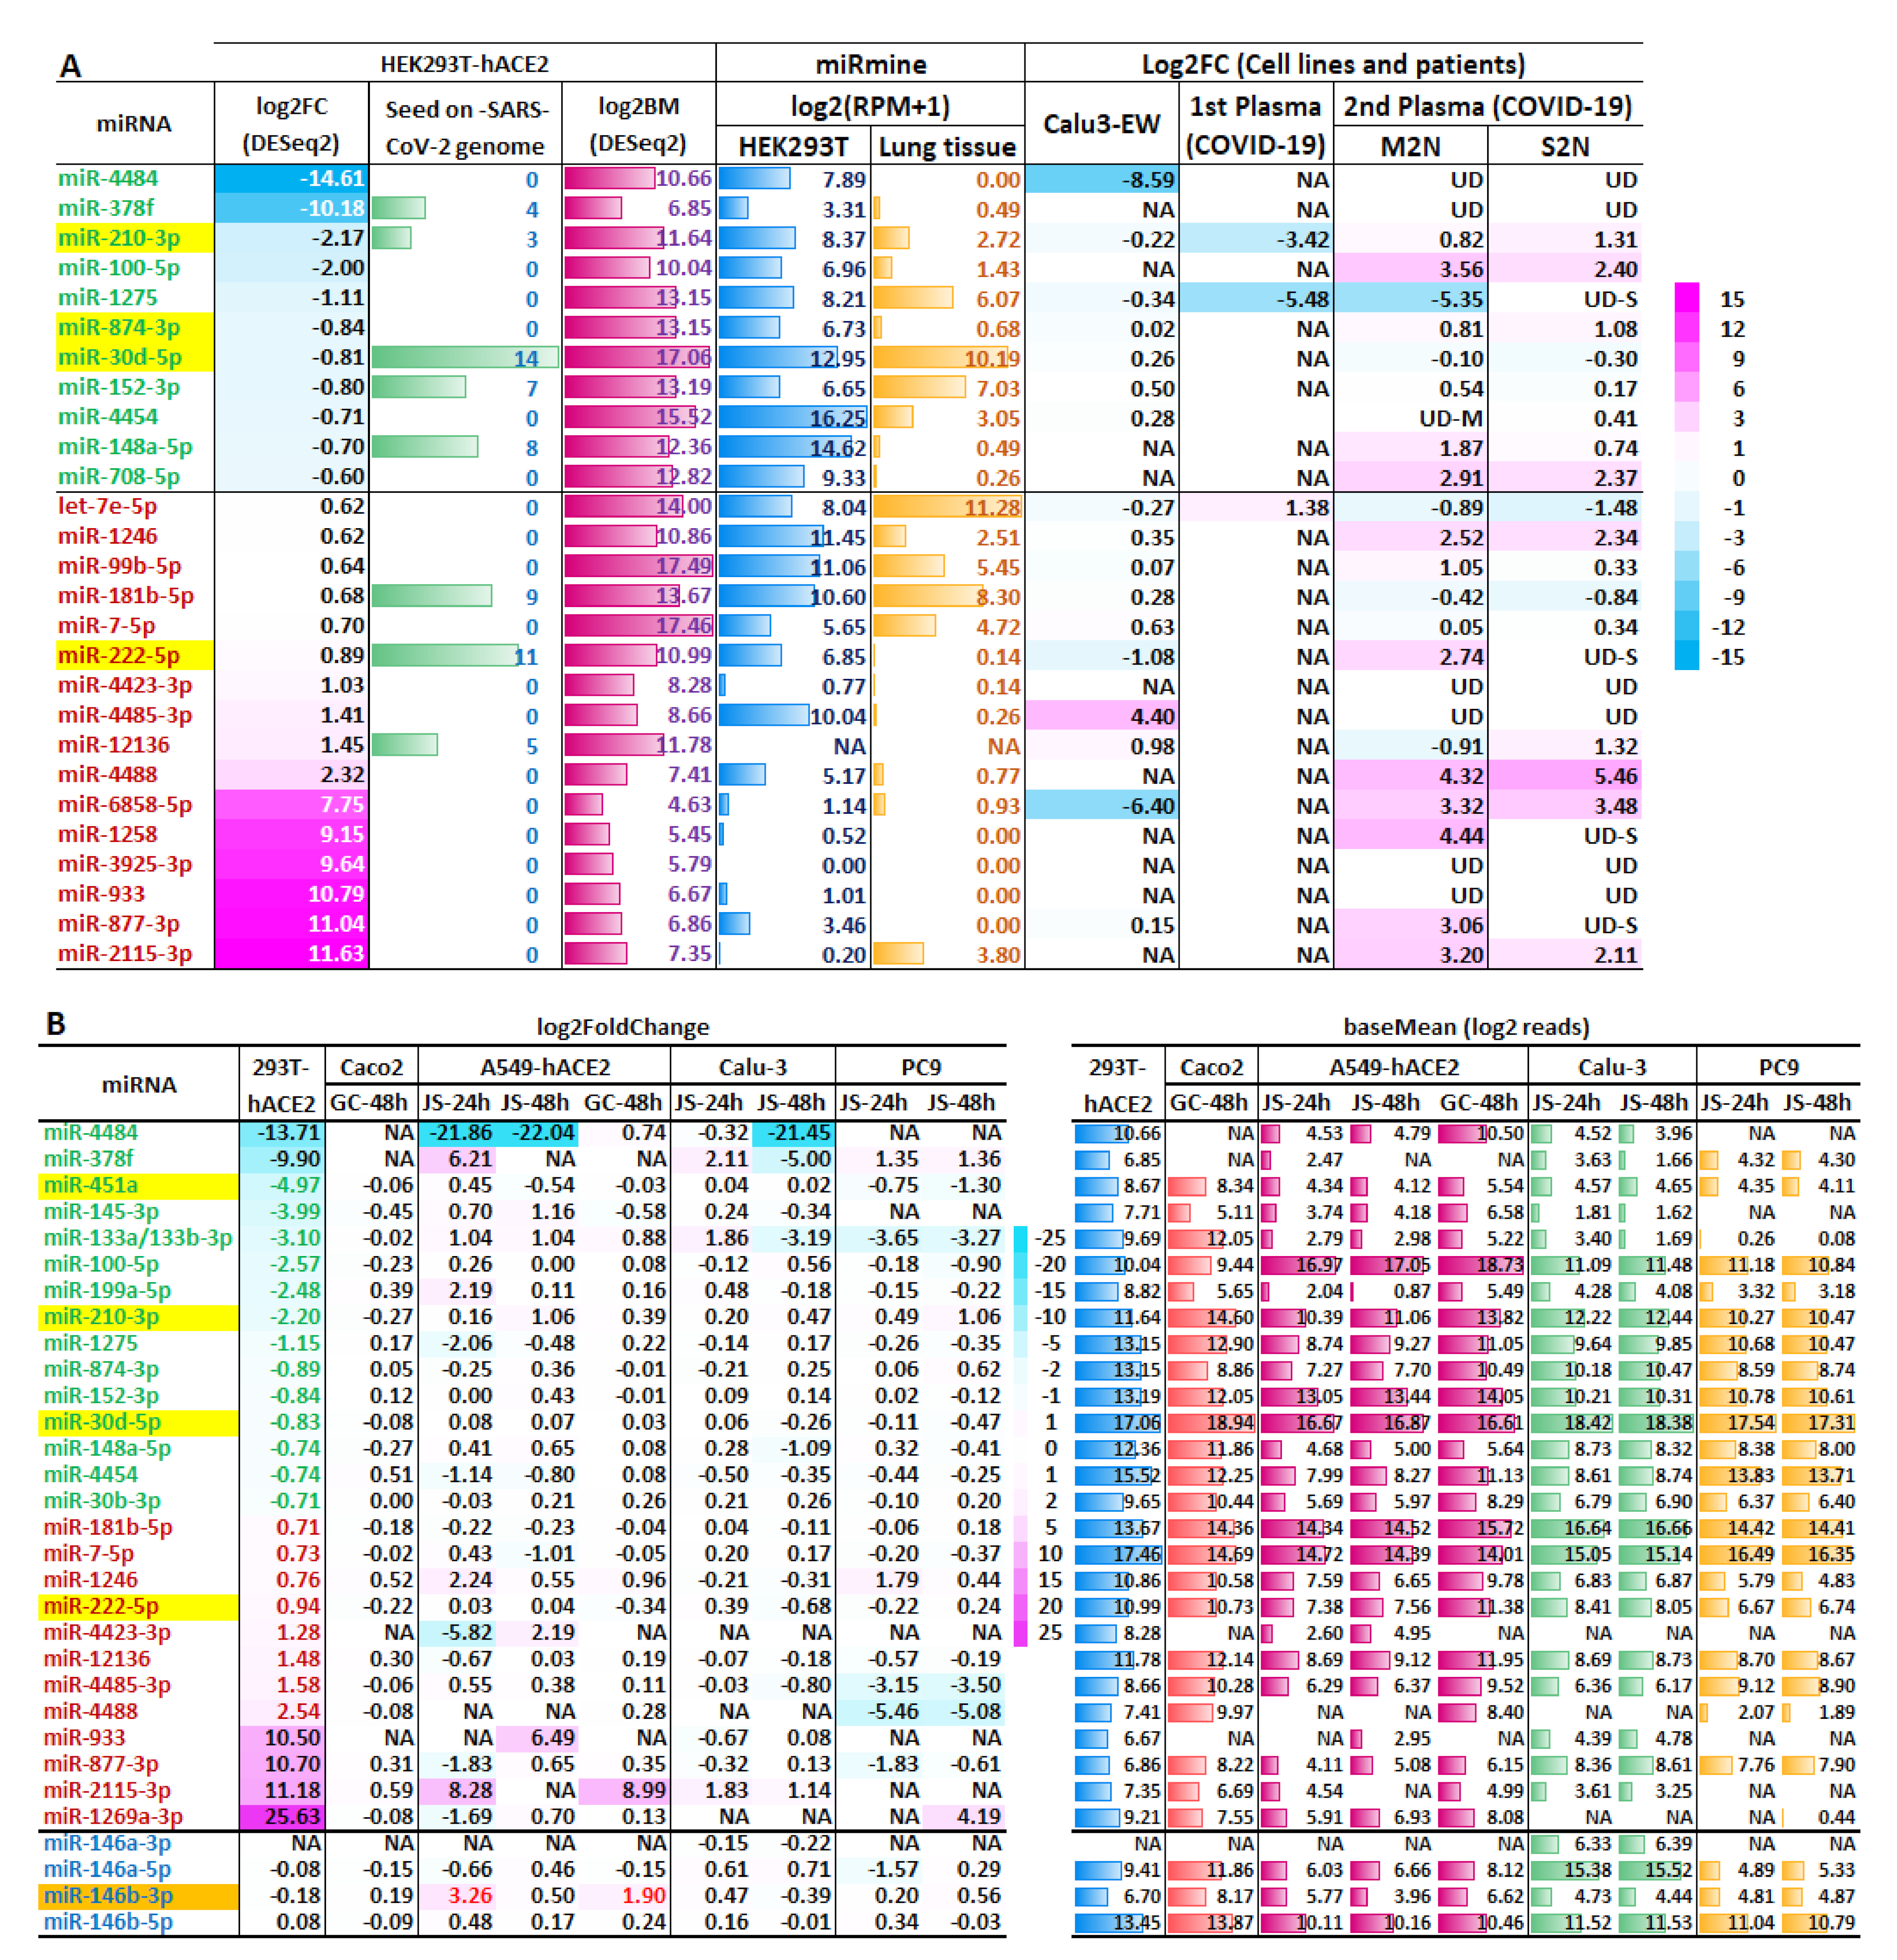
2.2. Host miRNAs Respond to SARS-CoV-2 Infection in HEK293T-hACE2 Cells

Host miRNAs are the largest family of host small RNAs that depend on the RNAi mechanism for biogenesis and function and participate in the interplay between host and viruses. Due to the fact that the above data revealed that SARS-CoV-2 infection in HEK293T-hACE2 cells could decrease the relative amount of miRNA population in all small RNAs, to determine the specific expression changes in miRNAs, we performed a differential expression analysis of miRNAs in SARS-CoV-2-infected versus mock-infected HEK293T-hACE2 cells. Despite robust infection, the scale of changes in the host miRNA expression was mild and only a small number of miRNAs exhibited a substantial change in their expression level. There were 27 miRNAs with a ≥1.5-fold change [abs(log2FC) ≥ 0.6], of which 15 miRNAs exhibited a ≥2-fold change [abs(log2FC)≥ 1] (Figure 1E, Supplementary File S1C). These results indicate that the SARS-CoV-2 infection in HEK293T-hACE2 cells only causes significant changes in the expression level of a small number of specific miRNAs but not a large population of miRNAs, despite a significant decrease in the percentage of miRNAs in all small RNAs.
To identify miRNAs that were specifically regulated by SARS-CoV-2 infection, we examined the expression levels of the above 27 miRNAs in small RNA profiling data from other SARS-CoV-2-infected human cell lines of COVID-19 patient samples (Table 1). First, we reanalyzed datasets that reported host miRNA level changes in response to SARS-CoV-2 infection. Specifically, the dataset of SARS-CoV-2-infected Calu-3 (Calu3-EW in Figure 2A) [10], miRNA profiling data from the first plasma dataset of COVID-19 patients (COVID-19 in Figure 2A) [13], and the second plasma dataset of COVID-19 patients (Figure 2A: M2N and S2N. M2N: mild to non-COVID-19; S2N: severe to non-COVID-19, Supplementary Files S2A and S4) [14] (Table 1). While the difference in small RNA profiles from different datasets indicates that SARS-CoV-2 infection could dysregulate miRNA expression in a cell type- and tissue-dependent manner, we observed overlapping changes in these datasets. We found that miR-1275 and miR-4484 were downregulated whereas miR-1246, miR-7-5p, miR-1258, miR-877-3p, and miR-2115-3p were upregulated in multiple datasets, despite that they were altered at different scales and the change is not always statistically significant.
Based on the expression levels of the above 27 miRNAs in human lung tissues documented by miRmine [30] and their seed sequences matched to sequences on the SARS-CoV-2 genome (Figure 1C–E and Figure 2A, Supplementary File S1C), we identified miR-210-3p and miR-30d-5p as the two host miRNAs that could be involved in or regulated by SARS-CoV-2 infection because their expression levels were significantly altered by SARS-CoV-2 infection, exhibiting higher expression levels in both HEK293T cells and lung tissues. These two miRNAs also harbor multiple seed sequences that match the SARS-CoV-2 genome (Figure 2A, Supplementary File S3A,B), and miR-30d-5p is the miRNA with the highest number of matches among the above 27 miRNAs.
miR-210-3p has been shown to be a major player in the hypoxia pathway by regulating the adaptive response to the low oxygen condition [31]. miR-210-3p was slightly downregulated in the SARS-CoV-2-infected Calu3-EW dataset and was also downregulated in the first plasma dataset of COVID-19 patients. However, the same laboratory reported it as an upregulated miRNA in the plasma of SARS-CoV-2-infected ferret samples [13]. In the second plasma dataset of COVID-19 patient samples, miR-210-3p was upregulated in both mild and severe COVID-19 patients, with a higher level in the plasma of severer cases (Figure 2A) [14]. Therefore, miR-210-3p is a host miRNA that can respond to SARS-CoV-2 infection. Whether it will be upregulated or downregulated upon SARS-CoV-2 infection may be dependent on whether the infection conditions lead to hypoxia or COVID-19 stages with or without the life-threatening hypoxemia symptom [32].
miR-30d-5p has fourteen 7-mer seed sequences and seven additional 6-mer seed sequences that are complementary to the SARS-CoV-2 genome (Figure 2A, Supplementary File S3A,B). Both miR-30a-5p and miR-30e-5p, expressed at relatively high levels in HEK293T cells, were significantly downregulated by the SARS-CoV-2 infection, albeit at a smaller scale (Supplementary File S1B,C). Since all family members of miR-30-5p share the seed sequence for target gene recognition, all other family members of miR-30-5p could also target SARS-CoV-2, thus, miR-30-5p may target the virus in any tissues or cells through different family members that are expressed in different tissues. In addition, we found that both miR-30b-5p and miR-30c-5p were among the significantly downregulated miRNAs in the second plasma dataset of COVID-19 patients [14], and miR-30a/c/d/e-5p were present at high levels in the upper respiratory tract [19]. Therefore, miR-30-5p may be a host miRNA that can respond to SARS-CoV-2 infection and may have antiviral effects or be involved in the host immune response [33].
We did not observe a significant change in the expression of immune-related miRNAs miR-155-3p and miR-146b-5p in SARS-CoV-2-infected HEK293T-hACE2 cells, although both miRNAs have been shown to be dysregulated by the SARS-CoV-2 infection in previous studies [10,14,34], presumably because HEK293T cells lack the immune response. Our reanalysis of the smRNAseq dataset from the second plasma dataset of COVID-19 patients confirmed that miR-146b-5p was downregulated in the plasma of both mild and severe COVID-19 patients. In addition, we found that miR-146a-5p was also downregulated in these samples [14]. There was more than two-fold reduction in the expression of both miR-146a-5p and miR-146b-5p in the plasma of severe COVID-19 patients compared to mild patients, indicating that their expression levels are correlated to the severity of the disease (Supplementary File S4). Therefore, there is a consistent observation of miR-146 reduction in both cell lines and patient samples, indicating that there may be a correlation between the reduced expression level of miR-146 and the exacerbated immune response observed in severe COVID-19 patients [34].
Next, we looked at the expression level changes in the above differentially expressed miRNAs in the datasets used to clone vmiR-ORF7a, SARS-CoV-2-infected hACE2-overexpressing A549 (A549-hACE2) cells, and Caco2 cells from the laboratory of Germano Cecere (datasets of GC: A5549-GC, Caco2-GC) [17] and SARS-CoV-2-infected A549-hACE2 cells, Calu-3 cells, and PC9 cells from the laboratory of Joan Steitz (datasets of JS: A549-JS, Calu3-JS, and PC9-JS) [18]. We reanalyzed our data and the above datasets in parallel using the same procedure and parameters (Table 1). To focus on miRNAs, we performed small RNA read length filtering, as both laboratories did to their datasets. All the above datasets were filtered to read lengths between 15-nucleotides (nts) and 30-nts before running miRge2 to generate miRNA counts and perform DESeq2 to identify differentially expressed miRNAs. Although the small RNA population was reduced to a smaller size and the list of differentially expressed small RNAs was slightly different to unfiltered data, we still observed significantly altered host miRNAs in SARS-CoV-2-infected HEK293T-hACE2 cells (Figure 2B, Supplementary File S5). However, for all datasets of GC and JS, there were only a few highly expressed host miRNAs with substantial change (DESeq2 calculated mean read count ≥50, ≥2-fold change [abs(log2FC) ≥ 1], p-adj ≤ 0.05) in SARS-CoV-2-infected A549-hACE2 (GC or JS) and Caco2 (GC) cells using high multiplicity of infection (MOI = 3 or 5), consistent with their conclusion that SARS-CoV-2 infection only affects the expression of a small number of host miRNAs (Figure 2B, Supplementary Files S2B and S6). Our reanalysis showed that miR-210-3p was only downregulated in the dataset of Caco2-GC-48h but upregulated in the rest of the GC’s and JS’s datasets. However, the change in miR-210-3p expression in all these datasets was not significant, indicating that a special change in miRNA-210-3p under our infection condition and the production of vmiR-ORF7a may not be associated with the expression change in specific host miRNAs. We also found that the amount of tRFs and rRNAs was reduced from read length filtered data compared to unfiltered data in our HEK293T-hACE2 dataset, but the percentage of reads for rRNAs was increased and the percentage of reads for miRNAs was decreased in infected samples (Supplementary File S5). This observation could probably explain, at least in part, why we have observed significant changes in the levels of tRFs and rRNAs in our studies.

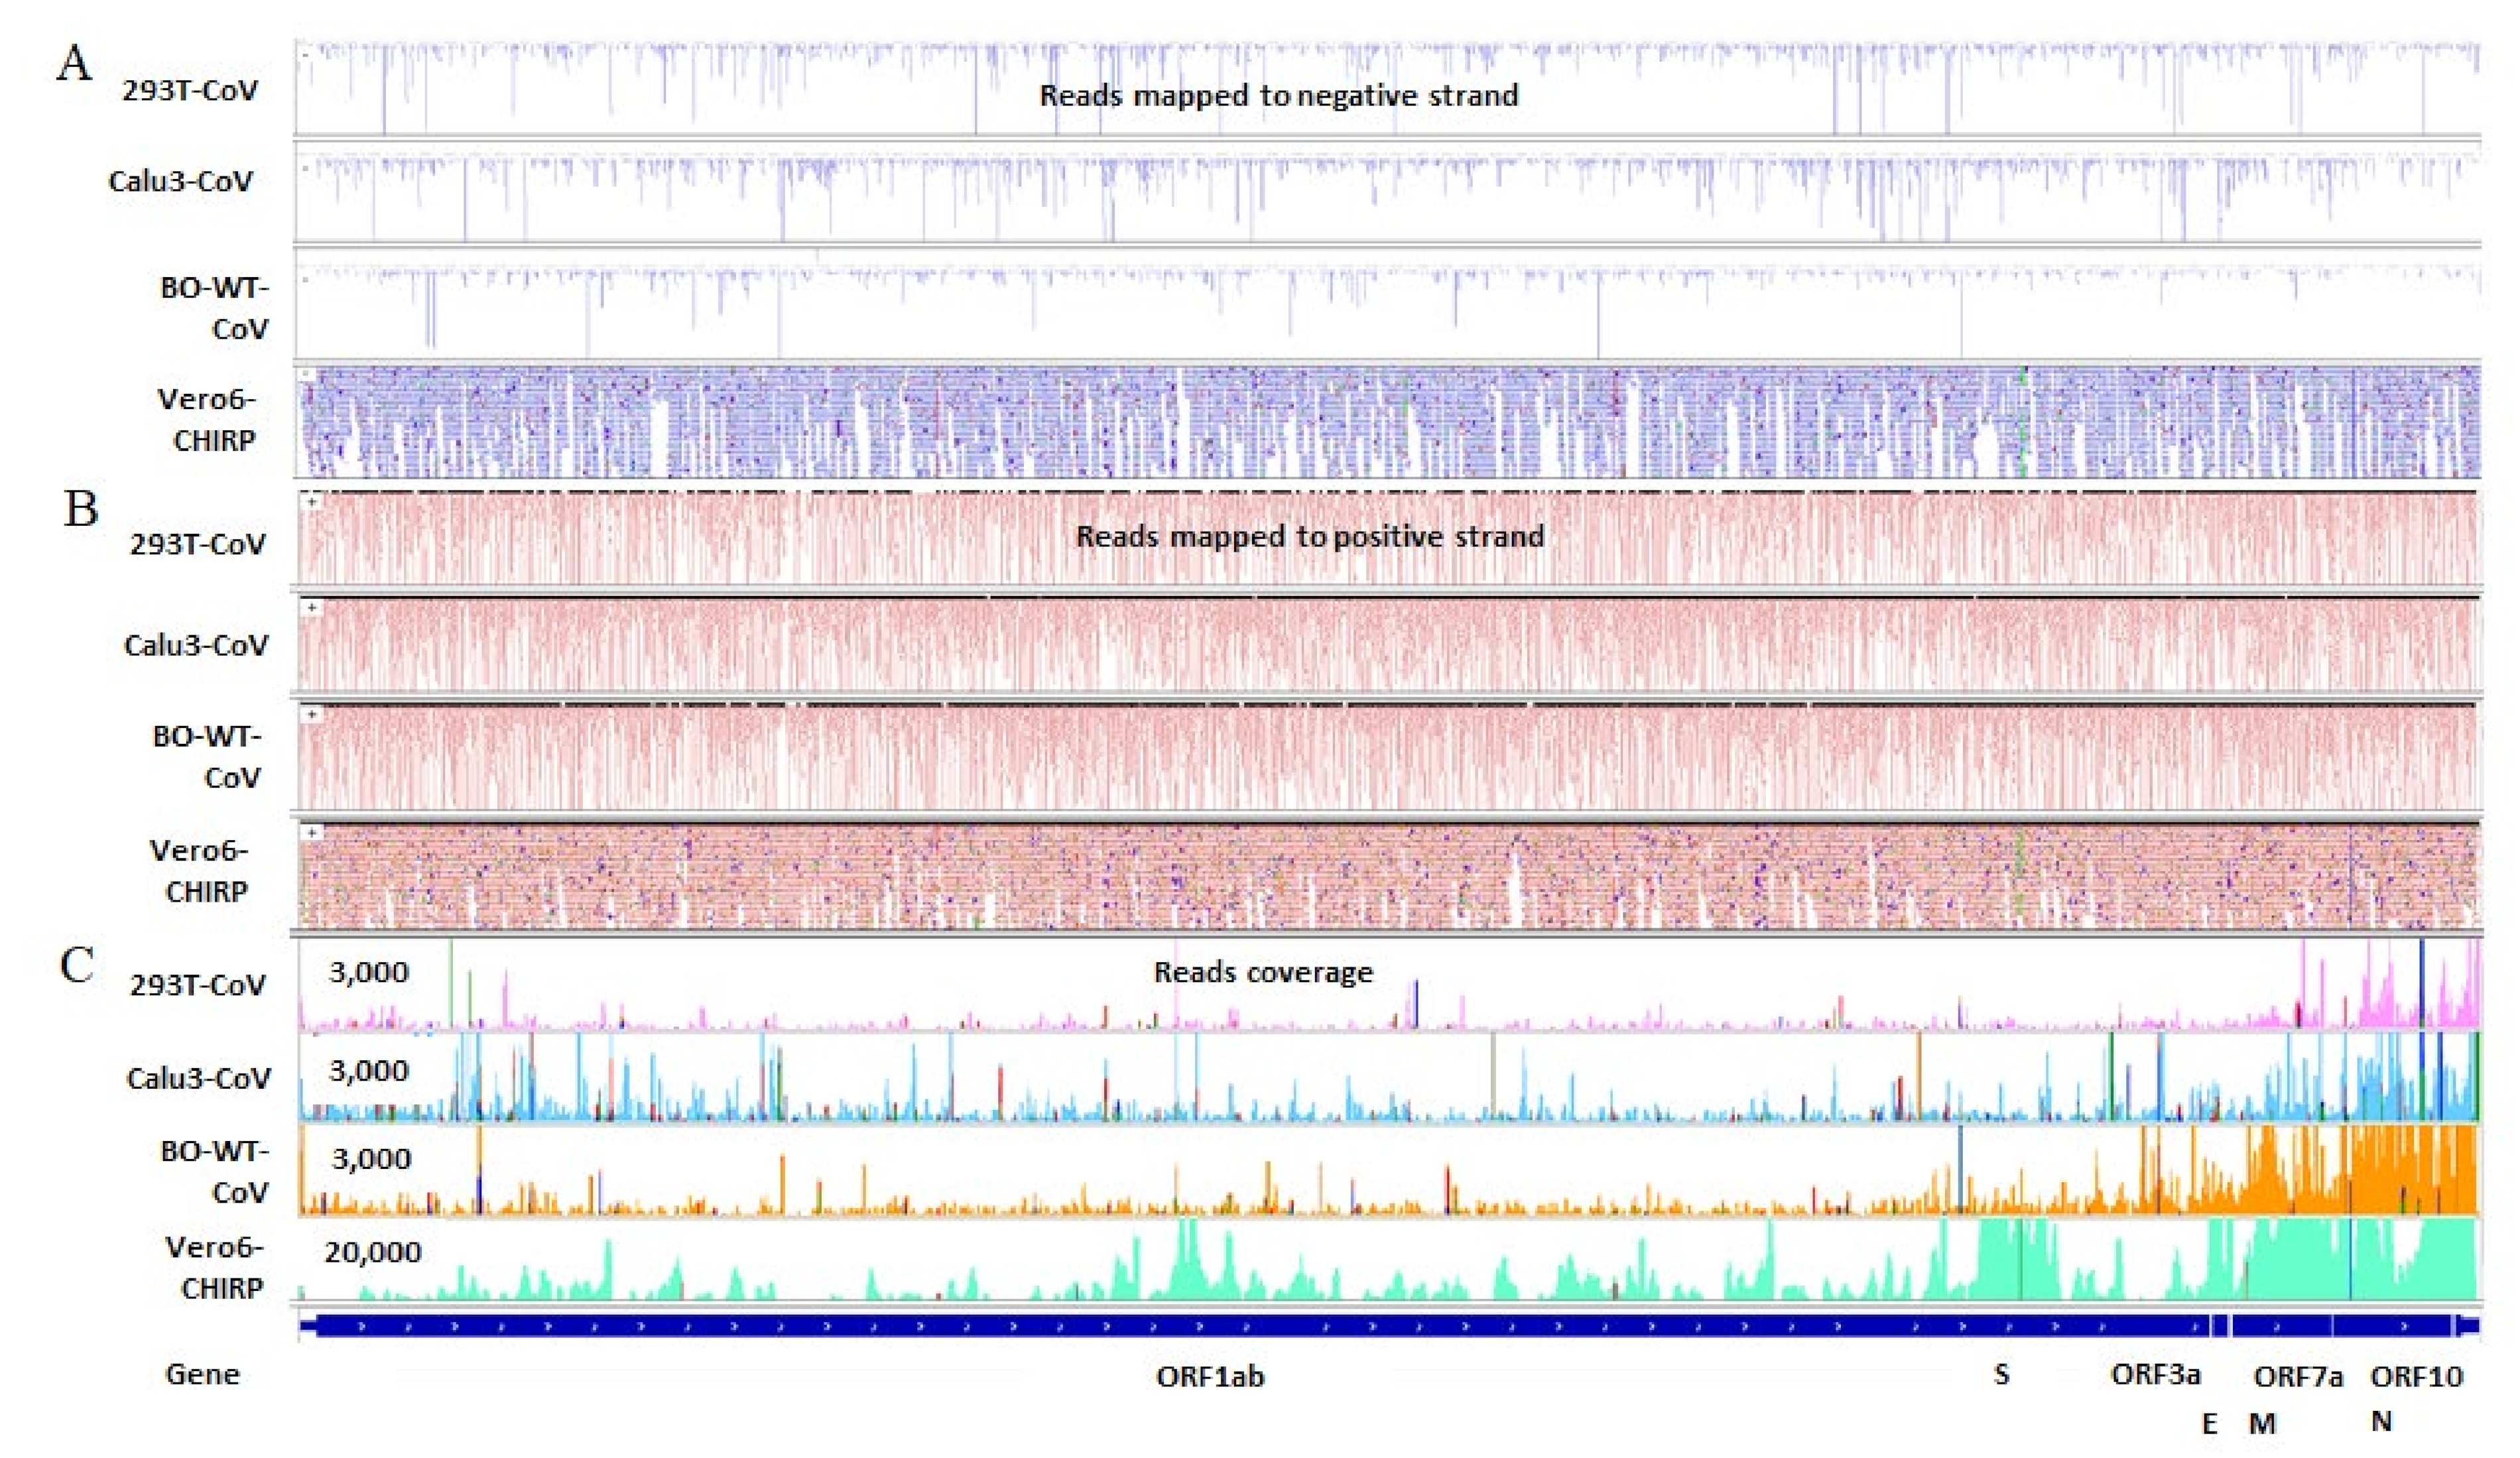
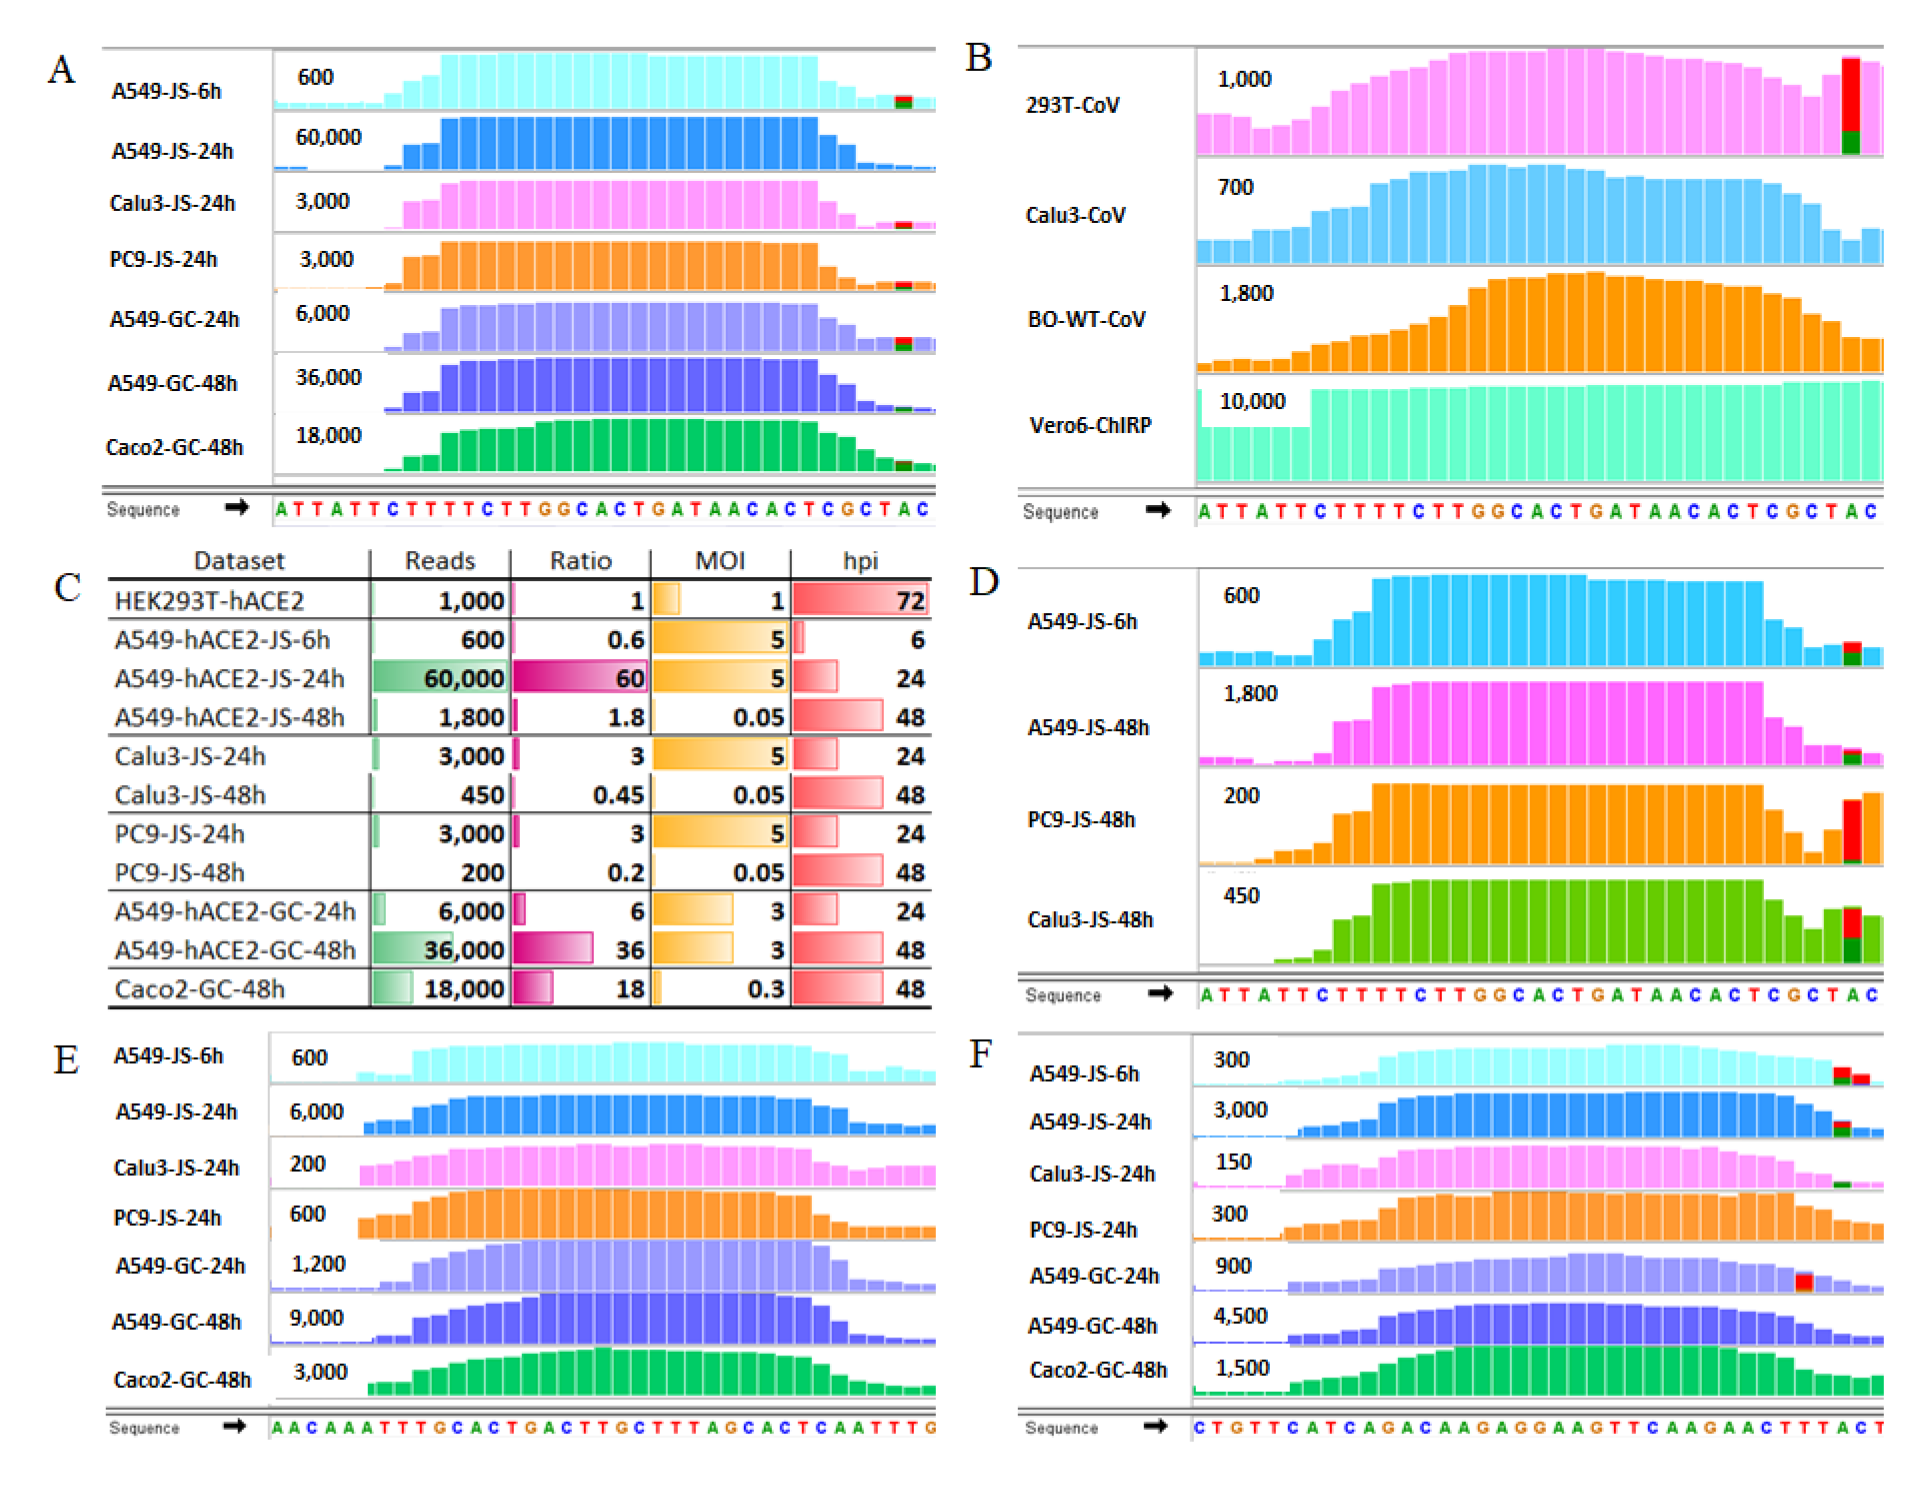
2.3. SARS-CoV-2 Infection Produces vsmRNAs in HEK293T Cells

We detected 0.85% of reads that were mapped to the SARS-CoV-2 genome in SARS-CoV-2-infected samples, consistent with the low percentage of vsmRNAs, most of which are <1% of total small RNA reads, in 41 hosts infected by six RNA viruses [35]. Except for a small portion of the vsmRNA that was matched to the -ssRNA genome or sgmRNA (-vsmRNA) (Figure S1A), most of the vsmRNA sequences were matched to the +ssRNA genome or +sgmRNA (+vsmRNA) (Figure S1B).
Most of these vsmRNAs were consistently present in both replicates of infection in HEK293T-hACE2 cells. Regardless of the polarity, there were many more vsmRNAs located in the region from the envelope (E) to ORF10 genes (Figure S1C,D). Next, we compared the presence of vsmRNAs in the dataset of Calu3-EW with the datasets of mouse brain organoids (BO), and in the second plasma dataset of COVID-19 patients [10,12,14]. We observed that vsmRNAs exhibited a similar presence in different replicates of the same infection, suggesting that these vsmRNAs are likely not randomly degraded viral RNA fragments. However, only some of them showed similar sequence read distribution across datasets of infections, including the datasets from Calu3-EW, BO, and COVID-19 patient plasma, and they are mainly +vsmRNAs (Figure 3). We also checked potential bindings of RNA binding proteins (RNP) to these vsmRNA-encoding regions in the SARS-CoV-2 genome using the chromatin isolation by RNA purification (ChIRP) data from SARS-CoV-2-infected Vero-E6 and Huh7 cells. We would like to check whether these vsmRNA derivation regions are covered and protected by RNPs [29] (Figure S2). The ChIRP data have a more robust coverage of the SARS-CoV-2 genome than smRNAseq data. There are almost 10 times more reads from ChIRP than that from smRNAseq for any region of the SARS-CoV-2 genome. However, the vsmRNA derivation regions with abundant vsmRNAs are not always regions that are heavily bound by RNPs, indicating that most vsmRNAs are not always derived from RNA fragments bound by RNPs and protected from degradation. Therefore, these vsmRNAs may have their own biogenesis pathways and SARS-CoV-2 infection could trigger the production of vsmRNAs. However, we did not observe a flat plateau-shaped distribution of the vsmRNAs in the read coverage tracks of the integrative genomics viewer (IGV), a typical feature of smRNAseq reads for miRNAs when the majority of reads mapped to a specific genome region have similar sequences. Instead, these vsmRNAs exhibited bell-shaped distributions, indicating that most of these reads have partially identical sequences and were unlikely generated in a precisely controlled manner, such as canonical miRNAs or siRNAs. The diversified vsmRNA sequences could result from inconsistent processing, the parental precursor RNAs have unstable in vivo structures, or they could be products of RNA degradation.
Next, to examine how vsmRNAs were processed and the potential function of vsmRNAs, we compared vsmRNAs in the datasets of SARS-CoV-2-infected HEK293T-hACE2, BO-WT-CoV, and Calu3-EW, and chose three vsmRNAs that were present in all these datasets to look at their detailed sequences and test their function. Two of the vsmRNAs were derived from the N gene and one from the ORF10. We denoted them as vsmRNA-N1-5p, vsmRNA-N3-5p, and vsmRNA-ORF10-3p (Figure S3A). They were chosen based on their high abundance, pattern of overlapped reads across different samples, and the sequences located in the arm region of a hairpin structure, which may favor Drosha/DGCR8 processing. The hairpin structure was predicted with LinearFold and mFold using the mature vsmRNA sequences, plus both upstream and downstream sequences (Figure S3B). The vsmRNA-ORF10 is in a large hairpin structure that has been verified experimentally [36].
Analysis of the sequences of all three vsmRNAs revealed that they were processed at several specific sites. These processed sequences partially overlap, but unlike mature miRNA sequences that usually have one to three major forms and are mainly different at the 3′ end, these vsmRNAs have more major isoforms and are different at both the 5′ and 3′ ends (Figure S3C).
To examine whether these three vsmRNAs have silencing functions and have the potential to modulate viral infection, we used reporter assays to measure their silencing effects. To test whether vsmRNAs can target the −ssRNA genome or −sgmRNA, we generated reporters that carry the viral N gene sequence (+strand reporters) or its reverse complementary sequences (−strand reporters) in the 3′ UTR of the Renilla luciferase gene (Rluc), then measured Rluc expression in the presence of either nucleus-localized (expressed from transfected plasmid DNA) or cytoplasm-localized (from transfected in vitro transcribed mRNA) N gene-3′UTR transcripts (Figure S3D). We only observed mildly reduced expression in strand-specific reporters (Figure S3E). To test whether the reduction was caused by antisense activity of reverse complementary sequences, or vsmRNAs derived from viral transcripts, or both, we constructed reporters carrying the short antisense or sense sequences of vsmRNA-5p and 3p for these three vsmRNAs. This time we only observed a very low reduction in reporter signal in the presence of viral transcripts, indicating that these viral transcripts may only have the antisense-mediated target repression activities. The low RNAi activities observed from these three vsmRNAs suggest that these viral transcripts may not be efficiently processed to yield high levels of vsmRNAs or that these vsmRNAs are not potent RNAi reagents (Figure S3F).

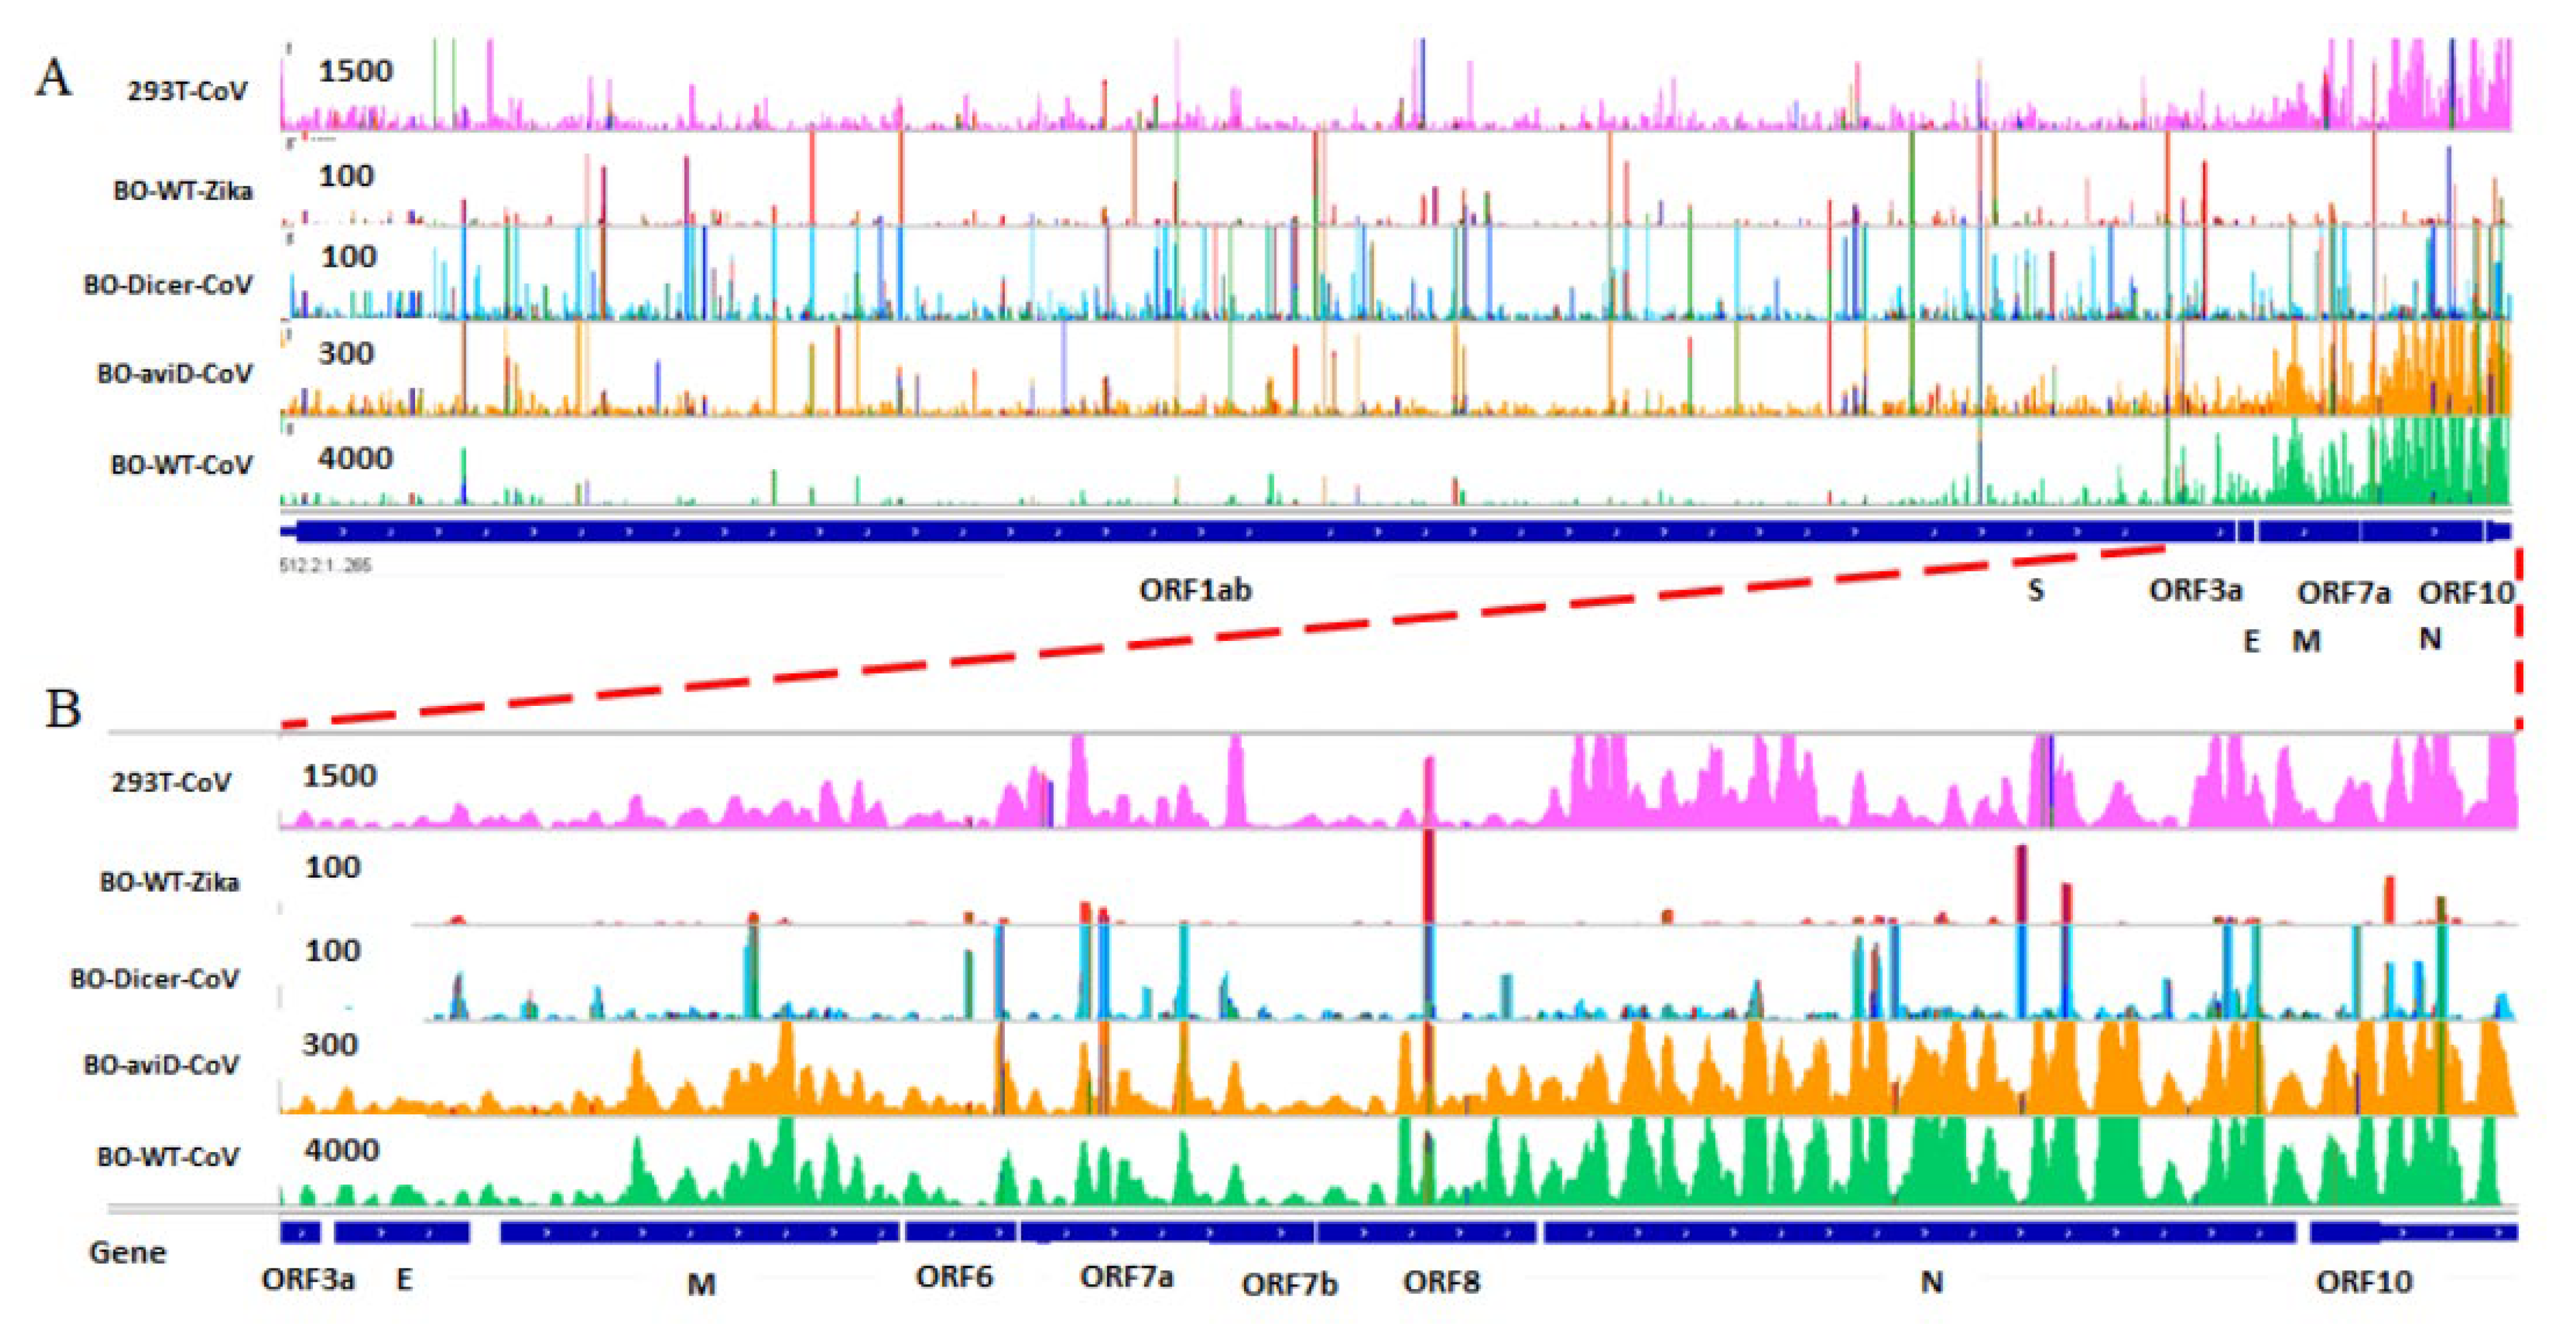
2.4. The Biogenesis of vsmRNAs and vmiR-ORF7a

We looked into the datasets of SARS-CoV-2-infected mouse brain organoids that revealed the production of vsiRNAs with aviD processing [12]. Our reanalysis found only low-level expressions of vsiRNAs in all three SARS-CoV-2-infected samples, including infected wildtype brain organoids that express both endogenous Dicer and aviD (BO-WT-CoV), infected Dicer-null brain organoids that overexpressed full-length Dicer exogenously (BO-Dicer-CoV), and infected Dicer-null brain organoids that express aviD exogenously (BO-aviD-CoV). There were abundant vsmRNAs in these samples. There were 30 times more vsmRNAs in BO-WT-CoV than that in BO-aviD-CoV. The BO-WT-CoV had 1/3 of the total reads of the BO-aviD-CoV but had at least 10 times more vsmRNA reads. Furthermore, there was only a low level of SARS-CoV-2-derived vsmRNAs in BO-Dicer-CoV, similar to that in wildtype brain organoids infected by the Zika virus as a negative control (BO-WT-Zika) (Figure 4 and Figure S4). These data support the intriguing idea that many virally derived RNA fragments are not favorable substrates of Dicer but can be efficiently processed by aviD to vsmRNAs, presumably because the endogenous aviD is much more efficient in processing than the exogenously expressed aviD or that the endogenous aviD is expressed at a much higher level than the exogenously expressed aviD. The Hel2i domain, which is deleted in aviD, is used by Dicer to bind TRBP, indicating a potential role of TRBP in the SARS-CoV-2 infection [37].
Among all SARS-CoV-2-derived vsmRNAs, vmiRNA-ORF7a has the best credibility because it was identified by smRNAseq in four cell lines and patient samples and was cloned independently by two groups [17,18]. We reanalyzed it in several datasets (Figure 5 and Figure S5).
Firstly, we found the flat-plateau read distribution of vmiR-ORF7a in datasets of both GC and JS but not others (Figure 5A,B). Usually, bona fide miRNAs have precise 5′ ends and their 3′ ends usually have 1–3 isoforms that form a flat-shaped read distribution, and random degradation leads to products variable in length, and the read distribution usually forms a curved shape. To rule out RNA degradation in our samples, we compared several human miRNAs in our infected samples with datasets of A549-JS-24h and A549-GC-48h (Figure S6). In both read distribution and read coverage, we observed our data and JS’s data showed a perfect flat top shaped read distribution for eight human miRNAs, while GC’s data may have some RNA degradation due to the extra step of size fraction for RNA (Figure S6A–E).
Secondly, we found that the abundance of vmiR-ORF7a varied dramatically cell-by-cell-line. It was most abundant in the A549-hACE2 cells and less abundant in the Caco2 cells. Moreover, both PC9 and Calu-3 cells, especially Calu-3 cells, a model cell line that has been extensively used for studying SARS-CoV-2 infection, had many fewer reads of miR-ORF7a, similar to their levels in SARS-CoV-2-infected HEK293T-hACE2 cells (Figure S5A). Since SARS-CoV-2 can achieve robust infection in Calu-3, Caco2, HEK293T-hACE2, and A549-hACE2 cells [10,25], the differential abundance of vmiR-ORF7a in these cells suggests that the production of miR-ORF7a is not directly correlated with viral load in different cells.
Thirdly, we found that the abundance of vmiR-ORF7a was directly correlated with the MOI of infection within the same cell line, which suggests that the high level of vmiR-ORF7a was directly correlated with the high viral load at the initial infection stage in the same cell lines (Figure 5A,C,D). It is worth noting that a high level of vmiR-ORF7a was already detected at 6 hpi in A549-hACE2 cells as shown in the A549-JS-6h dataset, similar to the level in HEK293T-hACE2 cells at 72 hpi, which indicates that vmiR-ORF7a can be produced in a large amount at a very early stage of infection, at least in A459-hACE2 cells, also supporting the idea that it may be processed from an early expressed, specifically transcribed sgmRNAs (Figure 5B,C).
According to the read distribution pattern on other areas of the SARS-CoV-2 genome in datasets of GC and JS, we predict that there may be two more vmiRNAs encoded by ORF7a that are sequentially processed out from the same transcript as vmiR-ORF7a: vmiR-ORF7a-2 and vmiR-ORF7a-3. Both are downstream of vmiR-ORF7a and less abundant than vmiR-ORF7a. vmiR-ORF7a-2 was the fifth top cloned 22-nt read in the dataset of A549-GC-48h [17] (Figure 5E,F). However, in the predicted RNA structure, vmiR-ORF7a is located at the 5′ arm of a hairpin structure, while vmiR-ORF7a-2 and vmiR-ORF7a-2 are not in a structure that would be a favorite Drosha/DGCR8 substrate (Figure S7).

3. Discussion

How the host RNAi pathway responds to the SARS-CoV-2 infection is an important question that remains to be answered, because answers to this question may reveal additional molecular mechanisms underlying the SARS-CoV-2 infection, the COVID-19 development and progression, and post-acute sequelae of COVID-19. Furthermore, RNAi molecules have the potential to be developed into effective therapeutic tools for combating COVID-19 and future infectious pandemics. However, conflicting data have been produced using COVID-19 patient samples or cell lines, which have caused confusion in the field and cast shadows on the therapeutic potential of molecules identified from these findings. In the current study, we conducted SARS-CoV-2 infection in HEK293T-hACE2 cells and performed a comparative study of small RNA profiles from SARS-CoV-2-infected cell lines and patient samples.
Firstly, we found many small host RNAs, such as miRNAs, tRFs, and rRNAs, that were perturbed by SARS-CoV-2 infection. The increased levels of tRFs and rRNAs in SARS-CoV-2-infected cells suggest that SARS-CoV-2 infection may induce the cleavage of tRNAs and rRNAs. The increase in tRFs, rRNAs, and other small RNAs in relative amounts to the total small RNA population could contribute to the decrease in the relative amount of miRNA population in the total small RNA population.
Our data indicate that SARS-CoV-2 infection can affect the expression of specific miRNAs but it unlikely affects host miRNA expression globally, which needs to occur by perturbing the miRNA biogenesis machineries. In this sense, our smRNAseq data together with published smRNAseq data do not provide evidence to support the idea that SARS-CoV-2 encodes VSRs to affect host miRNA biogenesis, although it has been reported that Dicer, Ago2, and Drosha were downregulated in COVID-19 patients, while DGCR8 was upregulated [9,38]. It is unlikely that changes in these RNAi components have significant effects on miRNA biogenesis. It remains unknown whether SARS-CoV-2 encodes VSRs that can affect RNAi silencing function by binding to Argonaute proteins and associated factors to affect the activity of the RNA-induced silencing complex.
Our analyses indicate that the SARS-CoV-2 infection can induce changes in the expression of both hypoxia and immune response-related host miRNAs in a cell- or tissue-dependent manner. Both miR-210-3p and miR-146 could contribute to the progression of COVID-19, thus, warranting further studies using patient samples.
The dysregulation of miR-210-3p expression in the SARS-CoV-2 infection was not consistent, both up and down regulation were observed. Whether the dysregulation of miR-210-3p expression in the infected cells and plasma of COVID-19 patients is a natural host response to hypoxia induced by the SARS-CoV-2 infection or whether it is correlated with the life-threatening hypoxemia symptoms in COVID-19 patients with severe cases remains to be investigated. It is possible that the expression of miR-210-3p is affected by the stage of the disease, the type of tissues, and/or the status of hypoxia conditions.
miR-146 is the most consistently observed host miRNA that exhibits reduced expression in response to the SARS-CoV-2 infection. It was downregulated in cell lines and COVID-19 patient samples. Considering the well-characterized role of miR-146 in the anti-inflammatory and anti-immune responses, the reduced expression level of miR-146 in severe COVID-19 patients may explain, at least in part, the exacerbated immune response observed in these patients.
While there are multiple potential site-specific RNA-RNA interaction sites between the SARS-CoV-2 RNA and miR-30-5p, whether miR-30-5p can modulate SARS-CoV-2 infection remains to be validated experimentally. One thing that is clear is that miR-30 family members are expressed in many tissues and have a high expression level in the lungs, the primary tissue of the SARS-CoV-2 infection. Our data revealed that all the cell lines used for infection, including HEK293T-hACE2, A549-hACE2, Calu-3, Caco2, and PC9 cells, had high miR-30d-5p expression. Therefore, SARS-CoV-2 transcripts are likely to be exposed to miR-30-5p regulation in infected cells. The effectiveness of this regulation remains to be validated experimentally. It will be interesting to find out whether miR-210-3p and miR-30-5p miRNAs are also downregulated in COVID-19 patients because their downregulation could lead to reduced targeting of the SARS-CoV-2 genome, thus, diminishing their antiviral effect. In addition, a recent study showed that herpesviruses can downregulate multiple miR-30 family members to induce type I interferon response, which is necessary for the latency and reactivation of the virus [33]. Thus, the involvement of miR-30 family members in the host immune response to SARS-CoV-2 infection deserves further study in the future.
Secondly, we performed studies on SARS-CoV-2-derived vsmRNAs and found that many species of vsmRNA are derived from SARS-CoV-2 genomes or transcripts. We showed that the ORF3a to ORF10 region had the highest expression of vsmRNAs. The generation of these vsmRNAs is likely dependent on aviD expression. The existence of SARS-CoV-2-derived vsmRNAs suggests that the viral genome or transcripts can be subjected to Drosha/DGCR8 processing, which requires the redistribution of Drosha/DGCR8 into the cytoplasm or the transportation of the viral genome or transcripts into the nucleus, and implies that the host can use the RNAi machineries to destroy the viral RNA genome of SARS-CoV-2, supporting the idea that Drosha/DGCR8 can have antiviral effects on SARS-CoV-2 infection.
The discovery of aviD in mammalian cells has brought up many questions for future studies, including, for example, whether the induction or activation of aviD is specific to viral infection, how aviD affects the biogenesis of other small RNAs, and how the switch from Dicer to aviD processing is regulated through splicing. Answers to these questions may provide insights into virology in general and mechanisms and applications of RNAi in viral infections.
Thirdly, the studies of vmiR-ORF7a raise many unanswered questions regarding its biogenesis, tissue distribution, and biological function in SARS-CoV-2 infection. These questions include, for example, whether pre-vmiR-ORF7a is processed out of the SARS-CoV-2 genome or sgmRNA or both, whether vmiR-ORF7a maturation is dependent on aviD or Dicer? Are different aviD expression levels in different cell lines or different infections correlated with different abundances of vmiR-ORF7a? Moreover, it will be interesting to know whether vmiR-ORF7a is present in COVID-19 patients across different tissues, at different disease stages, and how it affects the pathogenesis of COVID-19. If yes, whether it can be used as a therapeutic target.
It remains unclear why vmiR-ORF7a is only present at a high level in A549-hACE2 cells and Caco2 cells. One possible explanation is that vmiR-ORF7a is processed from specifically transcribed sgmRNAs in some cell types and the processing is independent of the abundance of the viral genome and mediated by Dicer directly. This explanation supports the idea that the biogenesis of vmiR-ORF7a is Drosha-independent but Dicer-dependent [17,18]. Other possible explanations include that different cell lines may exhibit different degrading viral RNAs and that only some degraded viral RNAs can be processed by Dicer into vmiR-ORF7a. It is worth noting that the level of vmiR-ORF7a reads is very low in nasopharyngeal swabs of patients that tested positive for COVID-19 [17] and were not detectable in the second datasets of plasma. Since miRNA is much more stable than mRNA in general, it is possible that vmiR-ORF7a exists in the RNAemia of SARS-CoV-2 and contributes to the post-acute sequelae of COVID-19. More work is needed to define the expression and function of vmiR-ORF7a in SARS-CoV-2-infected cells and tissues, its role in the development of COVID-19, and its potential to be used as a diagnostic marker and/or a therapeutic target.

4. Materials and Methods

All methods were carried out in accordance with relevant guidelines and regulations.

4.1. Cell Lines

HEK293T (ATCC CRL-11268) cell line was obtained from the American Type Culture Collection (ATCC).
The HEK293T-hACE2 cell line was created by transiently transfecting HEK293T cells with an hACE2 expressing vector (Addgene #1786). Total RNA from SARS-CoV-2 that infected the HEK293T-hACE2 cell were prepared for smRNAseq.
HEK293T and HEK293T-hACE2 cells were cultured at 37 °C and 5% CO2. DMEM media supplemented with 10% fetal bovine serum, 2 mM L-glutamine, penicillin (100 units/mL), and streptomycin (100 units/mL) was used for culture.

4.2. SARS-CoV-2 Infection, Expansion, and Quantification of Viral RNA

SARS-CoV-2 virus expansion, preparation, and quantification of viral RNA genome were performed as previously described [25,39,40] and were performed in the BSL3 facility of UCLA with institutional biosafety approvals. The RNA samples for smRNAseq were the same samples as the SARS-CoV-2 infected HEK293T-hACE2 cells that were used for RNAseq [25]. Briefly, SARS-CoV-2, isolate USA-WA1/2020, was used at MOI of 1 (1 plaque forming unit per cell) to infect HEK293T-hACE2 cells for 72 h. Trizol reagent (Thermo Fisher, Waltham, Ma, USA) was used for total RNA isolation.

4.3. Plasmids and In Vitro Transcripts Were Used for Reporter Assay

All sequences of DNA fragments and primers are listed in Supplementary Table S1.
siCheck reporters: The multiple clone site in siCheck2.0 (Promega) was modified to make siCheck2.4 to construct siCheck reporters. N sequence of SARS-CoV-2 was PCR-cloned from the GFP reporter that carries the SARS-CoV-2 fragment-2, including the sequence of N [41]. The 3′ UTR sequence was synthesized with IDT (integrated DNA technologies) as a gBlock fragment. N was first cloned to siCheck 2.4, then the gBlock fragment of 3′UTR was ligated to N to reconstitute the N-ORF10-3′UTR sequence in siCheck 2.4 to create siC-N. PCR was used to amply N-ORF10-3′ UTR sequence in siC-N and reverse ligated into siCheck 2.4 to create siC-revN.
Antisense and sense reporters for vsmRNA-5p and 3p: Antisense and sense oligos for 5p and 3p of vsmRNA-N1, -N3, and -ORF10 were annealed and cloned into siCheck 2.4 to create antisense and sense reporters, respectively.
pMD2-N: pMD2.G (Addgene plasmid # 12259) was used to subclone N-ORF10-3′UTR sequence in siC-N to create pMD2-N.
In vitro transcription (ivt): The 17-nt T7 promoter sequence was added to the 5′ end PCR primers and amplified from siC-N to createt a template for ivt. AmpliScribe T7-Flash transcription kit (Epicentre) was used for ivt reaction according to the manufacturer’s instruction. The reaction was performed using 1 µg template at 37 °C, for 2 h. The ivt control template in the kit was used to generate ivt control transcripts for reporter assays.
Luciferase reporter-based RNAi knockdown assays: For all siCheck-2.4-based reporters, SV40-driven Renilla luciferase (Rluc) was used as the primary reporter gene, with the sequence of interest cloned into the MCS in the 3′UTR region of Rluc. The HSK-TK promoter driven Firefly luciferase (Fluc) on the same vector was included as a control reporter. The expression of Rluc was normalized to the expression of Fluc (Rluc/Fluc). The percentage was calculated relative to the Rluc/Fluc ratio of the control plasmid or the ivt control transcripts.

4.4. Small RNA Deep Sequencing Dataset and Raw Data Processing

For HEK293T-hACE2 datasets: smRNAseq was carried out using a customized protocol [21,22]. Briefly, 100–1.0 µg of total RNA was used to construct smRNAseq libraries. smRNAseq was performed on a HiSeq 2500 (Illumina, San Diego, CA, USA). Single reads, flow cell cluster generation, and 51 cycles were used. The sequencing depth was 30 M reads per sample. To construct smRNAseq libraries, the 5′ adaptor used in the Illumina Truseq smRNAseq protocol was replaced with a customized 5′ adaptor that three random nucleotides at the 3′ end of the 5′ adaptors were added to in order to reduce sequencing bias [21,22]. The 3′ adaptor provided in the kit was used for 3′ end ligation and sample barcoding. Cutadapt [42] was used to remove the 5′ and 3′ adaptors from raw data files to generate unfiltered data that small RNAs of all lengths were kept. In order to compare with published datasets (GC and JS) that only contain small RNAs with a specific range of reading length, we also generated filtered 15-mer to 30-mer processed reads files for HEK293T-hACE2 datasets. For small RNA length filtered data, only reads with lengths between 15 nts and 30 nts were kept during the cutadapt processing step.
For Calu3-EW datasets from GSE148729: Raw data files were download from GEO [10]. Since there are no mock infection data available, infection at 4 h were used as control and infection at 12 h and 24 h were pooled together as infected samples.
For Mouse brain organoids datasets: All six sets of infection data of SARS-CoV-2 and Zika were downloaded from GEO (GSE173946) [12]. Due to the fact that there is no replicate for these datasets and there are mouse datasets, no miRNA analysis was performed on these datasets. These datasets were only used for viewing vsmRNA and datasets for Zika were used as control for SARS-CoV-2.
For the second plasma dataset of COVID-19 patients: The original raw datasets were downloaded from the referenced website [14]. They were reanalyzed by miRge2 in order to be comparable with other datatsets. Data for non-COVID-19 patients (HD19 and ICU2) were pooled as non-COVID-19 data (n-CoV), data for COVID-19 patients with mild symptoms (HA_68, HA_67_1, HA_67_2, HA7_4, and HA50) were pooled as mild COVID-19 data (m-CoV), and data for COVID-19 patients with severe outcomes (HA1_1, HA5_1, HA7_1, HA25_1, and HA44_1) were pooled as severe COVID-19 data (s-CoV). Normalized reads were used to generate the ratio of miRNA change in M2N (mild to non-COVID-19) and S2N (severe to non-COVID-19).
For datasets from GC: Raw sequence files of mock infection and infection (24 hpi and 48 hpi) for A549-GC and Caco2-GC from GSE162318 were downloaded from GEO.
For datasets from JS: Raw sequence files for mock infection and infection (6 hpi, 24 hpi, and 48 hpi) for A549-JS, Calu3-JS, and PC9-JS from GSE183280 were downloaded from GEO.

4.5. smRNAseq Data Analysis (Length Distribution, Reads Count, Annotation)

Most of the above raw smRNAseq read files were first processed with Cutadapt then analyzed with miRge 2.0 to generate files with reads length distribution and reads count [43]. HEK293T-hACE2 samples were also analyzed with miRge 3.0 to generate files with reads length distribution and reads count [44].

4.6. Small RNA qRT-PCR

A published S-Poly(T) small RNA qRT-PCR detection protocol was adapted for small RNA qRT-PCR. The protocol was modified for multiplex in the reverse transcription step [22,45]. Briefly, 100 ng total RNA was used. We first added poly(A) tail to the RNA using a poly(A) tailing kit from Epicentre (Madison, WI, USA). Since miR-10a-5p or miR-484 had similar abundance in the four HEK293T-hACE2 samples, we chose miRNA-10a-5p as an RNA sample loading control to normalize relative expression of other small RNAs, and miR-484 was used to validate similar miRNA-10a-5p expression levels across different samples. Primers for reverse transcription for all 10 small RNAs were pooled and were added to the same reverse transcription reaction. Primers used for reverse transcription of a specific small RNA were designed according to the most abundant isoforms of a given small RNA in smRNAseq data. All oligoes were ordered from IDT. Universal TaqMan probe and PCR mixtures were employed as published [45]. The ΔCq (quantitation cycle) value of a small RNA relative to miR-10a-5p in each sample was calculated as Cqsmall RNA-CqmiRNA-10a-5p. The ΔΔCq value of a small RNA represents the ΔCq of small RNAs in SARS-CoV-2 infected samples—ΔCq of small RNAs in mock infected samples. The value of 2−ΔΔCq was calculated as the relative fold change of a small RNA in infected samples versus that in mock infected samples. All primers for small RNA qRT-PCR are listed in Supplementary Table S1.

4.7. SARS-CoV-2 ChIRP Data Analysis

All six datasets ChIRP data for Vero E6 and Huh7 cells [29] were downloaded from GEO (GSE167341). Subreads aligner (version 2.1) [46] was used to align reads to SARS-CoV-2 genome to generate BAM files. IGV (version 2.12.2) tools [47] was used to sort and index BAM files for IGV track loading and viewing. After comparing all six datasets, data from replicate #1 of Vero E6 cells was used in all related figures.

4.8. DESeq2 Analysis of Differtially Expressed Small RNAs

Raw (unnormalized) miRNA read counts generated by miRge2 or 3 were used as input for the Bioconductor package DESeq2 (version 1.30.0) in R (version 4.1/4.2) environment to produce the differentially expressed small RNA results (infected versus mock) at the default setting. The p-value for differential gene expression was assessed with the Wald-test method. The Benjamini and Hochberg approach was used to obtain the adjusted p-value (p-adj) [48].

4.9. IGV View of vsmRNAs

Cutadapt processed smRNAseq data files were first aligned to SARS-CoV-2 reference (NC-045512.2) using Bowtie (version 1.3) to generated SAM files. Samtools was used to convert SAM files to BAM files, sort BAM files, and generate BAI files [47,49]. Bowtie2 (v2.4.5) was used to align reads to hg19 genome to view the human miRNA read distribution by IGV, as shown in Figure S4.

4.10. Published Small RNA Profile Datasets

Curated published small RNA profiles in HEK293T cells and the human lung tissue were downloaded from miRmine database at https://guanfiles.dcmb.med.umich.edu/mirmine/index.html (accessed on 7 October 2021) [30].

4.11. miRDB Identification of miRNA Seed Complementary Sequences in SARA-CoV-2 Genome

Host miRNA seed complementary sequences in SARS-CoV-2 genome were identified by miRDB [50]. SARS-CoV-2 full length genome was input into miRDB web interface for custom prediction at http://mirdb.org/custom.html (accessed on 1 July 2021).

4.12. Other Bioinoformatics Tools Used for Data Analysis and Plots

R (version 4.0 to 4.2), R studio (version 2022.07.1), and many R or Bioconductor software (version 3.11 to 3.15) packages were used for data analysis and visualization. R package of EnhancedVolcano (https://github.com/kevinblighe/EnhancedVolcano, accessed on 5 October 2022) was used to generate the volcano plots.

5. Statistics

Inferential statistics of differential small RNA expression in virally infected samples versus mock-infected samples were calculated with the default statistical settings in the DESeq2 as stated in the DESeq2 analysis section. Descriptive statistics of two different datasets were calculated with a two-way ANOVA followed by a post-hoc test (multiple unpaired t-tests). Unless specified in the figure legends, p-adj < 0.05 for DESeq2 data or p-value < 0.05 for others, was used as the cutoff for significance in gene expression. The error bar is expressed as the standard deviation.

Supplementary Materials

The following supporting information can be downloaded at: https://www.mdpi.com/article/10.3390/microbiolres13040056/s1. RNAs in SARS-CoV-2 infection supplementary materials.pdf, File_S1A_HEK293T-hACE2-smRNAseq_miRNA and tRFs read count and DESeq2 results infected vs uninfected_miRge3.xlsx; File_S1B_HEK293T-hACE2-smRNAseq_miRNA read count and DESeq2 results infected vs uninfected_miRge3.xlsx; File_S1C_HEK293T-hACE2-smRNAseq_miRNA read count and DESeq2 results infected vs uninfected_miRge2.xlsx; File_S2A_ raw miRNA read count_Calu3_EW-Plasma-II of h-m-s-COVID-19.xlsx; File_S2B_HEK293T vs GC JS datasets-DESeq2 results of log2FC-p-adj-baseMean.xlsx; File_S3A_miRDB predicted miRNAs targeting the SARS-CoV-2 -- list and rank.docx; File_S3B_miRDB predicted host miRNA seed on SARS-CoV-2 genome.docx; File_S4_normalized read count of human miRNAs from the second plasma dataset of COVID-19 patients.xlxs; File_S5_Filtered HEK293T miRNA count.xlsx contains miRge analyzed original raw miRNA counts in HEK293T-hACE2 cells.xlxs; File_S6_GC and JS datasets- DESeq2 results infected vs uninfected.xlsx.

Author Contributions

G.S., A.D.R. and Y.S. conceived the study. Q.C. prepared HEK293T-hACE2 cells for viral infection and extracted RNA from control and infected cells. V.A. and G.G.J. performed SARS-CoV-2 infection, and cell collection. E.M.L. performed qRT-PCR assay. G.S. performed bioinformatics analysis. G.S. and Y.S. wrote the manuscript with inputs from other authors. All authors have read and agreed to the published version of the manuscript.

Funding

This work was supported by the California Institute for Regenerative Medicine DISC2-12172 and the Louise and Herbert Horvitz Charitable Foundation to YS. The small RNA sequencing was performed in the Integrative Genomics Core of City of Hope and was supported by the National Cancer Institute of the National Institutes of Health under award number P30CA33572.

Institutional Review Board Statement

Not applicable.

Informed Consent Statement

Not applicable.

Data Availability Statement

All raw and some processed small RNA sequencing data generated in this study for HEK293T-hACE2 cells were deposited to the NCBI Gene Expression Omnibus (GEO; https://www.ncbi.nlm.nih.gov/geo/, accessed on 5 October 2022) under the accession number GSE189920. Reanalyzed public data were provided in Supplementary Files. Materials and Correspondence. Correspondence and requests for materials should be addressed to G.S. or Y.S.

Acknowledgments

We would like to thank Stanley Qi, Stanford University, for kindly providing us with the GFP reporter plasmid that carries SARS-CoV-2 fragment-2, which includes the sequence of N gene.

Conflicts of Interest

G.S. holds the US patent 8859239B2 for a method for small RNA profiling. All the other authors do not have any competing interests or conflict of interest.

References

  1. Zhou, P.; Yang, X.L.; Wang, X.G.; Hu, B.; Zhang, L.; Zhang, W.; Si, H.R.; Zhu, Y.; Li, B.; Huang, C.L.; et al. A pneumonia outbreak associated with a new coronavirus of probable bat origin. Nature 2020, 579, 270–273. [Google Scholar] [CrossRef] [PubMed] [Green Version]
  2. Maranini, B.; Ciancio, G.; Ferracin, M.; Cultrera, R.; Negrini, M.; Sabbioni, S.; Govoni, M. microRNAs and Inflammatory Immune Response in SARS-CoV-2 Infection: A Narrative Review. Life 2022, 12, 288. [Google Scholar] [CrossRef]
  3. Arghiani, N.; Nissan, T.; Matin, M.M. Role of microRNAs in COVID-19 with implications for therapeutics. Biomed. Pharmacother. 2021, 144, 112247. [Google Scholar] [CrossRef] [PubMed]
  4. Paul, S.; Vazquez, L.A.B.; Reyes-Perez, P.R.; Estrada-Meza, C.; Alburquerque, R.A.A.; Pathak, S.; Banerjee, A.; Bandyopadhyay, A.; Chakraborty, S.; Srivastava, A. The role of microRNAs in solving COVID-19 puzzle from infection to therapeutics: A mini-review. Virus Res. 2022, 308, 198631. [Google Scholar] [CrossRef] [PubMed]
  5. Guo, Z.; Li, Y.; Ding, S.W. Small RNA-based antimicrobial immunity. Nat. Rev. Immunol. 2019, 19, 31–44. [Google Scholar] [CrossRef] [PubMed]
  6. Umbach, J.L.; Cullen, B.R. The role of RNAi and microRNAs in animal virus replication and antiviral immunity. Genes Dev. 2009, 23, 1151–1164. [Google Scholar] [CrossRef] [Green Version]
  7. Hodgson, J. The pandemic pipeline. Nat. Biotechnol. 2020, 38, 523–532. [Google Scholar] [CrossRef]
  8. Uludag, H.; Parent, K.; Aliabadi, H.M.; Haddadi, A. Prospects for RNAi Therapy of COVID-19. Front. Bioeng. Biotechnol. 2020, 8, 916. [Google Scholar] [CrossRef]
  9. Mu, J.; Xu, J.; Zhang, L.; Shu, T.; Wu, D.; Huang, M.; Ren, Y.; Li, X.; Geng, Q.; Xu, Y.; et al. SARS-CoV-2-encoded nucleocapsid protein acts as a viral suppressor of RNA interference in cells. Sci. China Life Sci. 2020, 63, 1413–1416. [Google Scholar] [CrossRef] [Green Version]
  10. Wyler, E.; Mosbauer, K.; Franke, V.; Diag, A.; Gottula, L.T.; Arsie, R.; Klironomos, F.; Koppstein, D.; Honzke, K.; Ayoub, S.; et al. Transcriptomic profiling of SARS-CoV-2 infected human cell lines identifies HSP90 as target for COVID-19 therapy. iScience 2021, 24, 102151. [Google Scholar] [CrossRef]
  11. Tang, H.; Gao, Y.; Li, Z.; Miao, Y.; Huang, Z.; Liu, X.; Xie, L.; Li, H.; Wen, W.; Zheng, Y.; et al. The noncoding and coding transcriptional landscape of the peripheral immune response in patients with COVID-19. Clin. Transl. Med. 2020, 10, e200. [Google Scholar] [CrossRef] [PubMed]
  12. Poirier, E.Z.; Buck, M.D.; Chakravarty, P.; Carvalho, J.; Frederico, B.; Cardoso, A.; Healy, L.; Ulferts, R.; Beale, R.; Reis, E.S.C. An isoform of Dicer protects mammalian stem cells against multiple RNA viruses. Science 2021, 373, 231–236. [Google Scholar] [CrossRef]
  13. Farr, R.J.; Rootes, C.L.; Rowntree, L.C.; Nguyen, T.H.O.; Hensen, L.; Kedzierski, L.; Cheng, A.C.; Kedzierska, K.; Au, G.G.; Marsh, G.A.; et al. Altered microRNA expression in COVID-19 patients enables identification of SARS-CoV-2 infection. PLoS Pathog. 2021, 17, e1009759. [Google Scholar] [CrossRef] [PubMed]
  14. Grehl, C.; Schultheiss, C.; Hoffmann, K.; Binder, M.; Altmann, T.; Grosse, I.; Kuhlmann, M. Detection of SARS-CoV-2 Derived Small RNAs and Changes in Circulating Small RNAs Associated with COVID-19. Viruses 2021, 13, 1593. [Google Scholar] [CrossRef] [PubMed]
  15. Meng, F.; Siu, G.K.; Mok, B.W.; Sun, J.; Fung, K.S.C.; Lam, J.Y.; Wong, N.K.; Gedefaw, L.; Luo, S.; Lee, T.M.H.; et al. Viral MicroRNAs Encoded by Nucleocapsid Gene of SARS-CoV-2 Are Detected during Infection, and Targeting Metabolic Pathways in Host Cells. Cells 2021, 10, 1762. [Google Scholar] [CrossRef]
  16. Kim, D.; Kim, S.; Park, J.; Chang, H.R.; Chang, J.; Ahn, J.; Park, H.; Park, J.; Son, N.; Kang, G.; et al. A high-resolution temporal atlas of the SARS-CoV-2 translatome and transcriptome. Nat. Commun. 2021, 12, 5120. [Google Scholar] [CrossRef]
  17. Singh, M.; Chazal, M.; Quarato, P.; Bourdon, L.; Malabat, C.; Vallet, T.; Vignuzzi, M.; van der Werf, S.; Behillil, S.; Donati, F.; et al. A virus-derived microRNA targets immune response genes during SARS-CoV-2 infection. EMBO Rep. 2021, 23, e54341. [Google Scholar] [CrossRef] [PubMed]
  18. Pawlica, P.; Yario, T.A.; White, S.; Wang, J.; Moss, W.N.; Hui, P.; Vinetz, J.M.; Steitz, J.A. SARS-CoV-2 expresses a microRNA-like small RNA able to selectively repress host genes. Proc. Natl. Acad. Sci. USA 2021, 118, e2116668118. [Google Scholar] [CrossRef] [PubMed]
  19. Farr, R.J.; Rootes, C.L.; Stenos, J.; Foo, C.H.; Cowled, C.; Stewart, C.R. Detection of SARS-CoV-2 infection by microRNA profiling of the upper respiratory tract. PLoS ONE 2022, 17, e0265670. [Google Scholar] [CrossRef] [PubMed]
  20. Li, C.; Hu, X.; Li, L.; Li, J.H. Differential microRNA expression in the peripheral blood from human patients with COVID-19. J. Clin. Lab. Anal. 2020, 34, e23590. [Google Scholar] [CrossRef] [PubMed]
  21. Sun, G.; Wu, X.; Wang, J.; Li, H.; Li, X.; Gao, H.; Rossi, J.; Yen, Y. A bias-reducing strategy in profiling small RNAs using Solexa. RNA 2011, 17, 2256–2262. [Google Scholar] [CrossRef] [PubMed] [Green Version]
  22. Sun, G.; Cheng, Y.W.; Lai, L.; Huang, T.C.; Wang, J.; Wu, X.; Wang, Y.; Huang, Y.; Wang, J.; Zhang, K.; et al. Signature miRNAs in colorectal cancers were revealed using a bias reduction small RNA deep sequencing protocol. Oncotarget 2016, 7, 3857–3872. [Google Scholar] [CrossRef] [Green Version]
  23. Lau, L.; Gray, E.E.; Brunette, R.L.; Stetson, D.B. DNA tumor virus oncogenes antagonize the cGAS-STING DNA-sensing pathway. Science 2015, 350, 568–571. [Google Scholar] [CrossRef] [Green Version]
  24. Burdette, D.L.; Monroe, K.M.; Sotelo-Troha, K.; Iwig, J.S.; Eckert, B.; Hyodo, M.; Hayakawa, Y.; Vance, R.E. STING is a direct innate immune sensor of cyclic di-GMP. Nature 2011, 478, 515–518. [Google Scholar] [CrossRef] [PubMed] [Green Version]
  25. Sun, G.; Cui, Q.; Garcia, G., Jr.; Wang, C.; Zhang, M.; Arumugaswami, V.; Riggs, A.D.; Shi, Y. Comparative transcriptomic analysis of SARS-CoV-2 infected cell model systems reveals differential innate immune responses. Sci. Rep. 2021, 11, 17146. [Google Scholar] [CrossRef] [PubMed]
  26. Kim, D.; Lee, J.Y.; Yang, J.S.; Kim, J.W.; Kim, V.N.; Chang, H. The Architecture of SARS-CoV-2 Transcriptome. Cell 2020, 181, 914–921.e910. [Google Scholar] [CrossRef]
  27. Shapiro, J.S.; Langlois, R.A.; Pham, A.M.; Tenoever, B.R. Evidence for a cytoplasmic microprocessor of pri-miRNAs. RNA 2012, 18, 1338–1346. [Google Scholar] [CrossRef] [PubMed] [Green Version]
  28. Rouha, H.; Thurner, C.; Mandl, C.W. Functional microRNA generated from a cytoplasmic RNA virus. Nucleic Acids Res. 2010, 38, 8328–8337. [Google Scholar] [CrossRef] [PubMed] [Green Version]
  29. Flynn, R.A.; Belk, J.A.; Qi, Y.; Yasumoto, Y.; Wei, J.; Alfajaro, M.M.; Shi, Q.; Mumbach, M.R.; Limaye, A.; DeWeirdt, P.C.; et al. Discovery and functional interrogation of SARS-CoV-2 RNA-host protein interactions. Cell 2021, 184, 2394–2411.e2316. [Google Scholar] [CrossRef]
  30. Panwar, B.; Omenn, G.S.; Guan, Y. miRmine: A database of human miRNA expression profiles. Bioinformatics 2017, 33, 1554–1560. [Google Scholar] [CrossRef]
  31. Huang, X.; Le, Q.T.; Giaccia, A.J. MiR-210--micromanager of the hypoxia pathway. Trends Mol. Med. 2010, 16, 230–237. [Google Scholar] [CrossRef] [PubMed] [Green Version]
  32. Nitsure, M.; Sarangi, B.; Shankar, G.H.; Reddy, V.S.; Walimbe, A.; Sharma, V.; Prayag, S. Mechanisms of Hypoxia in COVID-19 Patients: A Pathophysiologic Reflection. Indian J. Crit. Care Med. 2020, 24, 967–970. [Google Scholar] [CrossRef] [PubMed]
  33. Hennig, T.; Prusty, A.B.; Kaufer, B.B.; Whisnant, A.W.; Lodha, M.; Enders, A.; Thomas, J.; Kasimir, F.; Grothey, A.; Klein, T.; et al. Selective inhibition of miRNA processing by a herpesvirus-encoded miRNA. Nature 2022, 605, 539–544. [Google Scholar] [CrossRef]
  34. Testa, U.; Pelosi, E.; Castelli, G.; Labbaye, C. miR-146 and miR-155: Two Key Modulators of Immune Response and Tumor Development. Noncoding RNA 2017, 3, 22. [Google Scholar] [CrossRef] [PubMed] [Green Version]
  35. Parameswaran, P.; Sklan, E.; Wilkins, C.; Burgon, T.; Samuel, M.A.; Lu, R.; Ansel, K.M.; Heissmeyer, V.; Einav, S.; Jackson, W.; et al. Six RNA viruses and forty-one hosts: Viral small RNAs and modulation of small RNA repertoires in vertebrate and invertebrate systems. PLoS Pathog. 2010, 6, e1000764. [Google Scholar] [CrossRef] [Green Version]
  36. Ziv, O.; Price, J.; Shalamova, L.; Kamenova, T.; Goodfellow, I.; Weber, F.; Miska, E.A. The Short- and Long-Range RNA-RNA Interactome of SARS-CoV-2. Mol. Cell 2020, 80, 1067–1077.e1065. [Google Scholar] [CrossRef] [PubMed]
  37. Liu, Z.; Wang, J.; Cheng, H.; Ke, X.; Sun, L.; Zhang, Q.C.; Wang, H.W. Cryo-EM Structure of Human Dicer and Its Complexes with a Pre-miRNA Substrate. Cell 2018, 173, 1549–1550. [Google Scholar] [CrossRef]
  38. Mousavi, S.R.; Sajjadi, M.S.; Khosravian, F.; Feizbakhshan, S.; Salmanizadeh, S.; Esfahani, Z.T.; Beni, F.A.; Arab, A.; Kazemi, M.; Shahzamani, K.; et al. Dysregulation of RNA interference components in COVID-19 patients. BMC Res. Notes 2021, 14, 401. [Google Scholar] [CrossRef]
  39. Sharma, A.; Garcia, G., Jr.; Wang, Y.; Plummer, J.T.; Morizono, K.; Arumugaswami, V.; Svendsen, C.N. Human iPSC-Derived Cardiomyocytes Are Susceptible to SARS-CoV-2 Infection. Cell Rep. Med. 2020, 1, 100052. [Google Scholar] [CrossRef]
  40. Wang, C.; Zhang, M.; Garcia, G., Jr.; Tian, E.; Cui, Q.; Chen, X.; Sun, G.; Wang, J.; Arumugaswami, V.; Shi, Y. ApoE-Isoform-Dependent SARS-CoV-2 Neurotropism and Cellular Response. Cell Stem Cell 2021, 28, 331–342.e335. [Google Scholar] [CrossRef]
  41. Abbott, T.R.; Dhamdhere, G.; Liu, Y.; Lin, X.; Goudy, L.; Zeng, L.; Chemparathy, A.; Chmura, S.; Heaton, N.S.; Debs, R.; et al. Development of CRISPR as an Antiviral Strategy to Combat SARS-CoV-2 and Influenza. Cell 2020, 181, 865–876.e812. [Google Scholar] [CrossRef] [PubMed]
  42. Martin, M. Cutadapt removes adapter sequences from high-throughput sequencing reads. EMBnet J. 2011, 17, 10–12. [Google Scholar] [CrossRef]
  43. Lu, Y.; Baras, A.S.; Halushka, M.K. miRge 2.0 for comprehensive analysis of microRNA sequencing data. BMC Bioinform. 2018, 19, 275. [Google Scholar] [CrossRef] [PubMed]
  44. Patil, A.H.; Halushka, M.K. miRge3.0: A comprehensive microRNA and tRF sequencing analysis pipeline. NAR Genom. Bioinform. 2021, 3, lqab068. [Google Scholar] [CrossRef] [PubMed]
  45. Kang, K.; Zhang, X.; Liu, H.; Wang, Z.; Zhong, J.; Huang, Z.; Peng, X.; Zeng, Y.; Wang, Y.; Yang, Y.; et al. A novel real-time PCR assay of microRNAs using S-Poly(T), a specific oligo(dT) reverse transcription primer with excellent sensitivity and specificity. PLoS ONE 2012, 7, e48536. [Google Scholar] [CrossRef] [PubMed] [Green Version]
  46. Liao, Y.; Smyth, G.K.; Shi, W. The Subread aligner: Fast, accurate and scalable read mapping by seed-and-vote. Nucleic Acids Res. 2013, 41, e108. [Google Scholar] [CrossRef] [PubMed] [Green Version]
  47. Robinson, J.T.; Thorvaldsdottir, H.; Winckler, W.; Guttman, M.; Lander, E.S.; Getz, G.; Mesirov, J.P. Integrative genomics viewer. Nat. Biotechnol. 2011, 29, 24–26. [Google Scholar] [CrossRef] [Green Version]
  48. Love, M.I.; Huber, W.; Anders, S. Moderated estimation of fold change and dispersion for RNA-seq data with DESeq2. Genome Biol. 2014, 15, 550. [Google Scholar] [CrossRef] [Green Version]
  49. Li, H.; Handsaker, B.; Wysoker, A.; Fennell, T.; Ruan, J.; Homer, N.; Marth, G.; Abecasis, G.; Durbin, R.; Genome Project Data Processing, S. The Sequence Alignment/Map format and SAMtools. Bioinformatics 2009, 25, 2078–2079. [Google Scholar] [CrossRef] [Green Version]
  50. Chen, Y.; Wang, X. miRDB: An online database for prediction of functional microRNA targets. Nucleic Acids Res. 2020, 48, D127–D131. [Google Scholar] [CrossRef]
Figure 1. Summary of reads annotated as human small RNAs and plots of differentially expressed small RNAs in SARS-CoV-2-infected HEK293T-hACE2 cells versus mock-infected cells. (A) Small RNA read length distribution in mock or SARS-CoV-2 (CoV)-infected HEK293T-hACE2 cells analyzed by miRge3; (B) small RNA read annotation distribution in mock or SARS-CoV-2 (CoV)-infected HEK293T-hACE2 cells analyzed by miRge3 and statistics were performed with two-way ANOVA and followed by multiple unpaired t-tests; (C) volcano plot of differentially expressed host tRFs and miRNA in SARS-CoV-2-infected HEK293T-hACE2 cells versus mock-infected cells; (D) small RNA qRT-PCR validation of smRNAseq data. Data represents an average of six replicates, and the error bar represents SD. (E) Volcano plot of differentially expressed human miRNAs in SARS-CoV-2-infected HEK293T-hACE2 cells versus mock-infected cells. NS/ns: not statistically significant for panels (B,C,E). * p < 0.01, ** p < 0.001 for panel (B).
Microbiolres 13 00056 g001
Figure 2. Significantly dysregulated small host RNAs in SARS-CoV-2-infected HEK293T-hACE2 cells and their expression in published datasets. (A) Unfiltered HEK293-hACE2 dataset versus datasets of Calu3-EW and plasma datasets of COVID-19 patients. Column “Log2FC” represents DESeq2 calculated log2 fold change of host miRNAs in SARS-CoV-2 infected cells versus mock infected cells. Column “Seed on SARS-CoV-2 genome” represents the number of host miRNA seed regions (nt #2 to 8 from 5′ end) complementary sequences on SARS-CoV-2 genome. Column “logBM” represents the average miRNA abundance in SARS-CoV-2 and mock-infected HEK293T-hACE2 cells measured by basic mean reads calculated with DESeq2. Column “log2(RPM + 1)” represents log2 values of miRmine analyzed RPM values plus one miRNA host in HEK293T cells (average RPM of six smRNAseq runs) or the human lung tissue (average RPM of two smRNAseq runs, miRmine defines RPM as reads per million miRNA reads, not all mapped reads). Column log2FC represent log2 fold changes of the significantly dysregulated miRNAs from HEK293T-hACE2 cells in SARS-CoV-2-infected Calu3-EW cells (Calu3-EW), the first plasma dataset of COVID-19 patients (1st Plasma), and the second plasma dataset of COVID-19 patients (2nd Plasma). “M2N” and “S2N” represent the change in those miRNAs in mild or severe COVID-19 patients compared to that in non-COVID-19 patients, respectively. Abbreviations: NA: data not available; M2N: mild COVID-19 to non-COVID-19; S2N: severe COVID-19 to non-COVID-19; UD: undetectable; UD-M: undetectable in mild COVID-19; UD-S: undetectable in severe COVID-19. (B) Small RNA length-filtered HEK293T-hACE2 dataset versus datasets of GC and JS. Significantly dysregulated host small RNAs with p-adj ≤ 0.05, abs(log2FC) > 0.7, and baseMean > 100 in SARS-CoV-2-infected-filtered the HEK293T-hACE2 dataset were plotted, along with their expression in SARS-CoV-2-infected datasets of GC and JS. The nine columns on the left side represent values of log2FC and the nine columns on the right side represent log2 values of DESeq2 calculated mean repression (baseMean). NA: data is not available. Four of the miR-146 family members were also plotted in the bottom four rows for comparison purposes. Refer to Table 1 for detailed information on infection and abbreviations of samples.
Microbiolres 13 00056 g002
Figure 3. Comparative IGV view of reads from smRNAseq datasets of HEK293T-hACE2, Calu3-CoV (Calu3-EW), BO-WT-CoV, and ChIRP data from Vero-E6 cells mapped to the SARS-CoV-2 genome. (A) Reads mapped to the full-length negative genome of SARS-CoV-2; (B) reads mapped to the full-length positive genome of SARS-CoV-2; (C) read coverage on full-length SARS-CoV-2 genome. Refer to Table 1 for detailed information on infection and abbreviations of samples.
Microbiolres 13 00056 g003
Figure 4. Comparative IGV view of reads from smRNAseq of HEK293T-hACE2 and mouse brain organoids mapped to the SARS-CoV-2 genome (A) Read coverage on full-length SARS-CoV-2 genome. (B) Read coverage at the E to ORF10 region. Refer to Table 1 for detailed information on infection and abbreviations of samples.
Microbiolres 13 00056 g004
Figure 5. Plots and IGV view of vmiR-ORF7a reads distribution. (A) Read distribution of vmiR-ORF7a in datasets of GC and JS. (B) Read distribution of vmiR-ORF7a in datasets of HEK293T-hACE2, Calu3-EW, and BO-WT-CoV. (C) IGV estimated reads of vmiR-ORF7a in HEK293T-hACE2, datasets of GC and JS. (D) Reads distribution in datasets of JS at 6 hpi (MOI = 5) versus at 48 hpi (MOI = 0.05). Column “Ratio” refer to ratio of IGV estimated read count in datasets of GC and JS to read count in dataset of HEK293T-hACE2. (E) Read distribution of vmiR-ORF7a-2 in datasets of GC and JS. (F) Read distribution of vmiR-ORF7a-3 in datasets of GC and JS. Refer to Table 1 for detailed information of infection and the abbreviations of the samples.
Microbiolres 13 00056 g005
Table 1. smRNAseq and ChIRP datasets and their abbreviated names used in the study (in both main text and figures).
NameSamples of InfectionMOIhpiGEOReference
HEK293T-Mock *Mock N/A72GSE189920 This study
HEK293T-CoV *SARS-CoV-2172
Calu3-CoV/Calu3-EWSARS-CoV-20.3312 and 24GSE148729[10]
Vero6-ChIRPSARS-CoV-20.0148GSE167341[29]
BO-WT-CoVSARS-CoV-2**96GSE173946 [12]
BO-aviD-CoVSARS-CoV-2
BO-Dicer-CoVSARS-CoV-2
BO-WT-ZikaZika virus***96
A549-JS-Mock *MockN/AN/AGSE183280 [18]
A549-JS-6 h *SARS-CoV-256
A549-JS-24 h *SARS-CoV-2524
A549-JS-48 h *SARS-CoV-20.0548
Calu3-JS-MockMockN/AN/A
Calu3-JS-24 hSARS-CoV-2524
Calu3-JS-48 hSARS-CoV-20.0548
PC9-JS-MockMockN/AN/A
PC9-JS-24hSARS-CoV-2524
PC9-JS-48hSARS-CoV-20.0548
A549-GC-Mock *MockN/A24 & 48GSE162318[17]
A549-GC-24 h *SARS-CoV-2324
A549-GC-48 h *SARS-CoV-2348
Caco2-GC-Mock MockN/A24 & 48
Caco2-GC-24 hSARS-CoV-20.324
Caco2-GC-48 hSARS-CoV-20.348
COVID-19 #Plasma of COVID-19 N/AN/AN/A[13]
Non-CoV (n-CoV) ##Plasma of non-COVID-19N/AN/AN/A, Web download [14]
Mild-CoV (m-CoV) ##Plasma of mild COVID-19 N/AN/A
Severe-CoV (s-CoV) ##Plasma of severe COVID-19 N/AN/A
Note and Abbreviations. CoV: SARS-CoV-2 infection; Zika: Zika virus infection; Vero6: Vero-E6; hpi: hours post infection; MOI: multiplicity of infection; BO: mouse embryonic stem cell derived organoids; aviD: Dicer knock out BO cells overexpress an isoform of Dicer (no Hel2i domain); Dicer: Dicer knock out BO cells overexpress full-length Dicer. WT: wildtype BO cells overexpress both aviD and Dicer; #: first plasma dataset of COVID-19; ##: second plasma dataset of COVID-19; *: hACE2 overexpression; **: 107 N gene copies of SARS-CoV-2; ***: 3 × 10⁵ PFU of Zika virus; N/A: data not available or applicable.
Publisher’s Note: MDPI stays neutral with regard to jurisdictional claims in published maps and institutional affiliations.

