1. Introduction and Motivation
The requirement for increasingly environmentally friendly and local emission-free vehicles is resulting, among other outcomes, in the stronger electrification of vehicle systems. In addition to new, innovative features, mechanical systems are increasingly being replaced by electrical solutions. Besides new electric drivetrain concepts, this also affects safety-critical control systems, such as the electronic stability program, adaptive cruise control or drive-by-wire [
1,
2,
3]. Consequently, not only is the number of new electric actuators and control units increasing, but the risk of potentially safety-critical faults is also increasing [
1,
4].
An undesired increase/decrease in the drive torque in a fault event can result in fatal accidents. Among all functions with high safety requirements, torque control is therefore one of the most important [
5]. The so-called torque security problem aims to avoid unintended acceleration and is one of the main hazards in automotive functional safety [
6]. In the case of engine control units for conventional vehicles, a three-layer safety architecture called EGAS [
4,
7] has been established.
In order to increase the functional safety of vehicles, ISO 26262 “Road Vehicles—Functional Safety”, which was derived from IEC 61508, was introduced in 2009 and represents the actual standard for this topic in the automotive industry [
8,
9]. Among other aspects, ISO 26262 defines the term “functional safety” as the absence of unacceptable risks due to hazards caused by the incorrect behavior of electrical and electronic systems. In this regard, ISO 26262 provides a standardized framework to determine the risks and guidelines in managing the development process, in order to reduce the risks to an acceptable level. For this purpose, each hazardous scenario is assigned a corresponding safety level—an Automotive Safety Integrity Level (ASIL). Thereby, ASIL-A represents the lowest and ASIL-D the highest level. The engine control unit of a conventional vehicle drive with an internal combustion engine is typically classified as ASIL-B [
10] and electric single-wheel drives with multiple engines as ASIL-D [
11]. Thus, for electrified vehicle drives, there are high requirements for the components and especially the safety concept, as well as the control system.
For example, this applies to the traction inverter, which controls the torque of the drive machine in electric vehicle drives. In [
2], it is highlighted that the traction inverter is one of the most fault-prone components. Faults in the traction inverter can consequently result in abrupt and unpredictable vehicle movements and acceleration due to the permanent mechanical contact between the drive machine and the vehicle’s drive wheels. Furthermore, according to [
2], the highest ASIL level is assigned to the unintended movement of the vehicle from standstill, as traffic participants may suffer fatal and life-threatening injuries as a result.
In the context of functional safety, it is therefore important to reliably detect unintentional behavior of the drive machine—in particular, faulty torque output. In the event of a fault, appropriate countermeasures must be initiated in a safety-related control system with the minimum fault reaction time in order to establish a safe state [
9,
12]. Appropriate diagnostic functions, among other solutions, are suitable and must be used to detect the undesired behavior of the drive machine [
3,
9,
12].
A common approach is based on the estimation of the actual torque of the driving machine and its comparison with the desired torque. If the deviation is too high or the torque accuracy is too low, a fault must be assumed. In accordance with the rules of safety decomposition, more than one estimation method can be combined in order to reach the required ASIL grade [
13]. In [
14], a functional safety architecture with monitoring of the actual torque of the driving machine is shown, based on measurements of the phase currents, the direct current voltage (DC voltage), the machine position and the machine temperature.
A well-known method for the detection of undesired behavior of the drive machine in electrified vehicle drives consists of balancing the power. The determined electrical power—corrected by power losses—must correspond to the mechanical power of the drive machine. The electrical power can be determined on the basis of the three-phase currents and voltages of the drive machine [
13,
15], but also the current and voltage on the DC or battery side could be used [
13] to determine the power drawn from or delivered to the vehicle electrical system. The mechanical power of the drive machine is the product of the measured angular velocity and the drive torque to be determined. The main problem in the described method lies in the inaccuracies in the case of low angular velocities of the driving machine (for example, during driving-off). This results in only low power, so that there are only minor power differences in operating points with low and high drive torque. The selectivity is insufficient and faults are often not detected at all or only too late.
In most cases, direct measurement of the torque in the drivetrain using torque sensors is not considered in vehicle series applications. The operating conditions, with high temperatures, vibrations, oil and dust, etc., demand a high level of durability. In addition, common force and torque sensors generally do not meet the cost expectations while fulfilling the respective accuracy requirements [
7].
For a long time, vehicle drivetrain observers have been used in hybrid and electric vehicles to improve the active damping control [
16,
17,
18]. According to [
19], these represent a method of optimizing active damping control in the low velocity range, particularly with regard to jerking at driving-off.
Accordingly, in [
17,
20], an observer for the estimation of the torque of the side shafts is presented, which is primarily used in the context of the active damping of torsional oscillations in the drivetrain. Here, the modeling is essentially based on the differential angle between the gearbox output of the drive unit and the wheel. The velocities of the gearbox output and the wheel are measured using sensors and additionally modeled in each case. Besides complete observability, this enables the consideration of the differences in quality of the velocity sensors. Explicit modeling of the tire belt as well as the tire–road contact is omitted, but the modeled air gap torque of the drive machine is considered [
17].
Another typical approach for an observer with the model of a drivetrain is described in [
18]. The used Luenberger observer is based on a simplified mechanical model of the drivetrain. In addition to the air gap torque of the drive machine, estimated from the field-oriented control, only the rotation angle of the drive machine is used as input. Other unknown variables, such as the angular velocity of the vehicle wheel, are estimated by the Luenberger observer and used for subsequent control algorithms, such as active damping control.
However, the consideration of the air gap torque of the drive machine, e.g., based on the explanations in [
20], may be critical with regard to functional safety. As described in [
18,
20], the air gap torque of the drive machine can be estimated using external control units or by a model. In the event of a fault, this estimate can deviate from reality and therefore result in an incorrect estimate of the side shaft torque.
A further method of estimating the torque in the drivetrain based on rotation angle or rotational velocity sensors is presented in [
21]. The estimation of the shaft angular torque is also based on an observer. The angular displacements are measured by encoder sensors with phonic wheels. The engine torque and clutch-transmitted torque obtained on dual mass flywheel torsion are determined.
In this research, the focus is on determining the torques acting on the real drivetrain on the basis of the torsion of the side shafts. An electric single-wheel drive is taken as an example. The determination of the side shaft torsion is based on the determination of the rotor rotation angle of the electric drive machine and the rotation angle of the vehicle wheel. Whereas the rotor rotation angle in a modern electric machine is usually measured with high-resolution encoders, the resolutions of vehicle-typical anti-lock braking system wheel speed encoders (ABS wheel speed encoders) are limited. These are usually magnetic pole rings with 40–50 pole pairs that are detected using magnetic field sensors. Recent developments for Advanced Driver Assistance Systems (ADAS) offer improved functions such as parking assistance, fully autonomous parking and traffic jam assistance, with the more accurate determination of the rotation angles of the vehicle wheels. For example, with appropriate magnetic field sensor technology, each pole pair can be mapped to eight pulses or edges [
22,
23]. In a passenger vehicle, this corresponds to approximately 5 mm of tire motion per increment. This research investigates the suitability of modern ABS wheel speed sensors for the detection of undesired drive torques. Particularly at standstill, the exact rotation angle of the vehicle wheel is not known due to the limited resolution. In addition, a vehicle-type ABS wheel speed sensor as an incremental encoder does not provide any information about the absolute rotation angle of the vehicle wheel.
The focus of this research is on driving-off procedures, in which faults must be detected quickly in order to establish a safe state within the so-called fault-tolerant time interval (FTTI). Using a worst-case estimation, limits for the drive torque are determined in order to enable early fault detection at the first edge of the ABS wheel speed sensor, after the wheel starts to turn. Parameter changes or changes in the dynamics of the drive machine are taken into account using the approach described in [
24].
The described model-based method is based on the analysis of drivetrain reactions using sensors already integrated in vehicles (see
Section 3). The effectiveness of the method is also demonstrated by experimental investigations on a hardware-in-the-loop test bench (HiL test bench) (see
Section 4). For this purpose, a short description of the used HiL test bench for the reproduction of an electric single-wheel drive is given in
Section 2.
Section 5 describes the extension of the algorithms and the corresponding experimental investigations.
2. Test Environment and Drivability Function
The experimental investigations in this research are carried out with the use of a HiL test bench, which was also used in [
25,
26,
27,
28,
29].
In the context of component and algorithm development, HiL test benches represent a cost-effective alternative with excellent reproducibility compared to tests on a real vehicle. In addition, when considering the functional safety of vehicle drives, certain faults can be reproduced—in order to develop suitable detection methods or countermeasures, for example. The use of a test bench eliminates the risk to the driver in critical situations that might occur.
The applied HiL test bench reproduces an electric vehicle of the compact class with a single-wheel drive. The behavior of an electric vehicle drive machine including a gearbox is reproduced by the test bench drive machine. For this, the inertia, torque and angular velocity of the drive machine are related to the gearbox output shaft. Using the test bench drive machine, a modified desired drivetrain torque is applied to the HiL test bench drivetrain. The modification of the desired drivetrain torque is carried out by the drivability function to reduce torsional oscillations, as described below.
For the simulation of the driving resistance forces from the vehicle longitudinal dynamics (gradient, rolling, acceleration and air resistance forces) and the tire–road contact, a HiL simulation model of the vehicle wheel is used as described in [
26,
27]. The resulting reacting torque, as well as the angular velocity of the vehicle wheel hub, is reproduced by the test bench load machine.
For the close-to-reality reproduction of the oscillation behavior of the drivetrain, a series-produced vehicle side shaft with typically torsional stiffness is integrated into the HiL test bench [
30]. In [
25,
26,
27,
28,
29,
31], it is proven that the oscillation behavior of the HiL test bench in combination with the HiL simulation model corresponds to the oscillation behavior of a real electrified vehicle drive system.
Furthermore, the HiL test bench includes a vehicle-related wheel braking system [
26,
30], which is not in focus in this research.
The high dynamics of the HiL test bench are supported by real-time control and a network with programmable logic (FPGA) using EtherCAT communication to a test bench inverter system with a 250 microsecond cycle time [
27,
32,
33].
For the detailed measurement of torques and angular velocities, high-resolution sensors are integrated into the HiL test bench, shown in
Figure 1.
In accordance with the descriptions in [
26], the high-resolution rotor position encoders of the two electric machines enable the emulation of a large number of different rotary position and rotary velocity encoders in vehicle-typical resolutions.
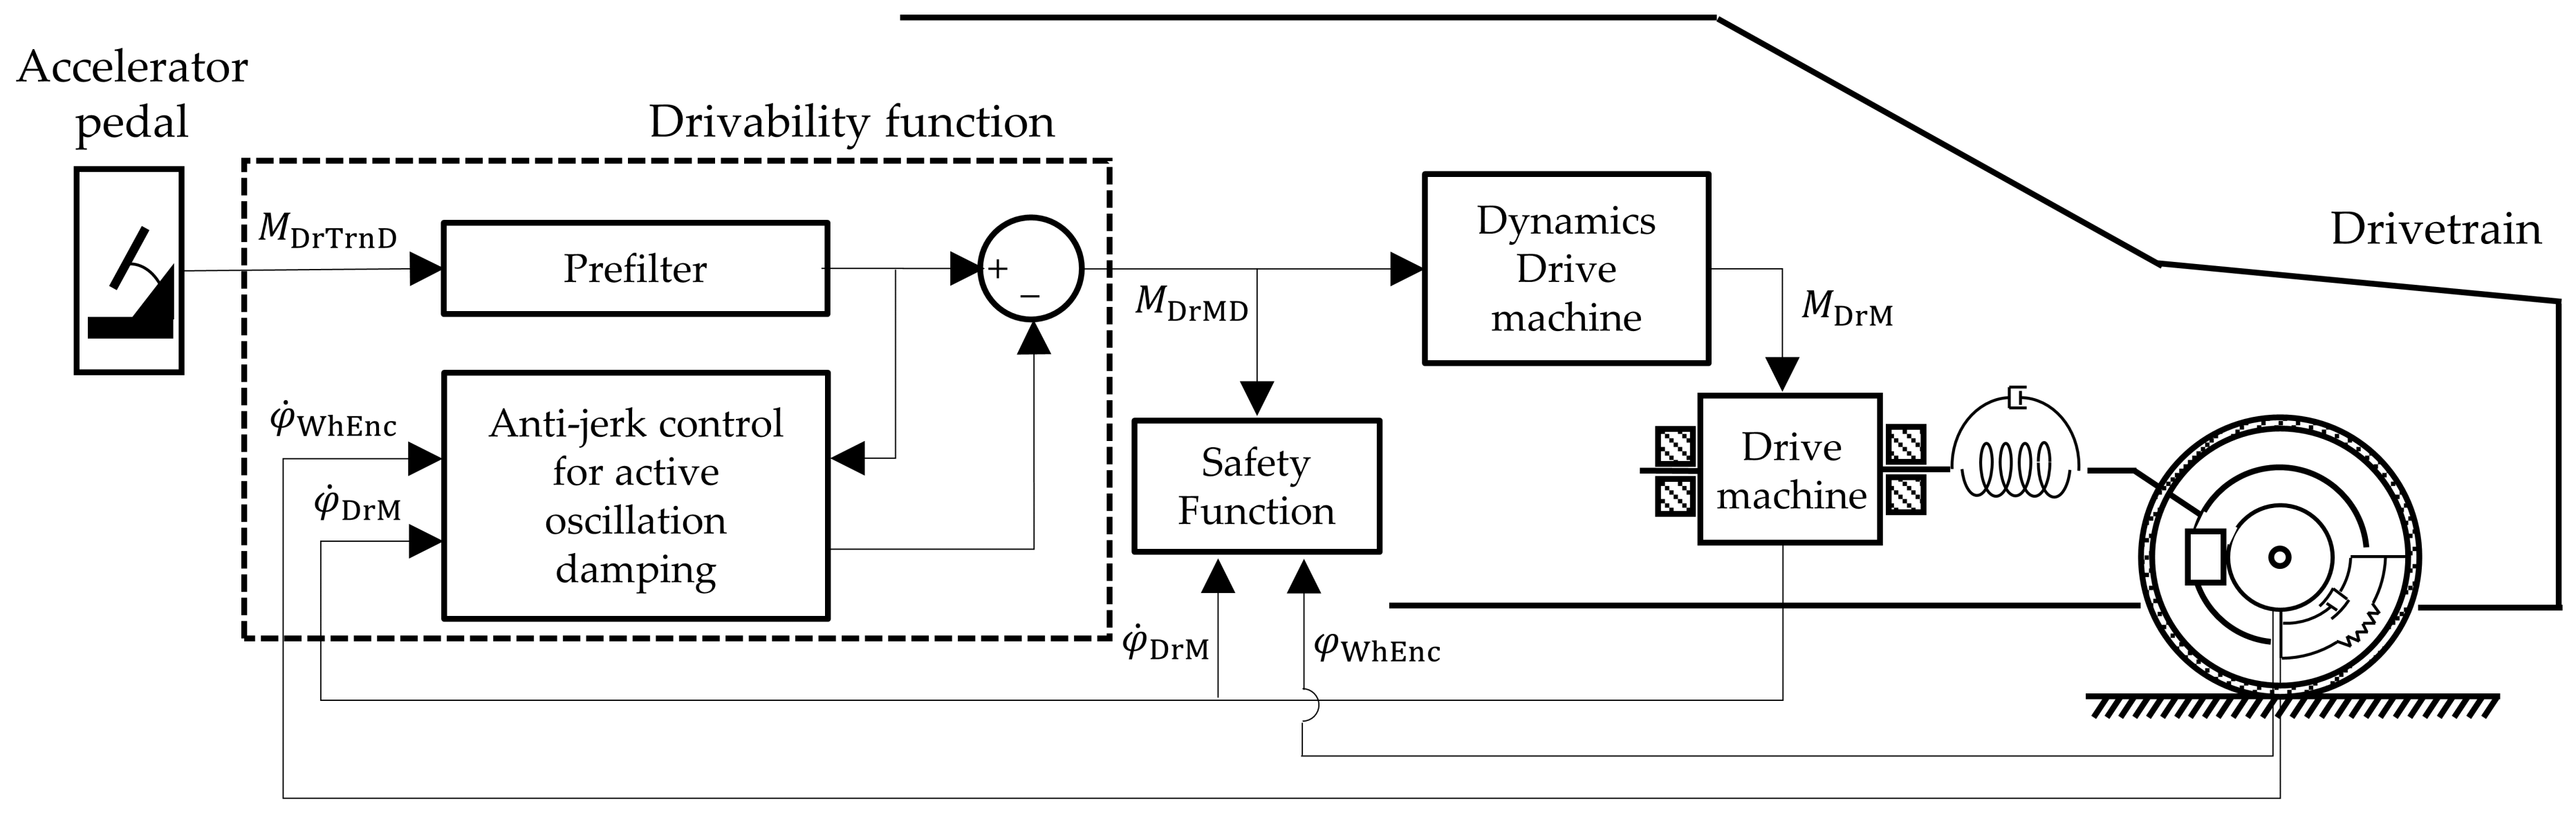
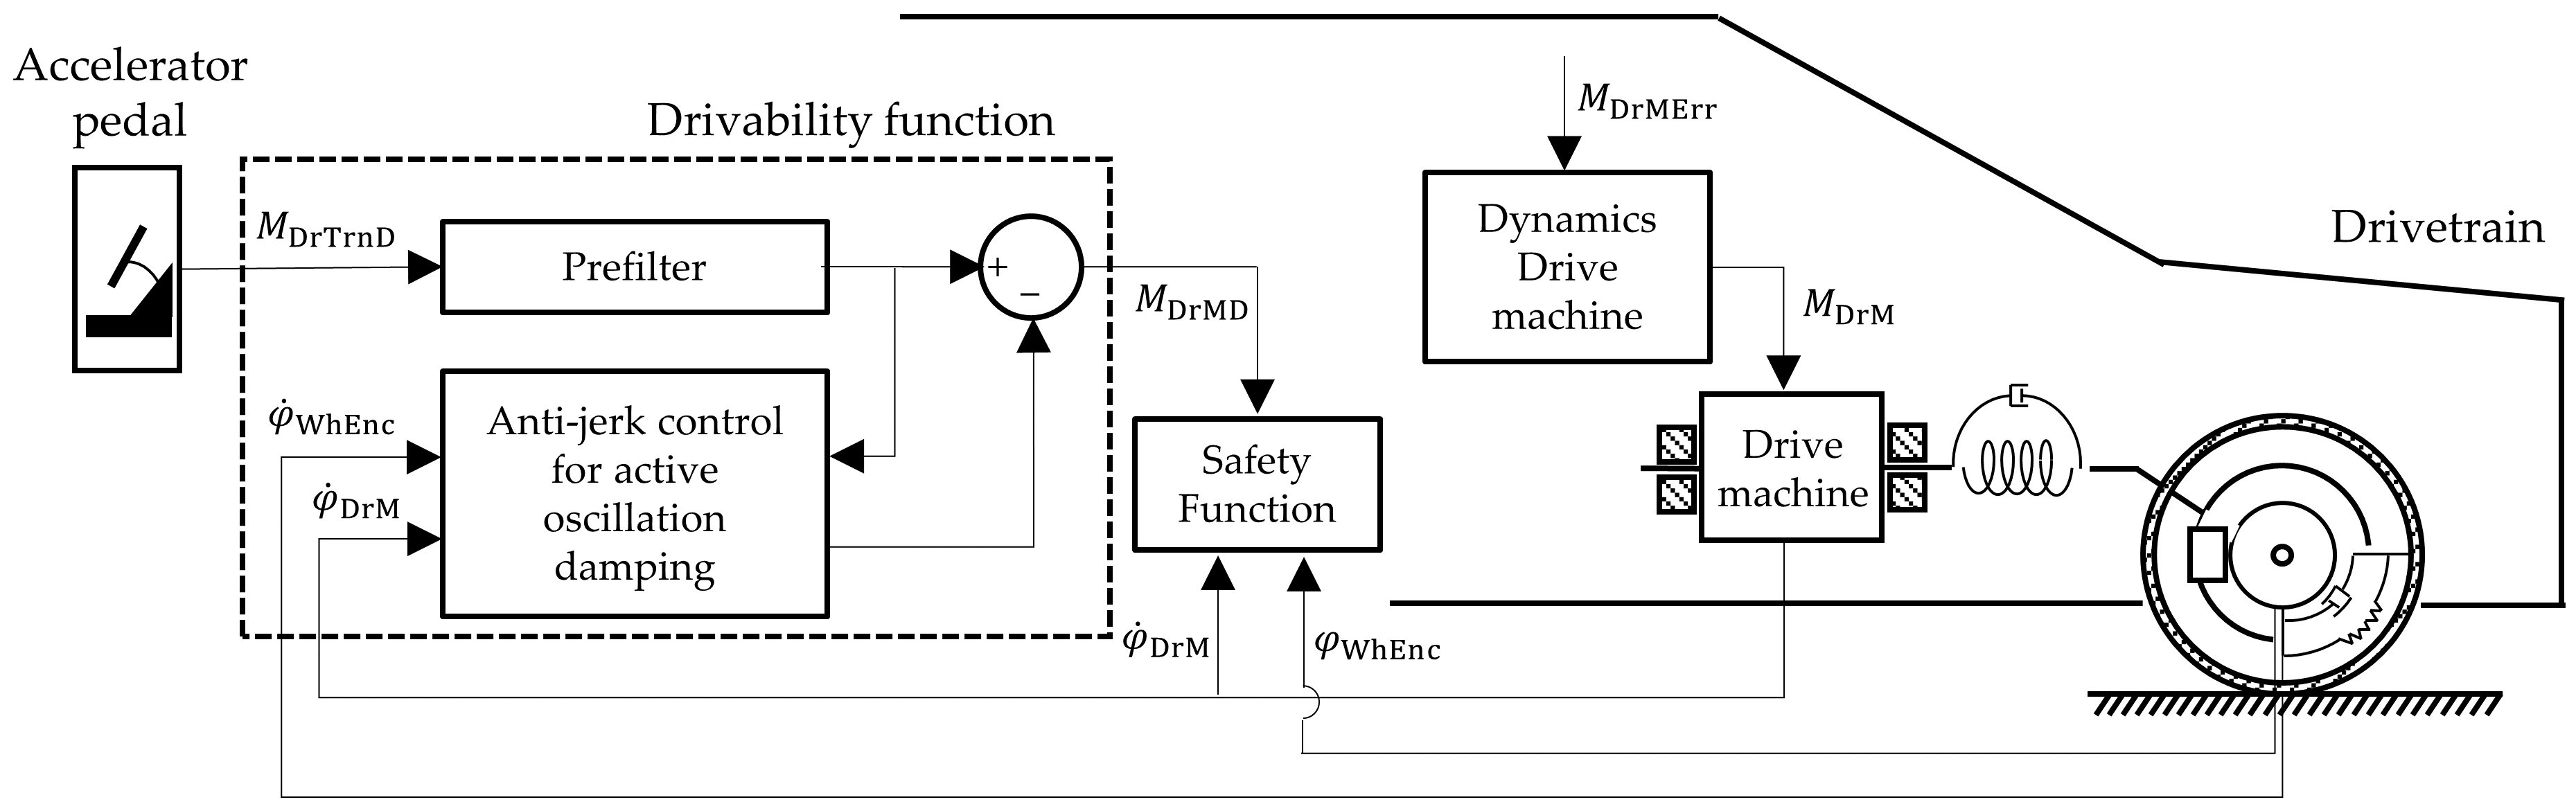
As mentioned above, the drivability function with integrated anti-jerk control described in [
25,
28] is used to reduce the jerk oscillations that typically occur in the drivetrain. The drivability function modifies the desired torque of the vehicle’s drive machine
, as shown in
Figure 2.
The structure of the drivability function is described and developed in [
25] and optimized in [
28]. The drivability function consists of the prefilter and anti-jerk control subsystems.
The prefilter is used to reduce the torsional oscillations of the vehicle side shaft during the load changes of the drive machine. The desired drivetrain torque
is used as the input variable. According to the explanations in [
25,
28], the prefilter can be derived from a simplified system model for the vehicle side shaft torque. Additionally, pole-zero compensation is performed.
For the anti-jerk control, the differential angular velocity
is determined by comparing the angular velocities of the vehicle drive machine
(related to the gearbox output shaft) and the vehicle wheel hub
[
25]. Subsequently, a comparison is made between this differential angular velocity and the demand differential angular velocity
, determined from the system model of the prefilter.
Using a positive gain factor , a derivative element with a first-order lag filter and a torque limitation, a damping torque is calculated and is added to the desired drivetrain torque modified by the prefilter. Therefore, the gain factor can be interpreted as being equivalent to the viscous damping constant of the drivetrain and is a design parameter required for a trade-off between the acceleration capacity and the comfort level.
Furthermore, the Dynamics Drive Machine block in
Figure 2 reproduces the real dynamic behavior of a typical vehicle drive machine. This can be approximated with a first-order lag element with the time constant
.
3. Fault Detection Algorithm
The algorithm for the detection of faults or undesired drive torques consists of determining the torque at the side shaft using two different approaches. The results of the two approaches are subsequently compared with each other.
The investigations are based on a single-wheel drive, where the drive machine is directly connected to a side shaft and a drive wheel without an intermediate gearbox. However, the developed algorithms should also be suitable for drivetrains with a gearbox. Particular attention is focused on the driving-off operation from standstill, as known concepts, such as comparing the electrical and mechanical power to determine the drive torque [
15], are of limited applicability at low speeds.
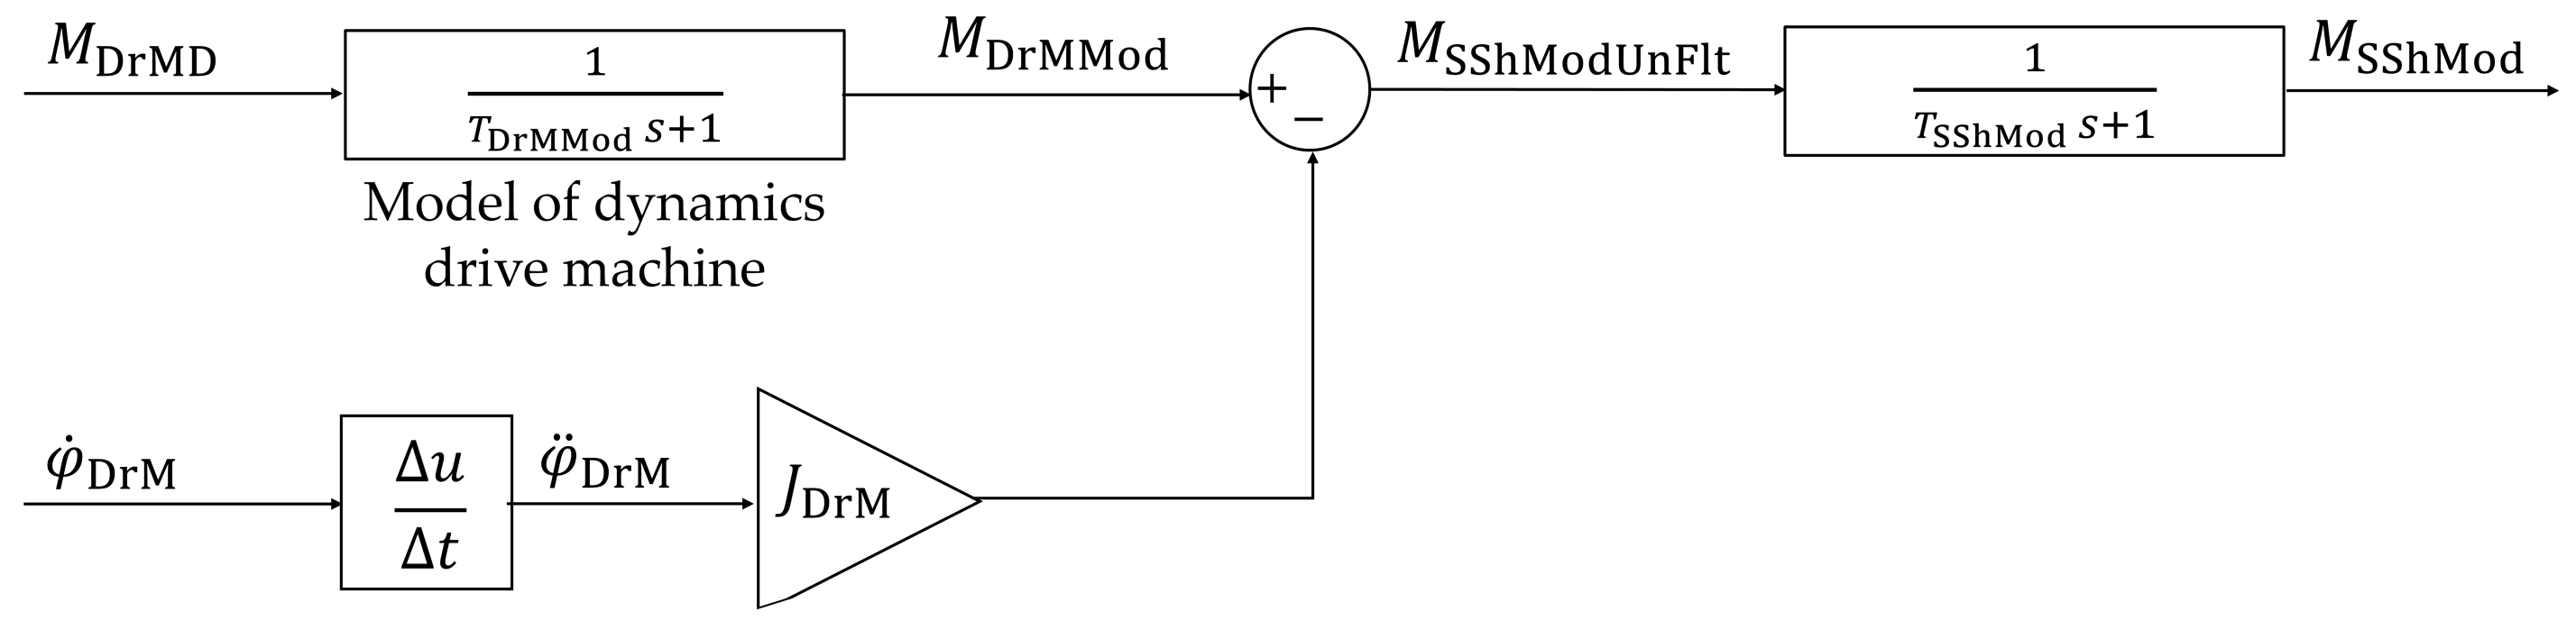
3.1. Modeled Side Shaft Torque from the Desired Torque of the Drive Machine
The first modeled side shaft torque
results from the desired torque of the drive machine
. From this demand torque, the modeled air gap torque
acting on the rotor of the drive machine can be calculated, considering the dynamics of the field-oriented current control or the torque excitation dynamics. The dynamics of the air gap torque of the drive machine are approximated in the model with a first-order lag element with the time constant
= 10 ms. Considering the moment of inertia of the drive machine
and the angular acceleration of the drive machine
(related to the gearbox output shaft), the unfiltered, modeled side shaft torque is determined by
The drive machine typically contains a rotor position encoder to measure the rotation angle
. From this, the angular velocity
and the angular acceleration of the drive machine
can be derived. The signal of the angular acceleration
is usually noisy. This noise also affects the unfiltered modeled side shaft torque
. To reduce the noise, filtering with a first-order lag element is used. On the HiL test bench, a time constant
of 5 ms is shown to be effective. This results in the modeled side shaft torque
, shown in
Figure 3.
As a result of the consideration of the acceleration of the drive machine , the modeled side shaft torque also reacts to influences from the output or wheel side. This is the case, for example, if the vehicle is rolling off on a downhill slope after the wheel brake is released, although the desired torque of the drive machine is 0 Nm.
The modeled side shaft torque is derived from the desired torque of the drive machine and thus follows the driver’s desired torque and can also be interpreted as a demand value.
The modeled side shaft torque can be compared with the side shaft torque determined on the drivetrain for fault detection. This side shaft torque is based on the torsion of the side shaft, which is affected by the actual torque of the drive machine . Its determination is described below.
3.2. Side Shaft Torque from the Torsion of the Side Shaft
The basic concept is to determine the torque transmitted by the side shaft from the torsion. The vehicle side shaft has a spring behavior; as a result of the torsional stiffness , the torsion is approximately proportional to the transmitted torque. The torsional damping of the vehicle side shaft is low and is neglected here.
Using the rotor position encoder of the drive machine, the rotation angle and angular velocity are known.
An ABS wheel speed sensor typically used in automotive vehicles is suitable for the determination of the rotation angle or the angular velocity of the vehicle wheel hub. Usually, the wheel speed sensor is an incremental encoder with a phonic wheel with limited resolution, which also provides no information about the absolute rotation angle of the wheel. Immediately after activating the system, the absolute rotation angle of the wheel is unknown. Rotations can only be detected according to the resolution. The exact angular relationship between the rotation angle of the drive machine and the rotation angle of the vehicle wheel hub cannot be determined. In the case of an optional gearbox between the drive machine and vehicle wheel, the absolute rotation angles of any intermediate gearbox shafts that may be included are also not known.
An estimation of the rotation angle
of the vehicle wheel hub can be determined by counting the edges of the incremental encoder:
Here,
is the number of edges and
is the relative rotation angle of the vehicle wheel hub between two edges, which results from the number of pole pairs of the encoder wheel and the resolution of the sensor evaluation. In this case,
= 0.0164 rad is assumed, corresponding to 384 edges per revolution of the vehicle wheel hub. This resolution corresponds to actual ABS wheel speed sensors with, for example, 48 pole pairs and 8 pulses per pole pair [
22,
23].
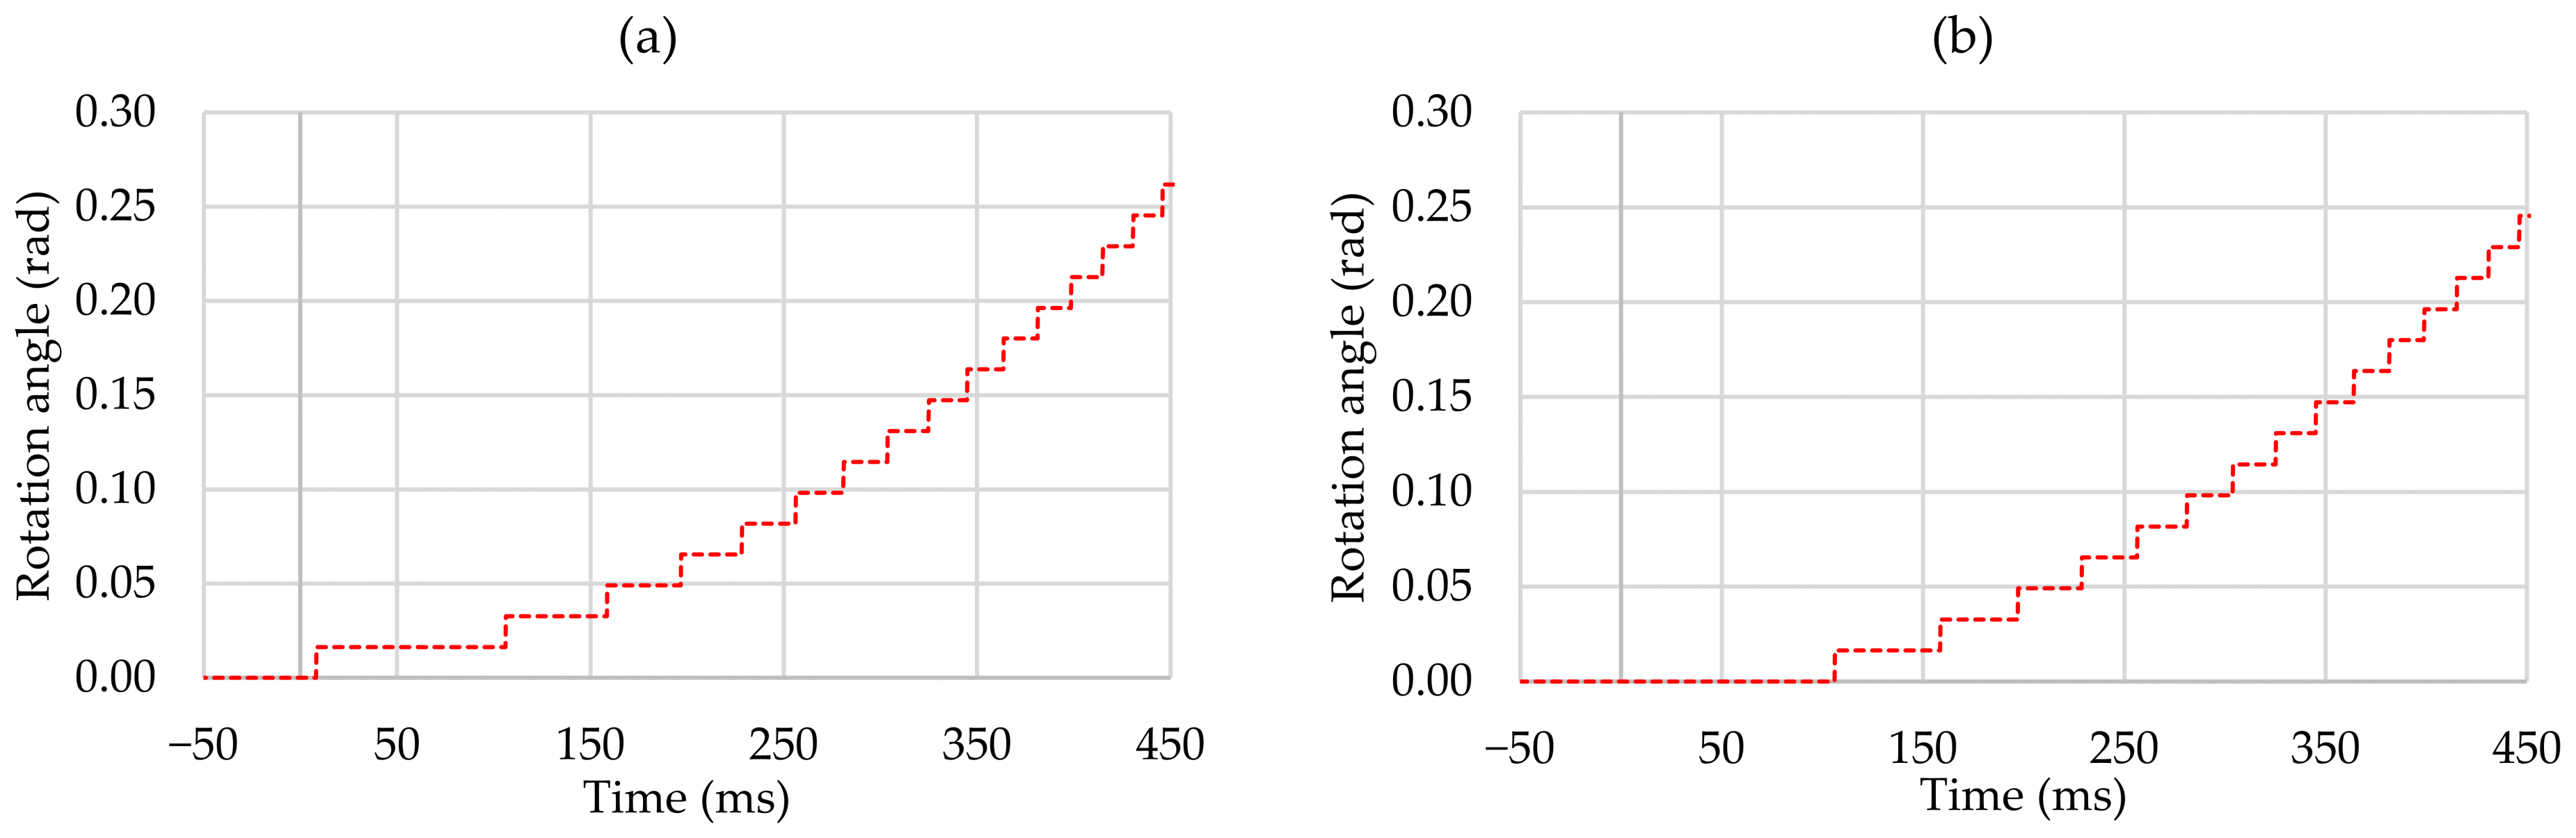
Figure 4 shows two curves of the rotation angle
of the vehicle wheel hub determined in this way when starting from standstill, where
= 0 rad is set in each case at standstill. The start-up process begins in each case at the time
= 0 ms.
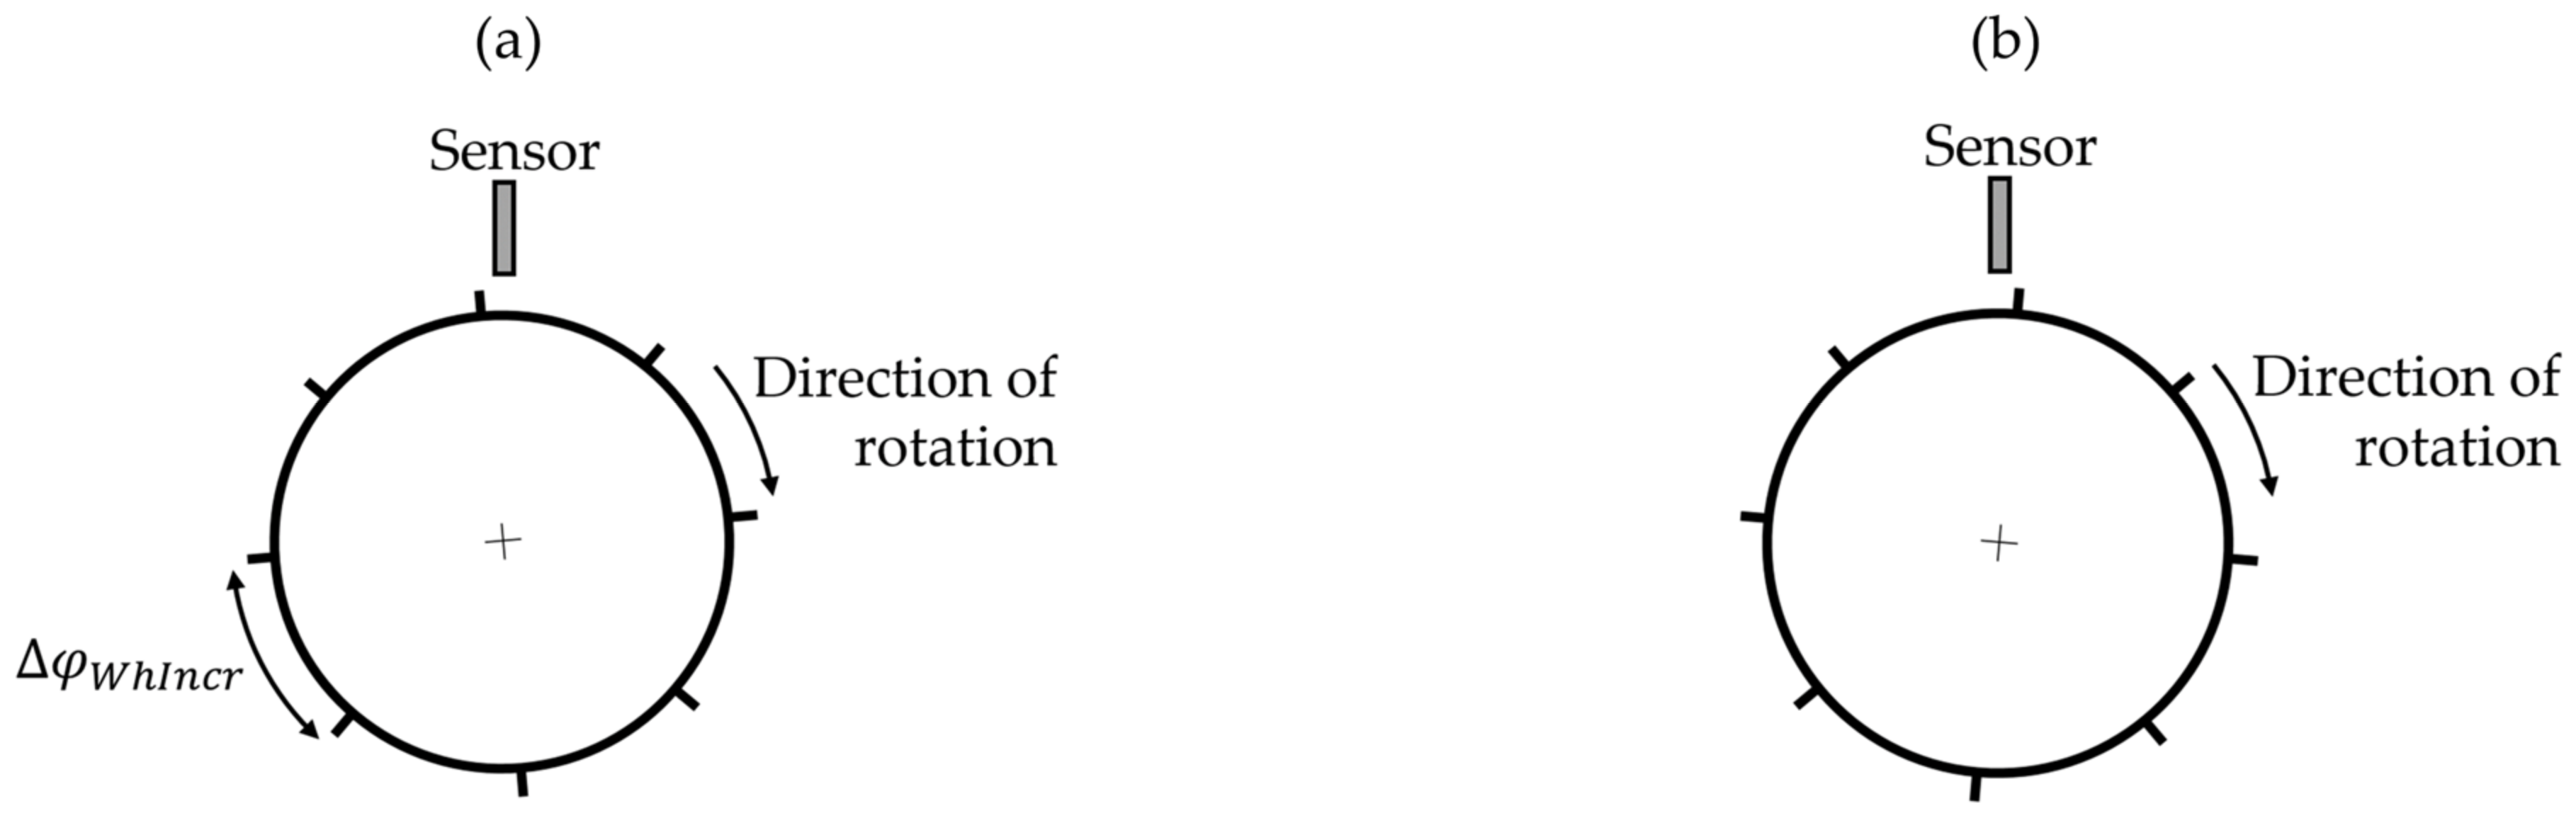
Depending on the initial position of the vehicle wheel hub at standstill, the first edge appears either early after driving-off or late.
Figure 5 shows the corresponding initial positions at standstill with an early (a) and a late (b) first edge.
By integrating the angular velocity
of the drive machine, the torsion angle
of the vehicle side shaft can be estimated as
It is assumed that, if the vehicle is at a standstill, the drive machine is not energized and thus no torque is applied. In this state, for example, the vehicle wheel brake is actuated. In this case, the side shaft is not twisted, with = 0 rad, which defines the initial conditions in Equation (3).
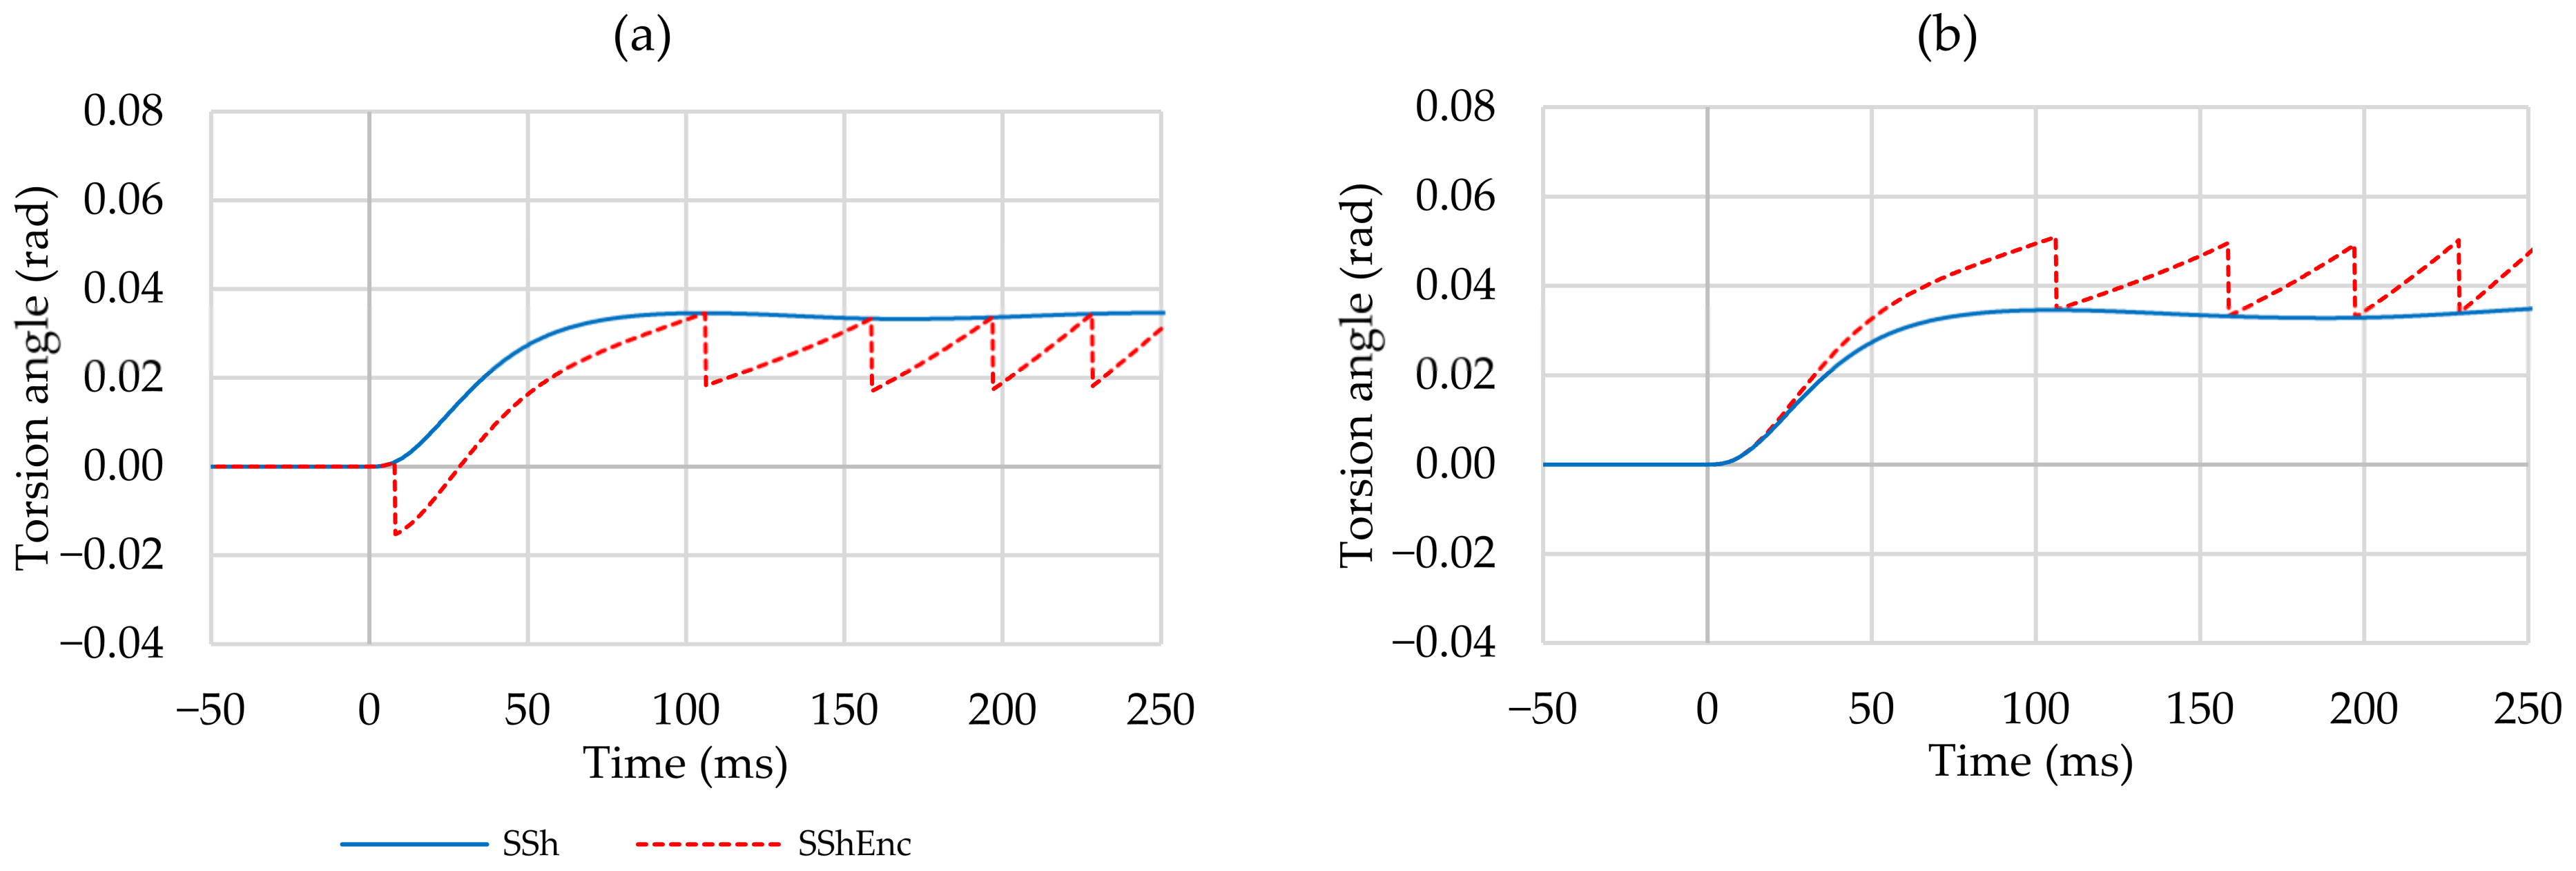
Figure 6 shows two curves of the torsion angle
of the vehicle side shaft estimated according to Equation (3) during a simulation of driving-off from standstill. The driving-off procedure starts, in each case, at the time
= 0 ms. Again, the inability to determine the precise initial position of the vehicle wheel hub affects the results.
Figure 6 shows the curves of the estimated torsion angle
at the earliest possible and the latest possible first edge according to
Figure 5. In addition,
Figure 6 presents the real torsion angle
of the vehicle side shaft determined in the simulations.
The estimated torsion angle
differs depending on the corresponding initial position of the vehicle wheel hub according to
Figure 5. Both the curves and the initial positions are shifted against each other by the maximum of the constant value
, which describes the relative rotation angle of the vehicle wheel hub between two edges.
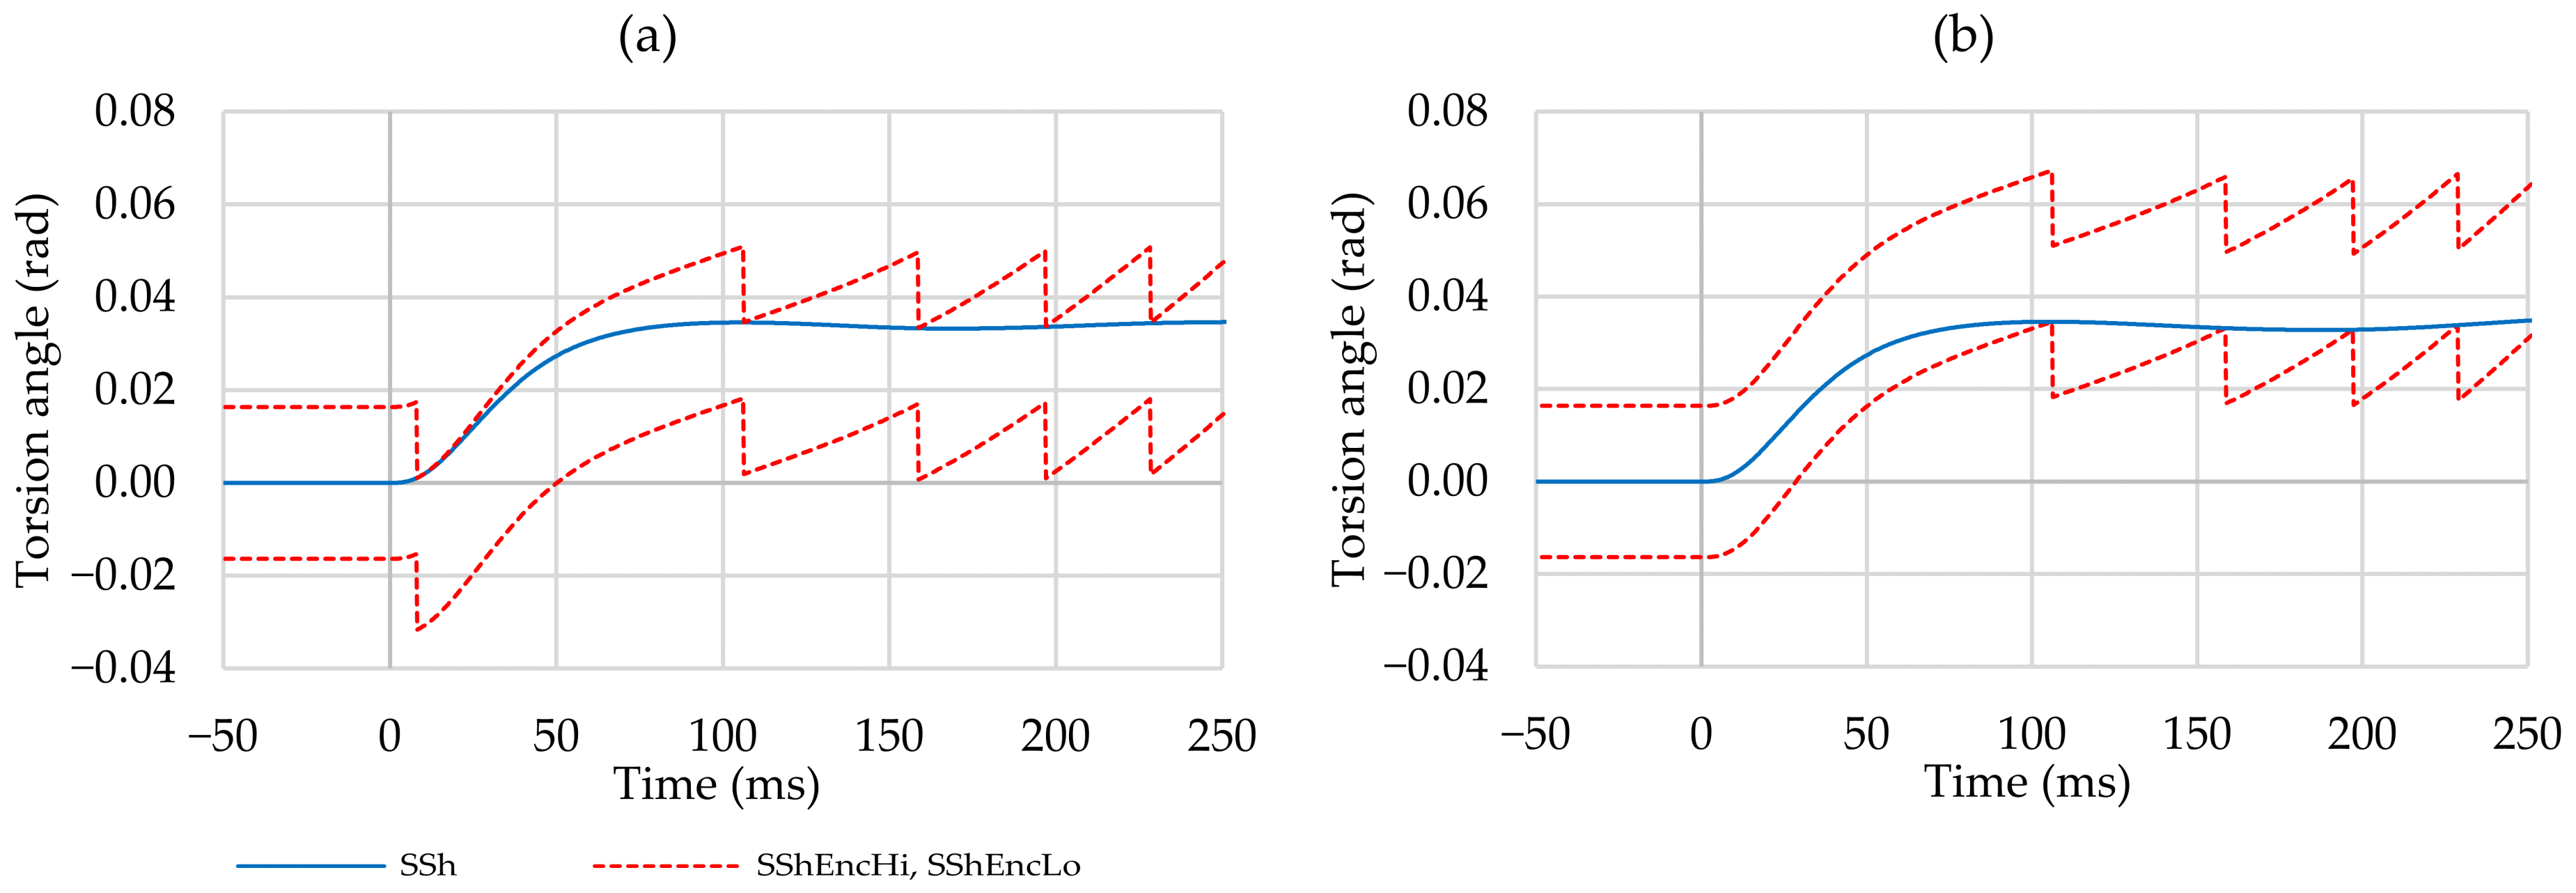
Consequently, an upper limit
and a lower limit
can be determined, between which the real torsion angle
of the vehicle side shaft occurs, via
Figure 7 shows the two limits for the torsion angle of the vehicle side shaft, along with the real torsion angle
of the vehicle side shaft in the case of the earliest possible (a) and the latest possible (b) first edge according to
Figure 5.
From the two limits for the torsion angle of the side shaft, corresponding limits for the side shaft torque can be calculated via
Thereby, only the torsional stiffness of the side shaft is considered; due to its weak influence, the torsional damping of the vehicle side shaft is neglected. An additional, constant torque component pushes the upper torque limit upward and the lower torque limit downward, for example, to account for model inaccuracies and nonlinearities effects of the real drive. A constant torque component of 30 Nm is selected for the HiL test bench.
Furthermore, it is advantageous to adjust the side shaft torque determined from the estimated torsion angle to the estimated air gap torque acting on the rotor of the drive machine for a longer driving period. For this purpose, a deviation between the two torques is fed back via a small gain factor .
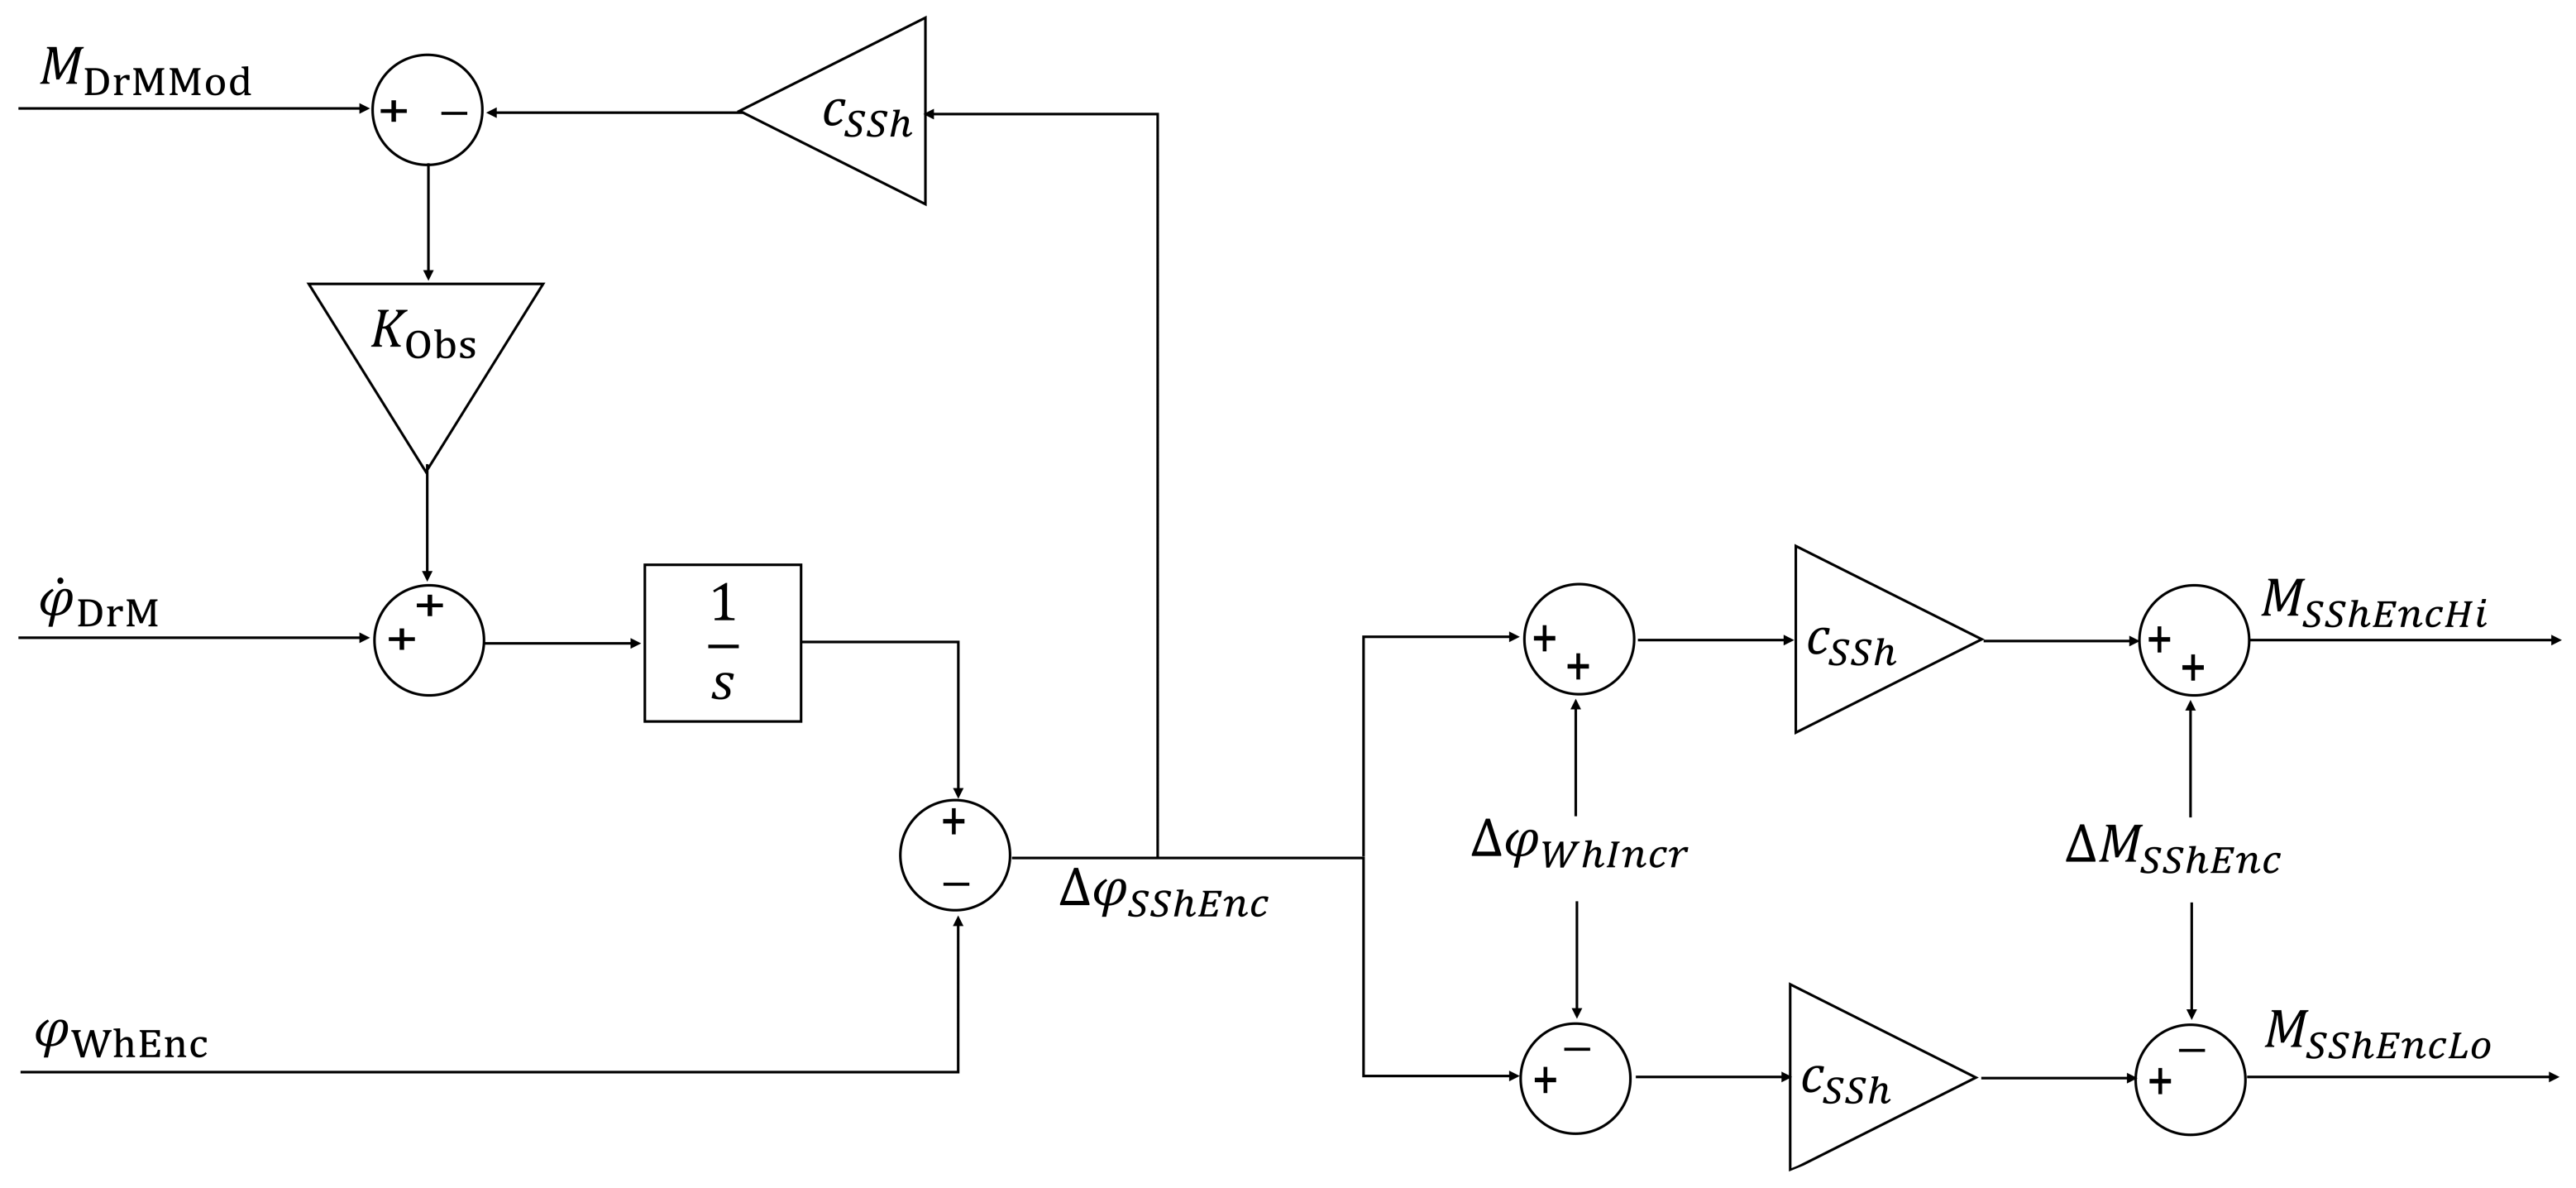
The whole process of the calculation of the upper torque limit
and the lower torque limit
for the side shaft torque is shown in
Figure 8.
The rotation angle of the vehicle wheel hub is determined by counting the edges of the incremental encoder and the rotation angle of the drive machine by integration of the angular velocity . Both rotation angles increase with the driving time. To avoid numerical problems, the two rotation angles are replaced with the torsion angle as a state variable in the real-time control of the HiL test bench.
3.3. Fault Detection by Comparison of the Side Shaft Torques
The modeled side shaft torque results from the desired torque of the drive machine .
The upper torque limit and the lower torque limit for the side shaft torque are derived from the torsion of the side shaft and are therefore significantly affected by the generated actual torque of the drive machine.
This means that two different approaches are used to determine the side shaft torque, the first based on the desired torque
of the drive machine and the second based on the actual torque
of the drive machine. If the results of the two approaches are closely related, the drive machine correctly applies the desired torque
into the actual torque
and it is assumed to operate error-free. In this case, the modeled side shaft torque
runs between the upper torque limit
and the lower torque limit
:
Failure of the condition according to Equation (8) indicates a fault in the drive machine. As a result of fault detection, the safety functions of the vehicle control system can initiate suitable countermeasures, such as switching off the drive machine.
4. Experimental Investigations on the HiL Test Bench
The described algorithms are implemented on a hardware-in-the-loop test bench to carry out realistic investigations and to detect influences such as the nonlinear stiffness of the side shaft, looseness or backlash in the drivetrain and so on. Particular attention is given to the reproduction of driving-off procedures.
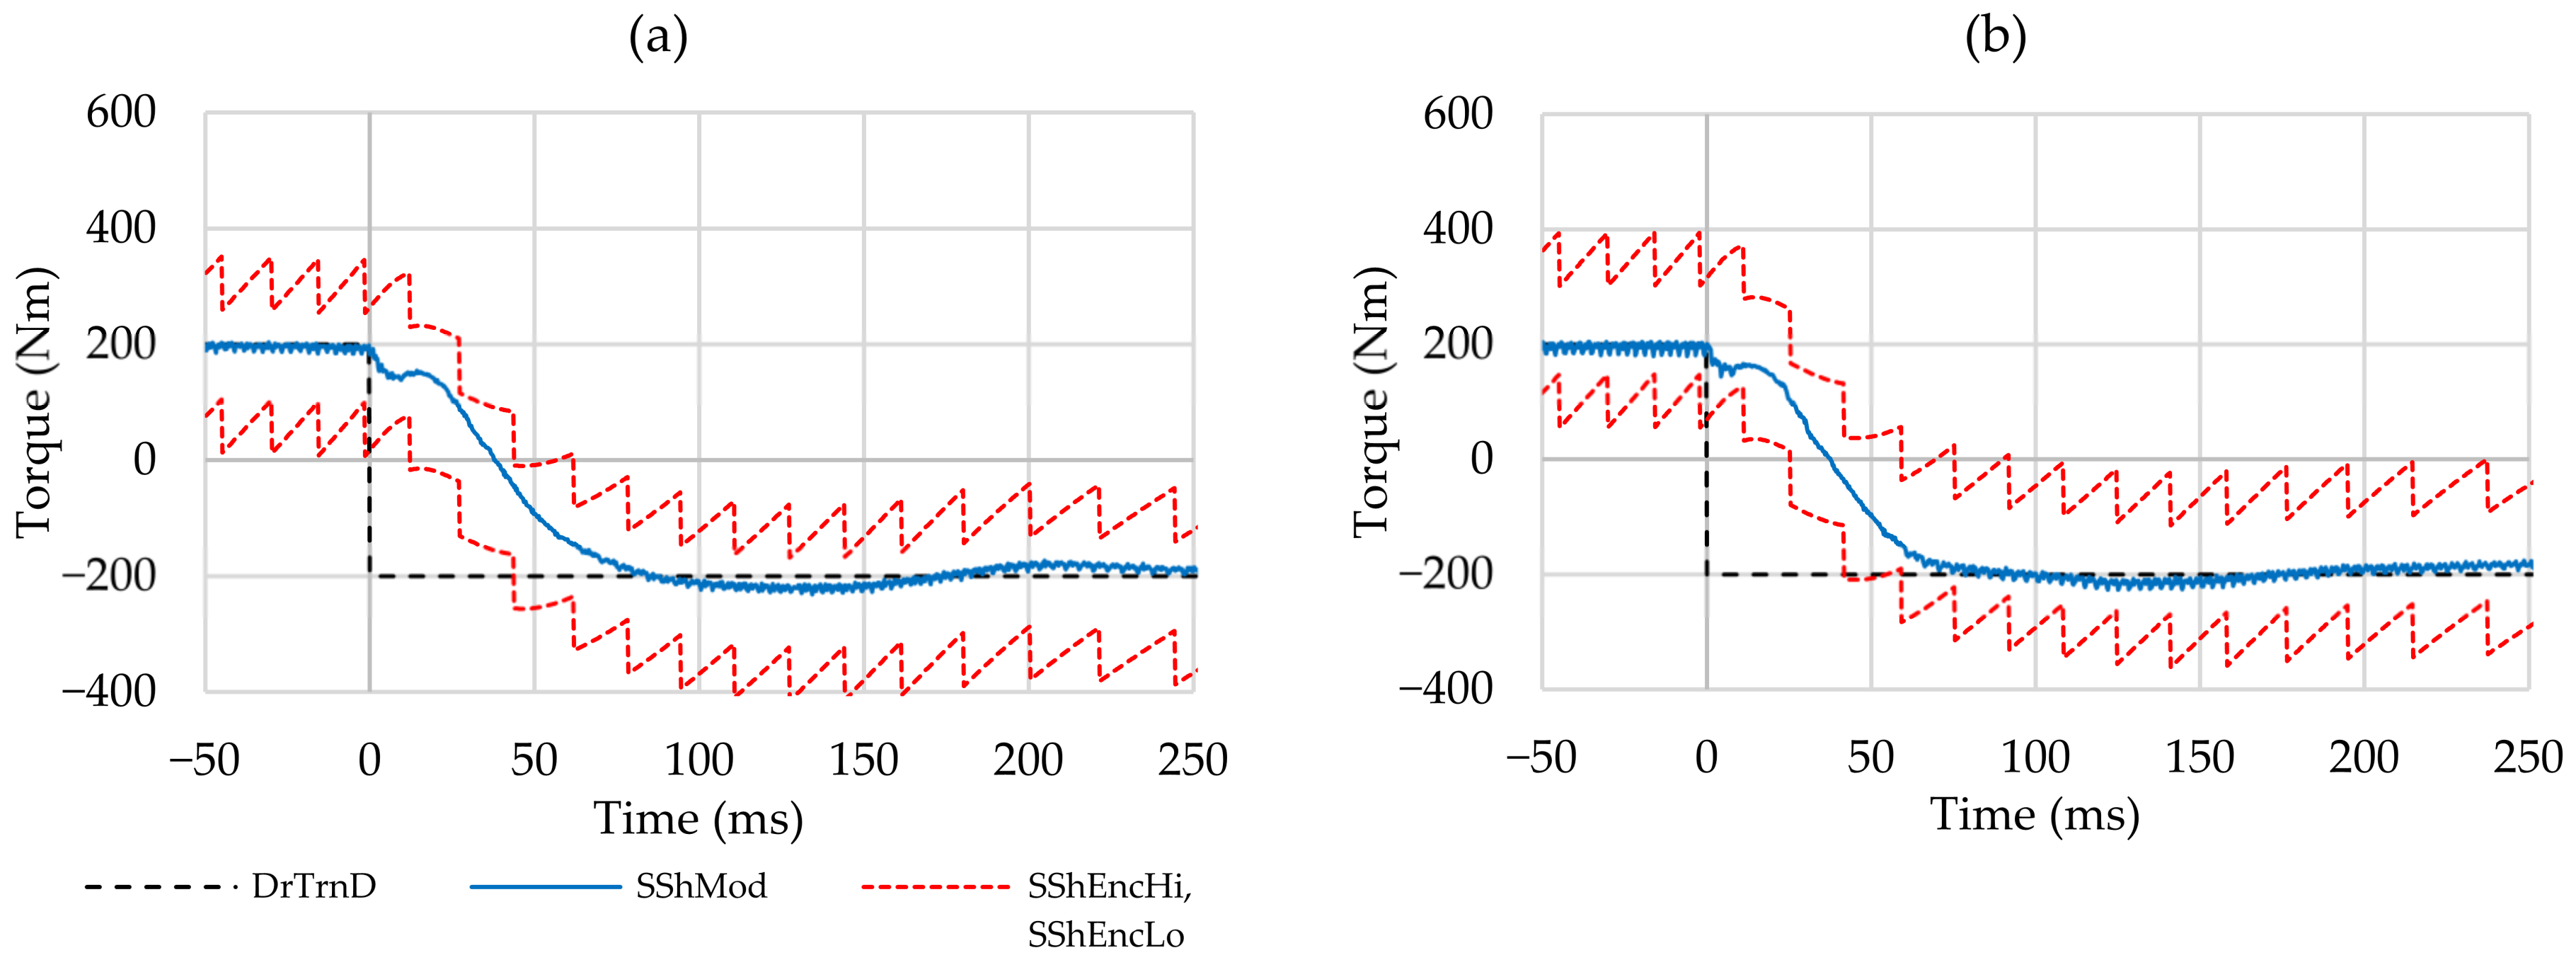
Figure 9 shows a driving-off procedure on a flat road from standstill, reproduced on the HiL test bench. To reproduce the driving-off procedure, the driver’s desired torque at the accelerator pedal jumps from 0 Nm to 200 Nm at the time
= 0 ms. This corresponds to a step change in the desired drivetrain torque
, shown in
Figure 2. To reduce jerk oscillations, this desired torque is modified by a prefilter and anti-jerk control, as described in
Section 2. The result is the desired torque
of the drive machine, which is applied to the drivetrain of the HiL test bench using the test bench drive machine.
The initial position of the emulated encoder for the determination of the rotation angle
of the vehicle wheel hub can be freely selected in the control system of the HiL test bench. In the following, the two limiting cases of the earliest possible and the latest possible first edge are specifically investigated according to
Figure 5.
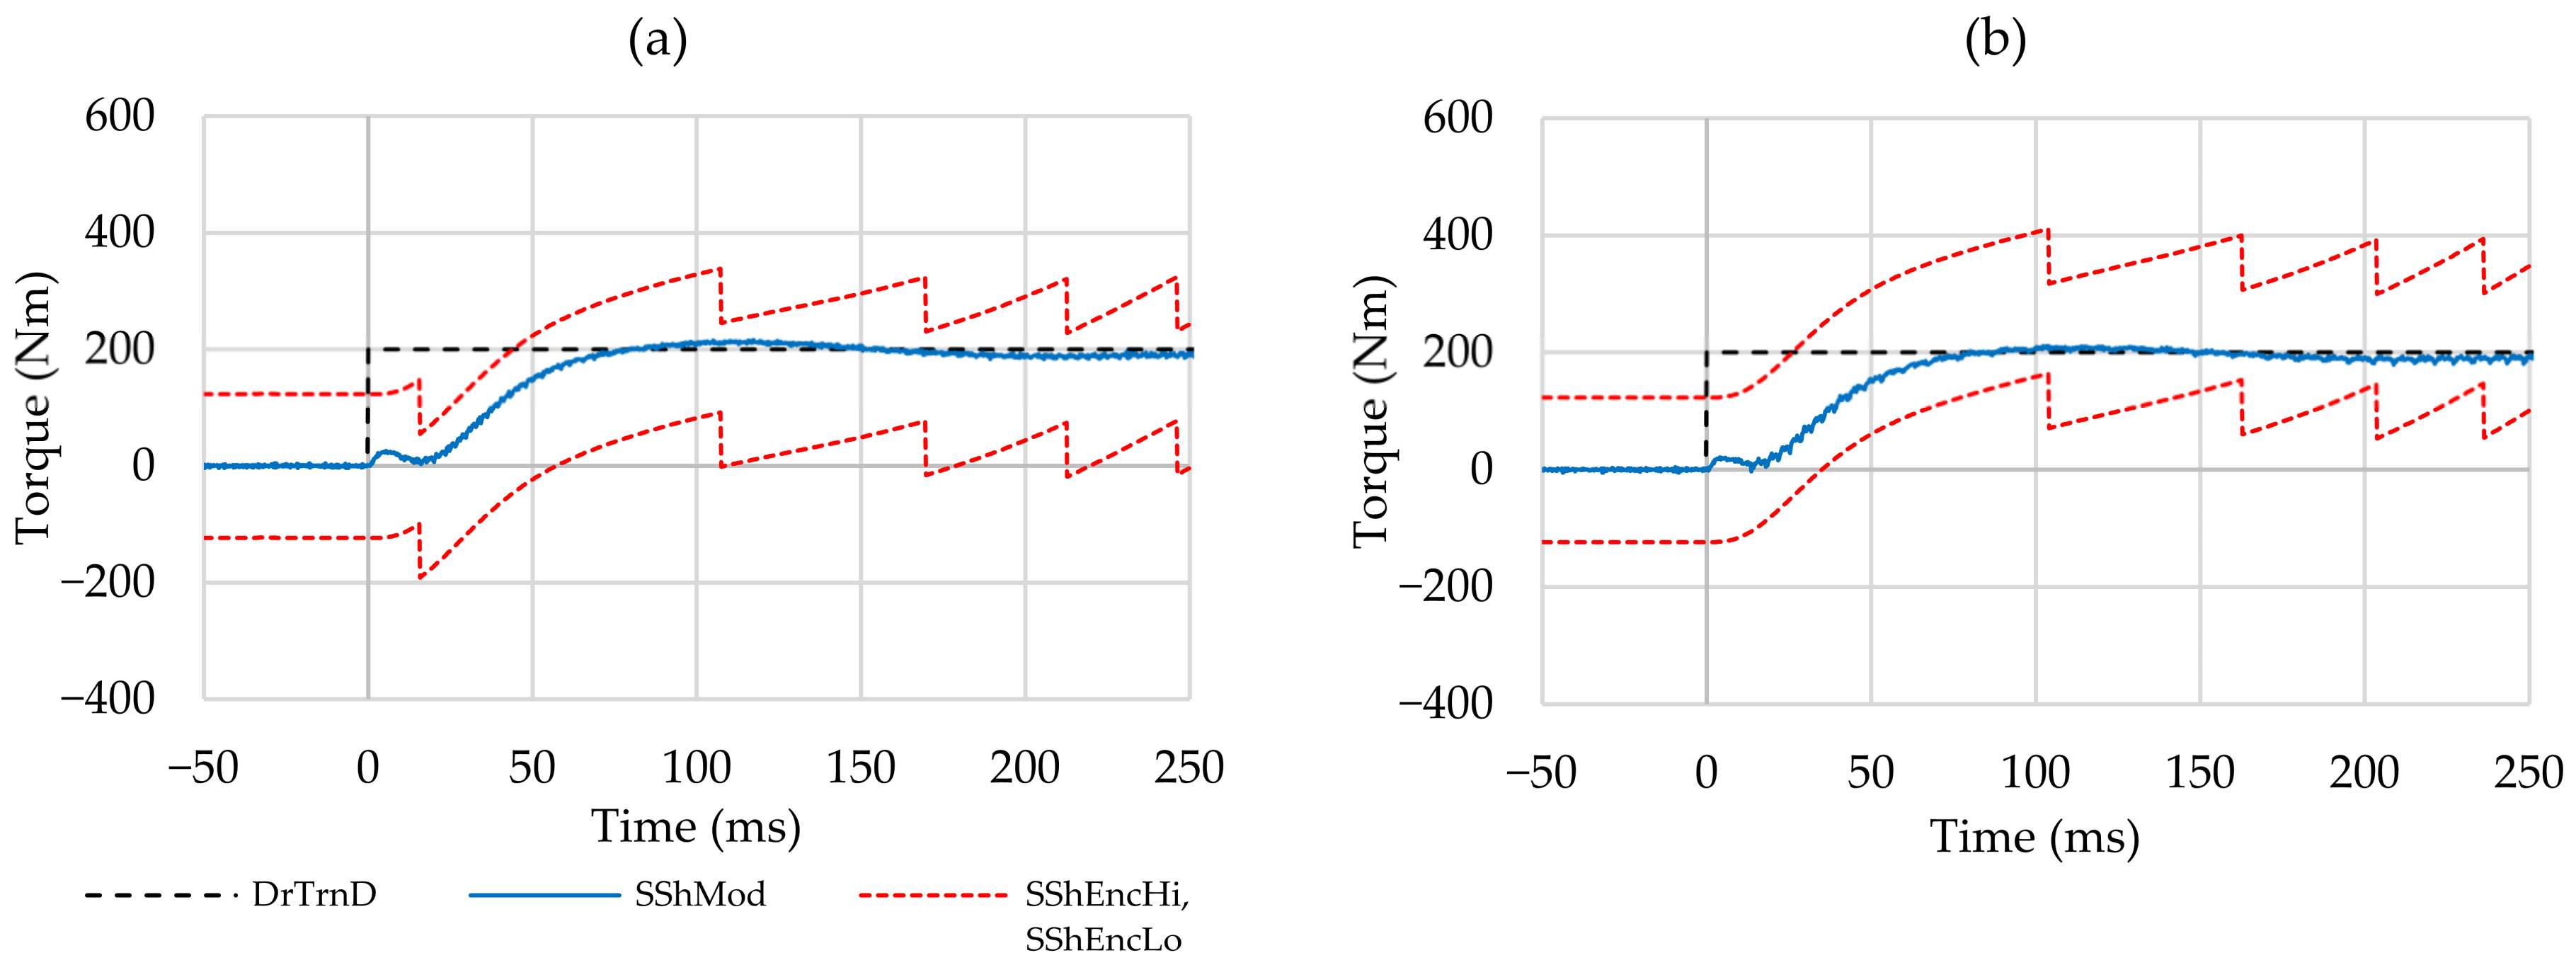
Figure 9 shows the desired drivetrain torque
, the modeled side shaft torque
and the upper and lower torque limits
and
. The modeled side shaft torque remains between the two torque limits during both driving-off procedures over the whole time period considered. Thus, the fault-free operation is correctly detected. Furthermore, the torque limits in the case of the earliest possible first edge are slightly lower than in the case of the latest possible first edge. This is caused by the dependence of the estimated torsion angle
on the respective initial position of the vehicle wheel hub according to
Figure 5.
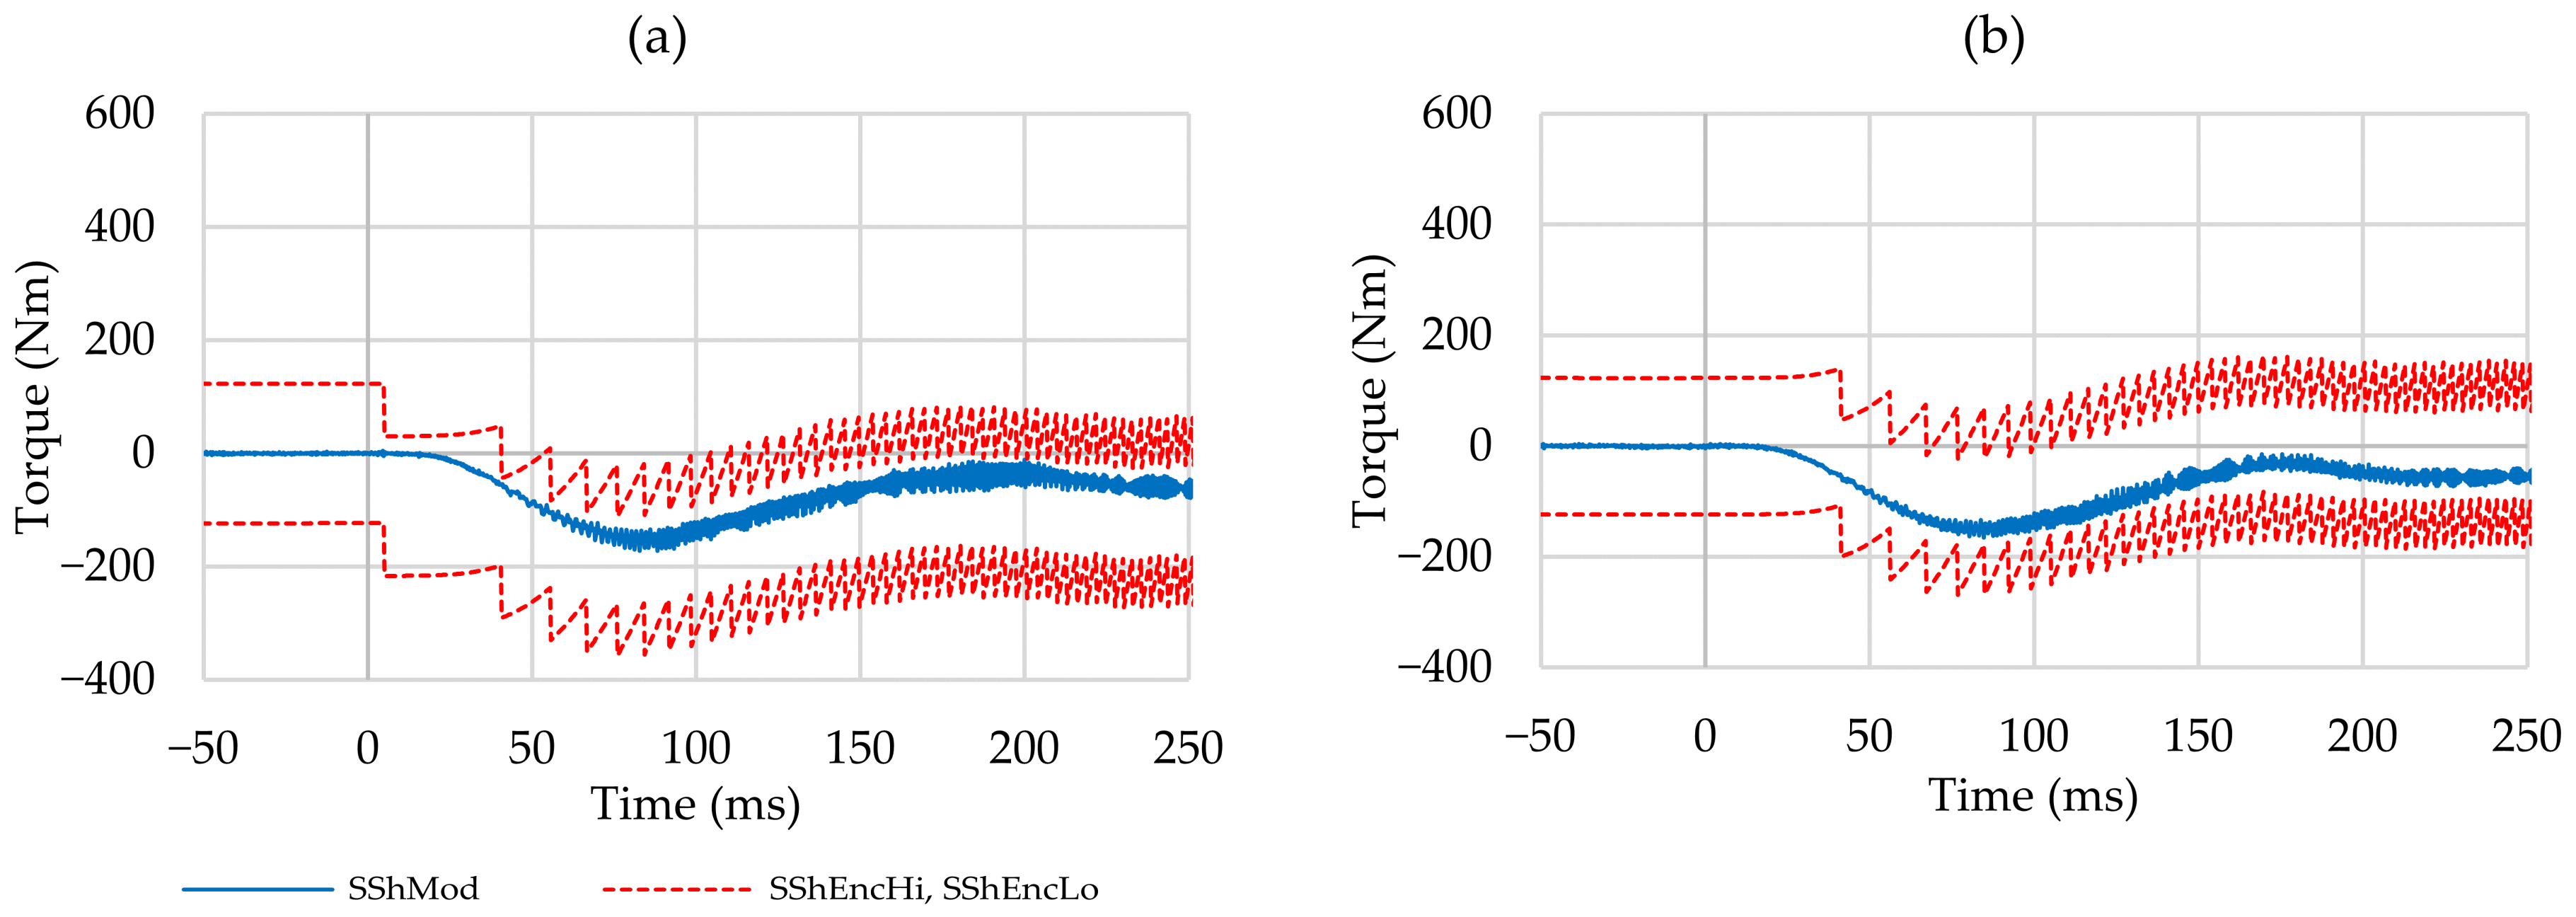
Another case of fault-free operation is shown in
Figure 10. In this case, rolling off on a downhill slope with a gradient angle of −60° is considered. This is intended to reproduce, for example, the rolling over of a curb. The simulated vehicle stands on the corresponding slope with the wheel brakes applied. At the time
= 0 ms, the brakes are released abruptly and the vehicle rolls off due to the downhill force. The desired drivetrain torque
remains at 0 Nm. Again, the two limiting cases of the first edge occurring as early as possible or as late as possible are considered for the determination of the rotation angle
of the vehicle wheel hub.
The two time curves of the modeled side shaft torque
and the upper and lower torque limits
and
in
Figure 10 show that the modeled side shaft torque also remains between the two torque limits in this case. Thus, fault-free operation is also correctly detected here. Likewise, the two torque limits in the case of the earliest possible first edge are slightly lower than those in the case of the latest possible first edge.
According to [
2], the unintended movement of a vehicle from a standstill is especially safety-critical, as traffic participants may suffer fatal and life-threatening injuries as a result. Thus, the safety goal is to “avoid unintended self-acceleration”. Therefore, a corresponding fault case involving the undesired torque buildup of the drive machine is considered here. For this purpose, the vehicle is assumed to stand still on a flat road without the brakes applied, and the driver does not initiate any desired torque over the whole time period. The desired drivetrain torque
is therefore 0 Nm over the whole time period. However, the drive machine is to receive a faulty input signal so that, at time
= 0 ms, the torque jumps from 0 Nm to 200 Nm.
In order to reproduce the fault behavior on the HiL test bench, the signal flow between the output of the drivability function and the Dynamics Drive Machine block is interrupted, as shown in
Figure 11. Thus, the anti-jerk control has no effect. The Dynamics Drive Machine block receives a new input signal with a torque error
. The inputs of the safety function remain unchanged compared to fault-free operation. The two limiting cases of the first edge beginning as early as possible and the first edge beginning as late as possible are again considered for the determination of the rotation angle
of the vehicle wheel hub. The time curves of the torque error
, the modeled side shaft torque
and the upper and lower torque limits
and
for both cases are shown in
Figure 12.
In both cases, the time curves illustrate that the modeled side shaft torque is beyond the torque limit at several times. In the case of the earliest possible first edge, this is, for the first time, at = 23 ms for approximately 58 ms and in the case of the latest possible first edge from = 14 ms for approximately 70 ms. Accordingly, the criterion for the detection of fault-free operation according to Equation (8) is not fulfilled in these time periods. Furthermore, due to the high risk of injury, such a fault event must be detected quickly and appropriate countermeasures must be initiated. A violation of the criterion according to Equation (8) for more than 50 ms is therefore sufficient, which leads, for example, to the safe deactivation of the drive machine.
5. Algorithm Extension to Consider Parameter Variations during Driving Operation
Highly dynamic driving maneuvers require accurate knowledge of the dynamic characteristics of the drivetrain. For example, for the calculation of the modeled side shaft torque , the dynamics of the air gap torque of the drive machine are approximated in the model with a first-order lag element with the time constant .
Figure 13 shows the measurement results on the HiL test bench for a dynamic change from driving to regenerative braking in fault-free operation. The desired drivetrain torque
from
Figure 2 is changed abruptly from 200 Nm to −200 Nm. In these measurements, the used time constant
= 10 ms reproduces the dynamics of the air gap torque of the real drive machine well. Equation (8) is satisfied; therefore, fault-free operation is concluded.
If the used time constant does not reproduce the dynamics of the real drive machine well, Equation (8) may not be satisfied temporarily, although fault-free operation is present.
Driving operations corresponding to
Figure 13 can occur at various vehicle velocities and thus angular velocities
of the drive machine and are associated with a variation in the charging or discharging power, which also leads to a change in the battery voltage. The battery voltage typically limits the maximum output voltage of the traction inverter, but the required voltage of an electric machine increases with increasing velocity and current demands. Limiting the output voltage can result in a slower rise or fall in the drive machine’s stator current, as well as the corresponding air gap torque [
34].
Thus, the dynamics of the air gap torque of the real drive machine depend on its operating point, especially on the angular velocity
and the battery voltage [
35].
Moreover, especially in electric vehicle drives, the parameters of the drive machine can vary significantly during operation due to the harsh thermal environment and magnetic saturation effects [
36].
In order to take these effects into account, the modeled side shaft torque is replaced by two limits, and . For this purpose, the estimation of the dynamics of the air gap torque of the drive machine is carried out using two time constants, and . The highest dynamics are specified with and the lowest dynamics are specified with over all possible operating points of the drive machine. For the investigations presented, the time constants = 5 ms and = 25 ms are selected.
From the desired torque of the drive machine
, two limits
and
can be determined for the air gap torque acting on the rotor of the drive machine. As a worst-case estimate, the upper limit
is assumed to increase with the highest dynamics and to decrease with the lowest dynamics. The lower limit
, on the other hand, increases with the lowest dynamics and decreases with the highest dynamics [
24]. This results in the following equations:
Figure 14 shows the calculation of the two limits
and
for the modeled side shaft torque using the two limits
and
for the air gap torque acting on the rotor of the drive machine, as a supplement to
Figure 3.
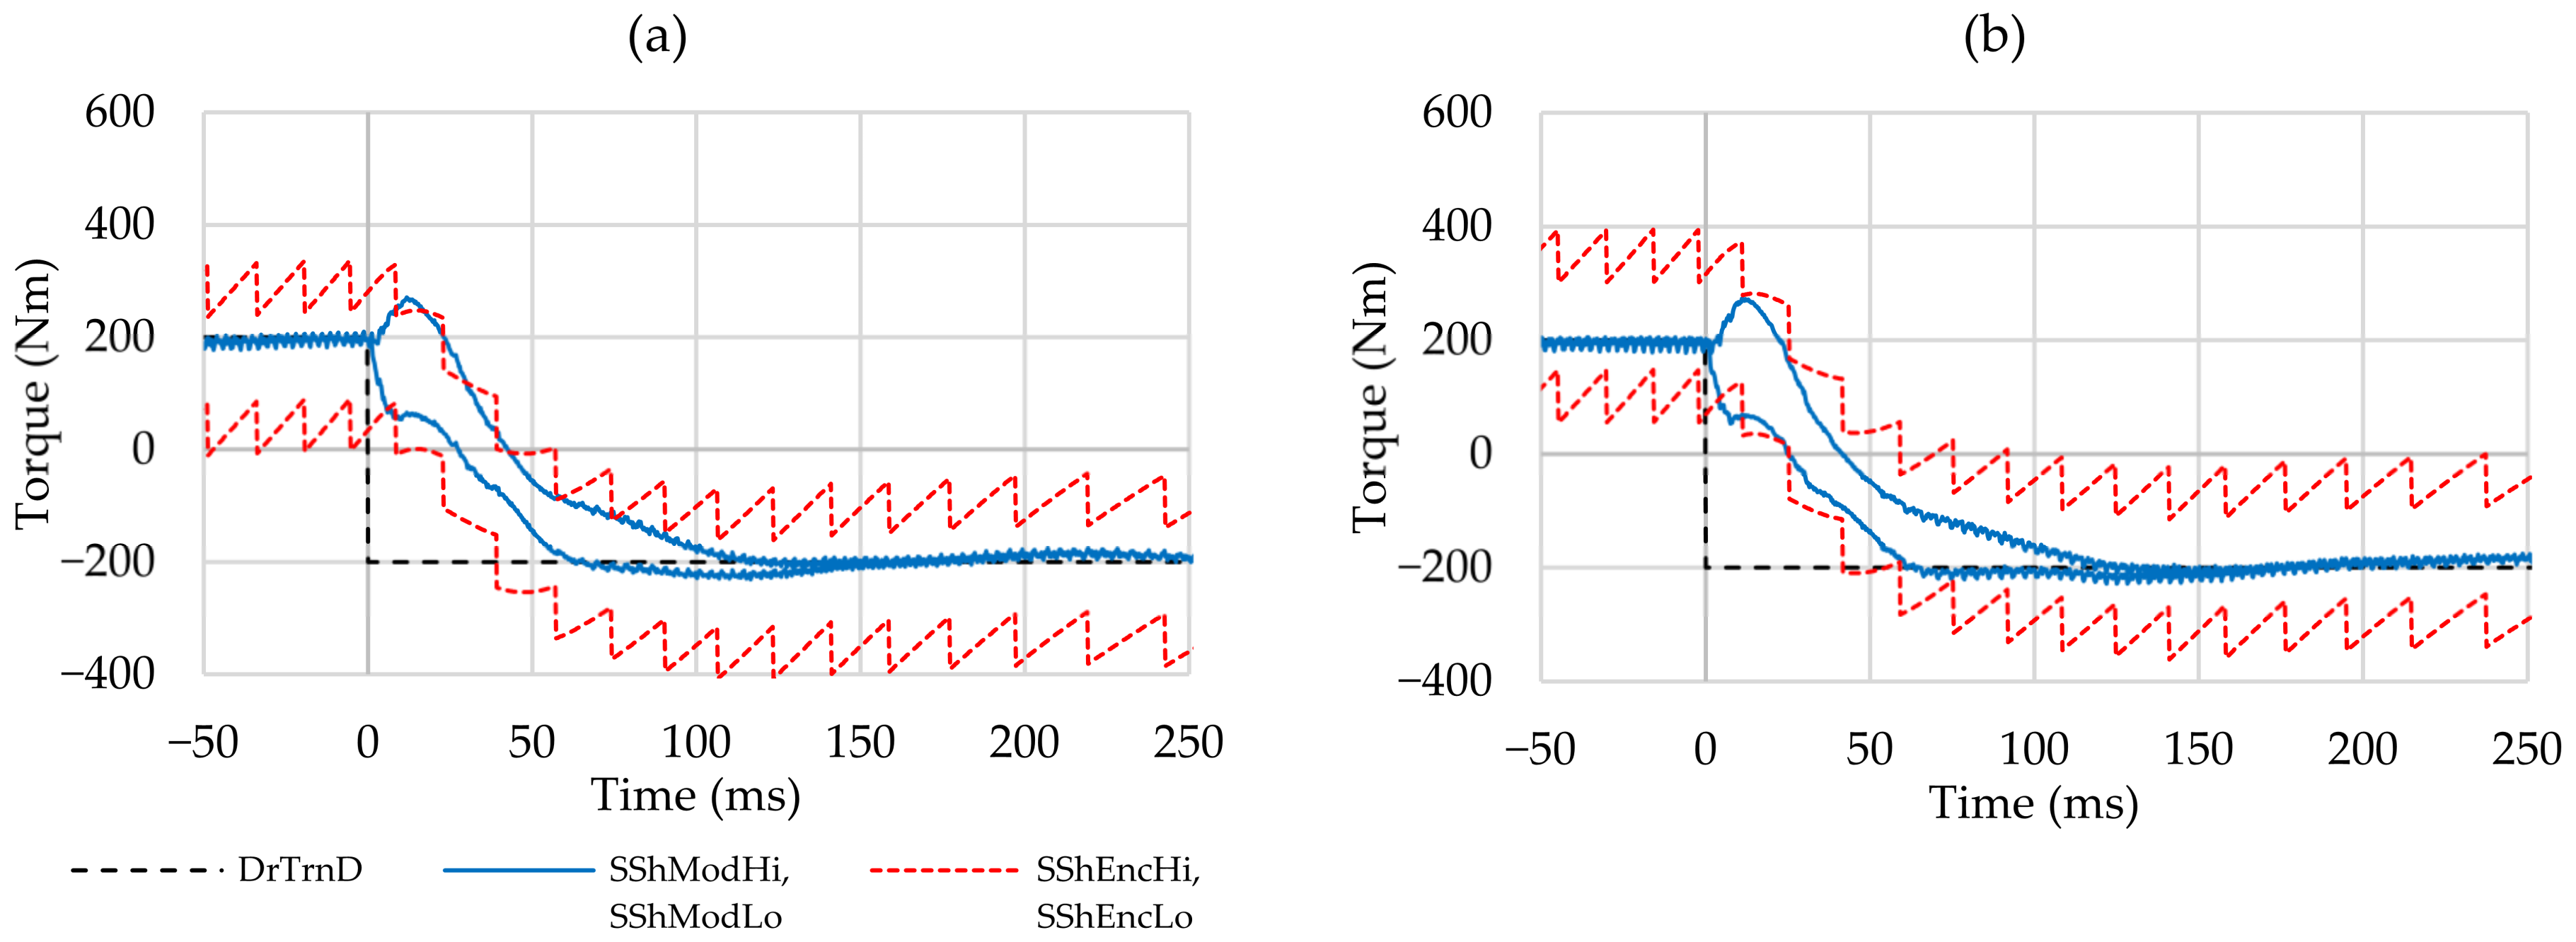
Figure 15 shows the results of the HiL test bench measurements for a dynamic change from driving to regenerative braking. These take place shortly after driving off, with the first edge as early as possible as well as the first edge as late as possible, for the determination of the rotation angle
of the vehicle wheel hub, corresponding to
Figure 13. Again, there is a fault-free case and the desired drivetrain torque
changes abruptly from 200 Nm to −200 Nm. There are two bands to be seen. The first band lies between the two limits
and
for the modeled side shaft torque; the second band is defined by the upper torque limit
and the lower torque limit
for the side shaft torque resulting from the torsion of the side shaft. Both bands overlap at least partially, in both cases in
Figure 15, which serves as a criterion for fault-free operation.
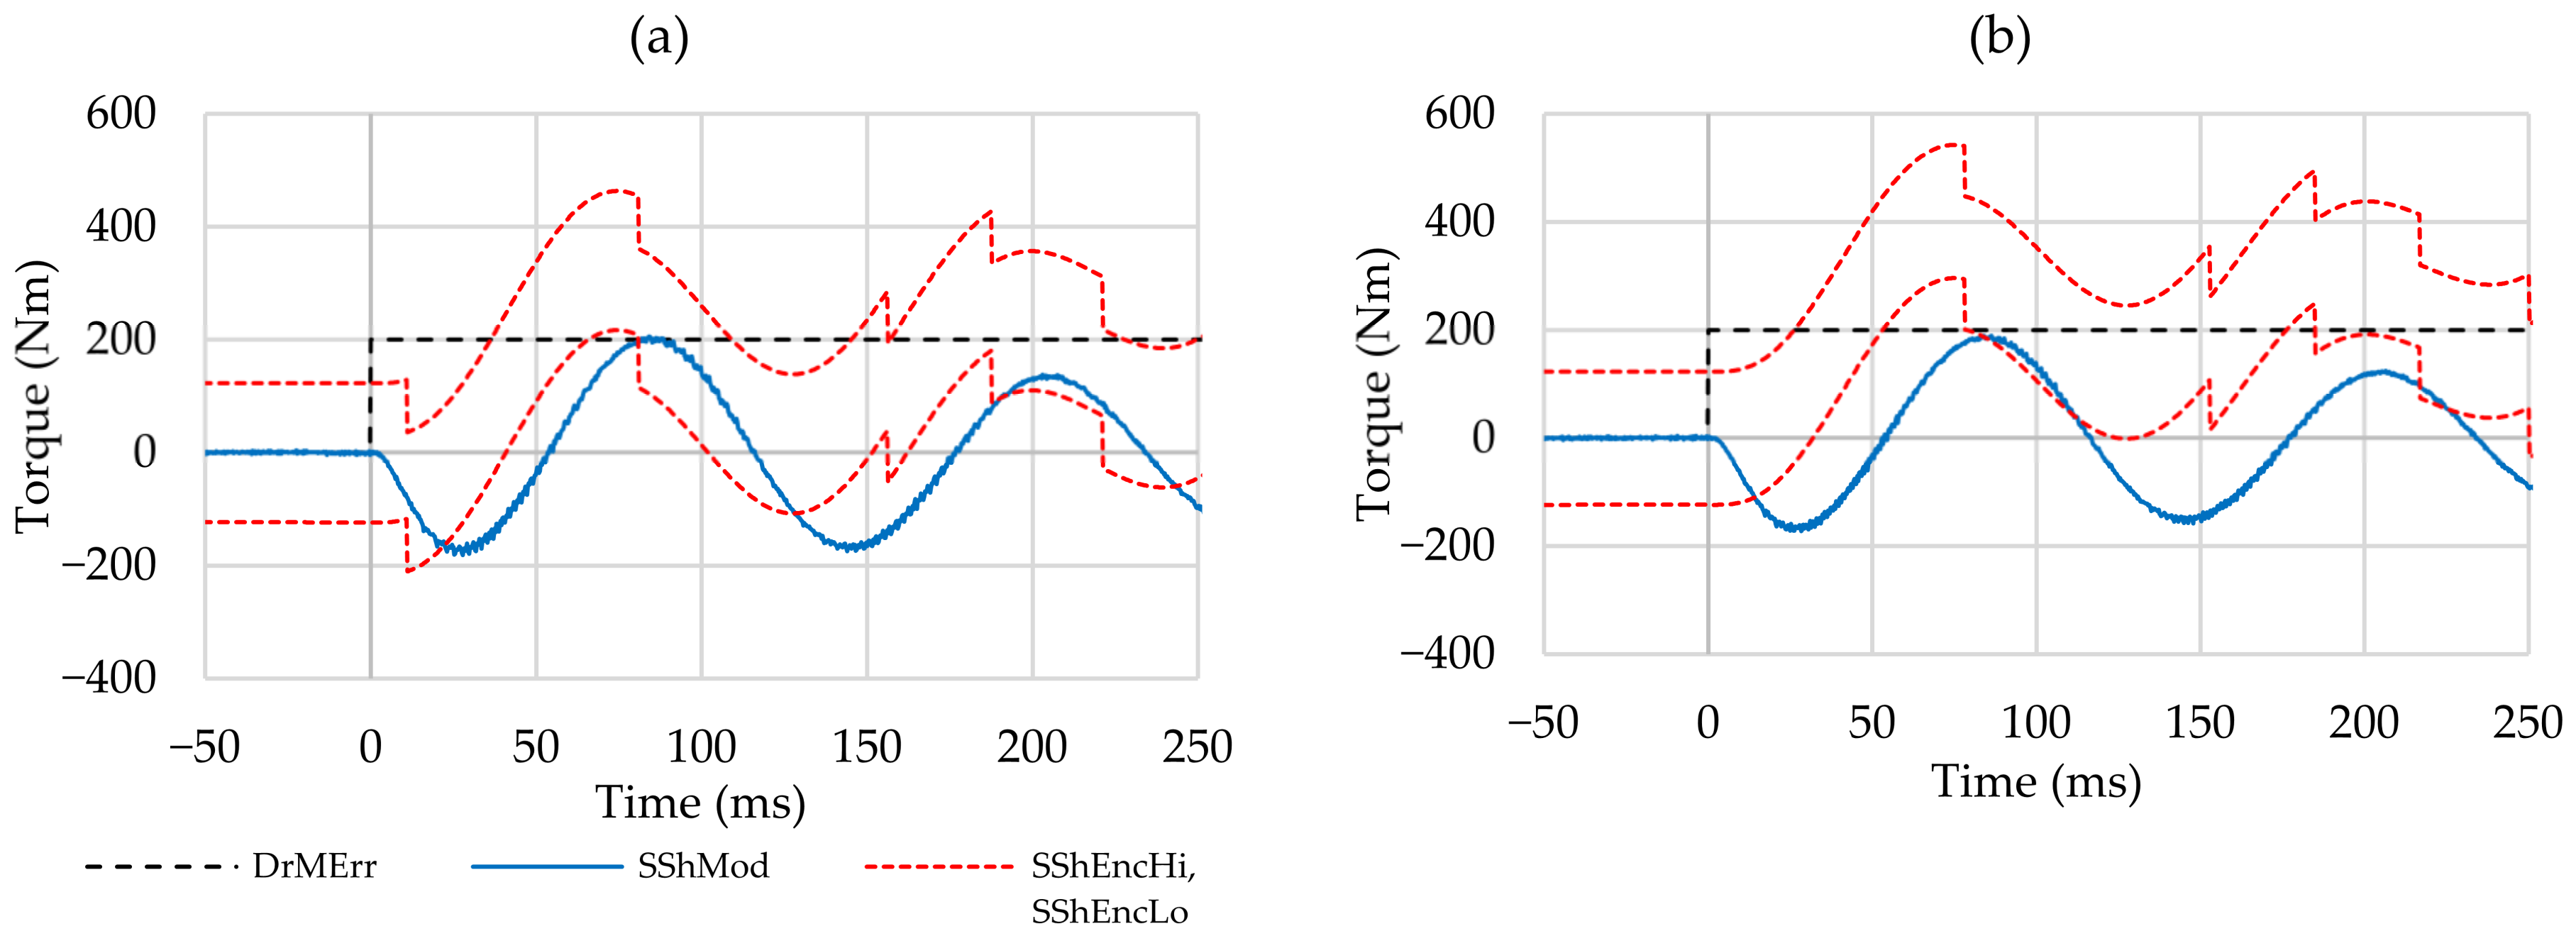
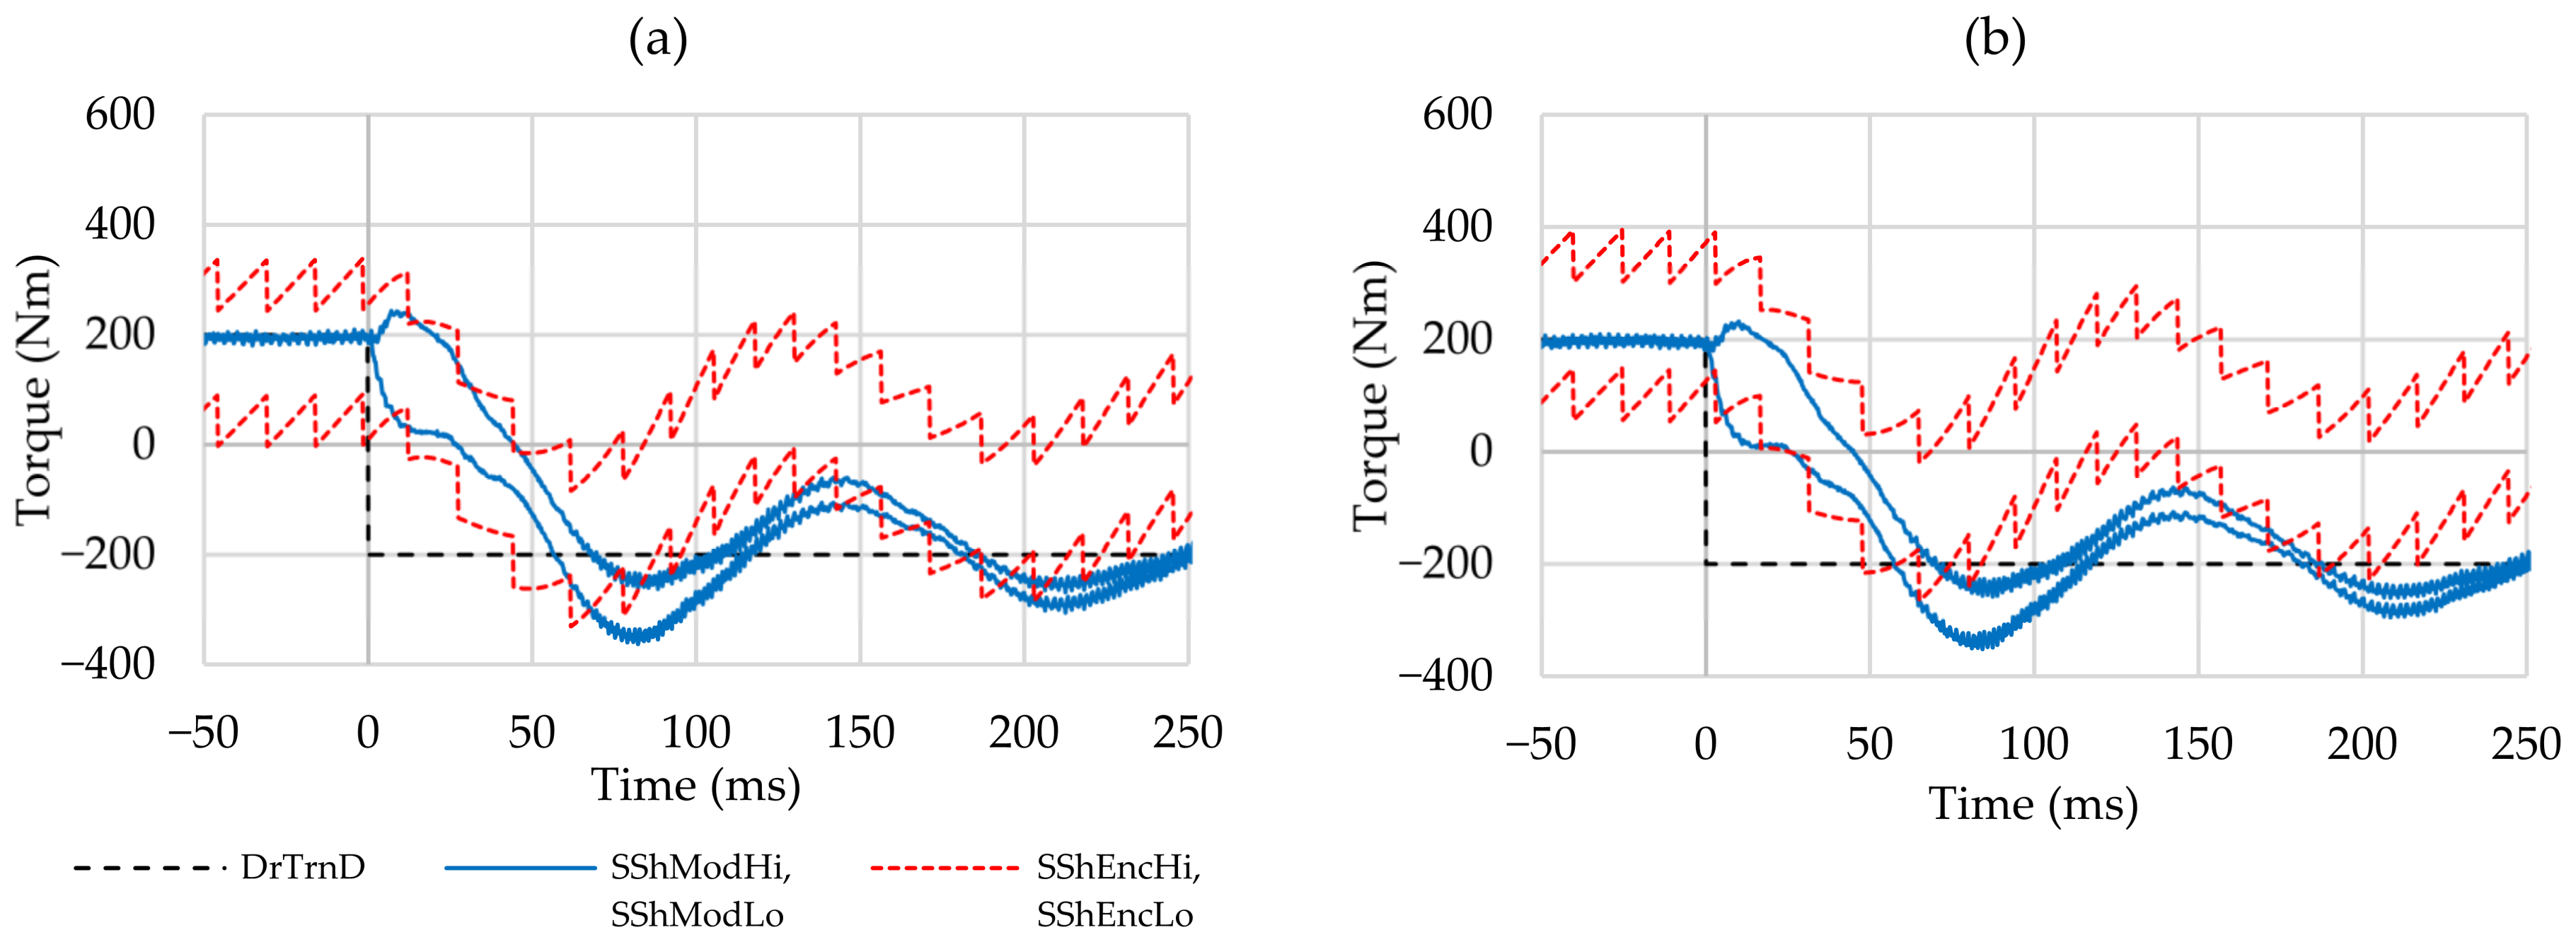
Figure 16 shows the results of the HiL test bench measurements for a dynamic change from driving to regenerative braking shortly after driving off, with the first edge beginning as early as possible and the first edge beginning as late as possible, in order to determine the rotation angle
of the vehicle wheel hub, as shown in
Figure 15. Again, the desired drivetrain torque
changes abruptly from 200 Nm to −200 Nm. However, a fault event is reproduced here in that the air gap torque
acting on the rotor of the real drive machine is permanently set to 0 Nm after dropping from 200 Nm to 0 Nm for the first time. This reproduces the loss of the air gap torque during the driving operation—for example, due to a defect. The air gap torque initially drops from 200 Nm to 0 Nm and then remains at 0 Nm, although the desired drivetrain torque
jumps to −200 Nm. Consequently, the modification of the desired drivetrain torque
by the anti-jerk control also has no effect. This fault scenario is problematic as the drivetrain fails to generate the required regenerative braking torque. The safety goal “avoid unintended insufficient deceleration (underbraking)” is thus violated. The fault event must be detected in order to compensate for the missing braking torque of the drivetrain—for example, by a friction brake intervention.
Figure 16 shows that both bands described above (first band between the limits
and
for the modeled side shaft torque; second band between the torque limits
and
) no longer overlap from
t = 83 ms for approximately 60 ms in the case of the earliest possible first edge, as well as from
t = 73 ms for approximately 84 ms for the latest possible first edge. The missing complete or partial overlap is used as a criterion to detect a fault so that suitable countermeasures can subsequently be initiated. In the case described, the countermeasures consist of the safe deactivation of the drive machine and the takeover of the braking torque by the vehicle friction brakes, for example.
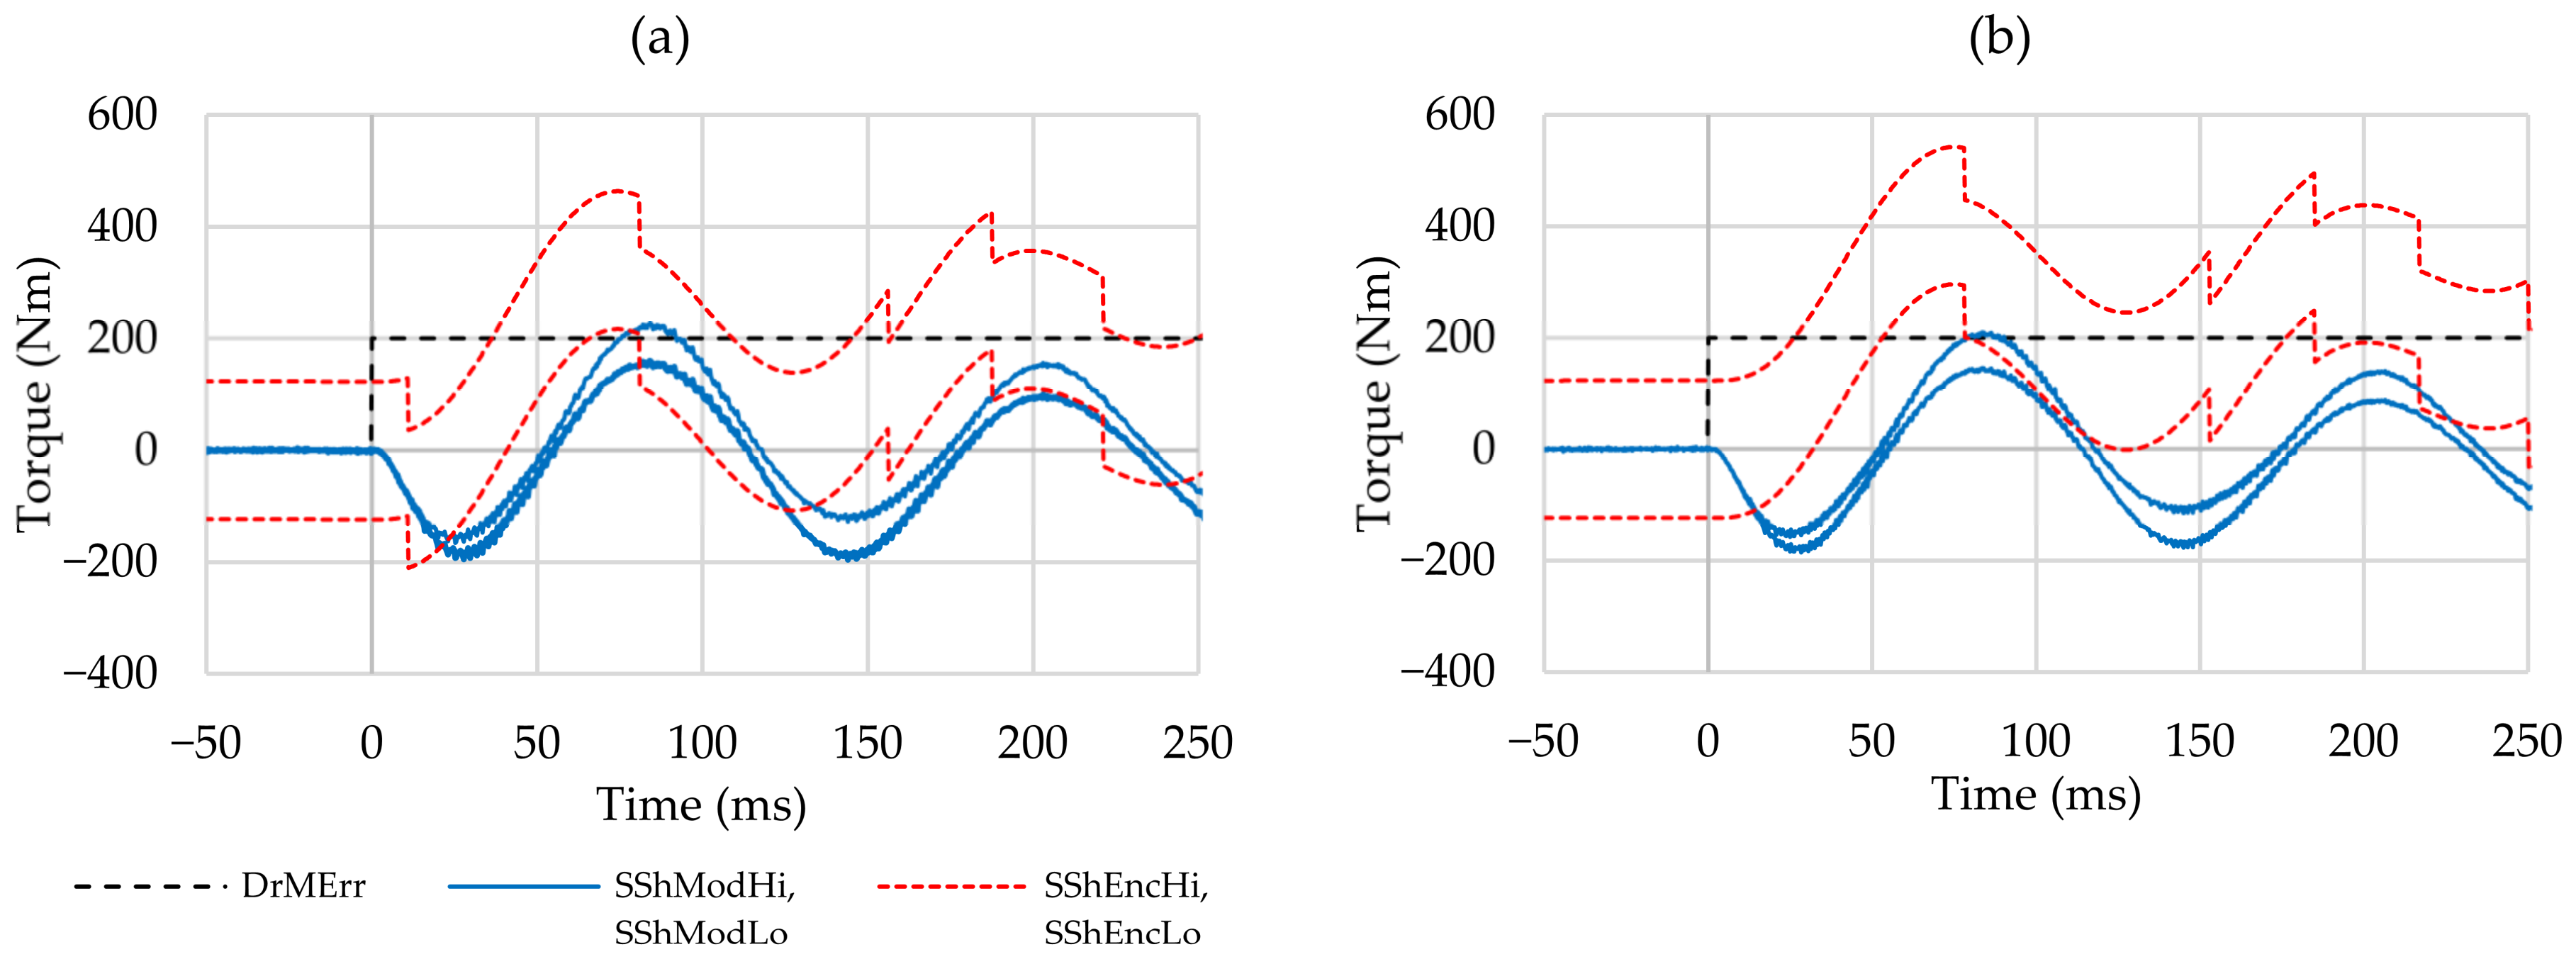
Figure 17 shows a fault event at standstill for the two limit cases for the determination of the rotation angle
of the vehicle wheel hub, corresponding to
Figure 12. As a result of the fault, the drive machine again generates a jump in the torque
from 0 Nm to 200 Nm, although there is a desired drivetrain torque
of 0 Nm.
Figure 11 shows the signal flows when reproducing this fault on the HiL test bench. In contrast to
Figure 12,
Figure 17 shows the first band between the limits
and
for the modeled side shaft torque.
Again, it is shown that a missing overlap of the two bands described above is suitable as a criterion for fault detection. With the earliest possible first edge, this is the case from = 24 ms for approximately 55 ms, with the latest possible first edge from time = 15 ms for approximately 64 ms.


