Article

Research on Collision Avoidance Systems for Intelligent Vehicles Considering Driver Collision Avoidance Behaviour

1
College of Mechanical Engineering, Jiangsu University of Technology, Changzhou 213001, China
2
College of Automobile and Traffic Engineering, Jiangsu University of Technology, Changzhou 213001, China
3
Equipment Research Institute, Beijing 102202, China
4
Department of Mechanical Engineering, City University of Hong Kong, Hong Kong 999077, China
*
Authors to whom correspondence should be addressed.
World Electr. Veh. J. 2023, 14(6), 150; https://doi.org/10.3390/wevj14060150
Submission received: 10 May 2023 / Revised: 29 May 2023 / Accepted: 1 June 2023 / Published: 6 June 2023
(This article belongs to the Special Issue Design Theory, Method and Control of Intelligent and Safe Vehicles)

Abstract

:
In this paper, a new collision avoidance switching system is proposed to address the lack of adaptability of intelligent vehicles under different collision avoidance operating conditions. To ensure the rationality of the collision avoidance switching strategy for intelligent vehicles, the NGSIM road dataset is introduced to analyse the driver’s collision avoidance behaviour, and a two-layer fuzzy controller considering the overlap rate is established to design the collision avoidance switching strategy. In order to achieve real-time collision avoidance system activation, a lane change collision avoidance model based on MPC control is also developed. Finally, a simulation environment was created using Matlab/CarSim for simulation verification. The simulation results show that the collision avoidance switching system is more responsive and has a shorter start-up distance and is more adaptable to different driving conditions.

1. Introduction

With China’s rapid economic development, the number of motor vehicles and drivers has increased dramatically, making traffic safety an increasingly prominent issue and a serious challenge in today’s society. Although the number of traffic fatalities has not seen a year-on-year increase, the latest report from the National Bureau of Statistics still puts the number of traffic fatalities at 62,218 in 2021 [1]. Collisions are consistently the highest number of traffic accidents and pose a great threat to the safety of people’s lives and property. In order to mitigate and avoid collisions, the field of automotive engineering has been dedicated to conducting relevant research [2,3]. Active collision avoidance systems help to improve driving safety and perform a key role in collision avoidance [4,5]. In the field of active safety, the primary consideration is the perception and processing of the traffic environment, and at the same time, many researchers at home and abroad have proposed many rich and excellent sensor technologies and image processing techniques [6,7]. In the field of intelligent vehicle collision avoidance control, there are generally two types: longitudinal braking collision avoidance and steering lane change collision avoidance. Longitudinal braking collision avoidance control can avoid collisions by reducing the vehicle speed but it requires a large safety distance to implement the braking behaviour [8,9]. In braking collision avoidance control, if the vehicle in front brakes or slows down suddenly, the vehicle may not be able to avoid an accident because the following distance is too small [10]. Compared with braking collision avoidance control, steering collision avoidance control requires smaller longitudinal safety distances under conditions, such as high relative speeds and low road adhesion coefficients, and its ability to avoid collisions is better [11]. Chen Xiang et al. [12] proposed an adaptive collision avoidance control based on a topological decision method with better adaptability to road adhesion coefficient and improved collision avoidance control by switching the braking strategy, but only a single braking collision avoidance method was considered. Yan Mingyue et al. [13] proposed a new cooperative steering and braking collision avoidance control strategy, which provided three collision avoidance schemes under emergency avoidance conditions through function assignment and multi-objective fuzzy decision-making, which greatly improved the stability and safety of the vehicle, but did not consider the influence of the minimum lateral distance required for the vehicle to avoid the vehicle in front and the percentage of the vehicle width, i.e., the overlap rate, on the collision avoidance switching strategy. Meng Lin et al. [14] conducted an in-depth analysis of drivers’ collision avoidance behaviour under realistic traffic hazard conditions. The study used logistic regression analysis on real road data to summarise the factors that influence drivers to take lane change to avoid collisions, and the results showed that the overlap rate factor has an important reference value. Li Lin et al. [15] investigated drivers’ braking and steering collision avoidance limits and compared the applicability of the two collision avoidance methods and the influence of factors, such as road adhesion coefficient and overlap rate. It was concluded that steering collision avoidance was more advantageous than braking collision avoidance under operating conditions, such as high initial vehicle speed, low road adhesion coefficient, and low overlap rate. The above two papers did not carry out further simulation validation based on the findings. In contrast, the NGSIM dataset, as a publicly available and authoritative traffic trajectory dataset, is often studied in depth by domestic and international scholars in the automotive and transportation fields. Hussain Qinaat [16] et al. used this dataset to study the impact of auxiliary lanes on traffic. Qu Dayi [17] and others have used this dataset to study vehicle trajectory prediction in the field of autonomous driving.
In order to solve the problem that the collision avoidance systems in the above literature do not consider different driving conditions well, and to further improve the collision avoidance effect of active safety systems, in this paper, the NGSIM dataset is used to analyse the driving behaviour of drivers under different emergency conditions, and a two-layer fuzzy controller is used to design a crash avoidance switching strategy to simulate the driver’s crash avoidance decision. A braking collision avoidance model and an MPC-based lane change collision avoidance model are also developed to ensure the timely activation of the collision avoidance switching system and to improve the collision avoidance effect of the system.

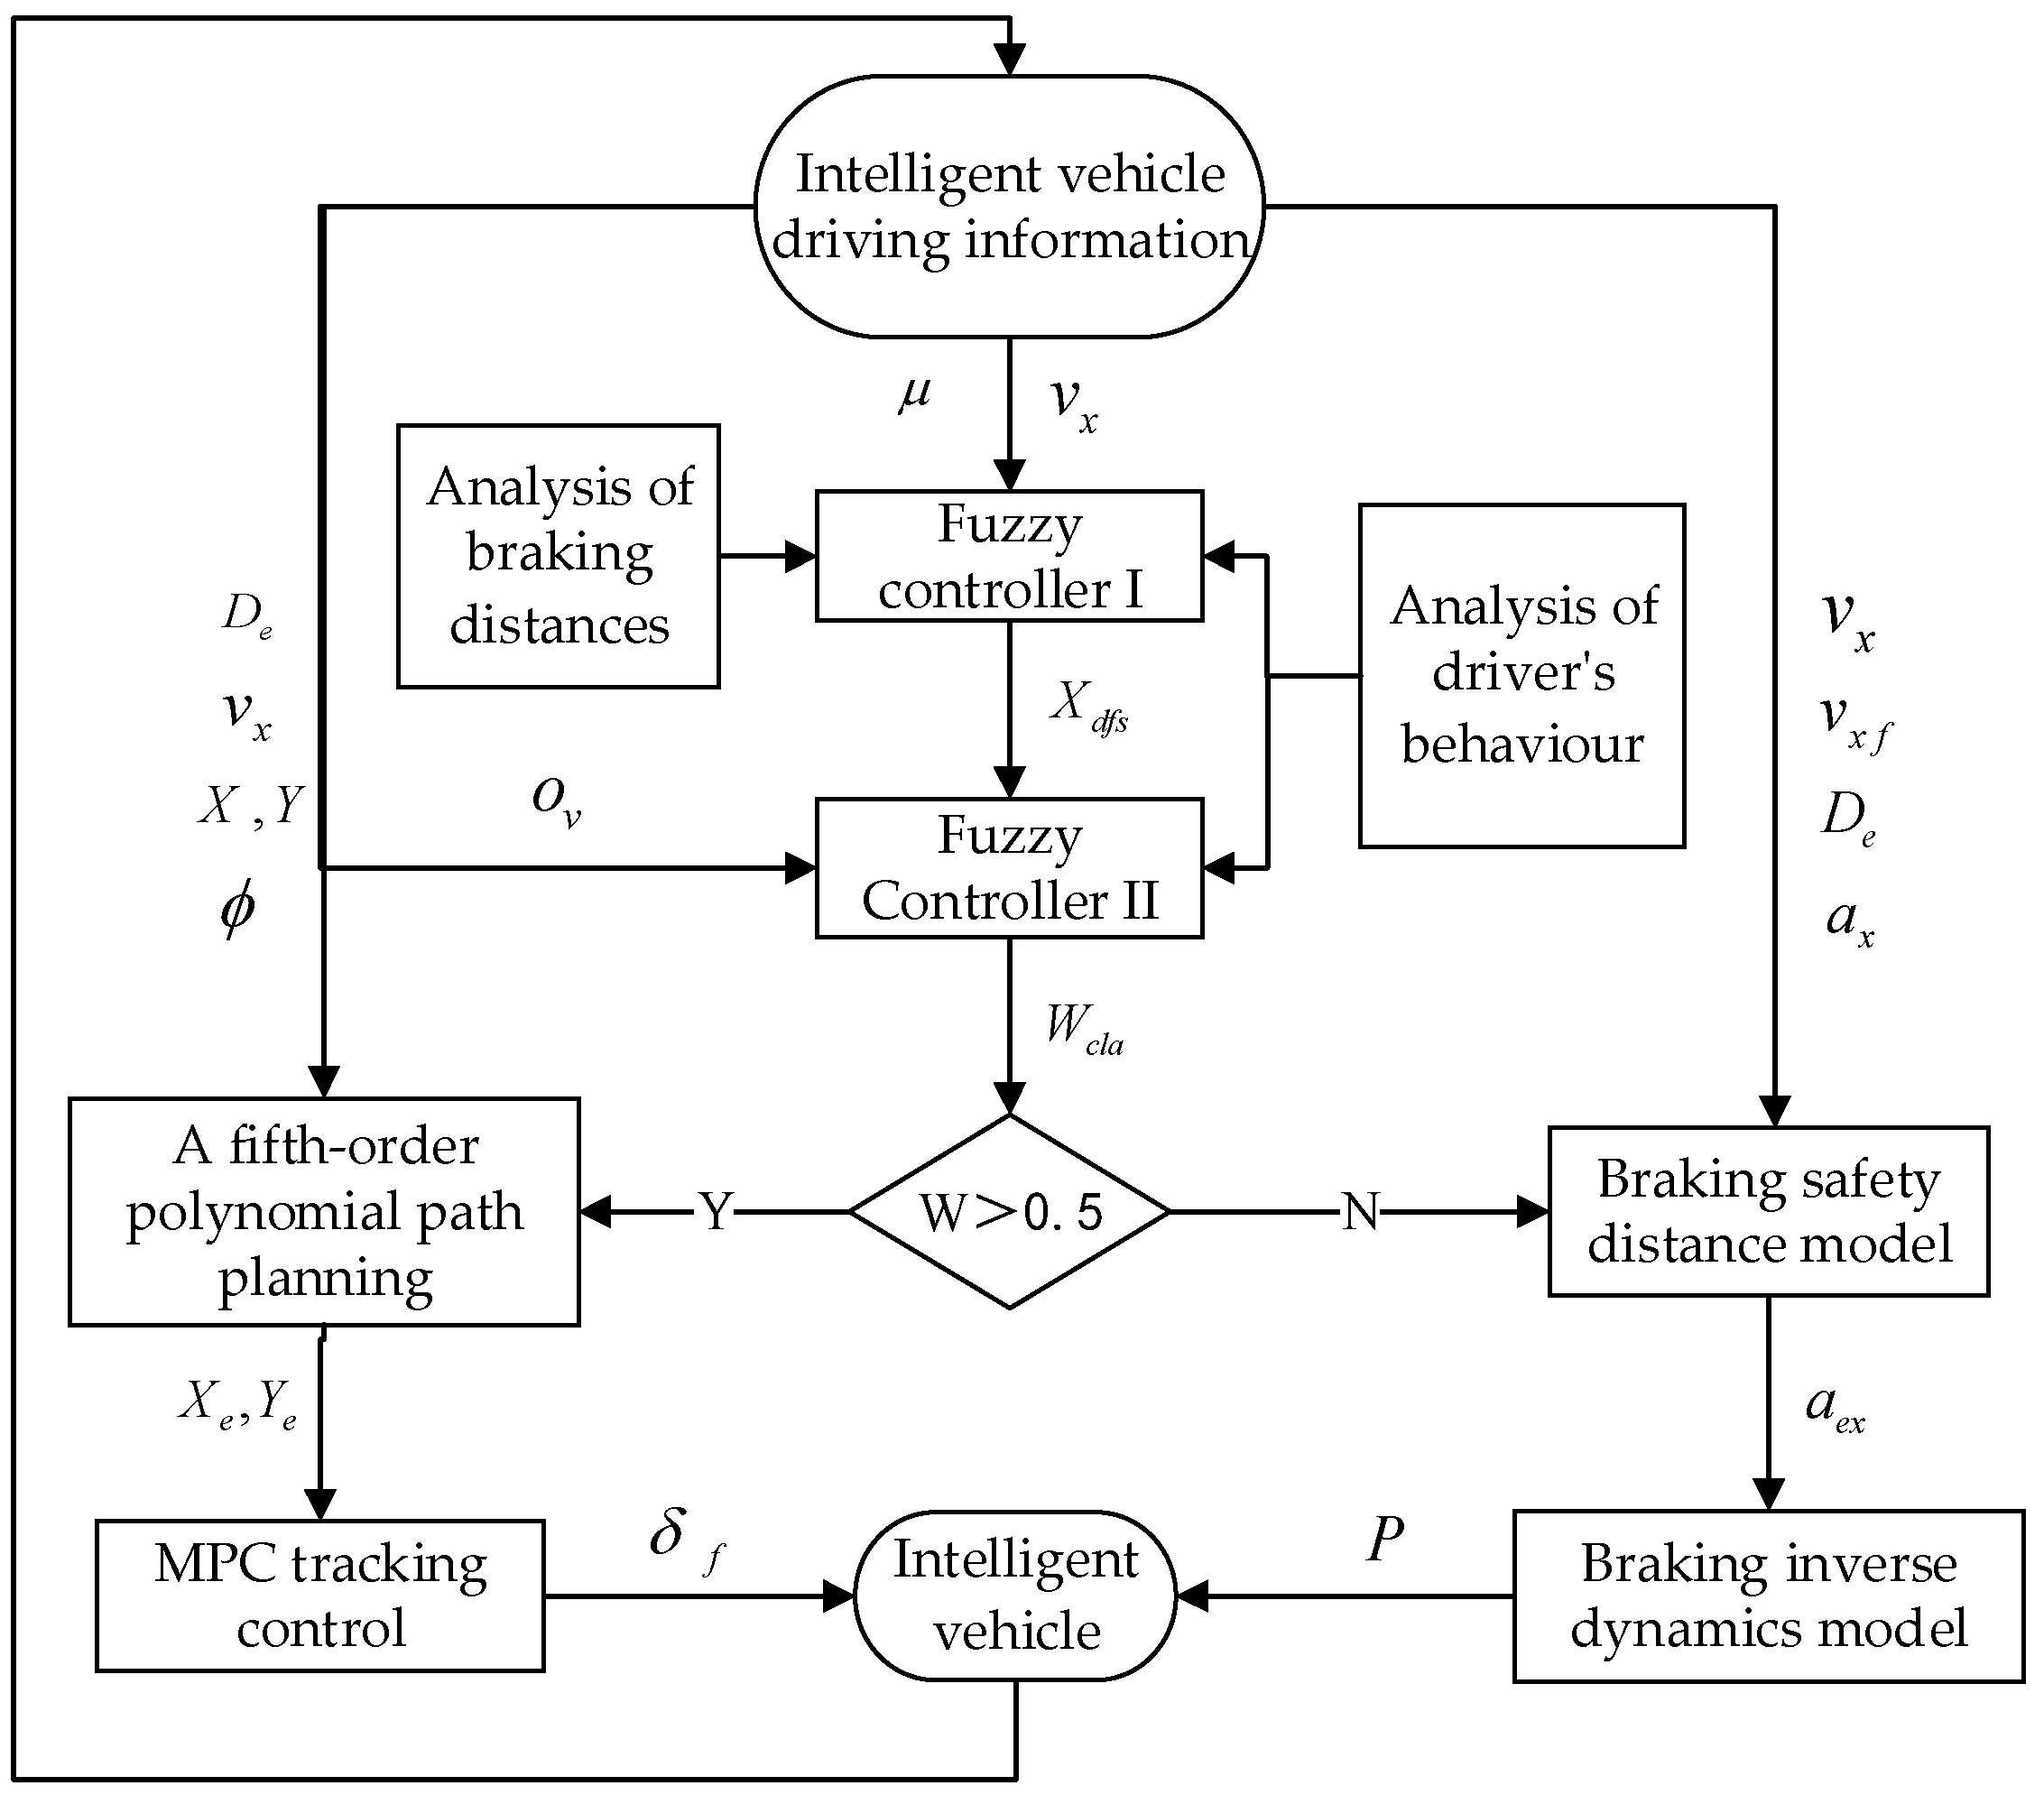
2. Collision Avoidance Modelling

In order to improve the accuracy of collision avoidance control, the control of the whole vehicle system needs to be considered; therefore in this paper, the CarSim vehicle model (Carsim2019, Mechanical Simulation Corporation, San Francisco, CA, USA) is chosen as the whole vehicle dynamics model, and a braking collision avoidance model is established based on the safe distance model. The model, in turn, achieves collision avoidance by establishing a kinetic model of the desired vehicle’s desired deceleration and inverse braking pressure to achieve the desired braking pressure control. In addition, to meet the requirements of lane change collision avoidance, five times polynomial path planning is used to obtain the desired lane change path, and the desired wheel turning angle is tracked by MPC control to achieve lane change collision avoidance.

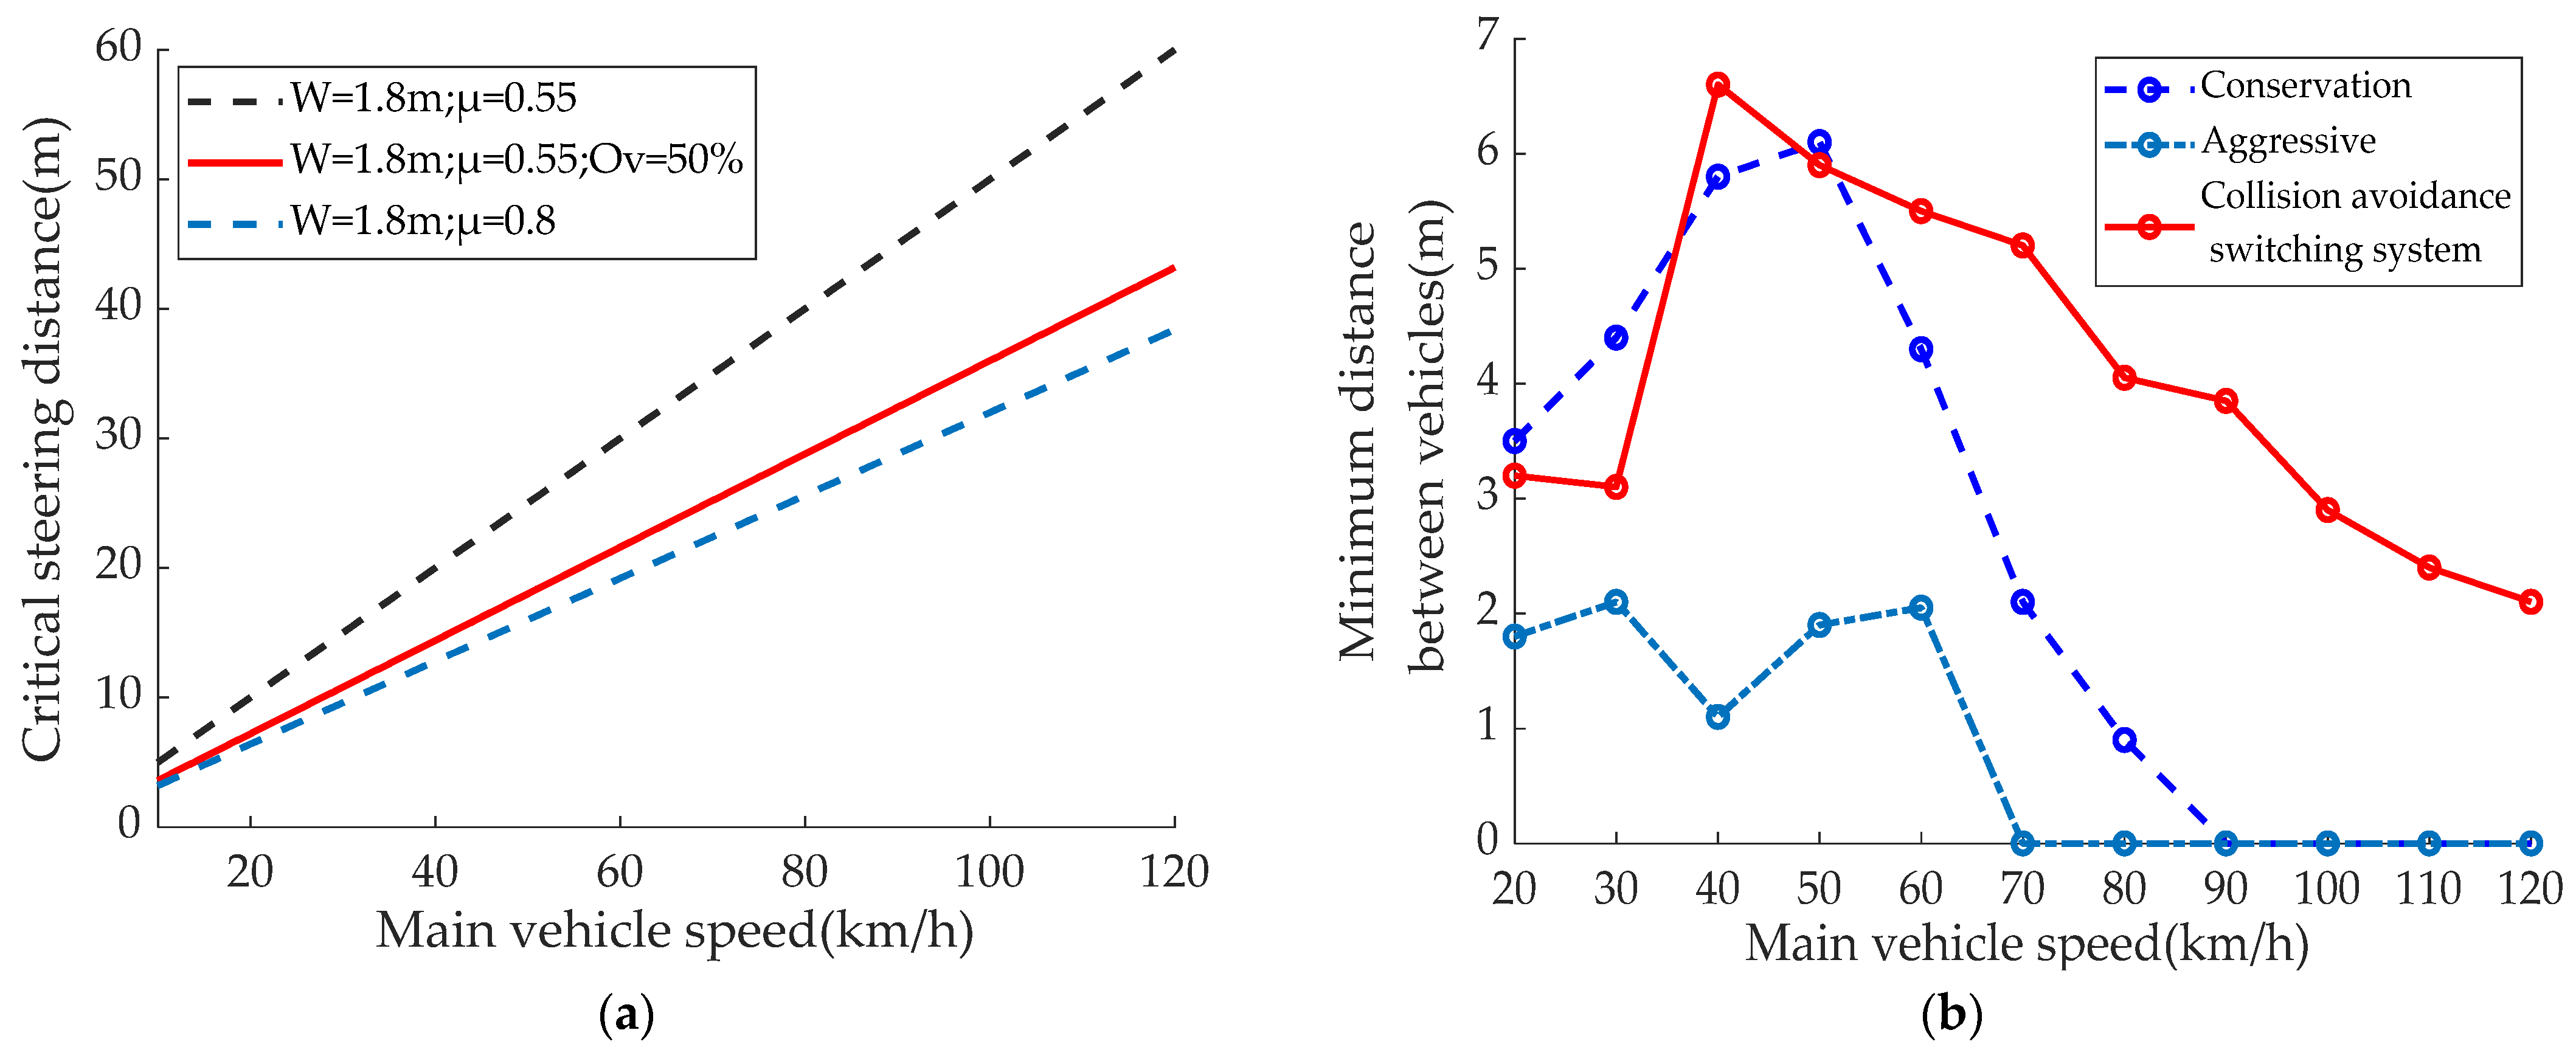
2.1. Braking Safety Distance Model

In emergency collision avoidance situations, the driver is unable to react and control the vehicle in time to avoid the obstacle, so collision avoidance control needs to be implemented directly by the controller, ignoring the effect of driver reaction time. The longitudinal braking distance equation [18] is:
D b = 1 3.6 ( t 1 + t 2 2 ) v x + v x 2 25.92 μ g
The formula contains several variables: t 1 and t 2 represent the time used to offset the brake disc and calliper gap and the braking force to reach the road adhesion used; μ represents the road adhesion coefficient; g represents the acceleration of gravity; and v x represents the initial speed of the vehicle. In the vehicle driving process, we need to set the safe distance D s . When the distance D e is less than or equal to D s , the vehicle system should start braking collision avoidance, take the longitudinal reserved safety distance D a is 3 m. That is, when D s D b + D a , the braking collision avoidance system to start.
Analysis of Equation (1) shows that t 1 and t 2 have a small effect due to their short duration. Therefore, the main factors affecting the safety distance model are the initial vehicle speed v x and the road adhesion coefficient μ . Therefore, the road adhesion coefficient is one of the important factors to be considered when designing a collision avoidance switching strategy in this paper.

2.2. Vehicle Braking Inverse Dynamics Model

As the master cylinder braking pressure needs to be controlled for braking purposes, the master cylinder braking pressure needs to be converted from the vehicle’s desired braking deceleration. The vehicle drive force or braking force is calculated from the desired acceleration. When the vehicle is under braking, the longitudinal vehicle dynamics model yields:
F b = m a x F f F w
Additionally, the relationship between ground braking force F b and master cylinder braking pressure p during braking is:
F b = k p p
By using Equations (2) and (3) above, it follows that:
p = | m a x + F f + F w | k p
Additionally, because the air resistance F w and the rolling resistance F f are:
F w = 1 2 ρ C b A V x 2 ;   F f = G f
Therefore, the master cylinder braking pressure p is:
p = | m a x + G f + 1 2 ρ C b A V x 2 | k p
In Equations (2)–(6), a x is the car deceleration, k p is the proportionality constant between the braking force and the brake master cylinder, ρ is the air density, C b is the air resistance coefficient, A is the windward area, G is the car gravity, and f is the rolling resistance coefficient.

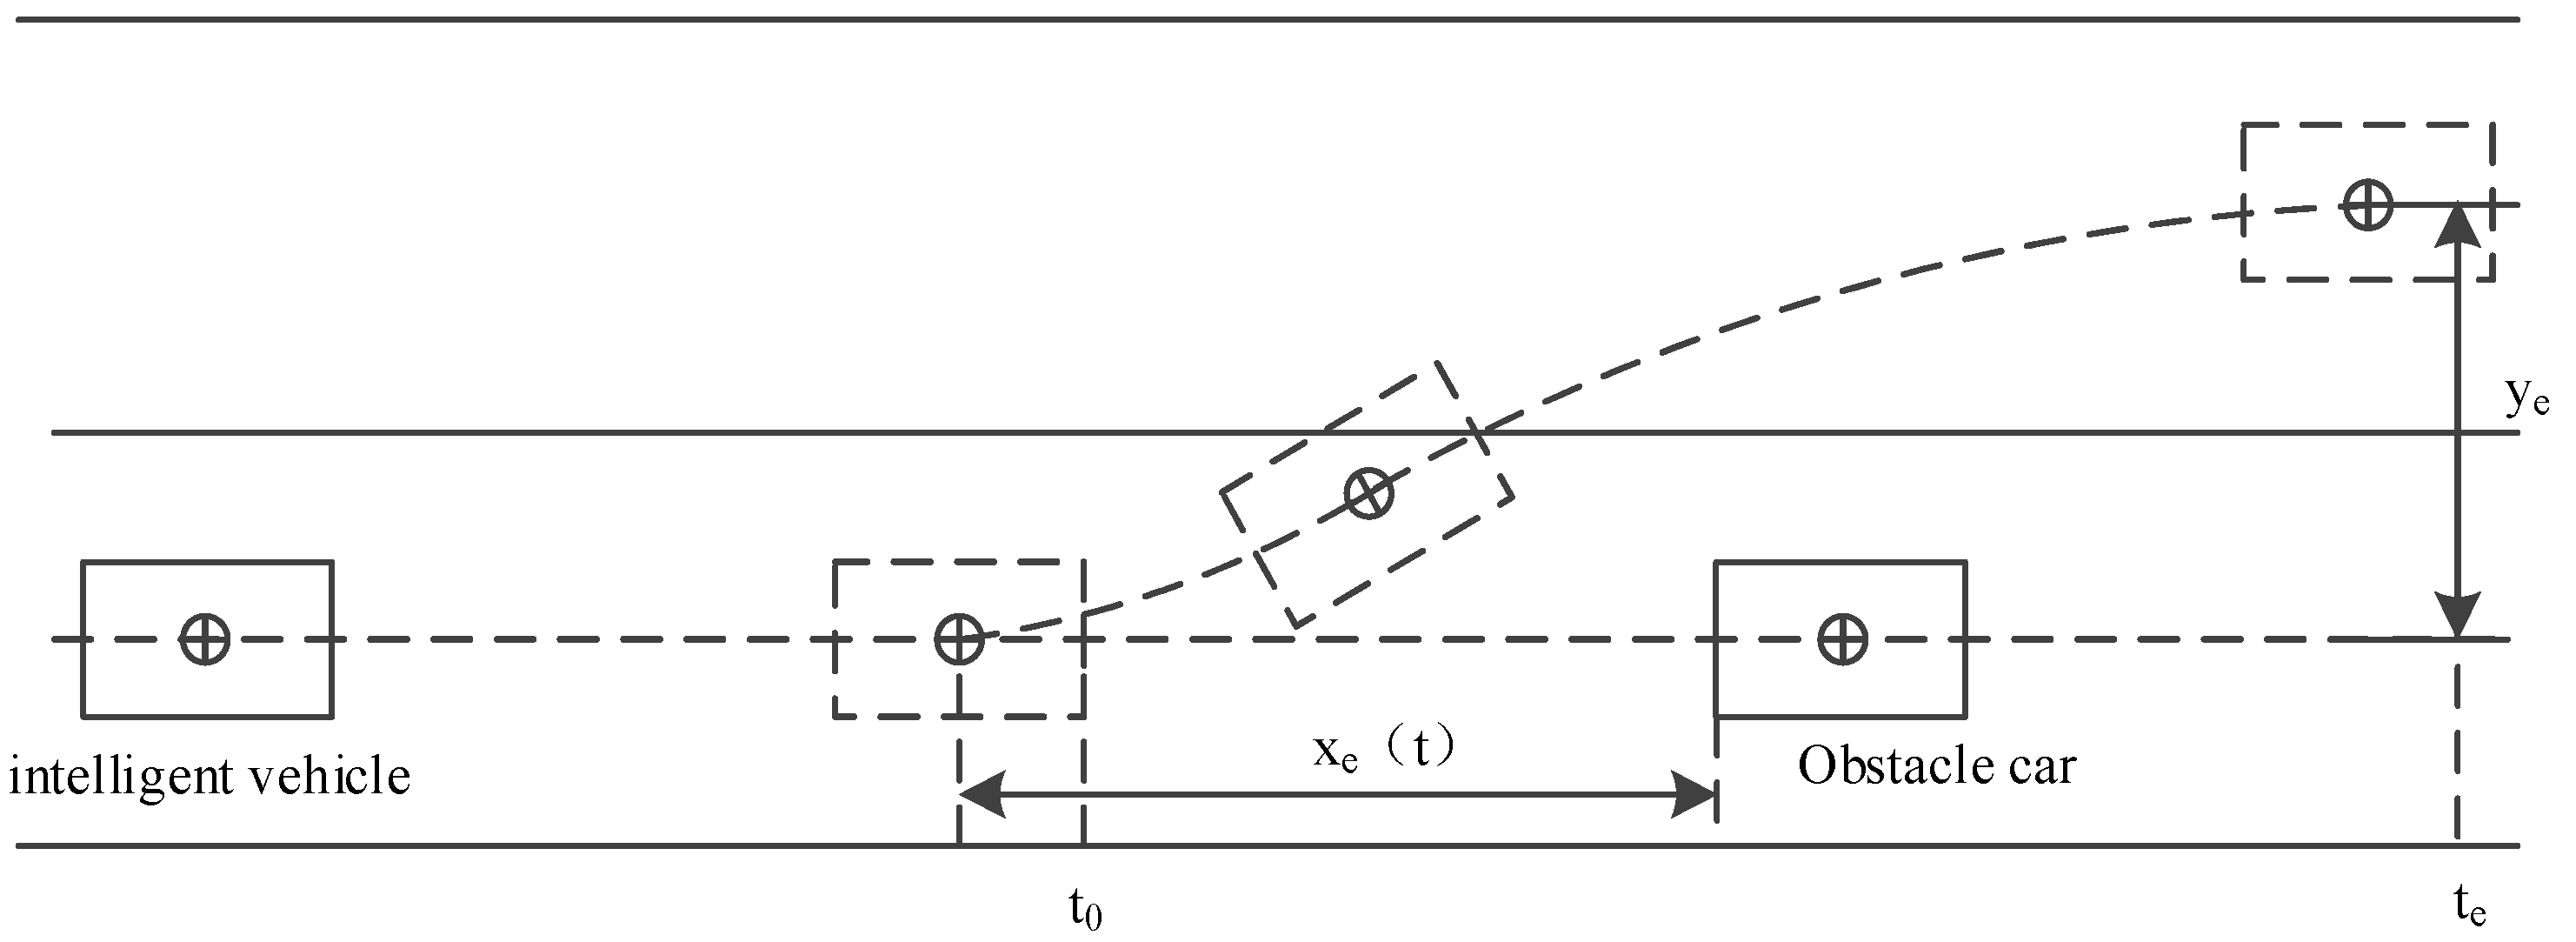
2.3. Lane Change Collision Avoidance Path Planning

In this paper, a fifth-order polynomial path planning method is used to fit the trajectory of the intelligent vehicle lane change. It is known from the literature [19] that polynomial curves have smooth curvature and do not have large abrupt changes. Therefore, the five-polynomial lane change collision avoidance model is the base model chosen for this paper. The analytical function of the model is:
y ( t ) = y e [ 10 ( x x e ) 3 15 ( x x e ) 4 + 6 ( x x e ) 5 ]
where the lateral displacement required to change lanes takes the value of the standard lane width of 3.75 m, which is represented by y e in the formula; and the longitudinal displacement required for the intelligent vehicle to complete the lane change to avoid collision is represented by x e in the formula.
If the longitudinal velocity v x of the intelligent vehicle is assumed to be constant, then during the vehicle lane change:
x e = v x t e
In the above equation t e represents the intelligent vehicle lane change time, so the lane change collision avoidance trajectory model containing only t e can be obtained as:
y ( t ) = y e [ 10 ( t t e ) 3 15 ( t t e ) 4 + 6 ( t t e ) 5 ]
The above Equation (9) is derived twice to obtain the expression for lateral3acceleration during vehicle lane change as:
a y ( t ) = 60 y e t e 5 ( 2 t 3 3 t e t 2 + t e 2 t )
This expression has a maximum point in the time range [0, t e ], and the maximum value of the lateral acceleration can be obtained by the calculation of Equation (10) as:
a y max = 10 3 y e 3 t e 2
According to Equation (11), it can be concluded that the maximum lateral acceleration during the lane change is related to the lane change time and the lane change lateral distance. As can be seen from the literature [20], the maximum lateral acceleration generated by the vehicle during the lane change cannot exceed the road attachment condition limit, i.e., | a y max | μ g . Therefore, the size of the lane change time t e will greatly affect the maximum lateral acceleration of the vehicle during the lane change, which in turn will have a key impact on the stability of the vehicle. From the literature [21], it can be seen that the vehicle lane change duration is generally between (1~6.8 s), while the lane change time taken in this paper is set at 3 s. Figure 1 below shows a diagram of lane change collision avoidance.

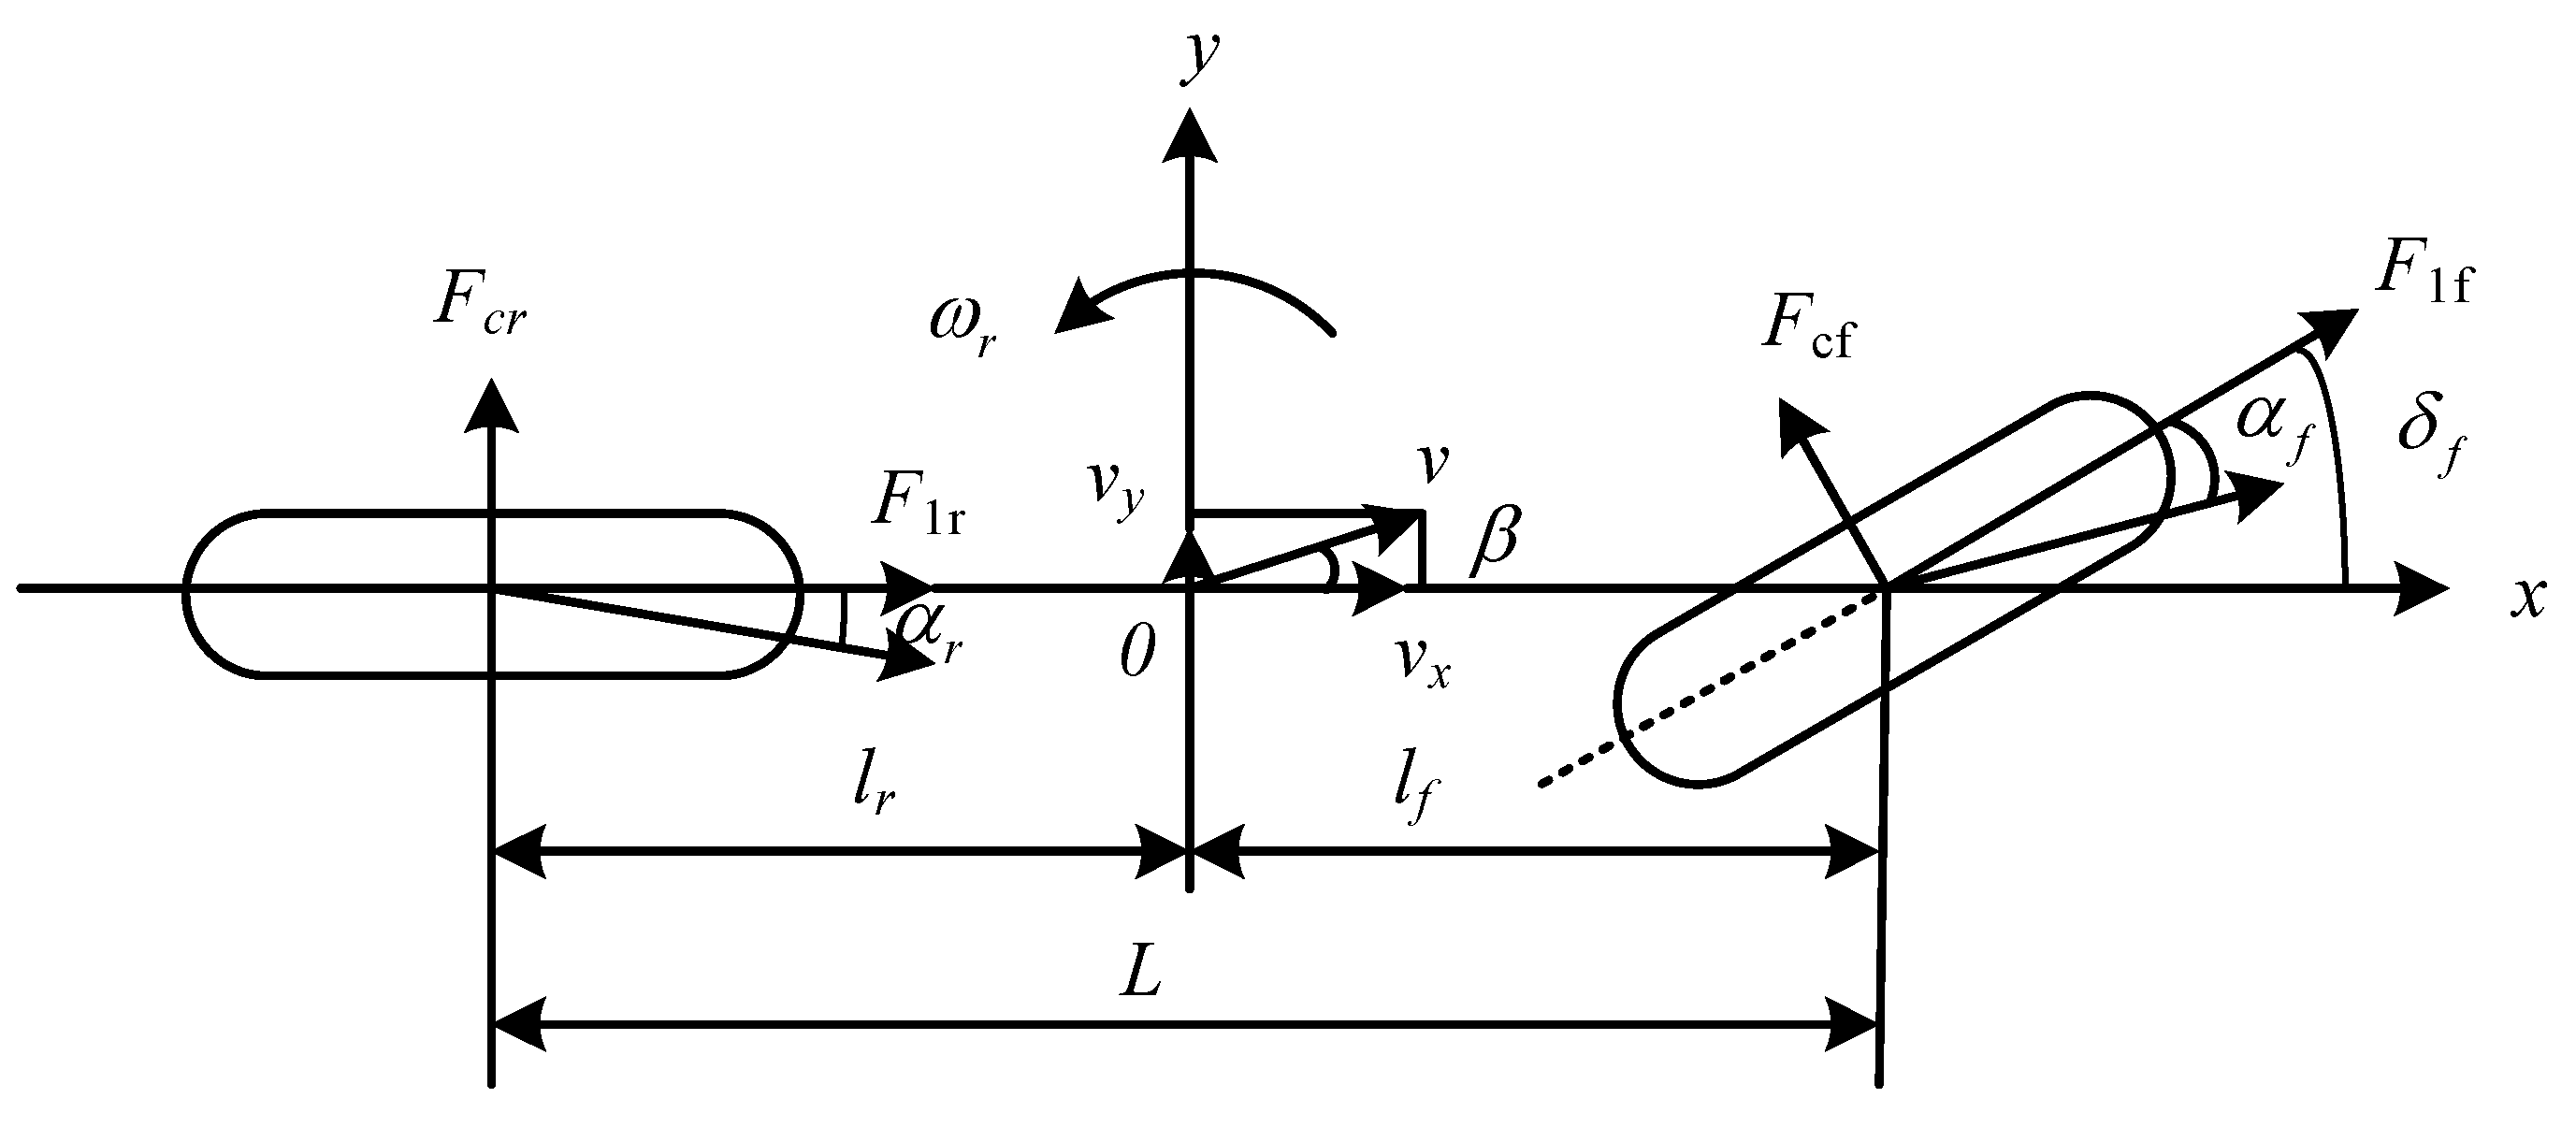
2.4. MPC Track Tracking Controller

First, a three-degree-of-freedom dynamics model with longitudinal, transverse, and transverse pendulums was developed based on the assumptions of the linear tyre model, as shown in Figure 2.
Based on Newton’s second law, the equations for the vehicle’s dynamics along the x-axis, y-axis and around the z-axis are developed. The equations are shown below:
{ m x ¨ = m y ˙ φ ˙ + 2 ( F lf cos δ f + F lr ) 2 F cf sin δ f m y ¨ = m x ˙ φ ˙ + 2 F lf sin δ f + 2 ( F cf cos δ f + F cr ) I z φ ¨ = 2 ( F cf cos δ f + F lf sin δ f ) · l f 2 F cr · l r
In Figure 2 and Equation (12): l f and l r are the distances of the front and rear axles from the centre of mass O, respectively; I z is the inertia of the vehicle around the z-axis; F lf and F lr are the longitudinal forces on the front and rear tyres, respectively; F cf and F cr are the lateral forces on the front and rear tyres, respectively; α f and α r are the lateral deflection angles of the front and rear wheels, respectively; β is the lateral deflection angle of the centre of mass; ω r is the angular velocity of the transverse pendulum; δ f is the angle of rotation of the front wheels; x ˙ and y ˙ are the velocities along the x and y axes; x ¨ and y ¨ are the accelerations along the x and y axes; φ ˙ is the angular velocity of the heading; and φ ¨ is the angular acceleration of the heading.
Considering the conversion relationship between the body coordinate system and the Cartesian coordinate system, the following Equation (13) can be obtained:
{ Y ˙ = x ˙ sin φ + y ˙ cos φ X ˙ = x ˙ cos φ y ˙ sin φ
As MPC control has excellent characteristics, such as high tracking accuracy and stable control effect in the field of intelligent driving. Therefore, this paper refers to the literature [22] to design MPC controller into the tracking control of lane change path. First, the vehicle dynamics model is simplified, ignoring the influence of the vehicle side-slip Angle and the role of the suspension, assuming that the car only moves in the X Y plane, approximation has ϕ ω r d t . Then, the state quantity of the simplified model is ξ = ( y ˙ , x ˙ , φ , φ ˙ , Y , X ) T , and the control quantity is u = δ f .
Next the model needs to be linearised: a control quantity is applied to the system to obtain the state trajectory and the new state quantity is defined as the deviation between the state trajectory and the actual state quantity, resulting in the linear time-varying equation:
ξ ˙ ( t ) = A ( t ) ξ ( t ) + B ( t ) u ( t )
After linearisation, the vehicle dynamics model is obtained with the A ( t ) and B ( t ) matrices corresponding to the Jacobi matrices of the state quantity ξ and the control quantity u , respectively. In order to achieve a discretization of the continuous time model, the difference equation is obtained using the difference approximation of the state quantities:
{ ξ ( k + 1 ) = A ( k ) ξ ( k ) + B ( k ) u ( k ) A ( k ) = I + T A ( t ) B ( k ) = T B ( t )
In the equation: I denotes the unit matrix; T is the sampling time of the system. The objective function of the controller is then designed. The objective function contains the tracking trajectory accuracy index and the control process smoothness index and adds the relaxation factor. The expression of the objective function is as follows:
J = i = 1 N p η ( t + i t ) η ref   ( t + i t ) Q 2 + i = 1 N c 1 Δ u ( t + i t ) R 2 + ρ ε 2
In the above Equation (14): η ( t + i t )   η ref   ( t + i t ) and Δ u ( t + i t ) denote the output value, reference value and control increment of the MPC control system at time t, respectively; while N P , N c , and ρ ε denote the prediction time domain, control time domain and the relaxation factor, respectively; and the Q and R matrices denote the weight matrix.
The next step is to establish the constraints of the system. In the predictive control phase of the model, the constraints of the front wheel steering and the influence of the front wheel angle change should be considered; at the same time, the lateral acceleration of the vehicle should be constrained to ensure the stability of the vehicle’s transverse sway. The control volume and output volume in the system optimisation process are constrained as shown in the following equation:
{ u min u k u max Δ u min Δ u k Δ u max y h , min y h y h , max y s , min ε y h y h , max ε
In the above equation: y h is the hard constraint output, i.e., the output that cannot be relaxed; y s is the soft constraint output, i.e., the output that can be dynamically adjusted by the relaxation factor.
Finally, the optimisation problem under the above constraints can be transformed into a quadratic programming (quadratic programming, QP) problem and the optimal control law can be solved by the interior point method to give the system better tracking accuracy and transverse sway stability. The Q , R matrices affect the weights of the trajectory tracking accuracy and the smoothness of the control volume, respectively. If the accuracy of trajectory tracking is of more concern, the weights in the Q matrix can be increased; if the smoothness of the control input is desired, the weights in the R matrix can be increased.

3. Analysis Based on Driver Collision Avoidance Behaviour

As it can be seen from the literature [23], this article is available from the website of the NGSIM Vehicle Track Traffic Dataset, a vehicle traffic data collection project sponsored by the Federal Highway Administration. The dataset is collected from four different regions: southbound US-101 in California, the Lankershim Boulevard map in Los Angeles, California, eastbound I-80 in Emeryville, California, and the Peachtree Street map in Atlanta, Georgia. us-101 and Lankershim Boulevard maps are common research scenarios in vehicle-road coordination, and this paper will process and analyse driver collision avoidance behaviour based on datasets from these two areas.
A diagram of the road collection section of I-80 is shown in Figure 3, where vehicle A has braked and steered in the previous moment to avoid the vehicle in front.

3.1. Pre-Processing Based on NGSIM Dataset

This vehicle trajectory dataset was transcribed from the video and generated at 0.1 s intervals as a set of data containing 18 attributes, such as vehicle ID, position, speed, acceleration, etc. Some of these data attributes are shown in Table 1. This dataset was presented in CSV and TXT formats and due to the amount of data generated, it was necessary to pre-process the data to filter to obtain vehicle braking/lane change collision avoidance. When actually driving a vehicle, there are only two situations that would lead to a driver making a decision to change lanes: 1. The driver is looking for a better driving experience; 2. To avoid a collision with another vehicle. As Situation 1 is clearly not an emergency situation, i.e., the driver does not need to make a sharp turn to achieve his goal, this paper can filter the data set using the condition of whether the lateral acceleration is greater than 0.4 g to get a partial emergency collision avoidance situation, then use the change in data before and after the vehicle lane change to get the driver’s collision avoidance behaviour. The following pre-processing was carried out using Matlab (Matlab2020b, MathWorks, Natick, Massachusetts, MA, USA) and Excel software (Excel 2013, Microsoft, Redmond, WA, USA).
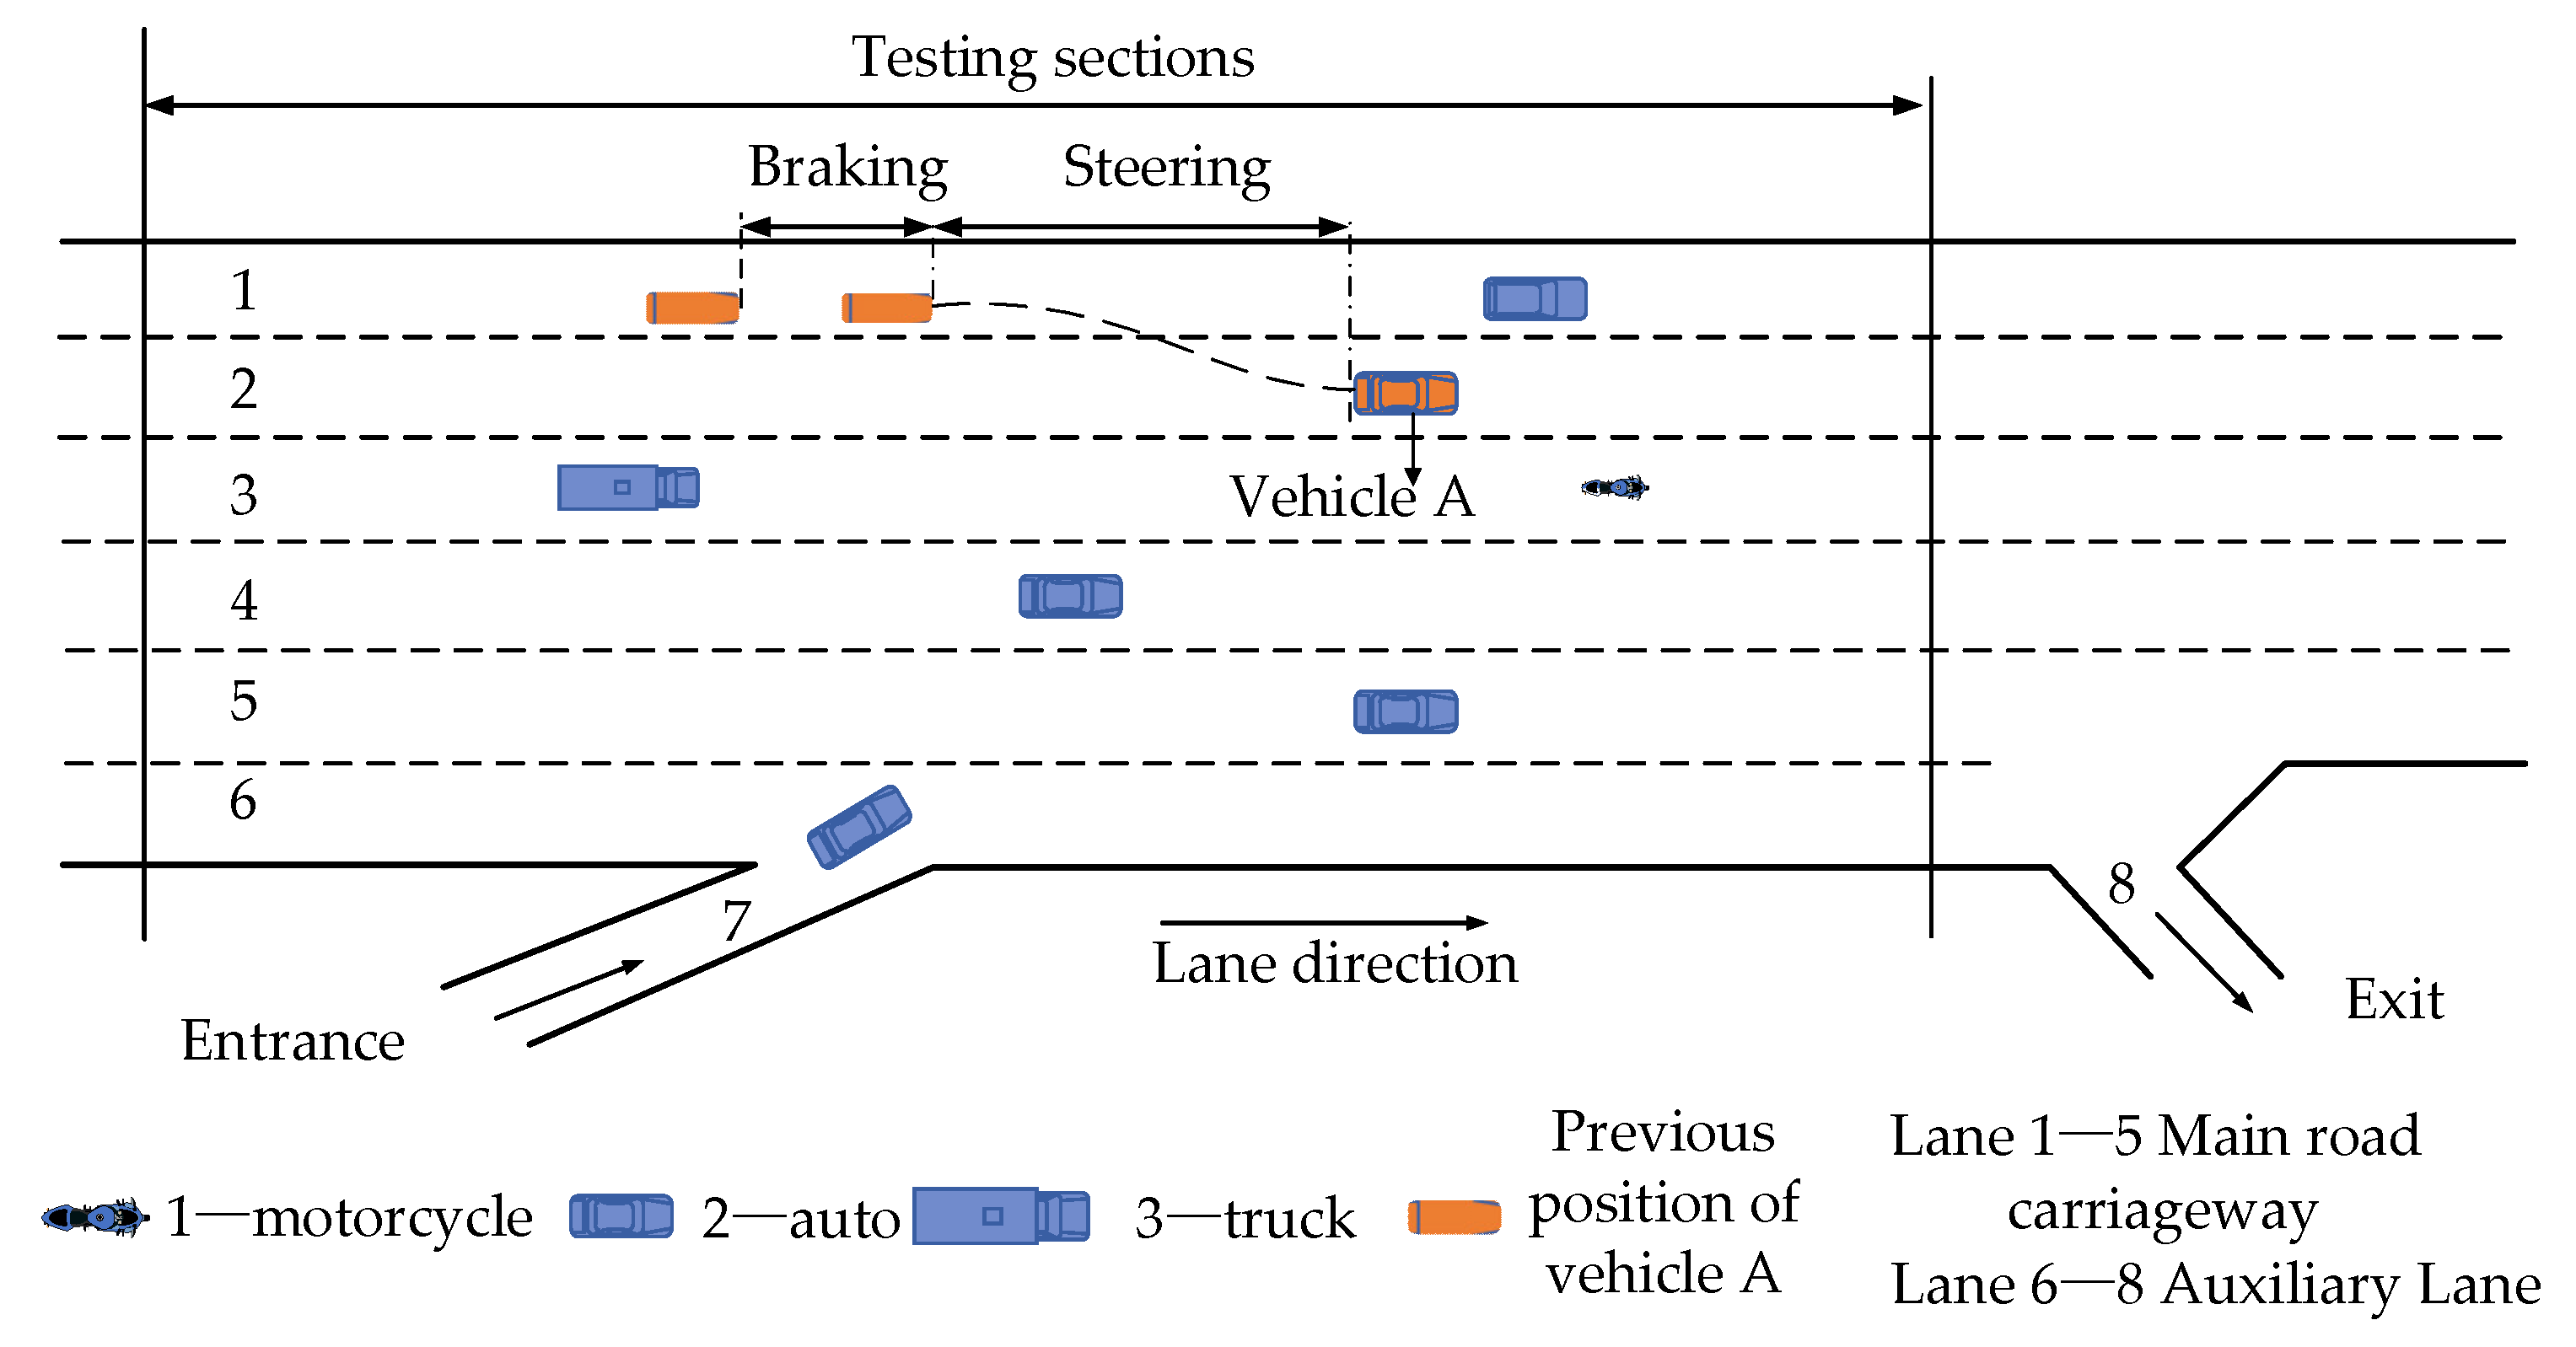
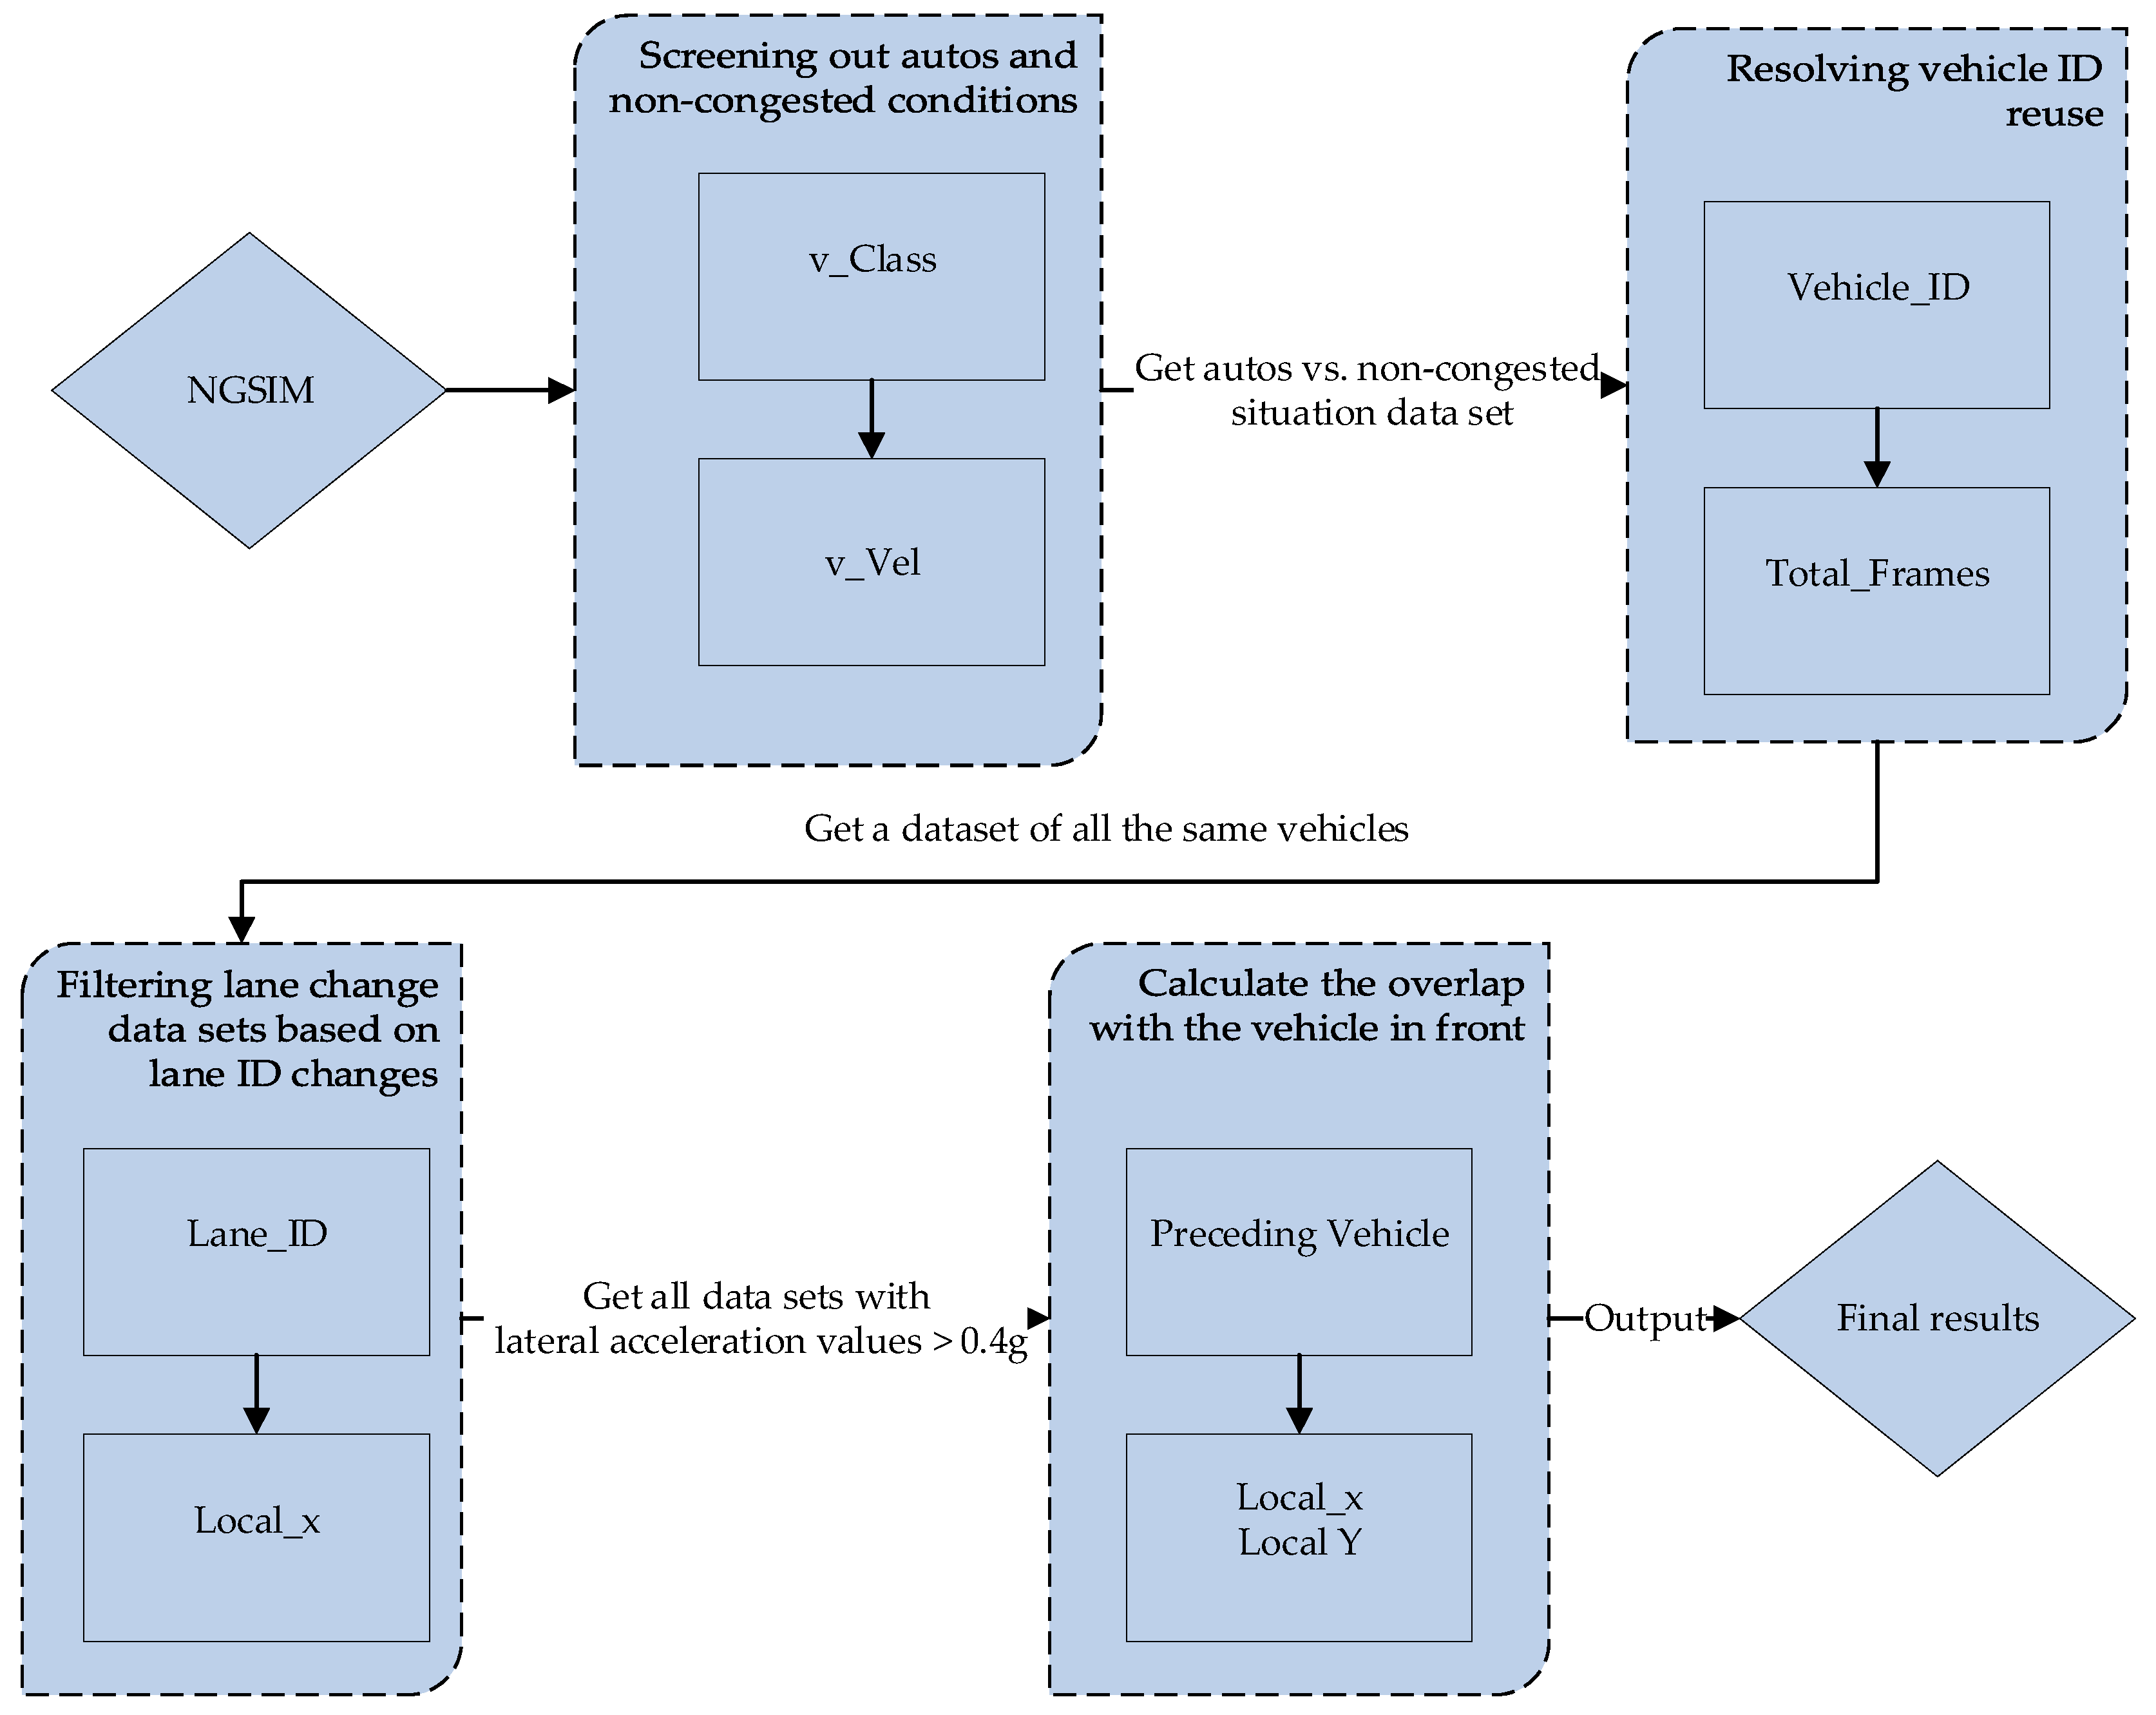
  • The data is first filtered according to the type of vehicle in the dataset, excluding motorbikes and large trucks, filtering to get all data for cars, then according to the corresponding vehicle speed list, excluding the data generated by congested road sections with vehicle speeds less than 4 fit/s.
  • Following this, the vehicle data of the same ID is filtered, and the data of a single vehicle is filtered according to the total length of time (Total_Frames) collected from different vehicles to solve the case of vehicle ID reuse, then the list of vehicle lanes and the list of lane differences are obtained, and here only the case of a single lane change occurs is considered.
  • According to the lane difference list get the index of the lane ID change point, and accordingly get the data before and after the vehicle lane change and the data after the vehicle and lane change. According to the data before and after the lane change, get the list of horizontal coordinates before and after the lane change, and according to the list of horizontal coordinates combined with the continuous change condition, get the starting point and end point of the lane change. At this point, we have 610 sets of lane change data for US-101 and 874 sets of lane change data for I-80, then we need to filter out the operating conditions where the lateral acceleration is greater than 0.4 g. Intercept the list of lateral coordinates between the start and end of the lane change, calculate the lateral acceleration from the lateral coordinates with the frame ID and convert the units. The list of accelerations was traversed, and data for vehicles with accelerations greater than 0.4 g were retained (g was considered to be 10). At this point, there were 322 sets of lane change data for US-101 roads and 326 sets of I-80 roads with lateral accelerations greater than 0.4 g.
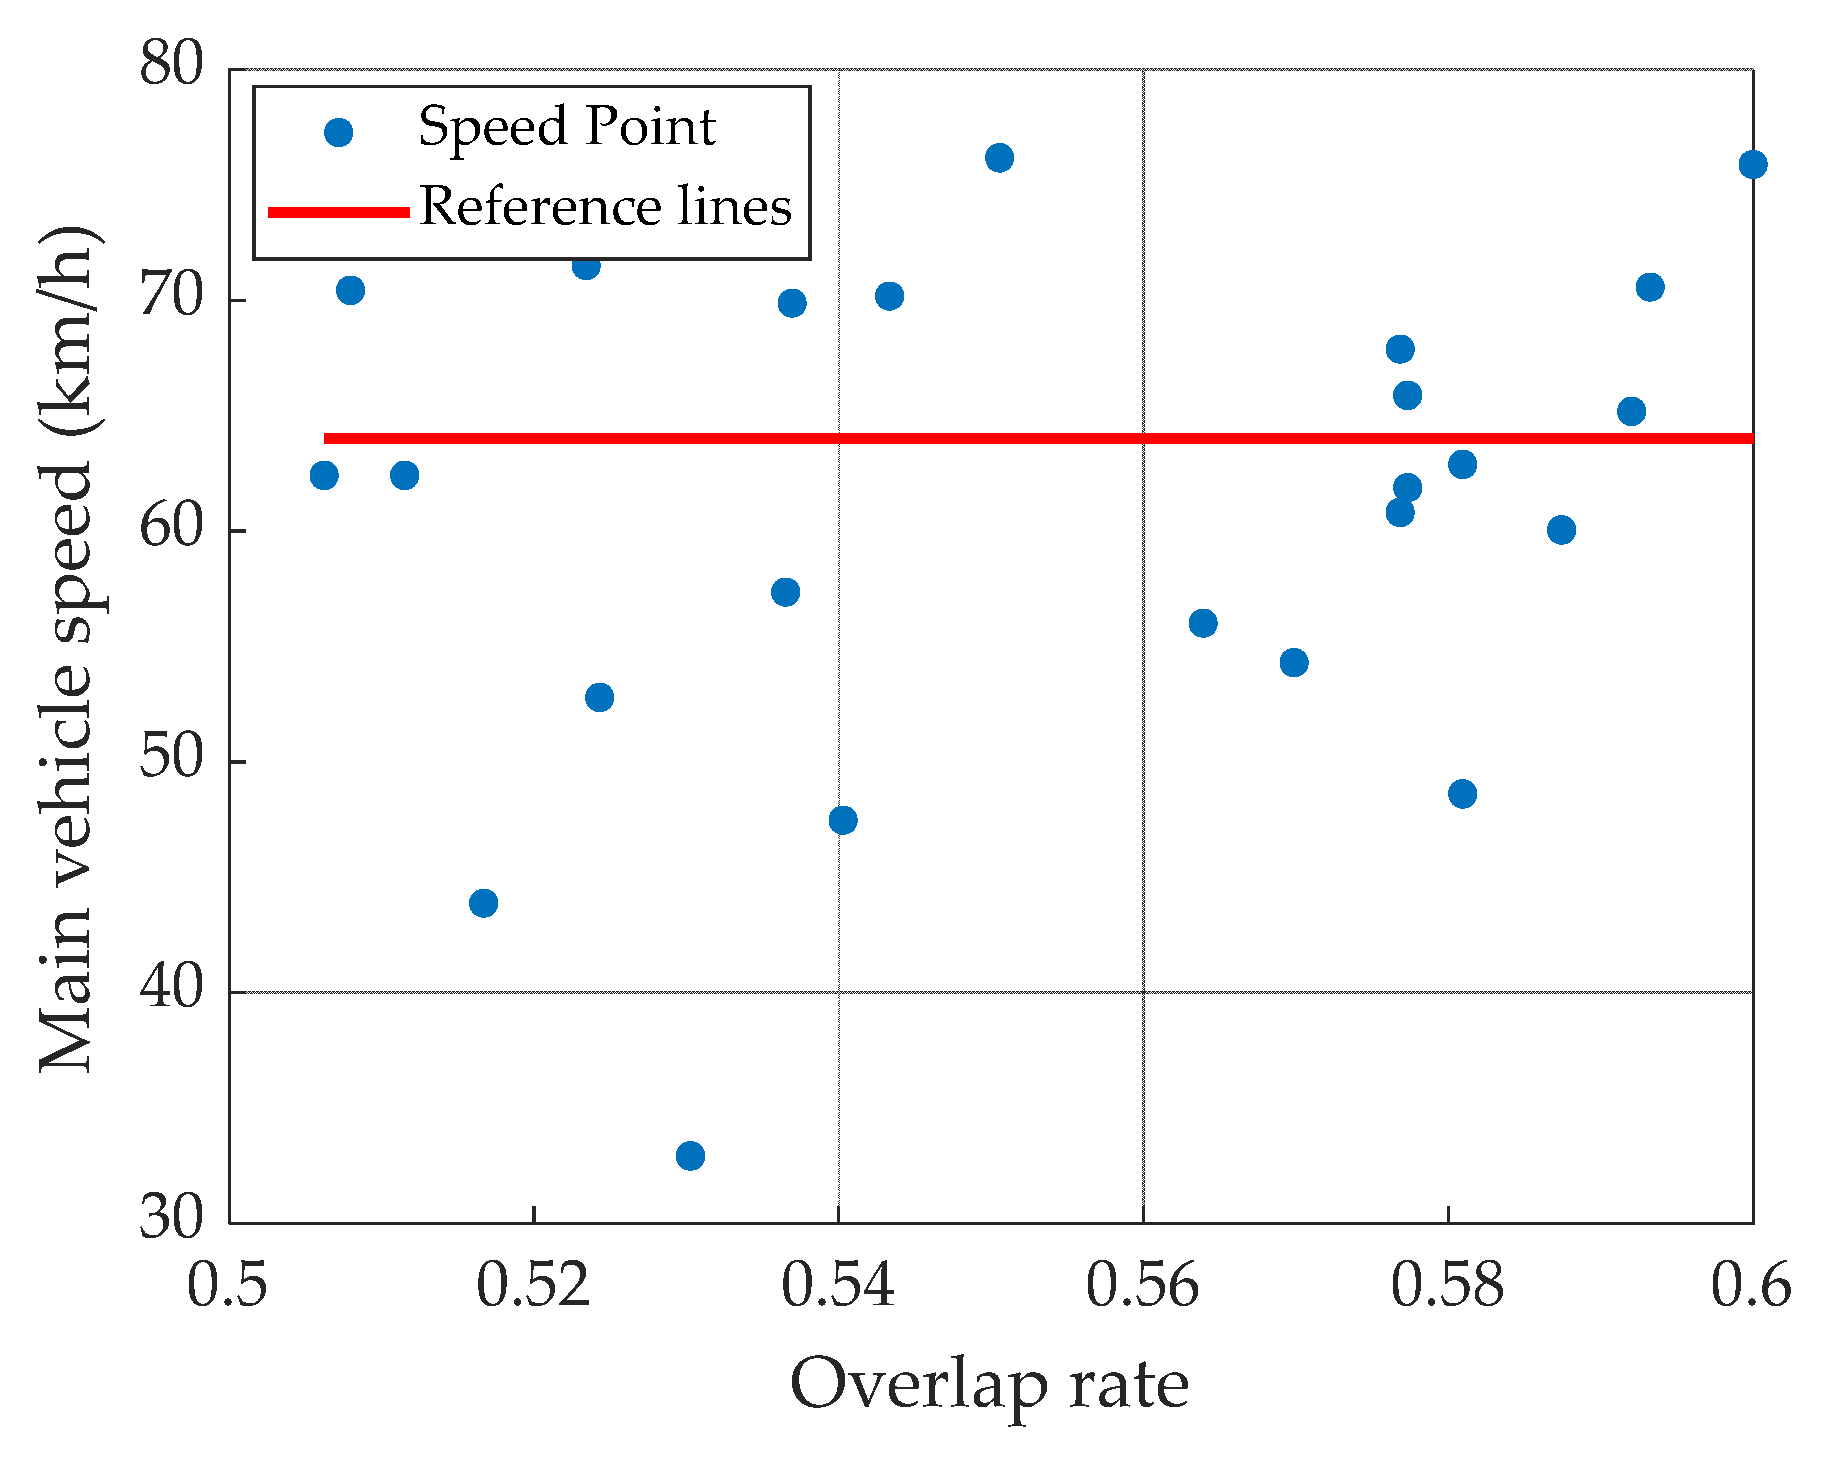
  • Finally, the overlap rate at the moment the vehicle starts to change lanes is obtained. The overlap rate in this paper represents the minimum lateral distance required for that vehicle to avoid the vehicle ahead and the percentage of that vehicle’s width: the data at the moment the vehicle starts to change lanes is obtained from the vehicle ahead at that moment by means of the time and preceding vehicle ID dual indicators. For calculation purposes, the overlap rate is calculated, and data of that size is saved, assuming that the vehicle is 4 m long and 1.8 m wide at the same moment, and save the acceleration of the vehicle at the moment of the previous second to determine whether the vehicle brakes early.
Figure 4 below shows a diagram of the filtering process based specifically on the attributes of the data set.

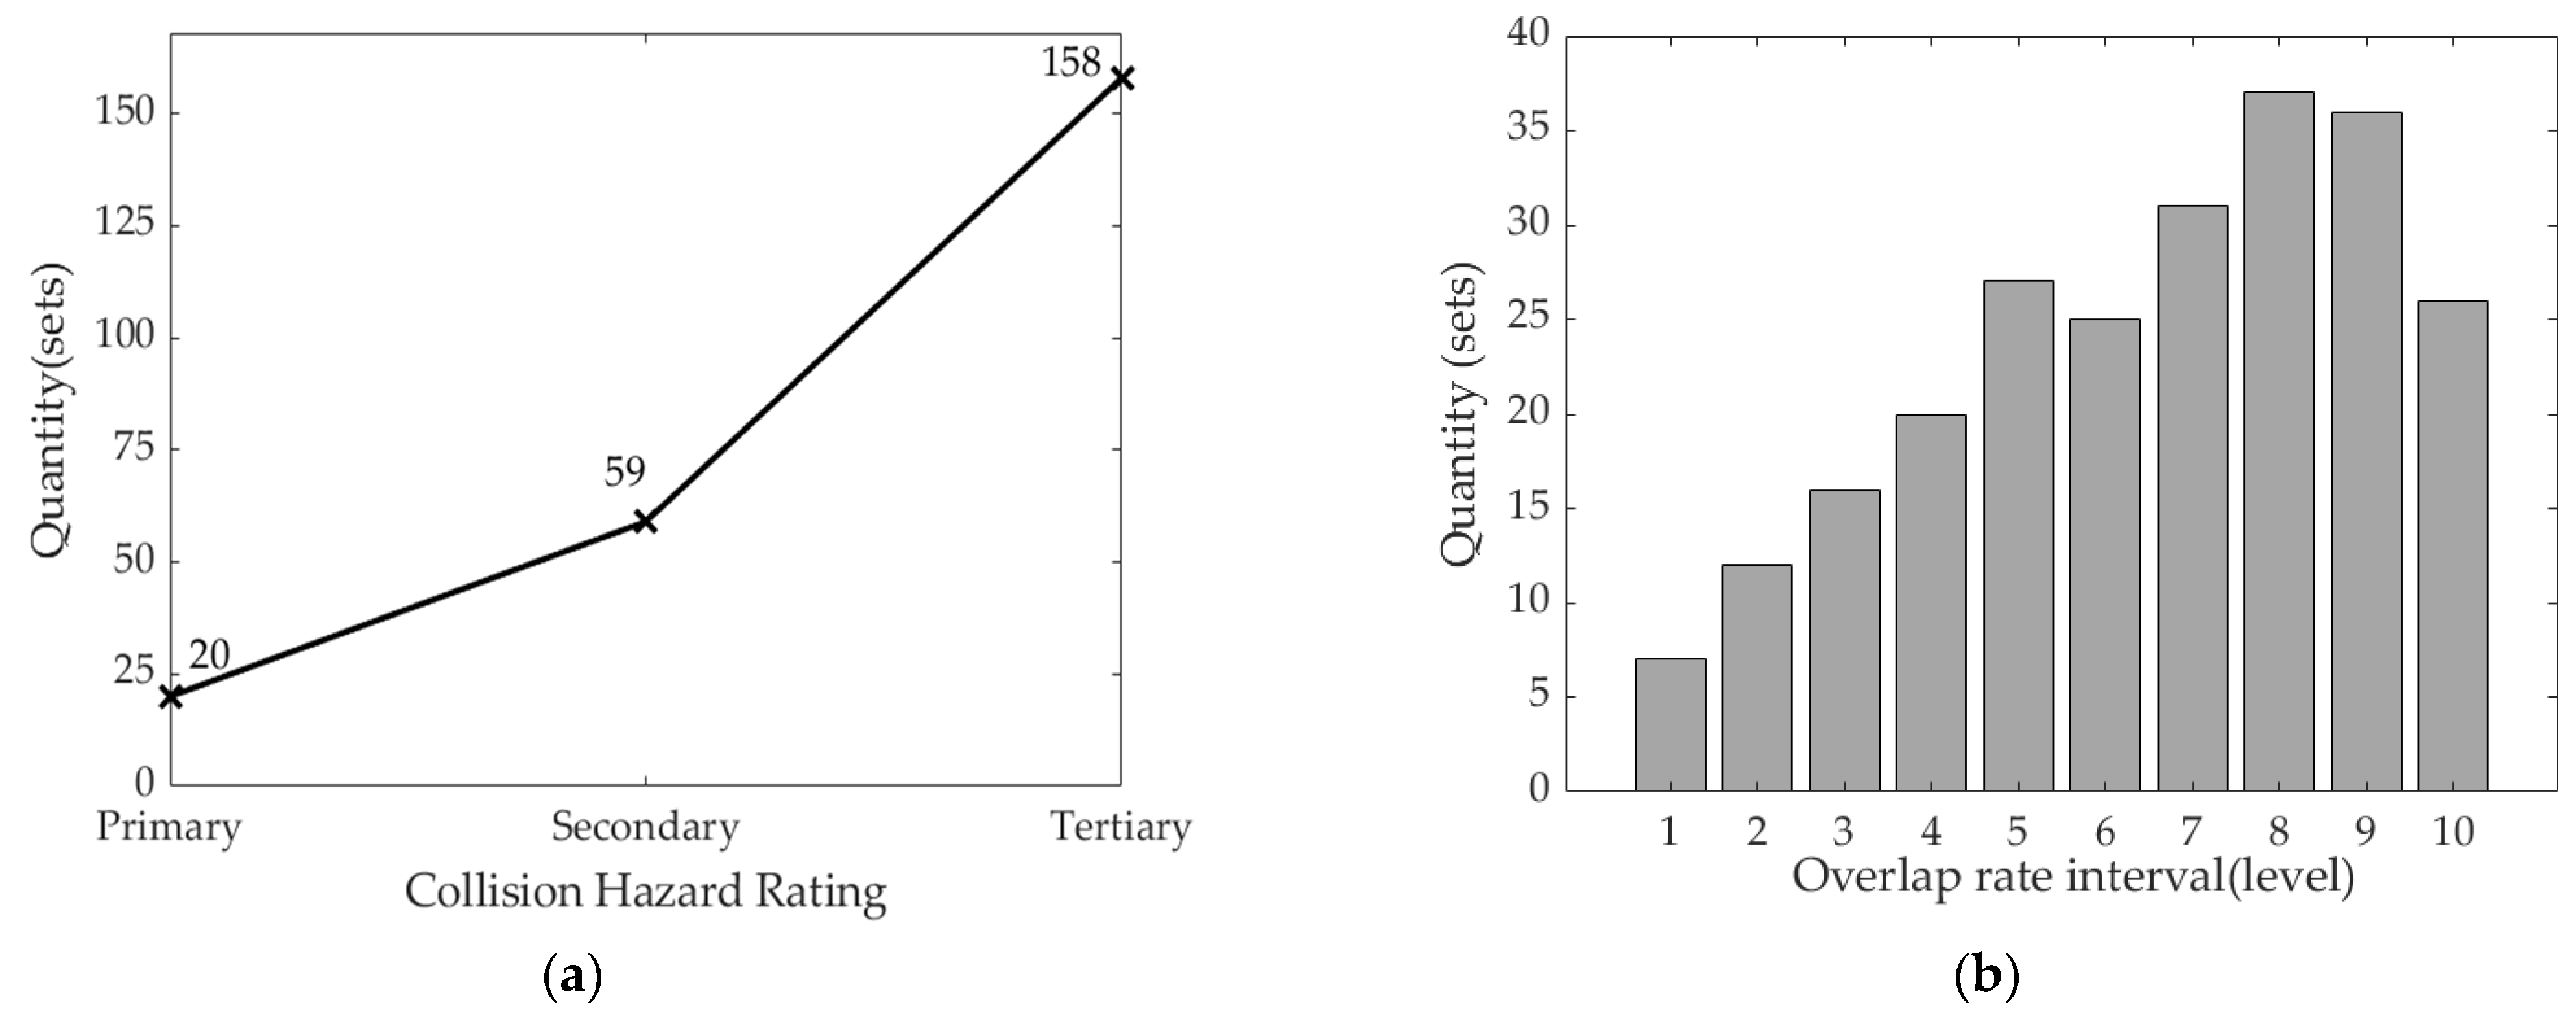
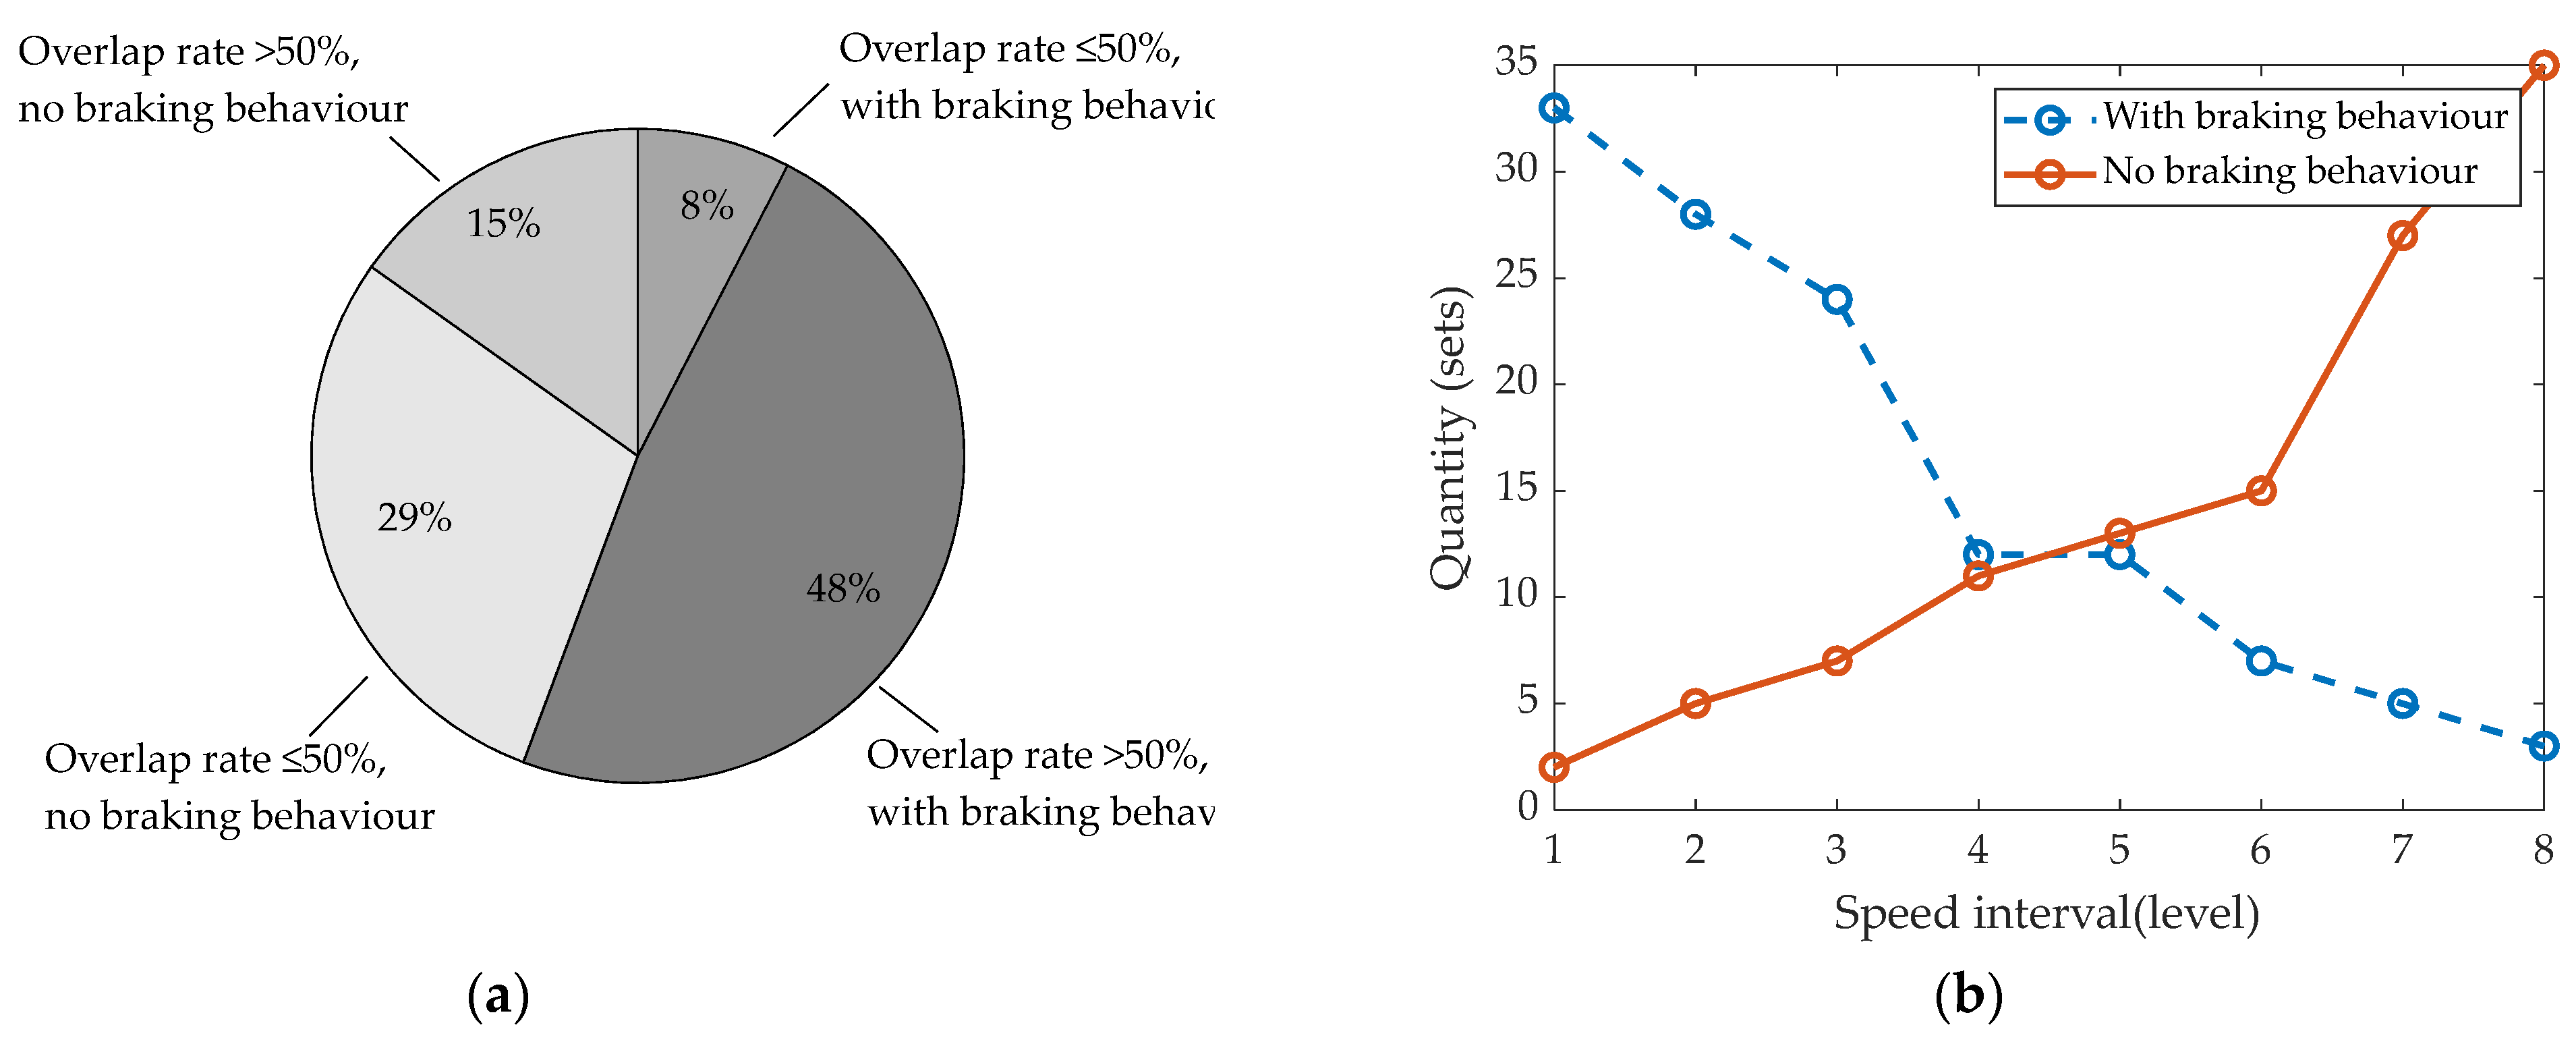
3.2. Analysis of Driver Collision Avoidance Behaviour Based on Pre-Processing Results

The above data set was pre-processed to obtain 610 sets of lane change data for US-101 and 874 sets of lane change data for I-80 for a total of 1484 cases. Since the steering behaviour of drivers is more aggressive during the actual lane change collision avoidance process in case of emergency, the cases with lateral acceleration greater than 0.4 g were filtered out to obtain 322 sets of data for US-101 roads and 326 sets of data for I-80 roads for a total of 648 cases. It is clear from the literature [24] that the TTC (time of own collision with the front) model is effective and simple to calculate as it can be used to identify collision hazard levels. Therefore, according to the model, the TTC > 3 s is set as no collision hazard, 2 s < TTC < 3 s as primary collision hazard, 1 s < TTC < 2 s as secondary collision hazard and TTC < 1 s as tertiary collision hazard. According to the defined hazard levels, 237 cases of hazardous conditions can be obtained as analysis targets. As shown in Figure 5, the distribution of hazardous conditions at each level is shown. From Figure 5a, it can be seen that in the actual lane change collision avoidance situation, as the emergency rate increases, more drivers choose to avoid collisions by emergency steering in extremely dangerous situations. It is also known from the literature that the factors affecting the driver’s choice of collision avoidance are also related to the overlap rate of the vehicle in front, as shown in Figure 5b, which shows the distribution of the overlap rate, dividing the overlap rate interval into 10 levels, [0%, 10%] for level 1, (10%, 20%] for level 2, and by analogy, (90%, 100%] for level 10.
From Figure 5b, we know that there is a significant quantitative difference between the overlap rate of the self and the preceding vehicle in terms of the number of conditions in which the overlap rate is greater than 50%, which justifies the need for further analysis of the vehicle overlap rate. In the case of a collision risk, the driver’s braking behaviour is judged by comparing the speed of the vehicle at the previous moment with the current moment, so the presence or absence of braking behaviour and whether the overlap rate is greater than 50% are taken as the basis for judgement to arrive at the percentage diagram shown in Figure 6a. The current vehicle speed also has a crucial influence on the driver’s choice of collision avoidance behaviour, then screening the speed of the self-car in the hazardous working conditions, it was found that when the vehicle speed fell into the 60 km/h to 80 km/h range, the number of working conditions with and without braking behaviour was basically the same, and as the vehicle speed increased, the driver’s braking behaviour before changing lanes also increased. The specific distribution of behaviour with and without braking in relation to vehicle speed is shown in Figure 6b, divides the speed interval into 8 levels, with (0,40] as level 1, (40,50] as level 2, (50,60] as level 3, (60,70] as level 4, (70,80] as level 5, (80,90] as level 6, (90,100] as level 7, and (100,∞) as level 8 (all the above speed value units are in km/h).
Figure 6a shows that when the overlap rate is >50%, drivers tend to take early braking action in dangerous situations, and when the overlap rate is ≤50% drivers tend to avoid collisions in emergency situations by not braking and using lane changing alone. As can be seen in Figure 6b, in the set of data where drivers take early braking action, the faster the auto speed, the fewer drivers choose to brake early; similarly, in the set of data where no early action is taken, we find that: as speed increases, more and more drivers tend to avoid collisions by changing lanes alone. It is reasonable to assume that taking a lane change to avoid a collision is more in line with driver expectations in scenarios where the speed of the vehicle is faster, i.e., more dangerous. The graph also shows that between speed levels 4 and 5, the number of drivers braking early or not tends to be equal. Therefore, it is reasonable to consider whether the overlap rate is greater than 50% and whether the speed is greater than 70 km/h (the median of the speed range) as important factors when deciding whether to use lane changing to avoid a collision. The results of this data screening process are shown in Table 2.

4. Design of a Two-Layer Fuzzy Controller

Fuzzy control can be used to solve non-linear problems due to its robustness, flexibility, and fault tolerance. Unlike traditional control methods, fuzzy control does not require an exact mathematical model but a linguistic knowledge model to design and modify the control algorithm. Therefore, this paper refers to the literature [25] to build fuzzy control, which in turn designs an active collision avoidance switching strategy that adjusts different collision avoidance measures according to different driving conditions during vehicle operation, thus better reflecting the rationality of the collision avoidance switching system. According to the previous paper, there are three important reference factors affecting the determination of collision avoidance measures: vehicle speed, road adhesion coefficient and overlap rate, so a two-level fuzzy controller is designed using these three factors to determine the collision avoidance measures of an intelligent vehicle.

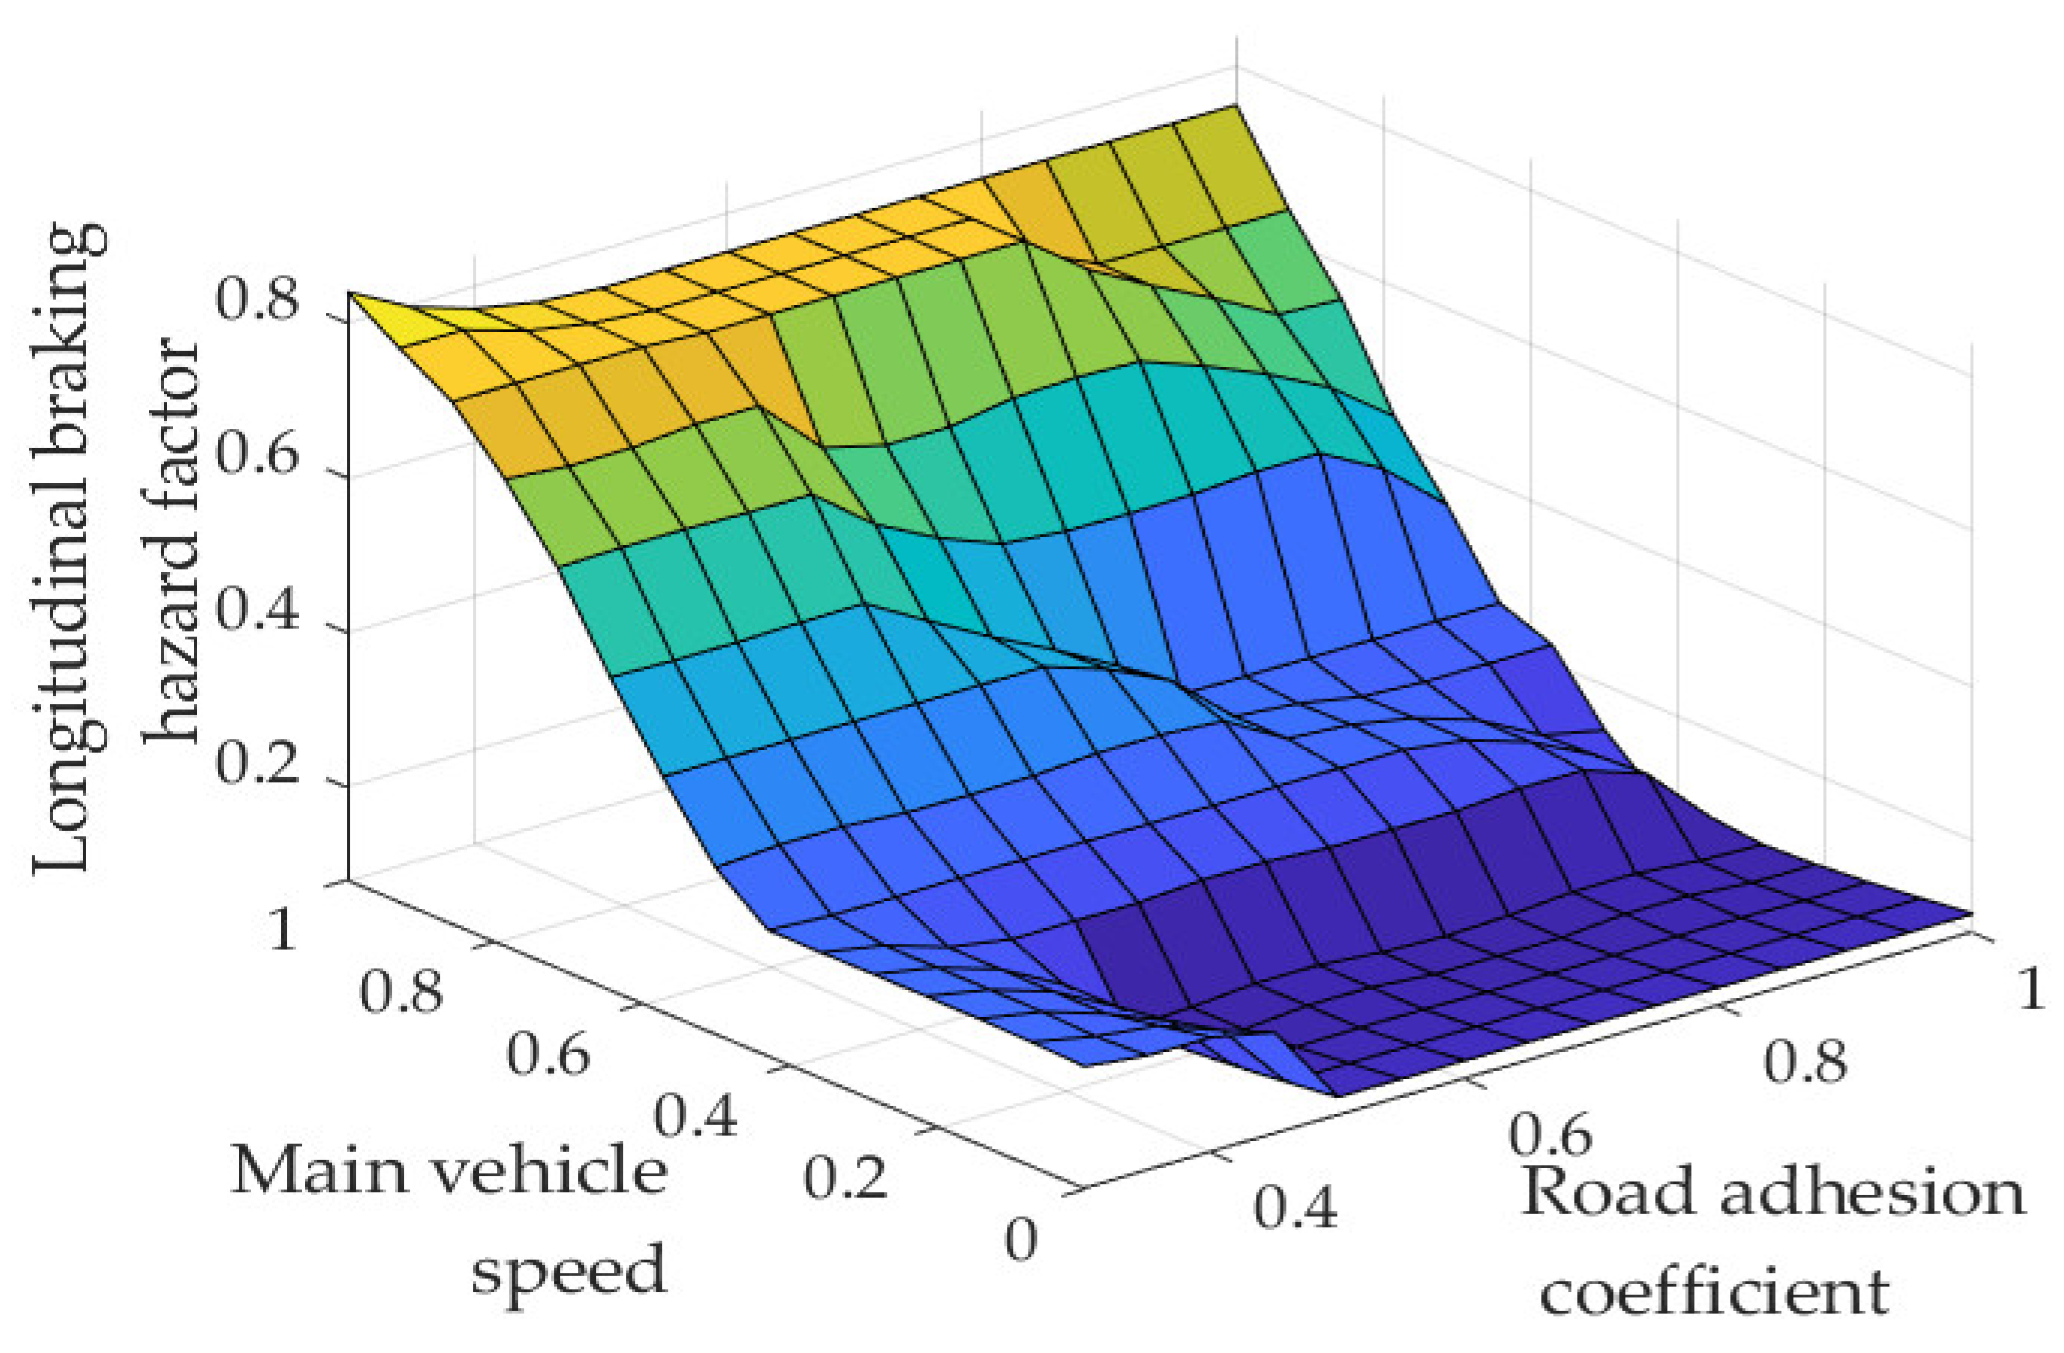
4.1. Fuzzy Controller I

From the literature [26], it is well known that for active collision avoidance systems, using a braking model based on safety distance instead of a braking model based on safety time can better reflect the collision braking effect of the vehicle at high speed. Therefore, in this paper, a fuzzy controller I is designed based on fuzzy control theory to take the position state information of the vehicle and the road information at the current moment as input, and the output results obtained are used to evaluate the longitudinal braking hazard of the intelligent vehicle at the current moment.
From Equation (1), it can be seen that the main factors affecting the braking distance are vehicle speed and adhesion coefficient; when the braking distance is long obviously cannot meet the longitudinal collision avoidance safety of a very short distance, so the vehicle speed and road adhesion coefficient are used as input parameters of the fuzzy controller I, and the output parameter is the longitudinal braking hazard coefficient. For the main vehicle speed, the fuzzy set is {MS1, MS2, MS3, MS4, MS}, without considering the low speed, and the maximum speed limit of China’s highways is 120 km/h, therefore the speed range is [20, 120] in km/h, and the main vehicle speed range is normalised to the speed coefficient range [0, 1]. For the road adhesion coefficient, as the road adhesion coefficient for rain and snow extremes is 0.3, the extreme road conditions less than 0.3 are not considered, and the fuzzy set is {RC1, RC2, RC3, RC4, RC5}, and the theoretical domain range is [0.3, 1]. The fuzzy set of output longitudinal braking hazard coefficients is {LF1, LF2, LF3, LF4, LF5} with the range of [0, 1]. The fuzzy rule table is shown in Table 3 and follows the rule that the faster the vehicle speed and the lower the road adhesion coefficient, the higher the longitudinal braking risk factor and the more dangerous the braking behaviour. The affiliation function is a triangular function, and the fuzzy relationship law is Mamdani. The fuzzy control input-output variable relationship surface is shown in Figure 7, the different colours indicate the level of the longitudinal brake hazard factor: the bluer the lower, the more yellow the higher.

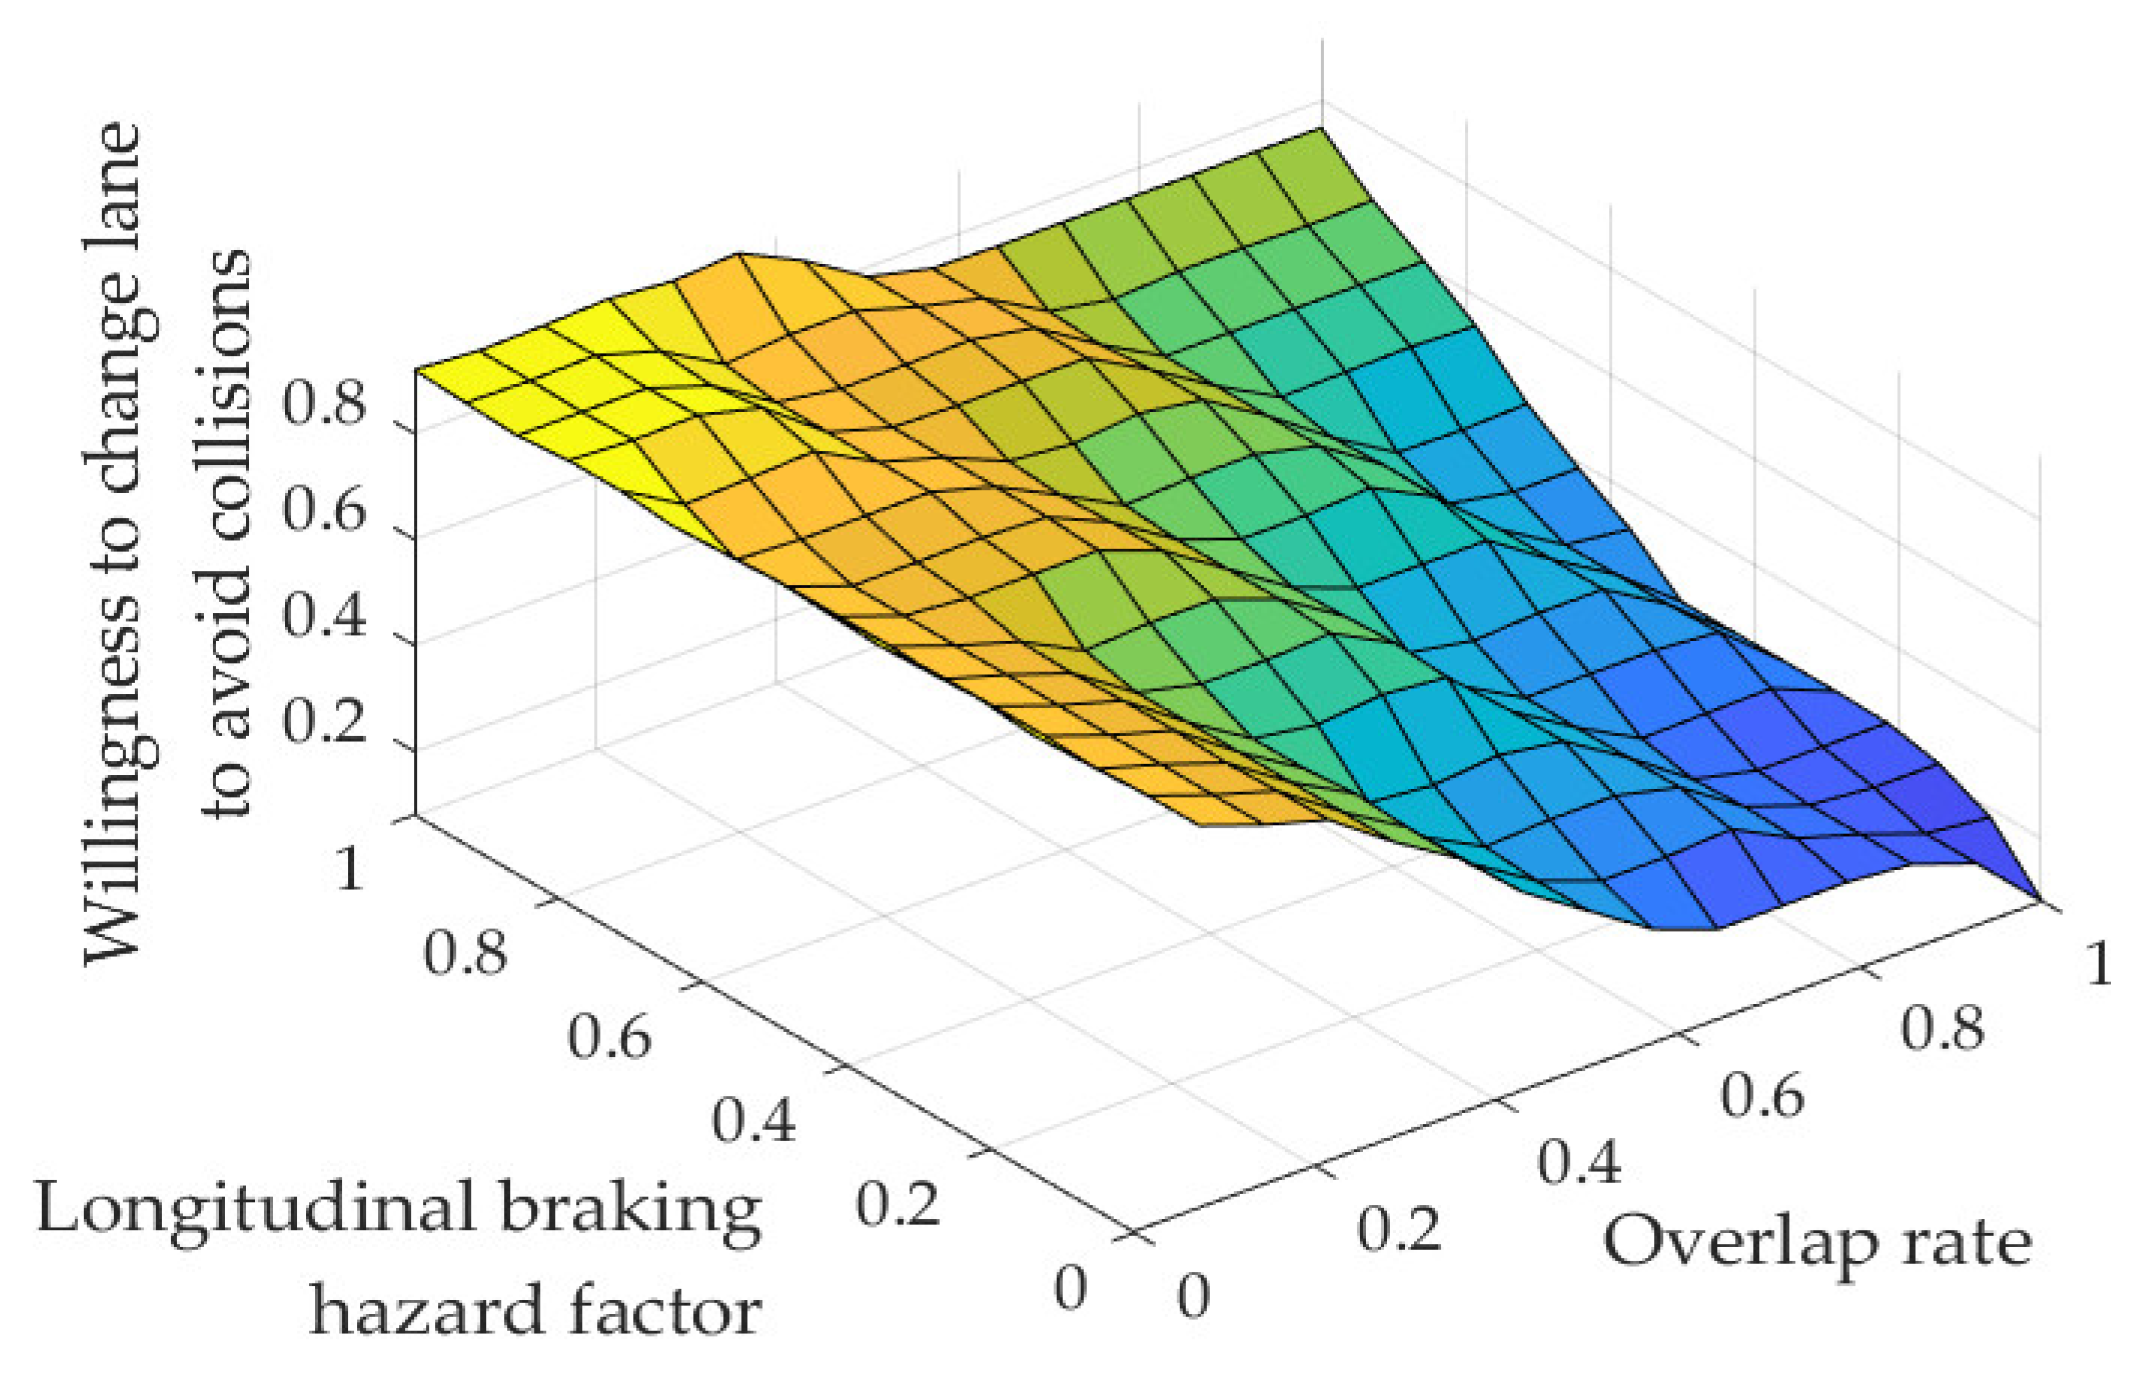
4.2. Fuzzy Controller II

In the actual collision avoidance process, the intelligent vehicle also needs to consider the impact of the overlap rate, so the longitudinal braking hazard factor and the overlap rate are used as input parameters of the fuzzy controller II, and the willingness to change lanes to avoid collision is used as an output parameter to finally determine the collision avoidance measures taken by the vehicle.
For the longitudinal braking hazard factor, the fuzzy set is {LF1, LF2, LF3, LF4, LF5}, and the range of the theory is [0, 1]. For the overlap rate, according to the national highway lane width standard, the lane width is 3.75 m; the vehicle width is 1.8 m for a B-class car, so the overlap rate is taken as [0%, 100%], and the fuzzy set is {OR1, OR2, OR3, OR4, OR5, OR6}, with a range of [0, 1]. The output quantity of the fuzzy controller is the willingness to change lanes to avoid collisions, and its fuzzy set is {W1, W2, W3, W4, W5}, and the theoretical domain range is [0, 1]. The fuzzy rule table is shown in Table 4 and follows the rule that the higher the longitudinal braking hazard factor and the lower the overlap rate, the higher the willingness to change lanes to avoid collisions and the more likely the system is to change lanes to avoid collisions. The affiliation function is a triangular function, and the fuzzy relationship law is Mamdani. The fuzzy control input–output variable relationship surface is shown in Figure 8, the different colours indicate the level of willingness to switch: the bluer the lower, the more yellow the higher.
Defuzzification of the willingness to change lanes to avoid a collision, when the willingness to change lanes to avoid a collision W > 0.5 , the collision avoidance switching strategy switches to change lanes to avoid a collision, and vice versa for braking to avoid a collision, the following Figure 9 is the flow chart of the collision avoidance switching control system.
As shown in Figure 9, X d f s is the braking collision avoidance hazard factor, W c l a is the willingness to change lanes to avoid collisions, v x f is the longitudinal speed of the vehicle in front, a e x is the desired deceleration of the self-vehicle, X e , Y e is the desired coordinates of the self-vehicle, and o v is the overlap rate of the two vehicles.
The next step is to verify the error between the two-layer fuzzy controller and the actual NGSIM data. As the US highways are asphalted, and the ground is dry at the time of testing, a pavement adhesion coefficient of 0.85 was selected, and an overlap factor of 0.55 was chosen as an input, where W c l a = 0.51 at a speed of 64 km/h, triggering the switching threshold. Twenty-four hazardous conditions data sets with overlap rates between 0.5 and 0.6 were selected as validation in the NGSIM data, and Figure 10 shows the scatter distribution of their vehicle speeds at the moment before the lane change. The mean value of these speeds was calculated to be 61.1 km/h, with an error of 4.7% from the controller output, as expected.

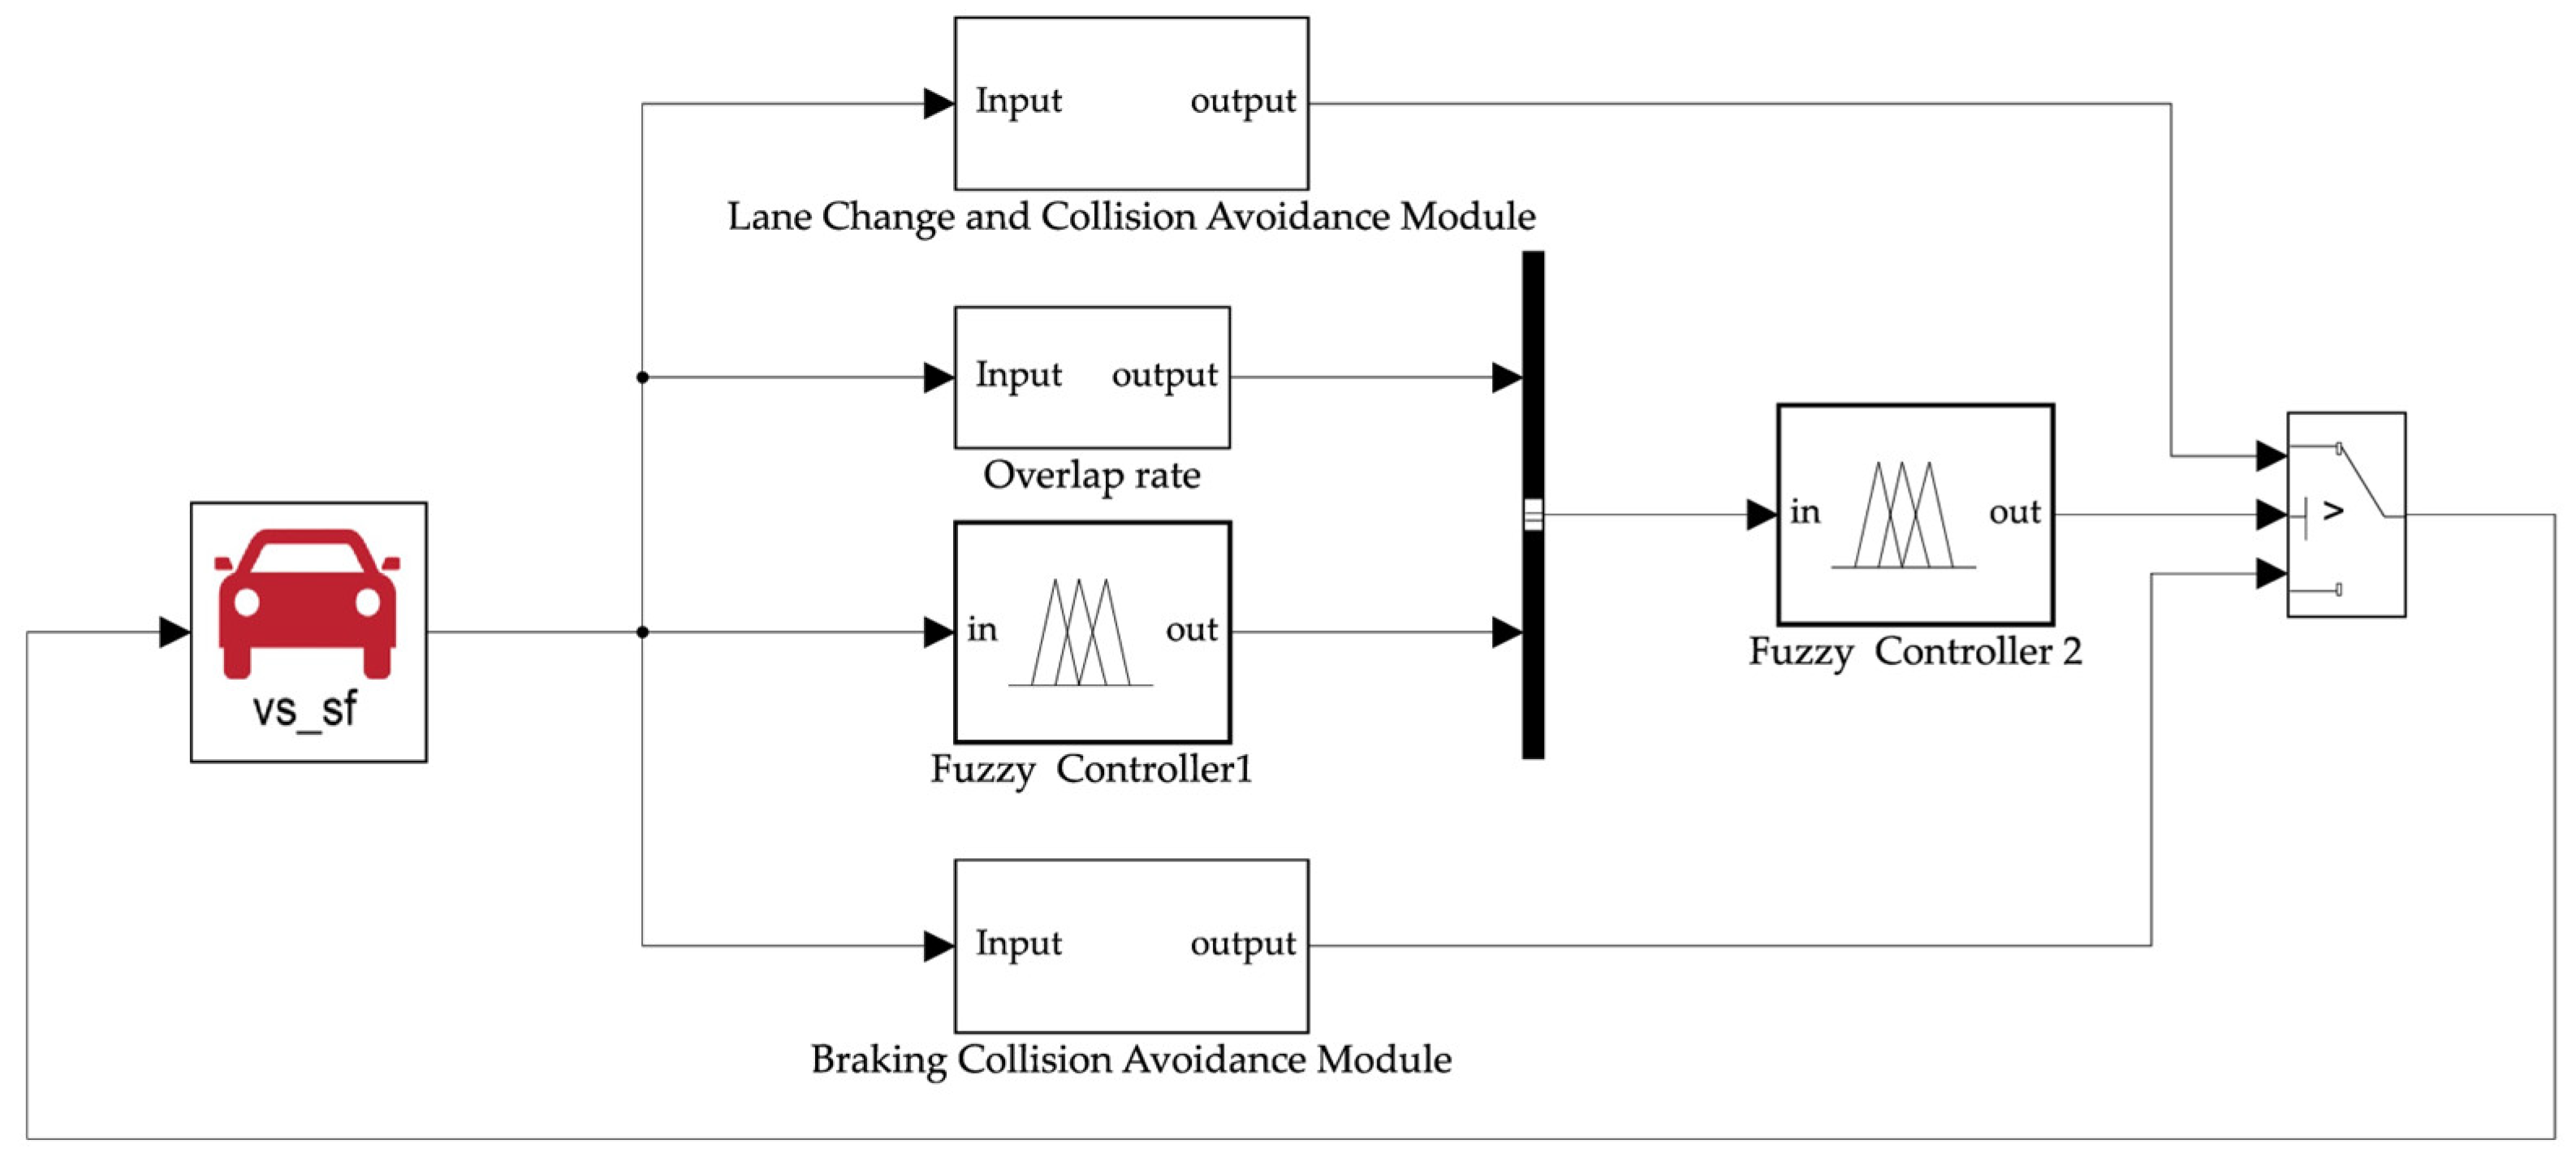
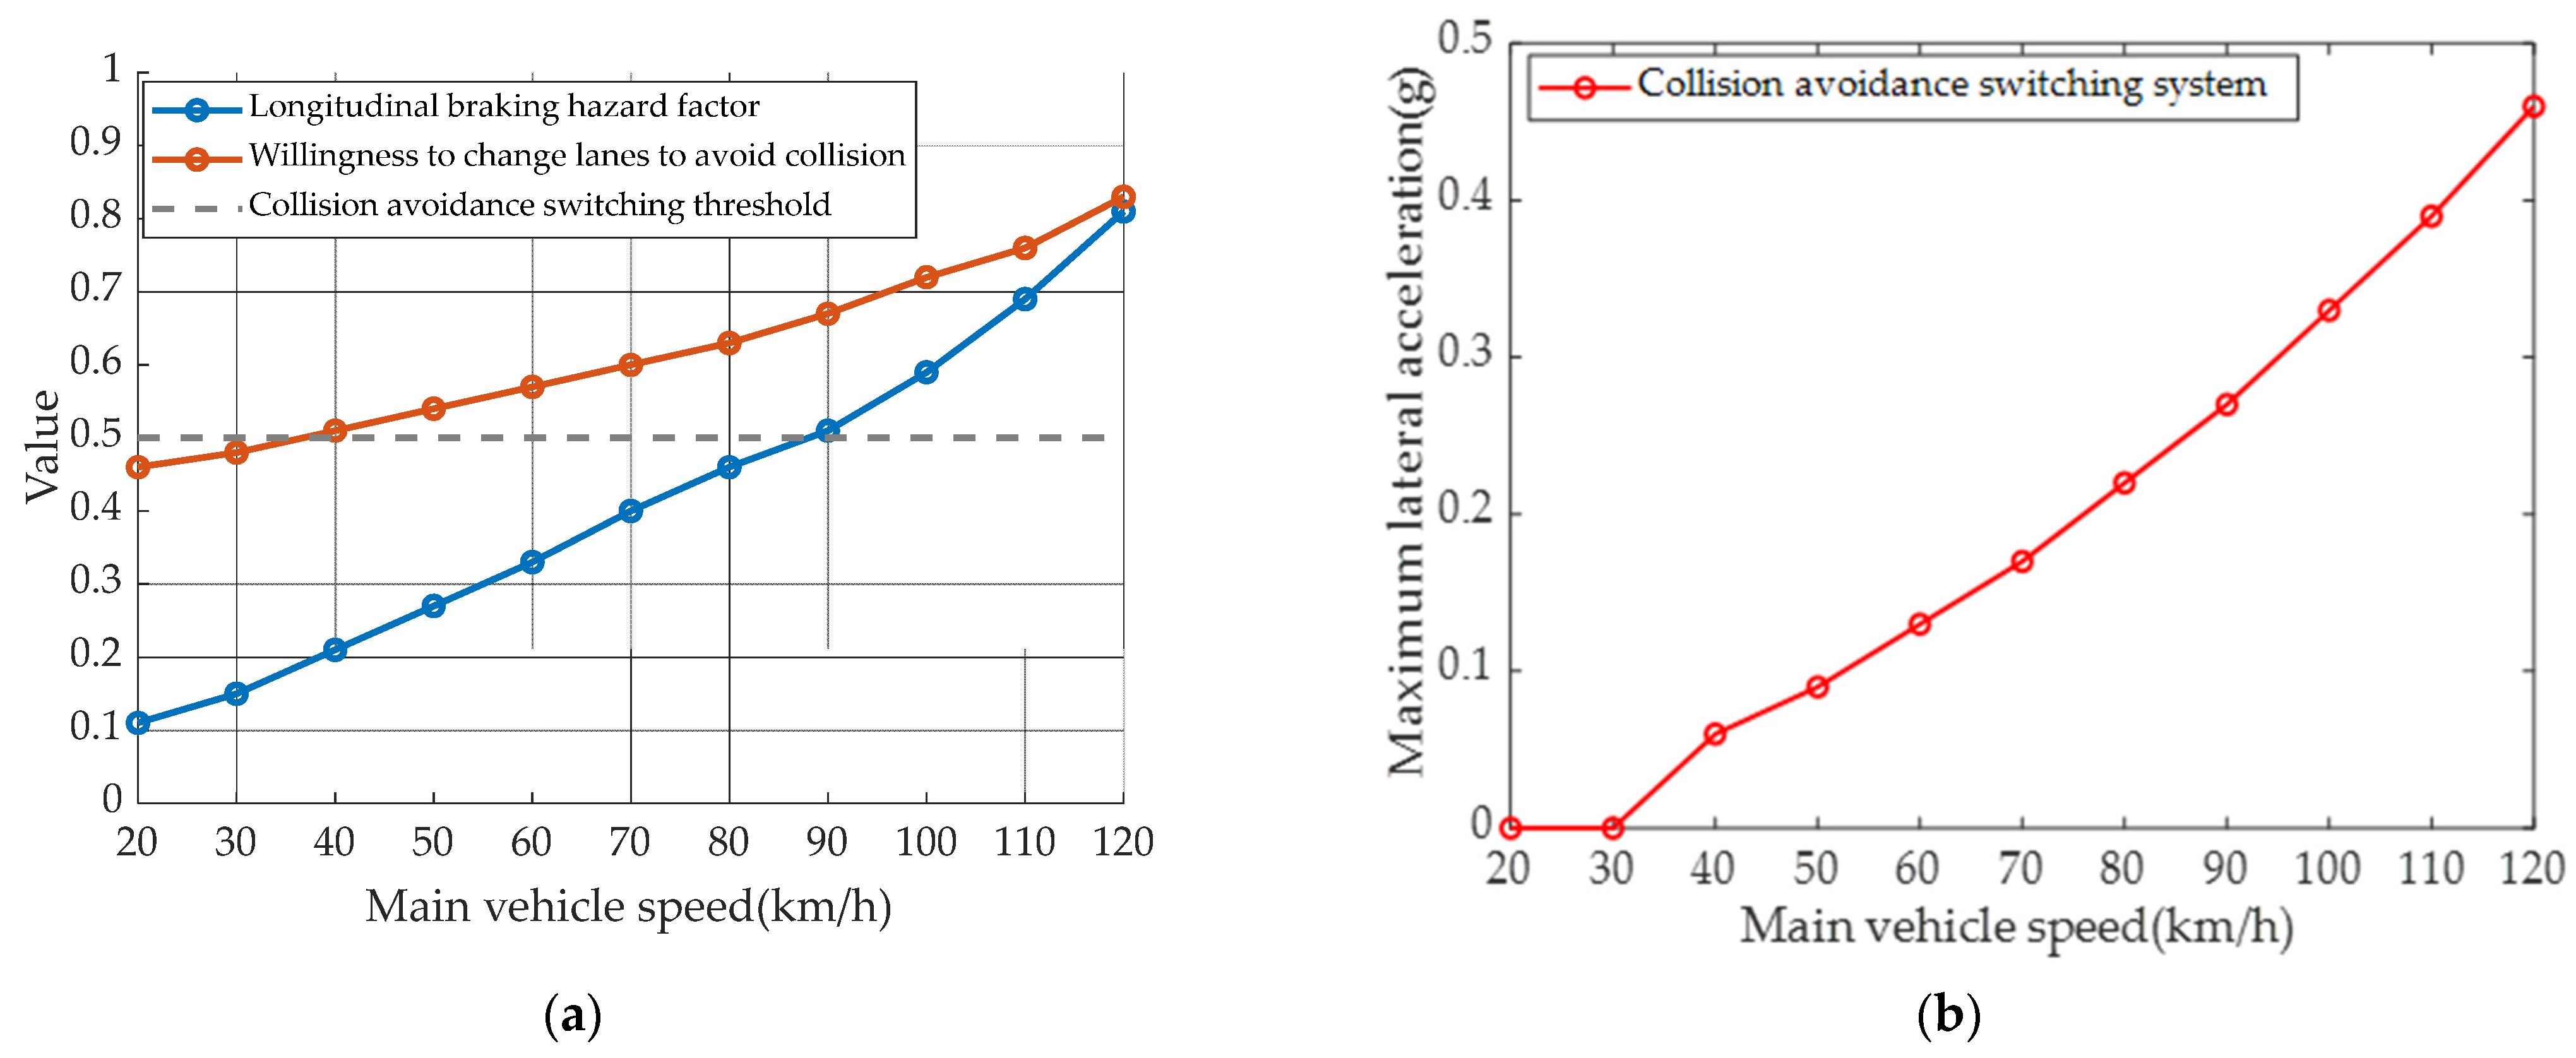
5. Simulation Verification

In order to verify the effectiveness of the collision avoidance switching control system, Matlab and CarSim simulation software are used for co-simulation, and the co-simulation model is shown in Figure 11. B-Class Hatchback models are used in the simulation in this paper, and the specific vehicle parameters are shown in Table 5 below.

5.1. Simulation of Collision Avoidance Switching Systems

From the literature [27], it can be seen that the China New Car Assessment Program (C-NCAP) has set typical test conditions for automatic emergency braking systems, and the simulation in this paper refers to the requirements of the front vehicle stationary condition (CCRS). The initial vehicle distance is set to 300 m, the overlap between the vehicle and the vehicle in front is 50%, the simulated road surface is set to wet, the adhesion coefficient is 0.55, the initial speed range of the vehicle is set to [20, 120], the speed unit is km/h, and the vehicle in the adjacent lane is not considered. The vehicle radar was selected from the ADAS Sensor Objects included in the CarSim software, with a detection distance of 750 m and a horizontal detection angle of 24 deg.
From the fuzzy controller I output can be seen, with the increase in the initial speed of the self-car, the longitudinal braking hazard coefficient will also gradually increase, by setting the collision avoidance working condition with the front car overlap rate of 50% factor by the fuzzy controller II output to get, when the initial speed of the self-car is about 36 km/h, the willingness to change lane to avoid collision reaches the collision avoidance switching threshold, at this time the collision avoidance switching control system will avoid collision by taking the change lane to avoid collision behaviour to the front car obstacle, Figure 12a shows the double-layer fuzzy controller output results.
In Figure 12b, when the collision avoidance switching system is working, its maximum lateral acceleration increases with the increase in vehicle speed, reaching a maximum value of 0.46 g < μg at 120 km/h. No instability occurs in the process of lane changing, and the collision avoidance switching system is relatively stable.
The premature activation of the active safety system by the Intelligent vehicles depending on the distance on the road in practice is likely to cause dissatisfaction among drivers with aggressive driving behaviour and may even lead to higher risks by switching off the car’s active safety functions prematurely. The next comparative study of the collision avoidance switching strategy proposed in this paper is based on the critical vehicle steering collision avoidance distance proposed in the literature [28]. In order to verify the collision avoidance effect of the collision avoidance switching system involved in this paper, the collision avoidance results of the front vehicle stationary condition (CCRS) in the fuzzy control-based braking collision avoidance method proposed in the literature [29] were selected for comparison.
As shown in Figure 13a, it can be seen that the steering collision avoidance critical safety distance increases with the initial vehicle speed, while the road adhesion condition and obstacle width will affect the critical safety distance. The smaller the road adhesion coefficient, the larger the critical safety distance; the larger the width of the obstacle, the larger the critical safety distance, mainly because the wider the obstacle, the more likely the main vehicle will have an angular collision with the obstacle, so it needs more space to avoid a collision. As the above literature does not consider the effect of overlap on the critical distance, a lower overlap with the preceding vehicle means a smaller obstacle width, i.e., a significant difference in the steering critical distance for the same lane change time of 3 s. Having an overlap ratio of Ov = 0.5 for the same vehicle width W = 1.8 m and road adhesion coefficient μ = 0.5 reduces the critical safety distance and results in a later activation of the collision avoidance system. The difference between the two critical distances increases as the vehicle speed increases, reaching a maximum of 16.8 m at a speed of 120 km/h, which means that the system activates 28% later and is more friendly to more aggressive types of drivers.
The fuzzy control-based collision avoidance system proposed in that literature distinguishes between the types of drivers: aggressive and conservative and provides two different braking collision avoidance strategies. As shown in Figure 13b, for the aggressive active collision avoidance control strategy, the relative distance between the vehicle and the stationary vehicle in front is maintained at 1.1~2.2 m after the active braking is completed in the range of 20~60 km/h; for the conservative active collision avoidance control strategy, the relative distance between the vehicle and the stationary vehicle in front is maintained at 0.9~6.1 m after the active braking is completed in the range of 20~80 km/h. Obviously, the two collision avoidance methods have a good collision avoidance effect in the low-speed range of the vehicle, but obviously cannot achieve the collision avoidance requirements in the high-speed range of the vehicle. According to the simulation of the collision avoidance switching system designed in this paper, as the collision avoidance mode is successfully switched at a speed of 36 km/h, the minimum relative distance to the stationary vehicle in front of the main vehicle is maintained at 2.1~6.6 m within the speed range of 20~120 km/h, which achieves a more excellent collision avoidance effect. The safety of the smart car was significantly improved compared to the braking collision avoidance strategy, as demonstrated by an increase in the speed range for collision avoidance of approximately 36.3%.

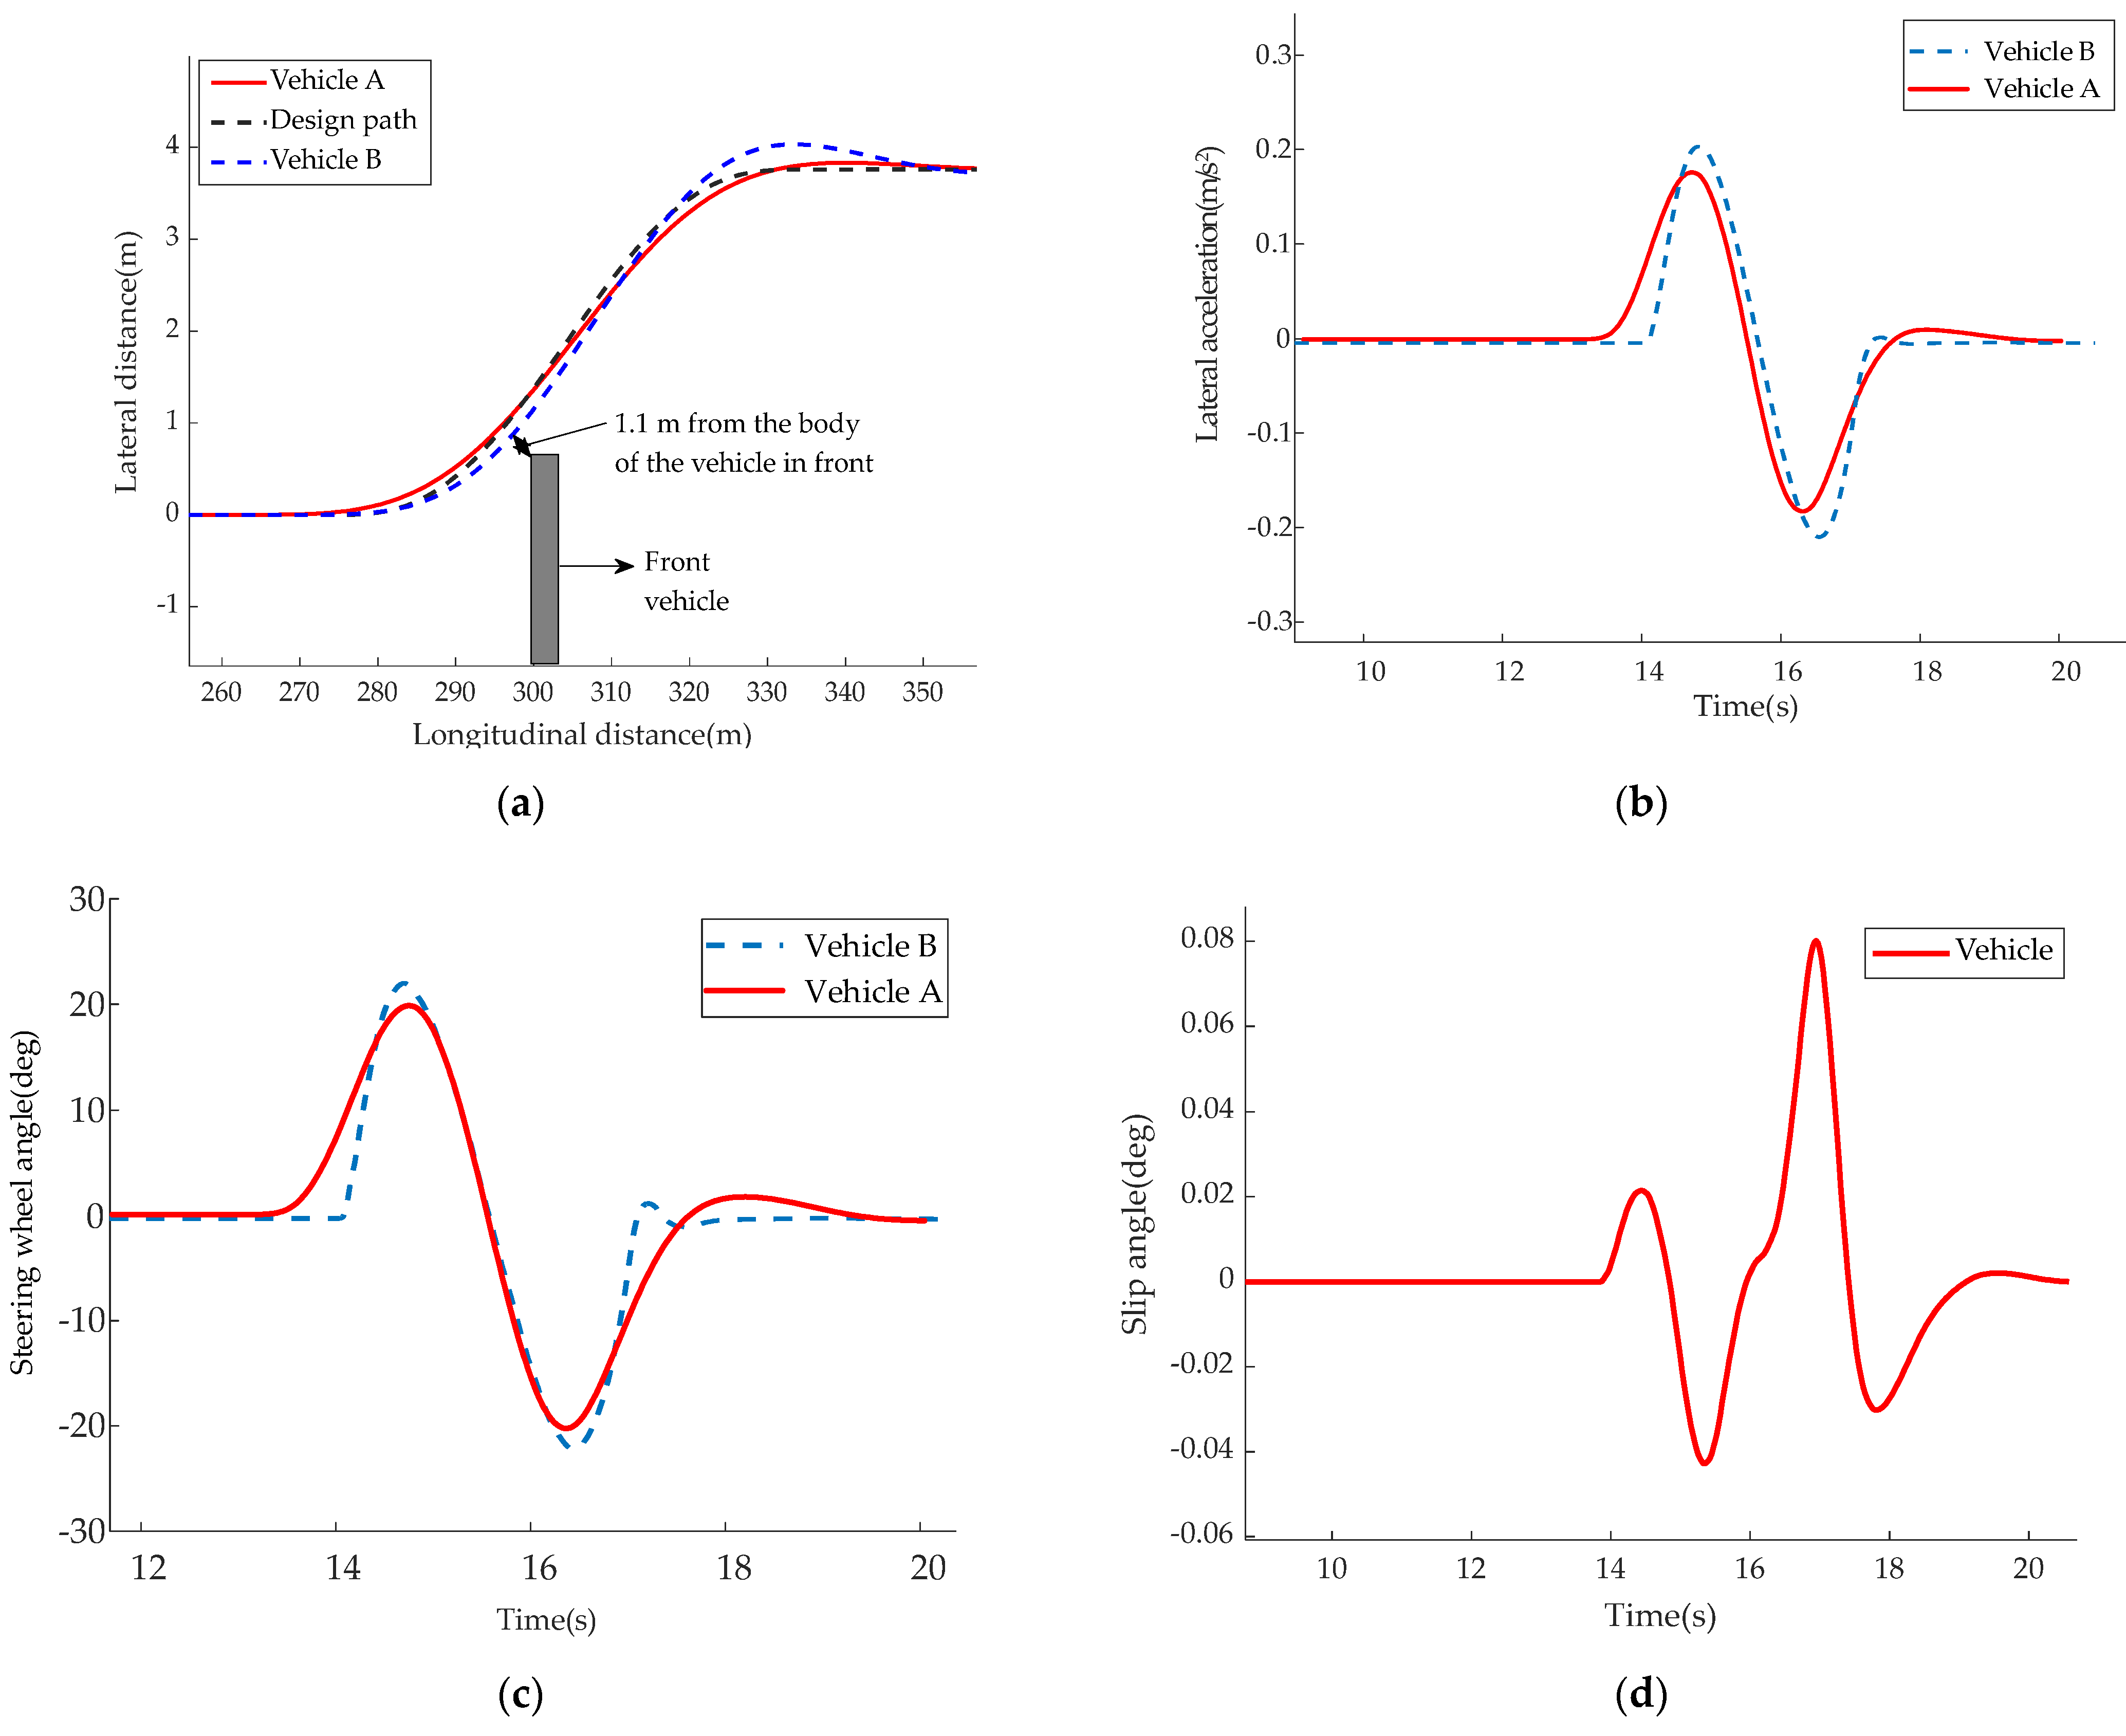
5.2. Simulation of a Collision Avoidance Switching System at a Speed of 70 km/h

In order to further verify the collision avoidance capability of the collision avoidance system proposed in this paper at high speed, the collision avoidance process of the intelligent vehicle at an initial speed of 70 km/h was selected. Vehicle A is the main vehicle, while vehicle B equipped with a PID path tracking controller, is set as a reference during the simulation.
Figure 14a shows that the collision avoidance switching system is activated when the vehicle reaches 273.4 m, and Vehicle A responds significantly faster than Vehicle B and enters the lane change process more quickly. Vehicle A is the shortest distance from the obstacle vehicle at 293.9 m, taking into account the influence of the vehicle width, so the shortest distance at this point is 5.2 m; while Vehicle B enters the lane change process later due to the limitation of the PID tracking controller, so the distance between Vehicle B and the obstacle vehicle is shorter at 298 m, the shortest distance is 1.1 m, although there is no collision, Vehicle B has a more dangerous collision Risk. As can be seen from Figure 14b, in terms of lateral acceleration, the limitations of the PID controller result in Vehicle B having a higher maximum lateral acceleration during the lane change collision avoidance process, and Vehicle A has a lower maximum lateral acceleration compared to Vehicle B. This reflects that the collision avoidance switching system equipped with the MPC controller proposed in this paper has higher steering stability. As can be seen from Figure 14c, vehicle A achieves an earlier steering process and a smoother and more stable steering curve compared to vehicle B in terms of steering wheel angle change. As can be seen in Figure 14d, the side deflection angle varies from −0.042 to 0.081 deg, which is within the linear range of the tyres.

6. Conclusions

In this paper, a collision avoidance switching system based on the driver’s collision avoidance behaviour is proposed. A longitudinal collision avoidance model based on safety distance and a lane change collision avoidance model based on MPC tracking control are also established. In terms of the collision avoidance switching strategy, a two-layer fuzzy controller that takes into account the overlap rate of two vehicles is adopted, and the collision avoidance switching strategy refers to the parameters extracted from the NGSIM actual traffic dataset to achieve the purpose of intelligent switching, enabling the vehicle to reasonably switch the collision avoidance method under different driving conditions. According to the simulation results, the proposed collision avoidance switching system has a more excellent collision avoidance effect and is more adaptable to the driving conditions.
The next step in the research will be to take real vehicles for verification, and theoretical research will also focus on the impact of other lanes of traffic and extreme road conditions on the active safety collision avoidance system.

Author Contributions

Conceptualisation, G.L., B.L. and T.L.; methodology, S.B. and G.L.; software, G.L.; validation, G.L., S.B. and B.L.; formal analysis, G.L.; investigation, S.B. and Z.Z.; resources, B.L., W.D. and H.T.; data curation, G.L. and W.D.; writing—original draft preparation, G.L.; writing—review and editing, G.L.; visualisation, J.G.; supervision, B.L.; project administration, B.L.; funding acquisition, S.B. All authors have read and agreed to the published version of the manuscript.

Funding

This research was funded by the National Natural Science Foundation of China under grant number 52172367, The Natural Science Foundation of the Jiangsu Higher Education of China under grant number 21KJA580001, Changzhou International Science and Technology Cooperation Fund under grant number CZ20220031. The APC was funded by 52172367.

Data Availability Statement

Not applicable.

Conflicts of Interest

The authors declare no conflict of interest.

References

  1. National Bureau of Statistics of China. Traffic Accident Statistics [DB/OL]. Available online: http://data.stats.gov.cn/index.htm (accessed on 10 April 2023).
  2. Xu, Z.; Zhao, W.; Wang, C.; Dai, Y. Local Path Planning and Tracking Control of Vehicle Collision Avoidance System. J. Nanjing Univ. Nat. Sci. 2018, 35, 729–738. [Google Scholar]
  3. Yong, J.; Li, Y.; Feng, N.; Li, U.Y. Adaptive automatic emergency braking control strategy based on an ESHB system. J. Automot. Saf. Energy 2022, 13, 300–308. [Google Scholar]
  4. Zhang, Z.; Luo, D.; Rasim, Y.; Li, Y.; Meng, G.; Xu, J.; Wang, C. A Vehicle Active Safety Model: Vehicle Speed Control Based on Driver Vigilance Detection Using Wearable EEG and Sparse Representation. Sensors 2016, 16, 242. [Google Scholar] [CrossRef] [PubMed] [Green Version]
  5. You, B. Research on Hierarchical Control Strategy for Autonomous Emergency Braking System Based on Prescan. Agric. Equip. Veh. Eng. 2022, 60, 54–59. [Google Scholar]
  6. Xiao, Y.; Yin, S.; Cui, G.; Yao, L.; Fang, Z.; Zhang, W. A Near-Field Area Object Detection Method for Intelligent Vehicles Based on Multi-Sensor Information Fusion. World Electr. Veh. J. 2022, 13, 160. [Google Scholar] [CrossRef]
  7. Humaidi, A.; Fadhel, M.; Ajel, A. Lane detection system for day vision using altera DE2. Telkomnika 2019, 17, 349–361. [Google Scholar] [CrossRef] [Green Version]
  8. Liu, Y.; Lv, K.; Zhao, J.; Liu, C.; Qiao, J. Research Review on Development of AEB Control Strategy Based on Human, Vehicle, Road and Environment. Automob. Technol. 2021, 548, 1–8. [Google Scholar]
  9. Hu, Y.; Lv, Z.; Liu, X. Algorithm and simulation verifcation of longitudinal collision avoidance for autonomous emergency break (AEB) system based on PreScan. J. Automot. Saf. Energy 2017, 8, 136–142. [Google Scholar]
  10. Yuan, W.; Jiang, Z.; Guo, Y. Research on Vehicle Active Collision Avoidance System Based on the Coordinated Actions of Braking and Steering. China J. Highw. Lransp. 2019, 32, 173–181. [Google Scholar]
  11. Yin, P.; Jiang, Z.; Ye, M.; Zhao, S.; Zhou, B. Research on Active Collision Avoidance Control System Considering Steering. Automob. Technol. 2019, 526, 1–7. [Google Scholar]
  12. Chen, X.; Cheng, S.; Zhao, W.; Wang, C.; Jiang, R. Extension-decision-based adaptive collision avoidance control for vehicles. China. J. Mech. 2023, 55, 213–222. [Google Scholar]
  13. Yan, M.; Wei, M.; Wang, K.; Zhao, W.; Wang, Y.; Zhang, F. Cooperative Collision Avoidance Control of Steering and Braking Based on Function Allocation and Multi-Objective Fuzry Decision. J. Chongqing Univ. Technol. Nat. Sci. 2018, 32, 63–71. [Google Scholar]
  14. Meng, L.; Zhu, X.; Sun, X.; Li, L.; Jiang, L. Analysis on Factors Affecting Drivers’ Steering Evasive Maneuvers in Real Traffic Risk Scenarios. Automob. Technol. 2016, 489, 59–62. [Google Scholar]
  15. Li, L.; Zhu, X.; Chen, H. Drivers’ Collision Avoidance Limit by Braking and Steering. J. Tongji Univ. Nat. Sci. 2016, 44, 1743–1748. [Google Scholar]
  16. Hussain, Q.; Dias, C.; Al-Shahrani, A.; Hussain, I. Safety Analysis of Merging Vehicles Based on the Speed Difference between on-Ramp and Following Mainstream Vehicles Using NGSIM Data. Sustainability 2022, 14, 16436. [Google Scholar] [CrossRef]
  17. Qu, D.; Wang, S.; Liu, H.; Meng, Y. A Car-Following Model Based on Trajectory Data for Connected and Automated Vehicles to Predict Trajectory of Human-Driven Vehicles. Sustainability 2022, 14, 7045. [Google Scholar] [CrossRef]
  18. Yu, Z. Automotive Theory, 5th ed.; China Machine Press: Beijing, China, 2009; pp. 98–100. [Google Scholar]
  19. Yuan, C.; Lin, Y.; Shen, J.; Chen, L.; Cai, Y.; He, Y.; Weng, S.; Wu, X.; Yuan, Y.; Gong, Y.; et al. Research on Active Collision Avoidance and Hysteresis Reduction of Intelligent Vehicle Based on Multi-Agent Coordinated Control System. World Electr. Veh. J. 2023, 14, 16. [Google Scholar] [CrossRef]
  20. Feng, M. Research on Vehicle Lane Changing Model Predictive Control Strategy Based on Lateral and Longitudinal Control. Master’s Thesis, Dalian University of Technology, Dalian, China, 2021. [Google Scholar]
  21. Wang, S.; Sun, W.; Liu, Z. Analysis on Lateral Acceleration of Lane Changing in Vehicle Stability. Mach. Des. Manuf. 2020, 353, 17–20+24. [Google Scholar]
  22. Li, Y.; Guo, C.; Li, Y.; Zhao, Y. Trajectory tracking control of autonomous vehicle based on steering and braking coordination. JSEE 2023, 45, 1185–1192. [Google Scholar]
  23. U.S. Department of Transportation Federal Highway Administration. Next Generation Simulation (NGSIM) Vehicle Trajec tories and Supporting Data. [Dataset] Provided by ITS DataHub through Data.transportation.gov. 2016. Available online: https://data.transportation.gov/Automobiles/Next-Generation-Simulation-NGSIM-Vehicle-Trajector/8ect-6jqj (accessed on 13 January 2023).
  24. Xia, Y.; Qin, Y.; Li, X.; Xie, J. Risk Identification and Conflict Prediction from Videos Based on TTC-ML of a Multi-Lane Weaving Area. Sustainability 2022, 14, 4620. [Google Scholar] [CrossRef]
  25. Humaidi, A.; Najem, H.; Al-Dujaili, A.; Pereira, D.; Ibraheem, I.; Azar, A. Social spider optimization algorithm for tuning parameters in PD-like Interval Type-2 Fuzzy Logic Controller applied to a parallel robot. Meas. Control 2021, 54, 303–323. [Google Scholar] [CrossRef]
  26. Virant, M.; Ambrož, M. Universal Safety Distance Alert Device for Road Vehicles. Electronics 2016, 5, 19. [Google Scholar] [CrossRef] [Green Version]
  27. Liu, F. Research on AEB System Test under low Friction Condition Based on C-NCAP Test Method. Master’s Thesis, Chang′an University, Xi’an, China, 2022. [Google Scholar]
  28. Luo, C.; Wang, G.; Zhang, S.; Zhang, W. A Switching Strategy of Active Collision Avoidance Mode Based on Critical Safety Distance. J. Chongqing Univ. Technol. Nat. Sci. 2020, 34, 27–35. [Google Scholar]
  29. Li, W.; Guo, W.; Shi, X.; Lu, Y.; Zhang, Y. Vehicle Active Collision Avoidance System Based on Fuzzy Control and Simulation Verification. J. Chongqing Univ. Technol. Nat. Sci. 2021, 35, 28–36. [Google Scholar]
Figure 1. Diagram of lane change to avoid collision.
Wevj 14 00150 g001
Figure 2. Vehicle three-degree-of-freedom dynamics model.
Wevj 14 00150 g002
Figure 3. Schematic illustration of highway: I-80.
Wevj 14 00150 g003
Figure 4. Schematic diagram of the data processing flow.
Wevj 14 00150 g004
Figure 5. The distribution of hazardous conditions:(a) Collision hazard rating distribution; (b) Overlap rate rating distribution.
Wevj 14 00150 g005
Figure 6. The distribution of hazardous conditions: (a) Braking behaviour and overlap rate; (b) Braking behaviour and vehicle speed.
Wevj 14 00150 g006
Figure 7. Diagram of the fuzzy controller I variable relationship surface. The different colours indicate the level of the longitudinal brake hazard factor: the bluer the lower, the more yellow the higher.
Wevj 14 00150 g007
Figure 8. Diagram of the fuzzy controller II variable relationship surface. The different colours indicate the level of the longitudinal brake hazard factor: the bluer the lower, the more yellow the higher.
Wevj 14 00150 g008
Figure 9. Flow chart of the collision avoidance switching system operation.
Wevj 14 00150 g009
Figure 10. Scatter plot of vehicle speeds in NGSIM dataset.
Wevj 14 00150 g010
Figure 11. Diagram of the simulation model of the collision avoidance switching system.
Wevj 14 00150 g011
Figure 12. Simulation of vehicle speeds from 20 to 120 km/h: (a) output of the two-level fuzzy controller; (b) maximum lateral acceleration.
Wevj 14 00150 g012
Figure 13. Simulation of vehicle speeds from 20 to 120 km/h: (a) comparison of critical steering distances for lane change collision avoidance models; (b) comparison results with braking collision avoidance systems.
Wevj 14 00150 g013
Figure 14. Simulation of lateral collision avoidance at a speed of 70 km/h: (a) Lane−changing track; (b) Lateral acceleration; (c) Steering wheel angle; (d) Slip angle.
Wevj 14 00150 g014
Table 1. Some of the attributes and their definitions.
Attribute LabelAttribute Definition
Vehicle_IDVehicle identification number.
Total_FramesTotal number of frames in which the vehicle appears in this data set.
Local_XLateral (X) coordinate of the front centre of the vehicle with respect to the left-most edge of the section in
the direction of travel.
Local_YLongitudinal (Y) coordinate of the front centre of the vehicle with respect to the entry edge of the section in
the direction of travel.
v_ClassVehicle type: 1—motorcycle, 2—auto, 3—truck.
v_VelInstantaneous velocity of vehicle.
Frame IDFrame Identification number.
Lane_IDCurrent lane position of vehicle.
Preceding Vehicle Id of the lead vehicle in the same lane. A value of ‘0’ represents no preceding vehicle.
Table 2. Schematic table of filtering results for NGSIM road dataset.
NumberParametersParameter ValueQuantity (Sets)Distribution (%)
1Lateral acceleration>0.4 g64844
≤0.4 g83656
2Collision hazardYes23737
No48063
3Main vehicle speed>60 km/h13858
≤60 km/h9942
4Overlapping ratio>50%15064
≤50%8736
5Braking behaviourYes13255
No10545
6TTCTTC > 3 s48063
2 s < TTC < 3 s203
1 s < TTC < 2 s599
TTC < 1 s15825
Table 3. Fuzzy control rules in Table 1.
Longitudinal Braking Hazard FactorMain Vehicle Speed
MS1MS2MS3MS4MS5
Road
adhesion
coefficient
RC1LF3LF3LF4LF4LF5
RC2LF2LF2LF3LF4LF5
RC3LF1LF2LF3LF4LF4
RC4LF1LF2LF2LF4LF4
RC5LF1LF1LF2LF3LF4
Table 4. Fuzzy control rules in Table 2.
Willingness to Change Lane to Avoid CollisionsLongitudinal Braking Hazard Factor
LF1LF2LF3LF4LF5
Overlap
rate
OR1W5W5W5W5W5
OR2W4W4W4W5W5
OR3W3W3W4W4W5
OR4W2W3W3W4W4
OR5W2W2W3W3W4
OR6W1W2W2W3W4
Table 5. Basic parameters of the vehicle.
ParameterValueUnit
Vehicle Mass (m)1530kg
Inertia around the vertical shaft (Iz)1742kg∙m2
Distance from c.g. to front axle (a)1.78m
Distance from c.g. to rear axle (b)1.37m
Centre of Gravity Height (H)0.54m
Vehicle width (WS)1.8m
Coefficient of air resistance (CD)0.271
Coefficient of rolling resistance (Crr)0.011
Frontal area (A)1.8m2
Disclaimer/Publisher’s Note: The statements, opinions and data contained in all publications are solely those of the individual author(s) and contributor(s) and not of MDPI and/or the editor(s). MDPI and/or the editor(s) disclaim responsibility for any injury to people or property resulting from any ideas, methods, instructions or products referred to in the content.

