1. Introduction
Nowadays, the drastic reduction in the use of fossil fuels and the growing awareness of deteriorating climatic conditions has led to the adoption of alternative energy technologies [
1]. Among the various technologies developed, one is the electric vehicle (EV), which is fast becoming a part of the modern system [
1].
In Ecuador, since 2015, incentives for the acquisition of electric vehicles have been promoted to citizens in general [
2]. From that date until July 2021, 655 electric vehicles have been commercialized nationwide. Compared to the total number of gasoline vehicles, which, as of January 2020, totaled 2,068,671 units registered [
3,
4], the share of EVs in Ecuador is negligible. Between January and July 2022, 108 electric cars were registered, which represents a 0.16% share of sales, totaling 65,604 units [
2], between light and commercial vehicles in the same period 5 months ago.
According to [
5], there are two factors that affect the acceptance of electric vehicles by the community: internal and external factors. Within the internal factors, there are certain characteristics of the electric vehicle, such as its autonomy, charging time and cost, which make it less convenient in today’s world. It is precisely the autonomy of some electric models, which is less than that of a combustion vehicle, that is the main obstacle when choosing an electric model. Added to this, there are external factors such as consumer characteristics and fuel prices, but it is the availability of charging stations that plays an important role, since the limited availability of charging stations can discourage the purchase of electric vehicles [
1].
In Ecuador, according to [
4], there are seven major brands available on the market (Nissan, Kia, MG, Zhidou, BYD, Dayang and Kaiyun), all models with different levels of autonomy. If we take the case of the KIA Soul EV, a model marketed by the KIA brand throughout the Ecuadorian territory and which enjoys an approximate EPA autonomy of 150 km, according to what is reported in [
6], for use in urban environments in cities in the center of the country such as Riobamba, Ambato and Latacunga, among others, with a recharge at each user’s home, it could meet the needs of each driver. However, it must be considered that drivers from these three cities will always have to consider traveling to the city of Quito for family, commercial, work or legal reasons. In this context, the autonomy of an electric vehicle such as the KIA Soul to make a trip from the city of Riobamba to Quito means this trip could not be made, since the distance between these two points can be up to 194.04 km [
7]. This leads to the consideration that in order to make the trip and travel between the cities, the driver will have to make stops along the route to recharge the car.
Currently, in Ecuador, there is a great variety of works concerning the location of recharging points for electric vehicles in the main cities; nevertheless, there are no specific studies concerning interurban cases. Thus, the present study arises as an alternative, based on the need to know what the minimum recharging infrastructure is that should be available along an intercity route to ensure the fulfillment of the route with a single electric vehicle. In this particular case, the proposal is to analyze the Riobamba–Quito route because this will benefit not only the users of Riobamba and Quito, but also the towns of Ambato, Latacunga and other neighboring sectors of zone 3 of the country. The research results will also provide relevant information regarding the implementation of these charging stations to the national government and investors who would be interested in investment in the development of the EV fleet in the central part of the country.
1.1. Electric Vehicle Charging Station Location Methodologies
There is a variety of studies dedicated to determining the best location for electric vehicle charging points. According to [
8], the studies can be focused on the energy network or the travelers. From the travelers’ point of view, the studies center on the location of charging points according to trip characteristics; another classification that can be proposed is according to the development of intercity and intracity charging infrastructure [
8].
Using this concept, it has been generalized that in intercity infrastructure planning, a flow-based approach can be used, whereas intra-urban infrastructures are based on the node approach [
8]. The difference between the two approaches focuses on the fact that the autonomy of an EV is sufficient for short trips within the intracity area; therefore, the charging demand occurs at the origin or destination of the trip; whereas for long trips, as the autonomy of an EV is not sufficient for long distances, the charging demand occurs during the trip [
8].
Among the most relevant works is the study conducted by the authors of [
9]. In this research, the locations of recharging stations are determined by considering mainly the characteristics of traffic flows in addition to demographics. In the investigation presented by the authors of [
10], a stochastic flow capturing location model (FCLM) is provided. This model takes into account the stochastic demands of users along the routes, as well as the installation cost and the quality of service of a charging station.
In the literature review, there are also other approaches to develop methodologies for the location of recharging points at the interurban level, such as the work presented in [
8], in which the location of charging points is proposed using multi-criteria methods weighted both to roads and to counties and districts. For this purpose, an evaluation oriented to points on national roads has been directed by investigating mainly existing resting places as possible recharging stations and designating strategic sectors as mandatory location sites. These methods were applied in Hungary at the national road level.
However, the study presented in [
11] proposes a location methodology based on the maximum distance between fast charge (MDFC), a figure from which the basic highway charging infrastructure (BHCI) is planned. According to the model the researchers propose, the distance between charging stations will depend on the region, mainly influenced by weather conditions. It is also concluded from the results of the method that the investment reflected in the proposed charging points would be sufficient to promote the acceptance of EVs, since the intention is to promote initial public infrastructure financed by the government. In fact, this calculation proposal has been replicated in Colombia by the Mining and Energy Planning Unit (UPME acronym in Spanish), establishing in the document [
12] the recommendations regarding recharging infrastructure for electric mobility in Colombia for different types of vehicle.
There are also large numbers of latent studies and thesis works that address the implementation of electric gas stations in the major cities of Ecuador in depth, such as [
13,
14]. In the interurban case, the study presented in [
15] can be cited as a reference. In this investigation, a Monte Carlo simulation is used for the analysis of the implementation of charging stations in the Province of Galapagos, assuming scenarios of replacements of the vehicle fleet in the locality. At such a level, it is important to highlight the need to propose alternative methodologies to extend the study of the location of charging points for electric vehicles to interurban cases since this is the sector that most needs this type of study, and its development can ensure a better immersion of electric vehicles at the national level.
1.2. Objectives of the Study
The objective of this study is to determine the location of the minimum intercity charging infrastructure for electric vehicles on the Riobamba–Quito route. For this, we proposed determining the maximum distance between fast charges on the road, considering aspects such as the autonomy of existing vehicles in the country and the considerations of the type of route where the charging infrastructure is planned.
We also proposed using an energy evaluation model in order to simulate the trips and recharging events of an electric vehicle subjected to the route under study to validate the proposal. GPS is used to analyze the data collected on the road.
The contribution of this study is to establish the location of charging stations for electric vehicles, as well as to recommend the minimum technical characteristics they should have to meet the needs of EVs on the study route.
2. Materials and Methods
This section describes the methodological process followed for this study. For the location of the charging infrastructure on the road, the MDFC methodology is mainly used. Subsequently, to evaluate the proposed location, a Simulink simulation is used in which the interaction of the EV and the location of the charging infrastructure can be evaluated using GPS data obtained on the road. For the reader’s convenience,
Figure 1 shows the methodological scheme followed.
2.1. Characteristics of the Route
The route under analysis for this study is the highway that connects the cities of Riobamba and Quito, known as the E35 Panamerican Highway. The respective bus terminals of both cities are established as the starting and arrival points since these are the locations where the traffic that connects these two cities is concentrated. The analysis is developed on a round-trip basis, considering the route obtained from the Google Maps application. The application reports a distance of 184 km and a total traveling time of 3 h and 3 min. These parameters may vary due to traffic circumstances, but are considered as a reference when planning this type of trip. The route has 2 to 4 lanes, and crosses important cities such as Ambato and Latacunga through peripheral roads.
Figure 2 shows the route used in this study.
2.2. Fast Charging Point Location Methodology Based on MDFC Calculation
This methodology proposed in [
11] takes the MDFC as the basic charging infrastructure planning figure, which is the distance in km between fast charging stations that would allow the EV to reach the station, including a safety margin. The method considers the use of fast charging because with this standard, the charging times are comparable to the refueling times in conventional internal combustion vehicles.
According to the authors, compared to other methods focused on the number of charging stations per vehicle, the calculation of the distance with the distance method is more practical, since it allows better location of the charging stations.
The calculation uses the expression presented in Equation (1)
here,
Rm represents the value of the EV range in km; the value to be used is the minimum range corresponding to the lowest value of existing category vehicles (“conservative
Rm”) or the average range of the accumulated vehicle fleet in a country (“real
Rm”).
Mw is the climate margin.
Mf is the margin of flexibility, which depends on aspects such as the type of road, driving style or traffic conditions, and
k is the simultaneity factor, which considers the coincidence of climatic conditions together with the flexibility factors [
11].
The method is presented at the end as the evaluation of a BHCI, defined as the minimum number of recharging points needed on the roads of a country to allow transportation with a single EV. For this purpose, Equation (2) is used.
where
Tn is the total length of the road network in km and
BHCI is the number of stations required for the minimum infrastructure.
2.3. Application of the Method to the Route under Study
According to [
11], the main input data for calculating the MDFC consist of information obtained from EV manufacturers, while supplementary information such as weather conditions and flexibility margins are country-specific factors.
2.3.1. Determination of Rm
In order to analyze the autonomy and the evolution of this variable, the electric vehicles available on the market are selected, discarding urban vehicles with low autonomy or those that do not have fast charging capacity. The information analyzed comes from EV manufacturers and the Association of Automotive Companies of Ecuador (AEADE is its acronym in Spanish).
Figure 3 shows the evolution of the electric vehicle fleet in Ecuador, where it is possible to appreciate the great market presence of the Kia Soul EV.
Table 1 presents the cumulative number of electric vehicles suitable for road trips sold in Ecuador from 2016 to 2022 and their autonomy according to manufacturers’ data. In order to choose the value of 𝑅𝑚, i.e., the value of the average autonomy, the value of 150 km (EPA) corresponding to the KIA Soul EV vehicle has been used. This leads us to choose a conservative Rm value, instead of a real one, but this decision is made because there is a majority presence of this vehicle in Ecuador. In addition, it is the vehicle with the lowest declared autonomy after the Volkswagen E-Golf, of which there is only one unit in the country.
2.3.2. Determination of Mw
For the climatic margin, the recommendations provided by the method have been considered and applied to the climatic conditions of the route under study. For this purpose,
Table 2 provides average climatic data of the main cities along the route under study.
The data provided come mainly from statistical analysis of historical climatological reports and model reconstruction from sources such as Cotopaxi International Airport and José Joaquín de Olmedo Airport [
41].
Taking into consideration that the temperature at which this route is traveled can be a minimum of 7 °C and a maximum of 20 °C, on average, a value of 15% is chosen from the margins recommended in [
11] for base heating requirements in temperatures above 0 °C. This decision allows drivers to make use of the EV’s heating and A/C system on the route.
2.3.3. Determination of Mf
This is a value that is composed with respect to various aspects of the road, as well as the driving style that is assumed, which may affect the EV’s autonomy. The first step is to select the percentage of impact that the maximum driving speed on the road will have. On the roads of Ecuador, the maximum speed on a highway is 100 km/h, so according to the margins proposed in [
11], the value to be selected for the traffic speed for estimated
Mf is 20%.
Next, the margin increase factors should be included; 5% will be added for driving style since it is considered the worst-case scenario in which the driver drives the vehicle in an aggressive manner on the road, and it is assumed that an ecological driving style will not be adopted. With respect to the high traffic factor, we also decided to use the maximum value of 5%, due to the high traffic on the Riobamba–Ambato section, since this road has only two lanes [
42], in addition to the fact that in part of the city of Quito, to reach the planned destination, i.e., the Quitumbe Bus Terminal, there are stretches of urban driving.
With respect to the margin for incomplete charging patterns, i.e., when users are not accustomed to making full charges, a value of 5% is assumed, the maximum value recommended by [
11], so that the fast charging stations planned proposal could accept a trip with a vehicle that is not fully charged from the starting point.
According to the study in [
43] in which the energy consumption of land transport on mountainous roads was evaluated, the authors report that the range of an EV in this type of orography can be affected by up to 26.9% with respect to the NEDC autonomy. This study scenario considers an aggressive driving style with little traffic and a low speed profile with speed limits between 30 and 60 km/h. The route used is of the mountainous type between Andorra la Vella and Canillo with an elevation difference of 600 m above sea level. In the case of the present study,
Figure 4 shows the altimetry of the route obtained using Google Earth software, where it can be seen that there are considerable ascents and descents during the trip. The maximum height reported is 3604 m above sea level and the minimum is 2366 m above sea level.
In the application of the MDFC method reported in [
12] in Colombia, it is recommended that a factor for driving on mountain roads be added to the flexibility factor, so for the present study, considering the experiences of Colombia and Andorra, 10% is used as a factor for mountain roads.
Table 3 shows the values chosen to determine the final value of
Mf.
2.3.4. Determination of k
This value corresponds to the simultaneity factor and considers the coincidence of weather conditions with the flexibility factor. With climatic margins higher than 40%, adverse weather conditions are assumed, whereby the speed is limited by the driver’s caution. According to [
11], taking the value of 1 is suggested when the climatic margin is zero or 10%, a similar condition to the one analyzed in this study. The value of 1 also allows the most unfavorable scenario for the EV autonomy to be estimated [
11,
12]. Therefore, we decided to use the value of 1 for k. The characteristics of the route under study and the consequent selection of the parameters that affect the autonomy of electric vehicles are summarized in
Table 4.
2.3.5. Calculation of MDFC and BHCI
With the values obtained for the climatic and flexibility margins and the simultaneity factor, Equation (1) is applied, and the obtained result is 60 km. This value is subsequently used in this study to locate the fast charging stations along the route.
BHCI is proposed as a planning tool for establishing fast charging infrastructure in a country. The BHCI itself is the number of fast charging stations that are necessary for any EV sold in a country to travel from any given location to any other location [
11]. According to the information obtained from Google Earth and Google Maps, the one-way trip has a total length of 183 km (
Tn). Applying Equation (2) gives a BHCI of 3.05. From this result, it is then considered that for the outbound route, the BHCI is 3 fast chargers.
In the analysis of the return route, the same route conditions are considered for the calculation of MDFC since the roads are parallel. Therefore, the value to be used is 60 km. The length of the return route (Tn) according to Google Earth and Google Maps is 184 km, so when applying Equation (2), the BHCI obtained is 3.07; this result indicates that for the return route, it is necessary to have 3 fast charging stations.
Then, it should be considered that it is convenient to locate fast charging stations in each destination city; consequently, an additional charging station will be added, i.e., the BHCI will be 4 charging stations for the outbound case and 4 charging stations for the return case. As the chargers in the cities of destination will serve both for the outbound and return case, the total BHCI to complete the route in both directions will be 6 fast charging stations.
2.3.6. Location of the Fast Charging Stations
In this section, we consider that in order to have a precise location of the charging stations, the value of the MDFC distance will be measured following the topology of the route from the point of origin of the trip for both cases, outbound and return trip. The measurement is performed virtually using the Windows application Google Earth. The location results are provided by geographical coordinates, and it is considered that the service coverage that could be provided by these charging stations will be within a radius of 60 km. With respect to the outward route, i.e., Riobamba–Quito, the proposed deployment of stations and their location is shown in
Table 5. Stations A, B, C and D are proposed to show the sequence during the progression of an EV along the route.
Regarding the analysis of the return trip, the sequence of charging points D, E, F, A is considered. The locations are presented in
Table 6. The final result of the location of fast charging stations for the Riobamba–Quito–Riobamba case study is shown in
Figure 5.
As shown in
Figure 5, the stations marked in yellow, A and D, are installed in the origin and destination cities. Stations B and C, marked in green, are located along the Riobamba–Quito section of the road. For the return trip, stations E and F, marked in red, are located along the Quito–Riobamba return route.
2.4. Modeling the Energy Consumption of 1 Electric Vehicle and Its Interaction with the Proposed BHCI
To evaluate whether the proposed BHCI and its locations are sufficient to ensure that an EV can travel from one point to another on the Riobamba–Quito–Riobamba road with solvency, the use of a consumption model that considers the use of route data obtained through road tests is proposed.
Specifically, the developed model considers the energy generation that can be estimated on the route, as well as the location of the charging points arranged along the route under study. The proposed model is general, as the goal is to evaluate several types of vehicles, and it is conducted in the Simulink computational environment of Matlab. In the following sections, the developments of each one of the parts that form the model are detailed.
2.4.1. Vehicle Dynamic Modeling
In order to determine the energy consumption of an electric vehicle on the road, it is common to use mathematical expressions that allow relating variables such as speed, acceleration, road grade, inertia and the physical characteristics of the vehicle to obtain the power demanded at every moment. This can be calculated using Equation (3) [
44]:
where 𝑃
x is the wheel power required to move the vehicle in W,
Fx is the traction force in N and 𝑣 is the vehicle speed in m/s. According to [
45], to take into account the effect of rotational inertias in the calculation of
Fx, the following equation can be used:
here, 𝛾
m is a mass factor and ∑𝑅 represents the other forces opposing the motion. The mass factor can be estimated by:
where 𝜉
o is the overall reduction ratio of the vehicle’s transmission (including the gearbox and drive axle ratios), which, in the case of most EVs, is fixed-gear. The forces in N opposing motion are the drag force (
Fd), rolling resistance force (
Rx) and force due to the slope of the road (𝑅
g) [
46], the equations for which are:
In these expressions,
is the density of the air in kg/m
3,
Cd is the drag coefficient,
A is the frontal area of the vehicle in m
2,
is the vehicle mass in kg,
g is the gravity, the value of 9.81 m/s
2 is taken and
θ is the road grade, while
fr is the coefficient of rolling resistance, which can be estimated with respect to
v in km/h with [
45]:
The
value can be obtained by applying the following equation:
where
P is the ambient pressure in Pa,
R is the universal constant of the gases, which means 286.9 J/kg K, and
T is the temperature in K [
46].
The following equations are also considered:
where
is the distance traveled by the EV in km and
is its acceleration in m/s
2. Using Simulink and the mathematical expressions described above, a simulation model is generated from the following inputs:
,
and
. The obtained outputs are the total distance traveled (
d), the acceleration (
a) and
Px for each instant in time.
Table 7 presents the specifications of the EVs that are used in the study development.
2.4.2. Modeling EV Operating Power
One of the key aspects to improve EV autonomy is the possibility of reusing the energy that can be recovered thanks to regenerative braking systems. In this context, the tractive power of an EV is positive when the vehicle needs to be driven by the electric motor and becomes negative during braking periods [
52]. What braking precisely does is dissipate the energy, which is stored as kinetic and potential energy. This is the reason why energy recovery systems allow part of the energy to be reused [
52]. Taking into account this behavior, we propose assuming that braking energy regeneration occurs whenever the vehicle acceleration does not exceed a threshold level by differentiating between normal braking and emergency braking and when the driving speed does not fall below a specific value, since these would be states in which kinetic energy would not be possible or it would be very low.
According to [
52], the charging and discharging events can be differentiated by establishing conditions for the differentiation events. In the first instance, when it is satisfied that,
, this is:
where
Pdch is the discharge power in W,
Pacc is the accessory power of the EV in W,
is the tire efficiency,
is the efficiency of the transmission,
is the efficiency of the electric engine and
is the efficiency of the battery.
When the vehicle is running but not moving forward, the following condition is given:
. Here, it is established that
The condition is used to differentiate events in which rapid braking occurs when exceeding a certain maximum deceleration (𝑎max) or when the traffic speed is lower than a minimum speed (𝑣min); in such a case, Equation (14) can be used to obtain Pdch at that instant.
A regenerative braking event then occurs;
. Considering the studies of [
43,
44,
53], to determine the charging power due to regenerative braking, the following equation is used:
where
Pch is the charging power in W. The output of this simulation block is called the operating power, and it is calculated as follows:
where
Pope is the operating power measured in W for each moment in time.
2.4.3. Simulation of the Battery State of Charge (SOC) and EV Consumption
In order to evaluate whether the EV can perform a given trip, it is necessary to evaluate the behavior of the battery state of charge (SOC) during the route. In agreement with what is stated in [
53], the operating range of the SOC should be between 20% and 95% in order to ensure the safety of the battery system. To determine the SOC in percentage of the battery, the following equation is used:
where
SOCini is the initial
SOC at which the EV starts the trip,
Chfst is the fast charging power delivered by an on-road fast charging event, which is simulated in more detail later in this paper, and
Cbat is the battery capacity measured in Wh.
According to [
53], it is possible to determine the energy consumption,
CE, of the EV in Wh/km using Equation (18):
whereas for obtaining the energy demand,
DE, in kWh for the whole cycle, the following expression is used:
2.4.4. Simulation of the Charging Infrastructure
In order to model the interaction that the EV will have with the charging infrastructure, we propose establishing a simulation of the charging events based on the MDFC value and the fast charging power at 50 kW DC that the KIA Soul EV is capable of handling [
6].
In this context, a charging event will take place if
, so the following Equation is used:
here, the fast charging power,
Chfst, will depend on the power that can be supplied by the charging station and the capability of the EV. In this section, PC is a Simulink “Lookup Table” component with the data corresponding to the 50 kW charging curve for the KIA Soul EV vehicle. The data were made available by the company Fastned through its website [
54,
55]. With this implementation, the power supplied by the station to charge the EV as a function of the SOC can be established through simulation.
By means of a programming structure using Matlab functions and Simulink “Variable Time Delay” block elements, it is established that when the distance (
d) traveled by the EV is equal to the MDFC, a pause is inserted in the trip to execute a charging event for a given period of time. For the simulation, the proposal presented in [
11] is taken into consideration. It is stated that a charging event does not exceed a stop of 20 min so that the time en route is close to that of conventional vehicles using rest stops for safety.
The design of this block is set to be modular, so a series of a number of chargers could be placed along the road by considering the BHCI calculated and the MDFC accumulated. This is measured from the start of the route to the location of the fast charging station. The distance
d and the SOC of the battery is input, and the output is
Chfst. The model’s final structure developed in Simulink is presented in
Figure 6.
2.4.5. Model Validation
For the validation of the model, the methodology used in [
53] is considered, and the energy consumption results of the Nissan Leaf 2013 vehicle obtained by the U.S. Department of Energy Advanced Vehicle Testing (AVTA) at the Idaho Nation Laboratory (INL) will be used [
56]. The tests correspond to the EPA driving cycles: urban dynamometer driving schedule (UDDS), used primarily to represent city driving conditions, the highway fuel economy driving schedule (HWFET), which represents highway driving conditions up to 60 mph, and the high-acceleration aggressive driving schedule (US06), also known as the “Supplemental FTP” driving schedule [
57].
The ACTA results are chosen mainly because the cycles studied represent many of the conditions of the Riobamba–Quito–Riobamba route, considering that there are both urban and highway areas. The validation process in this work consists of comparing the field data regarding energy consumption, provided by AVTA, with the results evaluated through the simulation of the 3 cycles considered.
According to the conditions of the AVTA study, the mass of the vehicle taken for the simulations is 1640 kg, due to the fact that the mass of the driver and the test equipment were added in the study. Another aspect to take into account is that the results compared with the model were obtained at 72° F (22.22 °C), so considering the atmospheric pressure at sea level and using Equation (10), it is obtained that
ρa = 1.20 kg/m
3; the other necessary parameters are obtained from
Table 7.
Table 8 presents the parameters used in the simulation, which have been obtained from the literature review. It is also considered that there are no charging events during the simulation of the driving cycles contemplated for the validation.
Table 9 represents the energy consumption in Wh/km available in the AVTA, and this is compared with the data obtained in the proposed model. The relative percentage error is reported for each analyzed cycle, and it can be observed that this does not exceed 10%. In addition, an average error of 4.1% for the 3 analyzed cycles is computed. For the analysis performed, it can be considered that by applying the proposed model, the EV Nissan Leaf energy consumption can be estimated with an average error of 4.1% with respect to the field data provided by AVTA; this makes it suitable for estimating the energy consumption of an EV using driving records obtained on the road.
2.4.6. Driving Data
The next stage of the study is to obtain driving data records for the route for use in the proposed energy evaluation model. The purpose is to obtain information regarding the elevation profile of the route and the speed developed by a vehicle with a frequency of 1Hz. With this information, the simulation results will allow us to determine whether the proposed charging station locations will be able to meet the charging needs of an EV on the study route. To obtain the data, considering the technical possibilities for this study, GPS location data recording has been chosen, with the data obtained from a GPS-enabled smartphone installed in a vehicle and the “Torque Pro” application. Currently, smartphones with GPS are usually accurate to 4.9 m in open areas [
61], an accuracy that was considered adequate for this first case study. Eight groups of driving data were recorded, both outbound and return, considering the start and end points of the Riobamba–Quito and Quito–Riobamba routes, reported in
Table 5 and
Table 6. The test vehicle was a 2017 Hyundai Ioniq Hybrid. For the correction of the instantaneous altitude data of the vehicle, the procedure for determining the cumulative positive altitude gain of a trip reported in Regulation (EU) 2016/646 [
62] was applied.
In order to obtain the most representative round-trip data record, the method of the minimum weighted differences of characteristic parameters (MWD-CP) [
63] was considered. This method is commonly used to obtain typical driving cycles (TDC) from data samples based on GPS data and analyze their characteristic parameters. The method is based on the Equation (21) where the cycle C with the smallest sum of weighted differences is selected as representative of all the cycles in the sample.
where
C is the minimum value of the sum of parameters,
wi is the estimation weight for each characteristic parameter,
Pij is the characteristic parameter value
i for the cycle
j and
is the mean of the characteristic parameter values
i. Since it is necessary to know the energy demand on the road to establish the SOC behavior in the simulation, we decided to take the percentages of positive energy demanded due to four forces that oppose the vehicle movement as characteristic parameters (Pi), according to their contribution to the total traction energy demand. Weight factors (wi) are then applied in the method according to the percentage of each energy.
Considering that the resistance due to inertia (
Ri), power (
P) and energy (
E) can be obtained by using the following expressions [
46]:
where
i corresponds to
Fd,
Rx,
Rg and
Ri, the individual positive energy is calculated for the forces at 1 s time intervals. Subsequently, the total accumulated positive energy is determined as follows:
where
is the sum of the total positive energy of the cycle,
is the positive energy due to the drag force.
is the positive force due to the rolling force,
is the positive force due to slope of the road and
is the positive force due to inertia. Subsequently, the percentage of energy with respect to
and their relative percentage with respect to the total positive energy are established. For the calculation, the data in
Table 7 are used; they correspond to the Hyundai Ioniq Hybrid, considering the gross vehicle weight rating. Regarding the
parameter, the value used is 0.90 kg/m
3, calculated from Equation (10), with an average temperature value of 12.96 °C obtained from the weather information in
Table 2 and an atmospheric pressure of 73,605.65 Pa collected from the average of measurements taken at the six points proposed for the location of the charging stations.
The results for the minimum weighted differences between characteristic parameters to obtain representative cycles of the group of data collected are represented in
Table 10 and
Table 11.
Subsequently, the calculation of the coefficients of variation of the selected characteristic parameters expressed as a percentage is applied. This allows us to know the variability of the data with respect to its mean [
64]. Equation (26) is used for the calculation:
where
is the coefficient of variation,
is the standard deviation and
is the data mean. The results obtained are reported in
Table 12, and as can be seen, there are no values higher than 16%, which indicates that there is little variability in the data series obtained for each characteristic parameter used, in addition to the fact that the averages used in the MWD-CP method are representative for the dataset.
The next step is to analyze the C values in
Table 10 and
Table 11. It can be inferred that considering the minimum weighted differences, the representative driving cycles correspond to register 1 for the outbound trip with a C value of 0.44 and register 1 of the set of return trips with a C value of 0.19; these selected registers are the ones used for the simulation of the EV evaluation and the BHCI proposed.
The summary characteristics of both records are presented in
Table 13. The obtained cycles and their altitude profiles for both the outward and return trips are shown in
Figure 7. Note that when comparing the altitude profile of both cycles, symmetry between the curves can be observed, and when comparing the outward and return cycle parameters in
Table 13, it is observed that there is similarity in the results. These comparisons suggest that it is possible to treat both the outbound and return routes as comparable cases.
2.5. Simulation Scenarios
Considering what is shown in
Table 1, the performance of the vehicle with the largest market presence in Ecuador will be evaluated, i.e., the Kia Soul EV, which currently has the lowest declared autonomy after the Volkswagen E-Golf. The proposed charging infrastructure will have to satisfy the energy demand of the EV, ensuring its performance within the appropriate operating ranges. The value of
corresponds to the one used for the selection of the representative driving records, and the mass value to be used is the maximum at which the EV can operate, i.e., the gross vehicle weight corresponding to 5 passengers and their luggage. We have considered this as a critical case that can occur and that the EV has to overcome. Regarding the battery capacity,
Cbat, the manufacturer reports that it is 27 kWh. The route data correspond to those presented in
Figure 7a,b, which are inputted into the model from a spreadsheet and the “Form Spreadsheet” function of Simulink with a sampling rate of 1 s.
For the simulation, two scenarios are proposed. In the first one, the EV is considered to be in a fully charged condition, i.e., the
value is 95%. Then, the simulation is performed in a round trip, the charging events have a duration of 20 min and the locations of charging stations are set in the model according to the MDFC value of 60 km and as established in
Table 5 and
Table 6. In order to consider the effects of the energy consumption of the air conditioning system on heating, the following is taken into account:
in accordance with [
53], in which it is stated that this value represents the base consumption to maintain a cabin temperature between 15 and 24 °C. In the second scenario, the electric vehicle is considered to be in an incomplete charging condition; the same conditions as for the first scenario are considered, but the difference is that the
value is 65%; this has been proposed to simulate the start of the trip with an EV that is not fully charged.
3. Results
3.1. Energy Consumption on the Road
The results obtained from the simulation of the complete cycle with respect to the representative driving cycles are presented in
Table 14. From the results, it can be seen that the return route has a lower energy consumption compared to the outbound route; however, the differences between both cases are not accentuated, i.e., they are comparable, as was also mentioned in
Section 2.4.6 when comparing the driving cycles.
3.2. Simulation Results of the KIA Soul EV’s Interaction with the Proposed BHCI Location
3.2.1. Simulation Results with EV under Full Charge Conditions
The results shown in
Table 15 and
Table 16 correspond to those obtained in the simulation with the EV under full charge conditions. As can be seen, in all cases, the EV operation upon arrival at each charging station is always above the 33.75% SOC condition considered adequate in relation to the battery operation ranges.
Figure 8 presents the behavior of the SOC with respect to the distance traveled and time elapsed for the outbound and return cases in this first simulation scenario. During EV operation on both routes analyzed, the SOC obtained is always above 20%. The data record established that the minimum SOC for both routes can reach 28.05%, which is obtained in some sectors of the Quito–Riobamba route on the way to the destination.
Regarding the final SOC, it can be seen that the BHCI allows the Kia Soul EV to reach its destination, either outbound or return, with an SOC above 20%. In this specific case, the minimum arrival SOC of 28.29% is obtained on the return trip. Another important aspect to highlight is that in each charging station where the stop has been made, the charge is limited to 95%, and with the 20 min charging time, it is possible to perform the routes safely, reaching charges up to values between 84.42% and 95% SOC.
The location of the proposed BHCI is shown to be solvent by allowing the EV to comply with the established routes with an SOC range between 28.04% and 95.00% according to the results obtained. Note that the established routes, both outbound and return, could not be fulfilled by the EV without charging infrastructure, considering that the energy demand is 31.70 kWh for the outbound and 29.76 kWh for the return, and that the battery capacity of the model analyzed is 27 kWh.
3.2.2. Simulation Results with EV under Incomplete Charge Conditions
For the second scenario,
Table 17 and
Table 18 report the results obtained in the simulation, where it can be seen that the final SOC for the outbound trip is 25.13% and for the return trip is 23.49%. The arrival SOC at each fast charging station is above 25.57%. If we observe the behavior of the SOC in
Figure 9a,b for both routes, it can be seen that it operates above the limit but is close to 20%, especially in the vicinity of Station E in the return section Quito–Riobamba; the data analysis reports that the minimum SOC at which the vehicle operates at that moment is 22.69%, a value that is within the recommended range.
At this point, it can be established that the minimum SOC with which this route can be completed is 65%, since running with a lower SOC could affect the safety of the battery system by operating at the recommended limit. It should also be noted that if the results obtained for both scenarios are compared, considering the output SOC values of each of the stations in the second scenario, it is even possible to reduce the charging times in the first scenario, i.e., the EV can be charged until reaching the SOC values presented in the second scenario and the route can be completed. On the other hand, if operating with an initial SOC of 65%, it is not advisable to reduce the charging times to values below 20 min.
4. Discussion
From the results achieved in the simulations, it can be highlighted that the location of the proposed BHCI allows the Kia Soul EV to fully comply with the study route in the outbound and return cases, operating within the recommended SOC limits that permit safeguarding the integrity of the battery, even in scenarios where the routes are started with an incomplete charge of 65% SOC. This further highlights the validity of the application of the maximum distance method between fast charging stations using the values assumed during the analysis in the first part of this work as inputs (see
Table 4), with respect to climatic conditions, route orography, flexibility and simultaneity for the calculation of MDFC. The results obtained also validate the determination of the BHCI of six charging stations and their locations along the study route, confirming that this proposed infrastructure is the minimum recommended to meet the energy demand of the KIA Soul EV model, allowing it to make the round trip on the Riobamba–Quito route with solvency and maintaining the SOC with values above 20%, even when starting the routes with an SOC of 65%.
Furthermore, the number of passengers influences the range of the vehicle. For example, in order to determine the effect of the number of passengers through simulation, using the curb weight of the KIA Soul EV plus the weight of a driver of 80 kg, the vehicle would reach 20% SOC traveling a distance of 127.14 km on the one-way route Riobamba–Quito. When using the gross weight of the vehicle, i.e., 1960 kg, which would include one driver, four passengers and luggage, the distance that can be reached is 117.09 km, i.e., 7.90% of autonomy is lost. Considering the above, we can say that the number of passengers is a parameter that affects the performance of the vehicle, so we recommend that in the application of this methodology, the gross vehicle weight is used, considering that the location of the minimum fast charging infrastructure should allow the EV to comply with the route under any operating circumstances.
In cases where a special lane exclusively for EVs is considered, it should be taken into consideration that the data entered into the simulation correspond to records of vehicle behavior on the route under study, and correspond to the altitude and speed profile obtained from the experimental records, so the behavior of the speed profile includes the behavior of traffic and the maximum speed that can currently be reached on the road on which the methodology is applied. For our case of analysis, the road has a stretch of 82.2 km with mostly only two lanes, then there is a 102 km section of road in which there are four and even six lanes in certain sections, but given the high vehicular flow, we can consider that it would be very complicated to have one exclusive lane. We can also mention that according to what is shown in the MDFC method, 5% of autonomy is penalized for high traffic factors. This consideration is taken into account in
Table 3 for our application given the high traffic conditions of the current route, so if there were then a special lane, we would estimate adjusting the results with a 5% improvement in autonomy for the location of the stations if, at some point, the government decided to adopt the designation of a high occupancy lane on the road.
The applicability of this method for the location of the required fast charging stations based on a country’s vehicle fleet is demonstrated by the strong possibility that this location methodology can be used in subsequent studies on various roads in Ecuador or other countries, and that its validity can be estimated by means of the proposed mathematical model.
In order to meet the user’s needs with respect to having fast charging stations to use an EV as if it were an internal combustion vehicle, and also to meet the purpose of minimum charging infrastructure in a country, it will be necessary to implement fast charging stations according to the capacities of the EVs distributed in the country. The KIA Soul EV is capable of charging with a maximum charging power of 50 kW in DC, so it is necessary to implement electric vehicle supply equipment (EVSE) with this specification in the proposed stations.
The following are the technical recommendations to be met by fast charging stations and the costs involved in their installation in Ecuador. For this example, it has been considered that at least one charging station of 50kW on DC for an EV will be installed in service stations or commercial premises adjacent to the six locations recommended in
Table 5 and
Table 6.
Proposal of Technical Characteristics and Costs for the Installation of the Charging Infrastructure
According to [
65], in technical terms related to the design of electric vehicle fast charging stations, specifically pertaining to level 3 and mode 4 charging, there is a diversity of regulations, for example, SAE J1772, IEC 61851 and IEEE ST 2030.1.1-2015, where the technical specifications of a DC fast charger for use with EVs are established. Among the most important characteristics regarding charging station design, an efficiency higher than 90% is recommended, with a maximum output voltage of between 50–500 V, a current of 0–125 A and a power factor higher than 0.95 operating at nominal potential [
66]. Likewise, [
65] states that a charging station should have the following infrastructure:
Transformer and substation equipment, including safety device.
Line and cable equipment.
Civil works.
Electrical works ensuring safety.
Adequate space and vehicle entry and exit.
At the moment, as we have been able to discover through our work, the distribution of electric vehicles in our country is very low; the 325 KIA Soul EVs are currently used in urban environments at a national level, so at the moment, and taking into account the percentage of share in sales mentioned in
Section 1, we consider it sufficient to have two chargers per charging station. However, future trends will seek to replace the gasoline-powered vehicle fleet in our country. Currently, the fuel stations along the analyzed route generally have 10 gasoline and 4 diesel fuel dispensers. This means that in the future, there should be 14 points per station, and we recommend that each point can supply up to two charging outlets at the same time to improve the waiting time. It is also important to mention that the model analyzed, the KIA SOUL, was sold until 2022. Currently, new models with better specifications are entering the country, which will reduce waiting times to make them more reasonable.
The determination of costs of a charging station, considering the characteristics that are collected from the recommendations of the specialized regulations, is difficult to estimate. The following, in
Table 19, is an estimate based on information provided by local vendors regarding the equipment available in Ecuador.
Providing a BHCI of six fast charging stations along the Riobamba–Quito route will then cost a total of USD 204,011.64. This is a reasonable cost that can be achieved by taking advantage of the areas close to the proposed locations and that have the best conditions with respect to the physical infrastructure, which will allow lower installation costs. This proposed BHCI and the investment would be sufficient to allow EVs such as the KIA Soul to be able to make intercity trips safely, especially considering that they would be able to start with a full charge and then charge for up to 20 min per stop at each proposed station. The contribution sought with this work is to encourage investment in charging infrastructure in Ecuador and Latin America with the firm intention of promoting the growth of electric mobility in the region.
5. Conclusions
From the analysis of the vehicle fleet in Ecuador, it was determined that the KIA Soul EV is the model with the greatest presence in the Ecuadorian market. Therefore, its EPA range of 150 km was taken as the minimum range parameter “Rm” of the vehicle fleet in the country. This parameter was the basis for the application of the methodology for the calculation of the maximum distance between fast charges, in which, taking into consideration the analysis of the conditions and characteristics of the Riobamba–Quito route, it was determined that the MDFC value for the location of charging stations should be 60 km. During the application of the methodology, the factors that affect the average autonomy were analyzed, establishing among them the climatic margin, flexibility margin and the simultaneity factor.
The BHCI obtained for the 182 km Riobamba–Quito route, both in the outbound and return sections, considering a 60 km MDFC, is six fast charging stations. The location of charging stations on the route was determined by measuring the value of individual autonomy, following the topology of the road virtually using the Google Earth application. The results were reported in geographic coordinates and locations were obtained for charging stations in the bus terminals of Riobamba and Quito, and in locations near the cities of Ambato and Latacunga on the highway.
The mathematical modeling of the EV’s interaction with the BHCI was performed based on the estimation of the energy demand and the SOC by simulating the road trip and the occurrence of charging events. The model validation uses experimental data obtained from Idaho Nation Laboratory reports regarding the 2013 Nissan Leaf vehicle, and an average error of 4.1% was obtained with respect to the field data concerning the energy consumption of the UDDS, HWFET and US06.
The weighted minimum differences method was used to analyze the driving data obtained using GPS. This method allowed representative driving cycles to be chosen from the sample, and it was performed based on the analysis of the positive energy consumed in the trips (see
Table 10 and
Table 11). When the coefficients of variation of each characteristic parameter were calculated, it was observed that the results did not exceed the 30% mentioned in the literature, which is indicative of the homogeneity of the dataset and the representativeness of the means used in the method (See
Table 12).
The simulation of the KIA Soul EV was conducted using the proposed model, and the critical case in which the vehicle mass is the maximum was considered. In the first instance, results were obtained regarding the energy demand for the outbound route Riobamba–Quito with a value of 31.7 kWh, while for the return trip Quito–Riobamba, a value of 29.76 kWh was presented. First, the minimal difference between the outbound and return energy demand shows that the two routes are equivalent. Second, given the results, it is evident that the KIA Soul EV could not fulfill the designated route without appropriate charging infrastructure, given its battery capacity of 27 kWh.
The simulation of the interaction of the KIA Soul EV with the proposed BHCI location was developed in two scenarios. Scenario 1 was performed with an initial SOC of 95%, and the results demonstrated that the SOC behavior on both routes always remains between 28.05% and 95.00% using two charging events of 20 min. Regarding scenario 2, the initial SOC is 65%, and on both routes, the SOC takes values between 22.69% and 89.84%, using the two corresponding charging events of 20 min. From these results, it can be concluded that the BHCI implemented in the simulation manages to maintain EV operation above 20%, which contributes to ensuring the integrity of the battery system and the fulfillment of the autonomy of the route.
Author Contributions
Conceptualization, L.B. and E.F.; methodology, L.B., E.F.; software, H.T.; validation, L.B., E.F. and H.T.; formal analysis, E.F.; investigation, L.B.; resources, L.B.; data curation, L.B. and E.F.; writing—original draft preparation, L.B.; writing—review and editing, H.T.; visualization, E.F.; supervision, E.F.; project administration, H.T.; funding acquisition, L.B. All authors have read and agreed to the published version of the manuscript.
Funding
This research received no external funding.
Data Availability Statement
The data presented in this study are available upon request from the corresponding author.
Conflicts of Interest
The authors declare no conflict of interest.
References
- Sharma, S.; Panwar, A.; Tripathi, M.M. Storage technologies for electric vehicles. J. Traffic Transp. Eng. 2020, 7, 340–361. [Google Scholar] [CrossRef]
- La Compra de Carros Eléctricos No Despega en Ecuador, Pese a sus Beneficios, Estas son las Causas|Informes|Noticias|El Universo. Available online: https://www.eluniverso.com/noticias/informes/el-alto-costo-inicial-y-la-falta-de-electrolineras-frena-la-compra-de-carros-electricos-en-ecuador-nota/ (accessed on 5 November 2021).
- Instituto Nacional de Estadísticas y Censos. Anuario de Transporte 2019; Instituto Nacional de Estadísticas y Censos: Quito, Ecuador, 2019. [Google Scholar]
- Asociación de Empresas Automotrices del Ecuador. Anuario 2020; Manthra Comunicación: Quito, Ecuador, 2021. [Google Scholar]
- Young, K.; Wang, L.Y.; Strunz, K. Electric Vehicle Integration into Modern Power Networks. In Power Electronics and Power Systems; Springer Science & Business Media: Berlin/Heidelberg, Germany, 2013; pp. 15–49. [Google Scholar]
- 2016 KIA Soul EV—Specifications. Available online: https://www.evspecifications.com/en/model/8ce695 (accessed on 25 June 2022).
- Distancia de Quito → Riobamba—Línea Recta, Ruta de Conducción, Punto Medio. Available online: https://es.distance.to/Quito/Riobamba (accessed on 17 June 2022).
- Csonka, B.; Csiszár, C. Determination of charging infrastructure location for electric vehicles. Transp. Res. Procedia 2017, 27, 768–775. [Google Scholar] [CrossRef]
- Sathaye, N.; Kelley, S. An approach for the optimal planning of electric vehicle infrastructure for highway corridors. Transp. Res. Part E 2013, 59, 15–33. [Google Scholar] [CrossRef]
- Tan, J.; Lin, W.H. A Stochastic flow capturing location and allocation model for siting electric vehicle charging stations. In Proceedings of the 17th International IEEE Conference on Intelligent Transportation Systems (ITSC), Qingdao, China, 8–11 October 2014. [Google Scholar]
- Colmenar-Santos, A.; De Palacio, C.; Borge-Diez, D.; Monzón-Alejandro, O. Planning Minimum Interurban Fast Charging Infrastructure for Electric Vehicles: Methodology and Application to Spain. Energies 2014, 7, 1207–1229. [Google Scholar] [CrossRef]
- Unidad de Planeación Minero Energética. Establecer Recomendaciones en Materia de Infraestructura de Recarga Para la Movilidad Eléctrica en COLOMBIA Para los Diferentes Segmentos: Buses, Motos, Taxis, BRT. Bogotá. 2019. Available online: https://www1.upme.gov.co/DemandaEnergetica/Consorcio_Usaene_sumatoria_producto_3_estaciones_de_cargaVF.pdf (accessed on 17 June 2022).
- León Duchi, E.F.; Quituisaca Verdugo, D.F. Estudio de la Ubicación y Dimensionamiento de Electrolineras en la Ciudad de Cuenca. Bachelor’s Thesis, Universidad Politécnica Salesiana, Quito, Ecuador, 2019. [Google Scholar]
- Alvarado Goya, S.A. Estudio de Factibilidad Para la Implementación de Electrolineras en el Distrito Metropolitano de Quito. Bachelor’s Thesis, Universidad Internacional del Ecuador, Quito, Ecuador, 2017. [Google Scholar]
- Otero, P.; Mera, L.; Calle, E. Aplicación de la Simulación de Montecarlo para el Análisis de la Implementación de Estaciones de Carga Rápida para Vehículos Eléctricos en la Provincia de Galápagos. Rev. Técnica Energía 2021, 17, 143–152. [Google Scholar] [CrossRef]
- Asociación de Empresas Automotrices del Ecuador. Anuario 2016; Grupo El Comercio C.A.: Quito, Ecuador, 2017. [Google Scholar]
- Asociación de Empresas Automotrices del Ecuador. Anuario 2017; Publiasesores Cía. Ltd.a.: Quito, Ecuador, 2018. [Google Scholar]
- Asociación de Empresas Automotrices del Ecuador. Anuario 2018; Editorial Ecuador F.B.T. Cía. Ltd.: Quito, Ecuador, 2019. [Google Scholar]
- Asociación de Empresas Automotrices del Ecuador. Anuario 2019; Editorial Ecuador F.B.T. Cía. Ltd.: Quito, Ecuador, 2020. [Google Scholar]
- Asociación de Empresas Automotrices del Ecuador. Anuario 2021; Manthra Comunicación: Quito, Ecuador, 2022. [Google Scholar]
- BYD E3—Lider Mundial en Vehículos Eléctricos. Available online: https://byd.com.ec/byd-e3/ (accessed on 27 March 2022).
- BYD e5: El Sedán Eléctrico a la Venta en Colombia para Servicio Especial y Taxi. Available online: https://www.elcarrocolombiano.com/lanzamientos/byd-e5-el-sedan-electrico-venta-en-colombia-servicio-especial-y-taxi/ (accessed on 27 March 2022).
- Pickup Eléctrica Dongfeng Rich 6EV—Auteco Mobility. Available online: https://www.autecomobility.com/pickup-electrica-dongfeng-rich-6ev/p (accessed on 27 March 2022).
- BYD S2—Lider Mundial en Vehículos Eléctricos. Available online: https://byd.com.ec/byd-s2/ (accessed on 27 March 2022).
- Vehículos Eléctricos de Carga|T3|BYD Auto|Motorysa. Available online: https://bydauto.com.co/modelo/t3/t3-electrico/ (accessed on 27 March 2022).
- BYD E2—Lider Mundial en Vehículos Eléctricos. Available online: https://byd.com.ec/byd-e2/ (accessed on 27 March 2022).
- Nissan Leaf—Eléctrico—Nissan Ecuador. Available online: https://www.nissan.com.ec/vehiculos/nuevos-vehiculos/nissan-leaf.html?gclid=CjwKCAjwuYWSBhByEiwAKd_n_vE9RtSW0jLj-A4URuaW8pQPkVlZRLKxMYhdDZZDV1VEV5b_nZTbmBoCSSoQAvD_BwE (accessed on 27 March 2022).
- Soul EV|Eco|Kia Ecuador. Available online: https://www.kia.com/ec/showroom/soul-ev.html?gclid=Cj0KCQjwrJOMBhCZARIsAGEd4VEg3rmvbAfR48TNk5OKlGMfuQrpCVhdAlOKHnRWSL1UNOjYO7w6RWcaAvWzEALw_wcB (accessed on 4 November 2021).
- Volkswagen e-Golf (2014–2016) Price and Specifications—EV Database. Available online: https://ev-database.org/car/1040/Volkswagen-e-Golf (accessed on 27 March 2022).
- MG ZS EV—Morris Garages. Available online: https://mgmotor.com.ec/modelos/mg-zs-ev/?user_id=77942945 (accessed on 27 March 2022).
- Audi e-Tron: Der Elektro-SUV von Audi|Audi.de. Available online: https://www.audi.com.ec/aola/web/ec/modelos/Tron/audi-e-tron-2023.html (accessed on 9 April 2023).
- Hyundai Kona Eléctrico. Available online: https://www.hyundai.com.ec/kona-electrico?gclid=CjwKCAjw586hBhBrEiwAQYEnHfmeXwZGLJWttvEULX8SWVtkxB9WPngbnhFVuXET9n3RoMko1rSG1hoCZr4QAvD_BwE (accessed on 9 April 2023).
- JAC eJS1 EV|JAC. Available online: https://jacecuador.com/shop/jac-ejs1-ev-2835?category=112 (accessed on 9 April 2023).
- EQA|Carros de Lujo Mercedes Benz. Available online: https://www.mercedes-benz.com.ec/mercedes/site/docs/20220414/20220414165248/mercedes_benz_eqa.pdf (accessed on 9 April 2023).
- Skywell—Grupo Mavesa. Available online: https://grupomavesa.com.ec/skywell/ (accessed on 9 April 2023).
- Catálogo de Vehículos Eléctricos Particulares en Ecuador. Available online: https://varusecuador.com/vehiculos-particulares/ (accessed on 9 April 2023).
- El Clima en Riobamba, el Tiempo por Mes, Temperatura Promedio (Ecuador)—Weather Spark. Available online: https://es.weatherspark.com/y/20020/Clima-promedio-en-Riobamba-Ecuador-durante-todo-el-a%C3%B1o#Figures-Temperature (accessed on 28 March 2022).
- El Clima en Ambato, el Tiempo por Mes, Temperatura Promedio (Ecuador)—Weather Spark. Available online: https://es.weatherspark.com/y/20027/Clima-promedio-en-Ambato-Ecuador-durante-todo-el-a%C3%B1o (accessed on 28 March 2022).
- El Clima en Quito, el Tiempo por Mes, Temperatura Promedio (Ecuador)—Weather Spark. Available online: https://es.weatherspark.com/y/20030/Clima-promedio-en-Quito-Ecuador-durante-todo-el-a%C3%B1o (accessed on 28 March 2022).
- El Clima en Latacunga, el Tiempo por Mes, Temperatura Promedio (Ecuador)—Weather Spark. Available online: https://es.weatherspark.com/y/20034/Clima-promedio-en-Latacunga-Ecuador-durante-todo-el-a%C3%B1o (accessed on 28 March 2022).
- Clima Ecuador: Temperatura, Climograma y Tabla Climática para Ecuador—Climate-Data.org. Available online: https://es.climate-data.org/america-del-sur/ecuador-63/ (accessed on 28 March 2022).
- Ampliación vía Ambato—Riobamba, Falta Presupuesto—AmbatoNews.com. Available online: https://www.ambatonews.com/2022/04/25/ampliacion-via-ambato-riobamba-falta-presupuesto (accessed on 18 June 2022).
- Travesset-Baro, O.; Rosas-Casals, M.; Jover, E. Transport energy consumption in mountainous roads. A comparative case study for internal combustion engines and electric vehicles in Andorra. Transp. Res. Part D Transp. Environ. 2015, 34, 16–26. [Google Scholar] [CrossRef]
- Alegre Buj, M.S. Modelado del Vehículo Eléctrico e Híbrido Paralelo por Medio de Matlab/Simulink y Planificación de Estaciones de carga Mediante Sistemas de Información Geográfica y Algoritmos Genéticos. Ph.D. Thesis, Universidad Nacional de Educación a Distancia, Madrid, Spain, 2017. [Google Scholar]
- Wong, J.Y. Theory of Ground Vehicles, 3rd ed.; John Wiley & Sons, Inc.: Ottawa, ON, Canada, 2001. [Google Scholar]
- Guillermo, D.; Moreno, C. Metodología para Minimizar el Consumo de Combustible en Autobuses, que Sirven Rutas Fijas, Mediante la Reconfiguración del Tren Motriz; Instituto Tecnológico y de Estudios Superiores de Monterrey: Atizapán de Zaragoza, Mexico, 2015. [Google Scholar]
- Gao, Z.; Lin, Z.; LaClair, T.J.; Liu, C.; Li, J.-M.; Birky, A.K.; Ward, J. Battery capacity and recharging needs for electric buses in city transit service. Energy 2017, 122, 588–600. [Google Scholar] [CrossRef]
- 2013 Nissan Leaf SL—Specifications. Available online: https://www.evspecifications.com/en/model/c54d7 (accessed on 9 July 2022).
- 2017 Hyundai Ioniq Hybrid (104 kW/141 PS/139 hp) (for Europe) Specs Review. Available online: https://www.automobile-catalog.com/car/2017/2453810/hyundai_ioniq_hybrid.html#gsc.tab=0 (accessed on 3 April 2023).
- 2014 Nissan Leaf S (80 kW/109 PS/107 hp) (Since January 2014 for North America) Specs Review. Available online: https://www.automobile-catalog.com/car/2014/2604590/nissan_leaf_s.html (accessed on 9 July 2022).
- 2020 Hyundai Ioniq Elektro (100 kW/136 PS/134 hp) (for Europe) Specs Review. Available online: https://www.automobile-catalog.com/car/2020/2909210/hyundai_ioniq_elektro.html (accessed on 9 July 2022).
- 2016 Kia Soul EV (81.3 kW/111 PS/109 hp) (for North America U.S.) Specs Review. Available online: https://www.automobile-catalog.com/car/2016/2079440/kia_soul_ev.html (accessed on 9 July 2022).
- Fiori, C.; Ahn, K.; Rakha, H.A. Power-based electric vehicle energy consumption model: Model development and validation. Appl. Energy 2016, 168, 257–268. [Google Scholar] [CrossRef]
- Kia—Fastned FAQ. Available online: https://support.fastned.nl/hc/en-gb/articles/4408899202193-Kia (accessed on 24 June 2022).
- Hyundai—Fastned FAQ. Available online: https://support.fastned.nl/hc/en-gb/articles/4405121276945-Hyundai (accessed on 4 July 2022).
- U.S. Department of Energy. 2013 Nissan Leaf Advanced Vehicle Testing—Baseline Testing Results. 2014. Available online: http://www.transportation.anl.gov/D3/ (accessed on 23 August 2022).
- Dynamometer Drive Schedules|US EPA. Available online: https://www.epa.gov/vehicle-and-fuel-emissions-testing/dynamometer-drive-schedules (accessed on 9 July 2022).
- WGołębiewski, W.; Lisowski, M. Theoretical evaluation of the effect of operating parameters on electric vehicle energy consumption and driving range. J. KONES Powertrain Transp. 2016, 23, 117–125. [Google Scholar]
- Park, S.; Rakha, H.; Ahn, K.; Moran, K. Virginia Tech Comprehensive Power-based Fuel Consumption Model (VT-CPFM): Model Validation and Calibration Considerations. Int. J. Transp. Sci. Technol. 2013, 2, 317–336. [Google Scholar] [CrossRef]
- Rydh, C.J.; Sandén, B. Energy analysis of batteries in photovoltaic systems. Part I: Performance and energy requirements. Energy Convers. Manag. 2005, 46, 1957–1979. [Google Scholar] [CrossRef]
- GPS.gov: GPS Accuracy. Available online: https://www.gps.gov/systems/gps/performance/accuracy/ (accessed on 8 July 2022).
- REGLAMENTO (UE) 2016/646 DE LA COMI-SIÓN—de 20 de Abril de 2016—por el que se Modifica el Reglamento (CE) n.o 692/2008 en lo que Concierne a las Emisiones Procedentes de Turismos y Vehículos Comercia-les Ligeros (Euro 6). 2016. Available online: https://eur-lex.europa.eu/legal-content/ES/TXT/?uri=OJ:L:2016:109:TOC (accessed on 15 July 2022).
- Huertas, J.I.; Díaz, J.; Cordero-Moreno, D.; Cedillo, K. A new methodology to determine typical driving cycles for the design of vehicles power trains. Int. J. Interact. Des. Manuf. 2018, 12, 319–326. [Google Scholar] [CrossRef]
- Martínez, C. Estadística y Muestreo; Ecoe Ediciones Ltd.: Bogotá, Colombia, 2012. [Google Scholar]
- González-Salas, A.; Murcia Pascual, P.; Alvarez Alonso, O.; De Muguerza, E.; Madrigal, M. Transport Electrification: Regulatory Guidelines for the Development of Charging Infrastructure. 2021. Available online: https://publications.iadb.org/en/transport-electrification-regulatory-guidelines-development-charging-infrastructure (accessed on 9 April 2023).
- 2030.1.1-2015; IEEE Standard Technical Specifications of a DC Quick Charger for Use with Electric Vehicles. IEEE: Piscataway, NJ, USA, 2016.
Figure 1.
Methodology followed for the location of fast charging stations on the Riobamba–Quito route.
Figure 1.
Methodology followed for the location of fast charging stations on the Riobamba–Quito route.
Figure 2.
Study route: Riobamba–Quito section.
Figure 2.
Study route: Riobamba–Quito section.
Figure 3.
Evolution of the electric vehicle fleet in Ecuador [
4,
16,
17,
18,
19,
20].
Figure 3.
Evolution of the electric vehicle fleet in Ecuador [
4,
16,
17,
18,
19,
20].
Figure 4.
Altimetry of the Riobamba–Quito route.
Figure 4.
Altimetry of the Riobamba–Quito route.
Figure 5.
Deployment of charging stations for the Riobamba–Quito–Riobamba case study.
Figure 5.
Deployment of charging stations for the Riobamba–Quito–Riobamba case study.
Figure 6.
Final structure of the energy model for EV and BHCI simulation, where two implemented fast charging stations are located.
Figure 6.
Final structure of the energy model for EV and BHCI simulation, where two implemented fast charging stations are located.
Figure 7.
Representative driving cycles on the Riobamba–Quito route: (a) one-way trip cycle, Riobamba–Quito route; (b) return trip cycle, Riobamba–Quito route.
Figure 7.
Representative driving cycles on the Riobamba–Quito route: (a) one-way trip cycle, Riobamba–Quito route; (b) return trip cycle, Riobamba–Quito route.
Figure 8.
SOC behavior during simulation with the EV under full charge conditions: (a) Riobamba–Quito route; (b) Quito–Riobamba route.
Figure 8.
SOC behavior during simulation with the EV under full charge conditions: (a) Riobamba–Quito route; (b) Quito–Riobamba route.
Figure 9.
SOC behavior during simulation with the EV under incomplete charge conditions: (a) Riobamba–Quito route; (b) Quito–Riobamba route.
Figure 9.
SOC behavior during simulation with the EV under incomplete charge conditions: (a) Riobamba–Quito route; (b) Quito–Riobamba route.
Table 1.
Electric vehicles in Ecuador suitable for on-road use and fast charging [
4,
6,
16,
17,
18,
19,
20,
21,
22,
23,
24,
25,
26,
27,
28,
29,
30,
31,
32,
33,
34,
35,
36].
Table 1.
Electric vehicles in Ecuador suitable for on-road use and fast charging [
4,
6,
16,
17,
18,
19,
20,
21,
22,
23,
24,
25,
26,
27,
28,
29,
30,
31,
32,
33,
34,
35,
36].
| Brand | Model | Cumulative Sales | Range (km) | Consumption Approval Cycle |
|---|
| Audi | E-Tron | 78 | 402 | NEDC |
| BYD | E3 | 7 | 400 | NEDC |
| BYD | E2 | 18 | 300 | NEDC |
| BYD | E5 AC EV | 7 | 400 | NEDC |
| BYD | S2 | 10 | 300 | NEDC |
| BYD | T3 | 5 | 300 | NEDC |
| Dongfeng | Serie Rich | 33 | 400 | NEDC |
| Hyundai | Kona | 11 | 484 | WLTP |
| JAC | EJS1 | 12 | 300 | - |
| KIA | SOUL EV | 325 | 150 | EPA |
| Mercedes Benz | Clase EQ | 22 | 411 | - |
| MG | MGZS | 7 | 335 | NEDC |
| Mini | Cooper | 13 | 215 | NEDC |
| Nissan | Leaf | 15 | 240 | EPA |
| Skywell | Serie ET5 | 85 | 520 | NEDC |
| Volkswagen | E-Golf | 1 | 130 | NEDC |
Table 2.
Average, maximum and minimum temperatures on the Riobamba–Quito route [
37,
38,
39,
40].
Table 2.
Average, maximum and minimum temperatures on the Riobamba–Quito route [
37,
38,
39,
40].
| City | Maximum Temperature (°C) | Average Temperature (°C) | Minimum Temperature (°C) |
|---|
| Riobamba | 19 | 12.5 | 8 |
| Ambato | 20 | 13.67 | 9 |
| Latacunga | 19 | 12.67 | 7 |
| Quito | 19 | 13 | 9 |
Table 3.
Flexibility margin.
Table 3.
Flexibility margin.
| Value Due to Highway Speed (Mf) | Aggressive Driving Style Factor (+Mf) | Factor for High Traffic Conditions (+Mf) | Factor for Incomplete Charging Patterns (+Mf) | Mountain Road (+Mf) | Total Mf |
|---|
| 20% | 5% | 5% | 5% | 10% | 45% |
Table 4.
Characteristics of the Riobamba–Quito route. Selected climatic, flexibility and simultaneity factor margins.
Table 4.
Characteristics of the Riobamba–Quito route. Selected climatic, flexibility and simultaneity factor margins.
| Home City | Destination City | Track Length (km) | Maximum Altitude
(masl) | Minimum Altitude
(masl) | Maximum Temperature
(°C) | Minimum Temperature
(°C) | Type of Route | Mw (%) | Mf (%) | k |
|---|
| Riobamba | Quito | 182 | 3604 | 2366 | 20 | 7 | Mountain | 15 | 45 | 1 |
Table 5.
Location of fast charging stations in the Riobamba–Quito case.
Table 5.
Location of fast charging stations in the Riobamba–Quito case.
| Sequence | Reference | Location |
|---|
| Latitude (DMS) | Longitude (DMS) |
|---|
| A | Riobamba Station | 1°39′47.28″ S | 78°39′49.64″ W |
| B | Ambato Station | 1°14′23.94″ S | 78°36′2.61″ W |
| C | Latacunga Station | 0°46′54.47″ S | 78°36′37.92″ W |
| D | Quitumbe Station | 0°17′52.72″ S | 78°33′33.07″ W |
Table 6.
Location of fast charging stations in the Quito–Riobamba case.
Table 6.
Location of fast charging stations in the Quito–Riobamba case.
| Sequence | Reference | Location |
|---|
| Latitude (DMS) | Length (DMS) |
|---|
| D | Quitumbe Station | 0°17′52.72″ S | 78°33′33.07″ W |
| E | Latacunga Station | 0°45′50.98″ S | 78°36′47.30″ W |
| F | Ambato Station | 1°14′7.71″ S | 78°35′5.63″ W |
| A | Riobamba Station | 1°39′47.28″ S | 78°39′49.64″ W |
Table 7.
Specifications of the EV used in the study development.
Table 7.
Specifications of the EV used in the study development.
| Parameters | Nissan Leaf 2013 | Hyundai IONIQ Hybrid 2017 | KIA Soul EV 2016 |
|---|
| Mass M (kg) | 1521/1902 1 [47] | 1370/1870 1 [48] | 1492/1960 1 [6] |
| Drag coefficient cd (-) | 0.28 [47] | 0.24 [48] | 0.34 [6] |
| Frontal area a (m2) | 2.28 [49] | 2.22 [50] | 2.39 [51] |
| Reduction radio (-) | 7.94 [47] | - | 8.21 [6] |
Table 8.
Parameters used in the simulation of the operating power block.
Table 8.
Parameters used in the simulation of the operating power block.
| Parameter | Value |
|---|
| Accessory power
| 0.280 [58] |
| Tire efficiency
| 0.99 [52] |
| Transmission efficiency
| 0.92 [59] |
| Electric motor efficiency
| 0.91 [53] |
| Battery efficiency
| 0.95 [60] |
| Maximum acceleration
| −3.00 m/s2 [52] |
| Maximum speed
| 5.00 m/s [52] |
Table 9.
Results of the EV Nissan Leaf simulation for model validation.
Table 9.
Results of the EV Nissan Leaf simulation for model validation.
| Cycle | AVTA Results (Wh/km) | Model Results (Wh/km) | Error (%) |
|---|
| UDDS | 125.1 1 | 133.3 | 6.6 |
| HWFET | 149.6 1 | 152.8 | 2.1 |
| US06 | 199.8 1 | 192.6 | 3.6 |
Table 10.
Minimum weighted differences of the Riobamba–Quito case.
Table 10.
Minimum weighted differences of the Riobamba–Quito case.
| Records | | C |
|---|
| | | |
|---|
| 1 | 8.86 | 20.15 | 37.28 | 33.72 | 0.44 |
| 2 | 9.19 | 20.90 | 35.81 | 34.10 | 0.80 |
| 3 | 9.82 | 21.20 | 38.63 | 30.35 | 1.84 |
| 4 | 8.10 | 17.52 | 31.59 | 42.78 | 5.79 |
| 5 | 9.53 | 20.60 | 38.06 | 31.80 | 1.02 |
| 6 | 10.77 | 20.89 | 38.92 | 29.42 | 2.29 |
| 7 | 10.82 | 21.32 | 35.29 | 32.57 | 1.10 |
| 8 | 10.07 | 19.92 | 38.70 | 31.32 | 1.47 |
| 9.65 | 20.31 | 36.78 | 33.26 | - |
| 0.10 | 0.20 | 0.37 | 0.33 | - |
Table 11.
Minimum weighted differences of the Quito–Riobamba case.
Table 11.
Minimum weighted differences of the Quito–Riobamba case.
| Records | | C |
|---|
| | | |
|---|
| 1 | 7.34 | 18.00 | 31.80 | 42.86 | 0.19 |
| 2 | 7.08 | 18.80 | 32.29 | 41.83 | 0.61 |
| 3 | 7.63 | 20.21 | 33.27 | 38.89 | 2.47 |
| 4 | 4.98 | 13.17 | 23.57 | 58.27 | 10.40 |
| 5 | 7.46 | 19.82 | 31.76 | 40.96 | 1.19 |
| 6 | 6.73 | 19.10 | 36.10 | 38.06 | 3.48 |
| 7 | 7.02 | 19.67 | 32.94 | 40.36 | 1.60 |
| 8 | 6.38 | 17.91 | 34.50 | 41.21 | 1.58 |
| 6.83 | 18.34 | 32.03 | 42.81 | - |
| 0.07 | 0.18 | 0.32 | 0.43 | - |
Table 12.
Determination of CV of the characteristic parameters.
Table 12.
Determination of CV of the characteristic parameters.
| Characteristic Parameter | | | |
|---|
| Outbound route |
| 9.65 | 0.93 | 9.66 |
| 20.31 | 1.23 | 6.04 |
| 36.78 | 2.50 | 6.79 |
| 33.26 | 4.16 | 12.51 |
| Return route |
| 6.83 | 0.85 | 12.40 |
| 18.34 | 2.25 | 12.25 |
| 32.03 | 3.72 | 11.61 |
| 42.81 | 6.44 | 15.04 |
Table 13.
Summary of parameters of selected records.
Table 13.
Summary of parameters of selected records.
| Parameter | One-Way Record | Return Record |
|---|
| Total distance (km) | 182.42 | 182.68 |
| Maximum speed (m/s) | 30.56 | 31.25 |
| Average speed (m/s) | 15.23 | 14.14 |
| Maximum acceleration (m/s2) | 3.93 | 5.16 |
| Minimum acceleration (m/s2) | −5.13 | −8.38 |
| Stops (%) | 14.03 | 16.44 |
| Total time (s) | 11,980.00 | 12,919.00 |
Table 14.
Results of the energy consumption of the studied routes, Riobamba–Quito–Riobamba.
Table 14.
Results of the energy consumption of the studied routes, Riobamba–Quito–Riobamba.
| Sequence | Total Time (s) | Power Demand (kWh) | Energy Consumption (Wh/km) |
|---|
| Riobamba–Quito | 14,379 | 31.7 | 173.77 |
| Quito–Riobamba | 15,319 | 29.76 | 162.9 |
Table 15.
Results of the simulation of the Riobamba–Quito trip with the EV under full charge conditions.
Table 15.
Results of the simulation of the Riobamba–Quito trip with the EV under full charge conditions.
| Station A | Station B | Station C | Station D |
|---|
| SOC Departure (%) | SOC Arrival (%) | SOC Departure (%) | SOC Arrival (%) | SOC Departure (%) | SOC Arrival (%) |
|---|
| 95 | 70.47 | 95 | 33.75 | 84.42 | 34.56 |
Table 16.
Results of the simulation of the Quito–Riobamba trip with the EV under full charge conditions.
Table 16.
Results of the simulation of the Quito–Riobamba trip with the EV under full charge conditions.
| Station D | Station E | Station F | Station A |
|---|
| SOC Departure (%) | SOC Arrival (%) | SOC Departure (%) | SOC Arrival (%) | SOC Departure (%) | SOC Arrival (%) |
|---|
| 95 | 55.62 | 94.09 | 57.54 | 94.57 | 28.29 |
Table 17.
Results of the simulation of the Riobamba–Quito trip with the EV under incomplete charge conditions.
Table 17.
Results of the simulation of the Riobamba–Quito trip with the EV under incomplete charge conditions.
| Station A | Station B | Station C | Station D |
|---|
| SOC Departure (%) | SOC Arrival (%) | SOC Departure (%) | SOC Arrival (%) | SOC Departure (%) | SOC Arrival (%) |
|---|
| 65 | 40.43 | 88.09 | 26.45 | 80.4 | 25.13 |
Table 18.
Results of the simulation of the Quito–Riobamba trip with the EV under incomplete charge conditions.
Table 18.
Results of the simulation of the Quito–Riobamba trip with the EV under incomplete charge conditions.
| Station D | Station E | Station F | Station A |
|---|
| SOC Departure (%) | SOC Arrival (%) | SOC Departure (%) | SOC Arrival (%) | SOC Departure (%) | SOC Arrival (%) |
|---|
| 65 | 25.57 | 79.94 | 43.51 | 89.57 | 23.49 |
Table 19.
Technical specifications and costs for the installation of fast charging stations in Ecuador.
Table 19.
Technical specifications and costs for the installation of fast charging stations in Ecuador.
| Infrastructure | Characteristics | Cost |
|---|
| EVSE | Power 60 kW DC and 43 kW AC | 20,000.00 |
| Voltage 200–750 V DC and 400 V AC |
| Efficiency > 95% |
| Power factor > 0.98 |
| Connector type: CCS2 up to 60 kW–DC, CHAdeMO up to 60 kW–DC, Type 2 up to 43 kW–AC |
| Standard: IEC 61851-1:2017, EN 61851-1:2010, EN 61851-23:2014, EN 61851-24:2014, IEC 61851-21:2018, GB/T 3465.7-2015. |
| Electrical equipment | Transformer and substation equipment 112.5 kVA with concrete base. | 9895.02 |
| Line and cable equipment (20 m) | 1765.80 |
| Electric works | Medium-voltage connection | 813.20 |
| Electrical works ensuring safety | 1155.31 |
| Civil works | Excavations, construction of a type B shaft, others | 372.61 |
| Total | 34,001.94 |
| Disclaimer/Publisher’s Note: The statements, opinions and data contained in all publications are solely those of the individual author(s) and contributor(s) and not of MDPI and/or the editor(s). MDPI and/or the editor(s) disclaim responsibility for any injury to people or property resulting from any ideas, methods, instructions or products referred to in the content. |
© 2023 by the authors. Licensee MDPI, Basel, Switzerland. This article is an open access article distributed under the terms and conditions of the Creative Commons Attribution (CC BY) license (https://creativecommons.org/licenses/by/4.0/).


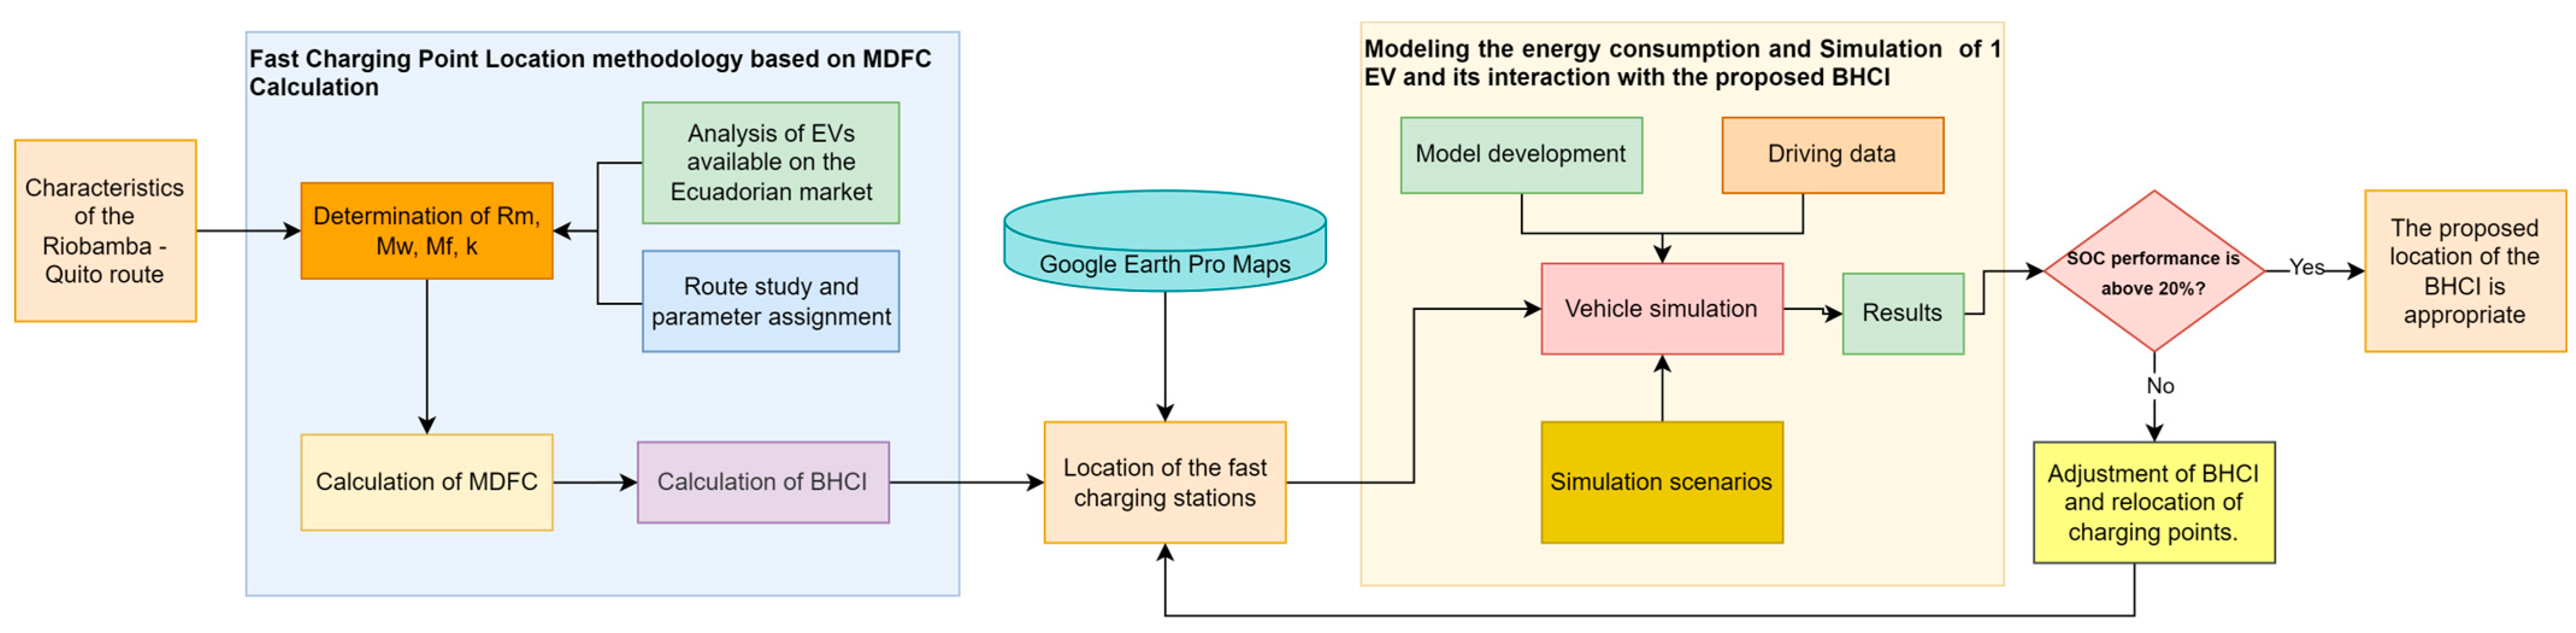
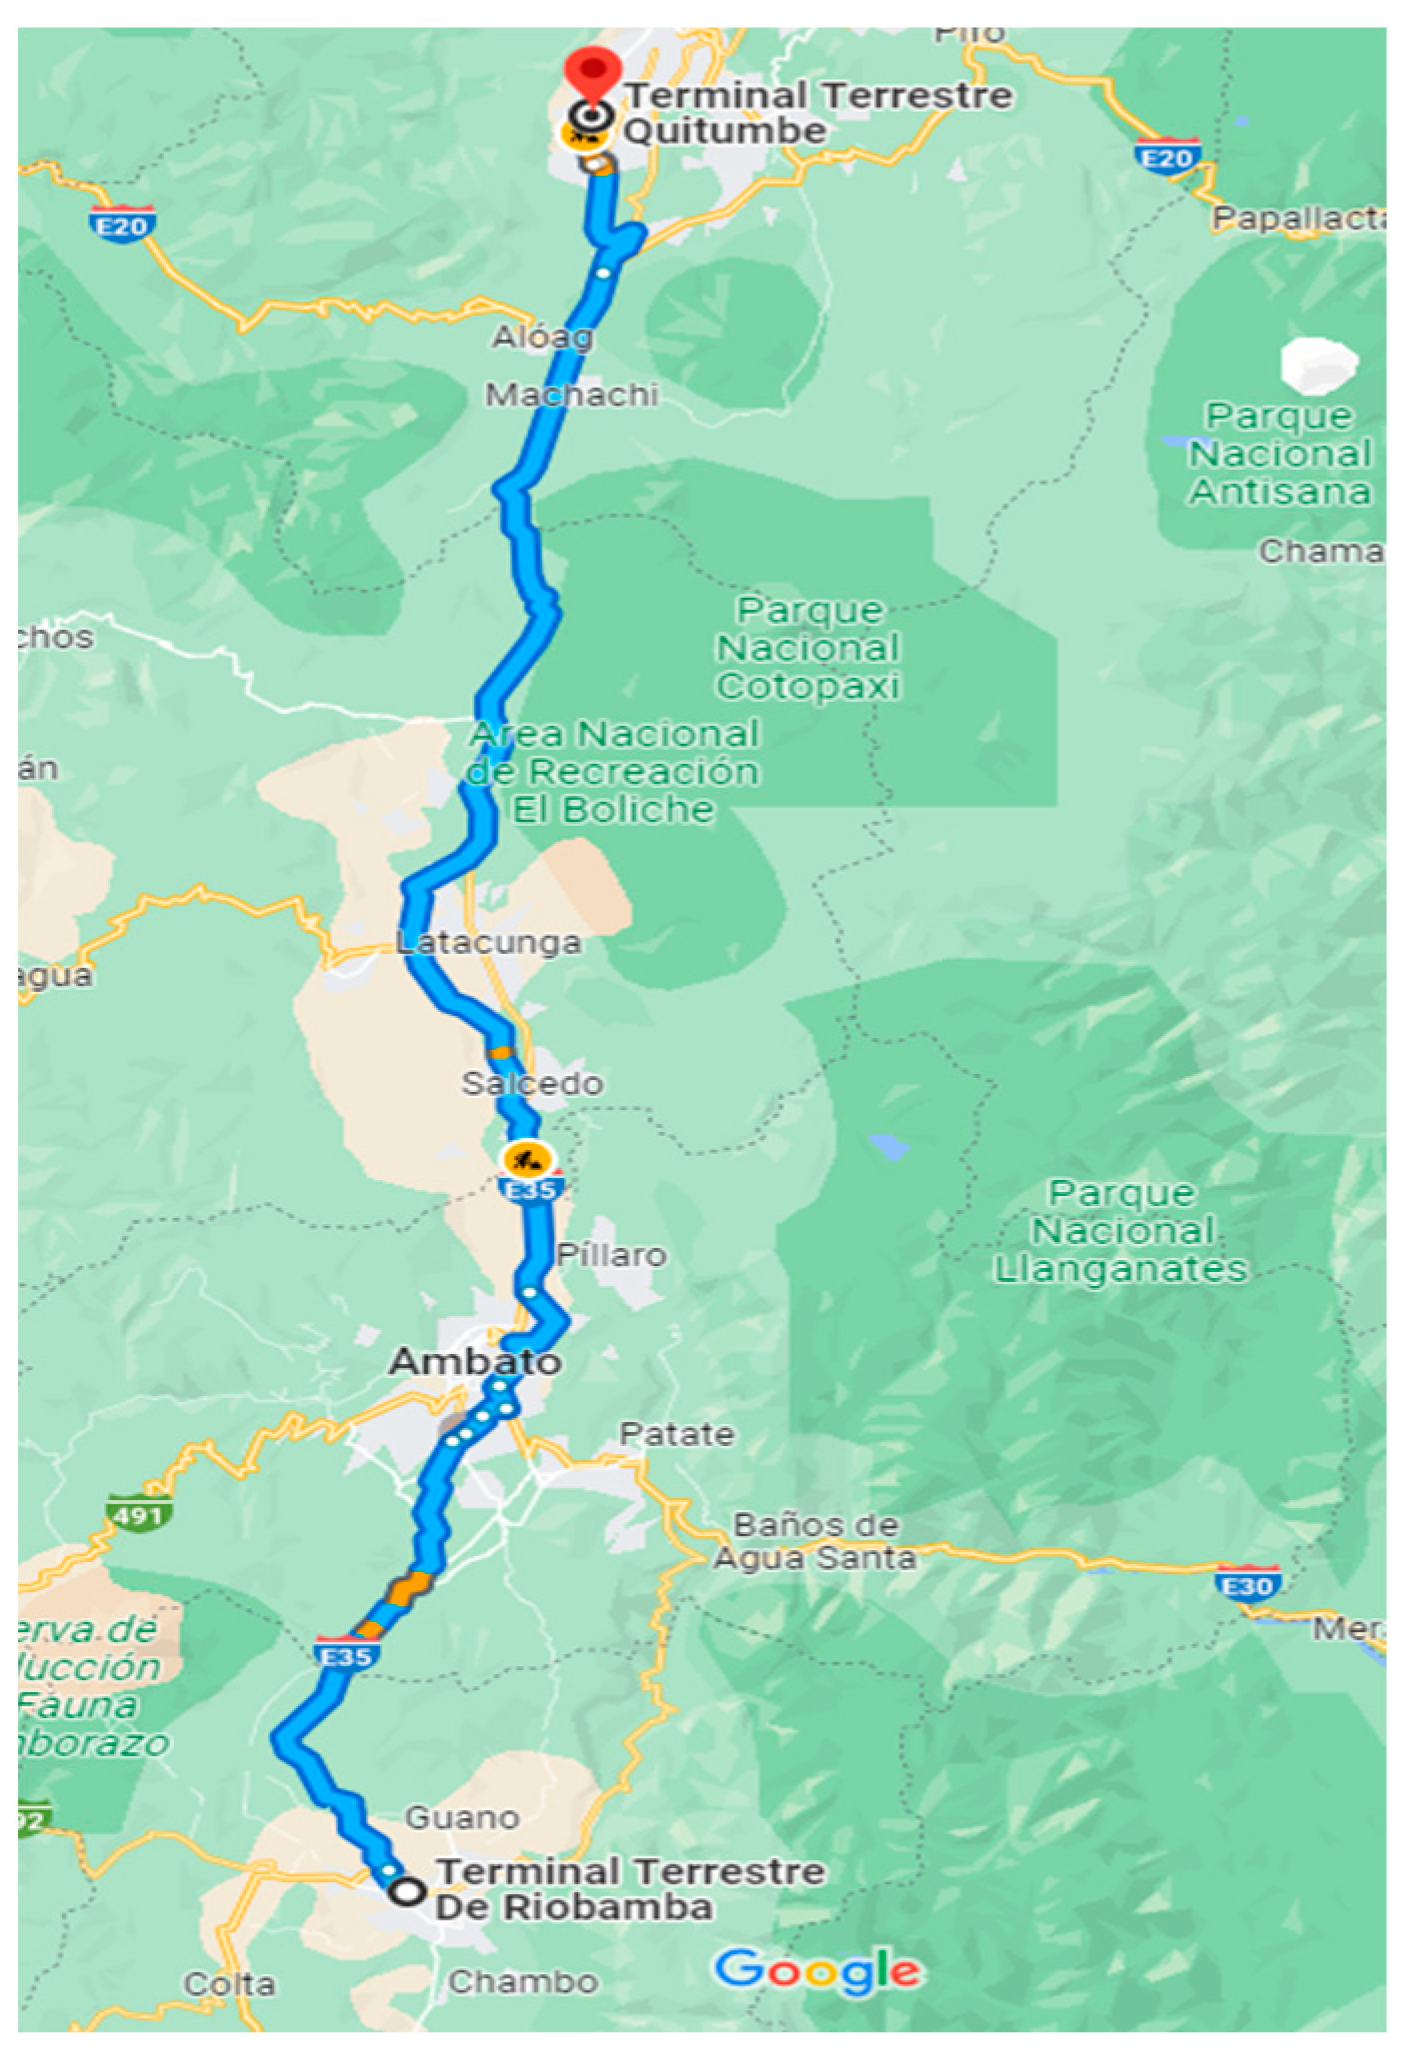
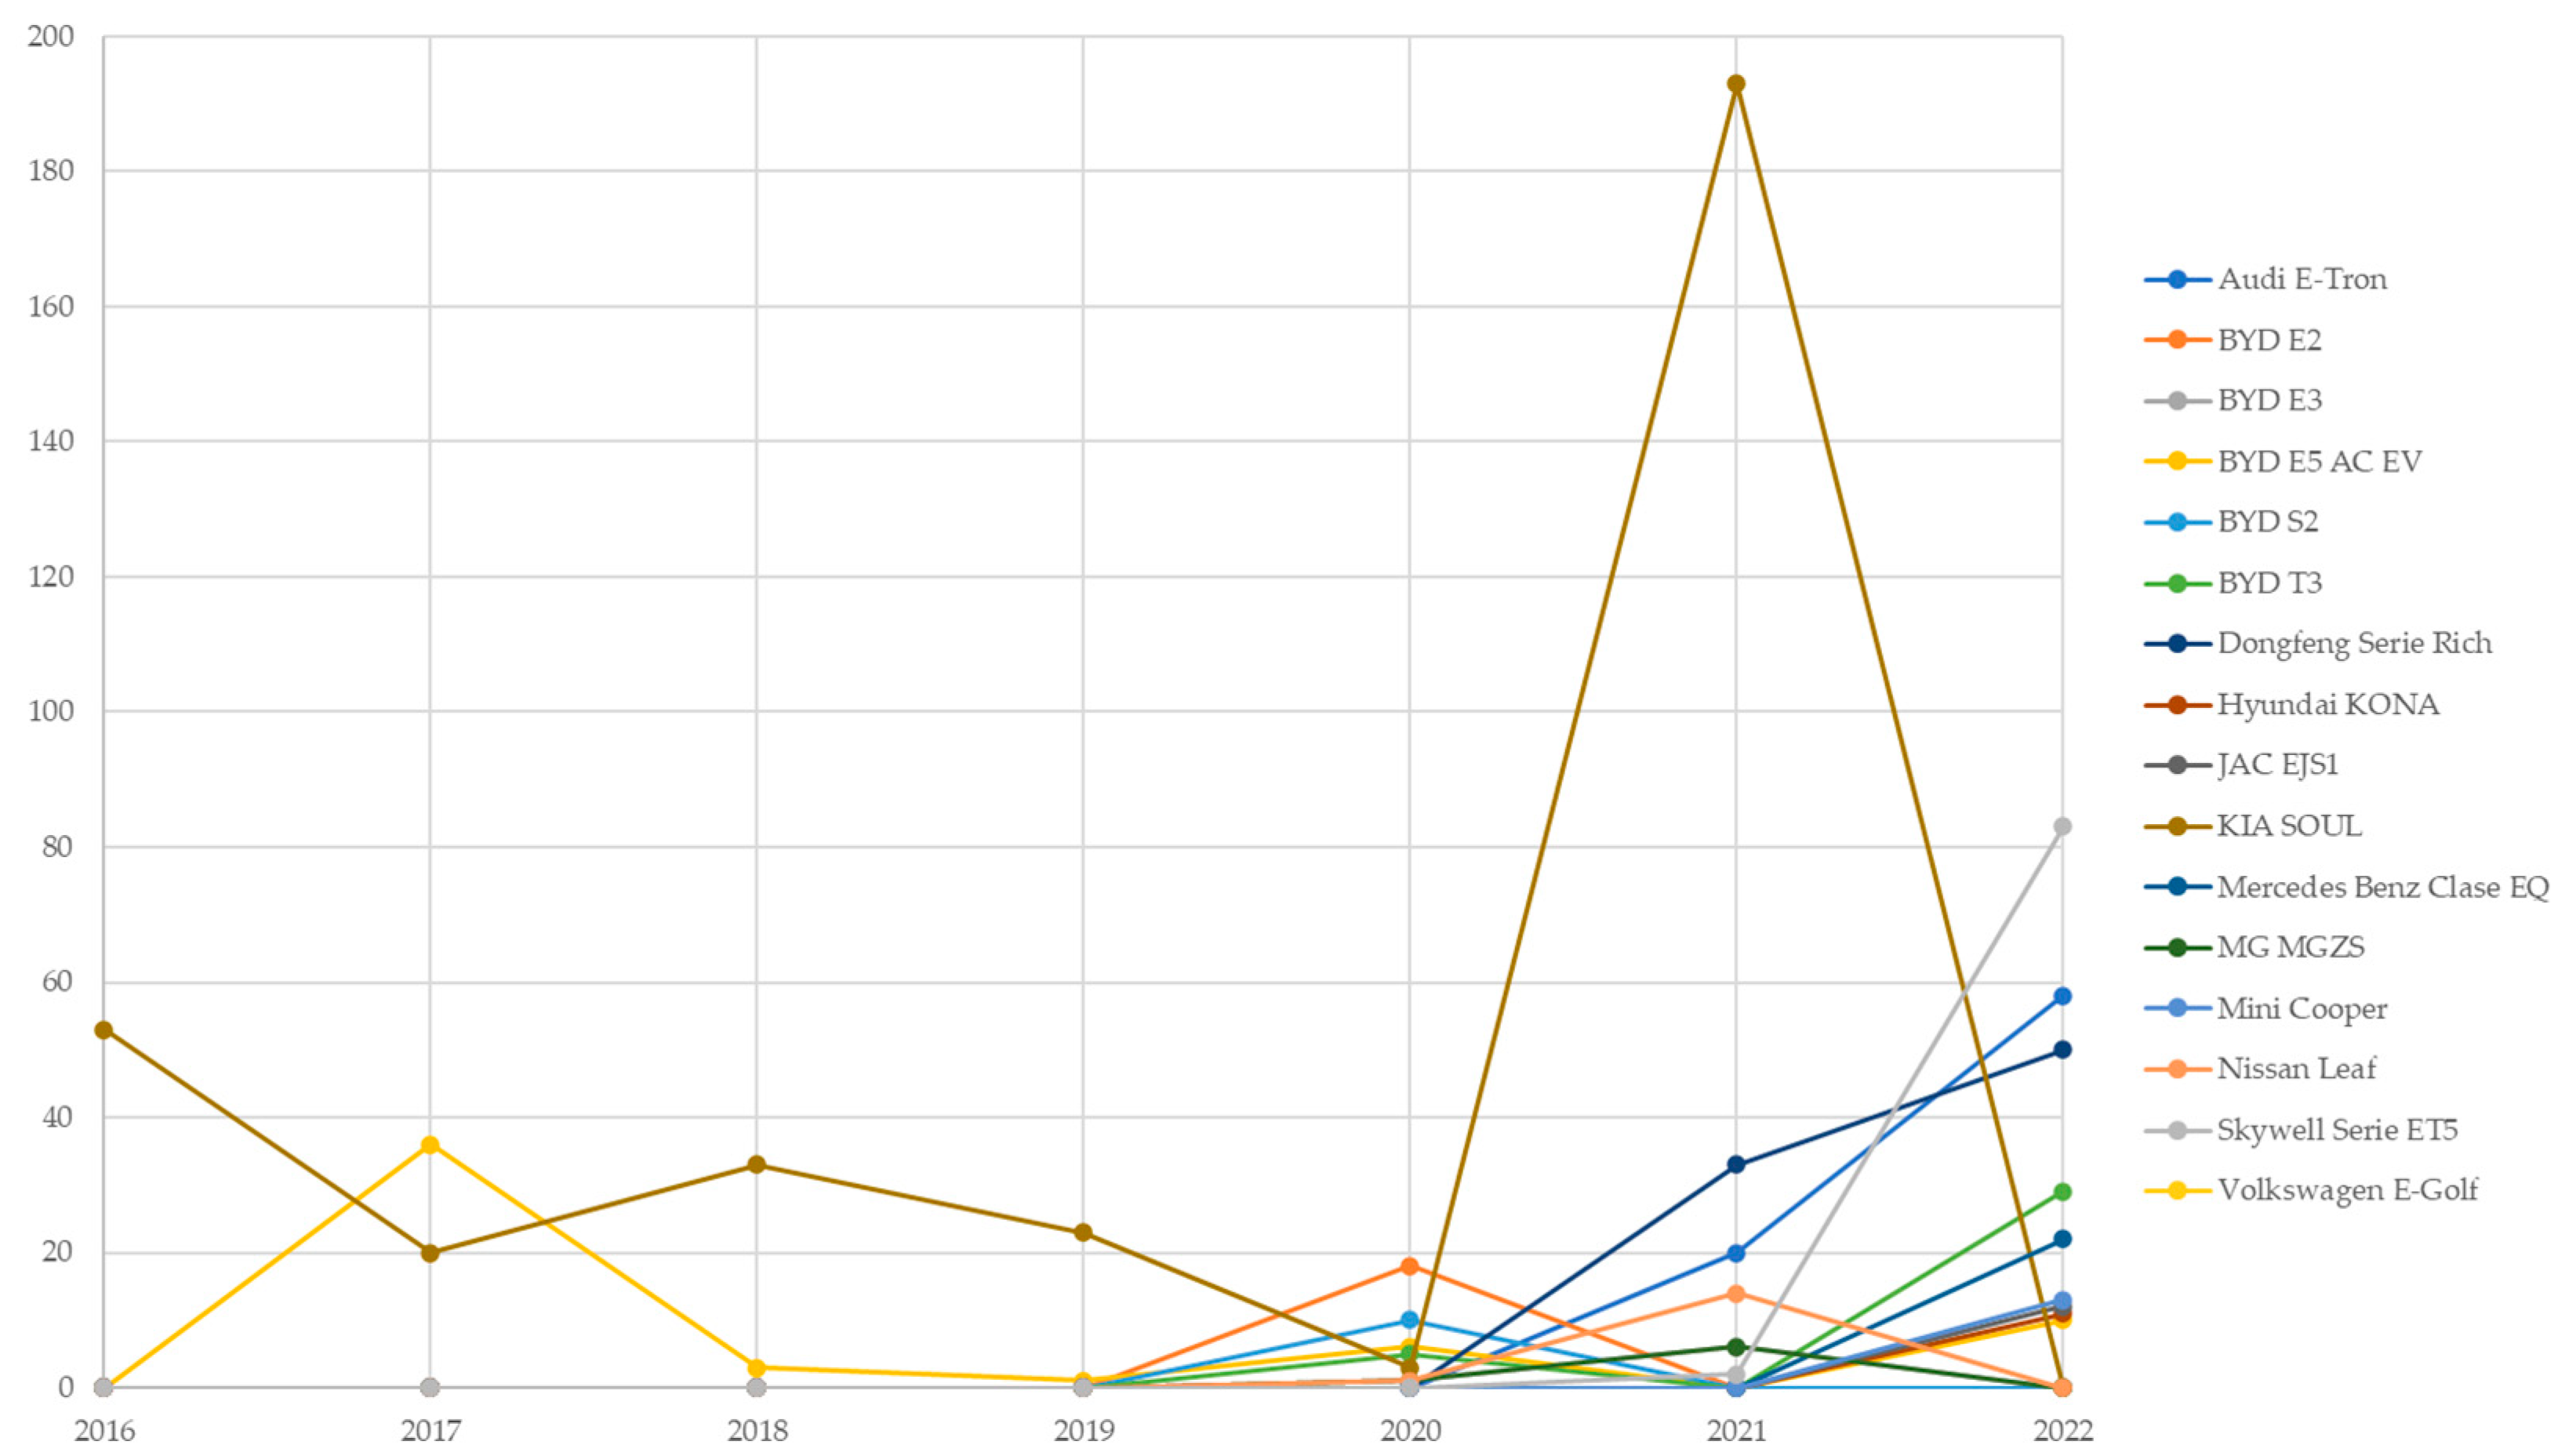
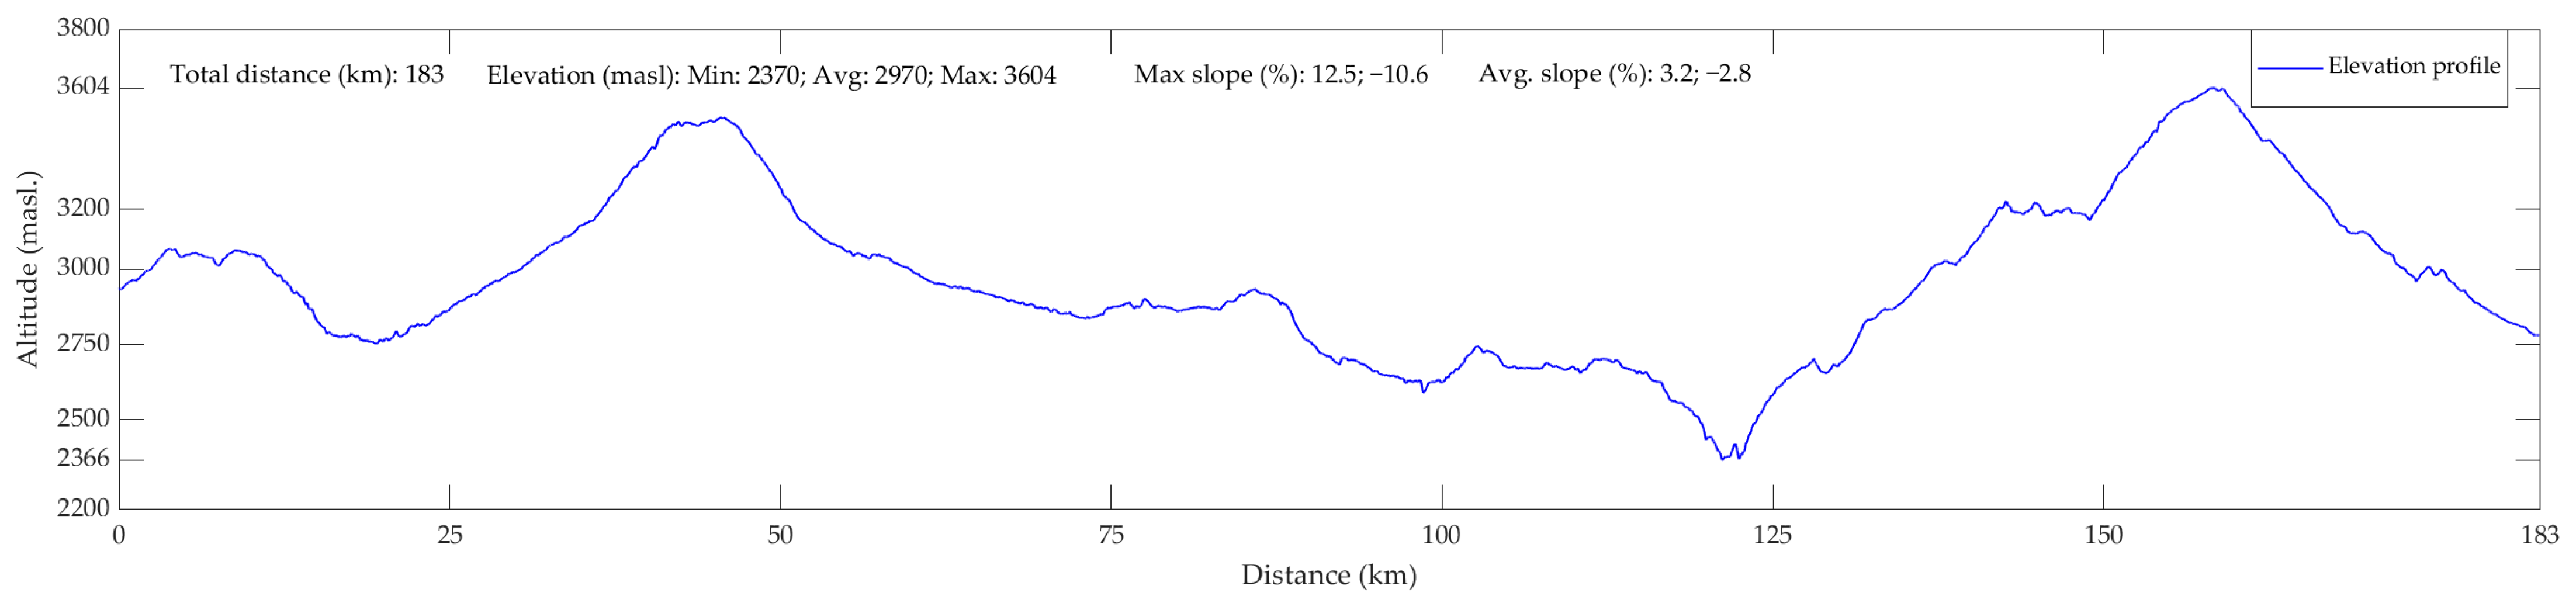
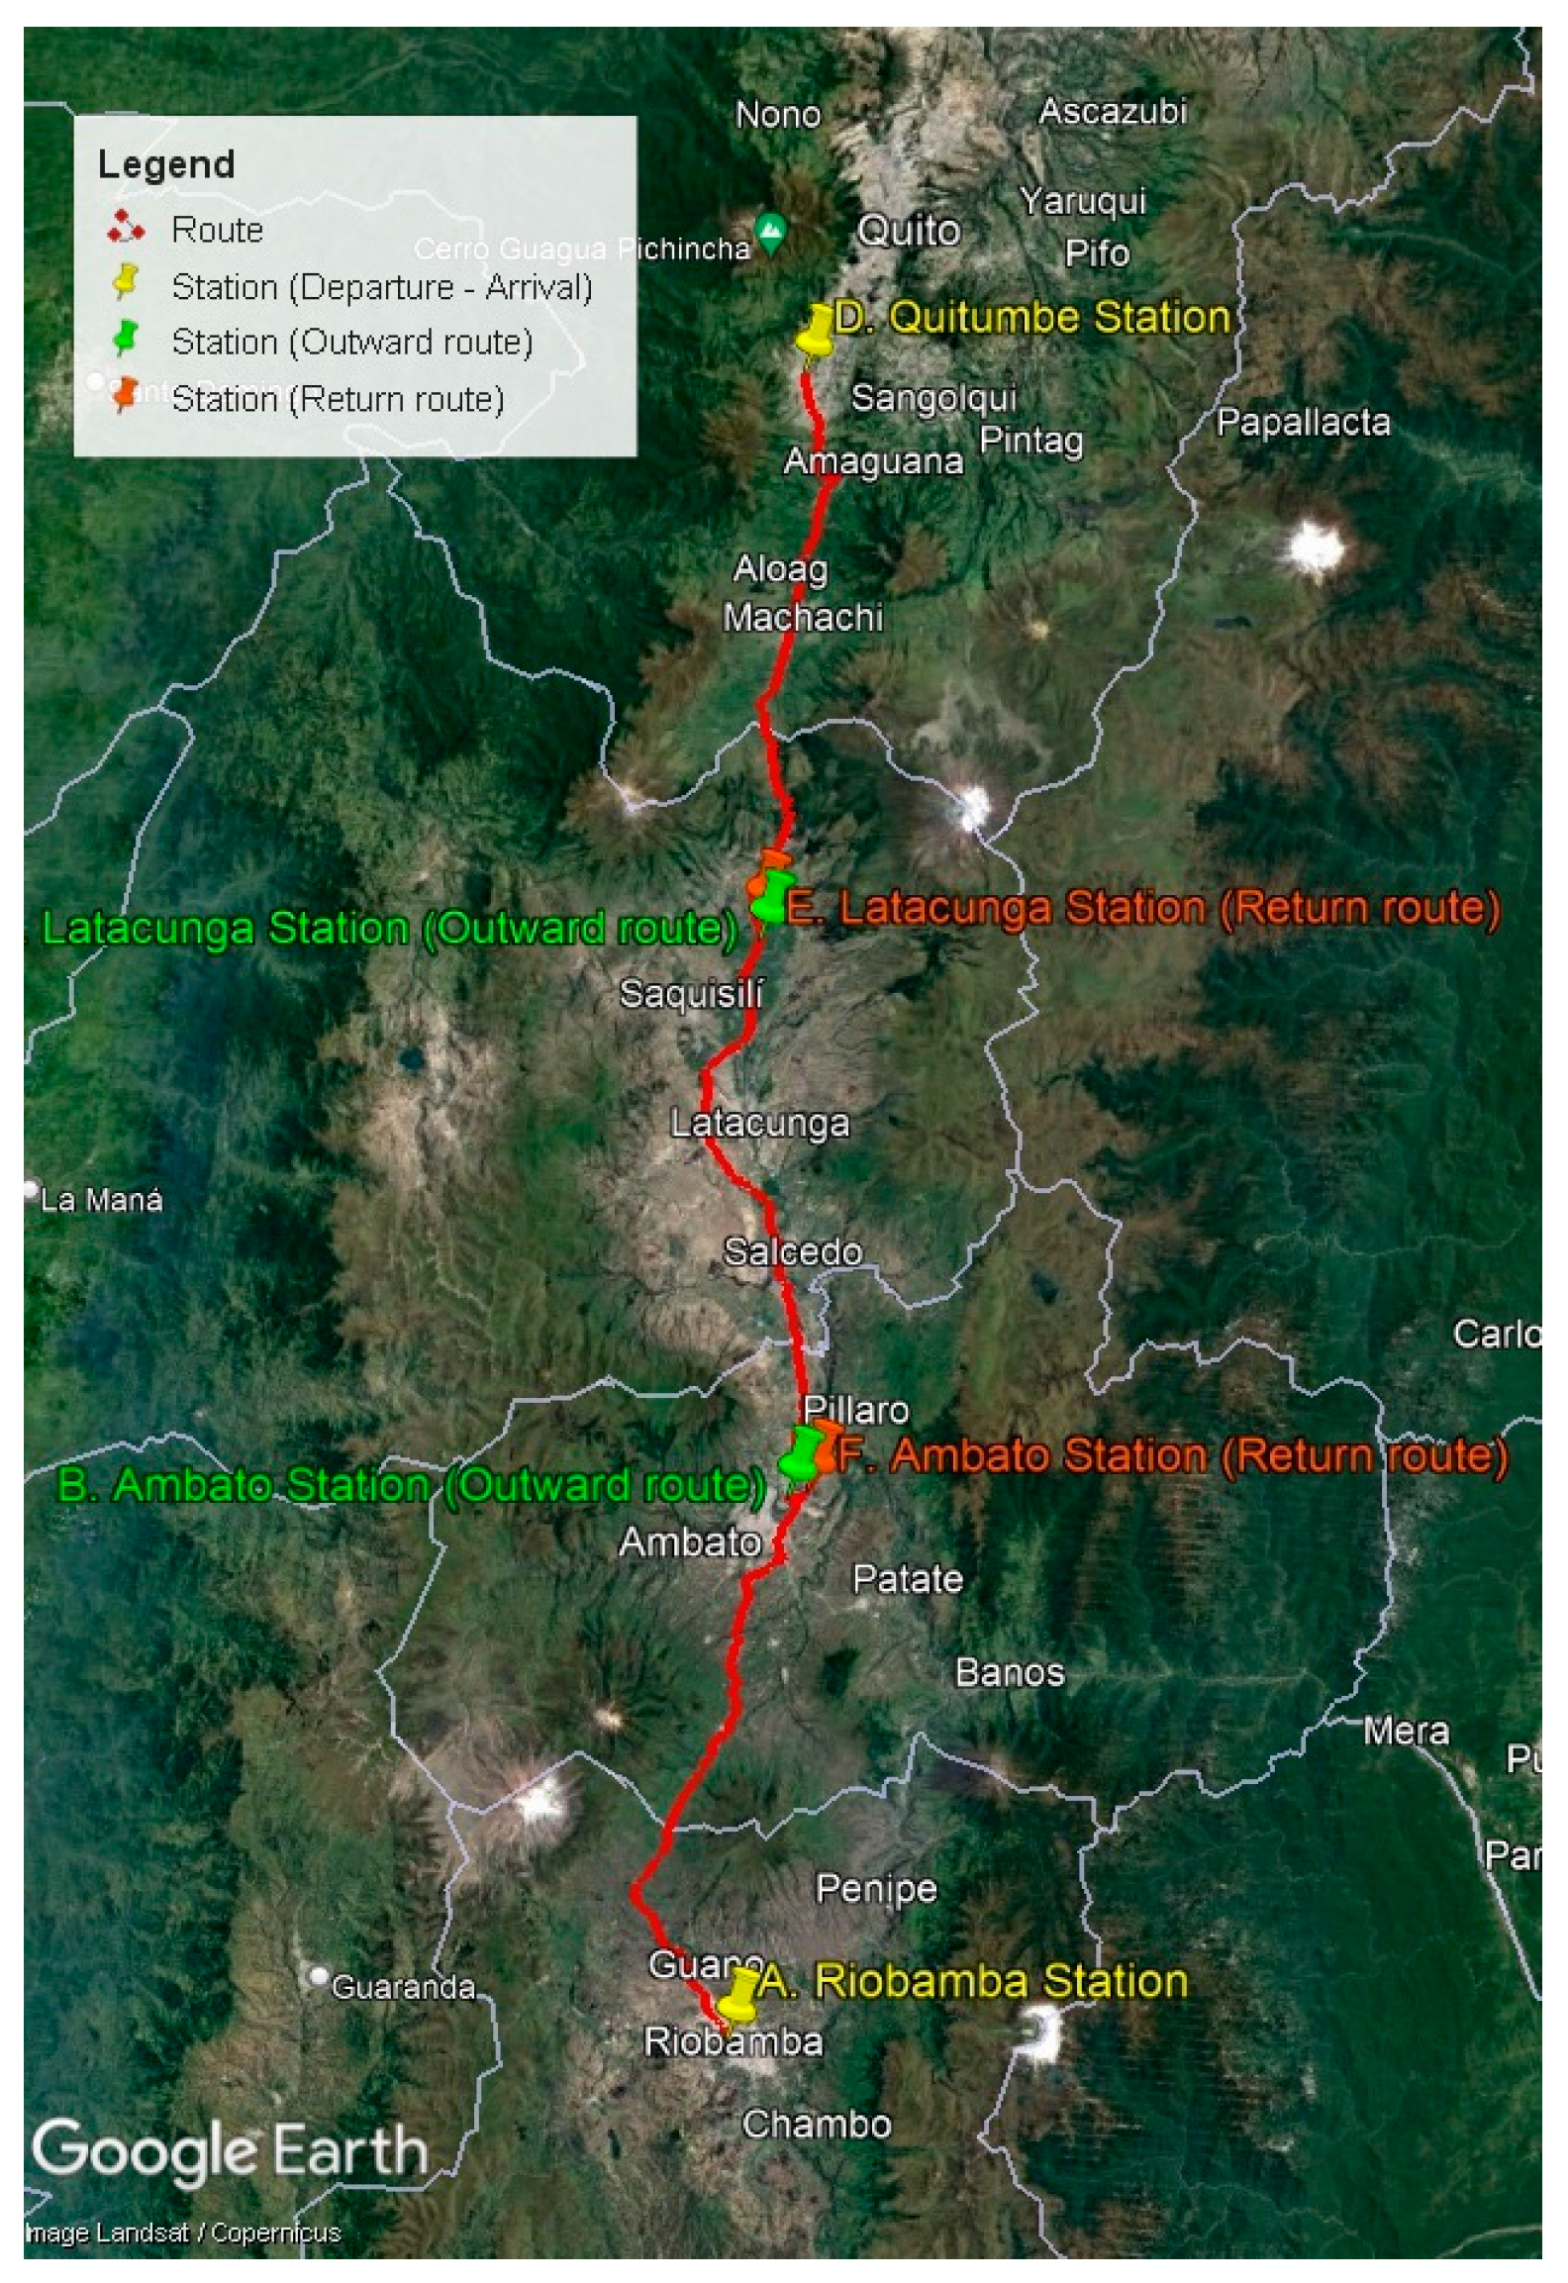
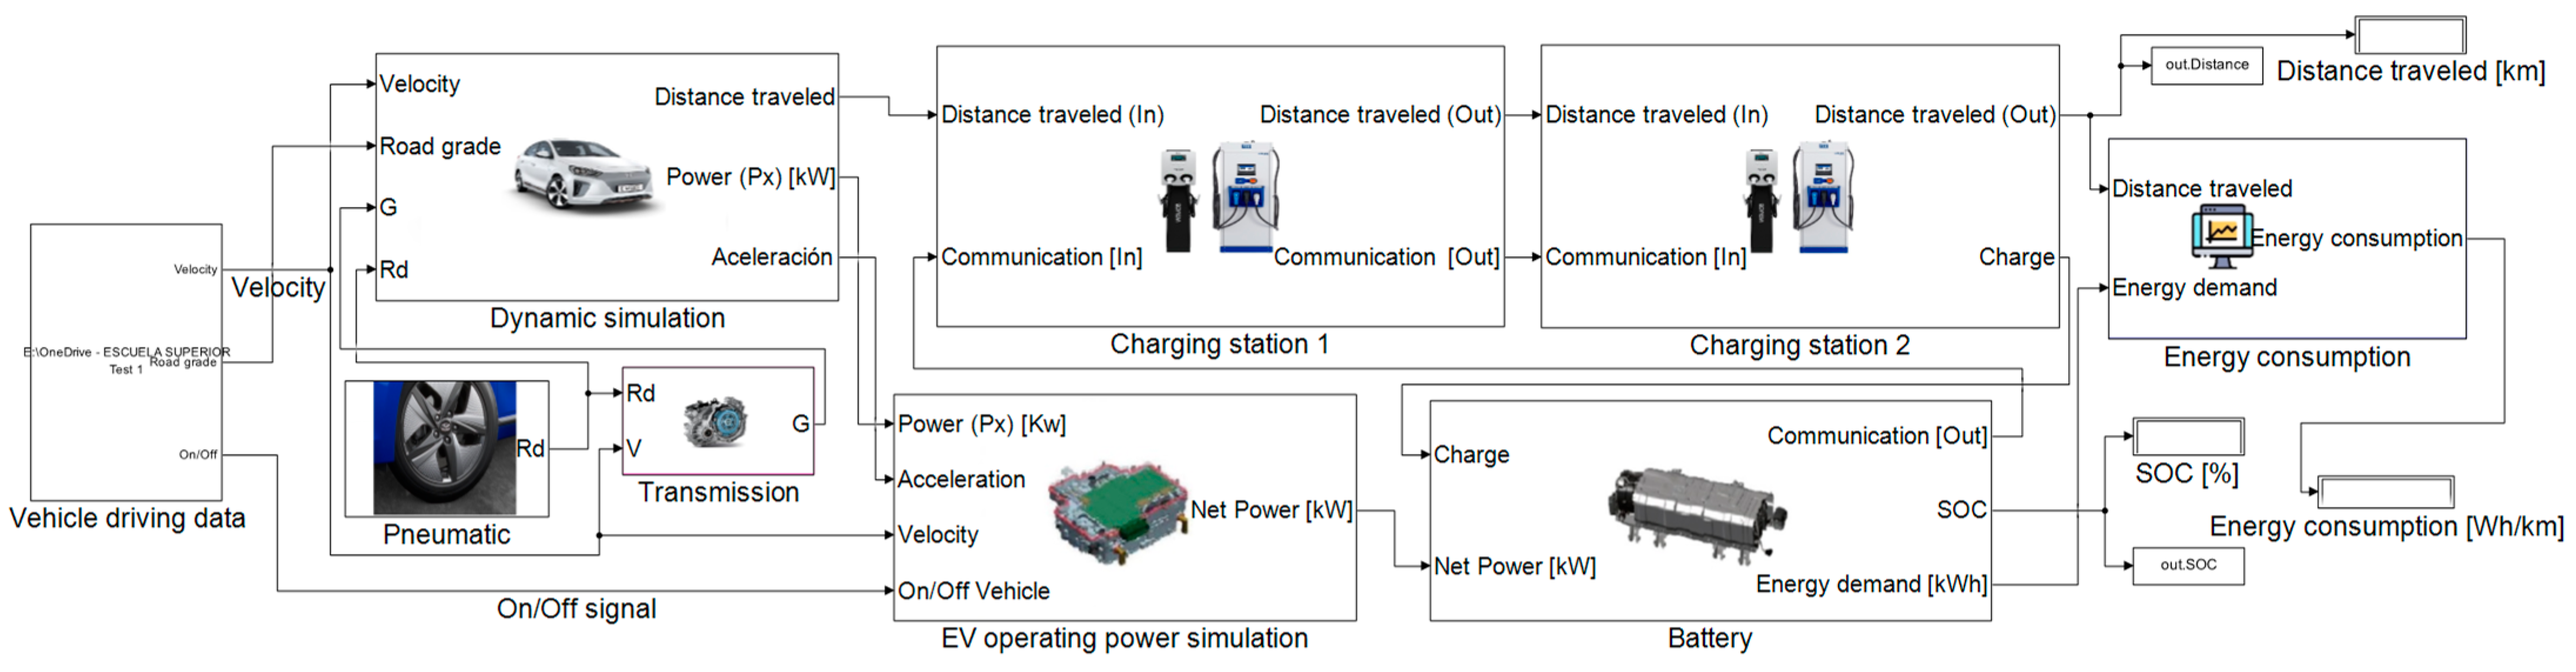
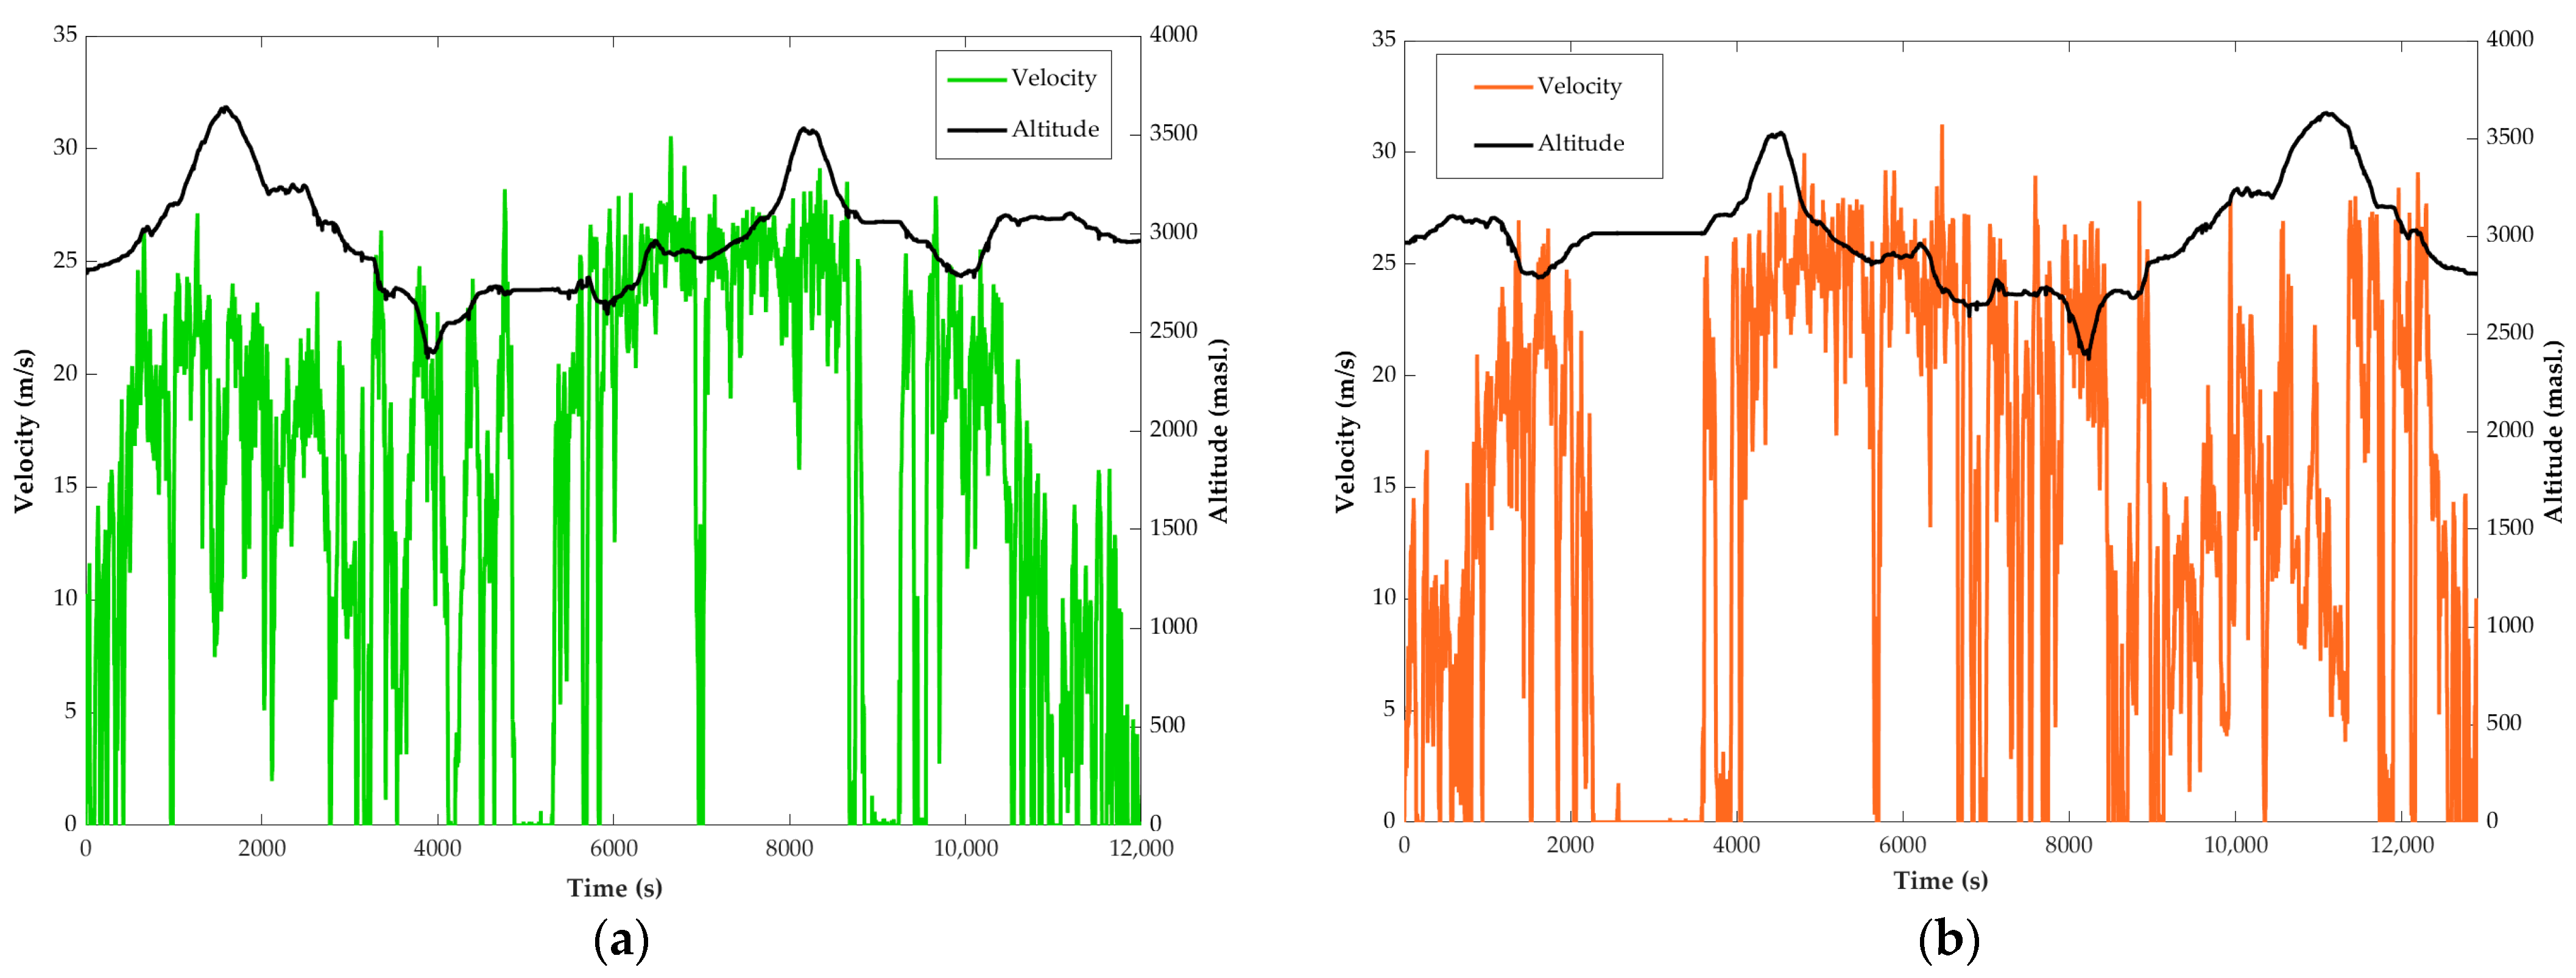
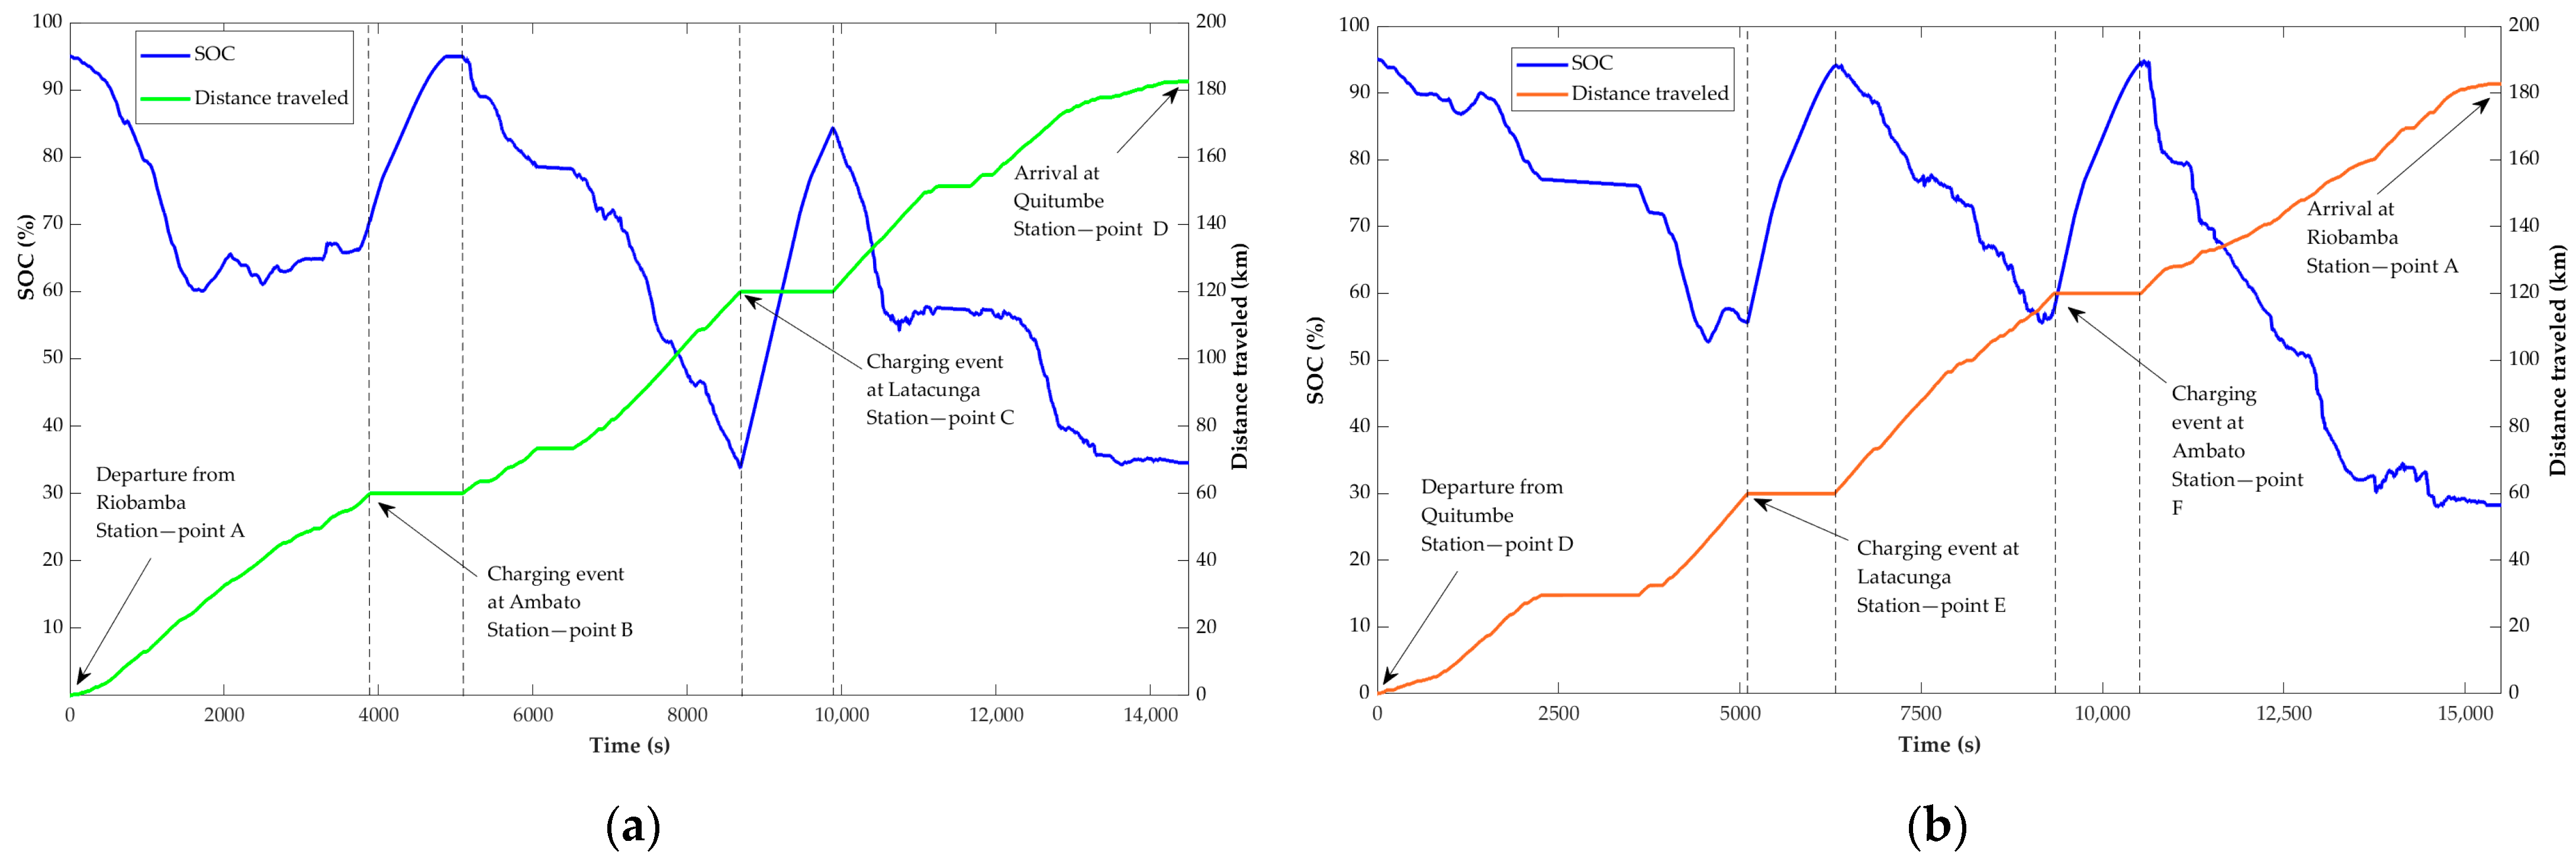
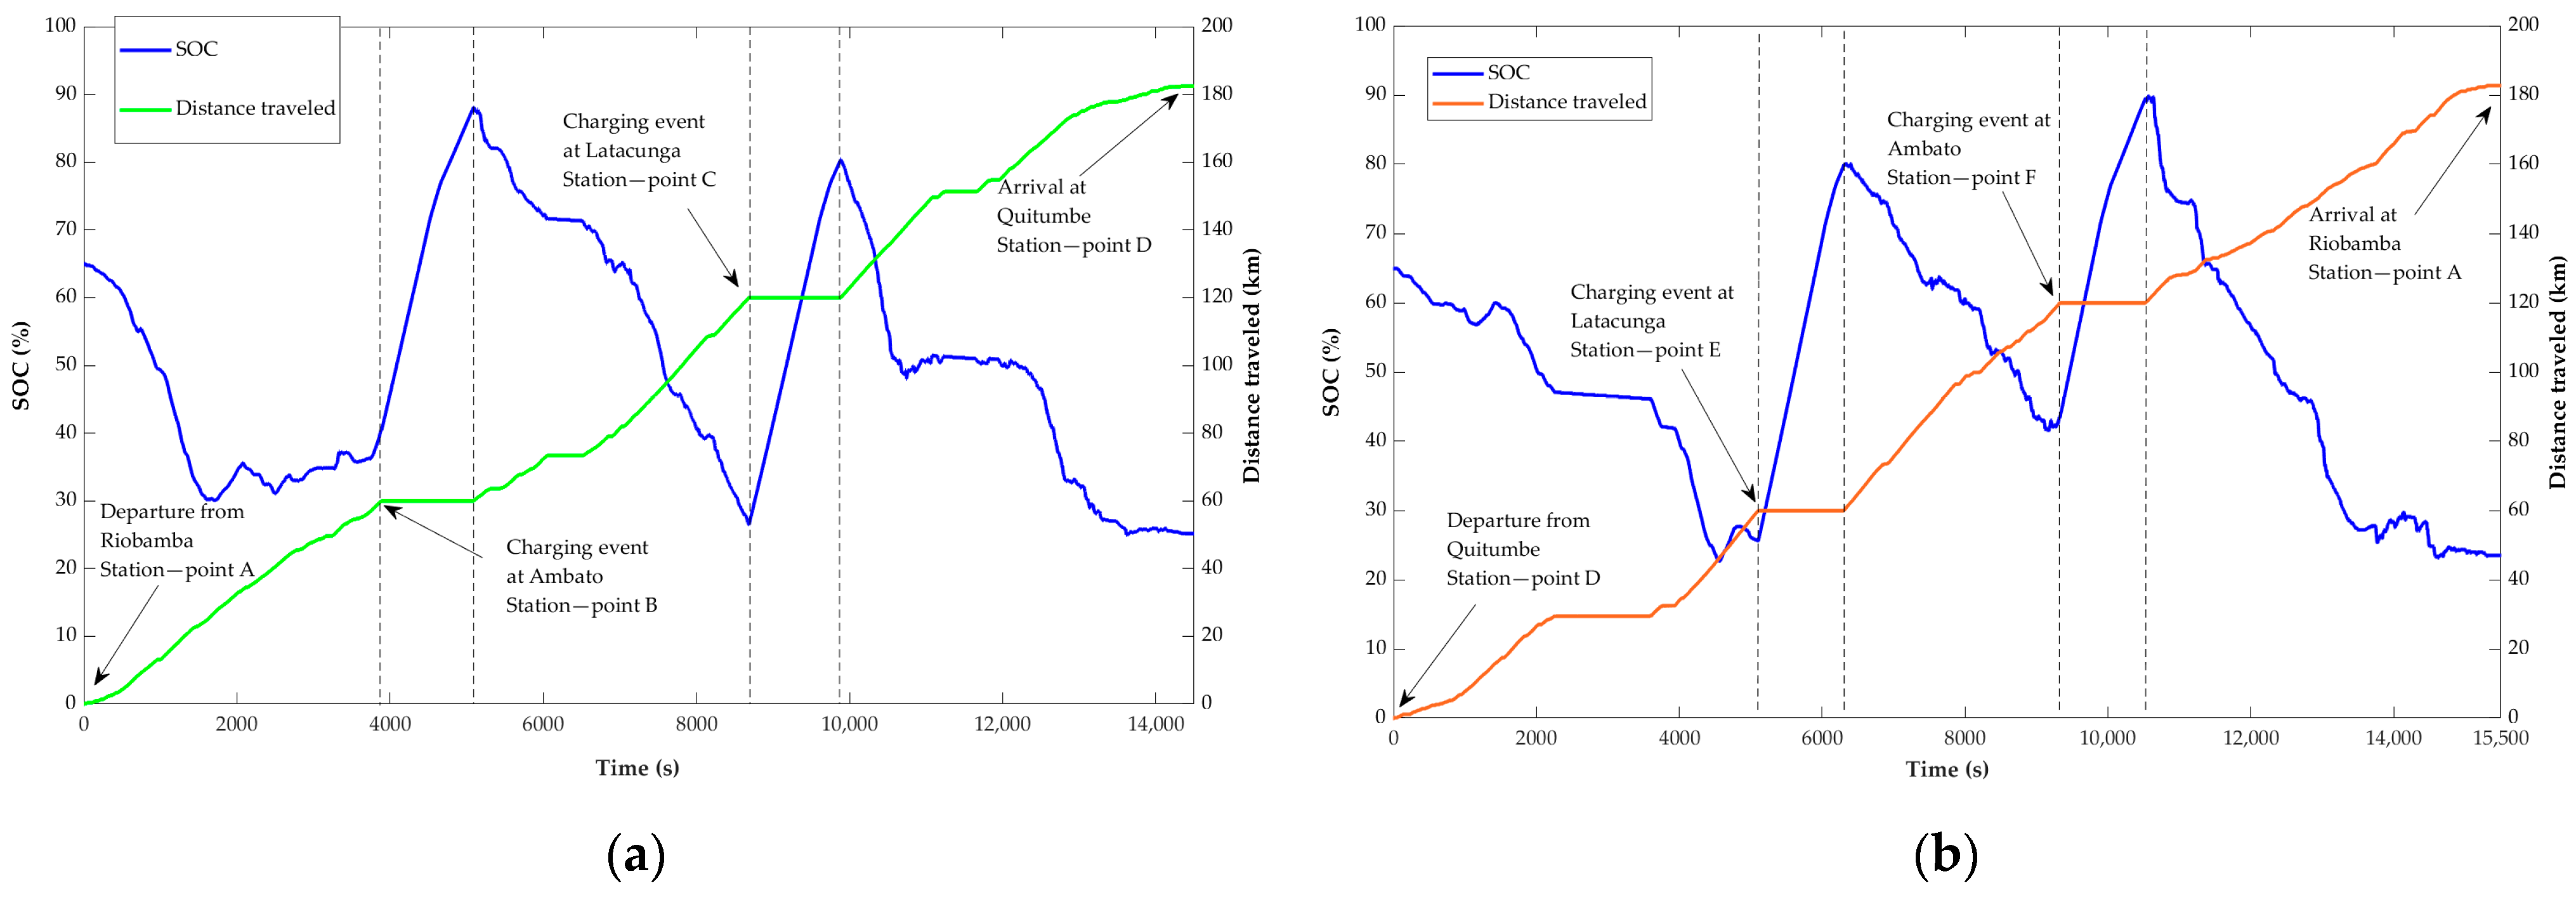