Article

Incremental Profitability Evaluation of Vehicle-to-Grid-Enabled Automated Frequency Restoration Reserve Services for Semi-Public Charging Infrastructure: A Case Study in Belgium

by
Andrei Goncearuc
1,2,*,
Nikolaos Sapountzoglou
1,
Cedric De Cauwer
1,
Thierry Coosemans
1,
Maarten Messagie
1 and
Thomas Crispeels
2
1
ETEC Department & MOBI Reserach Group, Vrije Universiteit Brussels (VUB), Pleinlaan 2, 1050 Brussels, Belgium
2
BUTO Department, Vrije Universiteit Brussel, Pleinlaan 2, 1050 Brussels, Belgium
*
Author to whom correspondence should be addressed.
World Electr. Veh. J. 2023, 14(12), 339; https://doi.org/10.3390/wevj14120339
Submission received: 20 October 2023 / Revised: 1 December 2023 / Accepted: 4 December 2023 / Published: 6 December 2023

Abstract

:
The current paper defines a framework for the introduction of automated frequency restoration reserve services, enabled by vehicle-to-grid technology, into the business model of an entity owning and operating a network of semi-public Electric Vehicle Supply Equipment. It assesses the profitability of this introduction by performing a case study based on the real-life electric vehicle charging data from the EVSE network located in a hospital parking lot. From the results of the study, it is clearly visible that the introduction of vehicle-to-grid-enabled automated frequency restoration reserve services has a significant positive incremental profitability; however, this is heavily dependent on the plug-in ratio of the charging network, determined by electric vehicle users’ behavior.

1. Introduction

1.1. Context

Recent years have shown a significant increase in the popularity of electric vehicles (EVs), which, in combination with the renewable energy supply, is generally considered a positive trend, leading to reduced pollution and a cleaner environment (e.g., reduced oil consumption and CO2 emissions) [1,2]. At the same time, the growing number of EVs on the roads brings certain challenges. One of these challenges is the increasing pressure on electricity grids [3]. However, EVs can also provide a solution to this issue by means of vehicle-to-grid (V2G) technology [4], allowing for bidirectional energy transfer between the EV battery and the electricity grid, and thus providing the opportunity not only to consume and store energy in EV batteries but also to inject it back into the grid. Moreover, this creates additional opportunities both for grid operators, who would potentially benefit from a solution to grid-balancing issues, and for the participants of the EV charging business ecosystem, which could potentially benefit from the additional revenue streams.
Based on a number of previous studies defining the EV charging business ecosystem [5], the business models of its participants [5,6], the introduction of V2G technology into these business models [5] and the initial opportunities of V2G service organizers in grid-balancing markets [7], the current study makes a step further into the investigation of the V2G potential in grid-balancing services. Namely, this study assesses the incremental profitability of the introduction of V2G-enabled automated Frequency Restoration Reserve (aFRR) services, into the business model of an entity owning, managing, and maintaining a semi-public EV charging infrastructure.

1.2. Literature Overview

The vehicle-to-grid (V2G) concept was primarily introduced by the research of Kempton et al. [8], outlining the technical and financial opportunities enabled by the bidirectional energy flow to and from the EV battery. One of these opportunities, further elaborated by a number of follow-up studies [9,10,11,12,13,14], is the potential application of V2G technology to energy-grid-balancing services. The participants of the EV charging business ecosystem, managing and maintaining the network of Electric Vehicle Supply Equipment (ESVE) would, in this case, take over the role of the grid-balancing service providers (BSP), aggregating a number of V2G EVSE and providing power and energy to the central grid in case of necessity [9,10] in exchange for remuneration based on their bidding strategies in a grid-balancing auction [11]. It is important to mention that the application of V2G technology is not limited by the central grid-balancing services and includes numerous applications, including peak shaving, local load-balancing and others [12,13]. However, the V2G-enabled grid-balancing services are particularly valuable in the light of the potential future necessity of electric grid reinforcements [14].
The initial business model of the participants of the EV charging business ecosystem, managing and maintaining the network of EVSE, is mainly based on the provision of EV charging services as the core value proposition at present, covering the needs of the EV users as the main customer segment and receiving EV charging fees as the main revenue stream [5,6,15].
However, the V2G-enabled transformation of this business model introduces an additional value proposition: grid-balancing services. The new value proposition targets a new customer segment, namely transmission system operators (TSO) (entities responsible for managing and maintaining a high-voltage electricity grid). At the same time, the currently existing main customer segment—the EV users—takes the role of the key partner, providing the EV batteries for the V2G-enabled grid-balancing services [5,7,16].
According to Elia [17], the Belgian TSO, there are three types of grid-balancing services designed to avoid frequency deviations from a predefined constant level (e.g., 50 Hz in Belgium):
  • Frequency Containment Reserve (FCR): primary reserve, which is automatically fully activated within a timeframe of 30 s in case of a significant frequency deviation and stabilizes the frequency fluctuations [18].
  • Automated Frequency Restoration Reserve (aFRR): secondary reserve, which is automatically fully activated within a timeframe between 30 s and 7.5 min, in order to restore the frequency at the predefined level [19].
  • Manual Frequency Restoration Reserve (mFRR): tertiary reserve, which is manually activated on demand within 15 min, in order to restore frequency at the predefined level in case of major imbalances [20].
According to the recent study, performed by Elia [21], EVs can be mainly used to provide FCR and aFRR services, as the provision of these services requires a relatively fast automatic activation and can be performed with limited energy resources. Moreover, according to [5], the inclusion of grid balancing services in the list of their value propositions can become a significant additional revenue stream for the participants in the EV charging business ecosystem.

Automated Frequency Restoration Reserve (aFRR)

From the revenue point of view, the aFRR service is particularly interesting for entities willing to engage themselves in the energy balancing market, since it opens two additional revenue streams: balancing power capacity and balancing energy remunerations [19].
In practice, the rules and procedures related to the provision of aFRR services differ from one TSO to another. However, even though the current study focuses on the Belgian TSO Elia, the procedural differences are not critical, and the results could be extrapolated to other geographical regions with minor adjustments.
It is also important to mention that the aFRR market was initially designed for large electricity-generating entities (e.g., gas and hydroelectric power plants), and still has substantial regulative barriers for small and medium enterprises (SMEs), CPOs, and other smaller prosumers willing to participate in the provision of the service [22]. The main barriers are:
  • Minimum amount of 1 MW of power for capacity bid and 1 MWh for energy bid [19].
  • Pay-as-bid auction principle, where the TSO pays exactly the amount indicated in the elected bid. The problem with this principle is that smaller entities rarely have sufficient resources for efficient continuous market analytics and are simply not able to indicate an up-to-date adequate price [23].
  • Expensive specialized metering equipment, which must be installed at every delivery point aiming to provide aFRR services [24].
However, recent years show a visible decentralization trend in the grid balancing market, indicating that these regulatory barriers can be diminished in the near future. For instance, the provision of FCR services does not require the installation of additional specialized metering equipment and requires only a standard digital meter [25]. Moreover, the FCR power capacity auctions are transferred to the pay-as-cleared principle, where all the elected bids from different BSPs receive equivalent remuneration based on the highest price from the elected bids [23]. These changes in the regulatory framework of the FCR services can be seen as the first step towards the decentralization of the whole grid-balancing market, including aFRR services.

1.3. Contribution

Since the V2G technology has not reached its maturity phase and the opportunities provided by the technology are not yet widely applied, the existing literature still lacks studies related to the profitability assessment of V2G-enabled aFRR. Therefore, the aim of the current study is to address this gap by defining the framework for the introduction of the aFRR services into the business model of an entity owning and operating an Electric Vehicle Supply Equipment (EVSE) network and assess the incremental profitability of this introduction based on a case-study of semi-public EV charging infrastructure.

2. Methodology

2.1. Model

The revenue streams of an entity owning, operating, and managing a network of EVSE is mainly represented by the fees received from the provision of EV charging services, which form the core value proposition of its initial business model. The cost structure, however, comprises numerous elements, including the cost of the supplied energy, depreciation of EVSE, human resources (HR) remunerations, and others [6,15].
As mentioned before, the introduction of V2G-enabled grid-balancing services is able to diversify the list of value propositions, entering a new market with a new customer segment and creating additional revenue streams. The focus of the current study lies in the assessment of the incremental profitability of the provision of V2G-enabled aFRR, which is the difference between the additional revenues and expenses caused by the introduction of the service. The factors influencing the incremental profitability of the provision of V2G-enabled aFRR are described in the current section in Equations (1)–(5).
The revenue generated by the provision of V2G-enabled aFRR (RaFRR) consists of two components, and can be defined as follows (Equation (1)):
RaFRR = CRaFRR + ERaFRR,
  • CRaFRR: power capacity remuneration;
  • ERaFRR: energy remuneration.
The provision and remuneration of the aFRR service are based on the auction principle. After concluding the contract with a TSO, a BSP is able to make power capacity bids on a day-ahead auction. Moreover, there are two types of power capacity auctions—“all-CCTU” and “per-CCTU”. The abbreviation CCTU means the Capacity Contracting Time Unit: the 4 h block when the power capacity bid made by the BSP can be activated by the TSO. Thus, in the first auction type, the bids are made for the whole 24 h, while in the second, bids are made for the 4 h blocks beginning from midnight (00:00 to 04:00; 04:00 to 08:00; 08:00 to 12:00, etc.). The BSP has to choose the suitable auction and CCTU(s) (in case of “per CCTU” auction) and make a power capacity bid, indicating the amount of power it is able to provide on the next day and the price of the desired service in EUR per MW of indicated power per hour (EUR/MW/h). The maximum amount of power the BSP is able to bid is defined beforehand by means of a prequalification test performed by the TSO. The bids are elected by the TSO based on the forecast-balancing power necessary for the next day and the “cheapest available” principle. If the bid made by the BSP is elected, the BSP receives the remuneration for the reserved amount of power (per MW) for the reserved time period (per hour) [19].
It is also important to mention that participation in the provision of aFRR services involves a certain risk of penalties in case of non-compliance with the contractual obligations of the BSP. The penalties can occur either due to the failure of spontaneous availability and/or activation tests performed by the TSO, or due to actual failure to provide the service during the activation. However, the maximum penalty should not exceed the remuneration of the respective month. Additionally, there is also a risk-mitigation opportunity, a so-called Transfer of Obligations (TO) procedure, allowing for the transfer of the power capacity obligations made by one BSP to another at the last hour before the due time, in case of any unexpected problems [19]. However, this procedure is based on agreements between the BSPs and can be costly for the demanding side.
Thus, for the V2G-enabled aFRR, the remuneration for the reserved power capacity (CRaFRR) mechanism can be formulated as follows (Equation (2)):
CR aFRR = aFRR Capacity   Bid × y = 1 Z N y   ×   K y   ×   T reserved × ( P plug-in P failure × F failure ) P TO × C TO
  • aFRRCapacity Bid: aFRR capacity bid (in €/MW/h) for the considered time period (Treserved);
  • y: type of EVSE (from 1 to Z) (e.g., uni/bi-directional; AC/DC; EVSE power level);
  • Ny: number of EVSE types y participating in the provision of aFRR services;
  • Ky: power level of EVSE type y;
  • Treserved: reservation time period of the available BSP power capacity;
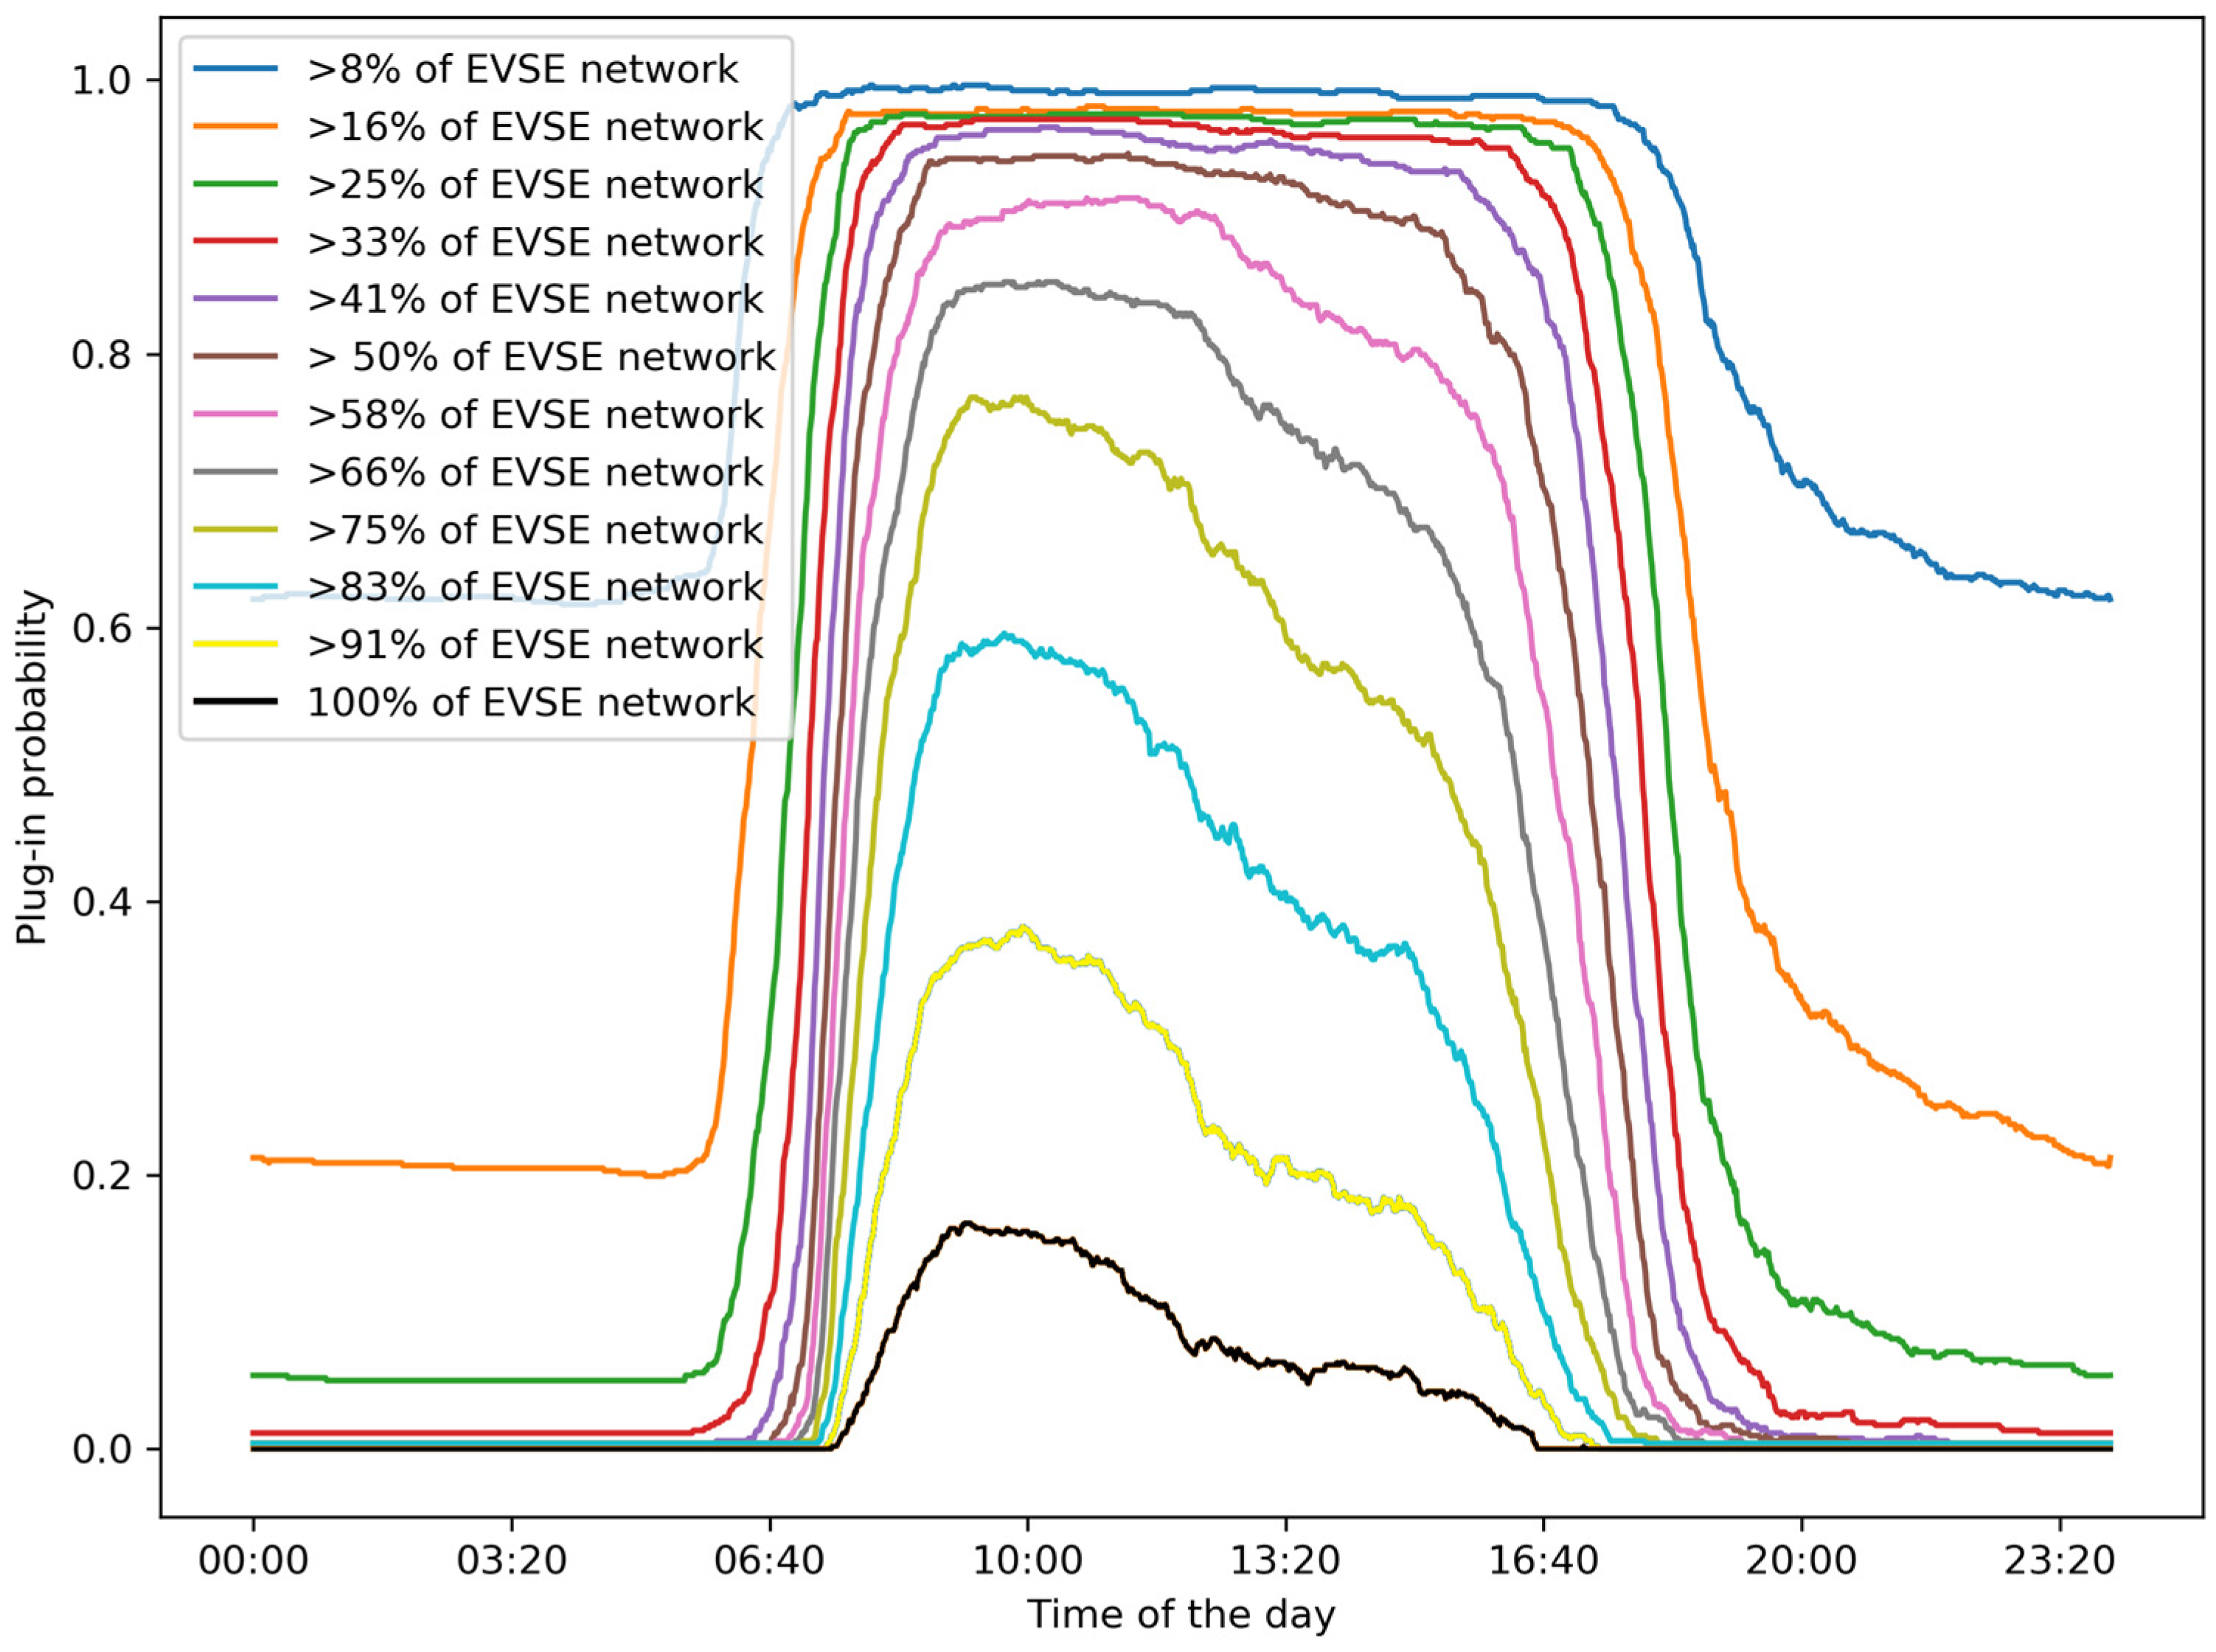
  • Pplug-in: probability that the EVSE type y is going to be plugged into an EV during the reservation time period (Treserved);
  • Pfailure: risk factor, indicating the probability that the BSP will fail and be penalized;
  • Ffailure: the multiplication factor forming aFRR penalties, which is the factor to be multiplied with the price of the missing MW of power the BSP was not able to deliver;
  • PTO: risk factor, indicating the probability of the necessity of opting for the transfer of obligations (TO) service;
  • CTO: cost of TO service.
During the CCTU for which the balancing power capacity was reserved, the TSO can actually activate the bid, and its activation initiates the second type of aFRR remuneration—balancing energy remuneration (ERaFRR). In order to provide (for aFRR+) (or decrease for aFRR−) the necessary power capacity, the BSP has to inject (or consume, in case of aFRR−) energy into the grid during the whole activation period, while the TSO will pay for this balancing energy. The balancing energy remuneration is also based on the auction principle, but is intra-day in this case. The BSP, whose power capacity bid was elected on the prior day, makes another intra-day energy bid, indicating the amount of energy (in MWh) and the price. In this case, the BSP receives the remuneration (cost reduction, for aFRR−) only in case of activation, based on the actual amount of MWhs injected (consumed, for aFRR−) into the TSO grid [19]. Thus, the V2G-enabled aFRR energy remuneration can be formulated as follows (Equation (3)):
E R a F R R = a F R R E n e r g y   B i d × y = 1 Z N y P L y T a c t i v a t e d
  • aFRREnergy Bid: aFRR energy bid (in €/MWh) for the considered time period (Tactivated);
  • Tactivated: activation time period of the available BSP power capacity.
The influence of the introduction of V2G-enabled aFRR services on the cost structure mainly involves the increase in infrastructure depreciation costs related to the difference between unidirectional and V2G EVSE prices, along with the necessary precise metering equipment to be installed at every delivery point (EVSE or EVSE hub). Thus, the additional costs related to the provision of V2G-enabled aFRR services can be defined as follows (Equation (4)):
C a F R R = y = 1 Z P y L y + m = 1 N P m L m
  • ∆Py: difference in price between uni- and bidirectional EVSE with comparable power level;
  • Ly: useful lifetime of EVSE type y;
  • m: number of aFRR delivery points (from 1 to N) in the EVSE network;
  • Pm: price of specialized aFRR metering equipment;
  • Lm: useful lifetime of specialized aFRR metering equipment.
Defining the incremental profits for the provision of V2G-enabled aFRR service (IPaFRR) as the difference between the additional revenues (RaFRR) and costs (CaFRR) results in the following formula (Equation (5)):
IP aFRR = aFRR Capacity   Bid × y = 1 Z N y × K y   ×   T reserved × ( P plug-in P failure × F failure ) P TO × C TO + aFRR Energy   Bid × y = 1 Z N y × K y   ×   T activated y = 1 Z P y L y + m = 1 N P m L m

2.2. V2G-Enabled aFRR Use-Case

2.2.1. General Provisions

In order to assess the incremental profitability of the V2G-enabled aFRR services, the current research applies the defined model, generating a case-study based on real-life data and a set of grounded assumptions.
In general, the process of the provision of V2G-enabled aFRR services can be compared with the use of stationary batteries for similar purposes. The EV battery increases (for aFRR+) or decreases (for aFRR−) the power level of the TSO grid in case of need, while the TSO pays for the reserved capacity and the activated energy.
However, the reserved capacity bids for aFRR+ are, on average, higher than the aFRR− bids, while the V2G technology allows not only for energy to be consumed at a lower price (for aFRR−) but also to be injected and sold through energy bids by aFRR+ [26]. Moreover, according to the internal EV charging data, in most cases, the EVs plug in at >50% state of charge (SOC), while participation in aFRR− requires buffer space in the EV battery. Finally, due to this need for additional buffer battery space, the EV is not able to charge during the CCTU outside the activation periods, solely relying on aFRR− activation periods to charge. At the same time, the expected parking time is typically longer than the time needed to charge, creating the opportunity to compensate for the depleted energy in aFRR+.
Considering all the above-mentioned issues, the case-study generated by the current research is focused on the provision of V2G-enabled aFRR+ services.
The provision of aFRR+ can be performed in two ways, depending on the power baseline set by the BSP before the activation. Either, during the activation, the BSP stops consuming energy from the grid, reducing its own power and increasing the power in the TSO grid compared to the declared baseline (while consuming), or the BSP injects energy into the TSO grid, increasing the power in grid compared to the idle-state baseline, as shown in Figure 1.
Figure 1 shows an example of the V2G-enabled aFRR+ provision process with time in hours on the x-axis and power in kW on the y-axis. The reserved CCTU begins at time t1 with the declared power baseline 1. At this point, the reservation period begins, but aFRR+ is not activated, so EVs connected to the EVSE network and engaged in the provision of the service are consuming energy and increasing their SOC. At timepoint t2, the TSO activates aFRR+ and the BSP stops consuming, dropping the power baseline to 0. The activation ends at timepoint t3, and connected EVs can continue to charge until timepoint t4, when they reach 100% SOC and remain plugged-in, but idle. At timepoint t5, the TSO initiates another activation, but this time the EVs are not able to stop charging, as they are idle and the power baseline is at level 0. Thus, the EVs begin to discharge, injecting energy into the grid. At timepoint t6, the activation ends, and EVs can begin to recharge the discharged energy, and at timepoint t7, the reserved CCTU ends. It is important to notice that, in case aFRR+ power capacity is provided by the reduction in or stopping of consumption, the BSP does not receive the energy remuneration, as no energy was actually injected into the grid.
Regarding the resulting SOC after the end of aFRR+ CCTU, due to the opportunity for service provision via stopping or reducing consumption, in the worst case, the additional ∆SOC would be equal to 0%, meaning that the EV would remain at the same state of charge as before CCTU. Therefore, a time buffer should be created after the CCTU to bring the EV to the SOC desired by the EV user.
However, on average, the probability of the occurrence of ∆SOC = 0% is less likely. By analyzing the open access data retrieved from Elia [26], the average aFRR+ activation time per CCTU (4 h) is 103 min (ex., injecting ~17.2 kWh of energy to the grid through 10 kW V2G charger), while, according to the internal EV charging data, the average time to reach 100% SOC is around 51 min (the vast majority of EVs plug in with 60–80% SOC). By subtracting 103 min from 4 h, it becomes clear that a time buffer of 137 min of non-active time within a CCTU is already present, making it easy to cover the time needed to reach 100% SOC.

2.2.2. Coping with Uncertainties for aFRR Capacity Remuneration

In addition the SOC, there is another important factor that plays a role. Unlike stationary batteries, the EV batteries move together with the vehicles, while the successful provision of V2G-enabled aFRR services requires every participating EVSE to be connected to an EV during the elected CCTU. Moreover, as the capacity bids are made on the day-ahead auction, the plug-in probabilities (Pplug-in) of the EVSE network for the elected CCTU should be known at least one day beforehand. This creates an area of uncertainty, consisting of the probability of using the costly TO risk-mitigation technique (PTO) and the probability of failing to deliver the service and receiving the penalty (Pfailure). Therefore, an accurate forecasting technique is of major importance for the successful implementation of the service.
The current research applies an EV-charging data-driven forecasting method, limiting the risk of failure. By making use of the historic EV charging data retrieved from the EVSE, which is meant to be engaged in the provision of V2G-enabled aFRR, the study defines a set of plug-in probabilities (Pplug-in) for every minute of the day. This allows for the CCTU(s) with the highest Pplug-in to be elected, limiting the risk of failure.
After defining the CCTU(s) with the highest Pplug-in, the risk could be further mitigated by the TO option. This could be achieved by comparing how accurately the Pplug-in values retrieved from the EVSE, which is meant to be engaged in the provision of V2G-enabled aFRR, one hour before and at the beginning of the elected CCTU(s) that correspond with each other (% of correspondence), and double checked by means of statistical analysis methods (e.g., t-test; ANOVA) (BSP can opt for a TO at the final hour before the CCTU). The high retrieved value indicates the high accuracy of the forecast and allows for the result of (1 − Pplug-in) to be used as the PTO value.
Finally, the probability of failure (Pfailure), despite all the risk-mitigation techniques, can be retrieved by calculating the joint forecasting accuracy of every CCTU timestep, adjusted for Pplug-in at the beginning of CCTU.

2.2.3. Values of the Model Parameters

After outlining the general provisions of the case study and describing the methods used to cope with uncertainties, it is relevant to define the values for a number of parameters that actually participate in the calculations.
As shown in Table 1, the values of the parameters are divided into three subgroups. The first subgroup represents the values retrieved from external data sources. It is important to note the importance of ∆Py variable, as, according to [7], the profitability of the whole business model is very sensitive to the price of V2G EVSE. The ∆Py value presented in Table 1 is retrieved from the difference in the privately retrieved price quotes for a 10 kW DC bidirectional charger and a unidirectional AC charger of a similar power level.
The second represents the ranges of probabilities retrieved by means of calculations from the available charging dataset, which are discussed in more detail in the results of the study (Section 3). The third subgroup is the values that are part of the assumptions list designed explicitly for the current case study.

2.2.4. Design and Assumptions of the Case Study

The current research assesses the annual incremental profitability of the V2G-enabled aFRR+ services by means of a case study of semi-public EVSE infrastructure located in a hospital parking lot (UZ Bussel). The dataset includes 9344 charging sessions from 12 EV chargers over a two-year period (January 2020–January 2022), filtered to include the workdays only, assuming the highest probability of EVs remaining plugged in for a longer period of time during working hours. Moreover, the current case study generates results for participation in only one CCTU per day, namely CCTU 4 (12:00–16:00), which is the one with the highest plug-in probabilities and lowest risk of failure.
Following the application of the model defined in Section 2.1, the case study adopts the following assumptions:
(a)
The costs of TO are defined by the bilateral contracts between the BSPs and are therefore not disclosed. The current study assumes this cost to be 120% of the capacity remuneration, as it is slightly lower than the one that is applicable for penalties.
(b)
The average EV battery capacity of the EVs charging at the respective EVSE is 50 kWh.
(c)
The provided case study does not include any bidding strategies, assuming all the power capacity bids are to be elected based on the average market price.

2.2.5. Scenarios

As is clear from the previous sections, the successful implementation of the V2G-enabled aFRR services is heavily dependent on the EV users’ charging behavior, determining the Pplug-in at a certain point in time. Therefore, the current study provides three different modeling scenarios, considering different types of behavior and interactions with EV users, which affect the Pplug-in and its derivatives (PTO; Pfailure):
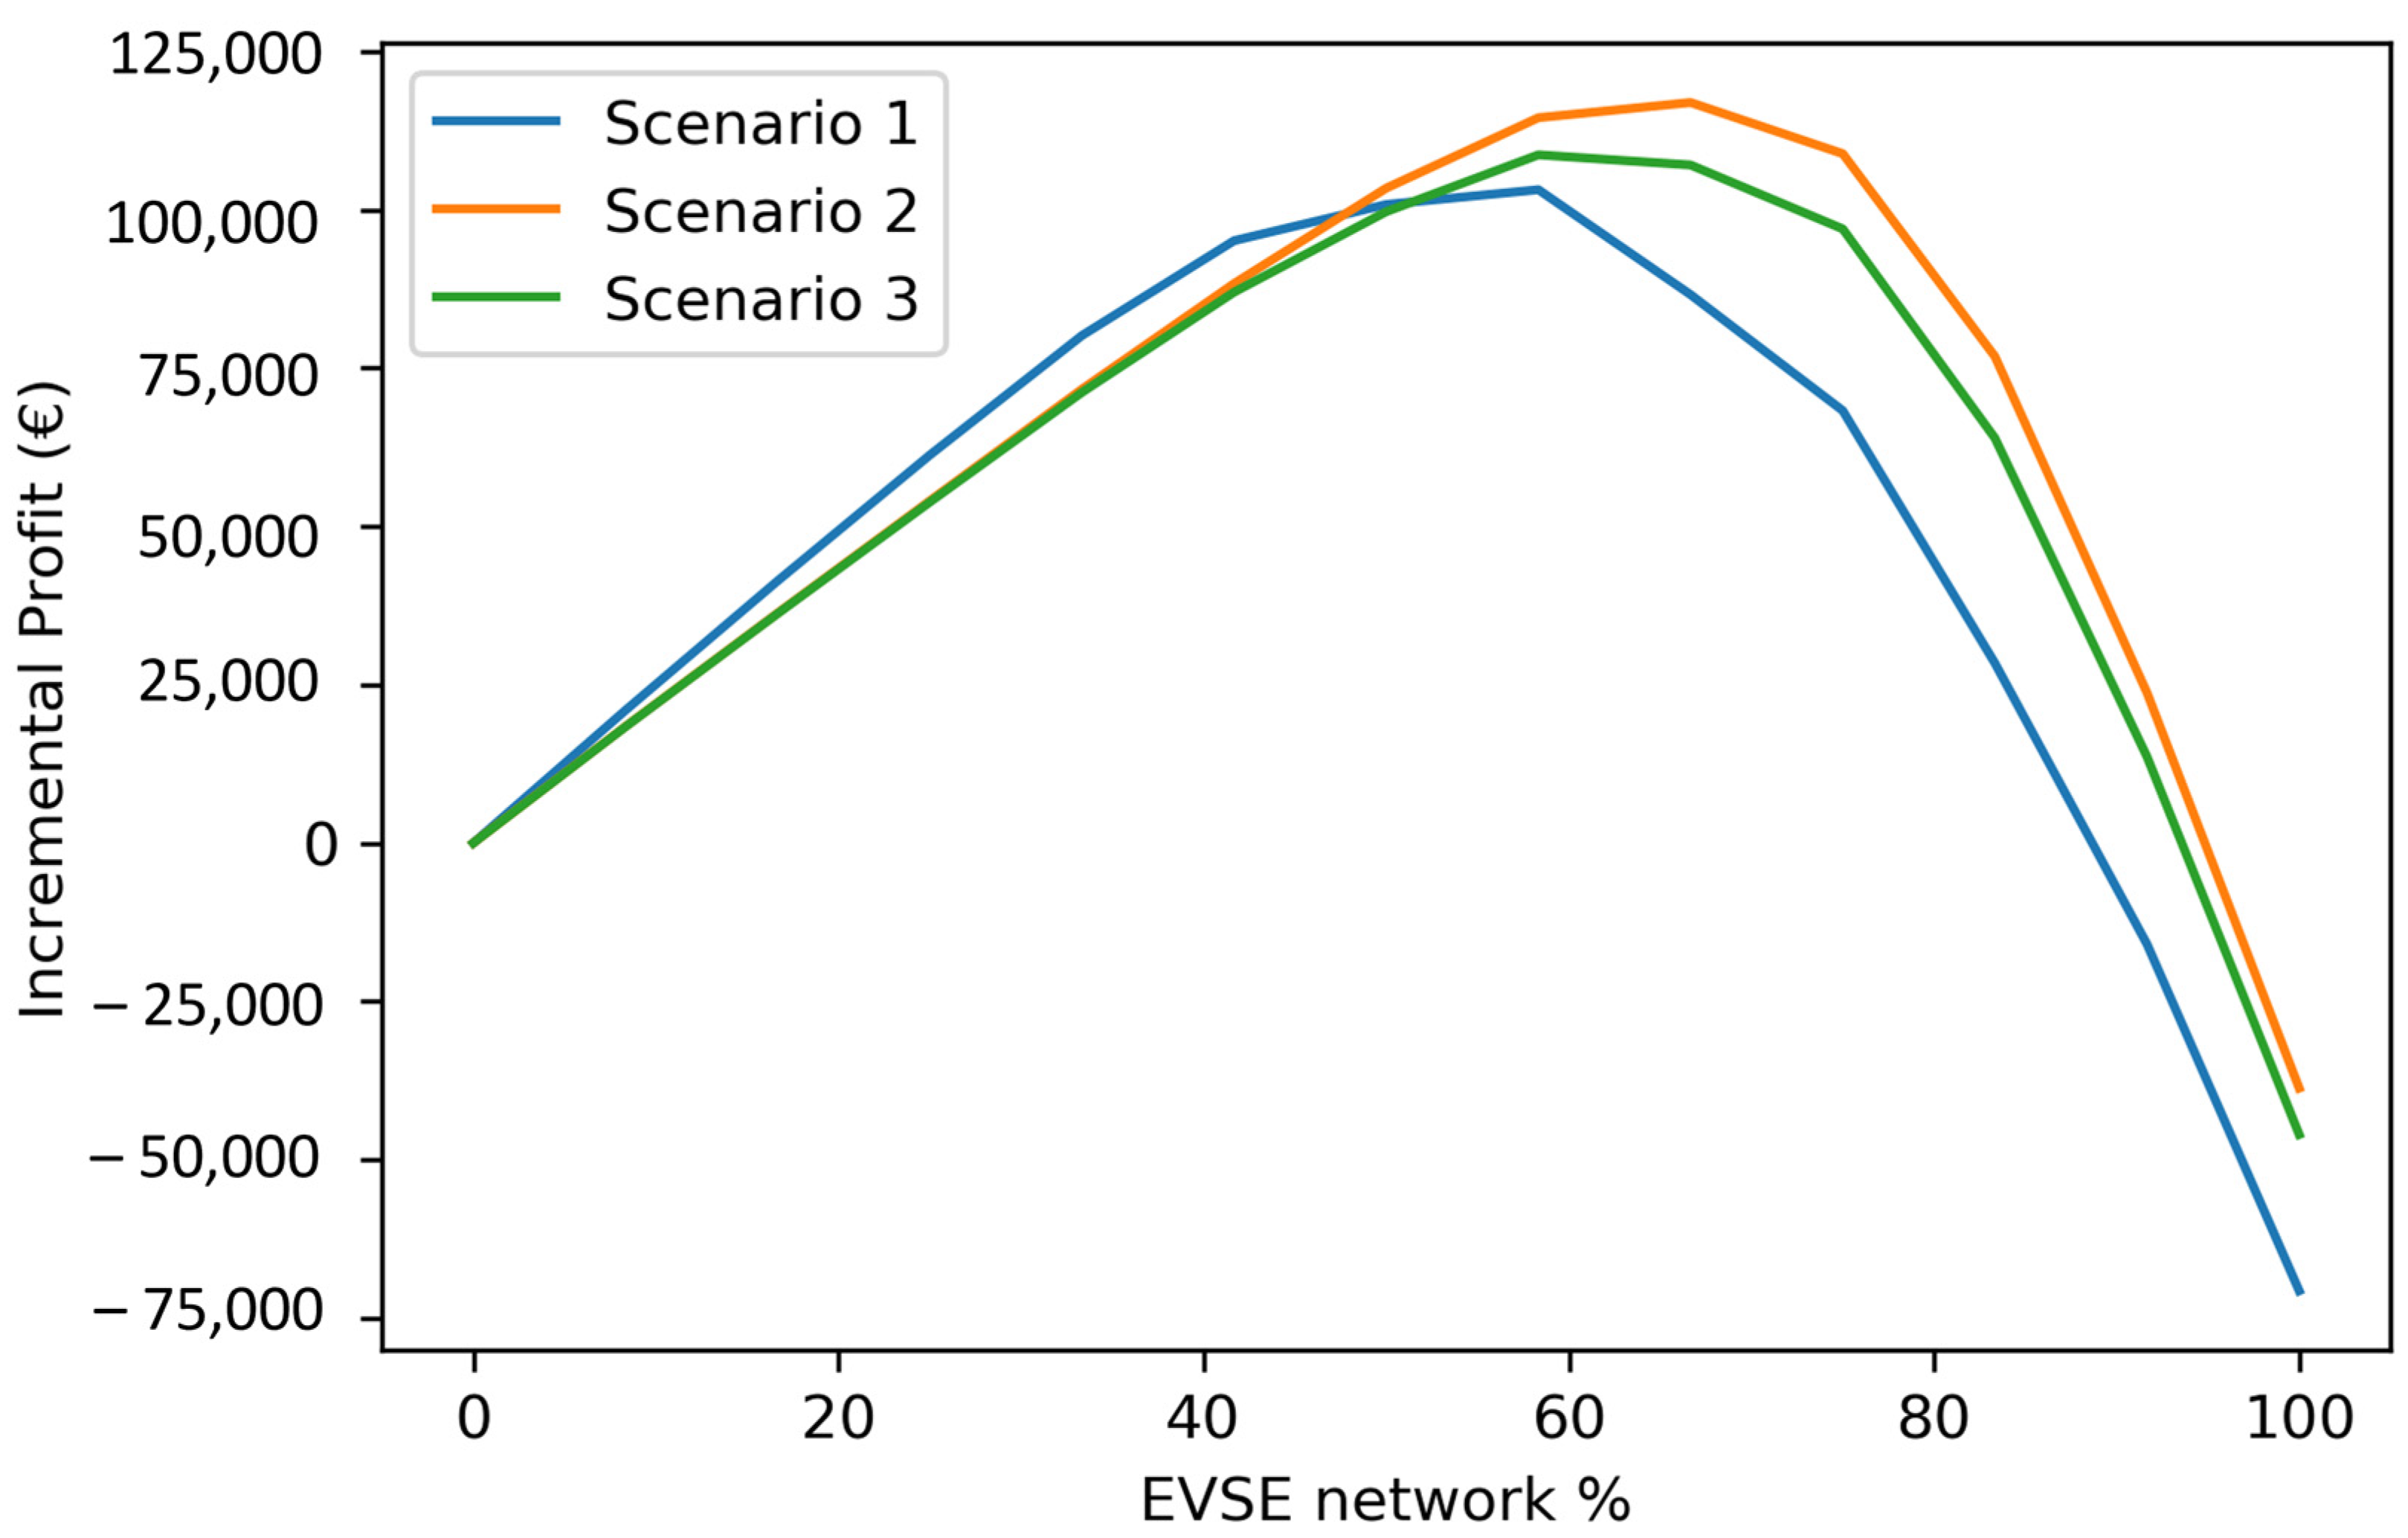
  • Scenario 1: Natural behavior. The EV user agrees to the fact that his/her EV is going to be used for V2G-enabled aFRR services (or is unaware of this fact), but does not change his/her charging behavior and acts naturally. This scenario is based purely on the historical real-life data of EV charging patterns determining Pplug-in, PTO, and Pfailure. The EV user is not bound by any obligations and is able to unplug the EV at any time. At the same time, the EV user receives no shared revenues from the provision of V2G-enabled aFRR services.
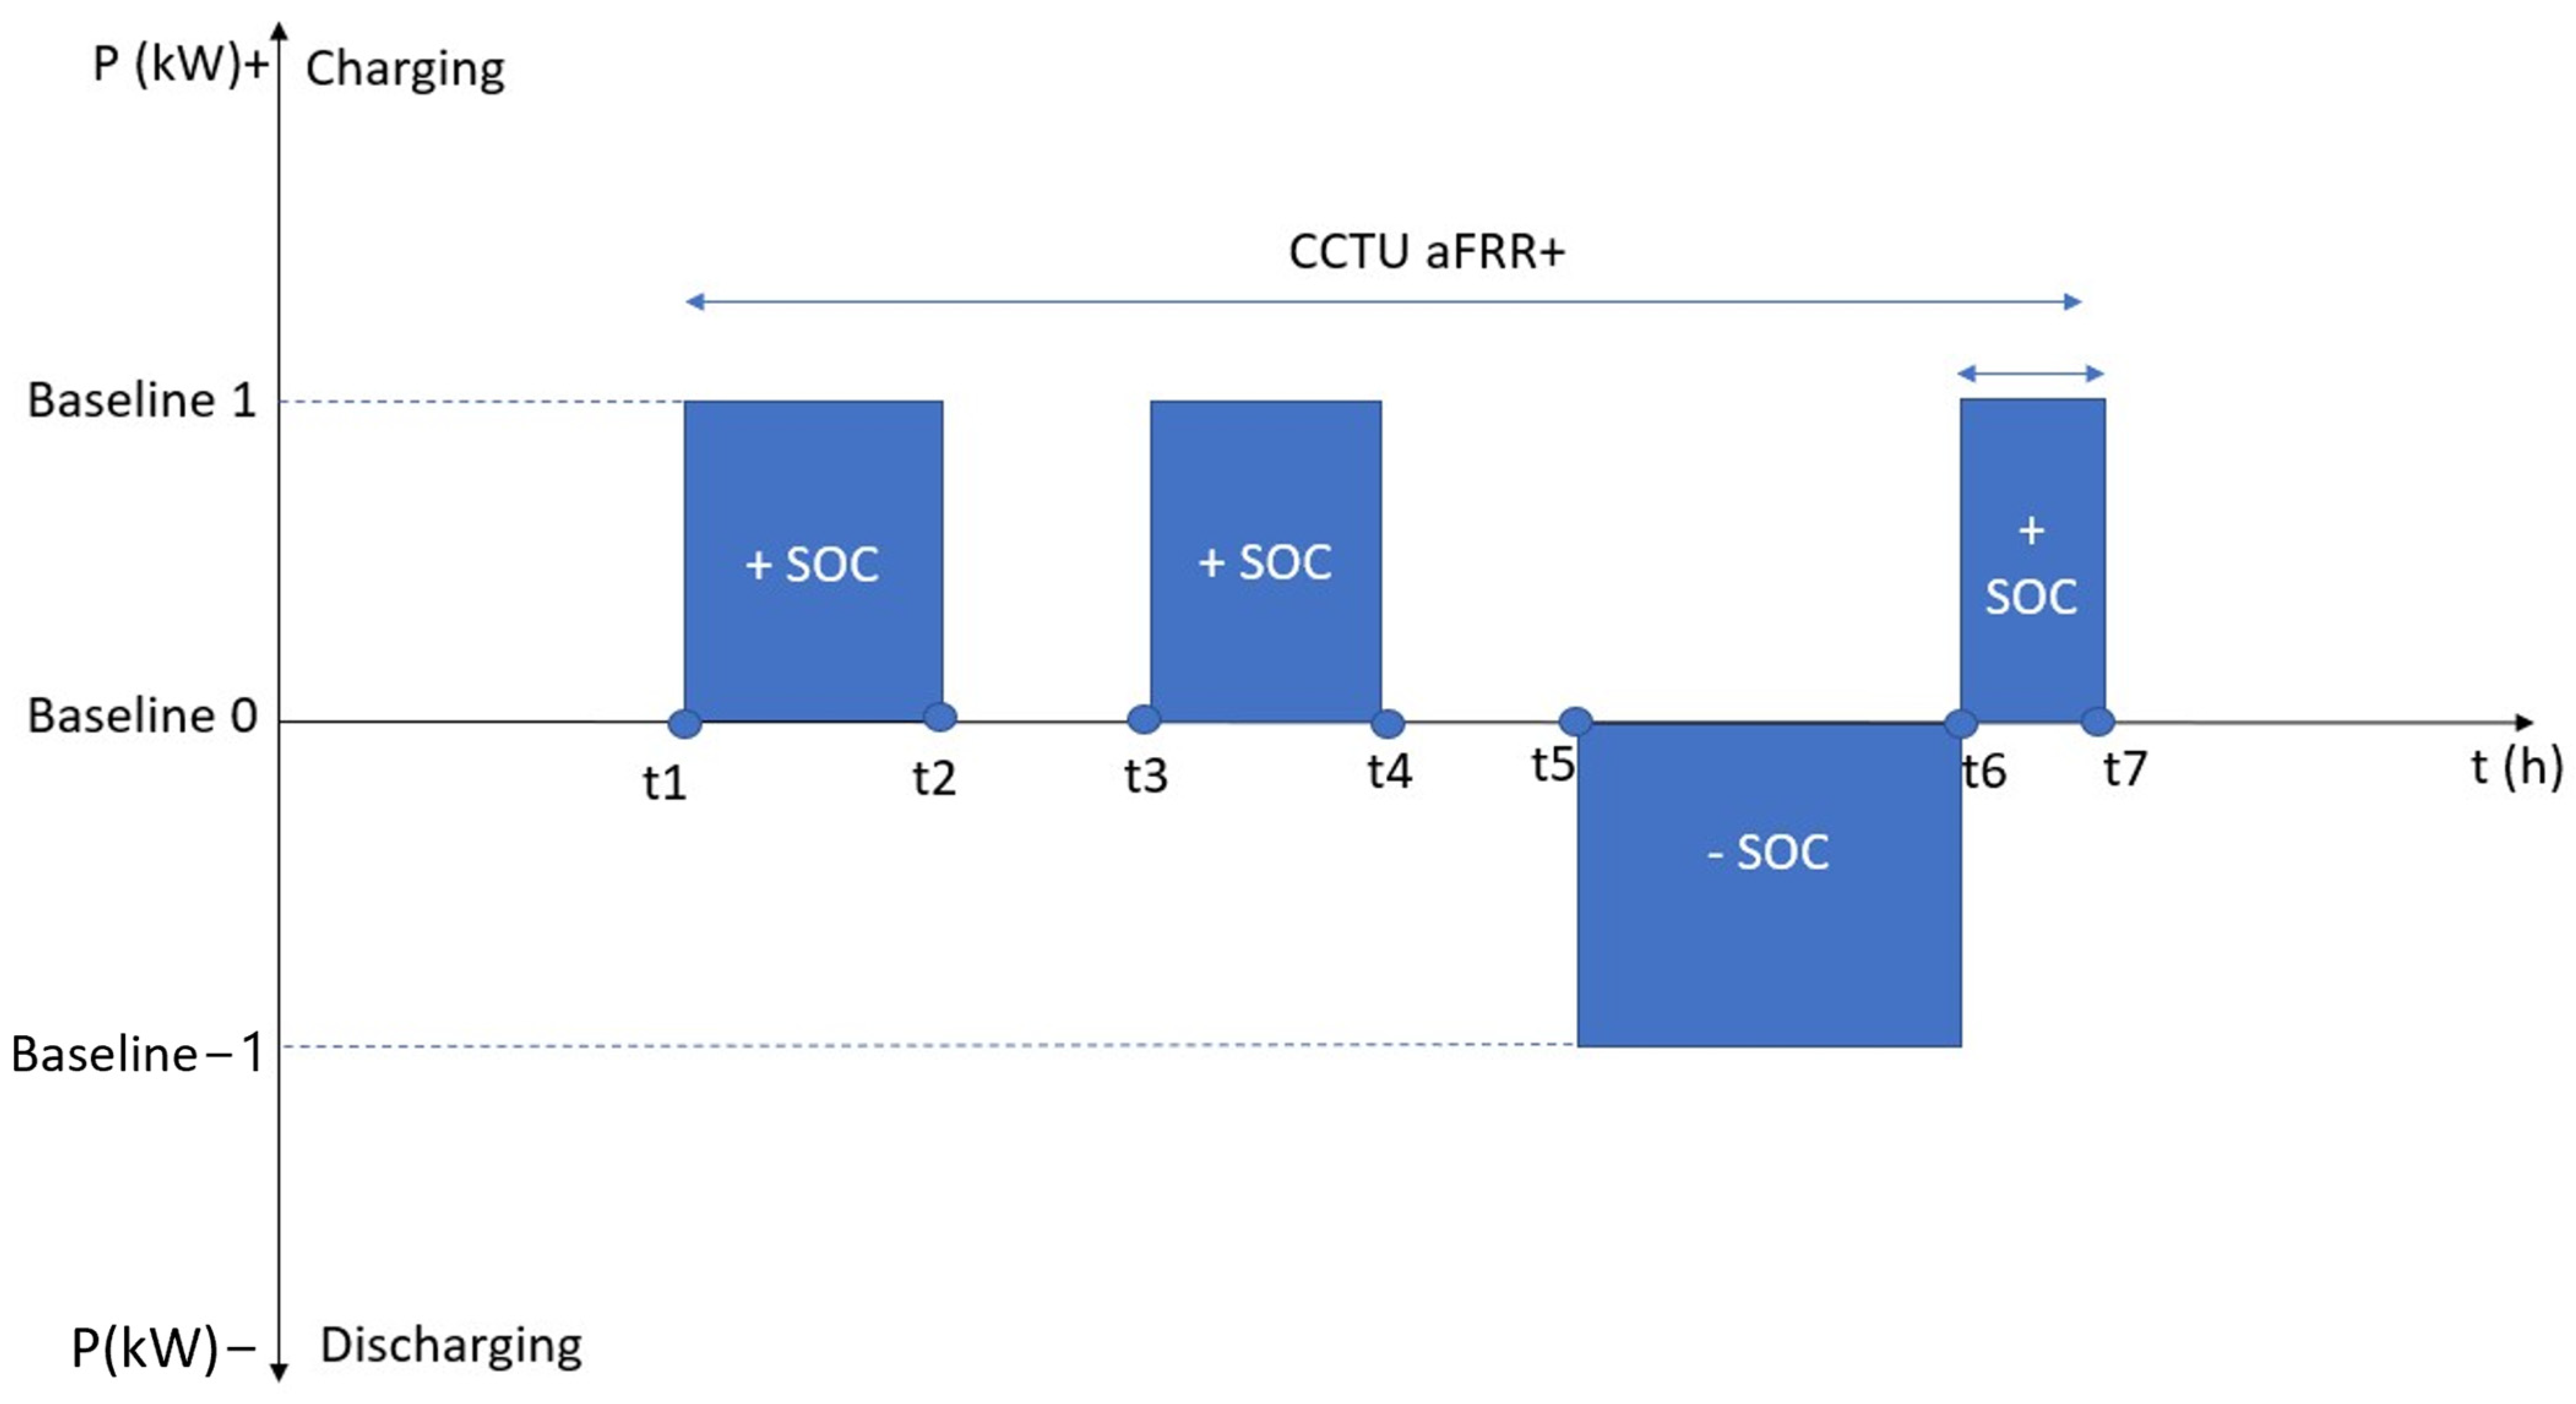
  • Scenario 2: Binding contract. The EV users receive binding day-ahead contracts, offering 20% of the aFRR+ capacity revenues for the permission to use their EV batteries for grid-balancing purposes. In this case, the EV would be plugged in and blocked for a period of 6 h, beginning 1 h before the elected CCTU (allowing fpr the user to opt for the TO option in case of emergency) and ending 1 h after the CCTU (ensuring that 100% SOC is reached for the EV after the provision of the service). In case of a violation of contract terms (e.g., not plugging in or unplugging before the contractually defined moments), the EV user pays a penalty equivalent to the penalty the BSP would receive for missing the MW (securing the BSP from losses in case of contract violations). This allows for a the situation where PTO = Pfailure = 0. This can be seen as another risk-mitigation method, cutting out the additional expenses related to uncertainties by sharing 20% of capacity revenues with the EV users.
  • Scenario 3: Non-binding contract. The EV users receive non-binding day-ahead contracts, offering 20% of aFRR+ capacity revenues for the permission to use their batteries for grid-balancing purposes. This contract type is a non-binding commercial offering that does not involve any penalties in case the EV user is not plugged-in during the defined period of time. Thus, in the worst case, the violation of the contract terms by the EV user would mean that no remuneration is received. In this scenario, 20% of the contracted users are assumed to violate the non-binding contract on average, creating losses related to TO and penalties for the BSP. This scenario can be seen as another risk-mitigation method, although less efficient than the one described in Scenario 2 in absolute terms for the BSP, but it is also less binding, and thus more attractive for EV users. In this case, the PTO and Pfailure are limited to 20% of their initial value.

3. Results

Before proceeding to the actual results of the study, determining the incremental profitability of the V2G-enabled aFRR+ services for an entity owning, managing, and maintaining EVSE infrastructure, it is important to discuss the results of the Pplug-in calculations and its derivatives, which play a crucial role in the successful implementation of the service. By making use of the method described in Section 2.2.2 and a real-life dataset retrieved from the EVSE network located in a hospital parking lot, the current study has defined the Pplug-in distribution, as presented in Figure 2:
Figure 2 shows the Pplug-in (y-axis) of the EVSE network during the time of the day (x-axis). Every curve on the graph represents the probability that at least a certain percentage of the EVSE network (indicated in the legend) is connected to an EV (and can potentially be used for grid-balancing) at a certain point in time. With regard to the location and the nature of the given EVSE network, it is clear the Pplug-in drastically increases around 07:00 and decreases around 17:00, indicating the average working hours of the hospital. This observatio directly points to the fact that the CCTU for the provision of grid-balancing services should be elected within this timeframe. Considering these conditions, there are two options regarding the CCTU choice: CCTU 3 (08:00–12:00) and CCTU 4 (12:00–16:00). However, there is also another point of attention, namely, PTO. As mentioned before, the BSP can opt for TO at final hour before the elected CCTU, while the Pplug-in values at 07:00 and 08:00 have significant differences, making the TO forecast inaccurate. At the same time, the Pplug-in values at 11:00 and 12:00 match each other very well. Therefore, the optimal risk-limiting choice is to opt for CCTU 4 (12:00–16:00) in this case. Another important observation is that the higher the considered percentage of the EVSE network, the lower the chance of having this percentage simultaneously plugged into the EVs. However, the Pplug-in density of up to 50% of EVSE network engagement remains quite high.
Thus, the first, and main, risk-mitigation method is an analysis of the historical plug-in data, as the ability to provide V2G-enabled aFRR services is the combination of the availability of V2G EVSE and the plugged-in EV. Therefore, the increase in the EVSE network engagement without the respective increase in EVSE occupation rate (increasing the potential plug-in probability) would only lead to losses. Also, as mentioned before, there is a TO option, serving as an official risk-mitigation method, limiting the potential losses related to penalties. Finally, the inclusion of the EV users in the contractual obligations, as described in scenarios provided in Section 2.2.5, serves as an additional, final risk-mitigation technique.
The incremental profitability of a V2G-enabled aFRR+ service for every EVSE network engagement level and every scenario defined in Section 2.2.5 is provided in Figure 3:
It is noticeable from Figure 3 that all the modeled scenarios show a positive incremental profit growth until the engagement of 60% (70% for Scenario 3) is reached by the EVSE network in aFRR+ services. These results are particularly interesting in light of the previously conducted research on the profitability of the provision of EV charging services only [7], showing negative profitability results (namely, −76,738 EUR) for this EVSE network size (250 EVSE units) caused by the high fixed costs and high electricity prices for smaller consumers. At the same time, it is clearly visible from Figure 3 that the incremental profits from the provision of V2G-enabled aFRR+ services are able to cover these losses, allowing for the break-even point to be reached on this relatively small network size.
Furthermore, after reaching the peak, the incremental profits begin to fall, eventually becoming negative at above 90% of network engagement. This behavior is explained by the lowering Pplug-in that goes along with the increasing network engagement (clearly visible on Figure 2), and resulting increase in PTO and Pfailure. Moreover, even though the potential penalty is capped by the power capacity revenues, the negative incremental profit is caused by the additional expenses related to the provision of the service.
It is also noticeable that, at lower EVSE network engagement values (up to 50%), Scenario 1 (blue curve) is more profitable than the other scenario. This can be explained by the lower PTO and Pfailure, which lead smaller expenses compared to the EV users’ remuneration. However, after 60% of EVSE network engagement, Scenario 1 shows a strong negative trend, reaching negative values faster than other scenarios. The reason for this is that the BSP in Scenario 1 does not mitigate the PTO and Pfailure by means of contracts with EV users, and bares more risks when the plug-in probability of the chosen percentage of the EVSE network begins to fall.

4. Conclusions

The current research has defined the framework for the introduction of the V2G-enabled aFRR services into the business model of an entity owning and operating an EVSE network, and used the defined framework for an assessment of its profitability based on a case study of EVSE infrastructure located in a hospital parking lot.
From the performed analysis, based on real-life data and a set of modeling assumptions, it becomes clear that the introduction of V2G-enabled aFRR services into the business model of an entity owning, managing, and operating a network of semi-public EVSE can have a significant positive incremental profitability.
However, it is important to bear in mind that the provision of aFRR services is heavily related to the plug-in probability of the EVSE network, influencing the potential network engagement in the service and the probability of costly risk-mitigation techniques and penalties. As is visible from the results of the case study, the profits increase up to 60–70% of the EVSE network engagement in aFRR service, with a relatively high simultaneous plug-in probability. Up to this level, the increasing additional revenues are able to cover the expenses. At higher levels of network engagement, the simultaneous plug-in probability of the network is significantly lower, resulting in a higher probability of TO, penalties, and diminishing profitability.
By comparing different scenarios from the case study, it becomes clear that above 50% EVSE network engagement it becomes more profitable to conclude contracts and share profits with the EV users. Even non-binding contracts (assumed to be violated in 20% of cases) partially mitigate the penalty and TO risks born by the BSP and increase profitability at the higher levels of EVSE network engagement.
Finally, it should be pointed out that even though the defined framework is applied to the semi-public EVSE network in the current research, its application (with minor adjustments) can be extrapolated to public and private EVSE infrastructures as well. Moreover, the framework can be applied to the unidirectional smart charging infrastructure; however, this would remove the opportunity to make incremental balancing energy bids and limit the direction of power-balancing. Therefore, the results of these potential use cases could be significantly different, and are interesting topics for future research.

Author Contributions

Conceptualization, A.G.; methodology, A.G.; software, A.G.; validation, C.D.C., N.S. and T.C. (Thomas Crispeels); formal analysis, A.G.; investigation, A.G.; writing—original draft preparation, A.G.; writing—review and editing, C.D.C., N.S. and T.C. (Thomas Crispeels); visualization, A.G.; supervision, C.D.C., N.S. and T.C. (Thomas Crispeels); project administration, C.D.C.; funding acquisition, T.C. (Thierry Coosemans) and M.M. All authors have read and agreed to the published version of the manuscript.

Funding

This research was funded by H2020 Research and Innovation Programme, grant number 875131.

Data Availability Statement

Data are contained within the article.

Conflicts of Interest

The authors declare no conflict of interest. The funders had no role in the design of the study; in the collection, analyses, or interpretation of data; in the writing of the manuscript; or in the decision to publish the results.

References

  1. International Energy Agency. Electric Vehicles. Available online: https://www.iea.org/reports/electric-vehicles (accessed on 11 April 2023).
  2. Koroma, M.S.; Costa, D.; Philippot, M.; Cardellini, G.; Hosen, M.S.; Coosemans, T.; Messagie, M. Life cycle assessment of battery electric vehicles: Implications of future electricity mix and different battery end-of-life management. Sci. Total Environ. 2022, 831, 154859. [Google Scholar] [CrossRef] [PubMed]
  3. Abousleiman, R.; Scholer, R. Smart Charging: System Design and Implementation for Interaction between Plug-in Electric Vehicles and the Power Grid. IEEE Trans. Transp. Electrif. 2015, 1, 18–25. [Google Scholar] [CrossRef]
  4. Sovacool, B.K.; Axsen, J.; Kempton, W. The Future Promise of Vehicle-to-Grid (V2G) Integration: A Sociotechnical Review and Research Agenda. Annu. Rev. Environ. Resour. 2017, 42, 377–406. [Google Scholar] [CrossRef]
  5. Goncearuc, A.; Sapountzoglou, N.; De Cauwer, C.; Coosemans, T.; Messagie, M.; Crispeels, T. An integrative approach for business modelling: Application to the EV charging market. J. Bus. Res. 2022, 143, 184–200. [Google Scholar] [CrossRef]
  6. Goncearuc, A.; Sapountzoglou, N.; De Cauwer, C.; Coosemans, T.; Messagie, M.; Crispeels, T. Business model quantification framework for the core participants of the ev charging market. World Electr. Veh. J. 2021, 12, 229. [Google Scholar] [CrossRef]
  7. Goncearuc, A.; Sapountzoglou, N.; De Cauwer, C.; Coosemans, T.; Messagie, M.; Crispeels, T. Profitability Evaluation of Vehicle-to-Grid-Enabled Frequency Containment Reserve Services into the Business Models of the Core Participants of Electric Vehicle Charging Business Ecosystem. World Electr. Veh. J. 2023, 14, 18. [Google Scholar] [CrossRef]
  8. Kempton, W.; Tomic, J.; Letendre, S.; Brooks, A.; Lipman, T. Vehicle-to-Grid Power: Battery, Hybrid, and Fuel Cell Vehicles as Resources for Distributed Electric Power in California; UC Davis: Davis, CA, USA, 2001. [Google Scholar]
  9. Venegas, F.G.; Petit, M.; Perez, Y. Active integration of electric vehicles into distribution grids: Barriers and frameworks for flexibility services. Renew. Sustain. Energy Rev. 2021, 145, 111060. [Google Scholar] [CrossRef]
  10. Ali, H.; Hussain, S.; Khan, H.A.; Arshad, N.; Khan, I.A. Economic and Environmental Impact of Vehicle-to-Grid (V2G) Integration in an Intermittent Utility Grid. In Proceedings of the 2020 2nd International Conference on Smart Power and Internet Energy Systems, SPIES 2020, Bangkok, Thailand, 15–18 September 2020. [Google Scholar] [CrossRef]
  11. Sortomme, E.; El-Sharkawi, M.A. Optimal combined bidding of vehicle-to-grid ancillary services. IEEE Trans. Smart Grid 2012, 3, 70–79. [Google Scholar] [CrossRef]
  12. Steward, D. Critical Elements of Vehicle-to-Grid (V2G) Economics; No. DSEV1030; National Renewable Energy Laboratory, U.S. Department of Energy: Denver, CO, USA, 2017. [Google Scholar]
  13. Cundeva, S.; Dimovski, A. Vehicle-to-grid system used to regulate the frequency of a microgrid. In Proceedings of the 17th IEEE International Conference on Smart Technologies, EUROCON 2017—Conference Proceedings, Ohrid, North Macedonia, 6–8 July 2017. [Google Scholar] [CrossRef]
  14. Knezović, K.; Marinelli, M.; Codani, P.; Perez, Y. Distribution grid services and flexibility provision by electric vehicles: A review of options. In Proceedings of the Universities Power Engineering Conference, Stoke on Trent, UK, 1–4 September 2015. [Google Scholar] [CrossRef]
  15. Madina, C.; Zamora, I.; Zabala, E. Methodology for assessing electric vehicle charging infrastructure business models. Energy Policy 2016, 89, 284–293. [Google Scholar] [CrossRef]
  16. Borne, O. Vehicle-to-Grid and Flexibility for Electricity Systems: From Technical Solutions to Design of Business Models. Available online: https://theses.hal.science/tel-02101210 (accessed on 1 December 2023).
  17. Elia. Keeping the Balance. Available online: https://www.elia.be/en/electricity-market-and-system/system-services/keeping-the-balance (accessed on 11 April 2023).
  18. Elia. Terms and Conditions for Balancing Service Providers for Frequency Containment Reserve (FCR). Available online: https://www.elia.be/-/media/project/elia/elia-site/public-consultations/2020/20200317-tc-bsp-fcrfinal-consulten.pdf (accessed on 15 August 2022).
  19. Elia. Terms and Conditions for Balancing Service Providers for Automatic Frequency Restoration Reserve (aFRR). April 2020. Available online: https://www.elia.be/-/media/project/elia/elia-site/electricity-market-and-system---document-library/balancing---balancing-services-and-bsp/2020/20200303_tc-bsp-afrr_en.pdf (accessed on 11 April 2023).
  20. Elia. Terms and Conditions for Balancing Service Providers for Manual Frequency Restoration Reserve (mFRR). April 2019. Available online: https://www.elia.be/-/media/project/elia/elia-site/public-consultations/20191004_terms_and_conditions_mfrr/tc-bsp-mfrrfeb2020.pdf (accessed on 11 April 2023).
  21. Elia. Using Electric Vehicles to Balance the Network. Available online: https://innovation.eliagroup.eu/projects/v2g/ (accessed on 23 August 2022).
  22. Lauinger, D.; Vuille, F.; Kuhn, D. A review of the state of research on vehicle-to-grid (V2G): Progress and barriers to deployment. In Proceedings of the European Battery, Hybrid and Fuel Cell Electric Vehicle Congress, Geneva, Switzerland, 14–16 March 2017. [Google Scholar]
  23. Elia. Remuneration of mFRR and aFRR Capacity: Pay-as-Bid & Pay-as-Cleared. 2020. Available online: https://www.elia.be/en/public-consultation/20200901_public-consultation-on-the-study-on-pay-as-bid-vs-pay-as-cleared (accessed on 11 April 2023).
  24. Elia. Technical Documentation Concerning the Provision of Ancillary Services. 2021. Available online: https://www.elia.be/-/media/project/elia/elia-site/electricity-market-and-system/system-services/how-to-become-provider-documents-technical/20221109_afrr-ems-requirements.pdf (accessed on 11 April 2023).
  25. Elia. Market Facilitation. Available online: https://innovation.eliagroup.eu/innovation-pillars/market-facilitation/ (accessed on 18 August 2022).
  26. Elia. Individual aFRR Capacity Bids. 2023. Available online: https://opendata.elia.be/explore/dataset/ods125/information/ (accessed on 14 April 2023).
  27. Izvia. Bornes de Recharge V2G Entreprise. Available online: https://www.izivia.com/bornes-electriques-lieu-de-travail/bornes-de-recharge-V2G-entreprise (accessed on 21 August 2022).
  28. Sovacool, B.K.; Kester, J.; Noel, L.; de Rubens, G.Z. Actors, business models, and innovation activity systems for vehicle-to-grid (V2G) technology: A comprehensive review. Renew. Sustain. Energy Rev. 2020, 131, 109963. [Google Scholar] [CrossRef]
  29. Indra. Vehicle-to-Grid (V2G) Chargers. Available online: https://www.indra.co.uk/v2g (accessed on 11 August 2022).
  30. Alfen. EV Charging Stations. Available online: https://alfen.com/en-be/ev-charging-stations (accessed on 23 August 2022).
  31. Elia. Individual Incremental Balancing Energy Bids (Historical Data). 2023. Available online: https://opendata.elia.be/explore/dataset/ods068/information/ (accessed on 14 April 2023).
  32. Elia. Activated Balancing Energy Volumes per Minute (Historical Data). 2023. Available online: https://opendata.elia.be/explore/dataset/ods061/information/ (accessed on 1 December 2023).
  33. Nelder, C.; Rogers, E. Reducing EV Charging Infrastructure Costs. 2020. Available online: https://www.researchgate.net/profile/Chris-Nelder/publication/338660434_Reducing_EV_Charging_Infrastructure_Costs/links/5e2237d6299bf1e1fab9ed9c/Reducing-EV-Charging-Infrastructure-Costs.pdf (accessed on 23 August 2022).
  34. Elia. General Technical Requirements for Private Measurement. 2021. Available online: https://www.elia.be/-/media/project/elia/elia-site/electricity-market-and-system/system-services/how-to-become-provider-documents-technical/technical-requirements-for-private-measurement-devices-final-v3_28102021.pdf (accessed on 1 December 2023).
Figure 1. Example of the V2G-enabled aFRR+ provision process.
Wevj 14 00339 g001
Figure 2. Plug-in probabilities of EVSE network during the working day.
Wevj 14 00339 g002
Figure 3. V2G-enabled aFRR incremental profit in the function of EVSE network % engaged in the provision of the service.
Wevj 14 00339 g003
Table 1. Values of the model parameters.
ParameterSymbolValueUnits
External data sourceEVSE type yDC V2G/
EVSE power level [27]Ky0.01MW
Difference between uni- and bidirectional EVSE price [27,28,29,30]Py3000
aFRR capacity bid [26]aFRRCapacity Bid65.07€/MW/h
aFRR energy bid [31]aFRREnergy Bid282.60€/MWh
CCTU time [19]Treserved4H
Average activation time per CCTU [32]Tactivated103minutes
EVSE useful lifetime [15,33]Ly10Years
Metering equipment cost [34]Pm2000
Metering equipment useful lifetime [34]Lm10Years
Failure factor [19]Ffailure1.3/
EV charging dataPlug-in probability during CCTUPplug-in[0.136; 0.99]/
Probability of failurePfailure[0.009; 0.32]/
Probability of TOPTO[0.01; 0.864]/
AssumptionsCost of TOCTO1.2×Capacity remuneration
EVSE network sizeNy250Units
Disclaimer/Publisher’s Note: The statements, opinions and data contained in all publications are solely those of the individual author(s) and contributor(s) and not of MDPI and/or the editor(s). MDPI and/or the editor(s) disclaim responsibility for any injury to people or property resulting from any ideas, methods, instructions or products referred to in the content.

