Article

Translation of Monoclonal Antibodies Pharmacokinetics from Animal to Human Using Physiologically Based Modeling in Open Systems Pharmacology (OSP) Suite: A Retrospective Analysis of Bevacizumab

1
Inserm UMR-S1144, Faculty of Pharmacy, Université Paris Cité, 75006 Paris, France
2
PhinC Development, 91300 Massy, France
3
Faculty of Medicine, Université de Tours, EA 4245 T2I, 37032 Tours, France
4
Service de Pharmacologie Médicale, CHRU de Tours, 37000 Tours, France
5
Biologie du Médicament—Toxicologie, Hôpital Cochin, Assistance Publique Hôpitaux de Paris, 75014 Paris, France
*
Author to whom correspondence should be addressed.
Pharmaceutics 2023, 15(8), 2129; https://doi.org/10.3390/pharmaceutics15082129
Submission received: 3 July 2023 / Revised: 3 August 2023 / Accepted: 8 August 2023 / Published: 14 August 2023

Abstract

:
Interspecies translation of monoclonal antibodies (mAbs) pharmacokinetics (PK) in presence of target-mediated drug disposition (TMDD) is particularly challenging. Incorporation of TMDD in physiologically based PK (PBPK) modeling is recent and needs to be consolidated and generalized to provide better prediction of TMDD regarding inter-species translation during preclinical and clinical development steps of mAbs. The objective of this study was to develop a generic PBPK translational approach for mAbs using the open-source software (PK-Sim® and Mobi®). The translation of bevacizumab based on data in non-human primates (NHP), healthy volunteers (HV), and cancer patients was used as a case example for model demonstration purpose. A PBPK model for bevacizumab concentration-time data was developed using data from literature and the Open Systems Pharmacology (OSP) Suite version 10. PK-sim® was used to build the linear part of bevacizumab PK (mainly FcRn-mediated), whereas MoBi® was used to develop the target-mediated part. The model was first developed for NHP and used for a priori PK prediction in HV. Then, the refined model obtained in HV was used for a priori prediction in cancer patients. A priori predictions were within 2-fold prediction error (predicted/observed) for both area under the concentration-time curve (AUC) and maximum concentration (Cmax) and all the predicted concentrations were within 2-fold average fold error (AFE) and average absolute fold error (AAFE). Sensitivity analysis showed that FcRn-mediated distribution and elimination processes must be accounted for at all mAb concentration levels, whereas the lower the mAb concentration, the more significant the target-mediated elimination. This project is the first step to generalize the full PBPK translational approach in Model-Informed Drug Development (MIDD) of mAbs using OSP Suite.

1. Introduction

The use of pharmacokinetic (PK) modelling during drug development has markedly increased, especially to predict the dose-concentration-response relationship in human models based on animal studies and to anticipate doses that should be investigated in upcoming clinical phases. Modelling methods and softwares were especially designed for small molecules, with the implementation of mechanistic data regarding drug transporters and metabolizing enzymes. However, many limitations remain in translational modelling of therapeutic proteins such as monoclonal antibodies (mAbs). Due to their large molecular weight, the mAbs volume of distribution is limited to a few liters represented by the vascular and interstitial spaces of highly perfused and leaky tissues, as antibody diffusion in tissues is allowed by the convective transport through paracellular pores in vascular endothelial cell membranes [1,2]. The non-specific elimination of mAbs consists in proteolysis in lysosomes after either target-independent fluid-phase or receptor-mediated endocytosis. The affinity of mAbs belonging to G-isotype immunoglobulins (IgG) to neonatal Fc receptor (FcRn) is the main receptor-mediated endocytosis mechanism that protects them from lysosomal degradation and explains their long elimination half-life in humans (11–30 days) while FcRn-mediated transcytosis is also involved in mAbs tissue distribution. mAb PK also depend on their interaction with target antigens (soluble and/or expressed on cell membranes). This phenomenon refers to target-mediated drug disposition (TMDD) and is responsible for non-linear PK profiles observed at lower concentrations when the target antigen is not saturated. TMDD depends on several factors such as the binding affinity, antigen turnover, elimination rate of the mAb-antigen complex, and finally on the mAb concentration. In case of drug development, inclusion of TMDD processes in the model could help in studying the PK/PD relationship that depends on antigen concentration in target tissues and provides a better evaluation of doses for further preclinical and clinical trials. However, the expression of target antigen is more complex than a simple one-compartment turnover that is assumed in TMDD modeling [3]. PBPK has the advantage to provide a more in-depth description of mAb biodistribution and may therefore account for mAb-target interaction not only in blood, but also in tissues and organs [4]. In addition, PBPK models consider the expression of FcRn in different tissues and mAb-FcRn binding affinity [5].
Although several PBPK models for mAbs disposition in humans [6,7] or in animals [5,8] have been reported in the literature, the methodology regarding the PK translation from animal to human including TMDD using full PBPK modeling remains limited. Glassman and Balthasar previously proposed a translational PBPK model including TMDD for mAbs scaled up from non-human primate (NHP) to human in the ADAPT software [9]. Their model was developed for mAbs exhibiting TMDD both in animals and humans. Nevertheless, not all mAbs show target-mediated profiles in animals and in such cases, prediction of PK in humans is more challenging. In addition, first-in-human (FIH) studies of mAbs can be also performed in healthy volunteers. Therefore, in the drug development process, the PK of mAbs should be first scaled up from preclinical species to healthy volunteers and then to patients. It could help to define the parameters related to TMDD in human and better predict the PK/PD relationship to avoid administering subtherapeutic doses in patients. In light of the above considerations, the objective of this study was to develop a full translational PBPK modelling approach including a TMDD mechanism for mAbs using the Open Systems Pharmacology (OSP) Suite. This modeling approach demonstration was based on a bevacizumab case example, using data from the literature. The model was used for a priori predictions of PK in human (healthy volunteers then patients) using monkey data during a theoretical drug development process.

2. Material and Methods

2.1. PK Data

Bevacizumab was selected for this retrospective analysis as it shows non-linear PK at very low doses due to TMDD and numerous PK studies in NHP, healthy volunteers (HV), and adult cancer patients after intravenous doses are available in the literature. Bevacizumab is a humanized monoclonal IgG1 antibody targeting vascular endothelial growth factor (VEGF) which results in blocking the angiogenesis and is approved for the treatment of several solid tumors [10]. Only complete PK profiles after intravenous doses were selected for this study to exclude potential sources of variability in subcutaneous absorption and to focus on drug distribution and elimination phases. Ten publications were selected, and data are summarized in Table 1. The majority of the data consisted of mean PK profiles (with or without standard deviation) although some individual profiles were also included. Data at 0.1 mg/kg dose from Gordon et al. [11] were excluded from this retrospective analysis due to large variability in the individual PK parameters reported in five patients (8- and 7-fold variation in clearance [CL] and area-under-the-concentration-time curve [AUC], respectively) and absence of individual PK profiles. The majority of the data were obtained in Caucasian populations, except for the study described by Li et al. in a Chinese population [12]. PK data were digitalized using the WebPlotDigitizer tool (https://apps.automeris.io/wpd/, accessed on 1 April 2022).

2.2. Software

PBPK modeling was performed using Open Systems Pharmacology (OSP) Suite version 10 (http://www.opensystemspharmacology.org, accessed on 1 April 2022) including the PBPK software PK-sim®. MoBi® was used to extend the PBPK model with the specific TMDD process. Data processing and graph plotting were performed in R version 4.0.5 coupled with RStudio version 1.4.1.

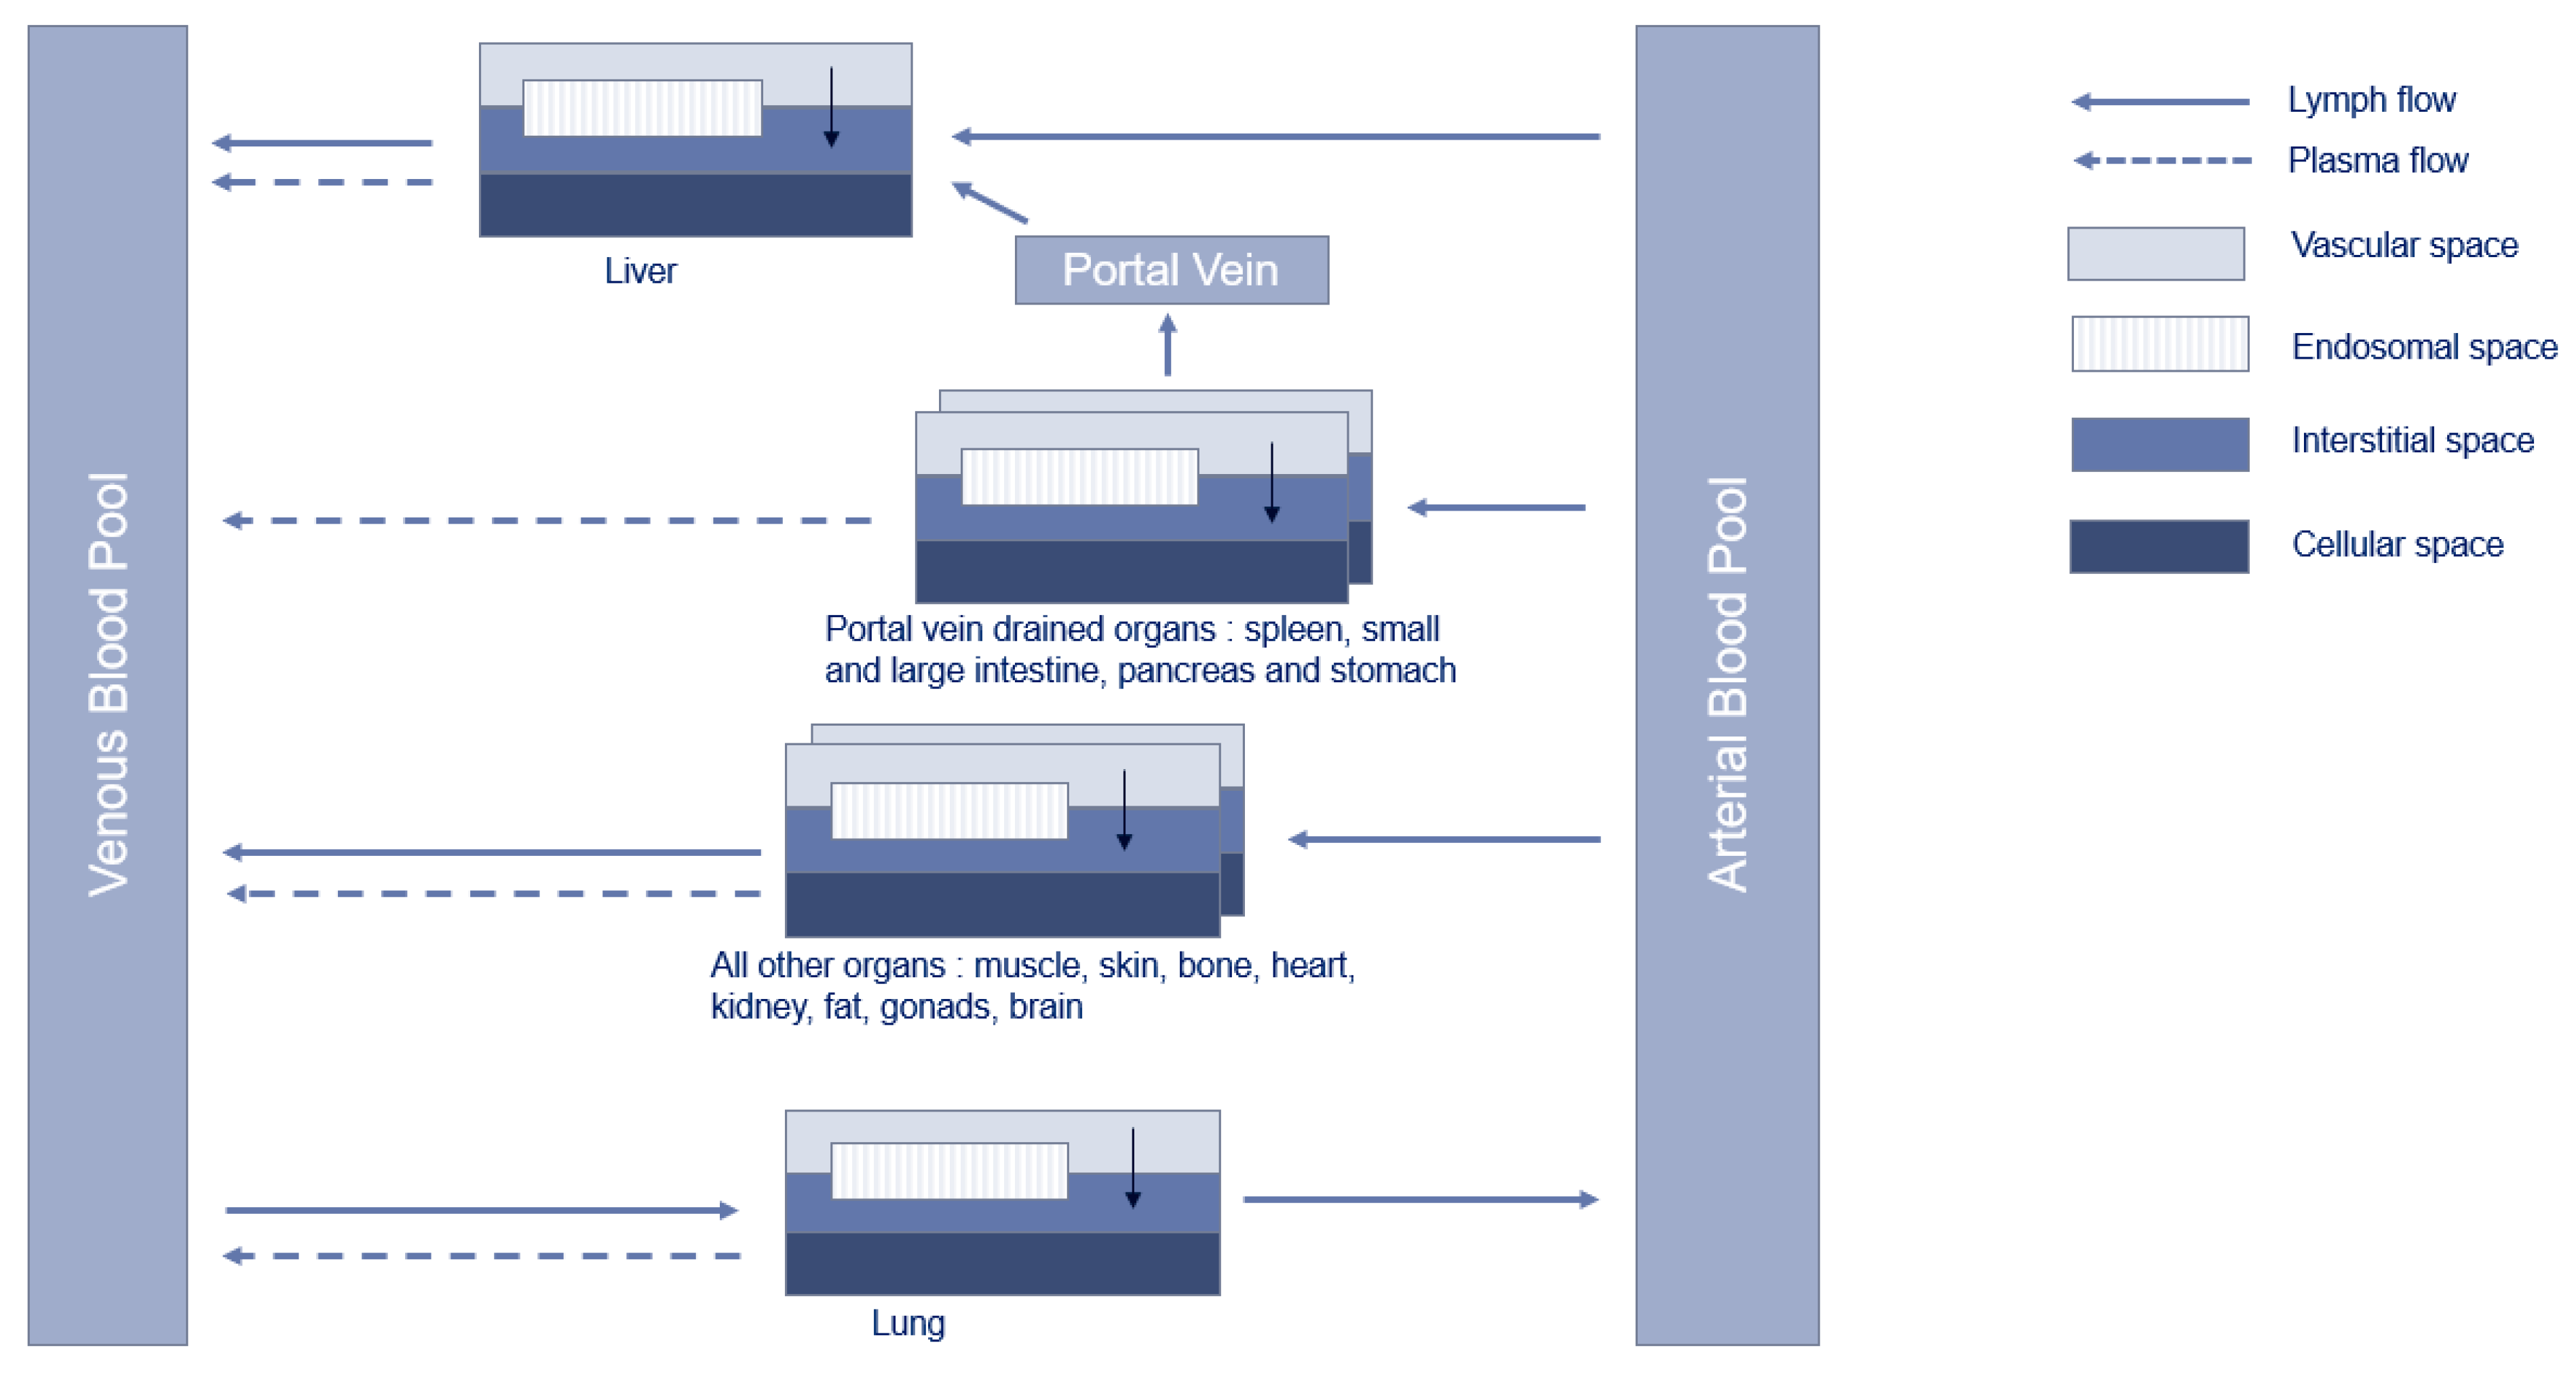
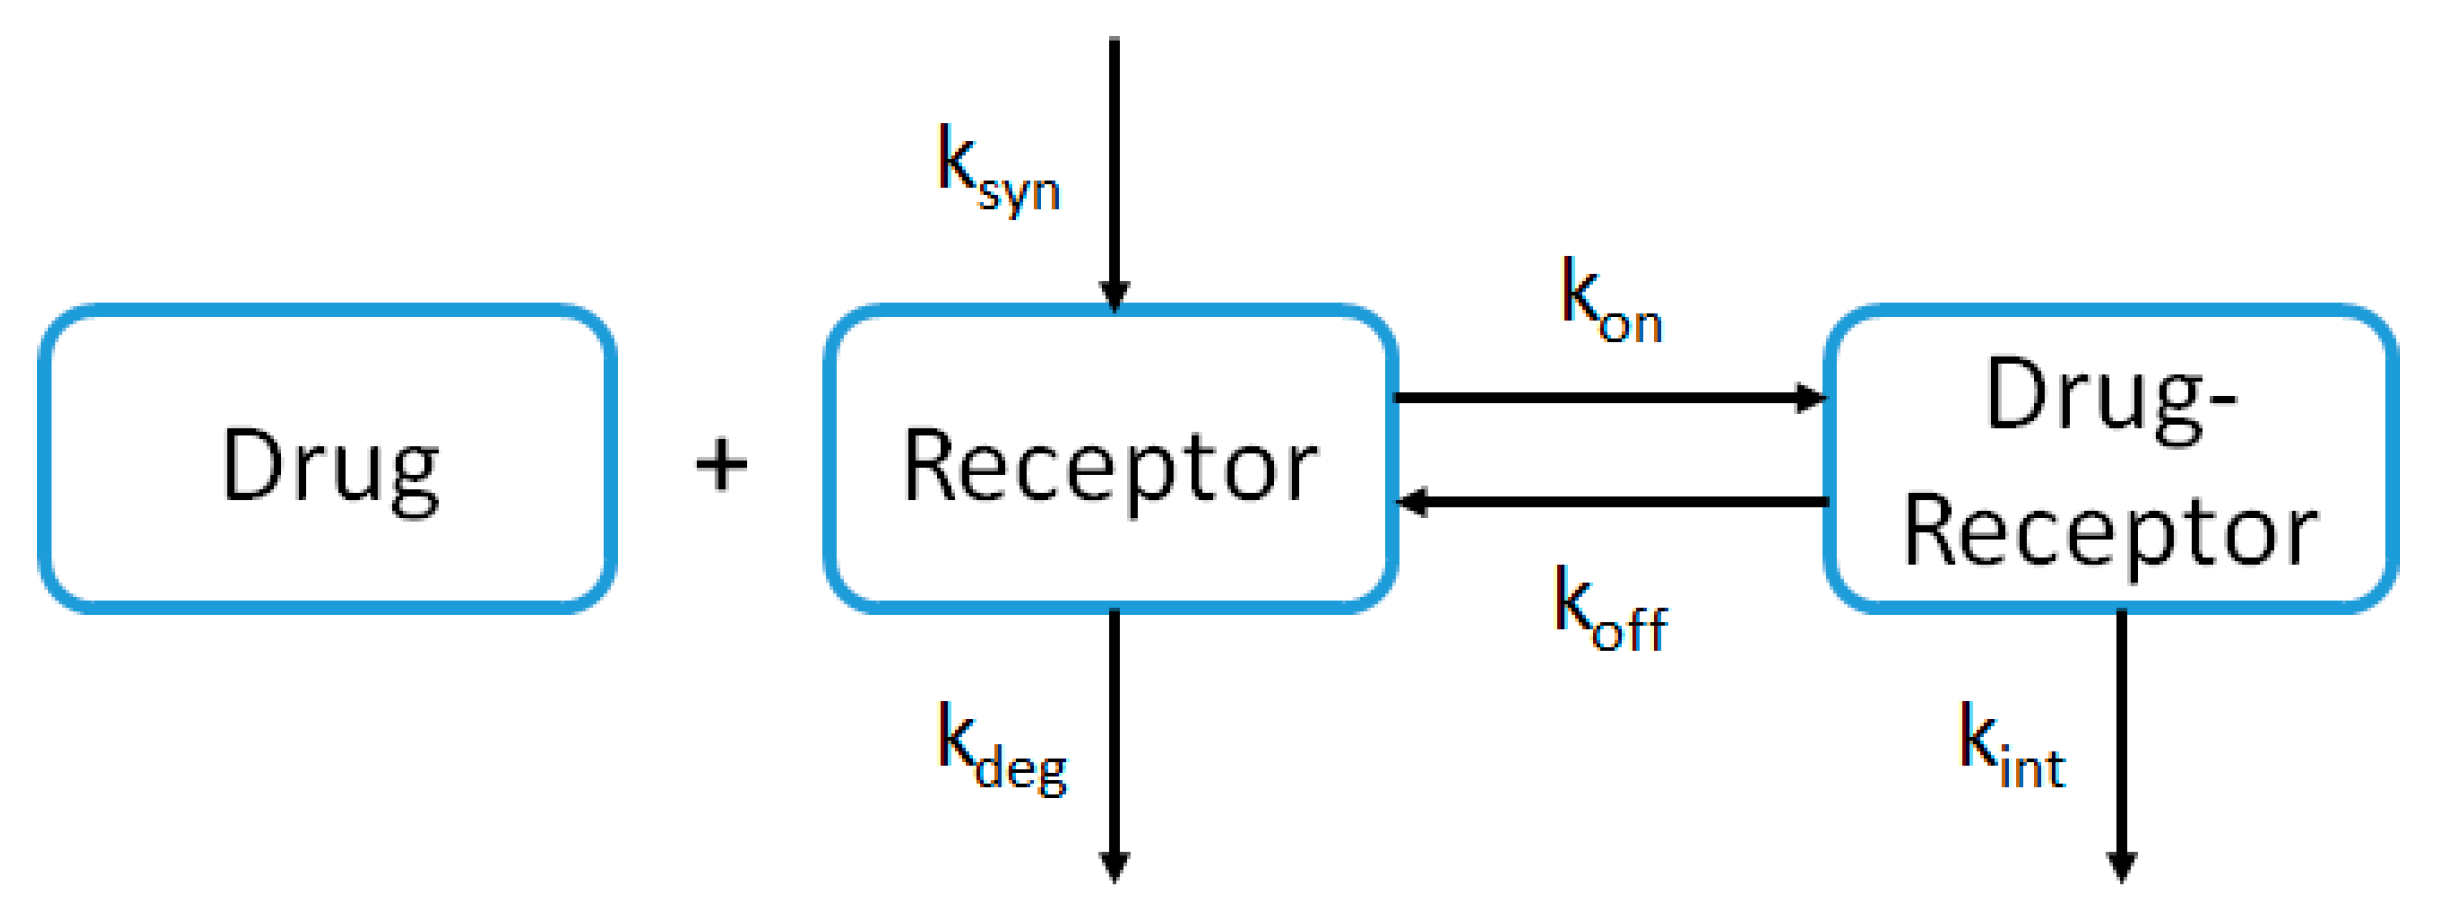
2.3. PBPK Model Structure

The PBPK model for mAbs in PK-sim® was proposed by Niederalt et al. [21]. In this analysis, the generic model was used without further modifications with physiological values for NHP and humans implemented in the software [22,23,24]. The structure of the model consists of 15 compartments representing organs or tissues connected by blood and lymph flows. Each compartment was further divided into vascular (plasma and blood cells), endosomal, interstitial, and cellular spaces [21]. An additional compartment was added to represent endosomes and lysosomes within vascular endothelial cells [21] to account for the catabolism of the drug in the endosomal space and its binding to FcRn [7]. Schematic representation of the model is presented in Figure 1. The transcapillary exchange of the drug between plasma and interstitial space by convection or diffusion in each organ was described using a two-pores formalism [21]. The return of the drug from the interstitial space to the blood compartment was described by organ-specific lymph flow.
Since the PBPK model for proteins in PK-sim® does not describe parameters related to the TMDD, the model was extended in Mobi® software. TMDD describes the reversible binding of the drug with its receptor leading to internalization of the complex and its elimination (Figure 2). In the modeling analysis, TMDD was described as follows:
d R d t = k s y n k d e g × R k o n × D × R + k o f f × D R
d D d t = k o n × D × R + k o f f × D R
d D R d t = k o n × D × R k o f f × D R k i n t × D R
With   k s y n = k d e g × R 0
k o n = k o f f K D , t a r g e t
where R is the receptor concentration, R0 is the receptor concentration at steady-state, D is the drug concentration, DR is the drug-receptor complex concentration, ksyn is the zero-order synthesis rate constant of the receptor, kdeg is the first-order elimination rate constant of the receptor, kon is the first-order binding rate constant, koff is the first-order dissociation rate constant, kint is the first-order internalization rate constant (elimination of the drug-receptor complex), and KD,target is the equilibrium constant dissociation of DR. The TMDD mechanism was described in presence of the target in the extracellular space (plasma and interstitial fluid).

2.4. PBPK Modeling Approach

This retrospective PK analysis was performed using bevacizumab PK data from the literature to represent different steps of a theoretical development of a therapeutic protein. To evaluate the interest of this type of Model-Informed Drug Development (MIDD), the approach was divided in several sequential steps. The PBPK model for bevacizumab was first built for NHP, then refined based on observed PK data in NHP. The next step consisted in a priori prediction of PK profiles in HV with the NHP model and then the model was refined based on the observed data. Finally, the PBPK model in HV was used for a priori prediction of PK profiles in cancer patients. At each step, the model predictive performance was evaluated by comparing observed versus a priori predicted (obtained with the model without refined parameters) AUC from the first until the last observed or predicted concentration, and the maximal concentration (Cmax).
The values for each specific parameter used in the bevacizumab PBPK model in each population are summarized in Table 2. They include equilibrium dissociation constant with FcRn (KD-FcRn), KD,target (equilibrium constant dissociation of bevacizumab with VEGF-A), VEGF-A concentration in each population, and parameters related to TMDD (kdeg, kint, koff) in human.

2.4.1. Non-Human Primate

The PBPK model was first developed in NHP in order to characterize the linear part of bevacizumab PK in a relevant species. The starting point of the model was to describe the physiology of the cynomolgus monkey with parameters referenced in the software and the physicochemical characteristics of bevacizumab (MW: 150 kDa and hydrodynamic radius: 5.34 nm). At this step, the key parameter to optimize was the dissociation constant of the IgG Fc portion with FcRn (KD-FcRn). This parameter was fitted in the model based on the observed data in NHP. To verify if KD-FcRn value used in the model was consistent and to confirm the PK prediction in NHP, the model was applied to PK data of xtend-bevacizumab. Xtend-bevacizumab is a lead Fc variant (M428L/N434S) of bevacizumab with greater affinity to human FcRn [13]. Values of KD-FcRn measured by Biacore in that study were 2460 and 218 nmol/L for bevacizumab and xtend-bevacizumab, respectively, which translates into an 11-fold higher affinity of xtend-bevacizumab to FcRn compared to bevacizumab [13]. The parameters related to bevacizumab binding to NHP VEGF-A were added in the model in order to consider the possible impact on its tissue distribution. KD,target and koff values for NHP (0.032 nmol/L and 3.5 day−1, respectively) were obtained from Ren et al. based on in vitro assays using a surface plasma resonance (SPR) Biacore system with NHP VEGF-A [25]. Since no data about VEGF-A concentration in NHP are available in the literature, it was assumed to be equivalent to that in human.

2.4.2. Healthy Volunteers

First, the model tested in NHP was used to predict PK profile in HV, considering that bevacizumab PK in HV is linear and that no TMDD occurs at physiological values of VEGF-A. Physiological characteristics were adapted to human using PK-Sim® references. KD-FcRn was considered 2-fold higher in humans than in NHP as described in the literature for IgG1 [27]. The KD,target and koff values for human (0.058 nmol/L and 2.7 day−1, respectively) were obtained from Papadopoulos et al. by in vitro assays using the SPR Biacore system with human VEGF-A [26]. Different values of VEGF-A plasma concentration in humans were reported in the literature (range: 0–3 nmol/L [28,29,30,31,32]). To account for this uncertainty in the model, different values ranging from 0 to 3 nmol/L were tested and evaluated in terms of best data fit. Large-scale gene expression data from publicly available sources are implemented in the OSP suite to be used directly in PBPK model building [33]. Expressed sequence tags (EST) is a gene expression database for many antigens and proteins extracted from relevant files in the human section of UniGene (National Center for Biotechnology Information) [34,35]. This EST gene database was used for VEGF-A relative expression across different organs and tissues in the model.
Second, the observed PK data collected in HV were used to refine the model. In order to characterize the non-linear profile observed in HV at very low doses (0.5 and 1 mg/kg), a TMDD mechanism was implemented in the model as described in Figure 2 and in the PBPK Model Structure Section. This mechanism was implemented in tissues and organs where VEGF-A is expressed according to EST gene database (Figure S1 in Supplementary Material). koff was fixed to an in vitro value (2.7 day−1 [26]), whereas kdeg and kint were fitted based on observed data at 0.5 and 1 mg/kg doses, respectively.
Finally, the model was validated using data in HV (single administration of a 3 mg/kg IV dose of bevacizumab) from the study by Liu et al. [36]. Observed data were compared to simulated data and AAFE and AFE were calculated.

2.4.3. Adult Cancer Patients

The PBPK refined model in HV was used to predict PK profiles in adult cancer patients. According to the literature, VEGF-A concentration in cancer patients is 2- to 10-fold higher than in HV in several solid tumor patients including breast, prostate, and colorectal cancer patients [29,30,31]. In the model for cancer patients, VEGF-A concentration was multiplied by these factors (2- and 10-fold increase in VEGF-A concentration was tested) in each tissue and organ where VEGF-A is expressed according to EST gene database (Figure S1 in Supplementary Material). Other parameters were considered equivalent to those in HV. PK data observed in adult cancer patients were used to refine the model. Estimated parameters relative to the TMDD mechanism (kdeg, kint and VEGF-A concentrations) were adjusted to obtain the final model.

2.5. Model Evaluation

At each step, PK prediction obtained with the a priori model (i.e., PK prediction in HV obtained with NHP model, PK prediction in cancer patients obtained with HV model) was compared with the observed data. This allows to evaluate the predictive performance of this approach in case of a prospective drug development when PK data in a specie/population to which the PK was scaled is not yet available. The model evaluation was performed by comparing graphically observed and predicted AUC from the time of the first to the last observed or predicted concentration and the maximal plasma concentration (Cmax).
The overall predictability of the a priori model was also evaluated in terms of precision using AAFE (average absolute fold error) and AFE (average fold error) according to the following equations [37,38]:
A A F E = 10   1 N   | log C P r e d i c t e d C O b s e r v e d |
A F E = 10   1 N   log C P r e d i c t e d C O b s e r v e d
The model validation and verification criteria were based on the guidelines intended for regulatory submissions (EMA and FDA) reported by Abduljalil et al. and Shebley et al. [39,40]. Predictions were considered as very accurate if they fell within the 0.80–1.25 error range, acceptable if within 0.50/0.80–1.25/2.00, and inaccurate if outside the two-fold error range (0.50–2.00).

2.6. Sensitivity Analysis

Sensitivity analysis was performed on parameters of interest (KD-FcRn, KD,target, VEGF-A concentration, kdeg, kint, koff) using the PK-Sim® or Mobi® tool. Parameter sensitivity was analyzed for AUC over the dosing interval at steady-state (AUCtau,ss) and Cmax at steady-state (Cmax,ss). The sensitivity of the PK parameters (S) is calculated as the ratio of the relative change of the PK parameter and the relative variation of the model parameter (fixed at 10%) as follows:
S = Δ P o   Δ p i   × p i   P o  
where Δ P o   P o   is the relative change of the PK parameter (AUCtau,ss or Cmax,ss) and Δ P i   p i   is the relative variation of the model parameter.

3. Results

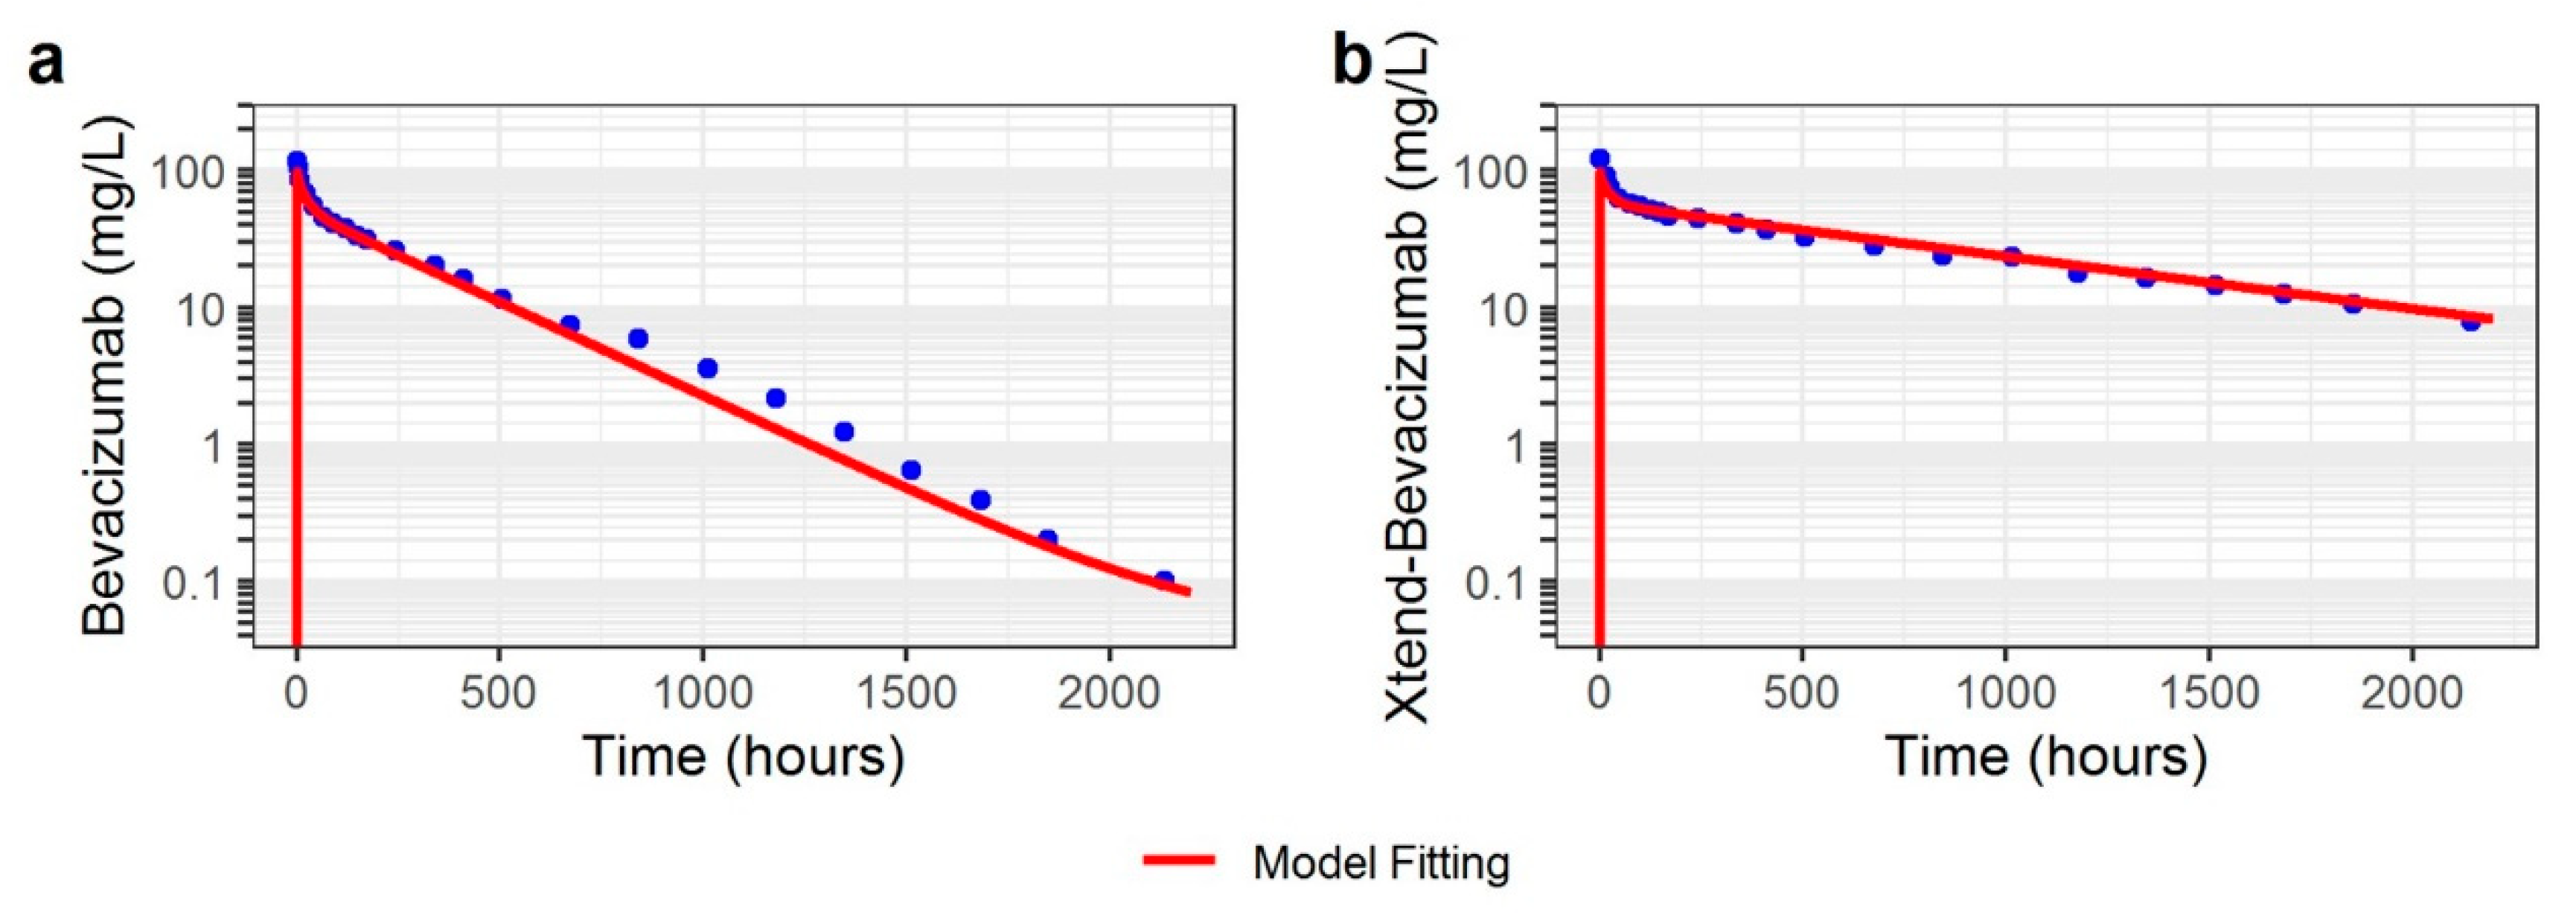
3.1. Non-Human Primate

Since no TMDD mechanism was necessary in the NHP model to fit the observed PK data, the key parameter in the model was KD-FcRn describing the affinity of bevacizumab to cynomolgus FcRn. This parameter was fitted to the observed data and the best fit was obtained with KD-FcRn of 450 nmol/L. This value was coherent with values found in the literature for IgG1 and bevacizumab in cynomolgus monkey [7,27]. Other parameters (such as concentration of VEGF-A, KD,target and koff) were fixed to physiological or experimental values (Table 2). Concentration-time data were satisfactorily described by the model (Figure 3).
Then, the model was used to describe xtend-bevacizumab data. For that, the value of KD-FcRn was divided by 11 in the model for xtend-bevacizumab in comparison to bevacizumab (41 nmol/L, Table 2). The model adequately described xtend-bevacizumab data as shown in Figure 3. The details of the model development steps in PK-Sim® are presented in Supplementary Material S2.

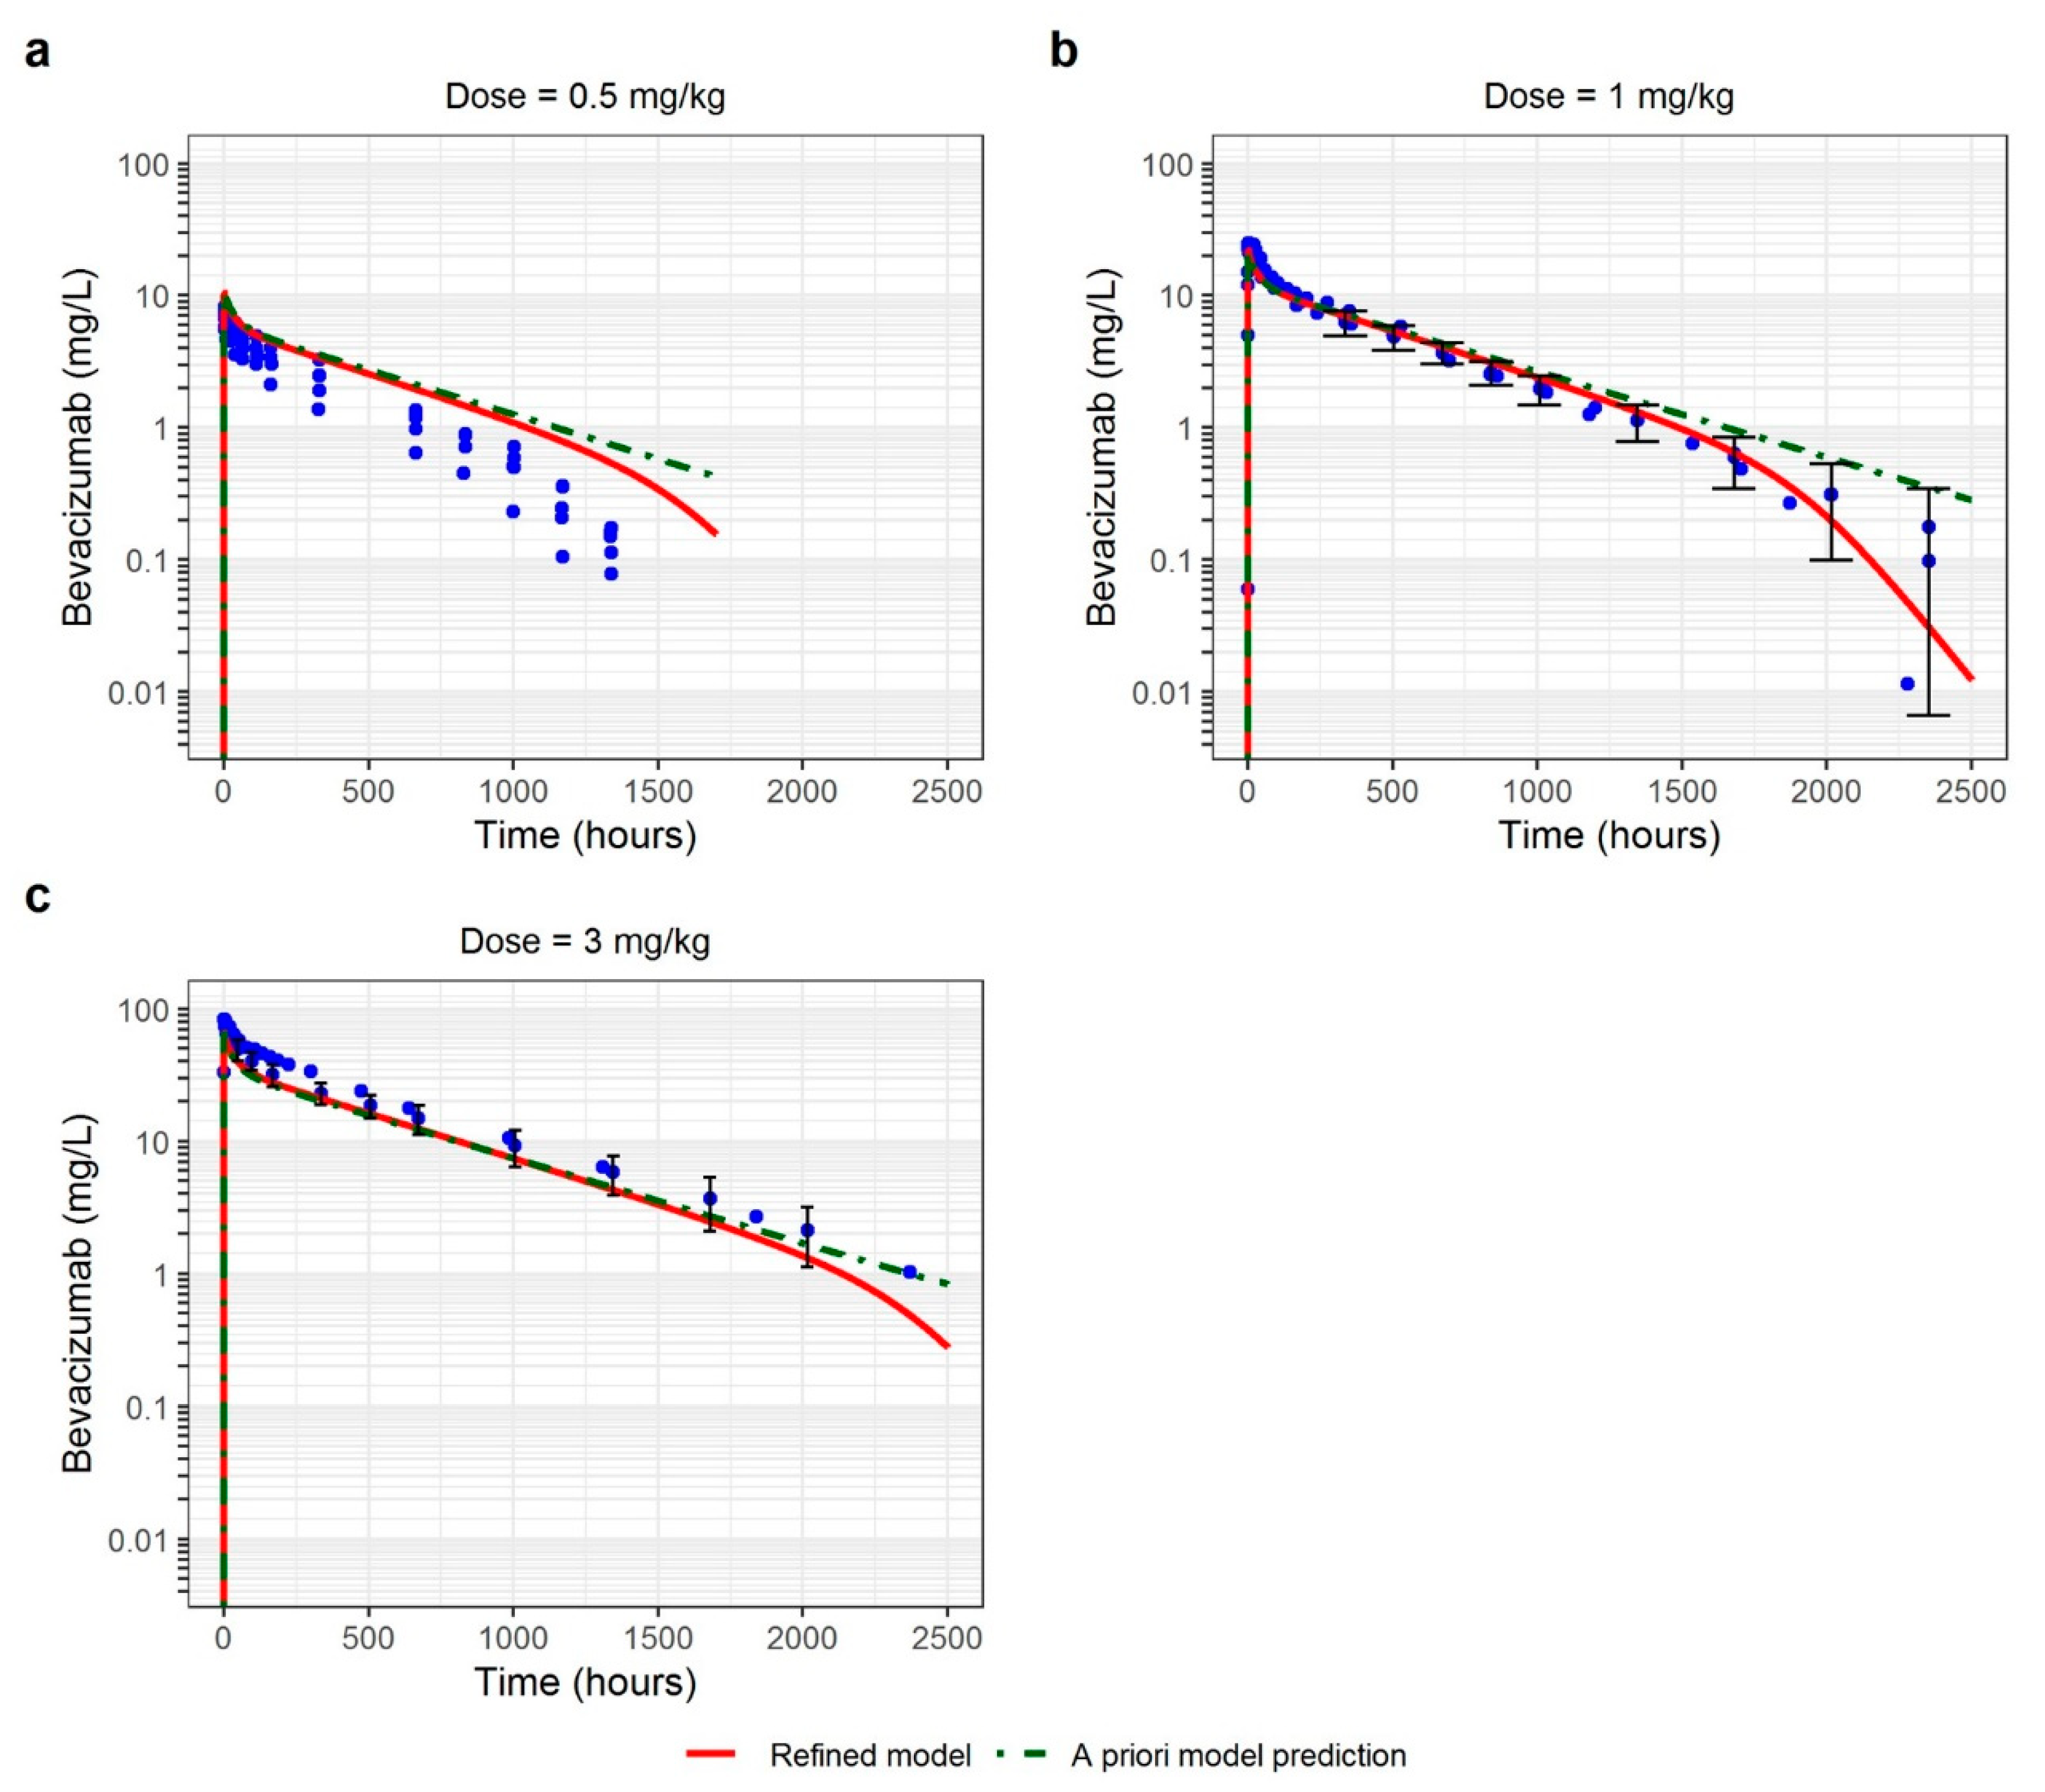
3.2. Healthy Volunteers

The PBPK model developed in NHP was used to predict PK in HV. A 2-fold higher KD-FcRn value than that in NHP (i.e., 900 nmol/L) was used in the model which allowed for adequate prediction of the observed data (Figure 4) [27]. The KD,target was fixed to an in vitro value (0.058 nmol/L) [26]. The variation in VEGF-A concentration between 0 and 3 nmol/L had no impact on the predictions and was therefore fixed to a mid-range value (1.5 nmol/L). The model showed good prediction of the linear part of the PK, that is, at higher plasma concentrations (visible at 3 mg/kg and at the beginning of the curve at 1 mg/kg, Figure 4). However, a slight overprediction of the terminal slope at 1 mg/kg and of the entire PK profile at 0.5 mg/kg dose was observed. This overprediction was due to TMDD which was not integrated in the model at this step. However, this a priori PK prediction was quite good, with Cmax and AUC within the 2-fold error threshold (except for one individual profile at 0.5 mg/kg dose in the Chinese population, Figure 5). For all the evaluated doses, AAFE and AFE ranged from 1.30 to 1.94 and from 0.72 to 1.94, respectively (Table 3). These PK profiles were in the acceptable range of prediction, with a slight overprediction trend for the 0.5 mg/kg dose. Parameter values are reported in Table 2. The details of the model development steps in PK-Sim® are presented in Supplementary Material S3.
In the next step, the model was refined to improve the fitting of observed HV PK profiles. The KD-FcRn was adjusted from 900 to 940 nmol/L (Table 2). Then, the TMDD mechanism was implemented in the model. kint and kdeg were fitted to the data at 0.043 day−1 and 0.18 day−1, respectively. The reference concentration of VEGF-A was adjusted to 0.3 nmol/L which allowed the description of TMDD Figure 4 (red profile). A slight overprediction of the entire PK profile was observed at 0.5 mg/kg dose. Nevertheless, the TMDD part of the model allowed a satisfactory description of these data.
The refined model was validated using data in HV (single administration of a 3 mg/kg IV dose of bevacizumab) from the study of Liu et al. [36]. Observed data were well predicted (Figure S2 in Supplementary Material) with AAFE and AFE of 1.24 and 1.23, respectively.

3.3. Adult Cancer Patients

The PBPK model refined using HV data was used to predict PK profiles in adult cancer patients. The TMDD parameters kdeg, kint, and koff were assumed to be the same as in HV but it was considered that cancer patients have 2- to 10-fold higher concentrations of VEGF-A as described in the literature [29,30,31]. Therefore, different concentrations of VEGF-A were tested in the model (values ranging from 0.6 to 3 nmol/L corresponding to 2- to 10-fold variation compared to HV value). Increasing VEGF-A concentration resulted in higher bevacizumab CL and lower plasma concentrations. However, the impact of VEGF-A concentration on PK profiles was only visible for low doses (0.3 and 1 mg/kg), that is, in the presence of TMDD (Figure 6). The model showed good a priori predictive performance when compared to the observed data both in the linear and non-linear (TMDD) range of concentrations (especially when VEGF-A concentration was fixed to 3 nmol/L). Comparison of a priori PK predictions with the observed data is presented in Figure 5 and shows that the majority of the a priori predictions were within the 1.25-fold error threshold range and all the predictions were within the 2-fold error threshold range. AAFE and AFE ranged from 1.17 to 1.39 and from 0.75 to 1.04, respectively, for all the doses (Table 3). These PK profiles were mainly in the very accurate range of prediction, and in the acceptable range for 3 mg/kg Cmax. No trend of over- or underprediction could be observed.
Then, the observed data in adult cancer patients were used to fit TMDD model parameters to better describe the lowest observed concentrations which were overpredicted using the a priori model. The only fitted parameter was VEGF-A concentration (3.86 nmol/L). It allowed a better description of PK profiles regarding 1 and 3 mg/kg doses (Figure 6). This value is 12-fold higher than that in HV which is consistent with higher VEGF-A concentrations observed in cancer patients than in HV due to tumor burden and remains close to the value described in the literature [29,30,31]. The final parameter values are reported in Table 2.

3.4. Sensitivity Analysis

Sensitivity analysis was performed for each fitted model and for each dose and the results are presented in Figure 7. KD-FcRn is the most important parameter to fit the linear part of the PK. Taking as an example the model in cancer patients and a 10 mg/kg dose, a 10% increase in KD-FcRn resulted in a decrease of 8% and 4.5% in AUCtau,ss and Cmax,ss, respectively. Although the results show that KD-FcRn have an impact on PK profiles at each dose, parameters relative to the TMDD mechanism became more significant at lower doses. For a dose of 0.3 mg/kg in cancer patients, kdeg was the parameter with the highest impact on AUCtau,ss and Cmax,ss, followed by KD-FcRn and VEGF-A concentration. At this dose, an increase of 10% in kdeg induced a 16% decrease in AUCtau,ss, whereas a 10% increase in VEGF-A concentration or KD-FcRn induced a decrease of 10% and 13% of AUCtau,ss, respectively. For HV models in single dose, only KD-FcRn impacted AUCtau,ss with a similar effect at each dose. An increase of 10% in KD-FcRn induced an 8% decrease of AUCtau,ss.

4. Discussion

Translational PK of therapeutic proteins is usually performed using population approach when the drug shows only linear PK both in animal and in human [2]. However, this translation becomes more complex in case of non-linearity in PK regardless of its origin (e.g., TMDD, anti-drug antibodies [ADA], disease state). In such cases, more mechanistic translational models are needed, such as full PBPK or quantitative system pharmacology (QSP) models. Since this kind of translational tool is still little described in the literature, the interest of this work was to develop a full translational PBPK modeling approach in an open-source software (OSP Suite) based on literature data for bevacizumab.
The developed PBPK translational model showed good predictive performance at all steps of a theoretical drug development process. Interestingly, TMDD was observable in HV, especially at low doses. Since VEGF-A concentration is significantly lower in HV than in patients, this TMDD mechanism was not necessarily expected. According to the manufacturer label, bevacizumab PK is linear in HV for doses ranging from 1 to 10 mg/kg [10], although a slightly non-linear profile was visible at 1 mg/kg in several studies [14,15,16,17]. In addition, Li et al. used a mixed zero- and first-order model to describe elimination of bevacizumab at 0.5 mg/kg in HV as it provided better description of the data than a linear PK model [12]. In this study, the use of HV data allowed to better anticipate PK in cancer patients, mostly due to the description of TMDD processes. Although during this theoretical MIDD, PK in patients could have been anticipated directly from NHP data, no indication on kdeg and kint parameters would have been available which could have limited model predictions. Therefore, this work supports the relevance of PK studies in HV during mAbs development. Phase 1 trials in patients are still a standard approach in the oncology field. However, as mAbs have a safer toxicity profile compared to conventional anticancer chemotherapy, it is more and more discussed to perform FIH studies in HV in the oncology field as well, which would help to avoid subtherapeutic doses in patients as discussed by Tranter et al. [41].
Previously, Baxter et al. [42] and Davda et al. [43] described the scaling up of linear mAbs PK using PBPK modeling. A platform PBPK model was also developed to describe the PK of mAbs including target-mediated elimination across several species by Shah and Betts [44], but no simulations were performed to analyze the ability of the model to predict PK in human. More recently, a catenary PBPK model developed by Chen and Balthasar [45] was scaled up to monkey [46] then to cancer patients [9]. That model showed good prediction of PK of four mAbs (cetuximab, dalotuzumab, figitumumab, and trastuzumab) but did not account for data in HV. Since FIH studies of mAbs are usually performed in HV, especially outside oncologic indications, the PK of mAbs in that case should be first scaled up from preclinical species to HV and then to patients. It could help to define the parameters related to TMDD in human and better predict the PK/PD relationship, especially at lower doses.
Parameter values obtained in cancer patients in the refitted model are consistent with those reported in the literature for bevacizumab using PBPK and population PK approaches [7,47,48]. However, the VEGF-A elimination half-life (i.e., 3.95 days, calculated as ln2/kdeg) was higher than the value previously described in the literature based on in vitro assays (between 30 min and several hours [49,50,51]). Nevertheless, Papachristos et al. and Panoilia et al. reported similar values of VEGF-A elimination half-life estimated using a population approach in metastatic cancer patients (5.97 and 1.73 days, respectively) [47,48]. It could be explained by the fact that VEGF-A is largely bound to its receptor in the membrane which could slow down its elimination [49].
In our model, endosomal kinetics of mAb–FcRn complex was described with non-equilibrium differential equations as previously developed by Niederalt et al. [21] (details on model equations are presented in Supplementary Material S1). This non-equilibrium mAb-FcRn binding was already used in the catenary model by Chen and Balthasar [45]. Non-equilibrium mAb-FcRn binding predicts more modest changes in antibody elimination half-life due to modifications of the affinity to FcRn (KD-FcRn) than the equilibrium model [4,45], for example, a <2.5-fold change in half-life for a 10-fold increase in binding affinity [45]. We observed similar findings with our model, since the 11-fold increase in FcRn binding affinity of xtend-bevacizumab compared to bevacizumab led to a 3-fold decrease in elimination half-life, which is coherent with the observed data. Chen and Balthasar speculated that non-equilibrium binding could explain the lack of a clear relationship between equilibrium FcRn binding affinity at pH 6 and the observed in vivo half-life of IgG antibodies [45]. Indeed, because of the slow rates of dissociation of mAb with FcRn, the assumption that mAb–FcRn binding reaches equilibrium prior to endosomal sorting seems incorrect.
Overall, the developed PBPK modeling framework showed good predictive performance. All the a priori predictions were within a 2-fold threshold for PE, AAFE, and AFE compared to the observed data. Only one data set was slightly overpredicted (1.58, 1.78, 1.94 and 1.94-fold PE for Cmax, AUC, AAFE and AFE respectively). It corresponded to Chinese HV administered a 0.5 mg/kg dose (Figure 4 and Figure 5). This overprediction seems to be due to an inadequate description of the volume of distribution that could be related to a physiological difference in this ethnic group. However, in a population PK analysis by Han et al., the differences in bevacizumab PK between Asian and Caucasian patients were described solely by the difference in body weight [52], which was considered in our analysis. It suggests that there might be other ethnical differences in physiological parameters between Caucasian and Asian populations which were not well accounted for in the model.
Sensitivity analysis allowed to evaluate the importance of KD-FcRn and TMDD-related parameters on model predictions for different doses and populations (NHP, HV and cancer patients) and to understand which parameter needs to be optimized during development of mAbs PBPK model. As expected, the variation of TMDD parameters had the highest impact on PK profiles at the lowest doses (especially 0.3 mg/kg in cancer patients). Since TMDD parameters are important to predict PK in FIH phase 1 trials, these parameters should be obtained by in vitro assays and in vivo measurement of the target concentration in preclinical species and target populations prior to PBPK model building. Concerning KD-FcRn, this parameter is the most important to determine the linear part of mAbs PK. It is usually determined by in vitro assays prior to PBPK modelling. However, KD-FcRn found in vitro does not necessarily correspond to the in vivo value. The in vitro value is used in preclinical PBPK modelling as a starting point and the in vivo value is obtained by fitting the observed data. To anticipate KD-FcRn in human, the in vitro/in vivo ratio determined in animal and the in vitro value from SPR assays in human is used to develop a PBPK model. PK translation of rozanolixizumab from preclinical to clinical stages described in the study by Lledo-Garcia et al. is an example of this type of approach [53].
The translational PBPK modelling approach developed in this work could be extended to other antibodies using the databases integrated in OSP Suite. The ease of use of the OSP Suite for translational PBPK is the fact that the software requires limited number of in vitro data to predict PK profiles. Therefore, it can help a more rapid screening of mAb drug candidates as it is currently done for small molecule drugs. In addition, the use of a comprehensive software tool for whole-body PBPK enables rapid access to all relevant anatomical and physiological parameters for human and common laboratory animals (mouse, rat, minipig, dog, monkey and rabbit) which are available from an integrated database [54]. Also, the target expression in the PK-Sim® EST database allows to easily develop linear or non-linear PK models for mAbs and to extrapolate inter-species PK with a reduced number of experimental data and with accurate predictions as shown in this example with bevacizumab. Finally, the PBPK model presented in this work can serve as a platform to develop models for other mAbs with more complex PK properties such as bi- or trispecific antibodies or antibody-drug conjugates (ADC). Indeed, in such cases, conventional population PK approaches might not allow to study the TMDD processes and PK-pharmacodynamic (PK/PD) relationship. Khot et al. used the example of T-DM1 (trastuzumab emtansine) to develop a full PBPK modelling platform in ADAPT software [55] whereas more recently, Zhang et al. described PK translation of a bispecific antibody using full PBPK approach in GastroPlus® software [56]. Finally, translational QSP models have been developed for CD3 bispecific molecules [57]. Prediction of drug PK, efficacy and toxicity using mechanistic frameworks integrating in silico, in vitro and in vivo data stands for the future in the drug development especially in biologics which are more complex drugs than small molecules.
This study has several limitations. First, a prospective validation of this approach was not possible because no prospective bevacizumab data set was available in our study. To further validate and consolidate the use of this approach in MIDD of mAbs, other studies with mAbs with more complex PK (e.g., ADC, bi- or trispecific antibodies) are needed.
Other host-related factors such as disease state, tumor burden, and presence of ADA may impact on mAbs PK [1,2] and were not included in this analysis. Time-varying PK has been observed for several mAbs such as nivolumab and pembrolizumab and has been associated to changes in disease state (cachexia, inflammation) [58,59]. In addition, patients who present ADA can have higher mAbs CL [2]. Prediction of mAbs PK in patients using animal or HV data does not allow to take these factors into account which might result in a wrong dose selection. Thus, further improvements should be performed in the translational PBPK models in order to include these factors in PK predictions.

5. Conclusions

In this work, we report development of a PBPK modelling framework in OSP Suite for PK translation from NHP to cancer patients for a mAb presenting TMDD. This project is the first step to generalize this kind of approach in MIDD of mAbs using OSP suite.

Supplementary Materials

The following supporting information can be downloaded at: https://www.mdpi.com/article/10.3390/pharmaceutics15082129/s1. Supplementary Material S1. Details of the FcRn-mAb binding model from Niederalt et al. Supplementary Material S2. Details of the different steps of model development in non-human primate in PK-Sim®. Supplementary Material S3. Details of the different steps of model development in healthy volunteers in PK-Sim®. Figure S1. Relative expression of VEGF-A in tissues and organs in the full PBPK model in PK-Sim according to Expressed Sequence Tags (EST) database. Figure S2. Observed and PBPK model-predicted concentrations in healthy volunteers for a 3 mg/kg IV dose. Red curve represents predictions obtained using refined model. Blue points are the observed data. AAFE and AFE are 1.24 and 1.23, respectively.

Author Contributions

B.P. and S.B.: Analysis of the data; M.F., D.T., X.D. and A.P.: project supervision; B.P.: writing—original draft preparation; B.P., S.B., M.F., D.T., X.D. and A.P.: writing—review and editing. All authors have read and agreed to the published version of the manuscript.

Funding

This research received no external funding.

Institutional Review Board Statement

Not applicable.

Informed Consent Statement

Not applicable.

Data Availability Statement

No new data were created in this study. Data sharing is not applicable to this article.

Conflicts of Interest

Blaise Pasquiers & Mathieu Felices are employed by PhinC Development (Contract Research Organization).

References

  1. Ovacik, M.; Lin, K. Tutorial on Monoclonal Antibody Pharmacokinetics and Its Considerations in Early Development. Clin. Transl. Sci. 2018, 11, 540–552. [Google Scholar] [CrossRef]
  2. Pasquiers, B.; Benamara, S.; Felices, M.; Nguyen, L.; Declèves, X. Review of the Existing Translational Pharmacokinetics Modeling Approaches Specific to Monoclonal Antibodies (mAbs) to Support the First-In-Human (FIH) Dose Selection. Int. J. Mol. Sci. 2022, 23, 12754. [Google Scholar] [CrossRef] [PubMed]
  3. Haraya, K.; Tsutsui, H.; Komori, Y.; Tachibana, T. Recent Advances in Translational Pharmacokinetics and Pharmacodynamics Prediction of Therapeutic Antibodies Using Modeling and Simulation. Pharmaceuticals 2022, 15, 508. [Google Scholar] [CrossRef]
  4. Garg, A.; Balthasar, J.P. Physiologically-based pharmacokinetic (PBPK) model to predict IgG tissue kinetics in wild-type and FcRn-knockout mice. J. Pharmacokinet. Pharmacodyn. 2007, 34, 687–709. [Google Scholar] [CrossRef] [PubMed]
  5. Glassman, P.M.; Balthasar, J.P. Physiologically-based modeling of monoclonal antibody pharmacokinetics in drug discovery and development. Drug Metab. Pharmacokinet. 2019, 34, 3–13. [Google Scholar] [CrossRef] [PubMed]
  6. Huang, W.; Stader, F.; Chan, P.; Shemesh, C.S.; Chen, Y.; Gill, K.L.; Jones, H.M.; Li, L.; Rossato, G.; Wu, B.; et al. Development of a Pediatric Physiologically-Based Pharma-cokinetic Model to Support Recommended Dosing of Atezolizumab in Children with Solid Tumors. Front. Pharmacol. 2022, 13, 974423. [Google Scholar] [CrossRef] [PubMed]
  7. Basu, S.; Lien, Y.T.; Vozmediano, V.; Schlender, J.-F.; Eissing, T.; Schmidt, S.; Niederalt, C. Physiologically Based Pharmacokinetic Modeling of Monoclonal Antibodies in Pediatric Populations Using PK-Sim. Front. Pharmacol. 2020, 11, 8. [Google Scholar] [CrossRef] [PubMed]
  8. Glassman, P.M.; Balthasar, J.P. Application of a catenary PBPK model to predict the disposition of “catch and release” anti-PCSK9 antibodies. Int. J. Pharm. 2016, 505, 69–78. [Google Scholar] [CrossRef]
  9. Glassman, P.M.; Balthasar, J.P. Physiologically-based pharmacokinetic modeling to predict the clinical pharmacokinetics of monoclonal antibodies. J. Pharmacokinet. Pharmacodyn. 2016, 43, 427–446. [Google Scholar] [CrossRef]
  10. Avastin-Epar-Product-Information_Fr.Pdf [Internet]. Available online: https://www.ema.europa.eu/en/documents/product-information/avastin-epar-product-information_fr.pdf (accessed on 16 January 2023).
  11. Gordon, M.S.; Margolin, K.; Talpaz, M.; Sledge, G.W., Jr.; Holmgren, E.; Benjamin, R.; Stalter, S.; Shak, S.; Adelman, D.C. Phase I Safety and Pharmacokinetic Study of Recombinant Human Anti-Vascular Endothelial Growth Factor in Patients With Advanced Cancer. J. Clin. Oncol. 2001, 19, 843–850. [Google Scholar] [CrossRef]
  12. Li, M.; Qiang, W.; Hu, L.; Wang, L.; Cheng, Z. A novel model for the pharmacokinetic studies of bevacizumab and etanercept in healthy volunteers and patients. Biochem. Pharmacol. 2017, 145, 169–177. [Google Scholar] [CrossRef] [PubMed]
  13. Zalevsky, J.; Chamberlain, A.K.; Horton, H.M.; Karki, S.; Leung, I.W.L.; Sproule, T.J.; A Lazar, G.; Roopenian, D.C.; Desjarlais, J.R. Enhanced antibody half-life improves in vivo activity. Nat. Biotechnol. 2010, 28, 157–159. [Google Scholar] [CrossRef] [Green Version]
  14. Wu, X.; Wynne, C.; Xu, C.; Gan, Y.; Wang, C.; Thomas, B.E.; Yu, J.C.; Li, S.; Zhang, L. A Global Phase I Clinical Study Comparing the Safety and Phar-macokinetics of Proposed Biosimilar BAT1706 and Bevacizumab (Avastin®) in Healthy Male Subjects. BioDrugs 2019, 33, 335–342. [Google Scholar] [CrossRef] [PubMed]
  15. Hettema, W.; Wynne, C.; Lang, B.; Altendorfer, M.; Czeloth, N.; Lohmann, R.; Athalye, S.; Schliephake, D. A randomized, single-blind, Phase I trial (INVICTAN-1) assessing the bioequivalence and safety of BI 695502, a bevacizumab biosimilar candidate, in healthy subjects. Expert Opin. Investig. Drugs 2017, 26, 889–896. [Google Scholar] [CrossRef] [PubMed] [Green Version]
  16. Hummel, M.; Bosje, T.; Shaw, A.; Liu, M.S.; Barve, A.; Kothekar, M.; Socinski, M.A. A pharmacokinetics study of proposed bevacizumab bio-similar MYL-1402O vs EU-bevacizumab and US-bevacizumab. J. Cancer Res. Clin. Oncol. 2022, 148, 487–496. [Google Scholar] [CrossRef]
  17. Demarchi, M.; Coliat, P.; Barthelemy, P.; Schott, R.; BenAbdelghani, M.; Kim, M.; Hii, J.C.S.; Feyaerts, P.; Ang, F.R.X.; Derde, M.P.; et al. A randomized phase I study comparing the pharmacokinetics of a bevacizumab (HD204) biosimilar to European Union-and United States of America-sourced bevaci-zumab. Handelsman DJ, éditeur. PLoS ONE 2021, 16, e0248222. [Google Scholar] [CrossRef]
  18. Sinn, A.; García-Alvarado, F.; Gonzalez, V.; Huerga, C.; Bullo, F. A randomized, double blind, single dose, comparative study of the pharmacokinetics, safety and immunogenicity of MB02 (bevacizumab biosimilar) and reference bevacizumab in healthy male volunteers. Br. J. Clin. Pharmacol. 2022, 88, 1063–1073. [Google Scholar] [CrossRef]
  19. Shin, D.; Lee, Y.J.; Choi, J.; Lee, D.; Park, M.; Petkova, M. A phase I, randomized, single-dose pharmacokinetic study comparing sb8 (bevacizumab biosimilar) with reference bevacizumab in healthy volunteers. Cancer Chemother. Pharmacol. 2020, 86, 567–575. [Google Scholar] [CrossRef]
  20. Romera, A.; Peredpaya, S.; Shparyk, Y.; Bondarenko, I.; Bariani, G.M.; Abdalla, K.C.; Roca, E.; Franke, F.; Cruz, F.M.; Ramesh, A.; et al. Bevacizumab biosimilar BEVZ92 versus reference bevacizumab in combination with FOLFOX or FOLFIRI as first-line treatment for metastatic colorectal cancer: A multicentre, open-label, randomised controlled trial. Lancet Gastroenterol. Hepatol. 2018, 3, 845–855. [Google Scholar] [CrossRef]
  21. Niederalt, C.; Kuepfer, L.; Solodenko, J.; Eissing, T.; Siegmund, H.-U.; Block, M.; Willmann, S.; Lippert, J. A generic whole body physiologically based pharmacokinetic model for therapeutic proteins in PK-Sim. J. Pharmacokinet. Pharmacodyn. 2018, 45, 235–257. [Google Scholar] [CrossRef] [Green Version]
  22. Davies, B.; Morris, T. Physiological Parameters in Laboratory Animals and Humans. Pharm. Res. 1993, 10, 1093–1095. [Google Scholar] [CrossRef] [PubMed]
  23. Edginton, A.N.; Schmitt, W.; Willmann, S. Development and Evaluation of a Generic Physiologically Based Pharmacokinetic Model for Children. Clin. Pharmacokinet. 2006, 45, 1013–1034. [Google Scholar] [CrossRef]
  24. Mordenti, J. Man versus Beast: Pharmacokinetic Scaling in Mammals. J. Pharm. Sci. 1986, 75, 1028–1040. [Google Scholar] [CrossRef] [PubMed]
  25. Ren, X.; Li, J.; Xu, X.; Wang, C.; Cheng, Y. IBI302, a promising candidate for AMD treatment, targeting both the VEGF and com-plement system with high binding affinity in vitro and effective targeting of the ocular tissue in healthy rhesus monkeys. Exp. Eye Res. 2016, 145, 352–358. [Google Scholar] [CrossRef]
  26. Papadopoulos, N.; Martin, J.; Ruan, Q.; Rafique, A.; Rosconi, M.P.; Shi, E.; Pyles, E.A.; Yancopoulos, G.D.; Stahl, N.; Wiegand, S.J. Binding and neutralization of vascular endothelial growth factor (VEGF) and related ligands by VEGF Trap, ranibizumab and bevacizumab. Angiogenesis 2012, 15, 171–185. [Google Scholar] [CrossRef] [Green Version]
  27. Neuber, T.; Frese, K.; Jaehrling, J.; Jäger, S.; Daubert, D.; Felderer, K.; Hohne, A.; Pabst, S.; Ostendorp, R.; Brocks, B.; et al. Characterization and screening of IgG binding to the ne-onatal Fc receptor. mAbs 2014, 6, 928–942. [Google Scholar] [CrossRef] [Green Version]
  28. Nowacka, A.; Smuczyński, W.; Rość, D.; Woźniak-Dąbrowska, K.; Śniegocki, M. Serum VEGF-A concentrations in patients with central nervous system (CNS) tumors. PLoS ONE 2018, 13, e0192395. [Google Scholar] [CrossRef] [PubMed] [Green Version]
  29. Stefanini, M.O.; Wu, F.T.H.; Mac Gabhann, F.; Popel, A.S. Increase of plasma VEGF after intravenous administration of bevacizumab is predicted by a pharmacokinetic model. Cancer Res. 2010, 70, 9886–9894. [Google Scholar] [CrossRef] [Green Version]
  30. Stefanini, M.O.; Wu, F.T.; Mac Gabhann, F.; Popel, A.S. A compartment model of VEGF distribution in blood, healthy and diseased tissues. BMC Syst. Biol. 2008, 2, 77. [Google Scholar] [CrossRef] [Green Version]
  31. Kut, C.; Mac Gabhann, F.; Popel, A.S. Where is VEGF in the body? A meta-analysis of VEGF distribution in cancer. Br. J. Cancer 2007, 97, 978–985. [Google Scholar] [CrossRef] [Green Version]
  32. Zajkowska, M.; Lubowicka, E.; Fiedorowicz, W.; Szmitkowski, M.; Jamiołkowski, J.; Ławicki, S. Human Plasma Levels of VEGF-A, VEGF-C, VEGF-D, their Soluble Receptor-VEGFR-2 and Applicability of these Parameters as Tumor Markers in the Diagnostics of Breast Cancer. Pathol. Oncol. Res. 2019, 25, 1477–1486. [Google Scholar] [CrossRef] [PubMed] [Green Version]
  33. Meyer, M.; Schneckener, S.; Ludewig, B.; Kuepfer, L.; Lippert, J. Using Expression Data for Quantification of Active Processes in Physiologically Based Pharmacokinetic Modeling. Drug Metab. Dispos. 2012, 40, 892–901. [Google Scholar] [CrossRef] [PubMed]
  34. Wheeler, D.L.; Barrett, T.; Benson, D.A.; Bryant, S.H.; Canese, K.; Church, D.M.; DiCuccio, M.; Edgar, R.; Federhen, S.; Helmberg, W.; et al. Database resources of the National Center for Biotechnology Information. Nucleic Acids Res. 2005, 33 (Suppl. S1), D39–D45. [Google Scholar] [CrossRef] [PubMed]
  35. Wheeler, D.L.; Barrett, T.; Benson, D.A.; Bryant, S.H.; Canese, K.; Church, D.M.; DiCuccio, M.; Edgar, R.; Federhen, S.; Helmberg, W.; et al. Database resources of the National Center for Biotechnology. Nucleic Acids Res. 2003, 31, 28–33. [Google Scholar] [CrossRef]
  36. Liu, Y.N.; Huang, J.; Guo, C.; Yang, S.; Ye, L.; Wu, S.T.; Zhang, X.F.; Yang, X.Y.; Han, C.C.; Pei, Q.; et al. A randomized, double-blind, single-dose study to evaluate the bio-similarity of QL1101 with bevacizumab in healthy male subjects. Cancer Chemother. Pharmacol. 2020, 85, 555–562. [Google Scholar] [CrossRef] [PubMed] [Green Version]
  37. Maharaj, A.R.; Wu, H.; Hornik, C.P.; Arrieta, A.; James, L.; Bhatt-Mehta, V.; Bradley, J.; Muller, W.J.; Al-Uzri, A.; Downes, K.J.; et al. Use of normalized prediction distribution errors for assessing population physiologically-based pharmacokinetic model adequacy. J. Pharmacokinet. Pharmacodyn. 2020, 47, 199–218. [Google Scholar] [CrossRef] [PubMed]
  38. Shimizu, H.; Yoshida, K.; Nakada, T.; Kojima, K.; Ogasawara, A.; Nakamaru, Y.; Yamazaki, H. Prediction of Human Distribution Volumes of Compounds in Various Elimination Phases Using Physiologically Based Pharmacokinetic Modeling and Experimental Phar-macokinetics in Animals. Drug Metab. Dispos. Biol. Fate Chem. 2019, 47, 114–123. [Google Scholar] [CrossRef] [Green Version]
  39. Abduljalil, K.; Cain, T.; Humphries, H.; Rostami-Hodjegan, A. Deciding on Success Criteria for Predictability of Pharmacokinetic Parameters from In Vitro Studies: An Analysis Based on In Vivo Observations. Drug Metab. Dispos. 2014, 42, 1478–1484. [Google Scholar] [CrossRef]
  40. Shebley, M.; Sandhu, P.; Riedmaier, A.E.; Jamei, M.; Narayanan, R.; Patel, A.; Peters, S.A.; Reddy, V.P.; Zheng, M.; de Zwart, L.; et al. Physiologically Based Pharmacokinetic Model Qualification and Reporting Procedures for Regulatory Submissions: A Consortium Perspective. Clin. Pharmacol. Ther. 2018, 104, 88–110. [Google Scholar] [CrossRef] [Green Version]
  41. Tranter, E.; Peters, G.; Boyce, M.; Warrington, S. Giving monoclonal antibodies to healthy volunteers in phase 1 trials: Is it safe? Br. J. Clin. Pharmacol. 2013, 76, 164–172. [Google Scholar] [CrossRef] [Green Version]
  42. Baxter, L.T.; Zhu, H.; Mackensen, D.G.; Butler, W.F.; Jain, R.K. Biodistribution of monoclonal antibodies: Scale-up from mouse to human using a physiologically based pharmacokinetic model. Cancer Res. 1995, 55, 4611–4622. [Google Scholar] [PubMed]
  43. Davda, J.P.; Jain, M.; Batra, S.K.; Gwilt, P.R.; Robinson, D.H. A physiologically based pharmacokinetic (PBPK) model to characterize and predict the disposition of monoclonal antibody CC49 and its single chain Fv constructs. Int. Immunopharmacol. 2008, 8, 401–413. [Google Scholar] [CrossRef] [PubMed]
  44. Shah, D.K.; Betts, A.M. Towards a platform PBPK model to characterize the plasma and tissue disposition of monoclonal antibodies in preclinical species and human. J. Pharmacokinet. Pharmacodyn. 2012, 39, 67–86. [Google Scholar] [CrossRef] [PubMed]
  45. Chen, Y.; Balthasar, J.P. Evaluation of a Catenary PBPK Model for Predicting the In Vivo Disposition of mAbs Engineered for High-Affinity Binding to FcRn. AAPS J. 2012, 14, 850–859. [Google Scholar] [CrossRef] [PubMed] [Green Version]
  46. Glassman, P.M.; Chen, Y.; Balthasar, J.P. Scale-up of a physiologically-based pharmacokinetic model to predict the disposition of monoclonal antibodies in monkeys. J. Pharmacokinet. Pharmacodyn. 2015, 42, 527–540. [Google Scholar] [CrossRef]
  47. Papachristos, A.; Karatza, E.; Kalofonos, H.; Sivolapenko, G. Pharmacogenetics in Model-Based Optimization of Bevacizumab Therapy for Metastatic Colorectal Cancer. Int. J. Mol. Sci. 2020, 21, 3753. [Google Scholar] [CrossRef]
  48. Panoilia, E.; Schindler, E.; Samantas, E.; Aravantinos, G.; Kalofonos, H.P.; Christodoulou, C.; Patrinos, G.P.; Friberg, L.E.; Sivolapenko, G. A pharmacokinetic binding model for bevacizumab and VEGF165 in colorectal cancer patients. Cancer Chemother. Pharmacol. 2015, 75, 791–803. [Google Scholar] [CrossRef]
  49. Yen, P.; Finley, S.D.; Engel-Stefanini, M.O.; Popel, A.S. A Two-Compartment Model of VEGF Distribution in the Mouse. PLoS ONE 2011, 6, e27514. [Google Scholar] [CrossRef]
  50. Simón-Yarza, T.; Formiga, F.R.; Tamayo, E.; Pelacho, B.; Prosper, F.; Blanco-Prieto, M.J. Vascular Endothelial Growth Factor-Delivery Systems for Cardiac Repair: An Overview. Theranostics 2012, 2, 541–552. [Google Scholar] [CrossRef]
  51. Kleinheinz, J.; Jung, S.; Wermker, K.; Fischer, C.; Joos, U. Release kinetics of VEGF165 from a collagen matrix and structural matrix changes in a circulation model. Head Face Med. 2010, 6, 17. [Google Scholar] [CrossRef] [Green Version]
  52. Han, K.; Peyret, T.; Marchand, M.; Quartino, A.; Gosselin, N.H.; Girish, S.; Allison, D.E.; Jin, J. Population pharmacokinetics of bevacizumab in cancer patients with external validation. Cancer Chemother. Pharmacol. 2016, 78, 341–351. [Google Scholar] [CrossRef] [PubMed] [Green Version]
  53. Lledo-Garcia, R.; Dixon, K.; Shock, A.; Oliver, R. Pharmacokinetic-pharmacodynamic modelling of the anti-FcRn monoclonal antibody rozanolixizumab: Translation from preclinical stages to the clinic. CPT Pharmacomet. Syst. Pharmacol. 2022, 11, 116–128. [Google Scholar] [CrossRef] [PubMed]
  54. Modules, Philosophy, and Building Blocks [Internet]. Available online: https://docs.open-systems-pharmacology.org/open-systems-pharmacology-suite/modules-philsophy-building-blocks (accessed on 18 July 2023).
  55. Khot, A.; Tibbitts, J.; Rock, D.; Shah, D.K. Development of a Translational Physiologically Based Pharmacokinetic Model for Anti-body-Drug Conjugates: A Case Study with T-DM1. AAPS J. 2017, 19, 1715–1734. [Google Scholar] [CrossRef] [PubMed]
  56. Zhang, W.; Xiang, Y.; Wang, L.; Wang, F.; Li, G.; Zhuang, X. Translational pharmacokinetics of a novel bispecific antibody against Ebola virus (MBS77E) from animal to human by PBPK modeling & simulation. Int. J. Pharm. 2022, 626, 122160. [Google Scholar] [CrossRef]
  57. Betts, A.; Haddish-Berhane, N.; Shah, D.K.; van der Graaf, P.H.; Barletta, F.; King, L.; Root, A.; Hoper, A.; Chen, X. A Translational Quantitative Systems Pharmacology Model for CD3 Bispecific Molecules: Application to Quantify T Cell-Mediated Tumor Cell Killing by P-Cadherin LP DART®. AAPS J. 2019, 21, 66. [Google Scholar] [CrossRef] [Green Version]
  58. Bajaj, G.; Wang, X.; Agrawal, S.; Gupta, M.; Roy, A.; Feng, Y. Model-Based Population Pharmacokinetic Analysis of Nivolumab in Patients With Solid Tumors. CPT Pharmacomet. Syst. Pharmacol. 2016, 6, 58–66. [Google Scholar] [CrossRef]
  59. Li, H.; Yu, J.; Liu, C.; Liu, J.; Subramaniam, S.; Zhao, H.; Blumenthal, G.M.; Turner, D.C.; Li, C.; Ahamadi, M.; et al. Time dependent pharmacokinetics of pembrolizumab in patients with solid tumor and its correlation with best overall response. J. Pharmacokinet. Pharmacodyn. 2017, 44, 403–414. [Google Scholar] [CrossRef]
Figure 1. Schematic representation of the PBPK model in PK-Sim®, adapted from Niederalt et al. [21].
Pharmaceutics 15 02129 g001
Figure 2. Schematic representation of the target-mediated drug disposition (TMDD) mechanism.
Pharmaceutics 15 02129 g002
Figure 3. Observed and PBPK model-predicted concentrations in non-human primate: (a) 4 mg/kg IV dose of bevacizumab, (b) 4 mg/kg IV dose of xtend-bevacizumab.
Pharmaceutics 15 02129 g003
Figure 4. Observed and PBPK model-predicted concentrations in healthy volunteers for different intravenous doses: (a) 0.5 mg/kg; (b) 1 mg/kg; (c) 3 mg/kg. Green dashed curve represents a priori predictions of PK profiles using non-human primate model and red curve represents predictions obtained using refined model. Blue points are the observed data with their 95% confidence interval when available (black bars).
Pharmaceutics 15 02129 g004
Figure 5. Observed versus a priori model-predicted AUC and Cmax of bevacizumab. HV, healthy volunteers.
Pharmaceutics 15 02129 g005
Figure 6. Observed and PBPK model-predicted concentrations in cancer patients at different intravenous doses: (a) 0.3 mg/kg; (b) 1 mg/kg; (c) 3 mg/kg; (d) 5 mg/kg; (e) 10 mg/kg. Green dashed curve represents a priori predictions of PK profiles using healthy volunteers’ model and red curve represents predictions obtained using refined model. Blue points are the observed data.
Pharmaceutics 15 02129 g006
Figure 7. Results of the sensitivity analysis. kint: Internalization rate constant of the drug-target complex (1st order); kdeg, degradation rate constant of VEGF (1st order); KD,target, equilibrium dissociation constant of bevacizumab to VEGF; KD-FcRn, equilibrium dissociation constant of bevacizumab to FcRn; Conc VEGF-A, concentration of VEGF.
Pharmaceutics 15 02129 g007
Table 1. Summary of digitalized PK bevacizumab data used for the PBPK model development.
PopulationNumber of SubjectsBevacizumab DoseStudy Description
Cynomolgus monkey2 (bevacizumab)
2 (xtend-bevacizumab)
4 mg/kg
Single dose
PK study in cynomolgus monkey, Mean profiles
Zalevksy et al., 2010 [13]
HV50.5 mg/kg
Single dose
PK study of bevacizumab,
Individual profiles in Chinese HV
Li et al., 2017 [12]
HV431 mg/kg
Single dose
Phase I study in HV,
Mean (sd) profiles
Wu et al., 2019 [14]
HV301 mg/kg
Single dose
Phase I study in HV, mean profiles
Hettema et al., 2017 [15]
HV371 mg/kg
Single dose
Phase I study in HV,
Mean profiles
Hummel et al., 2022 [16]
HV391 mg/kg
Single dose
Phase I study in HV, mean profiles
Demarchi et al., 2021 [17]
HV383 mg/kg
Single dose
Phase I study in HV,
Mean profiles
Sinn et al., 2022 [18]
HV403 mg/kg
Single Dose
Phase I study in HV,
Mean (sd) profiles
Shin et al., 2020 [19]
Adult cancer patients5 subjects per dose0.3, 1, 3, 10 mg/kg
Repeated dose
Phase I study in cancer patients, Mean profiles
Gordon et al., 2001 [11]
Adult cancer patients615 mg/kg
Repeated dose
Biosimilar study in patients, Mean profiles
Romera et al., 2018 [20]
HV, Healthy Volunteers, sd, standard deviation.
Table 2. Bevacizumab PBPK model parameters.
ParameterCynomolgus MonkeyHealthy VolunteersAdult Cancer Patients
BevacizumabXtend-BevacizumabA Priori PredictedRefinedA Priori PredictedRefined
KD-FcRn (nmol/L)45041900940940940
KD,target a (nmol/L)0.032 [25]0.032 [25]0.058 [26]0.058 [26]0.058 [26]0.058 [26]
koff a (day−1)3.5 [25]3.5 [25]3.5 [26]2.7 [26]2.7 [26]2.7 [26]
VEGF-A (nmol/L)0 to 3
(min-max)
0 to 3
(min-max)
1.50.30.6 to 3
(min-max)
3.86
kdeg (day−1)---0.180.180.18
kint (day−1)---0.0430.0430.043
KD-FcRn, equilibrium dissociation constant of FcRn-bevacizumab complex; KD,target, equilibrium dissociation constant of bevacizumab-VEGF-A complex; koff, first-order dissociation rate constant of bevacizumab-VEGF-A complex; VEGF-A, concentration of VEGF-A; kdeg, first-order degradation rate constant of VEGF-A; kint, first-order internalization rate constant of bevacizumab-VEGF-A complex. a Parameter fixed to the literature value.
Table 3. AFE and AAFE evaluation for a priori predictions of adult cancer patients and healthy volunteers.
PopulationDose (mg/kg)AFEAAFE
Adult Cancer Patients0.30.891.38
10.751.39
30.861.27
51.041.17
100.851.23
Healthy Volunteers0.51.941.94
11.051.30
30.721.39
AAFE: average absolute fold error. AFE: average fold error.
Disclaimer/Publisher’s Note: The statements, opinions and data contained in all publications are solely those of the individual author(s) and contributor(s) and not of MDPI and/or the editor(s). MDPI and/or the editor(s) disclaim responsibility for any injury to people or property resulting from any ideas, methods, instructions or products referred to in the content.

