
Synthesis and Biodistribution of 99mTc-Labeled PLGA Nanoparticles by Microfluidic Technique

 , ,
, ,
Abstract
:1. Introduction
2. Materials and Methods
2.1. Materials
2.2. Synthesis of PLGA-NPs
2.3. Synthesis of 99mTc-PLGA-NPs
2.4. Quality Controls
2.4.1. Particle Size Distribution and Zeta Potential (ζ) Measurements
2.4.2. Labeling Efficiency and Yield Calculation of 99mTc-PLGA-NPs
2.4.3. “In Vitro” Release Study
2.5. In Vivo Biodistribution Studies
3. Statistical Analysis
4. Results
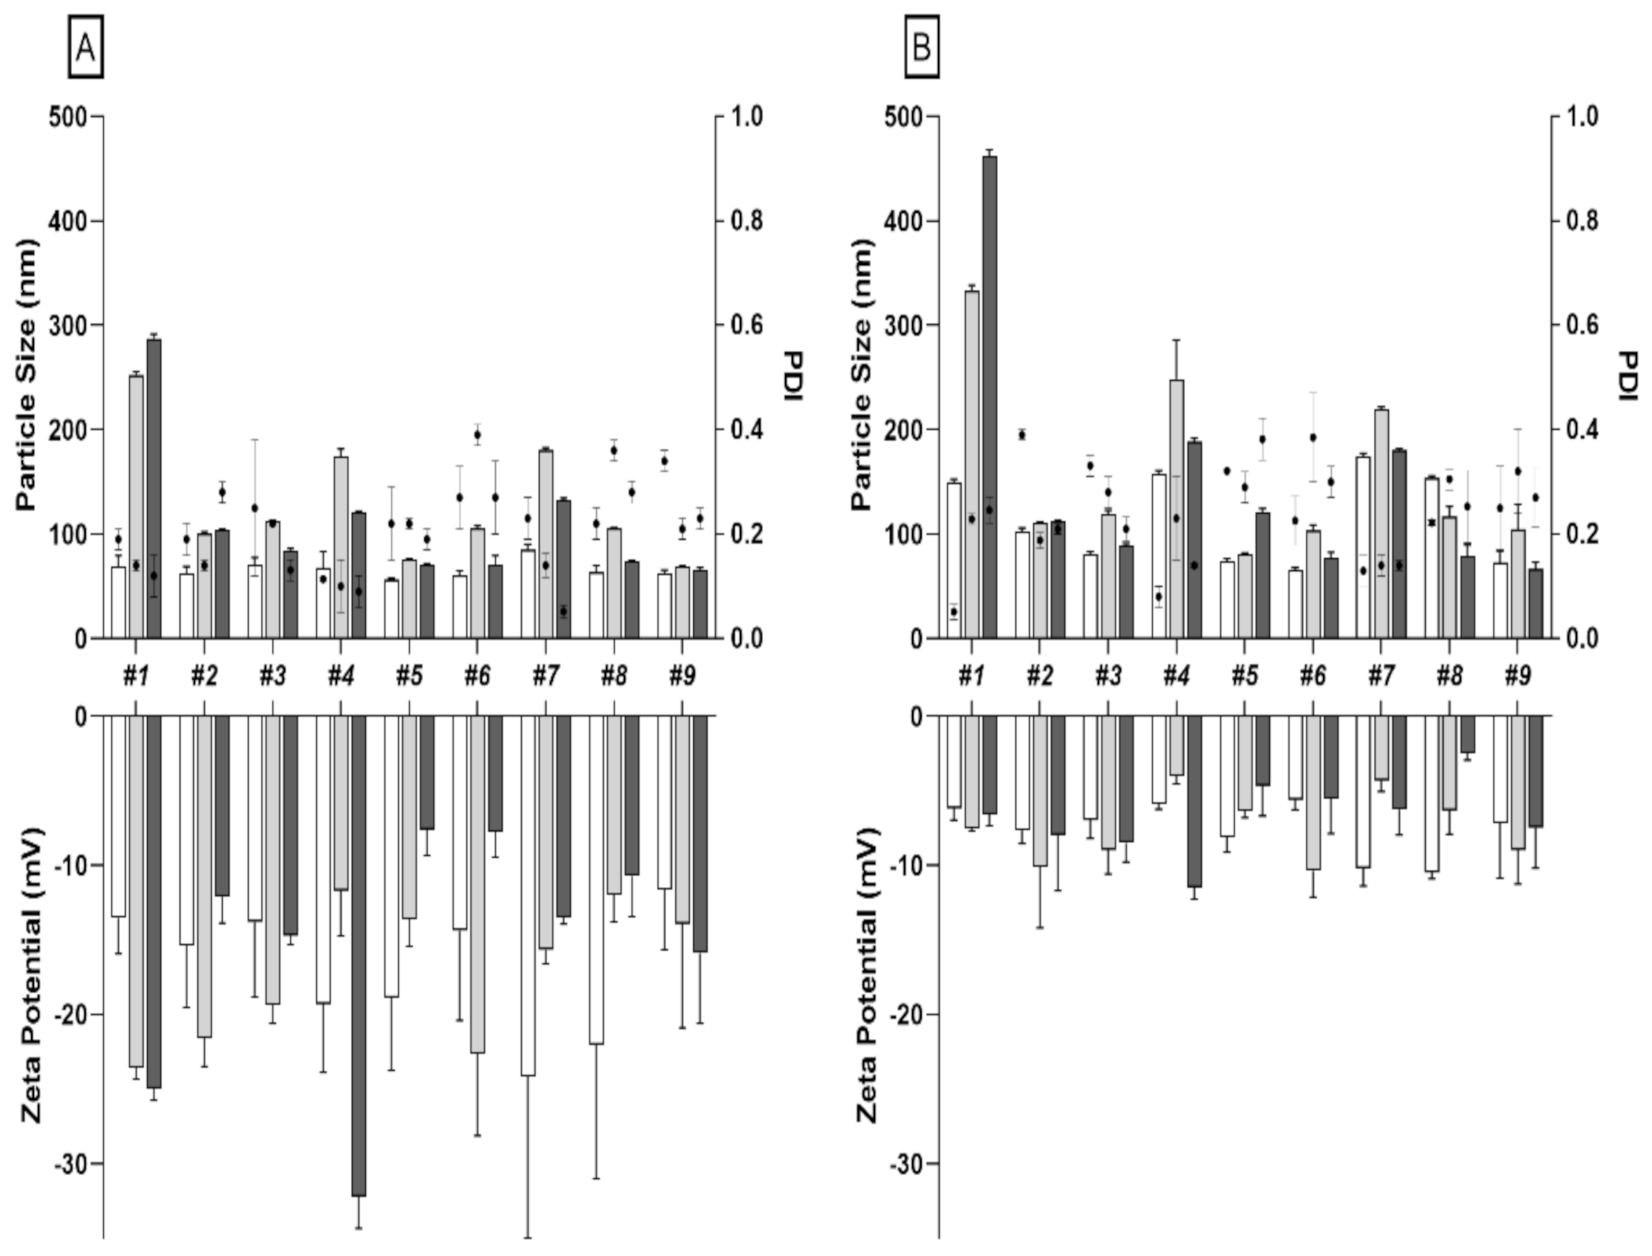
4.1. Particle Size Distribution and Zeta Potential (ζ) Measurements
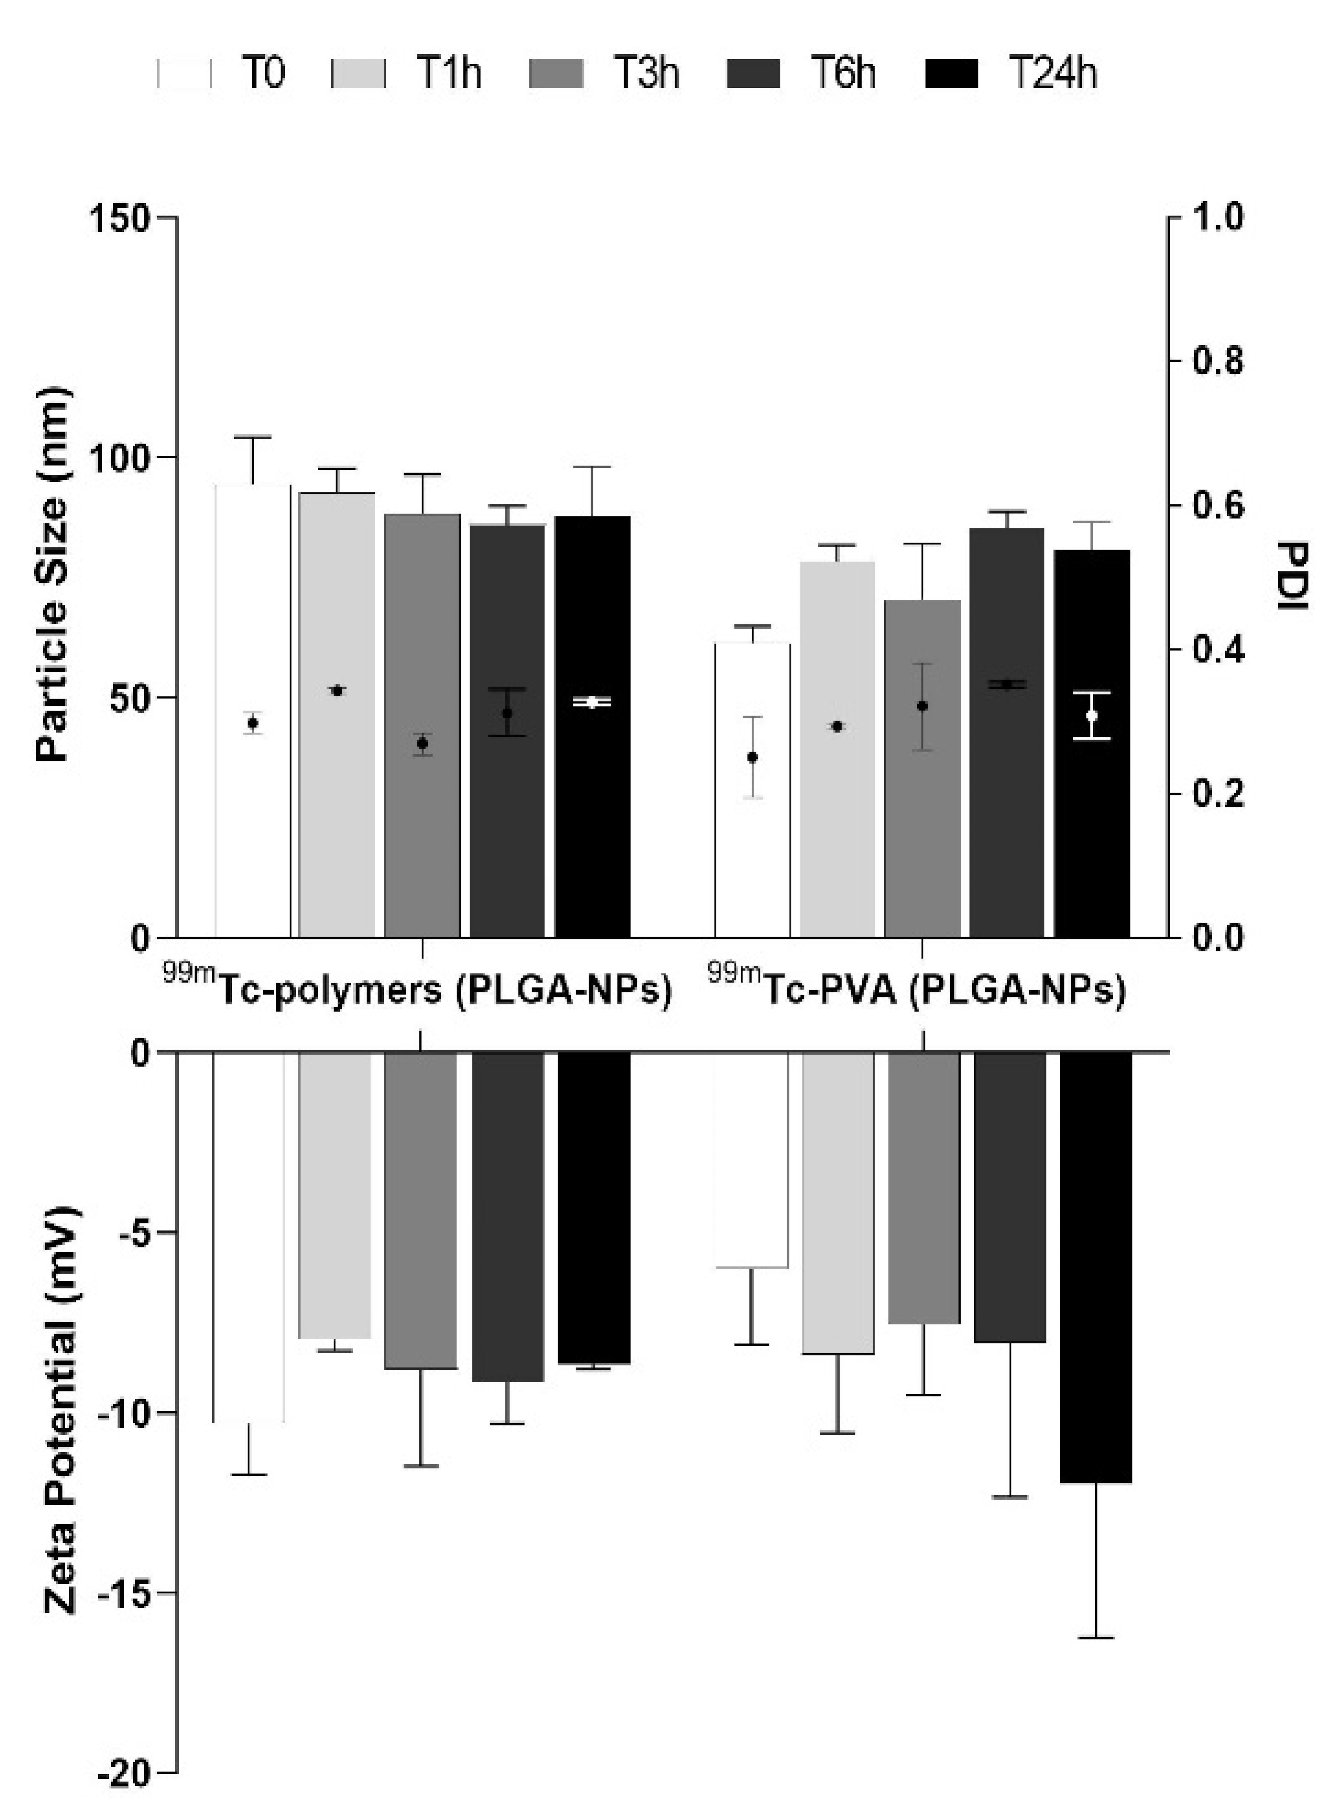
4.2. “In Vitro” Studies
4.3. In Vivo Biodistribution Studies
5. Discussion
6. Conclusions
Supplementary Materials
Author Contributions
Funding
Institutional Review Board Statement
Informed Consent Statement
Data Availability Statement
Acknowledgments
Conflicts of Interest
References
- Yohan, D.; Chithrani, B.D. Applications of nanoparticles in nanomedicine. J. Biomed. Nanotechnol. 2014, 10, 2371–2392. [Google Scholar] [CrossRef]
- Bi, Y.; Hao, F.; Yan, G.; Teng, L.; Lee, R.J.; Xie, J. Actively targeted nanoparticles for drug delivery to tumor. Curr. Drug Metab. 2016, 17, 763–782. [Google Scholar] [CrossRef] [PubMed]
- Yetisgin, A.A.; Cetinel, S.; Zuvin, M.; Kosar, A.; Kutlu, O. Therapeutic nanoparticles and their targeted delivery applications. Molecules 2020, 25, 2193. [Google Scholar] [CrossRef]
- Ernsting, M.J.; Murakami, M.; Roy, A.; Li, S.D. Factors controlling the pharmacokinetics, biodistribution and intratumoral penetration of nanoparticles. J. Control. Release 2013, 172, 782–794. [Google Scholar] [CrossRef] [PubMed] [Green Version]
- Longmire, M.; Choyke, P.L.; Kobayashi, H. Clearance properties of nano-sized particles and molecules as imaging agents: Considerations and caveats. Nanomedicine 2008, 3, 703–717. [Google Scholar] [CrossRef] [PubMed] [Green Version]
- Dinarvand, R.; Sepehri, N.; Manoochehri, S.; Rouhani, H.; Atyabi, F. Polylactide-co-glycolide nanoparticles for controlled delivery of anticancer agents. Int. J. Nanomed. 2011, 6, 877–895. [Google Scholar] [CrossRef] [PubMed] [Green Version]
- Prabhu, R.H.; Patravale, V.B.; Joshi, M.D. Polymeric nanoparticles for targeted treatment in oncology: Current insights. Int. J. Nanomed. 2015, 2, 1001–1018. [Google Scholar] [CrossRef] [Green Version]
- Bobo, D.; Robinson, K.; Islam, J.; Thurecht, J.K.; Corrie, S.R. Nanoparticle-based medicines: A review of FDA-approved materials and clinical trials to date. Pharm. Res. 2016, 33, 2373–2387. [Google Scholar] [CrossRef]
- Rezvantalab, S.; Drude, N.I.; Moraveji, M.K.; Güvener, N.; Koons, E.K.; Shi, Y.; Lammers, T.; Kiessling, F. PLGA-Based Nanoparticles in Cancer Treatment. Front. Pharmacol. 2018, 9, 1260. [Google Scholar] [CrossRef] [Green Version]
- Semete, B.; Booysen, L.; Lemmer, Y.; Kalombo, L.; Katata, L.; Verschoor, J.; Swai, H.S. In vivo evaluation of the biodistribution and safety of PLGA nanoparticles as drug delivery systems. Nanomedicine 2010, 6, 662–671. [Google Scholar] [CrossRef] [PubMed]
- Keles, H.; Naylor, A.; Clegg, F.; Sammon, C. Investigation of factors influencing the hydrolytic degradation of single PLGA microparticles. Polym. Degrad. Stab. 2015, 119, 228–241. [Google Scholar] [CrossRef] [Green Version]
- Swider, E.; Koshkina, O.; Tel, J.; Cruz, L.J.; de Vries, I.J.M.; Srinivas, M. Customizing poly(lactic-co-glycolic acid) particles for biomedical applications. Acta Biomater. 2018, 73, 38–51. [Google Scholar] [CrossRef] [PubMed]
- Houchin, M.L.; Topp, E.M.J. Review Chemical degradation of peptides and proteins in PLGA: A review of reactions and mechanisms. J. Pharm. Sci. 2008, 97, 2395–2404. [Google Scholar] [CrossRef]
- Morikawa, Y.; Tagami, T.; Hoshikawa, A.; Ozeki, T. The use of an efficient microfluidic mixing system for generating stabilized polymeric nanoparticles for controlled drug release. Biol. Pharm. Bull. 2018, 41, 899–907. [Google Scholar] [CrossRef] [PubMed] [Green Version]
- Bally, F.; Garg, D.K.; Serra, C.A.; Hoarau, Y.; Anton, N.; Brochon, C.; Parida, D.; Vandamme, T.; Hadziioannou, G. Improved size-tunable preparation of polymeric nanoparticles by microfluidic nanoprecipitation. Polymer 2012, 53, 5045–5051. [Google Scholar] [CrossRef] [Green Version]
- Capretto, L.; Carugo, D.; Mazzitelli, S.; Nastruzzi, C.; Zhang, X. Microfluidic and lab-on-a-chip preparation routes for organic nanoparticles and vesicular systems for nanomedicine applications. Adv. Drug. Deliv. Rev. 2013, 65, 1496–1532. [Google Scholar] [CrossRef]
- Schubert, S.; Delaney, J.T.; Schubert, U.S. Nanoprecipitation and nanoformulation of polymers: From history to powerful possibilities beyond poly (lactic acid). Soft Matter 2011, 7, 1581–1588. [Google Scholar] [CrossRef]
- Donno, R.; Gennari, A.; Lallana, E.; De La Rosa, J.M.R.; d’Arcy, R.; Treacher, K.; Hill, K.; Ashford, M.; Tirelli, N. Nanomanufacturing through microfluidic-assisted nanoprecipitation: Advanced analytics and structure-activity relationships. Int. J. Pharm. 2017, 534, 97–107. [Google Scholar] [CrossRef]
- Streck, S.; Neumann, H.; Nielsen, H.M.; Rades, T.; McDowell, A. Comparison of bulk and microfluidics methods for the formulation of poly-lactic-co-glycolic acid (PLGA) nanoparticles modified with cell-penetrating peptides of different architectures. Int. J. Pharm. X 2019, 1, 100030. [Google Scholar] [CrossRef]
- Duncanson, W.J.; Lin, T.; Abate, A.R.; Seiffert, S.; Shah, R.K.; Weitz, D.A. Microfluidic synthesis of advanced microparticles for encapsulation and controlled release. Lab. Chip. 2012, 12, 2135–2145. [Google Scholar] [CrossRef]
- Howell, P.B., Jr.; Mott, D.R.; Golden, J.P.; Ligler, F.S. Design and evaluation of a Dean vortex-based micromixer. Lab. Chip. 2004, 4, 663–669. [Google Scholar] [CrossRef]
- Varani, M.; Galli, F.; Capriotti, G.; Mattei, M.; Cicconi, R.; Campagna, G.; Panzuto, F.; Signore, A. Theranostic Designed Near-Infrared Fluorescent Poly (Lactic-co-Glycolic Acid) Nanoparticles and Preliminary Studies with Functionalized VEGF-Nanoparticles. J. Clin. Med. 2020, 9, 1750. [Google Scholar] [CrossRef] [PubMed]
- Chen, J.J.; Chen, C.H.; Shie, S.R. Optimal designs of staggered dean vortex micromixers. Int. J. Mol. Sci. 2011, 12, 3500–3524. [Google Scholar] [CrossRef] [PubMed]
- Chiesa, E.; Greco, A.; Dorati, R.; Conti, B.; Bruni, G.; Lamprou, D.; Genta, I. Microfluidic-assisted synthesis of multifunctional iodinated contrast agent polymeric nanoplatforms. Int. J. Pharm. 2021, 599, 120447. [Google Scholar] [CrossRef]
- Astete, C.E.; Sabliov, C.M. Synthesis and characterization of PLGA nanoparticles. J. Biomater. Sci. Polym. Ed. 2006, 17, 247–289. [Google Scholar] [CrossRef]
- Gañán-Calvo, A.M.; Gordillo, J.M. Perfectly monodisperse microbubbling by capillary flow focusing. Phys. Rev. Lett. 2001, 87, 274501. [Google Scholar] [CrossRef] [PubMed]
- Danaei, M.; Dehghankhold, M.; Ataei, S.; Davarani, F.H.; Javanmard, R.; Dokhani, A.; Khorasani, S.; Mozafari, M.R. Impact of Particle Size and Polydispersity Index on the Clinical Applications of Lipidic Nanocarrier Systems. Pharmaceutics 2018, 10, 57. [Google Scholar] [CrossRef] [Green Version]
- Jain, A.K.; Thareja, S. In vitro and in vivo characterization of pharmaceutical nanocarriers used for drug delivery. Artif. Cells Nanomed. Biotechnol. 2019, 47, 524–539. [Google Scholar] [CrossRef] [Green Version]
- Stolnik, M.C.; Garnett, M.C.; Davies, M.C.; Illum, L.; Bousta, M.; Vert, M.; Davis, S.S. The colloidal properties of surfactant-free biodegradable nanospheres from poly (β-malic acid-co-benzyl malate)s and poly (lactic acid-co-glycolide). Coll. Surf. 1995, 97, 235–245. [Google Scholar] [CrossRef]
- Roces, C.B.; Christensen, D.; Perrie, Y. Translating the fabrication of protein-loaded poly(lactic-co-glycolic acid) nanoparticles from bench to scale-independent production using microfluidics. Drug Deliv. Transl. Res. 2020, 10, 582–593. [Google Scholar] [CrossRef] [Green Version]
- Sahoo, S.K.; Panyam, J.; Prabha, S.; Labhasetwar, V. Residual polyvinyl alcohol associated with poly (D,L-lactide-co-glycolide) nanoparticles affects their physical properties and cellular uptake. J. Control. Release 2002, 82, 105–114. [Google Scholar] [CrossRef]
- Damiati, S.; Kompella, U.B.; Damiati, S.A.; Kodzius, R. Microfluidic Devices for Drug Delivery Systems and Drug Screening. Genes 2018, 9, 103. [Google Scholar] [CrossRef] [PubMed] [Green Version]
- Chiesa, E.; Dorati, R.; Modena, T.; Conti, B.; Genta, I. Multivariate analysis for the optimization of microfluidics-assisted nanoprecipitation method intended for the loading of small hydrophilic drugs into PLGA nanoparticles. Int. J. Pharm. 2018, 536, 165–177. [Google Scholar] [CrossRef]
- Garg, S.M.; Thomas, A.; Heuck, G.; Armstead, A.; Singh, J.; Leaver, T.J.; Wild, A.W.; IP, S.; Taylor, R.J.; Ramsay, E.C. PLGA Nanoparticles Production and In Situ Drug Loading Using the NanoAssemblr™ Benchtop Instrument and the Impact of Solvent Removal Methods; Precision NanoSystems Inc.: Vancouver, BC, Canada, 2017; Available online: https://www.precisionnanosystems.com/docs/default-source/pni-files/app-notes/plga---drug-loading-and-particle-purification-(pni-app-bt-009-ext)-e.pdf?sfvrsn=88e91c0e_2 (accessed on 10 April 2020).
- Psimadas, D.; Bouziotis, P.; Georgoulias, P.; Valotassiou, V.; Tsotakos, T.; Loudos, G. Radiolabeling approaches of nanoparticles with (99m) Tc. Contrast Media Mol. Imaging 2013, 8, 333–339. [Google Scholar] [CrossRef] [PubMed]
- Owens, D.E.; Peppas, N.A. Opsonization, biodistribution, and pharmacokinetics of polymeric nanoparticles. Int. J. Pharm. 2006, 307, 93–102. [Google Scholar] [CrossRef] [PubMed]
- Choi, H.S.; Liu, W.; Misra, P.; Tanaka, E.; Zimmer, J.P.; Ipe, B.I.; Bawendi, M.G.; Frangioni, J.V. Renal clearance of quantum dots. Nat. Biotechnol. 2007, 25, 1165–1170. [Google Scholar] [CrossRef] [Green Version]
- Zuckerman, J.E.; Choi, C.H.J.; Han, H.; Davis, M.E. Polycation-siRNA nanoparticles can disassemble at the kidney glomerular basement membrane. Proc. Natl. Acad. Sci. USA 2012, 109, 3137–3142. [Google Scholar] [CrossRef] [Green Version]
- Choi, C.H.; Zuckerman, J.E.; Webster, P.; Davis, M.E. Targeting kidney mesangium by nanoparticles of defined size. Proc. Natl. Acad. Sci. USA 2011, 108, 6656–6661. [Google Scholar] [CrossRef] [Green Version]
- Franken, P.R.; Guglielmi, J.; Vanhove, C.; Koulibaly, M.; Defrise, M.; Darcourt, J.; Pourcher, T. Distribution and dynamics of (99m)Tc-pertechnetate uptake in the thyroid and other organs assessed by single-photon emission computed tomography in living mice. Thyroid 2010, 20, 519–526. [Google Scholar] [CrossRef] [Green Version]


| Batch | PLGA (mg/mL) | FRR (Aqueous:Organic) | TFR (mL/min) |
|---|---|---|---|
| #1 | 5 | 1:1 | 8 |
| #2 | 5 | 3:1 | 8 |
| #3 | 5 | 5:1 | 8 |
| #4 | 5 | 1:1 | 12 |
| #5 | 5 | 3:1 | 12 |
| #6 | 5 | 5:1 | 12 |
| #7 | 5 | 1:1 | 15 |
| #8 | 5 | 3:1 | 15 |
| #9 | 5 | 5:1 | 15 |
| FRR (Aqueous:Organic) | PVA (mL) | PLGA Polymers (mL) | 99mTcO4− in PVA (mCi/mL) | 99mTcO4− in PLGA Polymers (mCi/mL) |
|---|---|---|---|---|
| 1:1 | 1 | 1 | 5 | - |
| 3:1 | 1.5 | 0.5 | 3.3 | - |
| 5:1 | 1.67 | 0.33 | 2.99 | - |
| 1:1 | 1 | 1 | - | 5 |
| 3:1 | 1.5 | 0.5 | - | 10 |
| 5:1 | 1.67 | 0.33 | - | 15.15 |
| Batch | 99mTc-Polymers (PLGA-NPs) | 99mTc-PVA (PLGA-NPs) | ||
|---|---|---|---|---|
| N° | LE Mean ± SD | YIELD Mean ± SD | LE Mean ± SD | YIELD Mean ± SD |
| #1 | 96.87 ± 1.74 | 26.70 ± 0.14 | 98.25 ± 2.47 | 19.06 ± 0.72 |
| #2 | 99.25 ± 1.06 | 34.05 ± 0.19 | 99.20 ± 1.13 | 27.50 ± 0.58 |
| #3 | 98.83 ± 0.40 | 22.54 ± 0.26 | 99.45 ± 0.78 | 31.60 ± 0.36 |
| #4 | 95.50 ± 1.20 | 22.12 ± 0.17 | 99.61 ± 0.56 | 32.93 ± 0.32 |
| #5 | 85.09 ± 10.96 | 11.60 ± 0.88 | 85.28 ± 17.23 | 29.82 ± 0.18 |
| #6 | 73.15 ± 26.90 | 14.78 ± 0.17 | 92.57 ± 10.51 | 41.33 ± 0.07 |
| #7 | 95.70 ± 1.48 | 19.10 ± 0.21 | 95.10 ± 2.06 | 31.73 ± 0.21 |
| #8 | 95.11 ± 1.92 | 13.8 ± 0.10 | 85.83 ± 5.25 | 20.71 ± 0.27 |
| #9 | 88.53 ± 1.43 | 10.92 ± 0.15 | 94.20 ± 5.83 | 33.69 ± 0.22 |
| 99mTcPLGA-NPs | 1 h Mean ± SD | 3 h Mean ± SD | 6 h Mean ± SD | 24 h Mean ± SD |
|---|---|---|---|---|
| 99mTc-polymers | 98.34 ± 1.79 | 97.97 ± 1.82 | 97.92 ± 1.86 | 84.34 ± 7.57 |
| 99mTc-PVA | 97.17 ± 3.66 | 97.92 ± 2.38 | 97.13 ± 2.65 | 84.21 ± 8.22 |
Publisher’s Note: MDPI stays neutral with regard to jurisdictional claims in published maps and institutional affiliations. |
© 2021 by the authors. Licensee MDPI, Basel, Switzerland. This article is an open access article distributed under the terms and conditions of the Creative Commons Attribution (CC BY) license (https://creativecommons.org/licenses/by/4.0/).
Share and Cite
Varani, M.; Campagna, G.; Bentivoglio, V.; Serafinelli, M.; Martini, M.L.; Galli, F.; Signore, A. Synthesis and Biodistribution of 99mTc-Labeled PLGA Nanoparticles by Microfluidic Technique. Pharmaceutics 2021, 13, 1769. https://doi.org/10.3390/pharmaceutics13111769
Varani M, Campagna G, Bentivoglio V, Serafinelli M, Martini ML, Galli F, Signore A. Synthesis and Biodistribution of 99mTc-Labeled PLGA Nanoparticles by Microfluidic Technique. Pharmaceutics. 2021; 13(11):1769. https://doi.org/10.3390/pharmaceutics13111769
Chicago/Turabian StyleVarani, Michela, Giuseppe Campagna, Valeria Bentivoglio, Matteo Serafinelli, Maria Luisa Martini, Filippo Galli, and Alberto Signore. 2021. "Synthesis and Biodistribution of 99mTc-Labeled PLGA Nanoparticles by Microfluidic Technique" Pharmaceutics 13, no. 11: 1769. https://doi.org/10.3390/pharmaceutics13111769