1. Introduction
Tree species classification is instrumental in deepening our understanding of the distinct characteristics and functional roles exhibited by different tree species within ecosystems [
1,
2,
3]. Each species possesses specific traits, such as growth rates, carbon sequestration capacities, and tolerance to environmental stressors [
4]. With climate change introducing new challenges, including altered temperature and precipitation patterns, increased frequency of extreme events, and shifts in species distributions [
5,
6], accurate classification becomes crucial in evaluating the responses and adaptive capacities of tree species to changing environmental conditions.
In recent years, the utilization of multi-temporally integrated satellite imageries has shown significant potential in tree species classification [
7]. Ref. [
8] conducted a study exemplifying this approach, highlighting its benefits in accurately identifying and categorizing tree species. Multi-temporally integrated satellite imageries involve the acquisition and integration of satellite data from multiple time points, capturing seasonal variations and long-term changes in vegetation patterns. This approach provides researchers with a comprehensive and dynamic view of the landscape, enabling them to assess the temporal dynamics of tree species composition and distribution. Ref. [
8] successfully demonstrated the effectiveness of multi-temporally integrated satellite imageries by combining various data sources, including high-resolution satellite imagery, multi-spectral data, texture information, and vegetation indices. Through the integration of these datasets across different time points, they were able to capture the phenological changes and unique spectral signatures associated with different tree species. This integration of multi-temporal data resulted in a more robust classification algorithm capable of differentiating between tree species with higher accuracy.
Although [
8] focused on utilizing a machine learning-based random forest model, the complexity of the data suggests the potential for the future implementation of deep learning approaches. The utilization of deep learning algorithms enhances the accuracy and robustness of tree species classification models, contributing to improved forest management, biodiversity conservation, and ecosystem health monitoring. Moreover, deep learning techniques hold promise in assessing the impacts of climate change on tree species distribution and identifying areas of vulnerability or resilience [
9]. It is worth noting that various parameters of convolutional neural networks (CNNs) can affect tree species classification results. For instance, in U-net-based CNNs, adjusting parameters such as patch size, epoch, patches per image, blur distance, class weight, and loss weight can significantly impact the classification outcomes. Notably, patch size and epoch are particularly influential factors in determining the classification results.
The absence of red-edge and/or SWIR bands in the data limits its utility, especially for ecosystem monitoring and agricultural management. These bands are essential for estimating biophysical and biochemical vegetation parameters. To enhance its applicability for forestry research, additional wavelengths such as water vapor (WVP) and SWIR bands are necessary to analyze the spectral reflection characteristics of trees in more detail. However, currently, domestic satellites lack these bands, requiring the use of satellites such as Landsat, Sentinel, and MODIS to analyze forest resources. The integration of heterogeneous imageries from different satellites may introduce errors due to variations in the spatial and spectral resolutions. Studies integrating specific bands have shown an improved classification accuracy for tree species. For instance, Ref. [
10] achieved an overall average accuracy of 77.21% by combining VNIR-SWIR bands in tree species classification using Aster imageries. Similarly, Ref. [
11] achieved a performance of up to 88.32% by integrating red-edge and SWIR bands in high-resolution land cover classification.
The characteristics of each tree species, such as texture, color tone, and pattern, are essential for accurate identification. The crown forms of different tree species exhibit distinct features, such as
Pinus densiflora’s umbrella shape with star-like branches or
Larix kaempferi’s conical form with layered branches. Although visually interpreting these crown characteristics from satellite imageries is challenging, studies have estimated the wavelength differences based on their crown features. Texture information has also been utilized in tree species classification analysis. Researchers have employed techniques, such as gray-level co-occurrence matrix (GLCM), to extract texture features from imageries. Studies have shown that incorporating texture information improves classification accuracy. For instance, Ref. [
12] demonstrated that using texture information from Landsat imageries increased the classification accuracy by at least 3.6%.
Vegetation indices derived from satellite imageries provide valuable insights into tree growth patterns, which are influenced by environmental conditions. Multi-temporal vegetation indices offer intrinsic characteristics for each tree species. They have been used for forest monitoring, biophysical vegetation analysis, and land-cover classification. Ref. [
13] classified vegetation in urban areas using normalized difference vegetation index (NDVI) and green vegetation index (GVI) derived from KOMPSAT imageries and aerial photographs. Integrating specific bands, incorporating texture information, and utilizing multi-temporal vegetation indices are valuable approaches to improving tree species classification accuracy.
In this study, we adjusted these parameters to construct the input dataset from multi-temporally integrated satellite imageries and trained them to learn the characteristics of forests in South Korea. Our aim was to design a deep learning-based tree species classification model that can estimate tree classes for forests across the entire country of South Korea. We compared the results with the previous random forest model and highlighted the improvements achieved by our proposed model.
2. Materials and Methods
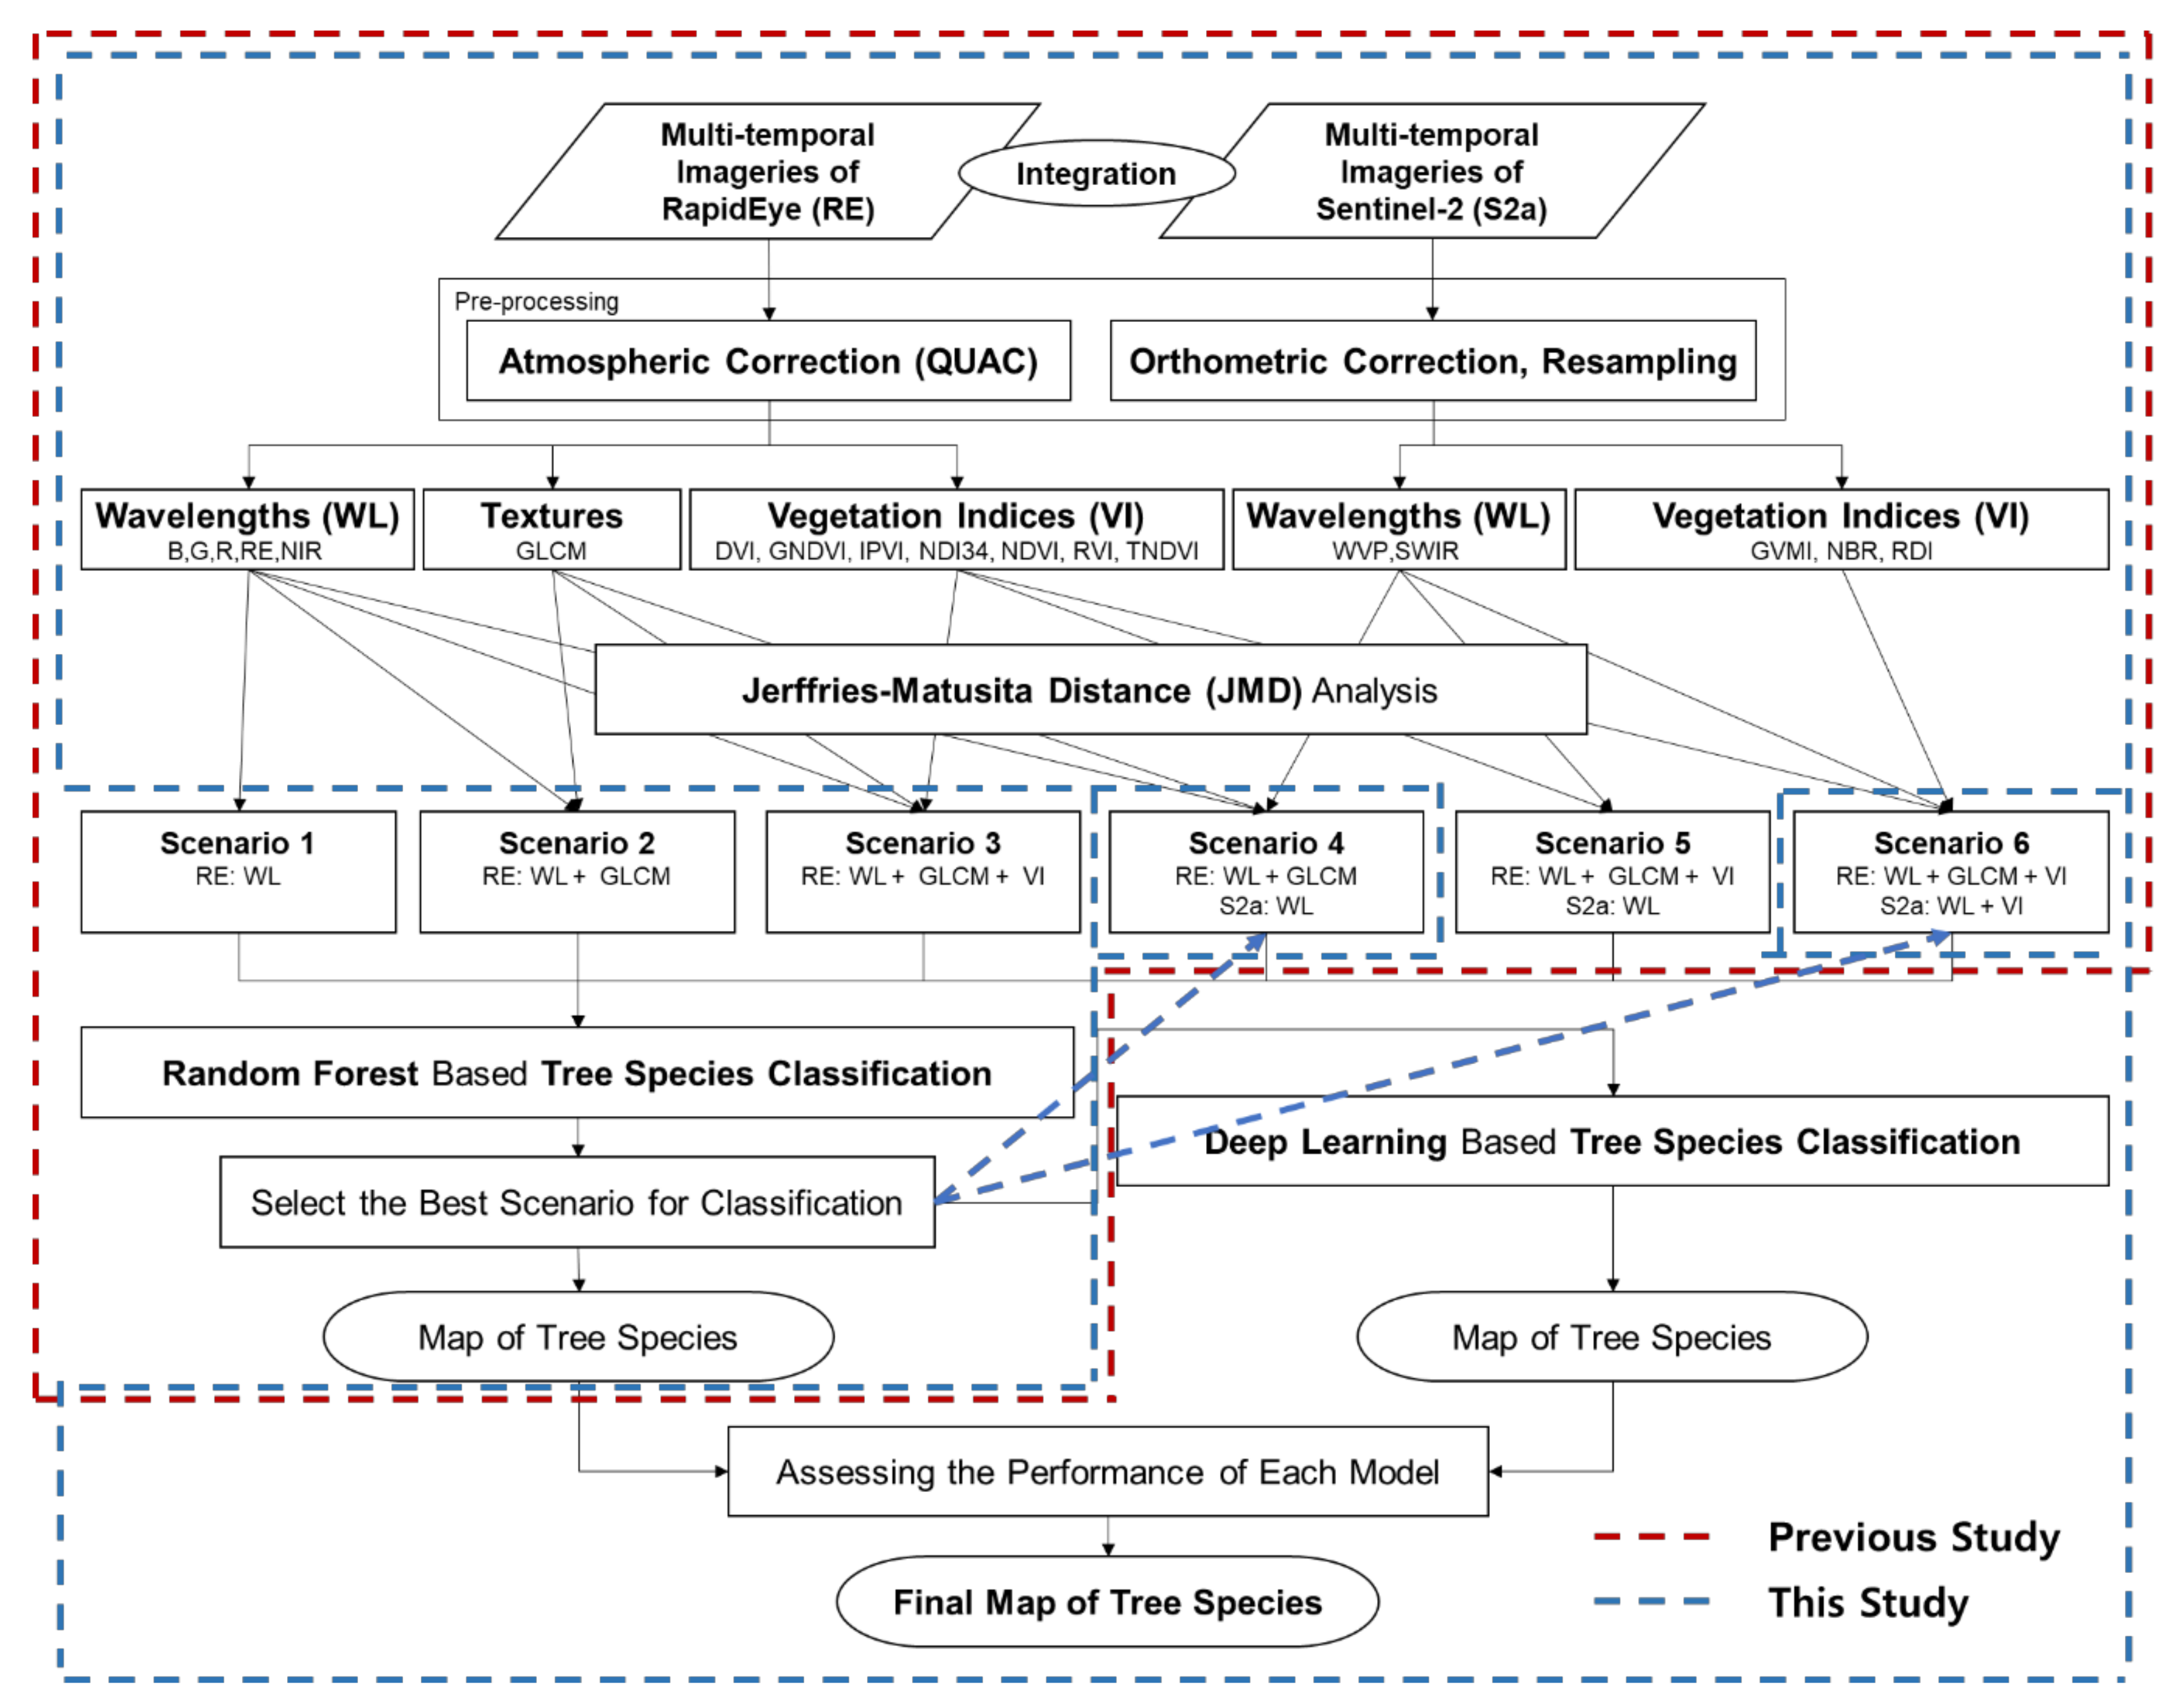
The research flow for tree species classification is illustrated in
Figure 1. The input data include pre-processed multi-temporal wavelengths from RapidEye and Sentinel-2, gray-level co-occurrence matrix (GLCM) of NIR band, and vegetation indices. The reference data were obtained from Korea Forest Service’s field survey-based forest type information, which was used to create a refined forest type map. The study evaluated the accuracy of tree species classification using different input datasets, represented by scenarios 1 to 6. Building on [
8], the results from the selected best scenarios, scenario 4 and scenario 6, were analyzed and compared for their accuracy through deep learning. The scenarios 1 to 6 represent different combinations of input data as follows (* RE: RapidEye; S2: Sentinel-2, P: previous study, T: this study):
- -
(P) Scenario 1: wavelengths of RE
- -
(P) Scenario 2: wavelengths of RE, GLCM statistics
- -
(P) Scenario 3: wavelengths of RE, GLCM statistics, vegetation indices from RE
- -
(P,T) Scenario 4: wavelengths of RE and S2, GLCM statistics
- -
(P) Scenario 5: wavelengths of RE and S2, GLCM statistics, vegetation indices from RE
- -
(P,T) Scenario 6: wavelengths of RE and S2, GLCM statistics, vegetation indices from RE and S2
Figure 1.
Research flow for the study.
Figure 1.
Research flow for the study.
2.1. Study Sites
In addition to the Korea National Arboretum (KNA) located in the Gwangneung forest between Namyangju and Pocheon City in Gyeonggi Province, our research extended to include the Chuncheon area. The selection of this area was based on its high potential for the development of economic forest complexes or forest industrial parks, characterized by an active participation from local residents and favorable conditions for forest management. Specifically, the Chuncheon management complex was chosen to encompass large-scale (500 hectares or more), well-organized, and consolidated private forests with excellent forest management conditions. In this study, we compared the accuracy of tree species classification between the natural forest area of Gwangneung and the managed forest area of Chuncheon.
2.2. Input Dataset from Satellite Imageries
In order to facilitate the implementation of deep learning across different regions under consistent input data conditions, similarly to the approach employed in the study conducted by [
8], we prepared the dataset using the same input data as theirs. The dataset consisted of pre-processed satellite imagery, specifically high-resolution RapidEye and low to medium-resolution Sentinel-2 imageries. These imageries encompassed a range of spectral wavelengths, which were utilized for subsequent analysis. For the pre-processing of satellite imageries, we conducted several steps following established methodologies. First, geometric and orthometric correction were performed using a 1:5000 resolution national forest map to ensure accurate spatial alignment. Next, atmospheric correction was carried out using the quick atmospheric correction (QUAC) model, which effectively removes atmospheric interference and improves image quality. Due to the varying growth characteristics preferred by different tree species and their distinct geographic distributions, it is necessary to incorporate topographic factors that can account for these variations to perform the appropriate corrections [
14]. So, terrain correction was applied using the SCS + C technique, considering the topographic variations present in the imagery. Terrain correction was adopted based on the methodology described by [
15].
To extract meaningful features from the satellite imagery, we employed a range of techniques that encompassed both texture analysis and vegetation indices. The gray-level co-occurrence matrix (GLCM) played a pivotal role in capturing texture information by analyzing the near-infrared band, allowing us to discern spatial patterns within the imagery. In this regard, we computed seven essential GLCM statistics, namely the mean, variation, homogeneity, contrast, dissimilarity, entropy, and angular second moment. This comprehensive approach accounted for the influence of the window size utilized in generating texture information, as its selection profoundly impacts the accuracy of tree species classification [
16,
17,
18]. In addition to the GLCM, we calculated a diverse set of widely recognized vegetation indices. These indices included the difference vegetation index (DVI), green normalized difference vegetation index (GNDVI), infrared percentage vegetation index (IPVI), normalized difference index using band 3 and 4 (NDI34), normalized difference vegetation index (NDVI), ratio vegetation index (RVI), transformed normalized difference vegetation index (TNDVI), global vegetation moisture index (GVMI), normalized burn ratio (NBR), and simple MIR/NIR ratio drought index (RDI) [
19,
20,
21,
22,
23,
24,
25,
26,
27,
28]. By leveraging these indices, we gained insights into critical vegetation attributes such as density, health, and moisture content, all of which play a pivotal role in tree species classification and effective forest management.
It is important to note that detailed descriptions of the preprocessing methods can be found in the study by [
8], serving as a comprehensive reference for the applied techniques. The utilization of this consistent dataset allows for a standardized comparison and evaluation of tree species classification accuracy across the natural forest of Gwangneung area and the managed forest of Chuncheon area, contributing to a deeper understanding of the potential applications of deep learning in forest management complexes. The detailed information of input datasets is in
Table 1.
The Jeffries–Matusita Distance (JMD) serves as a valuable measure for assessing the dissimilarity between selected independent variables within a deep learning model. Ranging from 0 (indicating identical distributions) to 1.414 (representing complete dissimilarity), JMD is frequently employed to quantify the degree of separation [
29,
30,
31]. In our study, all of the independent variables used exhibited a significantly high degree of separation across the various indices. This observation affirms their suitability for a robust model evaluation and underscores their effectiveness in capturing distinct patterns and features within the dataset.
2.3. Referrence Dataset from Field Based Refined Forest Type Map
The primary data source for tree species classification in this study was the forest type map, a widely utilized forest map in South Korea. The forest type map provides comprehensive information on attributes such as tree type, species, diameter, age, and crown density. Produced on a national scale by Korea Forest Service (KFS), it serves as a national forest type map for forest management purposes. The forest type map used in this study was surveyed in the field from 2006 to 2019 and served as the ground truth for validating the tree species classification performed by the deep learning model. To ensure accuracy, the forest type map was examined at the stand level and underwent meticulous corrections based on field information. Field surveys were conducted on trees with a diameter at breast height (DBH) of 6 cm or higher, focusing on major tree species and species with significant presence. The standard plot size for the surveys was 0.04 hectares (20 m × 20 m), and over 800 sample plots were carefully selected to represent the tree species composition observed during the precise field survey.
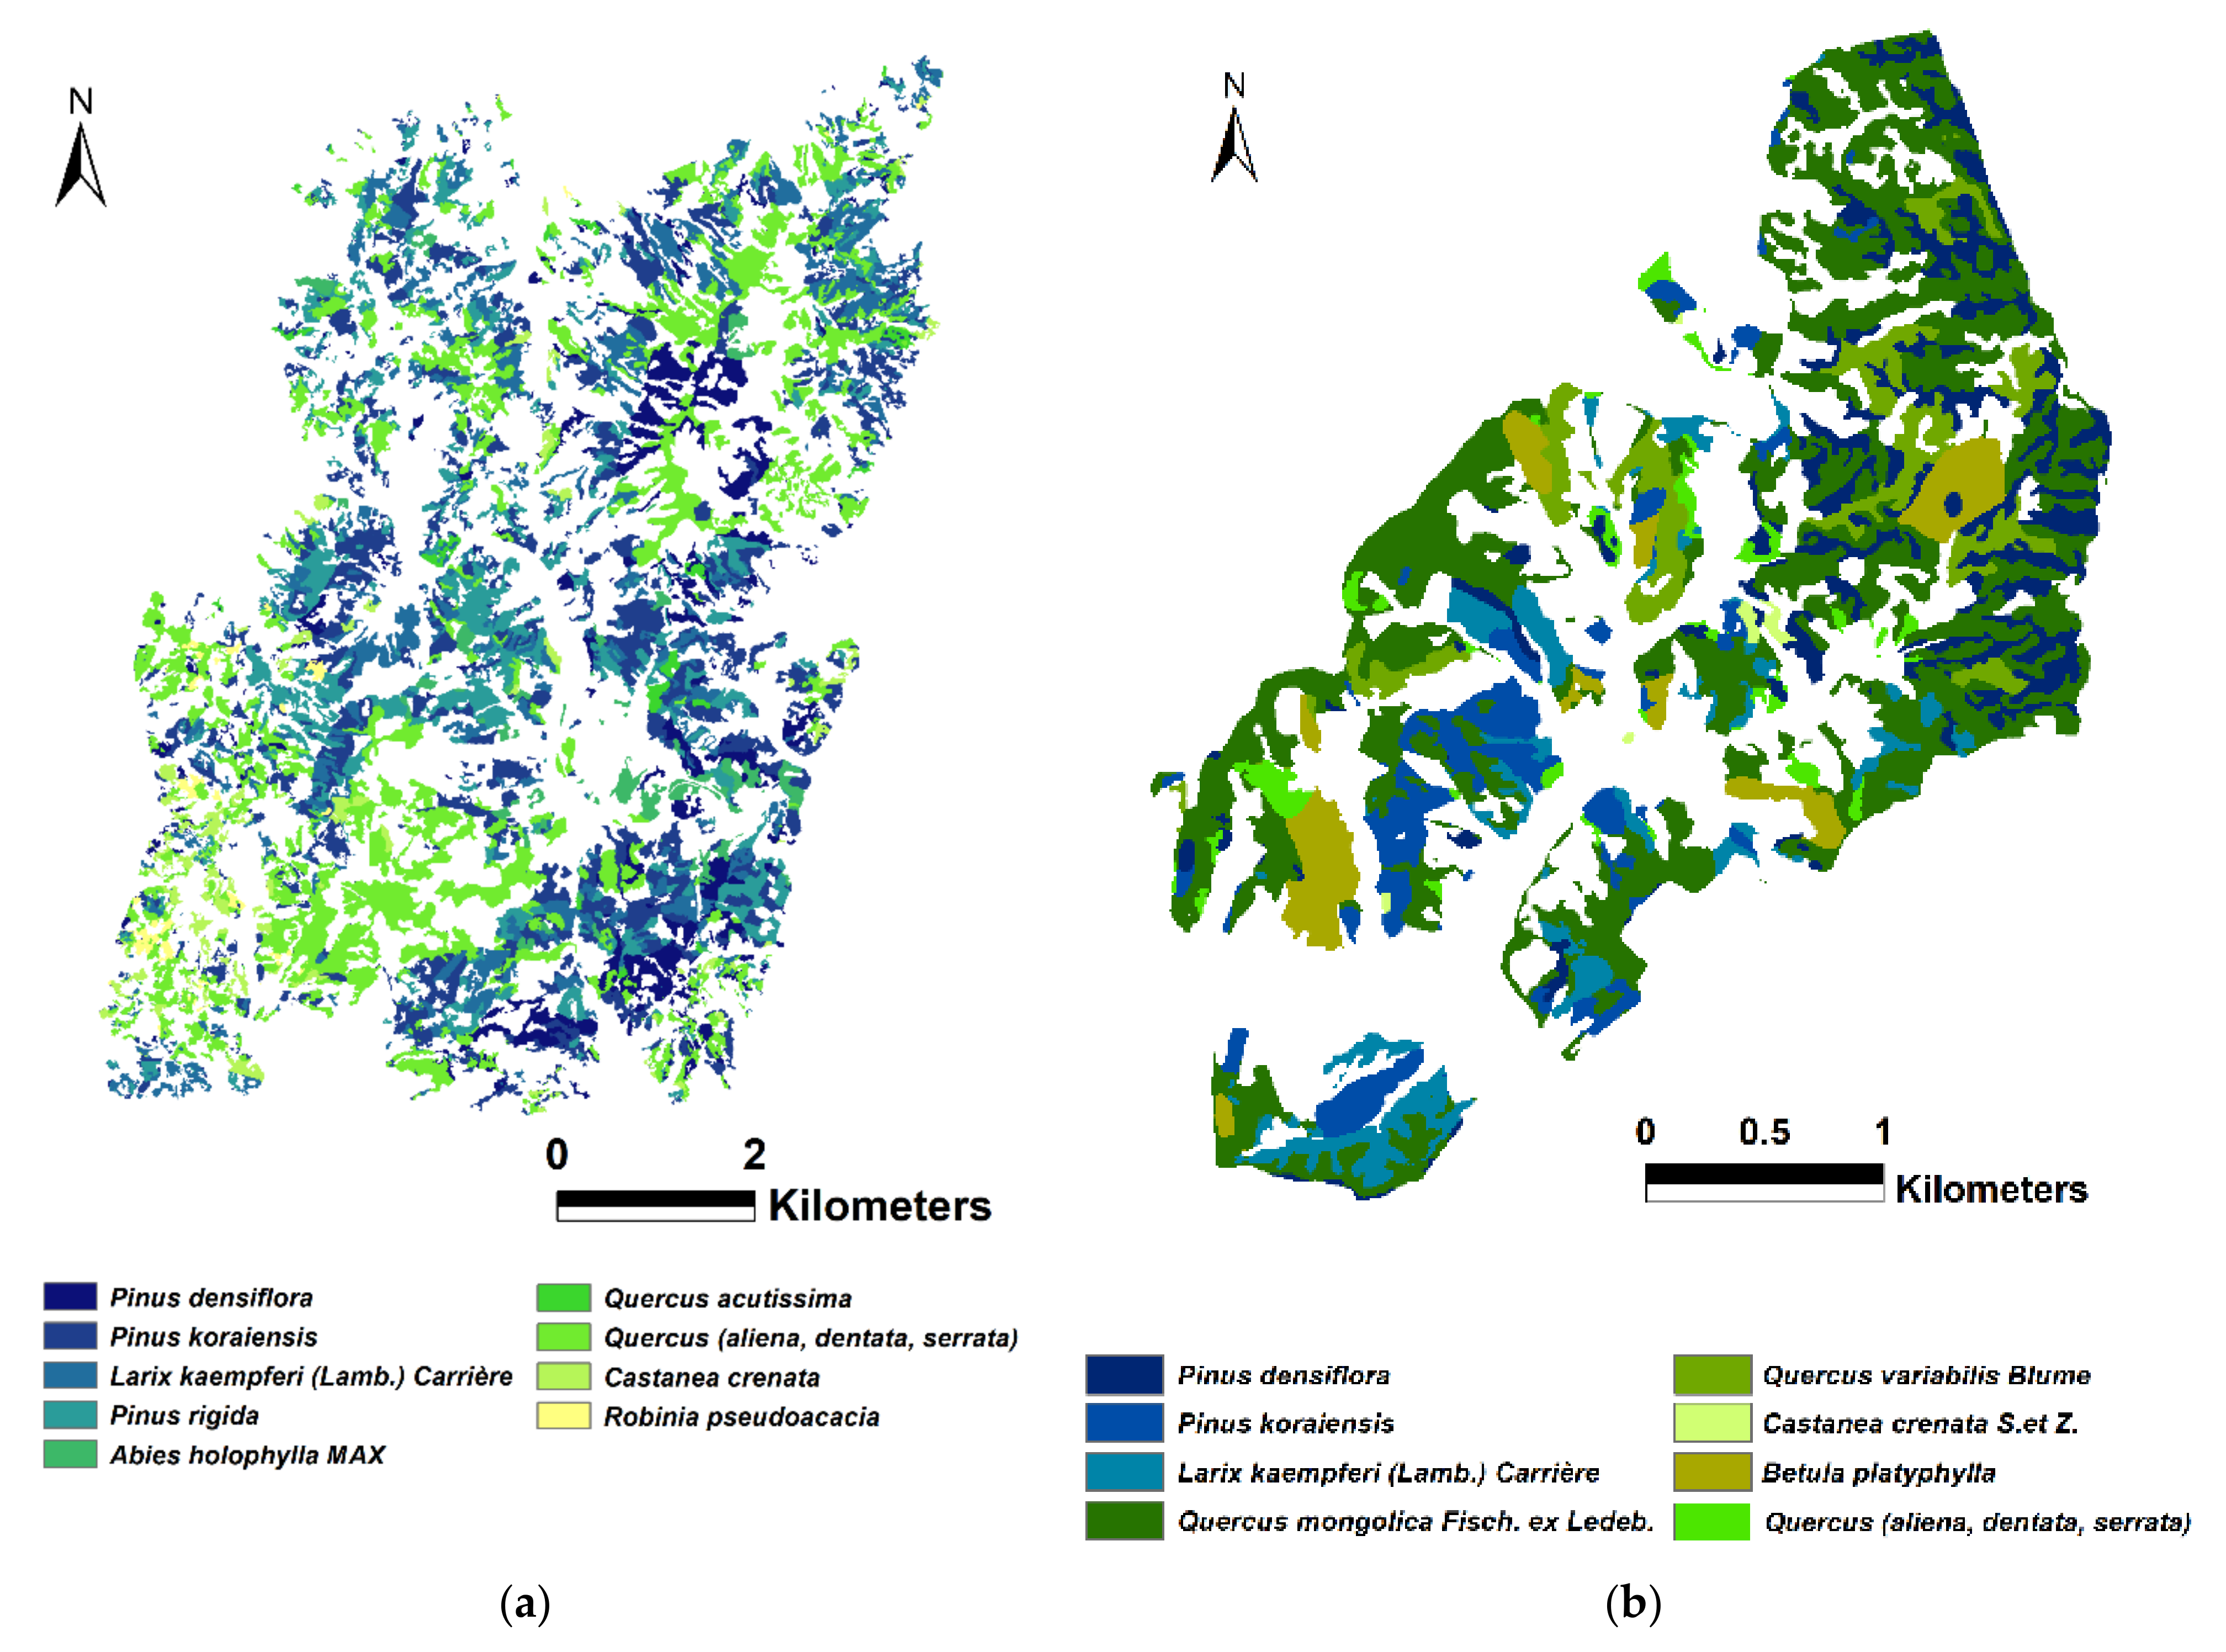
The temperate forest, specifically the Gwangneung region, predominantly consists of nine tree species: P. densiflora, P. koraiensis, L. kaempferi, Pinus rigida, A. holophylla, Quercus acutissima, Quercus (aliena, dentata, serrata), C. crenata, and R. pseudoacacia. These species collectively cover an area of 28,200 hectares within the Gwangneung region. Notably, P. densiflora occupies 2702 hectares (9.58%), P. koraiensis covers 6682 hectares (23.70%), L. kaempferi covers 4063 hectares (14.41%), P. rigida covers 4342 hectares (15.40%), A. holophylla covers 786 hectares (2.79%), Q. acutissima covers 296 hectares (1.05%), Quercus (aliena, dentata, serrata) covers 8309 hectares (29.46%), C. crenata covers 840 hectares (2.98%), and R. pseudoacacia covers 180 hectares (0.64%).
In the Chuncheon region, the temperate forest cover primarily comprises eight tree species:
P. densiflora,
P. koraiensis,
L. kaempferi,
Quercus mongolica,
Quercus variabilis,
Castanea crenata,
Betula platyphylla, and
Quercus (
aliena,
dentata,
serrata). These species collectively occupy an area of 590 hectares within the Chuncheon region. Notably,
P. densiflora covers 82 hectares (13.90%),
P. koraiensis covers 51 hectares (8.64%),
L. kaempferi covers 47 hectares (7.97%),
Quercus mongolica covers 291 hectares (49.32%),
Quercus variabilis covers 54 hectares (9.15%),
Castanea crenata covers 6 hectares (1.02%),
Betula platyphylla covers 40 hectares (6.78%), and
Quercus (aliena, dentata, serrata) covers 19 hectares (3.22%). It is worth mentioning that the selected tree species in Gwangneung and Chuncheon regions used in this study collectively represent over 90% of the total forest area found throughout South Korea [
32].
2.4. Architecture of Convolutional Neural Networks (CNNs) for Tree Species Classification
Deep learning algorithms utilize artificial neural networks to perform “end-to-end” learning, where the computer autonomously extracts the necessary features for data analysis. This stands in contrast to traditional machine learning techniques that require researchers to manually understand data characteristics and extract features. As the amount and complexity of data used for analysis increase, the strength of end-to-end deep learning is maximized.
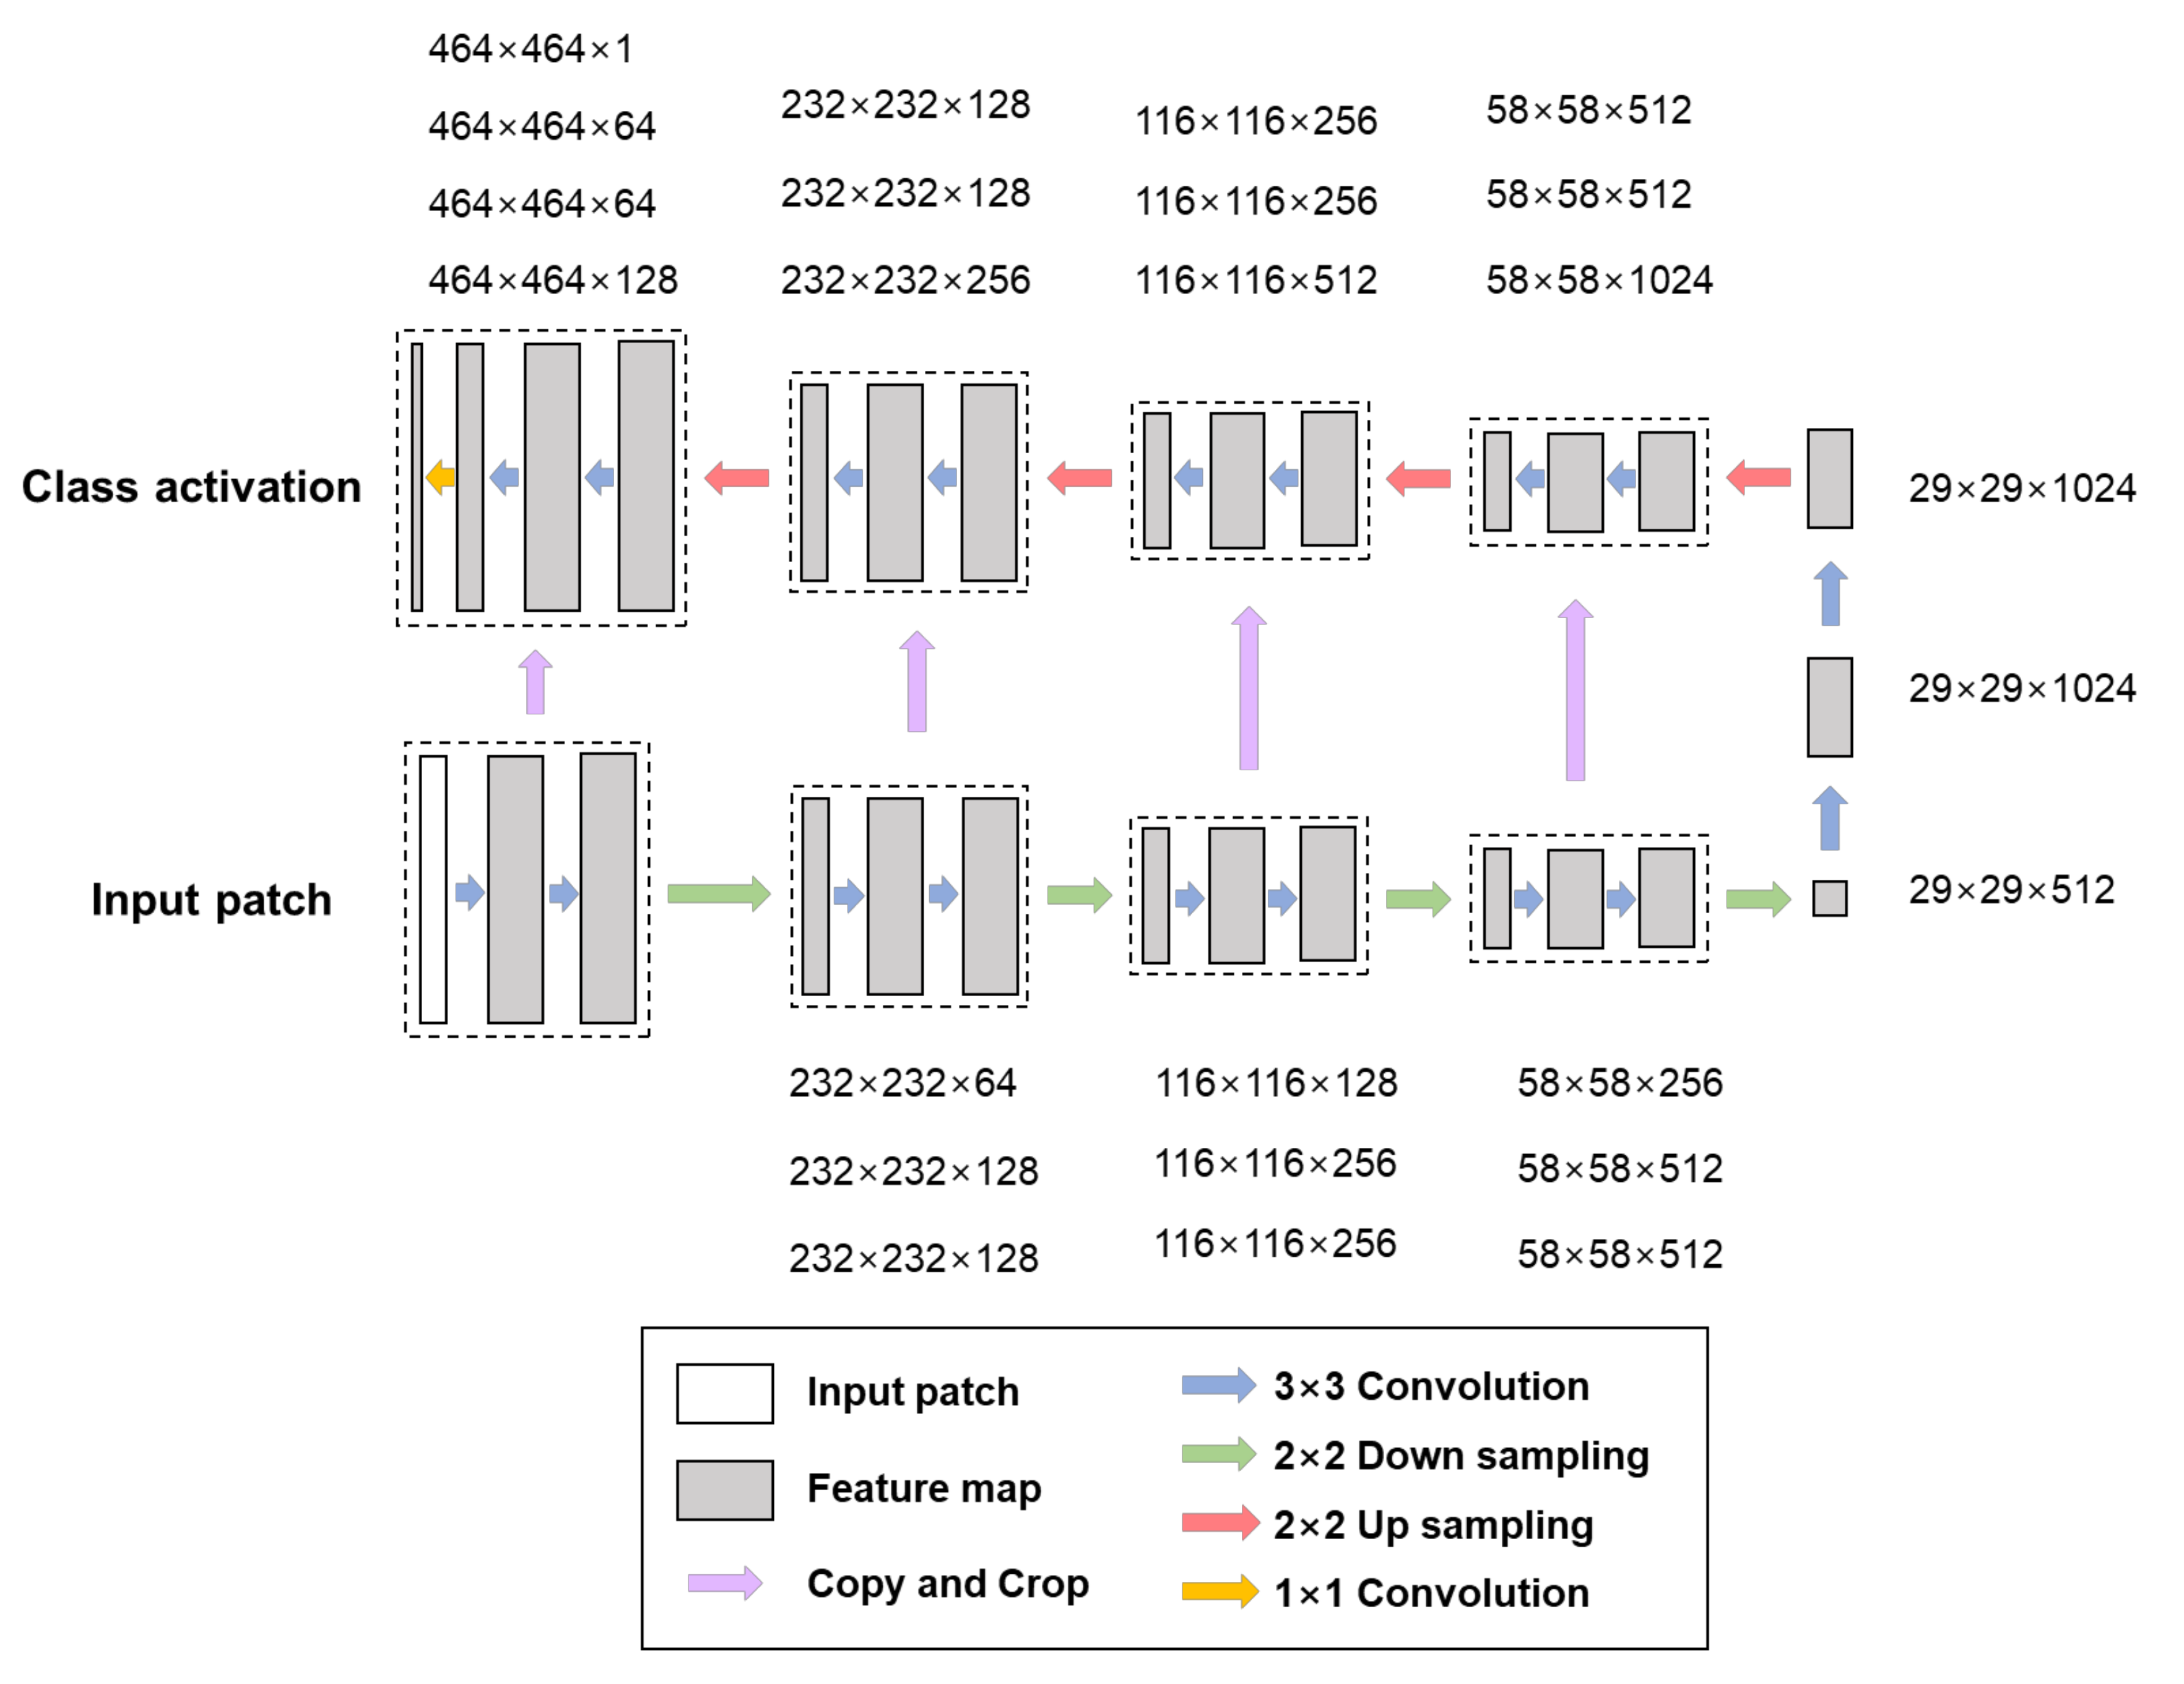
U-net is a convolutional neural network architecture that is an extension of the CNNs architecture with minor modifications. It not only performs classification but also incorporates the segmentation technique, allowing for the delineation of the corresponding boundaries of the classification target [
33].
Figure 2 illustrates the network architecture, depicting how the model processes a single patch. The U-Net architecture is designed for a single-class training workflow for explanatory purposes. It consists of five levels and 27 convolutional layers, with each level representing a different pixel resolution of the model. The architecture comprises a contracting path and an expansive path. The contracting path follows the conventional architecture of a convolutional network, involving the repeated application of two 3 × 3 convolutions, each followed by a rectified linear unit (ReLU), and a 2 × 2 max pooling operation with stride 2 for downsampling. At each downsampling step, the number of feature channels is doubled. In the expansive path, each step involves upsampling the feature map, followed by a 2 × 2 convolution that halves the number of feature channels. This is followed by concatenation with the corresponding cropped feature map from the contracting path, two 3 × 3 convolutions, each followed by a ReLU. Cropping is necessary to account for the loss of border pixels in each convolution. The final layer employs a 1 × 1 convolution to map each component feature vector to the desired number of classes. The output is a class activation raster, which is then converted into a mask and compared to the mask band of the label raster. In general, when performing machine learning, the initial learning rate is set differently, considering the size of the target area and the resolution of the input data. Research is being conducted to determine the optimal learning rate, as demonstrated by [
34]. However, to objectively determine the appropriate learning rate for accurate modeling depending on the detection target and the target area, separate analysis is required. The training and the validation and testing areas were divided into sizes of 70% and 30%, respectively, in relation to the total study area.
2.5. Accuracy Assessment for CNNs Model
To assess the accuracy of tree species classification, True Positive (
TP), True Negative (
TN), False Positive (
FP), and False Negative (
FN) were calculated. TP represents the areas where the forest type map and the CNNs model both correctly identify the same tree species.
FN represents the cases where the forest type map and the CNNs model both incorrectly identify different tree species compared to the reference data. Using
TP,
TN,
FP, and
FN values, accuracy, precision, recall,
f1
score, and Intersection over Union (
IoU) were computed (Equations (1)–(5)).
Accuracy, although it can be overly reliant on the accuracy of a specific class due to imbalances in the input data, measures the overall correctness of the classification. Precision represents the performance of the model in correctly identifying the relevant objects, while recall represents the model’s ability to find all relevant instances. By averaging these metrics, their dependency on specific classes is reduced. The f1 score is designed to prevent accuracy from being inflated by high values of either precision or recall. It is the harmonic mean of precision and recall [
35]. Additionally,
IoU calculates the ratio of overlapping regions to the total area and serves as a metric to determine the success of detecting individual objects in object detection tasks [
36].
3. Results
3.1. CNNs-Based Tree Species Classification Using Multi-Temporally Integrated Satellite Imageries
Scenarios 4 and 6, which showed the highest accuracy in previous study using the random forest model [
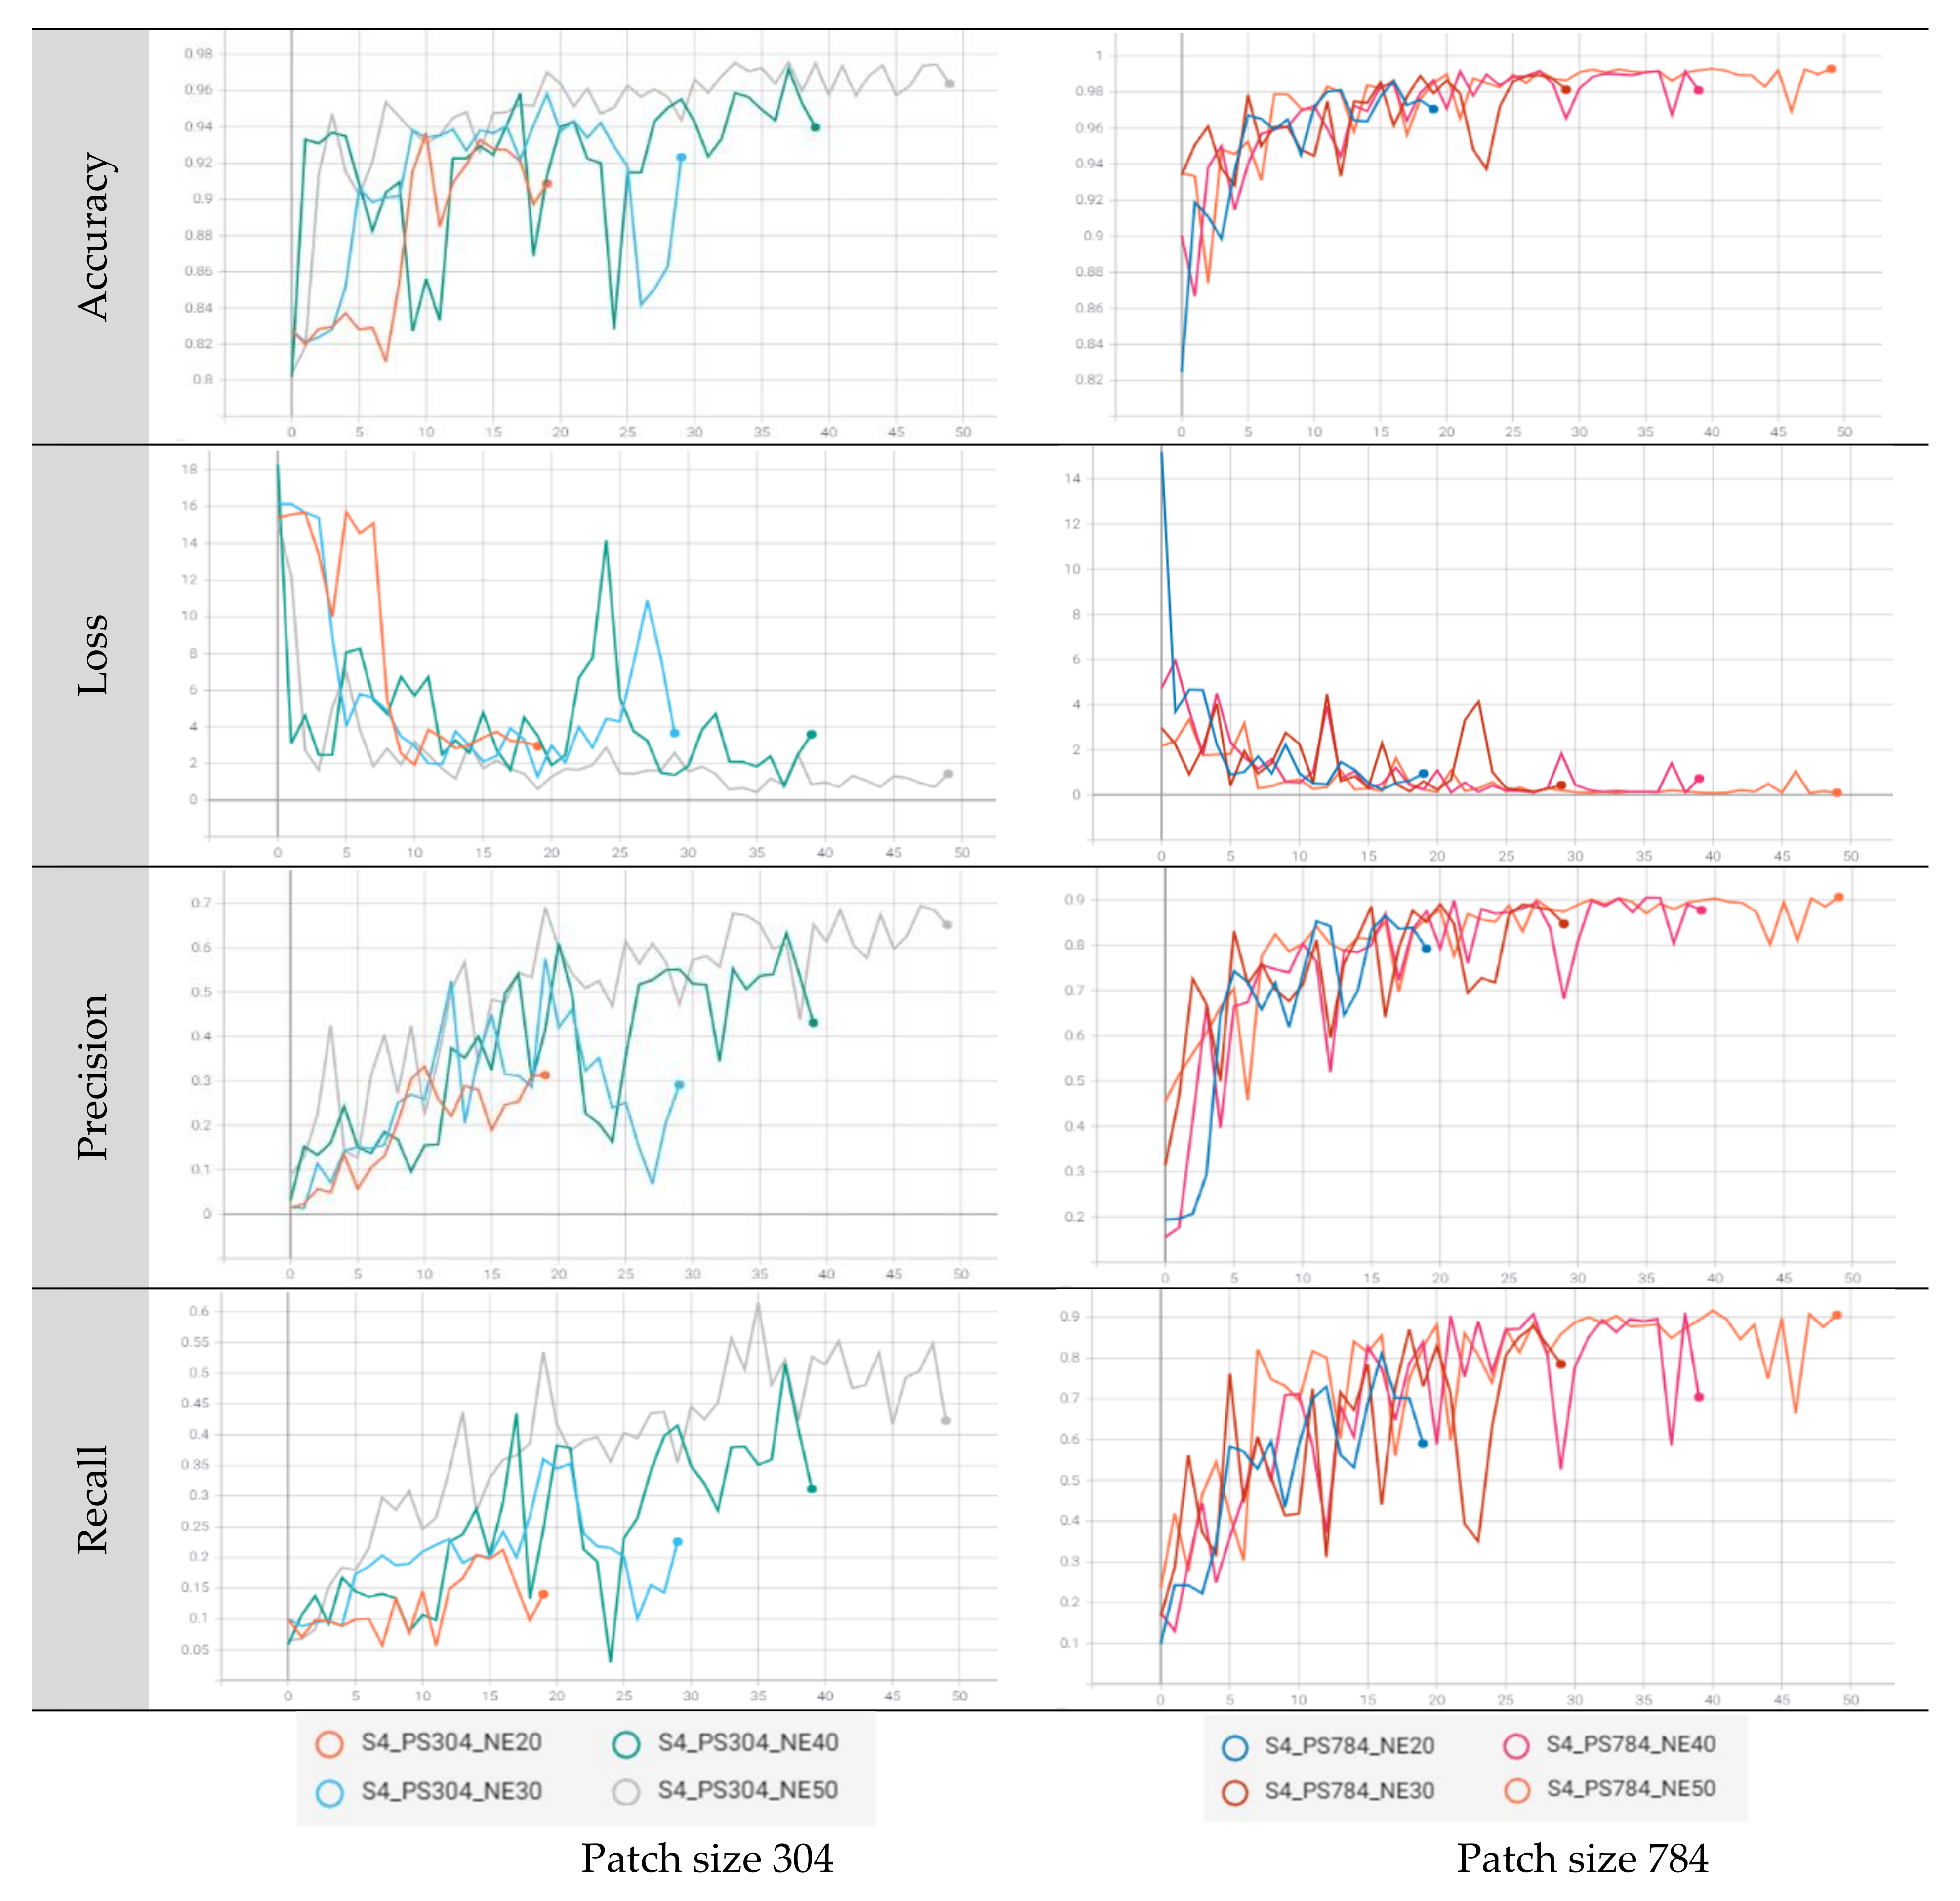
8], were selected for tree species classification by running U-net- based convolutional neural networks (CNNs). To perform tree species classification under the optimal conditions, CNNs were operated by adjusting each parameter. The patch size was compared by setting it to 304 × 304 and 784 × 784, considering the size of the study area and the spatial resolution of satellite imageries, and the epoch was run up to 50 times from 20 in increments of 10. The patches per image were increased from 100 in consideration of the epoch and executed up to a value of 250. The blur distance ranged from a minimum of 1 to a maximum of 8, class weights ranged from a minimum of 0 to a maximum of 3, and a loss weight of 0.5 was set considering the characteristics of the forests and the resolution of the satellite imageries. Through 72 experiments, in which each parameter was adjusted, it was confirmed that there was a variability in accuracy of less than 1% at most, regardless of how much the other parameters were adjusted within the range, except for the patch size and epoch.
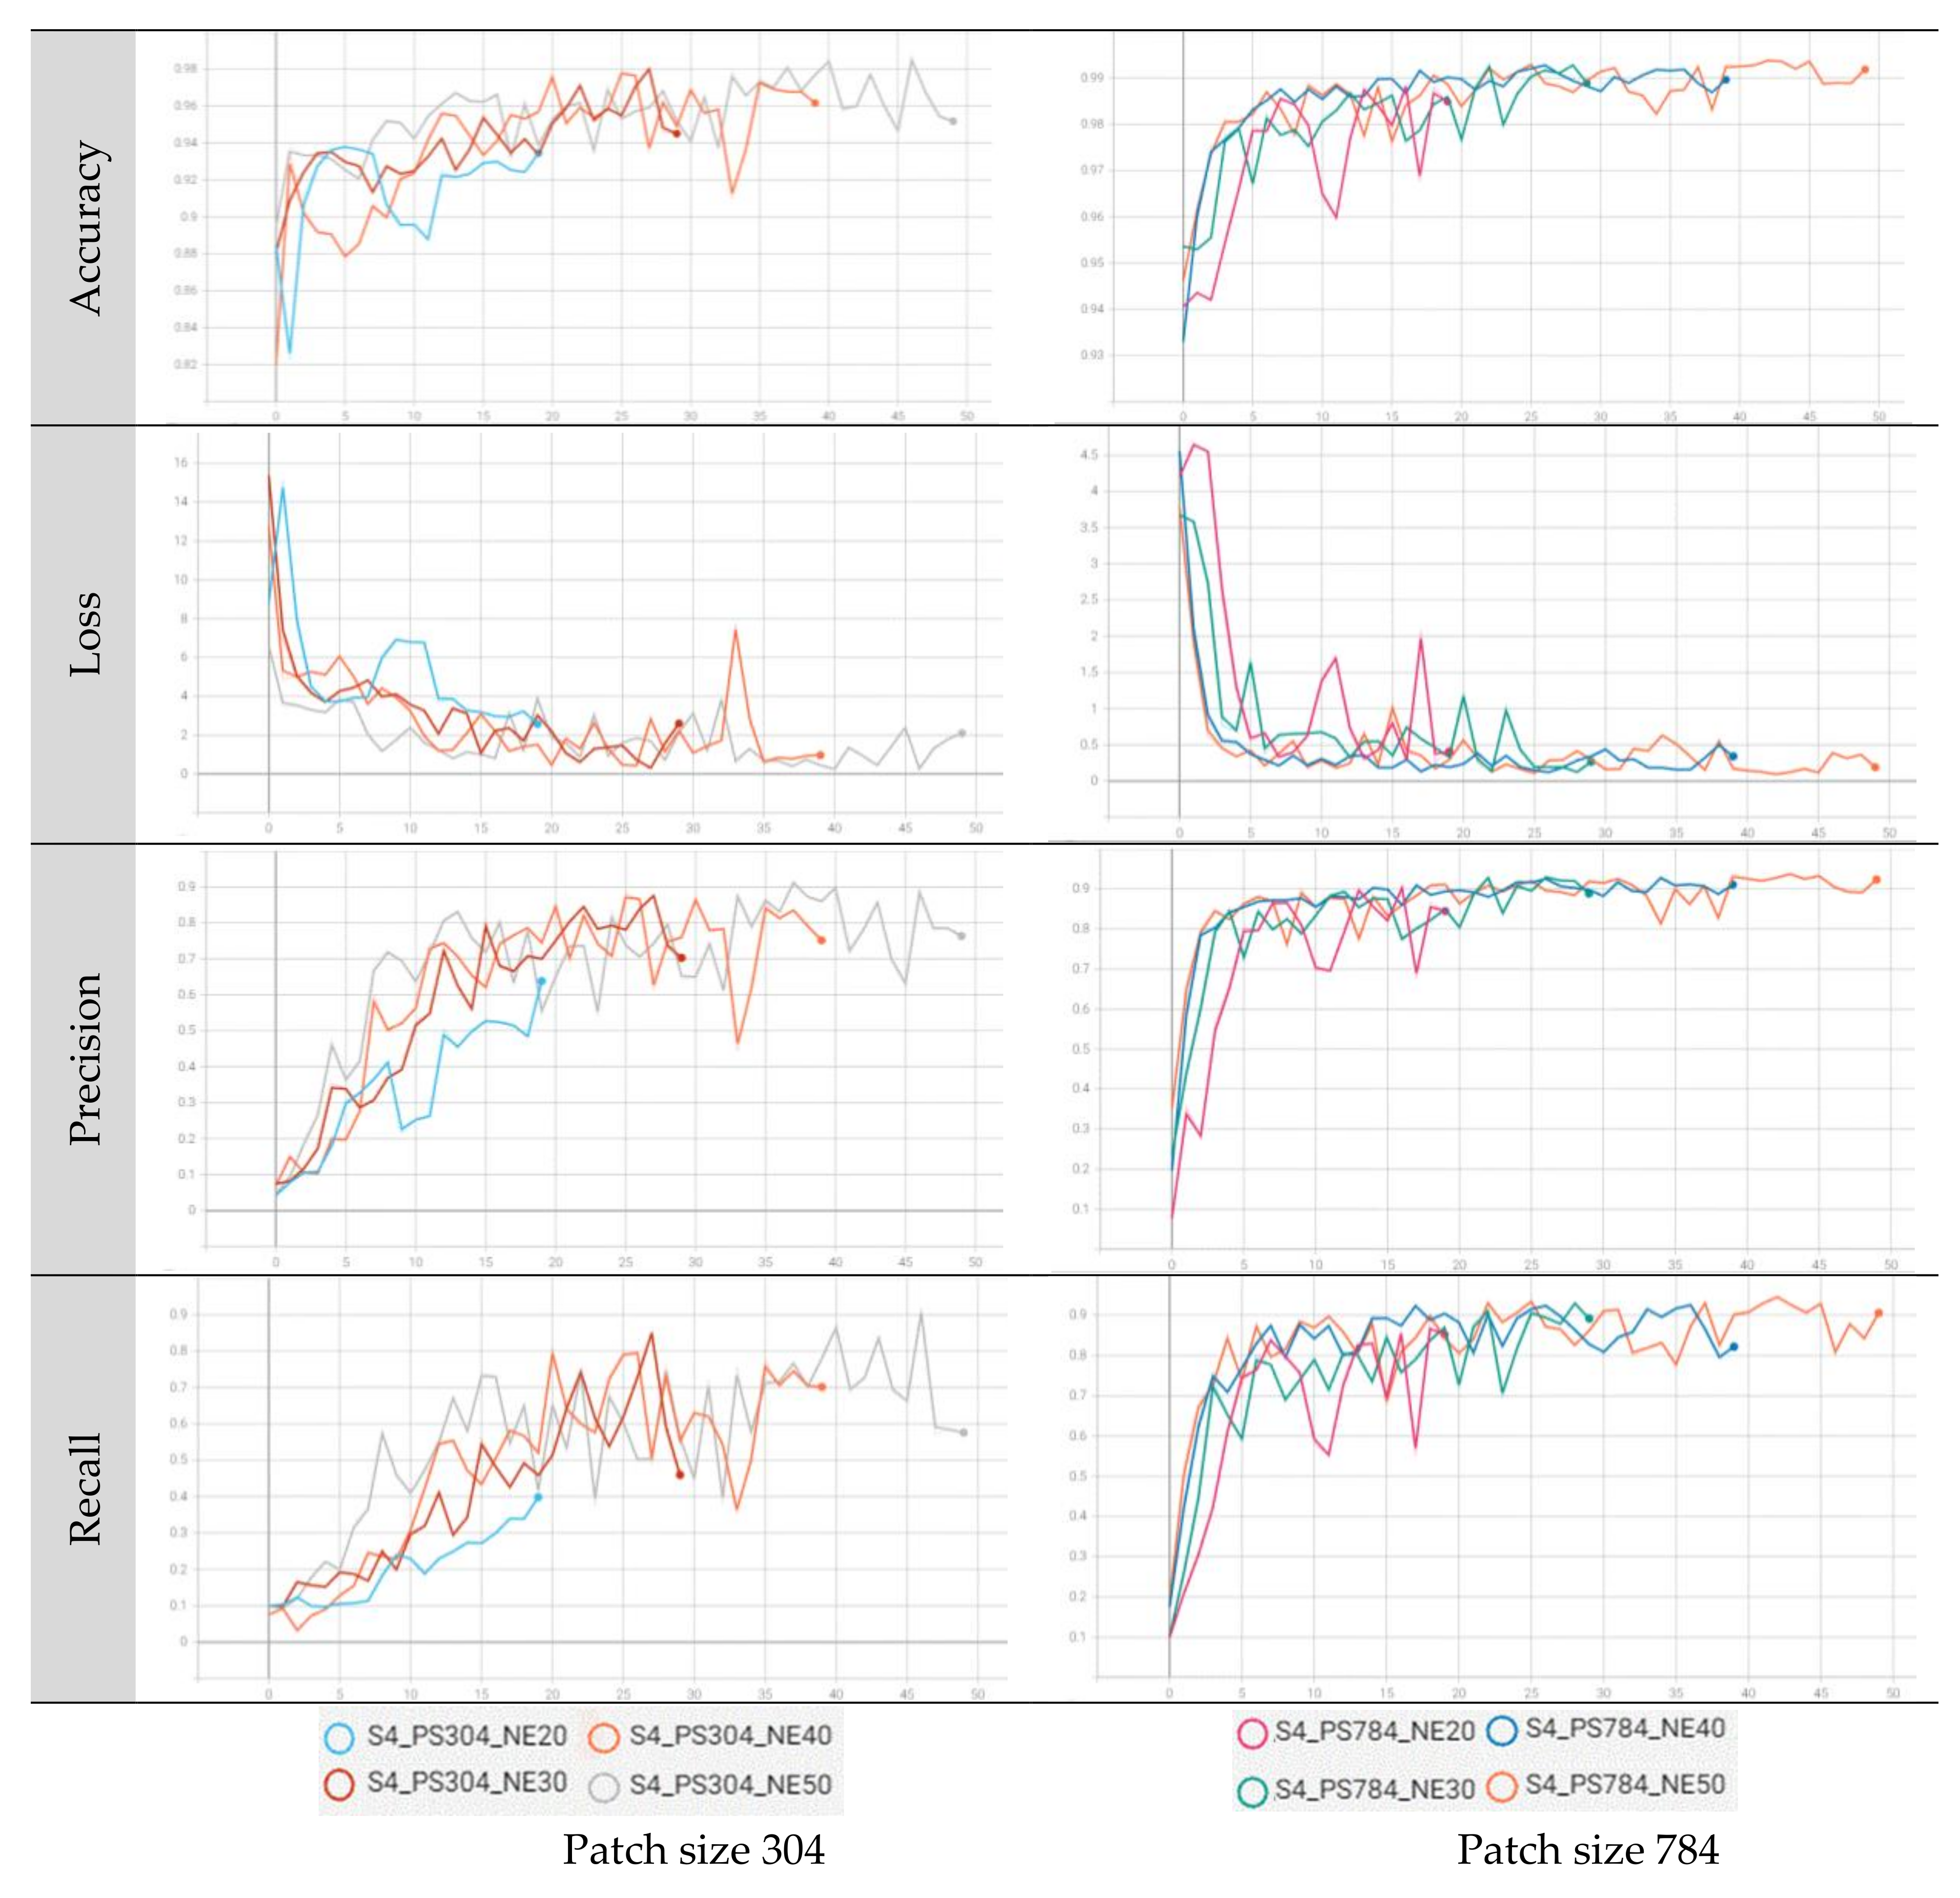
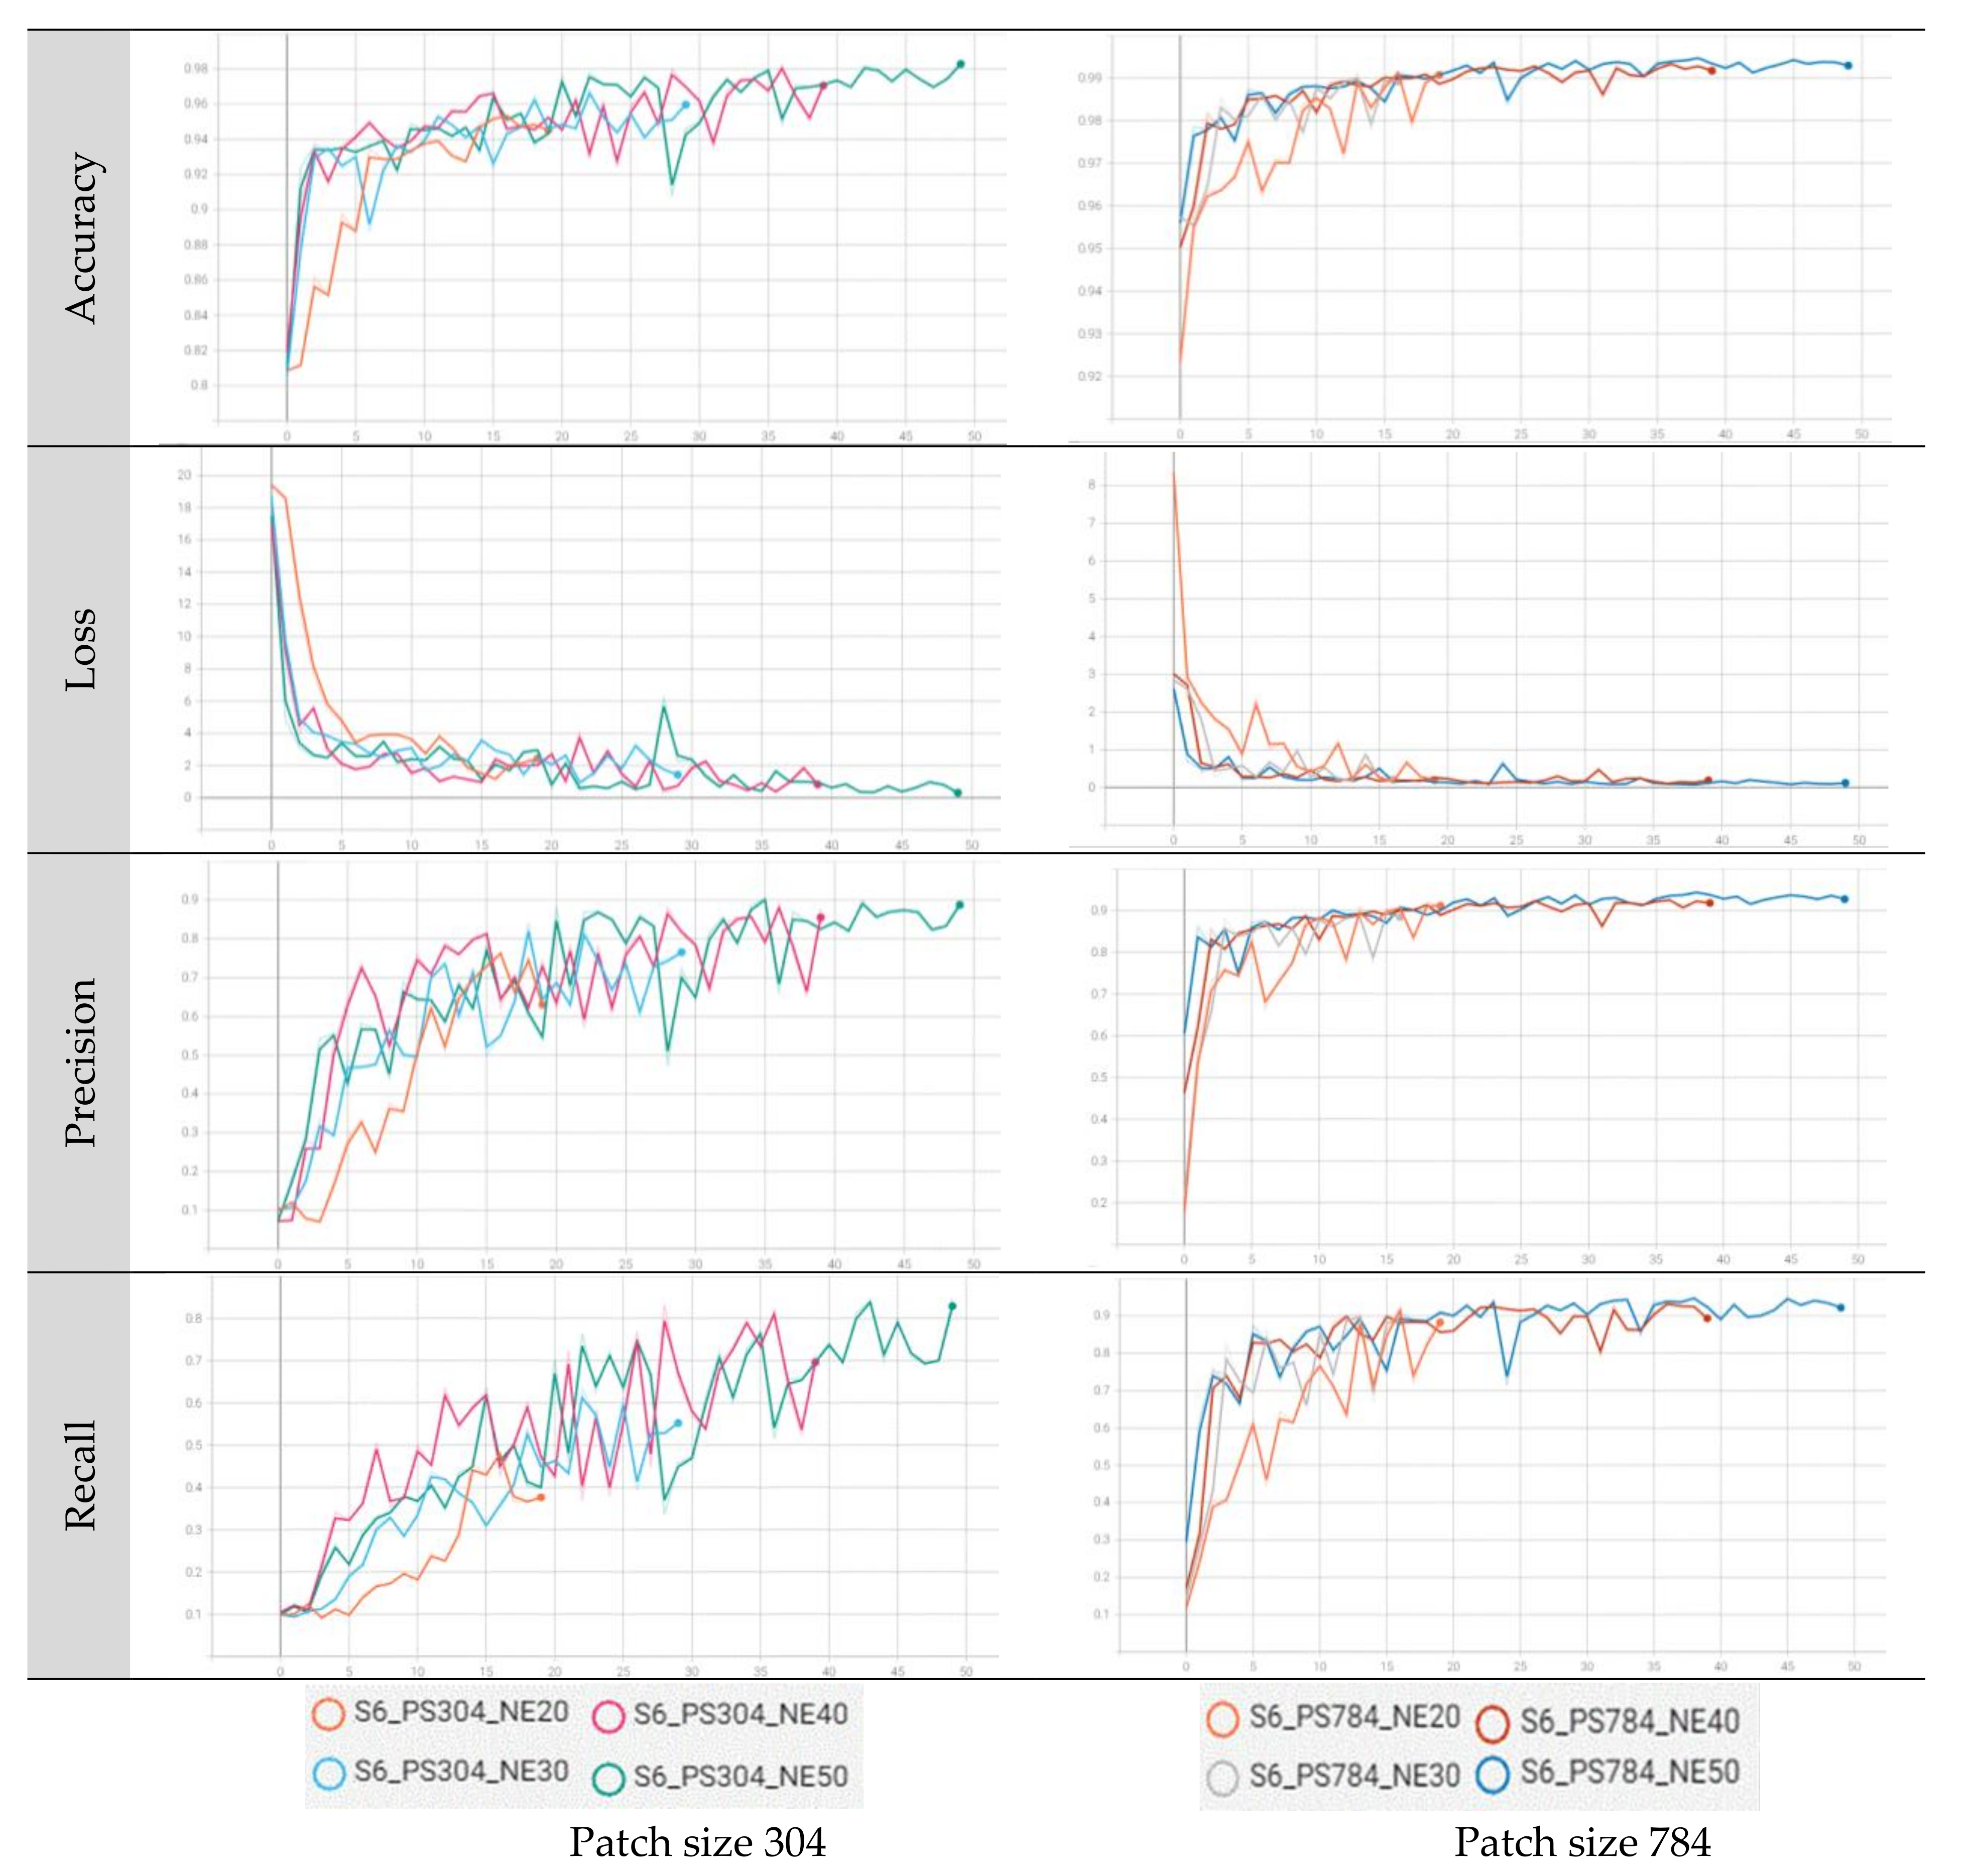
The precision, which is the user accuracy of the batch and epoch statistics, indicates how well the training is performed. In both scenarios 4 and 6, the training user accuracy was the highest, with a value of over 87% in a patch size of 784 with epoch 50 in Gwangneung and Chuncheon regions. In both regions, it was observed that when the patch size was set to 304, the learning rate of CNNs was relatively slow in terms of batch and epoch accuracy, precision, and recall. Additionally, the loss value decreased unstably, confirming that the patch size was not large enough to perform the classification (
Figure A1,
Figure A2,
Figure A3 and
Figure A4). This means that a patch size of 304 is not sufficient to describe the combinations of the input dataset utilized in this study. However, when the patch size was 784, it was confirmed that training was rapidly performed in a batch size of less than 1000 and with epoch 5. It appears that various data augmentation methods, such as rotation and flip, were performed at an appropriate patch size.
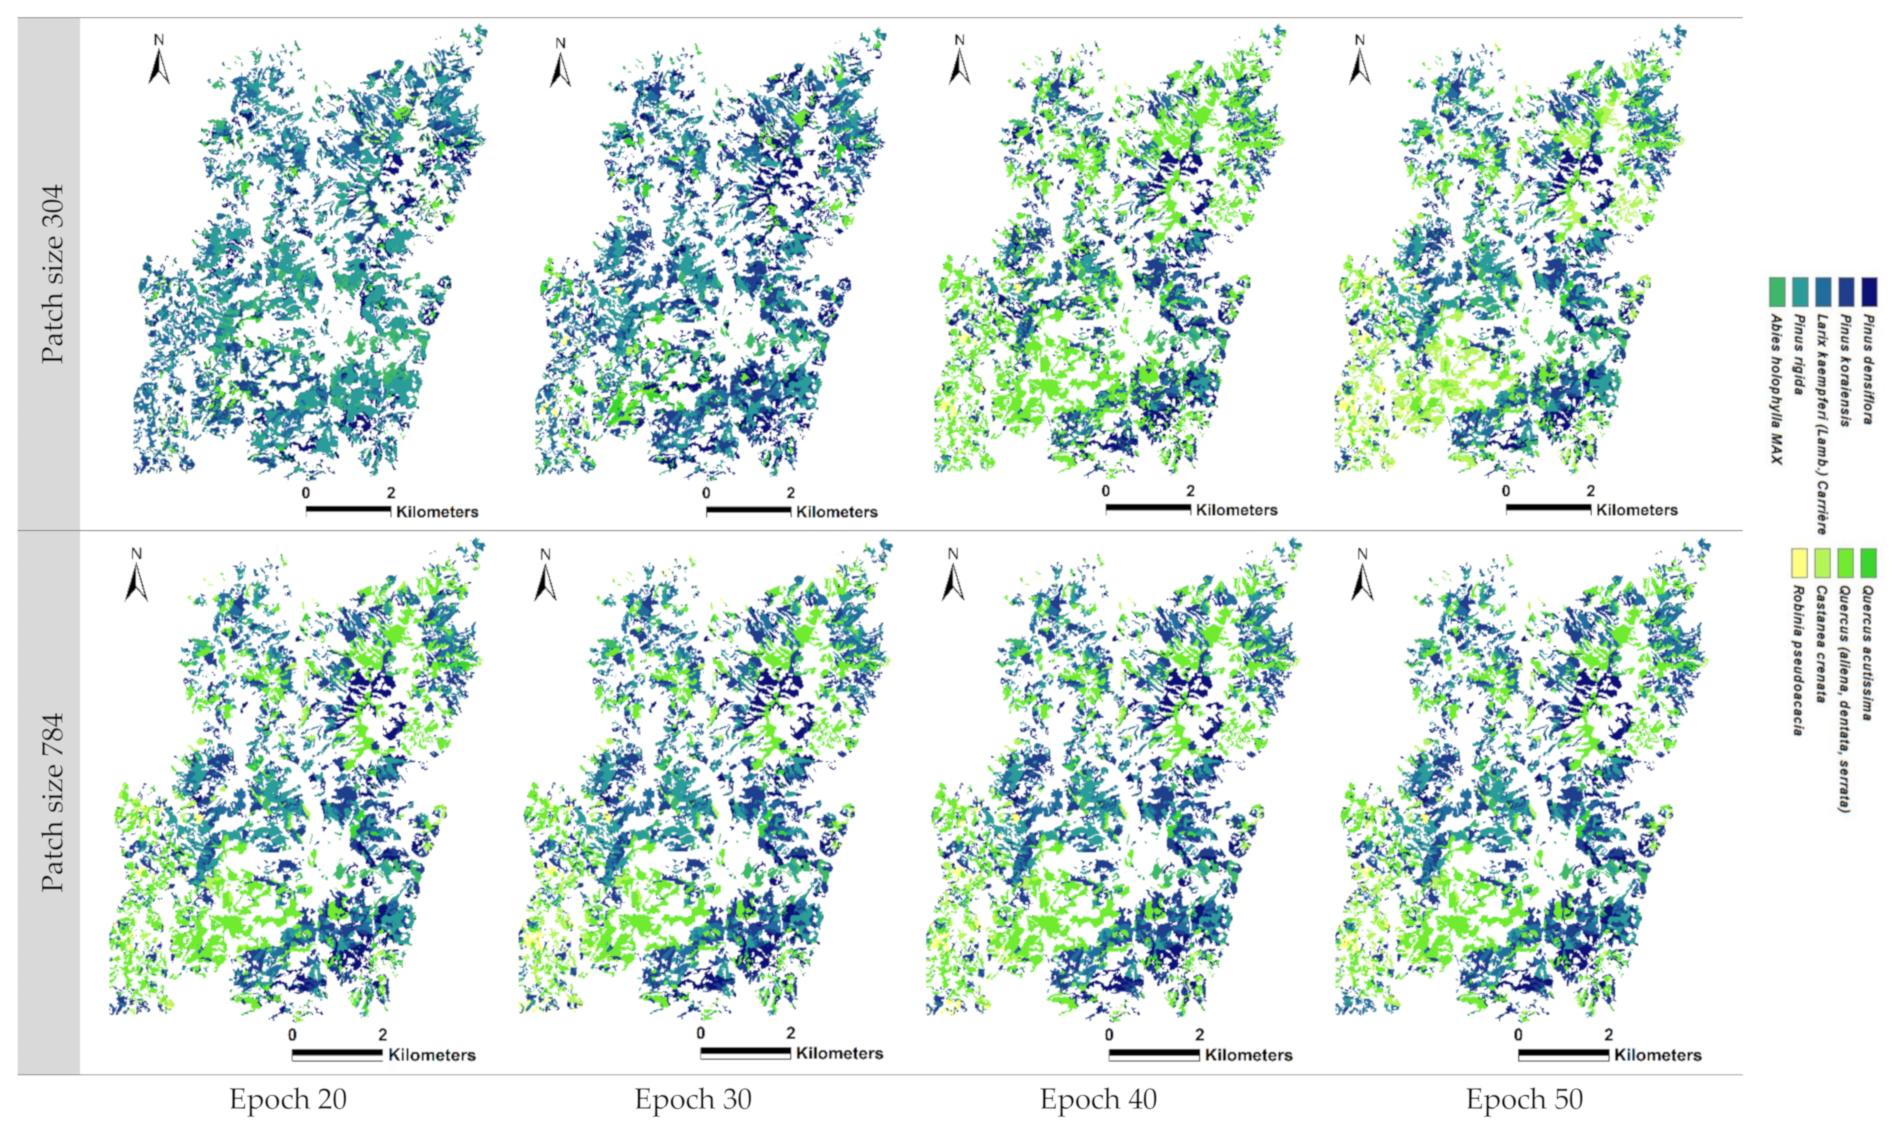
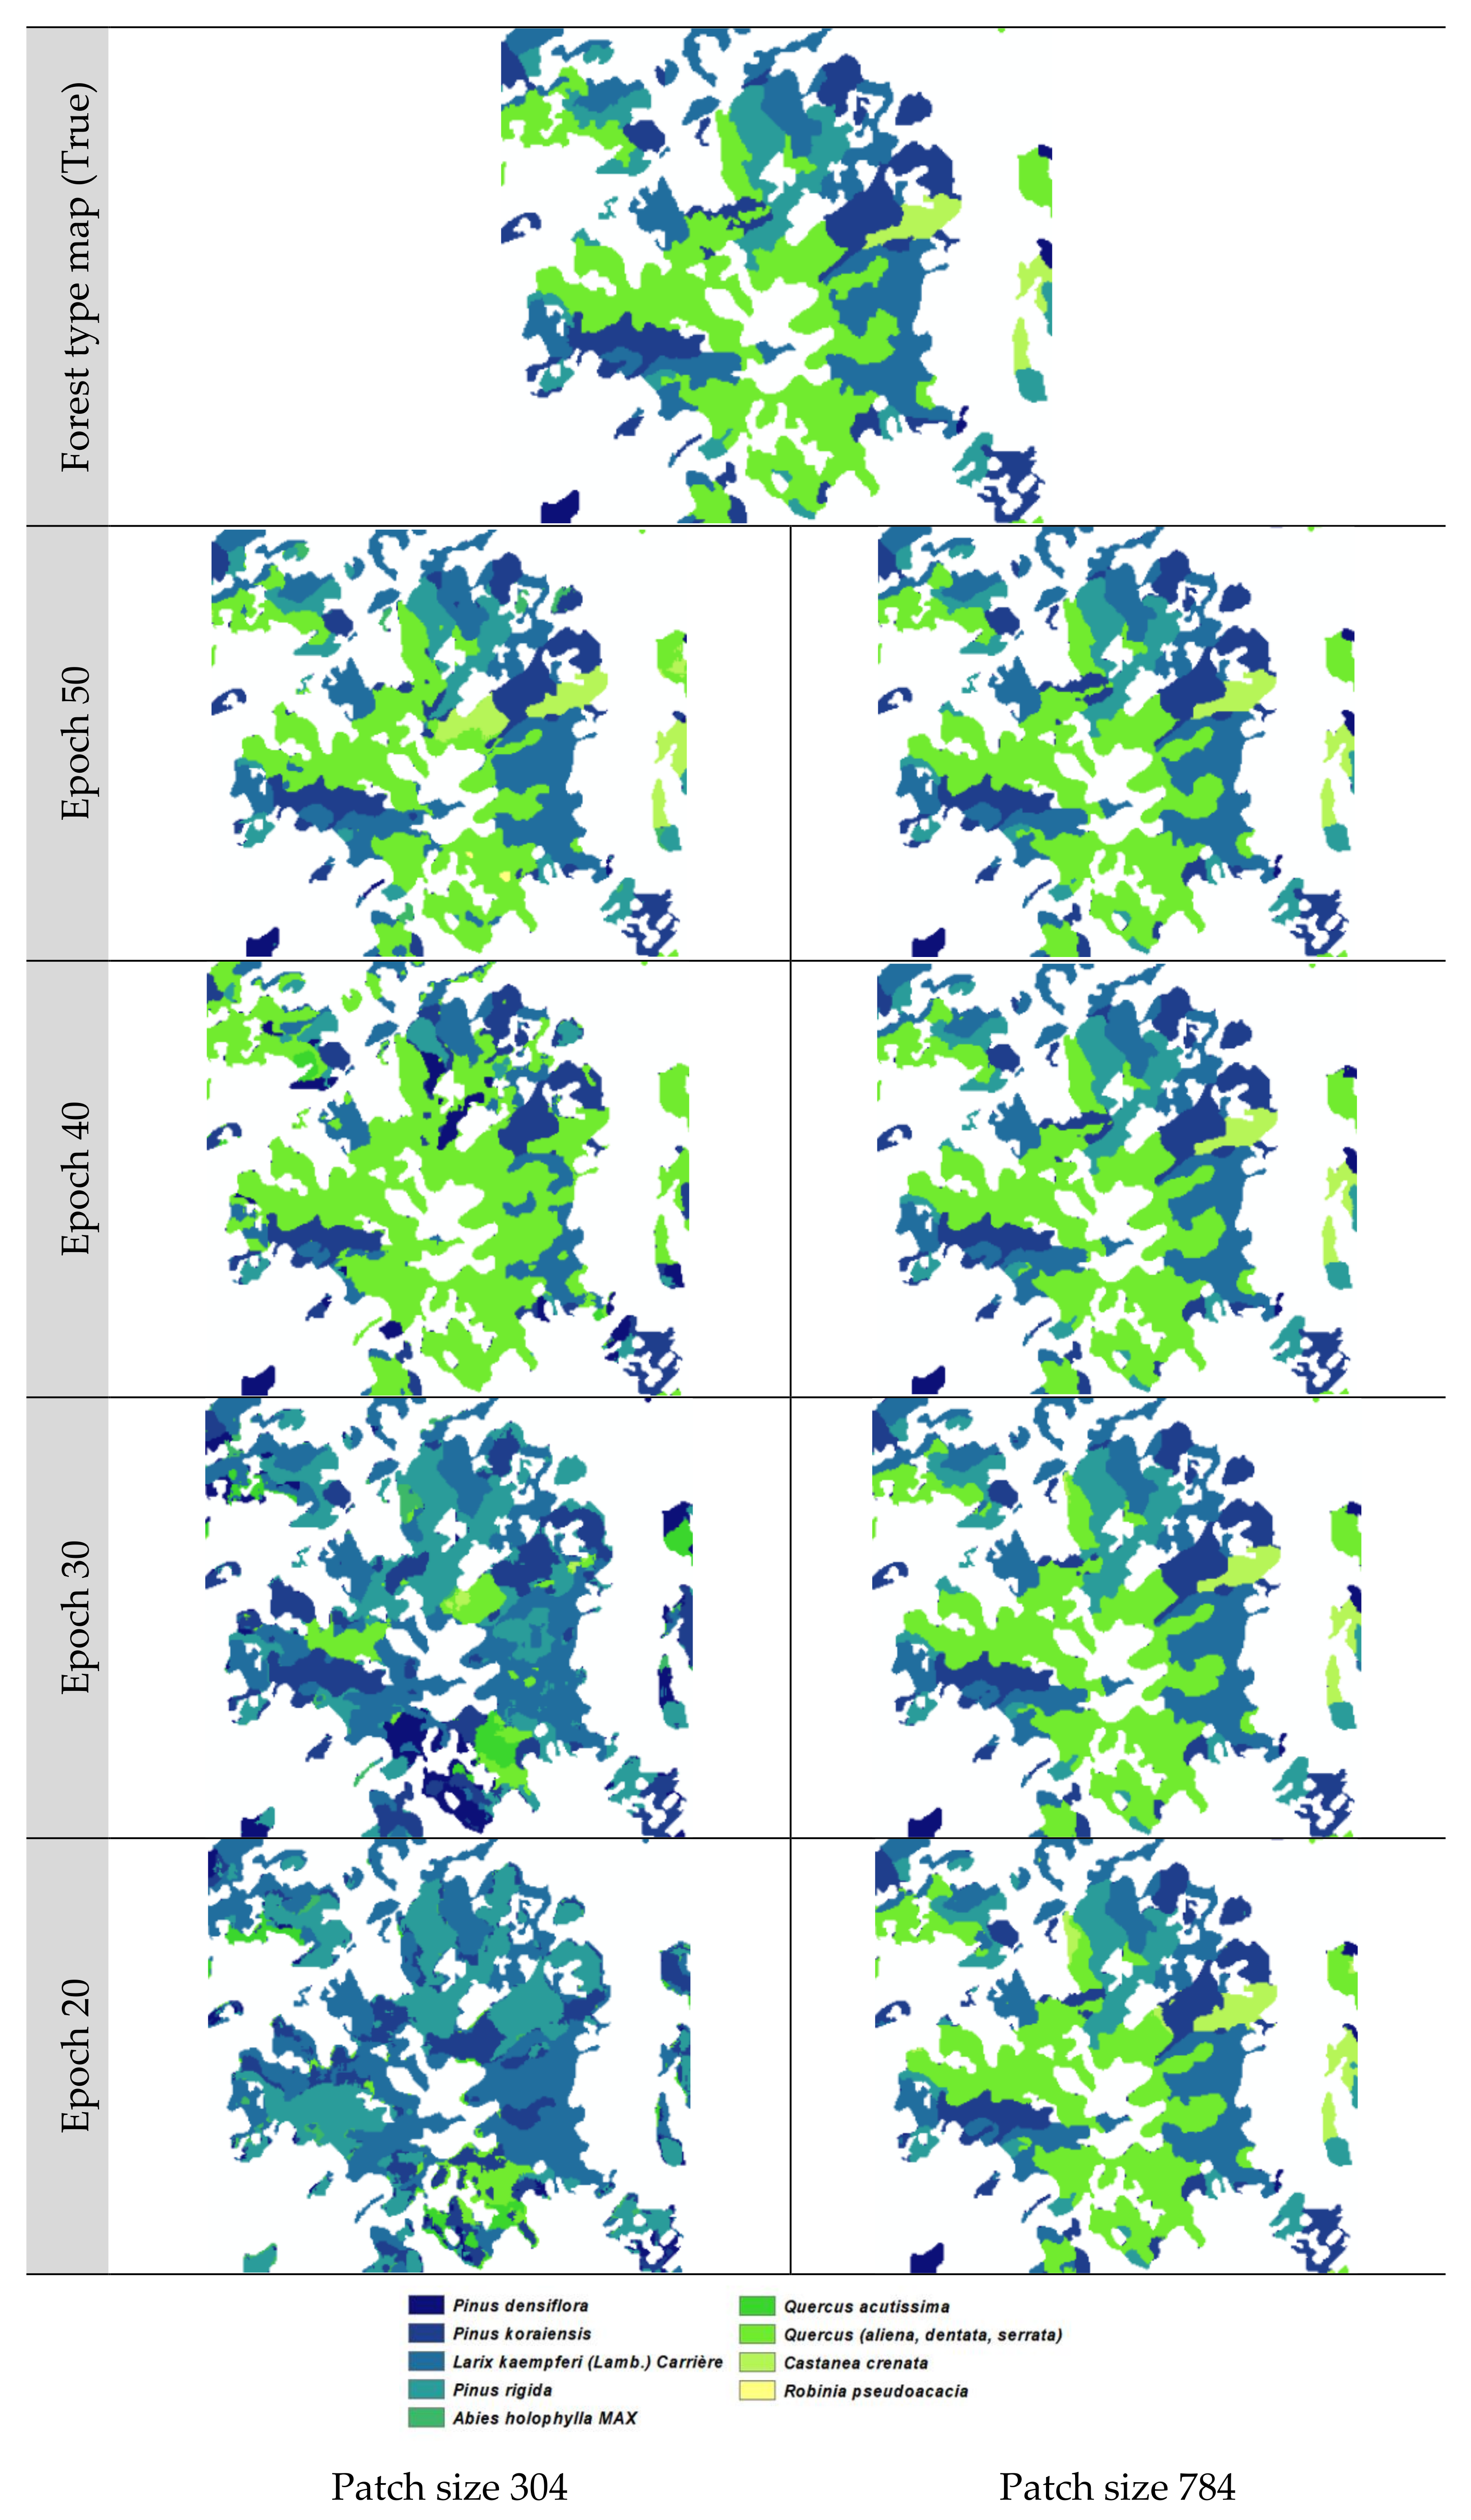
In the Gwangneung region, the performance of tree species classification varied depending on the patch size and scenarios. When a patch size of 304 was used in scenario 4, the recall values ranged from 14.0% to 42.3% across different epochs. In contrast, a patch size of 784 achieved a consistently high classification accuracy, ranging from 59.0% to 90.5%, even without considering vegetation indices. Similarly, in scenario 6 with a patch size of 304, the recall values ranged from 16.3% to 47.7%. However, the accuracy significantly improved with a patch size of 784, ranging from 40.0% to 82.0%, surpassing the accuracy obtained with a patch size of 304 (
Table 2). These findings indicate that a patch size of 304 may not be suitable for accurate tree species classification in scenarios 4 and 6. In scenarios 4 and 6, in epochs of 20 and 30 and of patch size 304, the misclassification of needle-leaved trees (i.e.,
P. rigida and
L. kaempferi) was remarkably high in the Gwangneung region. This suggests that it is more difficult to perform classification on needle-leaved tree species. As observed in the study by [
14], the lower accuracy of the needle-leaved trees classification can be attributed to the similarity in spectral characteristics among different coniferous species.
Moreover, as the loss value increases, a decrease in the validation accuracy can be expected. This observation is supported by the narrowing difference between the recall and precision when the accuracy is high. Notably, the validation accuracy for a patch size of 784 with an epoch of 50 was comparable to the highest training accuracy achieved (
Figure 3a).
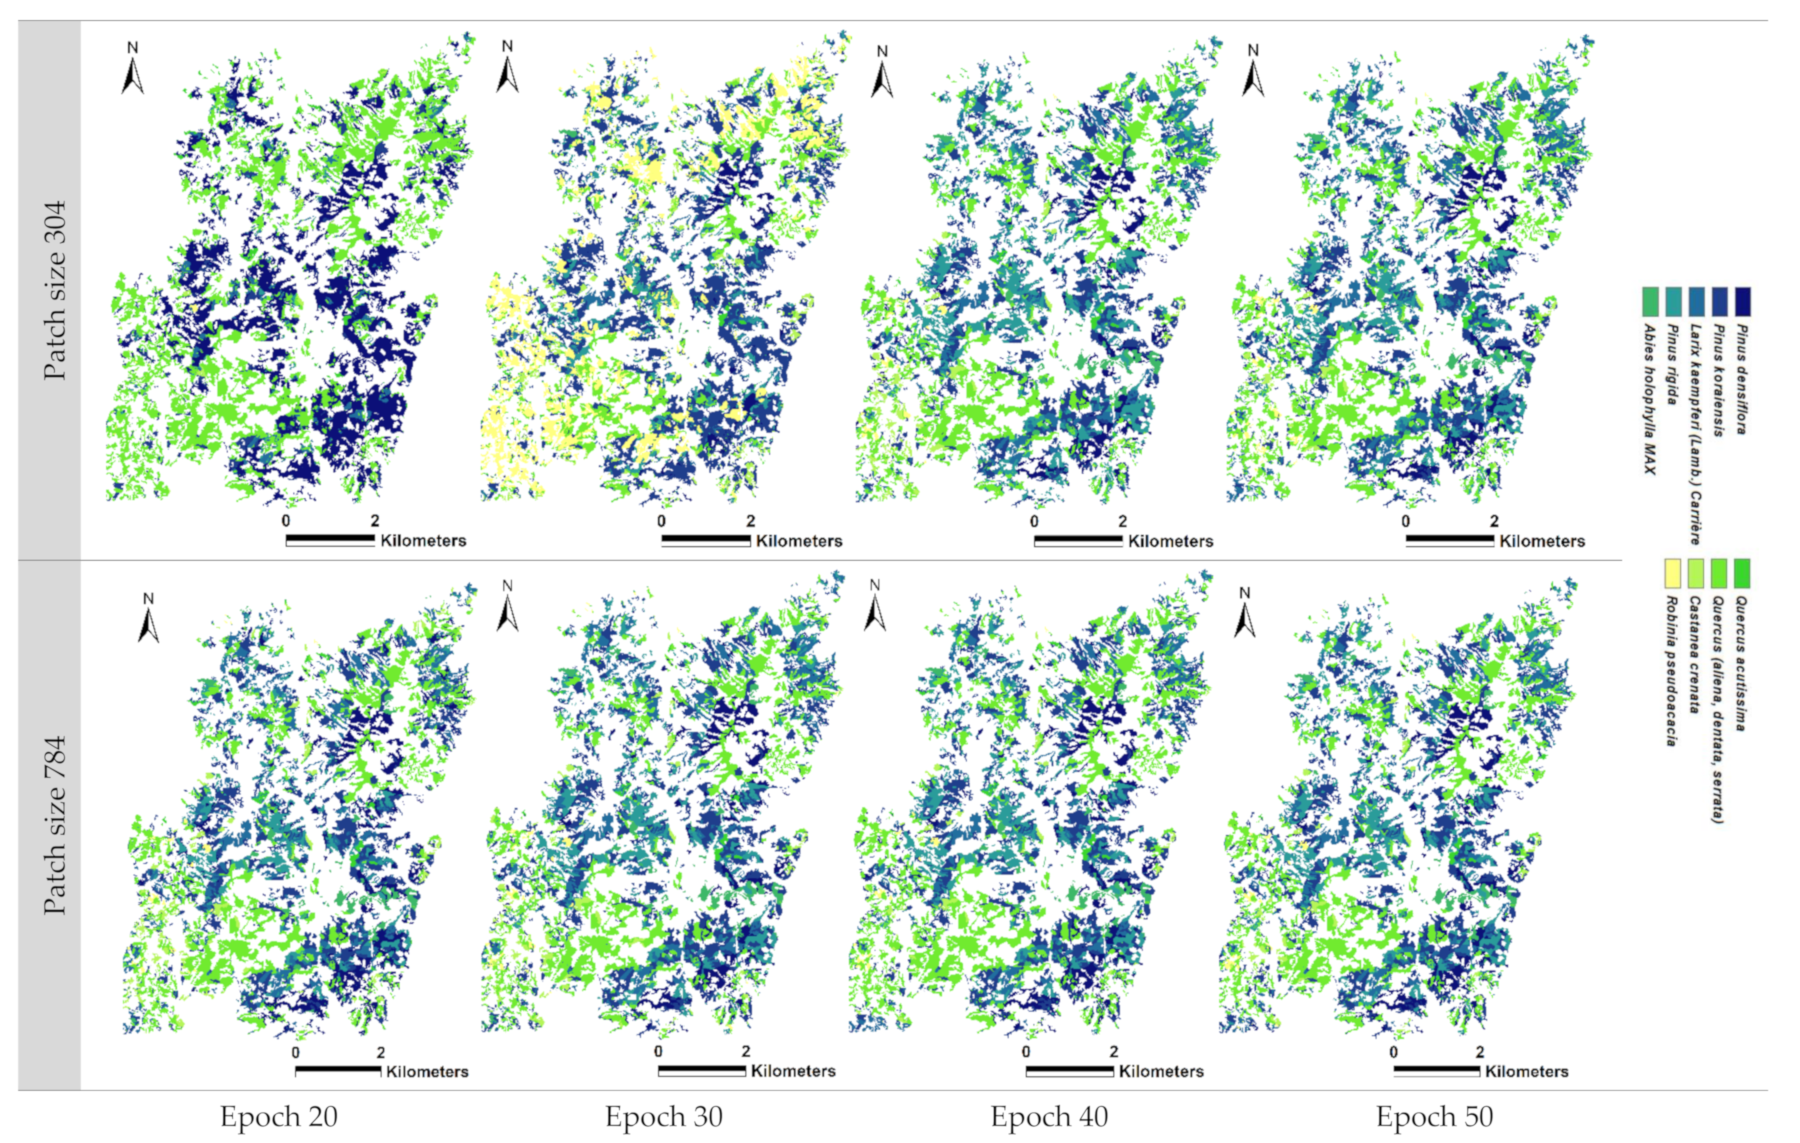
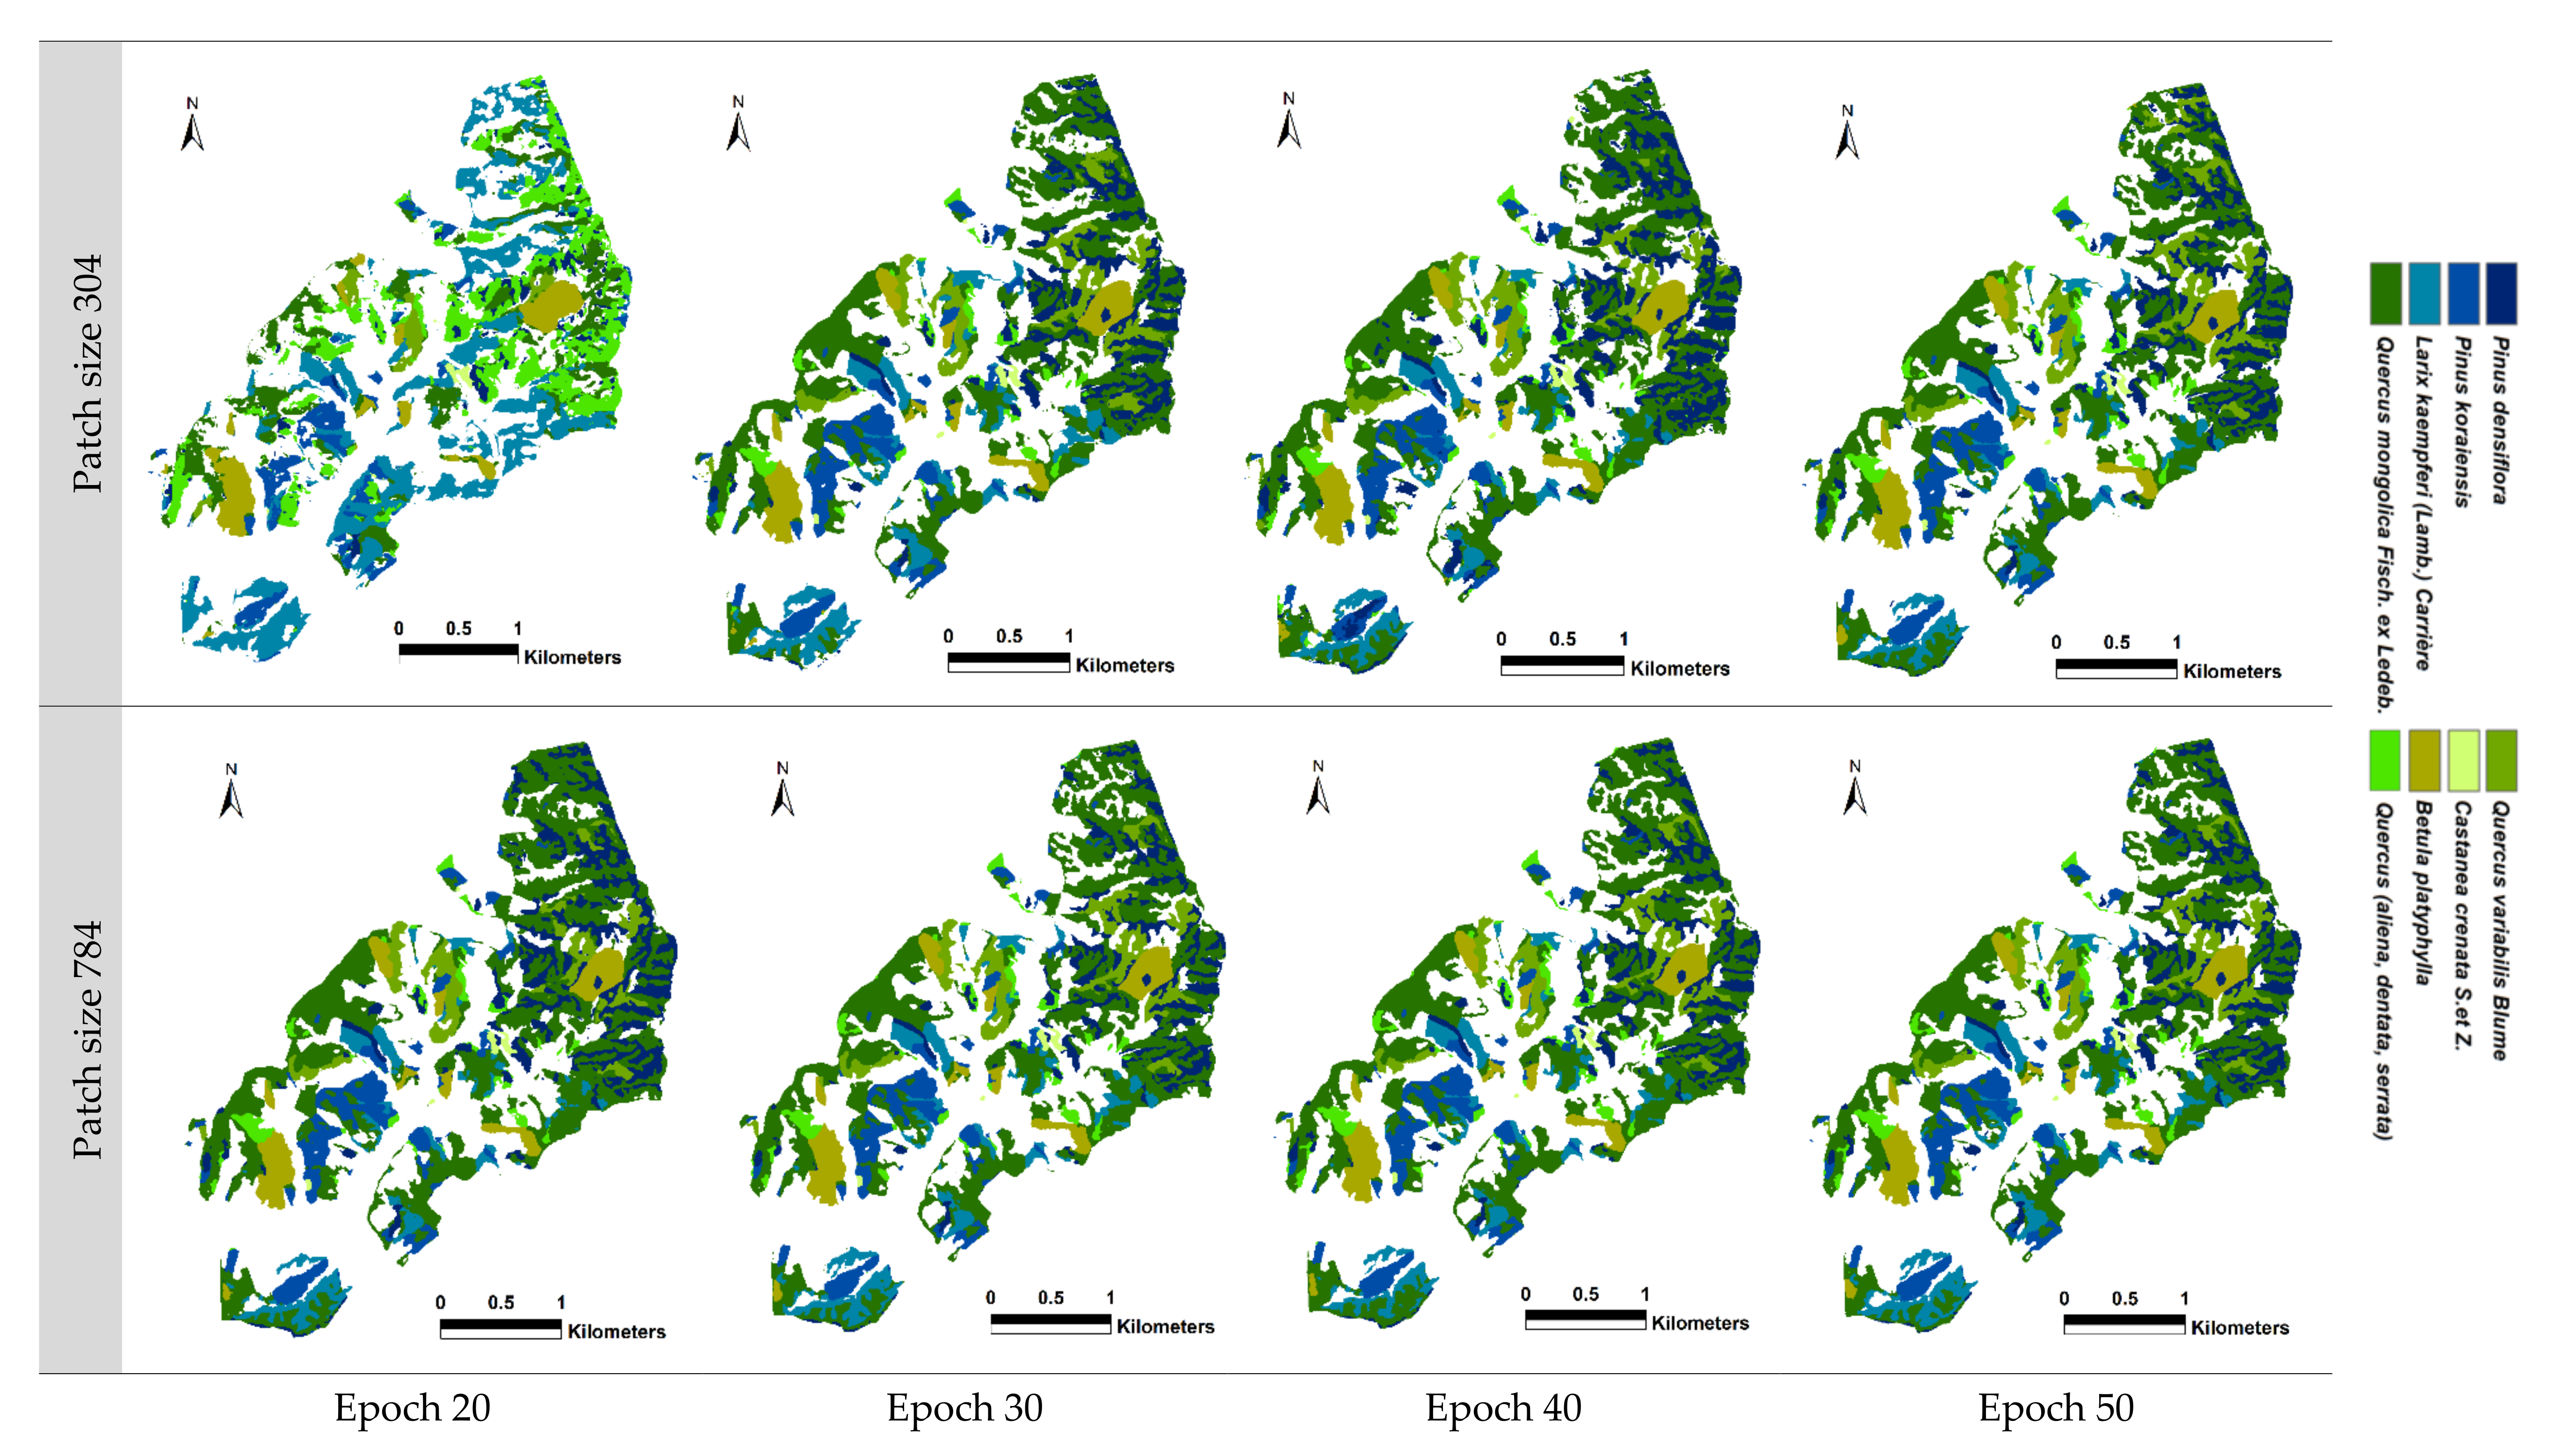
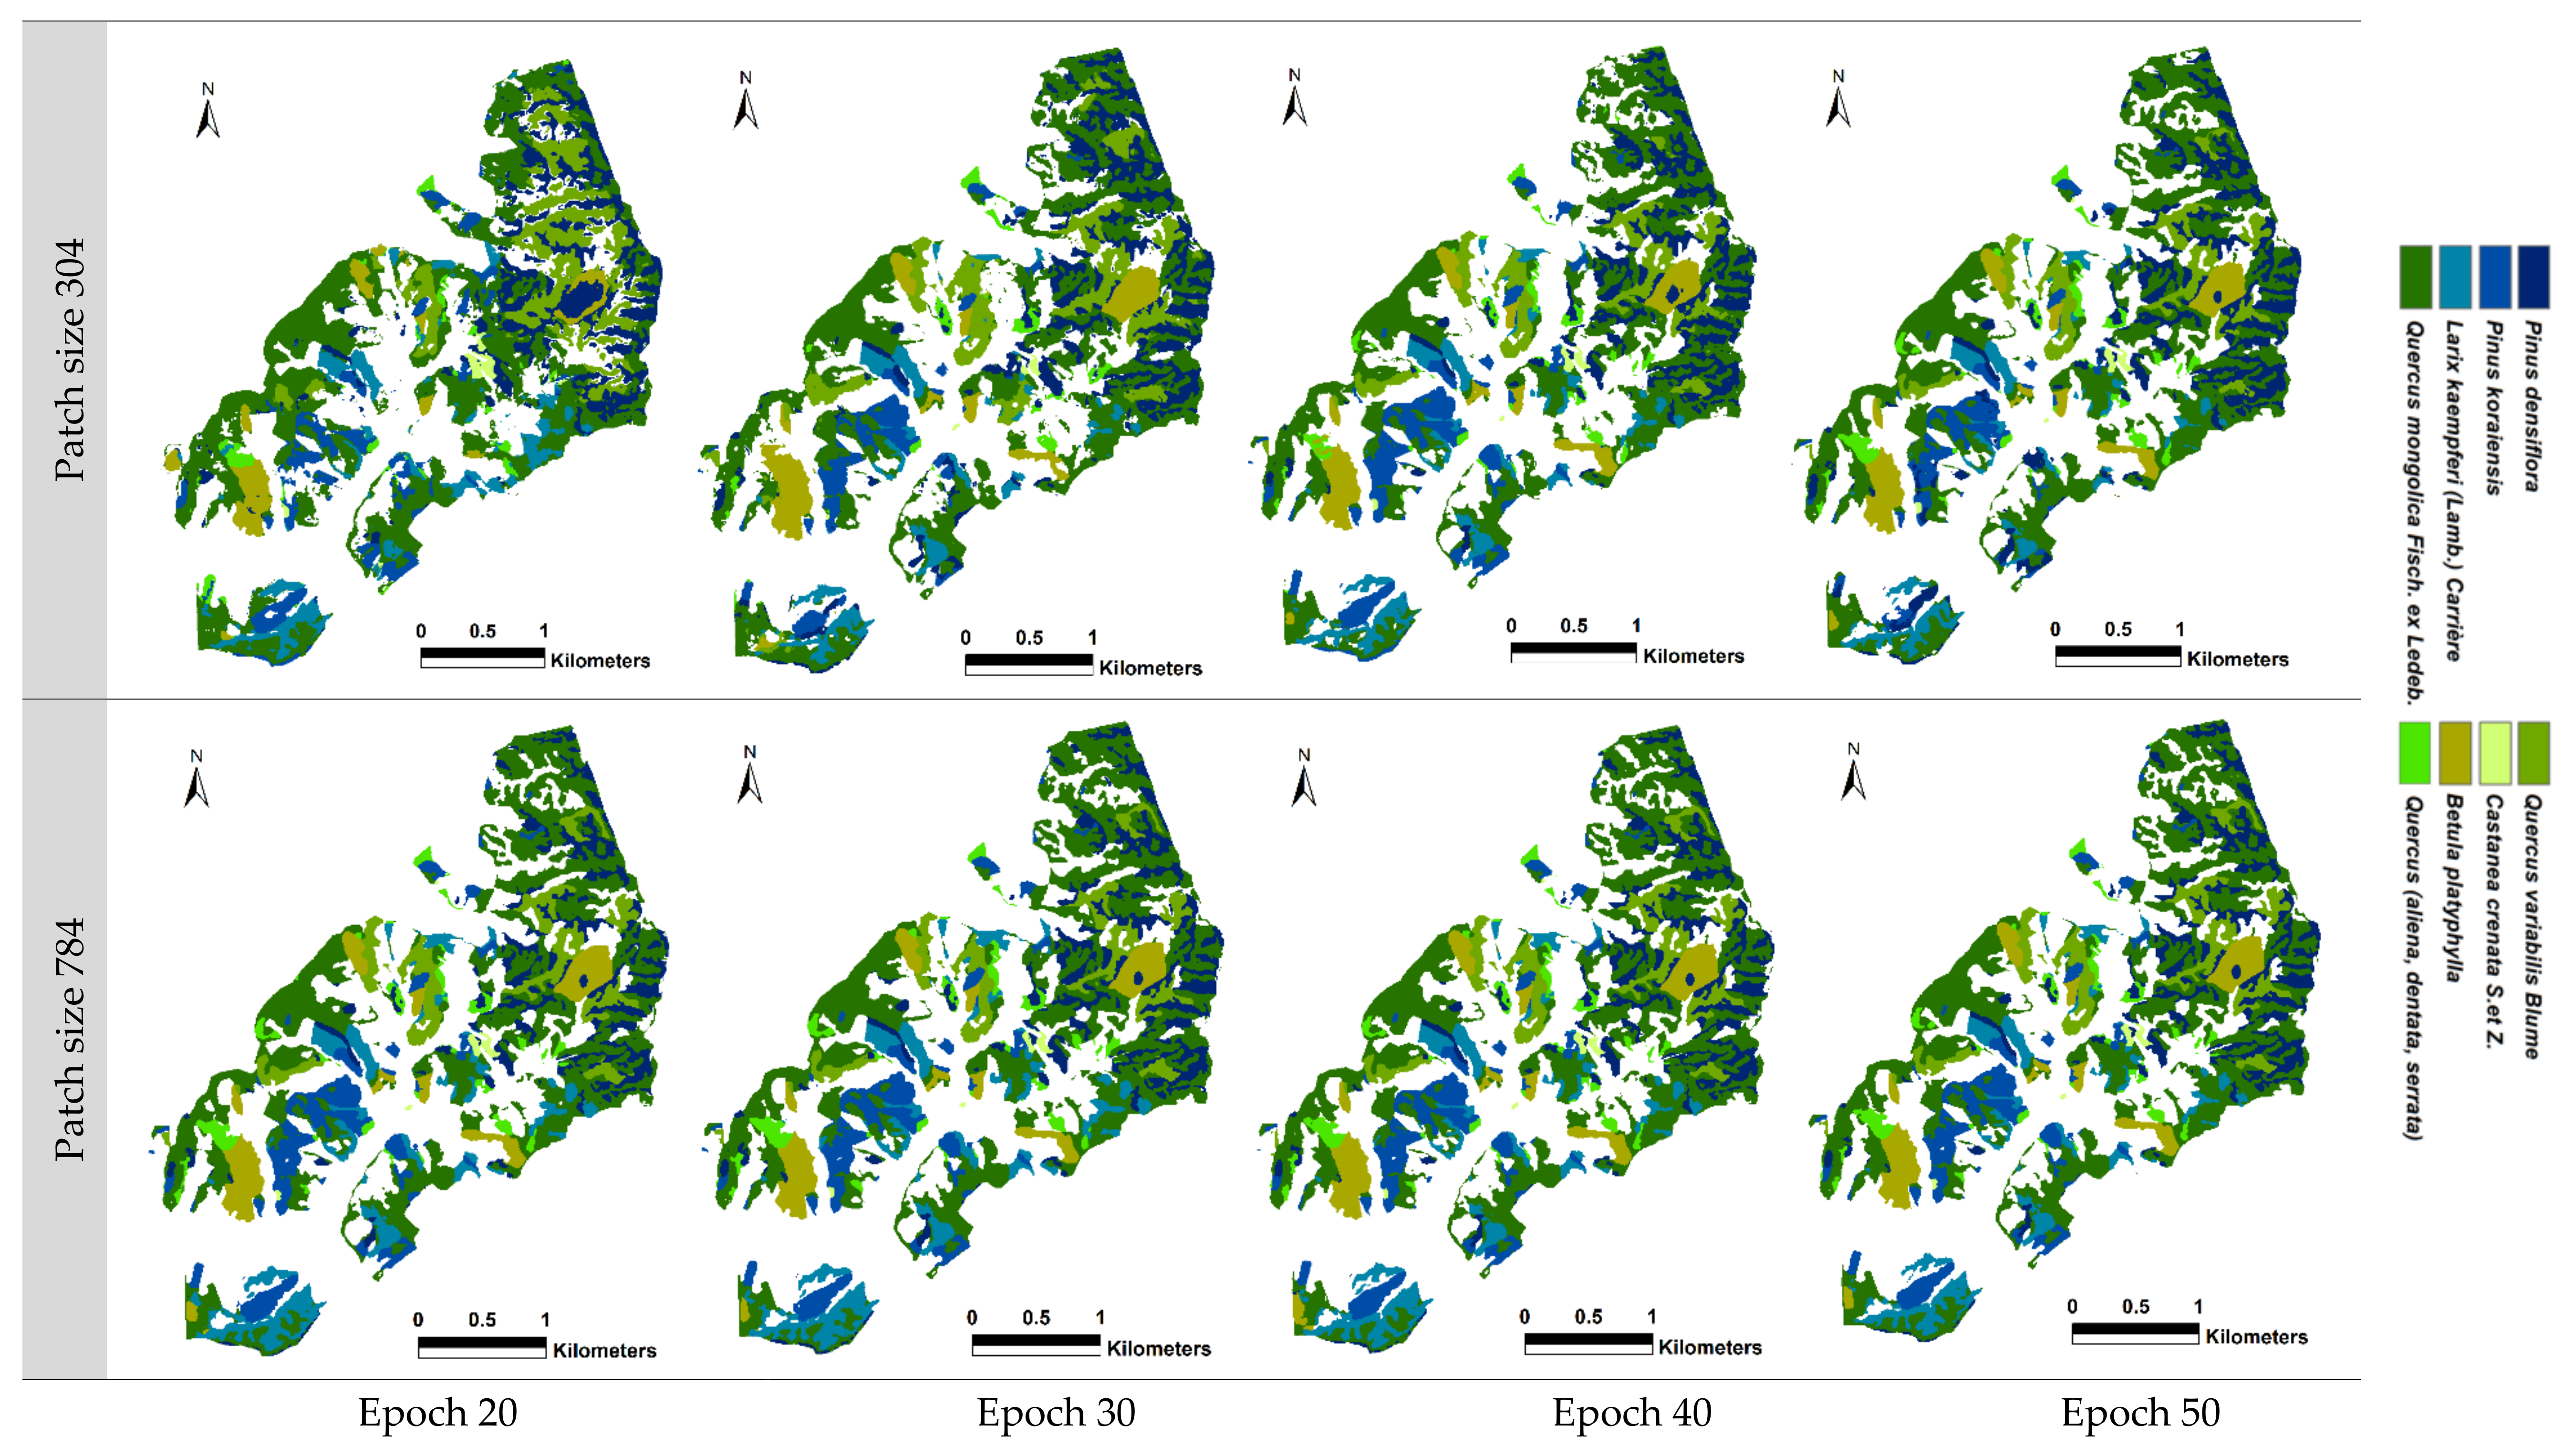
In the Chuncheon region, the results diverged from those observed in the Gwangneung region, primarily due to the increased patch size, from 304 to 784. When utilizing a patch size of 304 in scenario 4, the recall values ranged from 40.2% to 57.5% across different epochs. However, a patch size of 784 consistently achieved high classification accuracy, ranging from 85.1% to 91.0%, even without considering vegetation indices. Similarly, in scenario 6 with a patch size of 304, the recall values ranged from 37.8% to 84.4%. Notably, a substantial improvement in accuracy was observed when the patch size was increased to 784, ranging from 89.1% to 92.1%, surpassing the accuracy attained with a patch size of 304 (
Table 3). Unlike the Gwangneung region, the inclusion of vegetation indices further enhanced the accuracy in the Chuncheon region. This is likely because the Chuncheon region is a well-managed plantation area where individual tree species at the stand level are better maintained compared to the Gwangneung region, leading to clearer variations in vegetation indices and an improved classification performance (
Figure 3b).
The validation statistics for all epochs consistently showed a stable increase in performance when using a patch size of 784 and performing at least 30 epochs. However, with a patch size of 304, the tree species classification was not effective even after 20 epochs. On the other hand, for larger areas such as Gwangneung, the classification accuracy improved from epoch 30 onwards. In the case of a quarter-sized region such as Chuncheon, proper classification was achieved starting from epoch 40 (
Figure A5,
Figure A6,
Figure A7,
Figure A8 and
Figure A9). The Gwangneung region exhibited the highest recall value of 90.5% in scenario 4, employing a patch size of 784 and epoch 50, without considering vegetation indices. Similarly, in the Chuncheon region, scenario 6 demonstrated the highest recall value of 92.1%, utilizing all input datasets with the same patch size and epoch (
Table 2 and
Table 3,
Figure 3).
We have classified a total of 13 tree species, and the classification for species beyond these is not yet available. The entire tree species present in the Korean forest map amounts to a total of 50. In the future, there are numerous additional tree species that need to be included in the classification, and to accomplish this, we believe that we will require supplementary input data.
3.2. Identifying the Topographic Factors Associated with Tree Species Misclassification
In this study, a comprehensive analysis of topographic factors, including elevation, slope, and aspect, was conducted to investigate the reasons for misclassified tree species. Both the true and false points of classification were extracted and compared statistically (
Table 4). The average elevation was found to be 246.77 m for true classifications and 219.58 m for false classifications, indicating an average elevation difference of 27.19 m. The misclassified areas exhibited relatively lower topography. Similarly, the average slope was 15.98° for true classifications and 20.10° for false classifications, representing a mean difference of 4.12°. The misclassified areas displayed relatively higher slope values. This can be attributed to the effect of the valley topography characterized by low elevation and steep slopes. It was observed that misclassifications were higher in patch size 304 compared to patch size 784, and as the epoch increased, the influence of topographic factors decreased. This suggests that misclassifications can be partially corrected through parameter tuning. However, it also emphasizes the need for the appropriate topographic correction of the satellite imageries prior to analysis in forested areas.
Regarding aspect, the azimuth was categorized into eight divisions: north, northeast, east, southeast, south, southwest, west, and northwest. The distribution of each azimuth category was quantitatively analyzed as a percentage of the total area. The cases with an accurate classification were predominantly observed in the southeast, west, and east directions. In contrast, the false classification cases were mainly distributed in the northwest, southwest, and west directions. Notably, a significant concentration of misclassifications occurred towards the west, possibly influenced by shadows originating from the west due to the revisit time of RapidEye and Sentinel-2 satellites to our study sites, estimated to be around 11:00 am.
These findings highlight the influence of topographic factors on the accuracy of tree species classification. The variations in elevation, slope, and aspect play a crucial role in distinguishing between the true and false classifications. The results suggest that areas with lower elevations and steeper slopes are more prone to misclassifications, while the distribution of shadows, particularly originating from the west, can also impact the classification accuracy.
4. Discussion
The limited scope of the target area can significantly affect the accuracy of tree species classification using U-net-based CNNs. Although U-net models have shown promising results in various applications, their performance in specific regions may have certain limitations. One of the main challenges is the availability and representativeness of the training data. If the training dataset predominantly consists of samples from a particular geographic region or lacks diversity in terms of tree species composition, the model may struggle to generalize well to new and unseen areas.
To overcome this limitation and improve the performance of U-net models, several approaches can be considered. Firstly, expanding the training dataset to include a more diverse range of samples from different regions can enhance the model’s ability to capture variations in tree species characteristics. This may involve collecting additional ground truth data or leveraging existing datasets from a broader geographic extent. Secondly, incorporating transfer learning techniques can be beneficial. By pretraining the U-net model on a larger and more diverse dataset, such as a national tree species dataset, and then fine-tuning it with region-specific data, the model can leverage the knowledge gained from broader contexts while adapting to the specific characteristics of the target region. In our further study, the second approach will be employed to expand the target area, continuously adding target tree species to improve the model. In addition, careful selection of the patch size for analysis is crucial. While larger patch sizes can capture more contextual information and potentially improve accuracy, they may also introduce challenges in terms of computational resources and processing time. It is essential to consider the available hardware resources and computational constraints when determining the optimal patch size. Striking a balance between accuracy and the practical limitations is crucial to ensure an efficient and effective analysis. In conclusion, while U-net-based CNN models show great potential for tree species classification, their performance in specific regions can be limited by the narrow scope of the target area. By addressing challenges related to the training data representation, incorporating transfer learning techniques, and carefully selecting patch sizes, the accuracy and generalizability of U-net models can be enhanced, enabling a more robust and accurate tree species analysis in restricted geographic regions.
A comparison with other relevant studies conducted in different geographical and climatic conditions than our study sites was performed (
Table 5). The classification accuracy of tree species varied across tropical, temperate, and boreal climates, given the diverse distribution of species and variations in density and growth characteristics. Considering these biomes, the achieved classification accuracy in our study provides valuable insights into the performance of our proposed approach. The varying environmental factors, species composition, and growth patterns across different climates necessitate a thorough evaluation of the classification accuracy to understand the effectiveness and generalizability of our methodology in various ecological settings. Such an analysis strengthens the robustness of our findings and facilitates better-informed decision making for forest management and conservation efforts worldwide.
In this study, we successfully classified a total of 13 tree species with remarkably high accuracy, particularly when compared to previous research endeavors. Notably, even studies [
37,
38], which utilized similar models and climates, exhibited discrepancies in accuracy when compared to our findings. The observed variations in accuracy can be attributed to several factors, including the incorporation of texture information and vegetation indices derived from satellite bands as inputs, as well as differences in the preprocessing techniques applied to the satellite imageries. These discrepancies highlight the significance of leveraging advanced data processing and feature extraction methodologies in improving the classification outcomes. Moreover, other studies [
39,
40,
41], while applying different classification models, encountered challenges in achieving comparable accuracy, especially in tropical climates. The complex and diverse vegetation growth conditions in tropical regions present unique challenges for an accurate tree species classification. Factors such as species diversity, variations in vegetation patterns, and environmental heterogeneity can all contribute to the lower accuracy observed in studies conducted in tropical climates. On the other hand, studies [
42,
43] focused on boreal climates, characterized by lower tree densities compared to the temperate and tropical climates. As such, the accuracy achieved in these studies was found to vary depending on the specific classification model utilized. Notably, study [
43] demonstrated a remarkably high accuracy, but it is essential to interpret this finding with caution, as the classification focused on vegetation layers from a broader land cover perspective, rather than the precise identification of individual tree species.
Our research stands out for its exceptional accuracy in tree species classification, reflecting the successful incorporation of advanced techniques such as texture analysis and vegetation indices. The observed variations in accuracy across different climates and models highlight the importance of considering diverse environmental factors and employing sophisticated modeling approaches to optimize tree species classification in various ecosystems. Such insights contribute to the advancement of remote sensing applications in forestry and environmental management, allowing for more informed decision making in sustainable forest conservation and resource management practices.
Table 5.
Comparison of user accuracy with respect to biomes in current and previous studies.
Table 5.
Comparison of user accuracy with respect to biomes in current and previous studies.
| Biomes | User Accuracy | Model | Type of Dataset | Number of Tree Species | Sources |
|---|
| Temperate climates | 0.905–0.921 | U-net CNNs | Satellite with multispectral bands | 13 | This study |
| Temperate climates | 0.733 | U-net CNNs | Satellite with multispectral bands | 9 | [37] |
| Temperate and tropical climates | 0.865 | U-net CNNs | Satellite with multispectral bands | 1 | [38] |
| Tropical climates | 0.576 | CNNs | Satellite with multispectral bands | 1 | [39] |
| Tropical climates | 0.752 | CNNs | Aerial photographs with multispectral bands | 9 | [40] |
| Tropical climates | 0.756 | XGB | Satellite with multispectral bands | 9 | [41] |
| 0.526 | GNB |
| 0.770 | RF |
| 0.768 | GB |
| 0.769 | LR |
| 0.663 | KNN |
| 0.826 | SVM |
| 0.813 | MLP |
| 0.800 | LGBM |
| Boreal climates | 0.703 | RF | Airborne hyperspectral and LiDAR | 4 | [42] |
| 0.824 | SVM |
| 0.688 | LGBM |
| 0.817 | ANNs |
| Boreal climates | 0.970 | CNNs | Satellite with multispectral bands | 1 | [43] |
| 0.840 | AB |
| 0.850 | GNB |
| 0.900 | RF |
| 0.930 | KNN |
| 0.910 | QDA |
The tree species classification algorithm developed in this study aims to provide forest analysis ready data (F-ARD) for the upcoming agricultural and forestry satellite, the compact advanced satellite 500 (CAS500-4), scheduled to launch in 2025 in South Korea. The algorithm serves as a baseline at the current stage, recognizing the need for a further validation of its performance and an additional verification of the variables used. Integrating the algorithm with CAS500-4 holds significant potential for enhancing the forest analysis capabilities in South Korea. By leveraging the satellite’s advanced imaging capabilities and incorporating the developed tree species classification algorithm, valuable insights into the country’s forest resources and their dynamics are expected to be obtained. However, it is crucial to acknowledge the inherent limitations and challenges associated with the algorithm’s application in specific target areas. Factors such as regional variations in tree species composition, forest structure, and environmental conditions can influence the algorithm’s performance. Therefore, further validation efforts are required to ensure its reliability and accuracy across diverse geographic regions within South Korea. The algorithm’s contribution lies in establishing a baseline for tree species classification and providing a starting point for the development of forest analysis products using CAS500-4 imagery. Its results serve as a foundation for future refinements and improvements, enabling the optimization of the algorithm’s performance through ongoing research and validation. As the agricultural and forestry satellite CAS500-4 is launched and operationalized, collaboration between the algorithm’s development team and CAS500-4 mission stakeholders will play a vital role. Through continued partnerships, the algorithm can be refined, validated, and further optimized to meet the specific requirements and objectives of CAS500-4’s forest analysis applications. Therefore, while this study’s tree species classification algorithm presents a significant opportunity for forest analysis using CAS500-4’s F-ARD, it is crucial to acknowledge the need for an ongoing validation, addressing the regional limitations, and a further verification of the variables utilized. The algorithm’s results provide a baseline that can be built upon and refined, contributing to the advancement of forest analysis capabilities in South Korea and serving as a stepping stone for future developments in the field of satellite-based forestry monitoring and assessment.


