Article

Altitudinal Differentiation of Forest Resilience to Drought in a Dryland Mountain

College of Earth and Environmental Sciences, Lanzhou University, Lanzhou 730000, China
*
Author to whom correspondence should be addressed.
Forests 2023, 14(7), 1284; https://doi.org/10.3390/f14071284
Submission received: 4 May 2023 / Revised: 8 June 2023 / Accepted: 18 June 2023 / Published: 21 June 2023

Abstract

:
Drought is one of the major climate disasters leading to forest degradation in dryland mountains. Hence, revealing the response of forest resilience to drought is crucial to predict forest succession in dryland mountains under future global warming. Here, we chose the Qilian Mountains as the study area and calculated the recovery time and drought intensity along elevation from 1982 to 2020 using the Leaf Area Index (LAI) and the Standardized Precipitation Evapotranspiration Index (SPEI). Then, the forest resilience to drought was calculated using the area of an exponentially fitted curve between drought intensity and corresponding recovery time. Finally, the dominant climate factors underlying altitude differentiation of forest resilience were analyzed using a random forest (RF) regression model, and correlations were determined based on a generalized additive model (GAM). The results indicate that forests in the elevation range of 2600–3900 m exhibited faster recovery rates and greater resilience compared to those in 1700–2600 m. The attributional analysis shows that altitudinal differentiation of forest resilience to drought was mainly constrained by precipitation with a non-monotonic correlation, and resilience was strongest when monthly precipitation reaches 30 mm. In terms of the occurrence of historical drought events, increased potential evapotranspiration improved resilience in the elevation range of 2600–3900 m and enhanced cloud cover initially enlarged the resilience and then decreased it in the elevation range of 3000–3400 m and 3400–3900 m, with resilience being strongest when cloud cover reached 24% and 33%, respectively. Under future climate change, global warming will further exacerbate the drought impact in arid regions, increasing the risk of primary forest collapse. The results of this study provide a scientific basis for predicting the potential changes in vegetation resilience and developing policies for ecological protection in dryland mountains, and we will take addressing the difficult study of the quantitative effects of tree species on resilience altitude differentiation based on ecosystem scales as our future direction.

1. Introduction

Climate is an important external factor affecting ecosystems, and the increased frequency of climate hazard events can disrupt ecosystem structure and function [1,2,3]. Drought is considered to be one of the most complicated climate hazard events and can reduce vegetation growth capacity [4], decrease net primary productivity [5], trigger forest mortality events [6], and alter plant community biodiversity [7]. The intensity, frequency, and duration of drought worldwide have increased significantly with global warming, with drought having increasingly severe impacts on ecosystems [8,9,10], Therefore, it is critical to recognize and understand the processes through which ecosystems respond to drought.
The concept of resilience was introduced into ecology by Holling in 1973 [11]. Ecosystem resilience is defined as the ability of a system to recover from external disturbances without changing into a substitute state [12,13]. Recovery time, as the key indicator of ecosystem resilience, represents the time required for the system to return to its normal state [14,15]. Previous studies have evaluated the recovery time for ecosystems to recover after being exposed to drought. The recovery time is closely associated with the drought intensity of drought events [16,17,18]. Schwalm et al. [16] reported that the greater the drought intensity the ecosystem experiences, the longer the recovery time is required. Ingrisch et al. [18] pointed out that under the same drought intensity, the ecosystems that required shorter recovery time were more resilient. Therefore, recent studies coupled recovery time and drought intensity to assess the resilience of ecosystems to droughts [19,20]. For instance, Yao et al. [20] proposed an indicator that fits curves based on the relationship between recovery time and drought intensity to judge the resilience of different ecosystems. The resilience varies significantly among ecosystems. Forests showed weaker resilience to drought than other ecosystems and a higher risk of incomplete recovery [21]. However, dryland mountains are extremely fragile in response to drought events, and forest resilience to drought of dryland mountains has not been systematically studied. Furthermore, altitude is the key variable affecting the distribution of forest species and the forest growth of dryland mountains. The characteristics of multiple factors affecting the recoverability to drought, including climate variables, biotic variables, as well as soil properties, etc., also show obvious elevation heterogeneity. Among them, climate variables change particularly significantly with increasing altitude and are extremely important in studying the attribution of vegetation changes. For instance, precipitation increases and temperature decreases as altitude rises in some dryland mountains [22,23]. Therefore, the dynamic response relationship between recovery time and drought intensity may be significantly different among different altitude zones. What is the relationship between recovery time and drought intensity at different elevations in dryland mountain forests? What altitudinal differentiation characteristics does forest resilience based on the above relationships exhibit? What are the dominant climate factors and correlations of resilience altitudinal differentiation? Solving these problems is essential to predict how dryland mountains will recover from drought disturbance in the future climate context, and to identify and understand the mechanism of geographical heterogeneity in response to drought of dryland mountain vegetation.
Qilian Mountain National Park (QMNP) is the core area of the Qilian Mountains, known for its complex mountain climate and primary forests with significant elevation differentiation. It has become an ideal experimental site to explore forest response to climate change in dryland mountains. Previous studies showed that drought was the most major climate hazard event in QMNP and inhibited primary forest growth [22]. Temperature and precipitation were the main factors driving forest change in QMNP [22,23,24]. Specifically, tree growth was mainly affected by a one-month time lag effect of precipitation and a two-month time accumulation effect of temperature [25]. Overall, the qualitative, quantitative, and temporal effects of climate on primary forest change in QMNP have been systematically studied. However, under the background of global climate change, primary forests in dryland mountains experienced frequent drought events and are at great risk of incomplete recovery or even collapse [26]. It is very urgent to study forest resilience under drought disturbance, analyze altitudinal differentiation characteristics of resilience, and explore its affecting factors, which is of great importance to determine whether primary forests can recover from drought events and formulate restoration measures at different elevations under water and heat conditions in the QMNP in the future.
This study hypothesizes that forest resilience to drought exhibits altitudinal differentiation in dryland mountains. To verify this hypothesis, QMNP was selected as a typical study area. We calculated recovery time and drought intensity using the leaf area index (LAI) as the vegetation state index and the standardized precipitation evapotranspiration index (SPEI) as the drought index, respectively. Forest resilience curves were fitted based on the dynamic response relationship between recovery time and drought intensity, and forest resilience was quantified using the curve area. Then we analyzed the altitude differentiation of forest resilience and assessed the recovery time required by the ecosystem under future drought disturbance. Finally, we identified the dominant climate factors contributing to altitudinal differentiation of resilience and explored their correlations. This study aims to uncover the spatiotemporal characteristics of forest resilience and its underlying mechanism in QMNP. The findings confirm the importance of adopting the altitudinal gradient perspective in studies of the dryland mountain evolution. They provide a scientific basis for predicting the potential changes in forest resilience to drought hazards in the QMNP and other dryland mountains under the background of future global warming.

2. Methodology

2.1. Research Area

QMNP, with a total area of 5.02 × 10⁴ km2, is one of the first 10 pilot national park systems established in China, renowned for its ecological importance. It serves as an important ecological security barrier in the west, an important water production area for inland rivers and the Yellow River Basin, and a priority area for the conservation of biodiversity. The park (94°51′~103°00′ E, 36°47′~39°48′ N) is located at the intersection of two major plateaus, the Qinghai–Tibet Plateau and Mongolian Plateau. The ecosystem is unique and diverse, with the forest being one of the most critical ecosystem types (Figure 1). It has a typical continental alpine semi-humid mountain climate, with an average annual temperature of approximately 4 °C and an average annual rainfall of approximately 400 mm. The climatic conditions show significant altitude dependence in primary forests, with precipitation increasing and temperature decreasing as altitude increases [26,27,28,29,30].

2.2. Data Source and Processing

2.2.1. Meteorological Data

This study used the 1 km monthly temperature and precipitation dataset for 1982–2020 from the National Earth System Science Data Centre (http://www.geodata.cn/data/datadetails.html?dataguid=192891852410344&docId=3517, accessed on 21 March 2022) to compute the SPEI. The dataset is based on the global 0.5° climate data released by CRU [31] and the global high-resolution climate data released by WorldClim [32], validated by data from 496 independent meteorological observation sites, and its results are reliable [33].
The potential evapotranspiration data were obtained from the 1990–2021 China 1 km monthly potential evapotranspiration dataset released by the National Earth System Science Data Centre (http://www.geodata.cn/data/datadetails.html?dataguid=34595274939620&docId=991, accessed on 15 March 2023). This dataset is based on the China 1 km monthly mean temperature, minimum temperature, and maximum temperature dataset [33], and calculated using the Hargreaves potential evapotranspiration formula. It has been subjected to multiple quality control measures, and has high accuracy [34].
The cloud cover data are from the Climatic Research Unit gridded Time Series (CRU TS) produced by the NERC Centers for Atmospheric Science (UK) (NCAS) (https://crudata.uea.ac.uk/cru/data/hrg/, accessed on 17 March 2023). The spatial resolution of this dataset is 0.5° and the temporal resolution is monthly [35].

2.2.2. Elevation Data

The elevation data used in the study were the digital elevation model (DEM) data provided by the Resource and Environmental Science Data Center of the Chinese Academy of Sciences (https://www.resdc.cn/data.aspx?DATAID=123, accessed on 17 February 2022). The dataset was reconstructed based on recent Shuttle Radar Topography Mission V4.1 (SRTM V4.1), and the spatial resolution was 30 m.

2.2.3. Vegetation Data

As a key vegetation structure variable, LAI is critical in vegetation feedback to climate [20,35,36,37,38]. It is generally defined as half of the sum of green leaf surface area per unit surface area [34]. The LAI data from 1982 to 2020 used in this study were selected from the NOAA Climate Data Record (CDR) of AVHRR Leaf Area Index (LAI) and Fraction of Absorbed Photosynthetically Active Radiation (FAPAR) dataset (https://doi.org/10.7289/V5M043BX, accessed on 22 April 2022), which was derived from the NOAA AVHRR surface reflection product. After data acquisition, the spatial resolution was 0.05°. Monthly LAI data were obtained by selecting the Maximum LAI Value of vegetation growth in the month based on Maximum Value Composites pixel by pixel [39].
Forest data were obtained from the 30 m land cover dataset and its dynamics from 1990 to 2020 in China (1.0.0) [40]. The dataset was verified based on 5463 visual interpretation samples and the overall accuracy is 80%. The forest information along elevation zones through field investigations is described in Figure 2. The main elevation zone of the forest distribution in QMNP is 2600–3400 m, the lower forest line is 1700 m and the upper forest line is 3900 m [23,26,27]. The main elevation zone of the forest distribution was divided into 400 m intervals. Therefore, the forest distribution of QMNP was divided into four elevation zones: 1700–2600 m, 2600–3000 m, 3000–3400 m, and 3400–3900 m.

2.3. Analysis

2.3.1. Standardized Precipitation Evapotranspiration Index

In this study, we used the SPEI to investigate drought. The SPEI is an effective indicator for detecting and assessing droughts regarding global warming [41,42,43,44]. It encompasses multiscale effects and is more sensitive to changes in the water and heat conditions [45,46,47]. Considering the seasonal characteristics of forest growth, we chose the SPEI with the time scale of three months (SPEI-3) that reflects short-term and medium-term moisture conditions, allowing us to study the characteristics of seasonal drought events and reveal the drought effects on ecosystems [41,48,49,50]. The potential evapotranspiration (PET) was calculated through using the Thornthwaite method [51]. The SPEI-3 was obtained by calculating the difference between precipitation and potential evapotranspiration and conducting normal standardization. The specific calculation process based on Equations (A1)–(A14) is shown in Appendix A.

2.3.2. Theoretical Basis of Resilience Curve

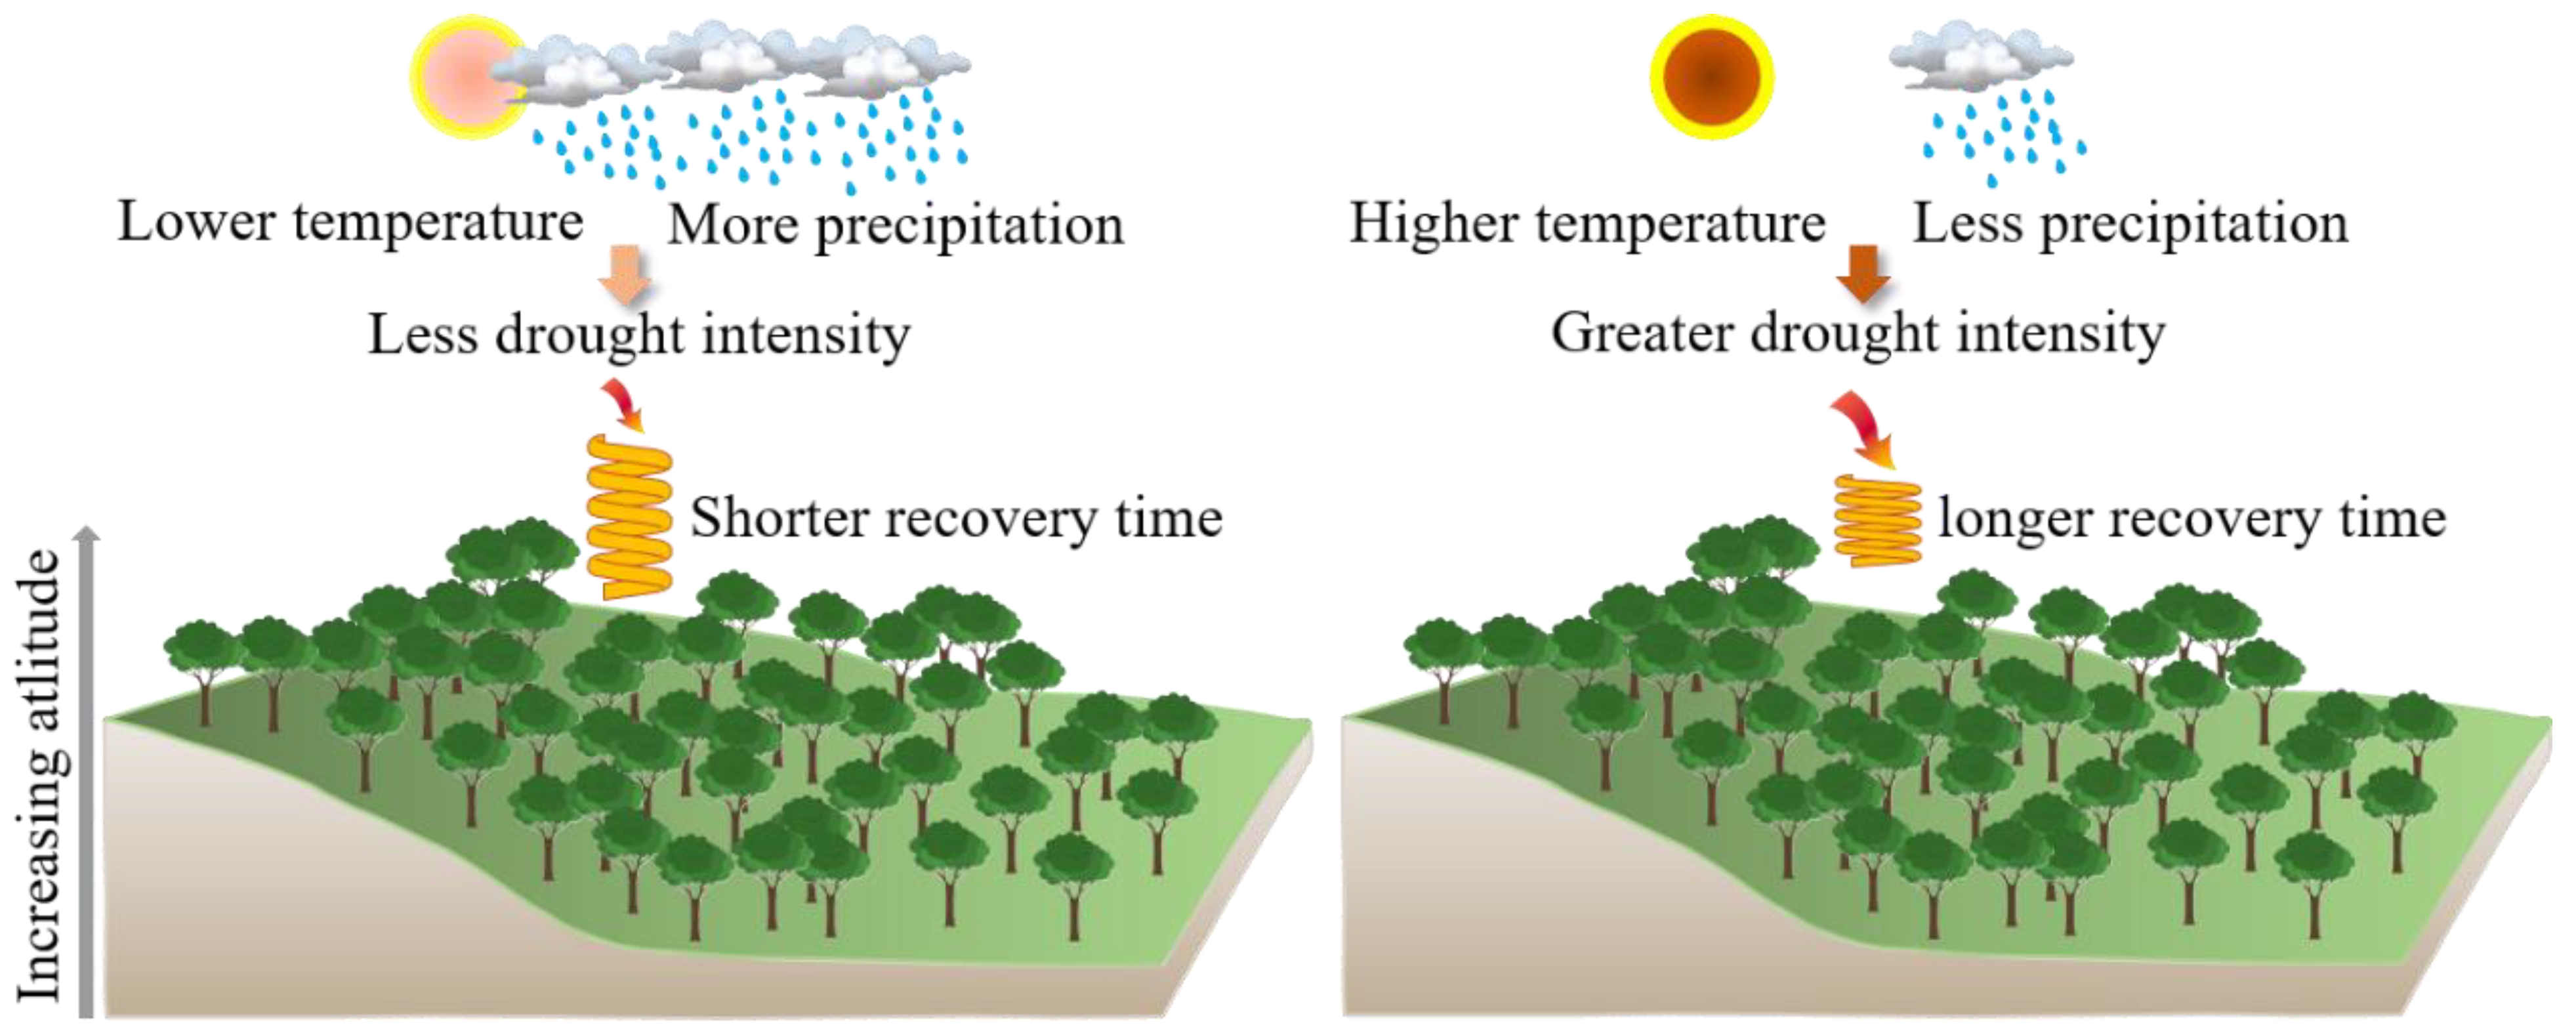
Physiological Basis of Resilience Curve

The forest has a certain recoverability to drought disturbances, which can be visualized through a spring-like process (Figure 3). Specifically, under the premise that a forest ecosystem can recover, as the drought intensity increases, the functional traits of the ecosystem are compressed more severely, resulting in a longer recovery time. This process is dynamic and non-linear [52,53,54]. For this reason, some studies have fitted a nonlinear curve of the relationship between the recovery time and the maximum drought intensity and quantified the resilience using the curve area [20]. However, we found that this research overestimated resilience due to the occasional interference of drought events corresponding to maximum drought intensity.
Average drought intensity is the average of drought intensity of multiple events corresponding to the recovery time, it can avoid occasional interference of extreme drought and improve the accuracy of quantified resilience [55]. Therefore, this study replaced the maximum drought intensity index with average drought intensity and continued to adopt the method of fitting the dynamic response relationship curve to evaluate resilience. The fitted curve was defined as the resilience curve (Figure 4).

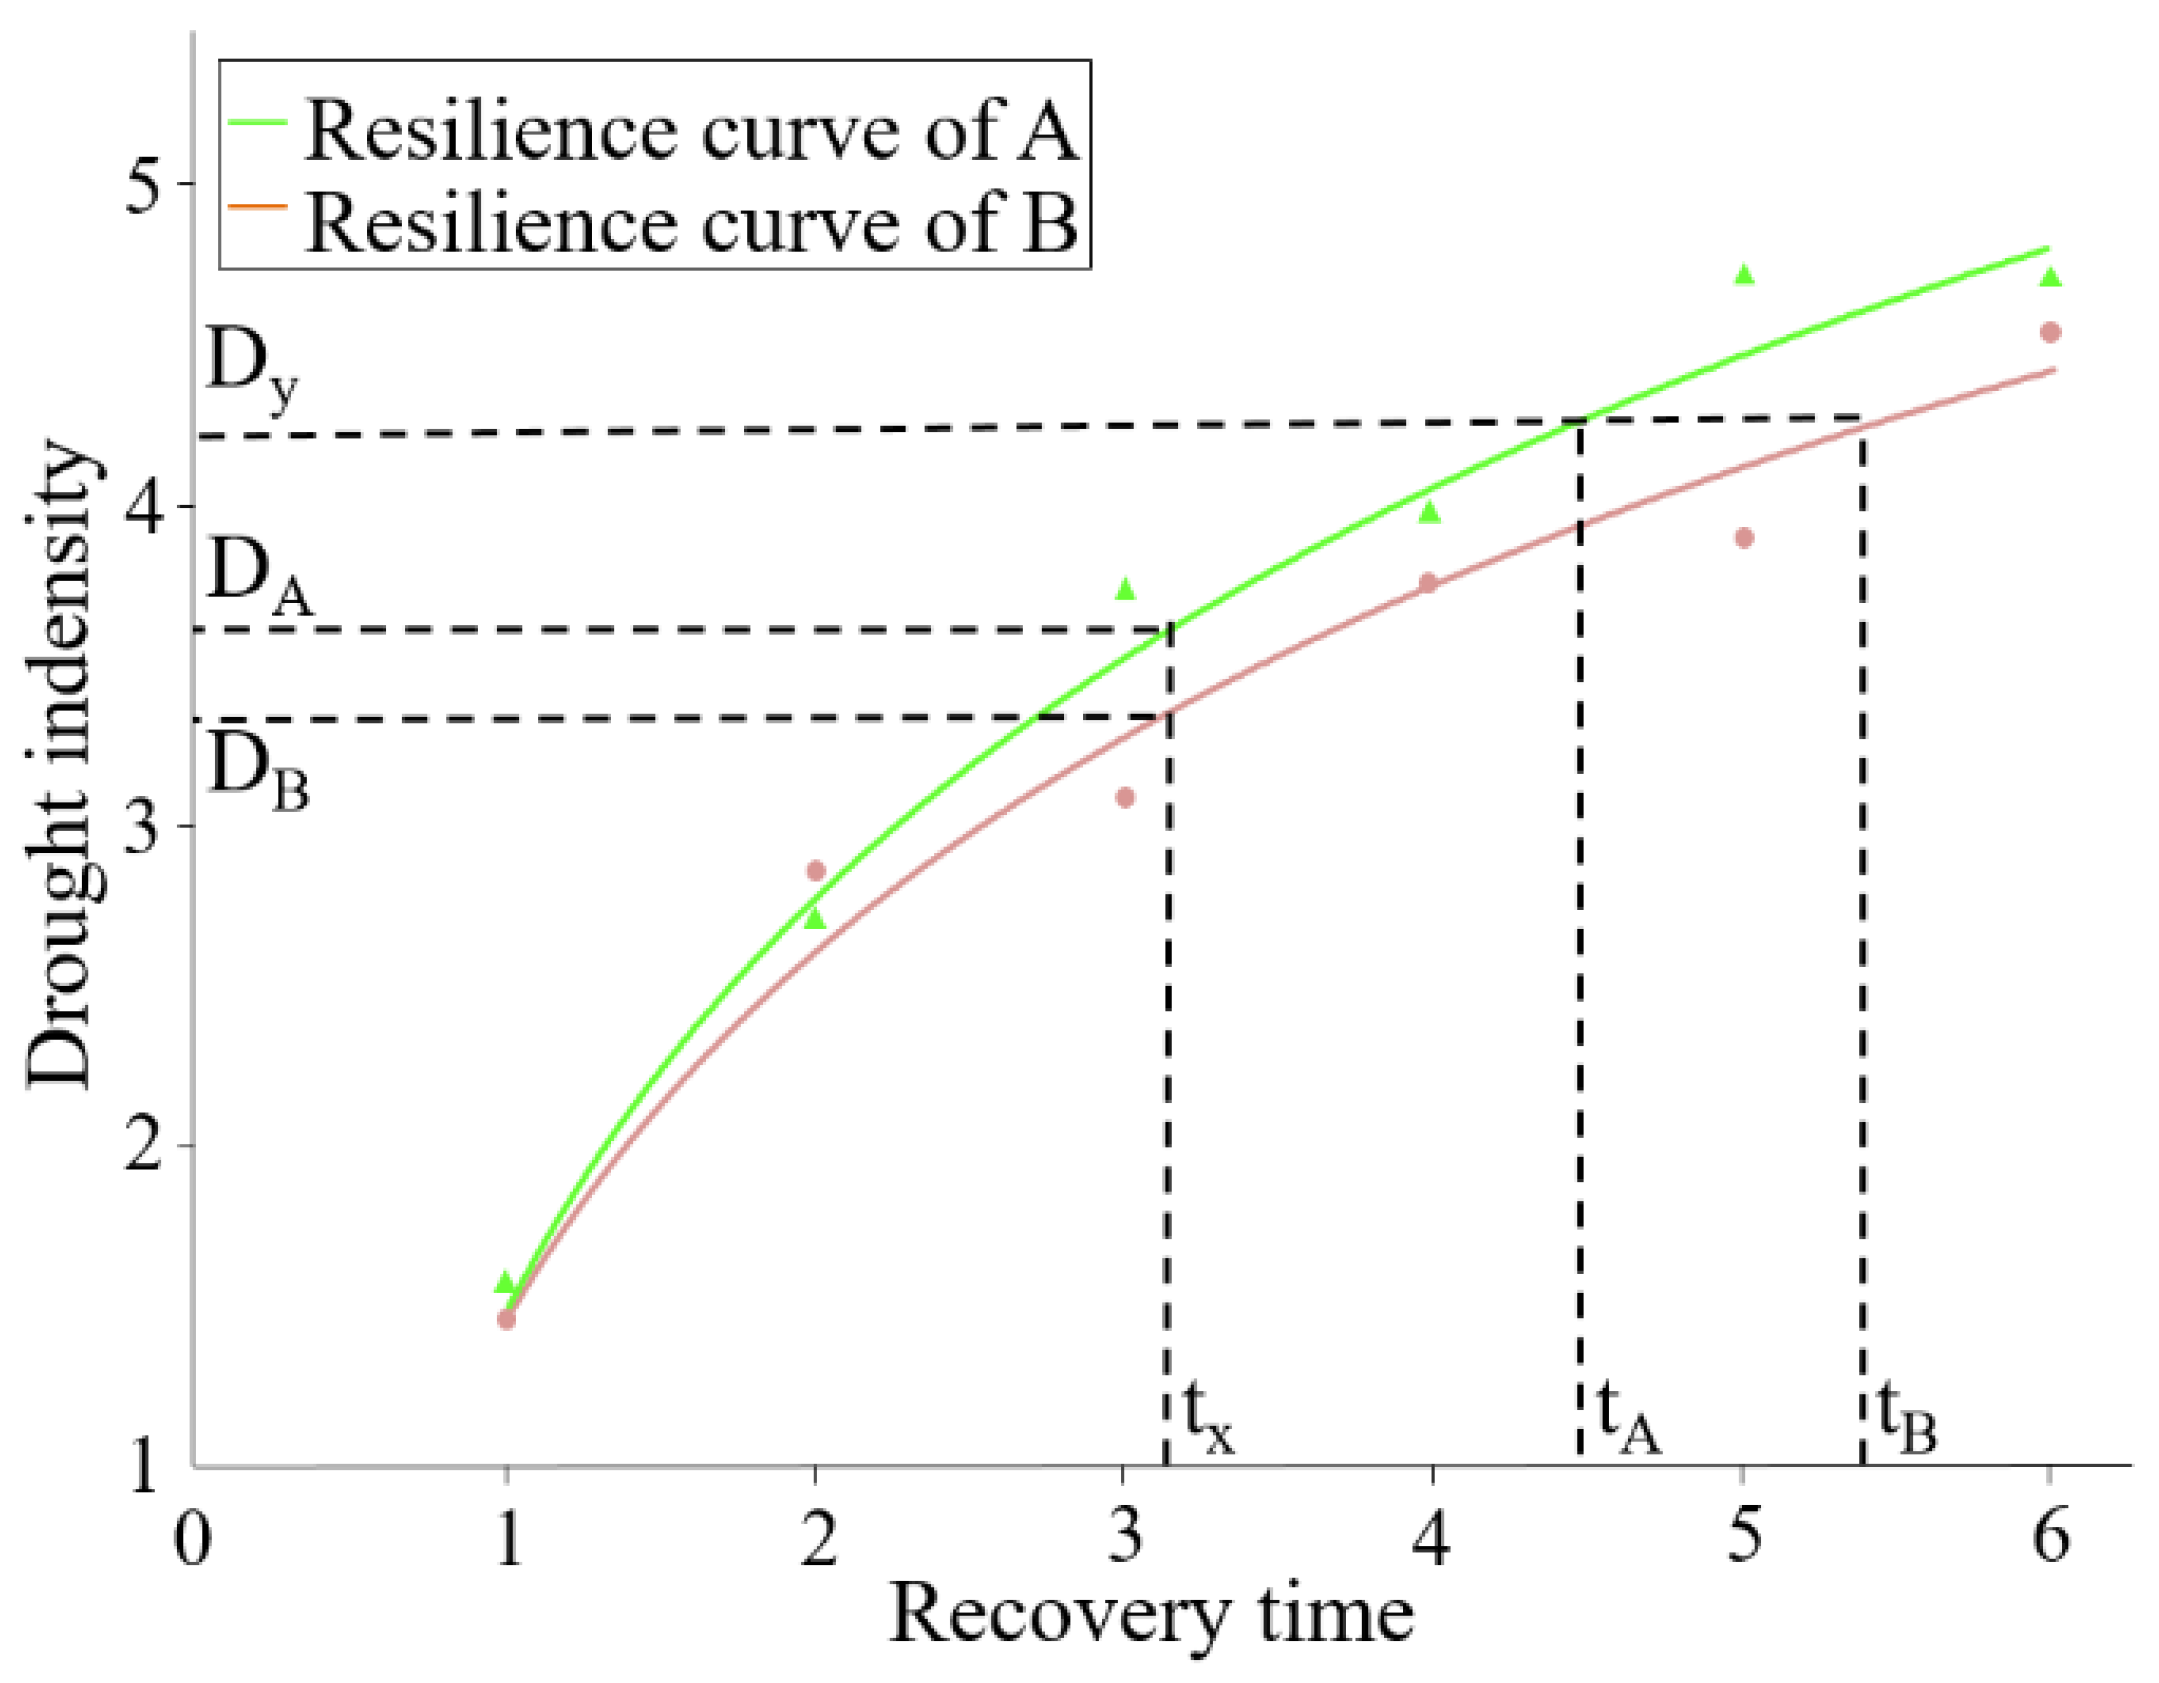
Interpretation of the Resilience Curve and Resilience Qualification

The resilience curves of forests in different elevation zones in this study have the following ecological implications [20,56]: (1) For forests in different elevation zones, the slope of the resilience curve is higher, and the response rate to drought is faster. (2) Forests that withstand greater drought intensity have greater resilience in the same recovery time. If forests in different elevation zones are subjected to the same drought intensity, a shorter recovery time will show greater resilience. (3) By fitting the curve, the recovery time taken for the ecosystem to recover while enduring the corresponding drought intensity can be estimated. (4) The curve provides a basis to measure whether the ecosystem disturbed by continuous drought events can restore during the calculated recovery time; otherwise, the ecosystem may collapse.
The area of resilience curves in this study has the following ecological implications [20]: Within the same recovery time, the larger the curve area, the lower the sensitivity of the forest to drought, and the higher the forest resilience to drought.

2.3.3. Resilience Curves

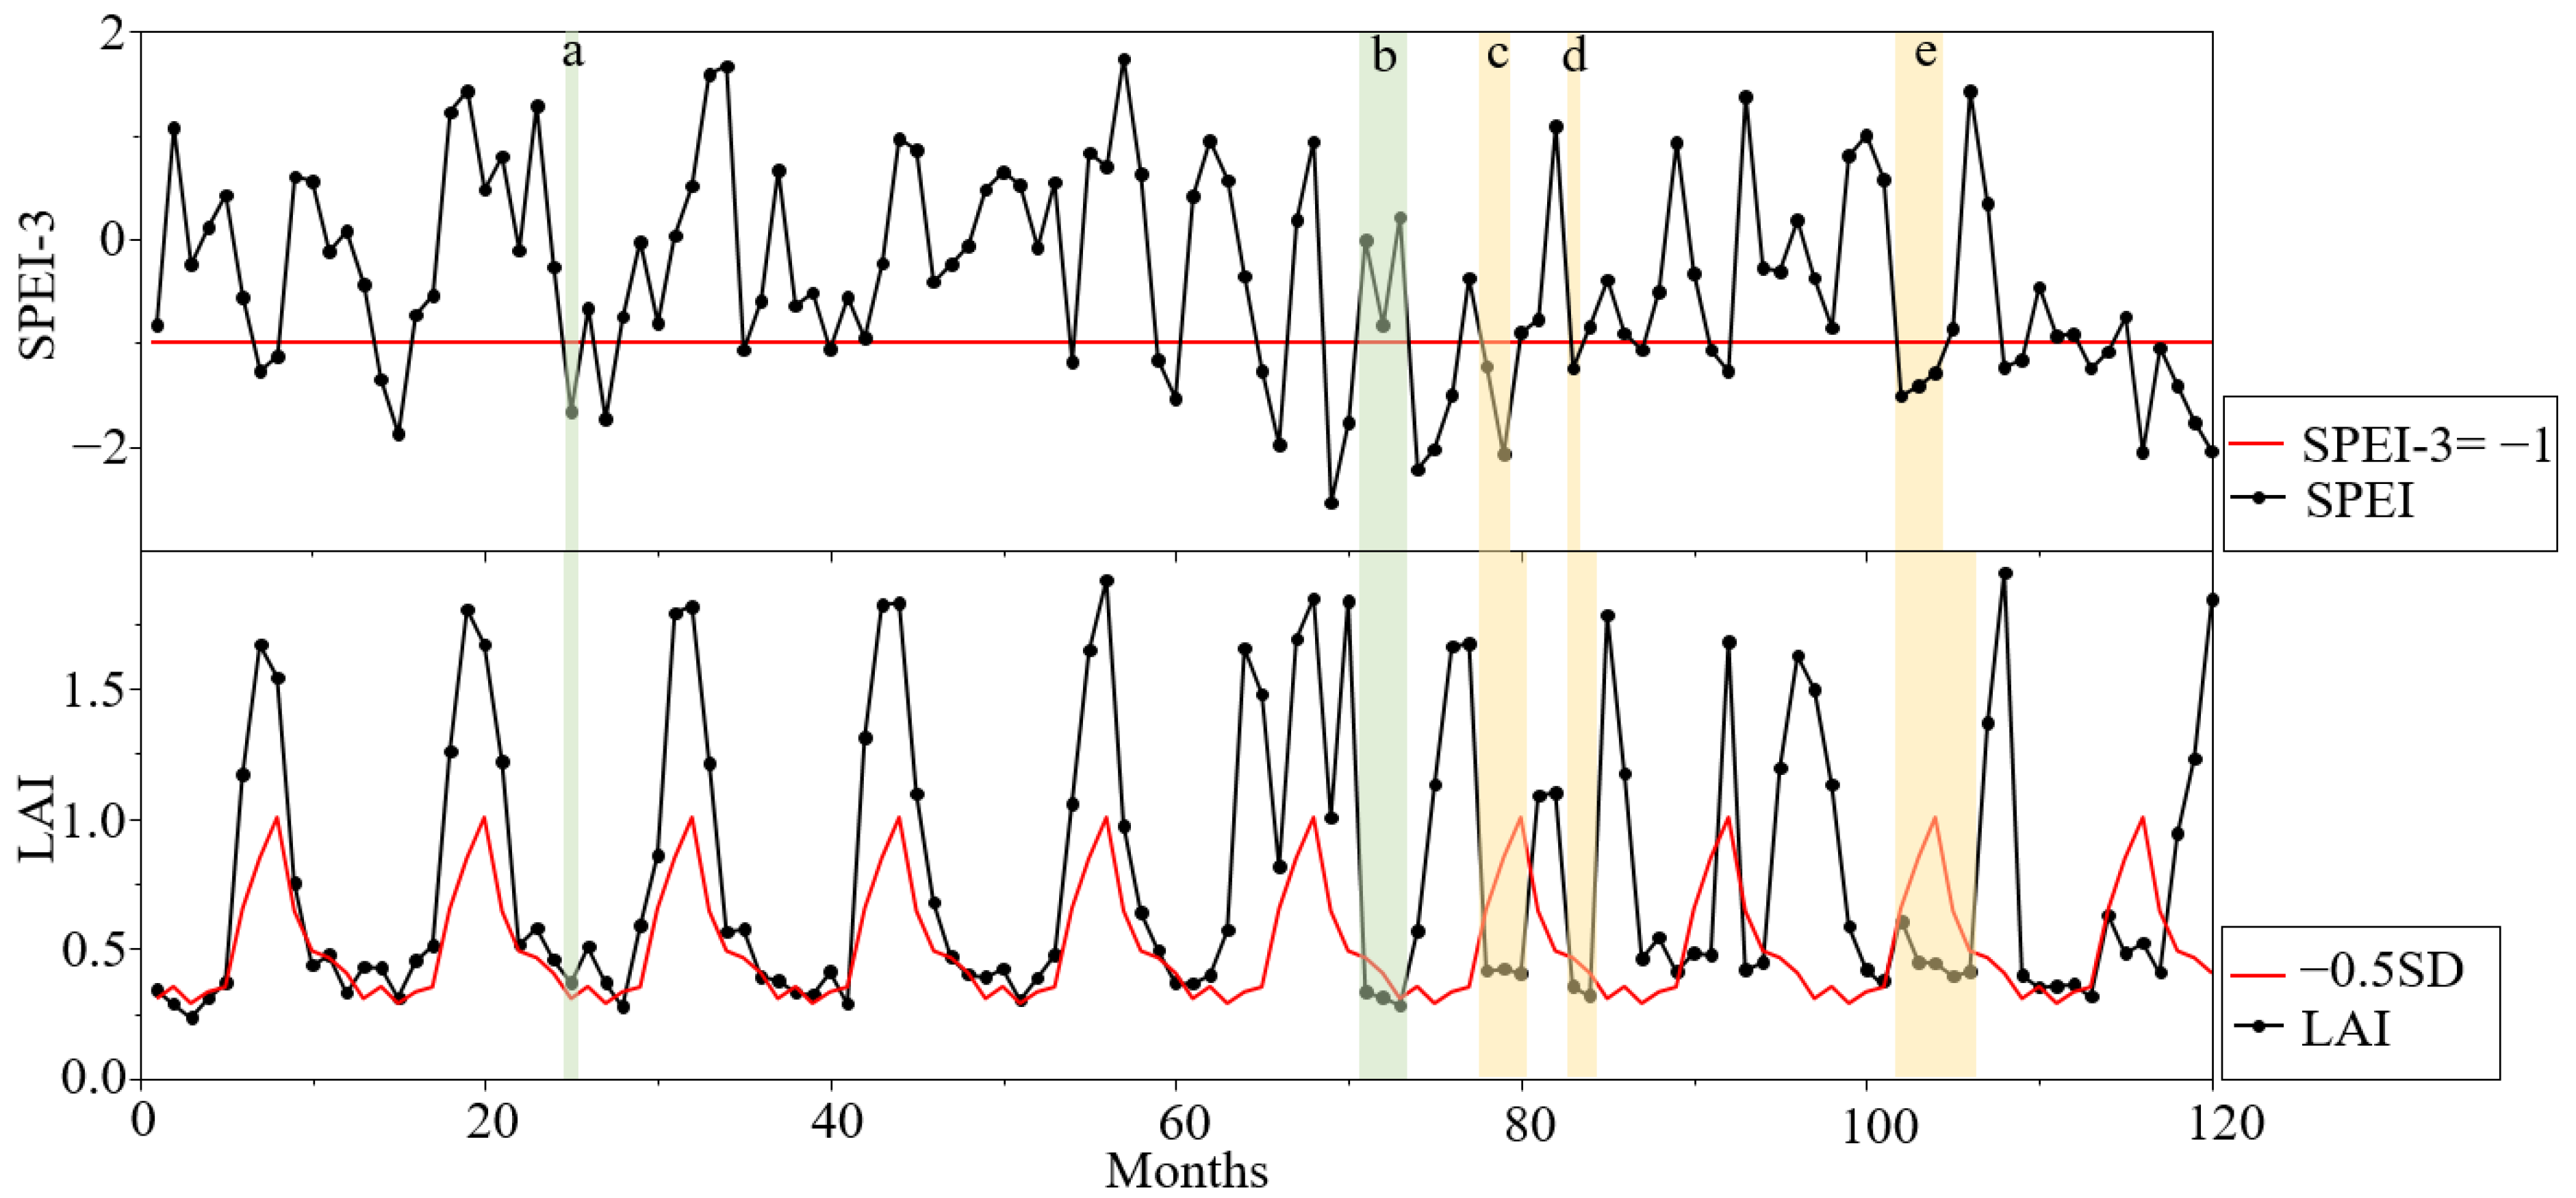
Definitions of Recovery Time and Drought Intensity

We take January as an example and selected a time series of LAI data from January 1982 to January 2020. Twelve sets of LAI time-series data from January to December were obtained. We calculated the mathematical expectation and standard deviation (SD) of these twelve sets of LAI time-series data, respectively. An SPEI below −1 indicated drought [57]. To reduce the impact of factors other than drought (insect pests, forest harvesting, mining, etc.) that contribute to LAI anomalies, the series where drought (SPEI-3 < −1) and LAI anomalies occurred concomitantly was selected [58,59]. Recovery time was defined as the time duration taken for an LAI under −0.5 SD to reach −0.5 SD again [16,20]. This approach is illustrated in Figure 5. After data filtering, we obtained time-series data that met the requirements, such as c, d, and e, where c, d, and e respectively indicated that the recovery time was 3 months, 2 months, and 5 months.
Drought intensity was computed as the absolute value of the monthly SPEI-3 (below −1) cumulative sum for a drought event within the recovery time [43,60,61]. Drought intensity was calculated as follows:
Drought   intensity = i = 1 n S P E I i
where  n  is the value for months with an SPEI-3 < −1 during the recovery time of each drought event.

Resilience Curve and Resilience Qualification

With recovery time as the horizontal axis and drought intensity as the vertical axis, the ecosystem resilience curve to drought was conducted by fitting the point data. We chose the logarithmic function  Y = a + b ln x  to represent the resilience curve based on the coefficient of determination (R2) of the fitted curve.
In this study, resilience at each recovery time was measured by using the area of the resilience curve, the algorithm was shown as follows [62]:
Resilience =   Y   d ( t )
where t represents recovery time.

2.3.4. Affecting Climate Factors of Forest Resilience

Forest restoration is a complex ecological process, which is influenced by a variety of factors, including climate factors, biotic variables, and external disturbances [63,64]. Climate factors directly affect plant growth and habitat environment. At the same time, they may interfere with other complex factors affecting forest restoration that are difficult to isolate and parse separately [65]. Therefore, we focused on exploring the impact of climate factors on the ratio of the drought intensity to the recovery time of historical events [20,66], specifically examining the effects of temperature (TEM), precipitation (PRE), cloud cover (CLD) and PET based on previous research results in the Qilian Mountains. TEM during the recovery period (RecTEM) was calculated as the average monthly temperature. RecPRE, RecPET, and RecCLD were obtained by the same calculation.
A random forest (RF) regression model was used to analyze the importance of factors affecting resilience. RF is a machine learning method based on decision trees, which can effectively deal with high-dimensional data and nonlinear relationships, and has high accuracy and good robustness [67,68]. Firstly, we randomly split the data, with two-thirds of the data as the training set and one-third of the data as the verification set. Then, we built an RF model consisting of 500 regression trees. During the splitting process of decision trees, factors that reduce the average Gini impurity less are considered more important to resilience.

2.3.5. Relationships between Forest Resilience and Dominant Factors

Generalized additive model (GAM) was applied to analyze the relationships between resilience and dominant factors. GAM is a non-parametric extension of generalized linear models, commonly used to explore the nonlinear relationship between the dependent variable and independent variables [69,70]. GAM was built using the “mgcv” package in R. We applied nature logarithmic transformation to it to reduce the impact of extreme values on the model [71], The form in the study was shown as follows:
f o r e s t   r e s i l i e n c e ~ G a u s s i a n
log ( f o r e s t   r e s i l i e n c e ) = β 0 + s ( x i ) + ε            
Forest resilience values follow Gaussian distribution. Where    β 0  is Constant intercept term,  ε  is random error,  s ( x i )  is the spline smoothing function that is automatically selected by the GAM model based on the nonlinear relationship between dominant climate factor and forest resilience in each elevation zone.

3. Results

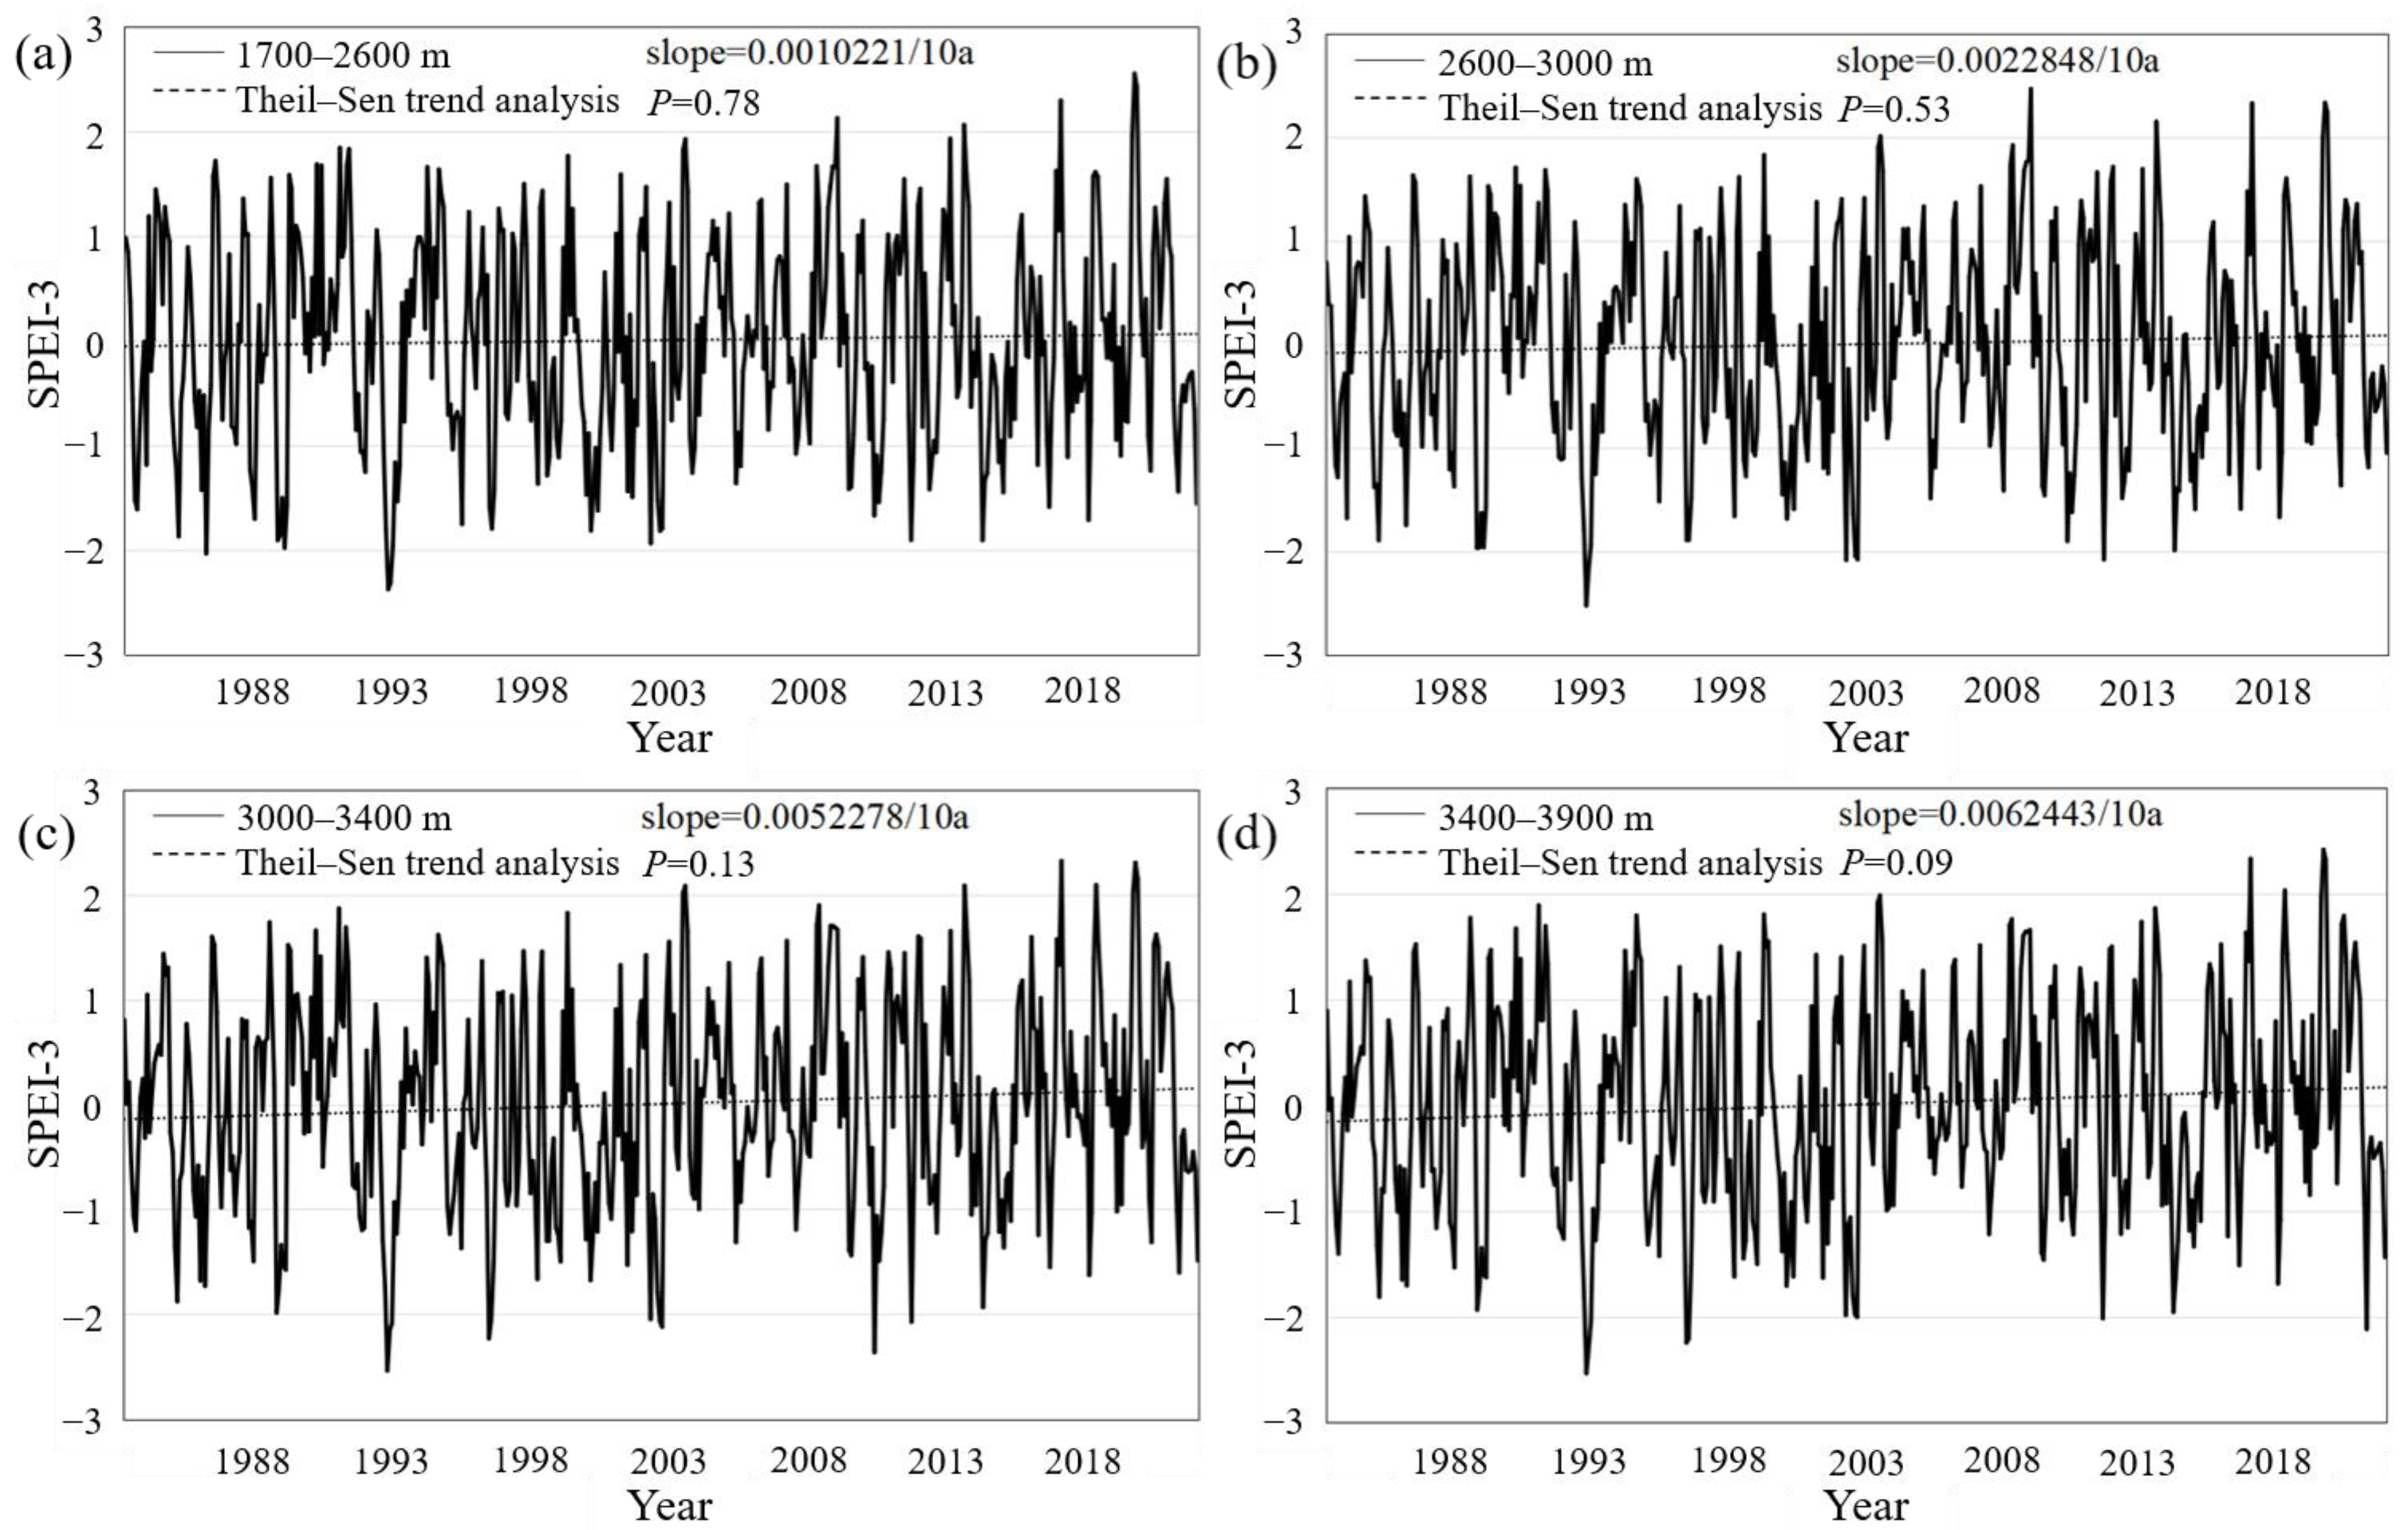
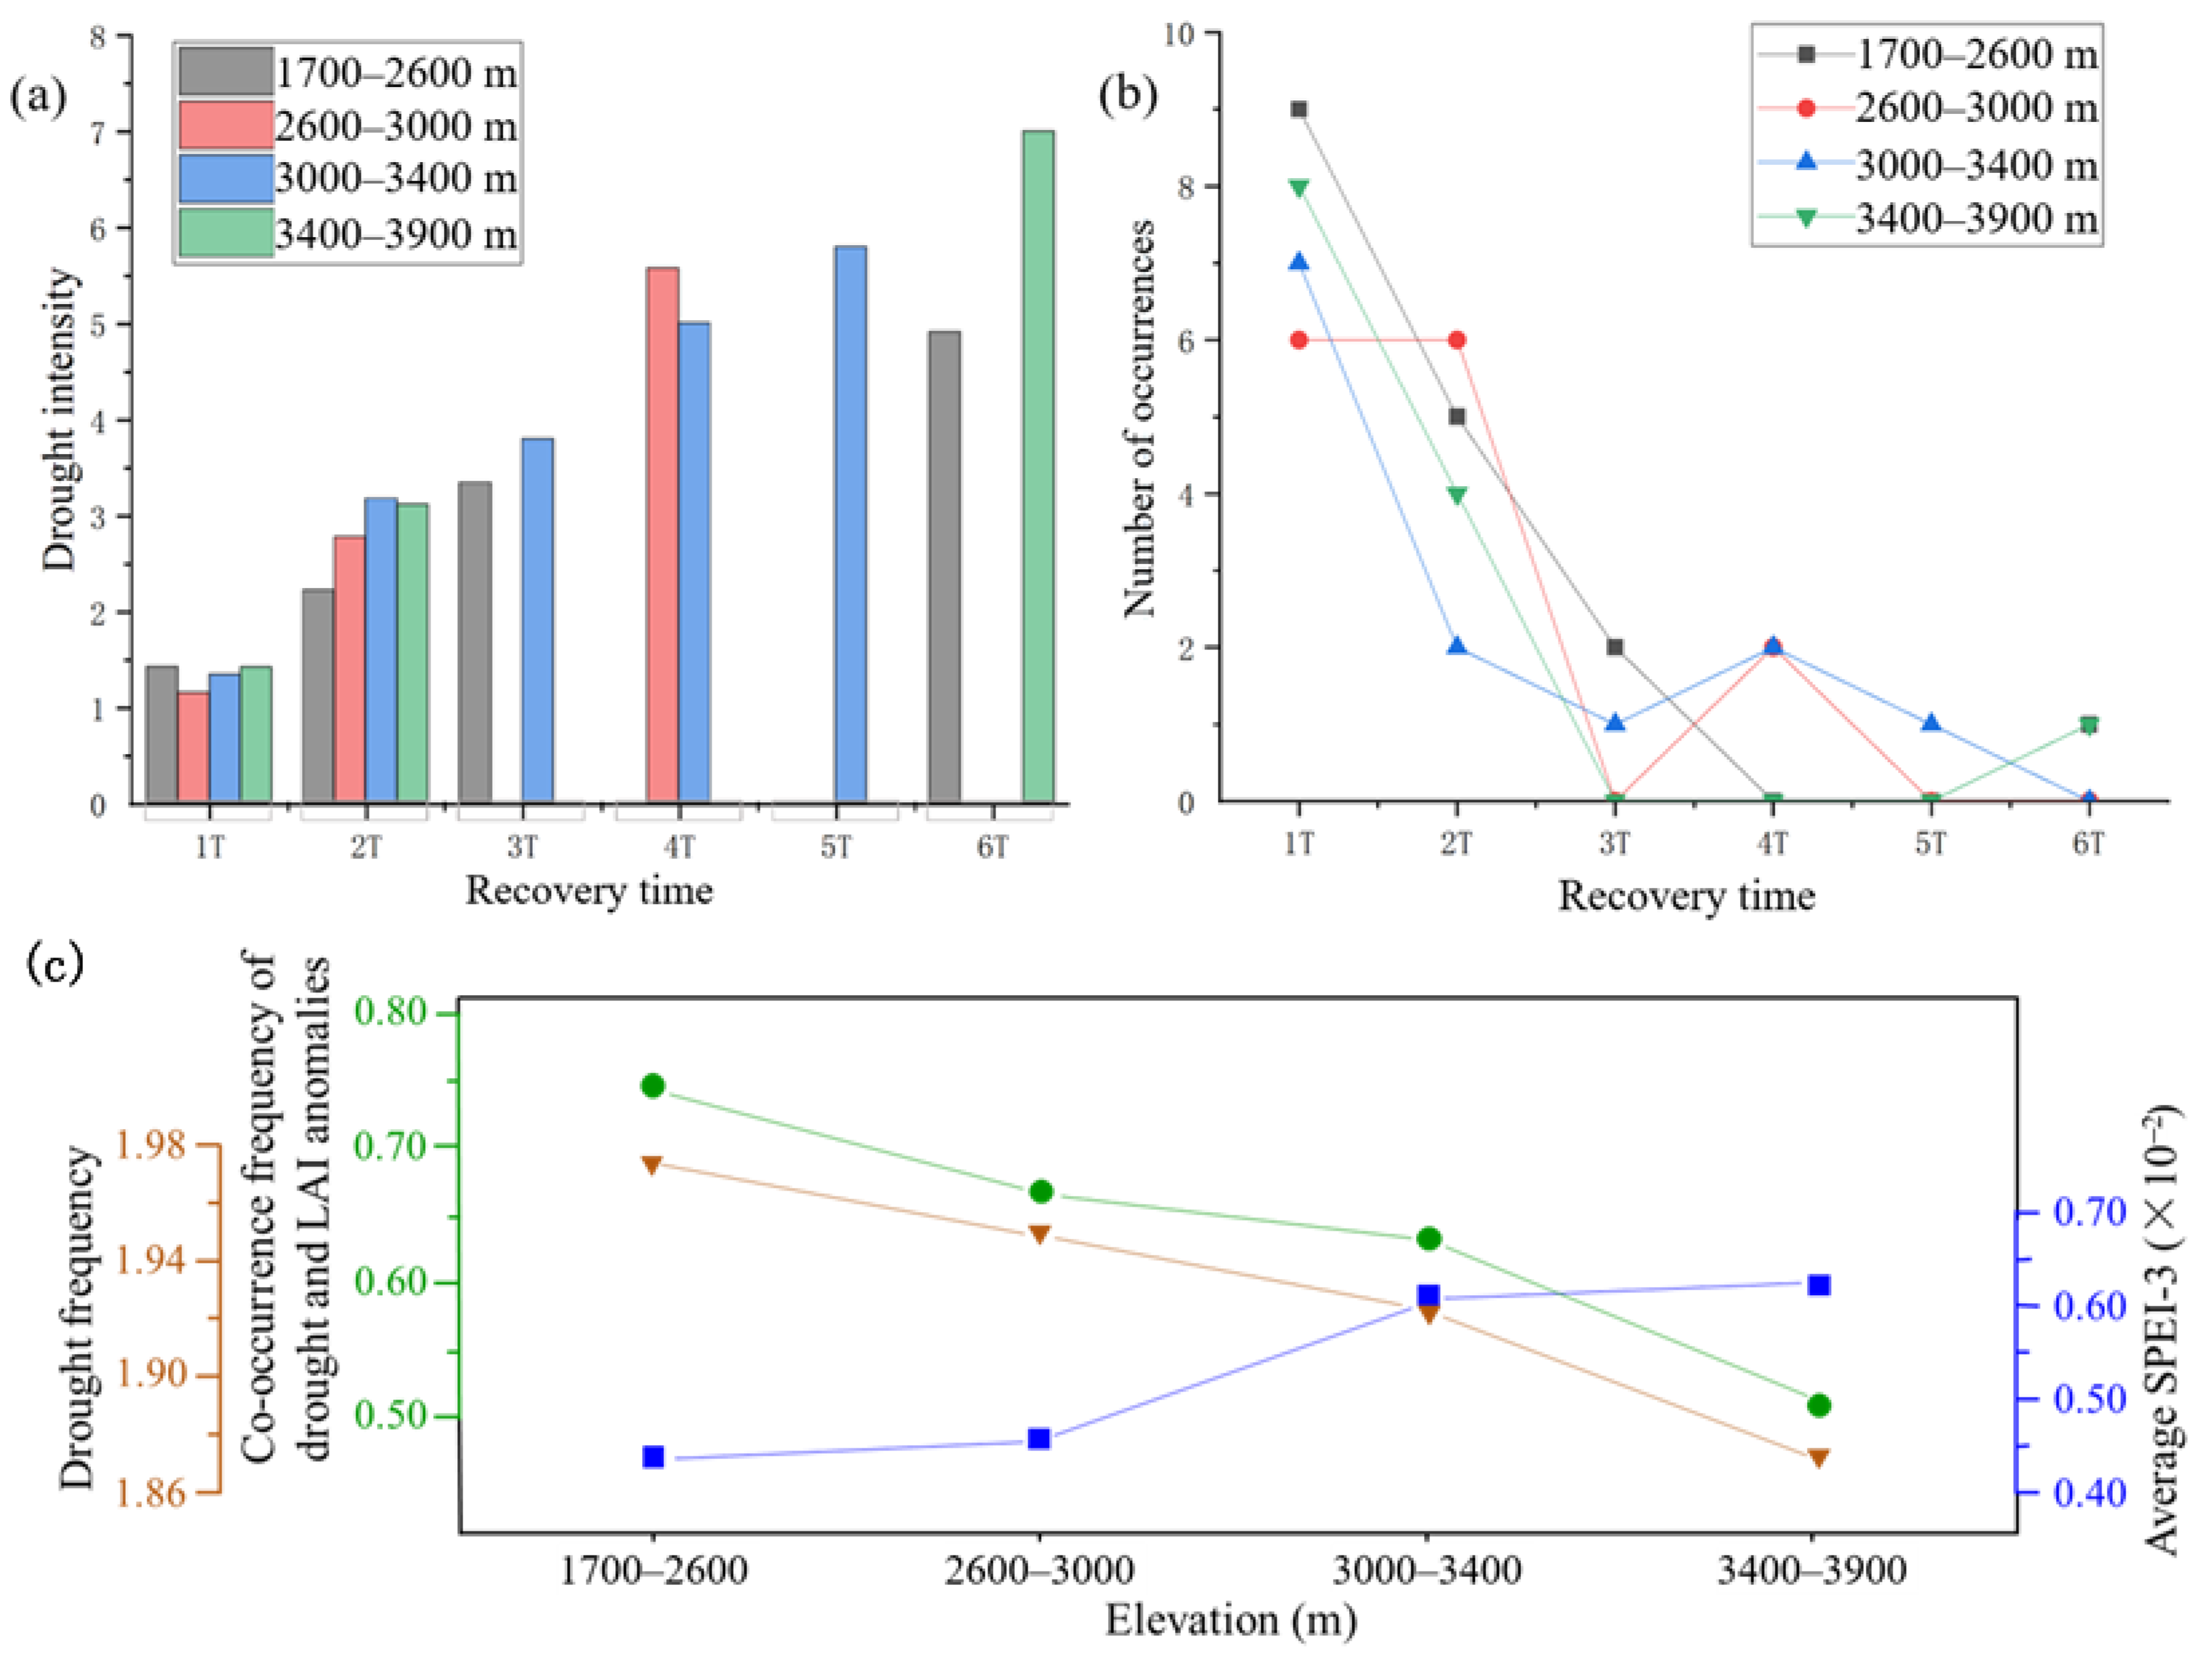
3.1. Altitudinal Differentiation of Forest Drought

Using Theil–Sen trend analysis and the Mann–Kendall trend test [71,72,73,74], the trends of the SPEI values in different elevation zones of QMNP from 1982 to 2020 were determined (Figure 6). The SPEI values of different elevation zones showed a non-significant increasing trend (p > 0.05) over the past 40 years, and the forests of different elevation zones showed different degrees of aridification. On the whole, forests at 3000–3900 m elevations showed higher linear slope values and lower p values than those at 1700–3000 m elevations. This indicated that the humid characteristics and trends towards humidification at higher altitudes were more notable. This may be mainly related to the pattern that precipitation increases as altitude rises in QMNP [23,24].
The drought intensity and drought occurrences in forests in different elevation zones are shown in Figure 7. The higher the drought intensity of the drought events experienced in the QMNP, the longer the recovery time required to return to the pre-drought state. The lower the drought intensity, the more frequent the drought events that occurred. Moreover, in terms of altitudinal differentiation, with the increase in altitude, the environment became more humid, the frequency of drought occurrence decreased, and the frequency of LAI anomaly occurrence under the interference of drought also showed a decreasing trend (Figure 7c).

3.2. Altitudinal Differentiation of Forest Resilience to Drought

The resilience curves of forests in different elevation zones fitted in this study are shown in Figure 8. The 1700–2600 m and 3000–3400 m resilience curves passed the significance test at the level of 0.05 and 0.01, respectively, while the 2600–3000 m and 3400–3900 m resilience curves only passed the significance test at the level of 0.1 because there were few sample points. From slope b of the resilience curves, the rates of forest resilience in response to drought in the different elevation zones increased in the order 1700–2600 m, 3000–3400 m, 3400–3900 m, and 2600–3000 m. The greater the rate, the more rapid and sensitive response to drought.
The differences in resilience along the integral interval of recovery time in different elevation zones and the dispersion coefficients [75] of resilience at each recovery time are shown in Figure 9. The forest resilience to drought gradually increased in the elevation ranges of 1700–2600 m, 3000–3400 m, 2600–3000 m, and 3400–3900 m. At the same time, the resilience curve area of 1700–2600 m was the smallest and far less than the other three elevation zones under the same recovery time, indicating that the forests in this elevation zone had the weakest resilience to drought disturbance. The areas of the resilience curves of forest ecosystems in the different elevation zones and the dispersion coefficients are shown in Table 1.

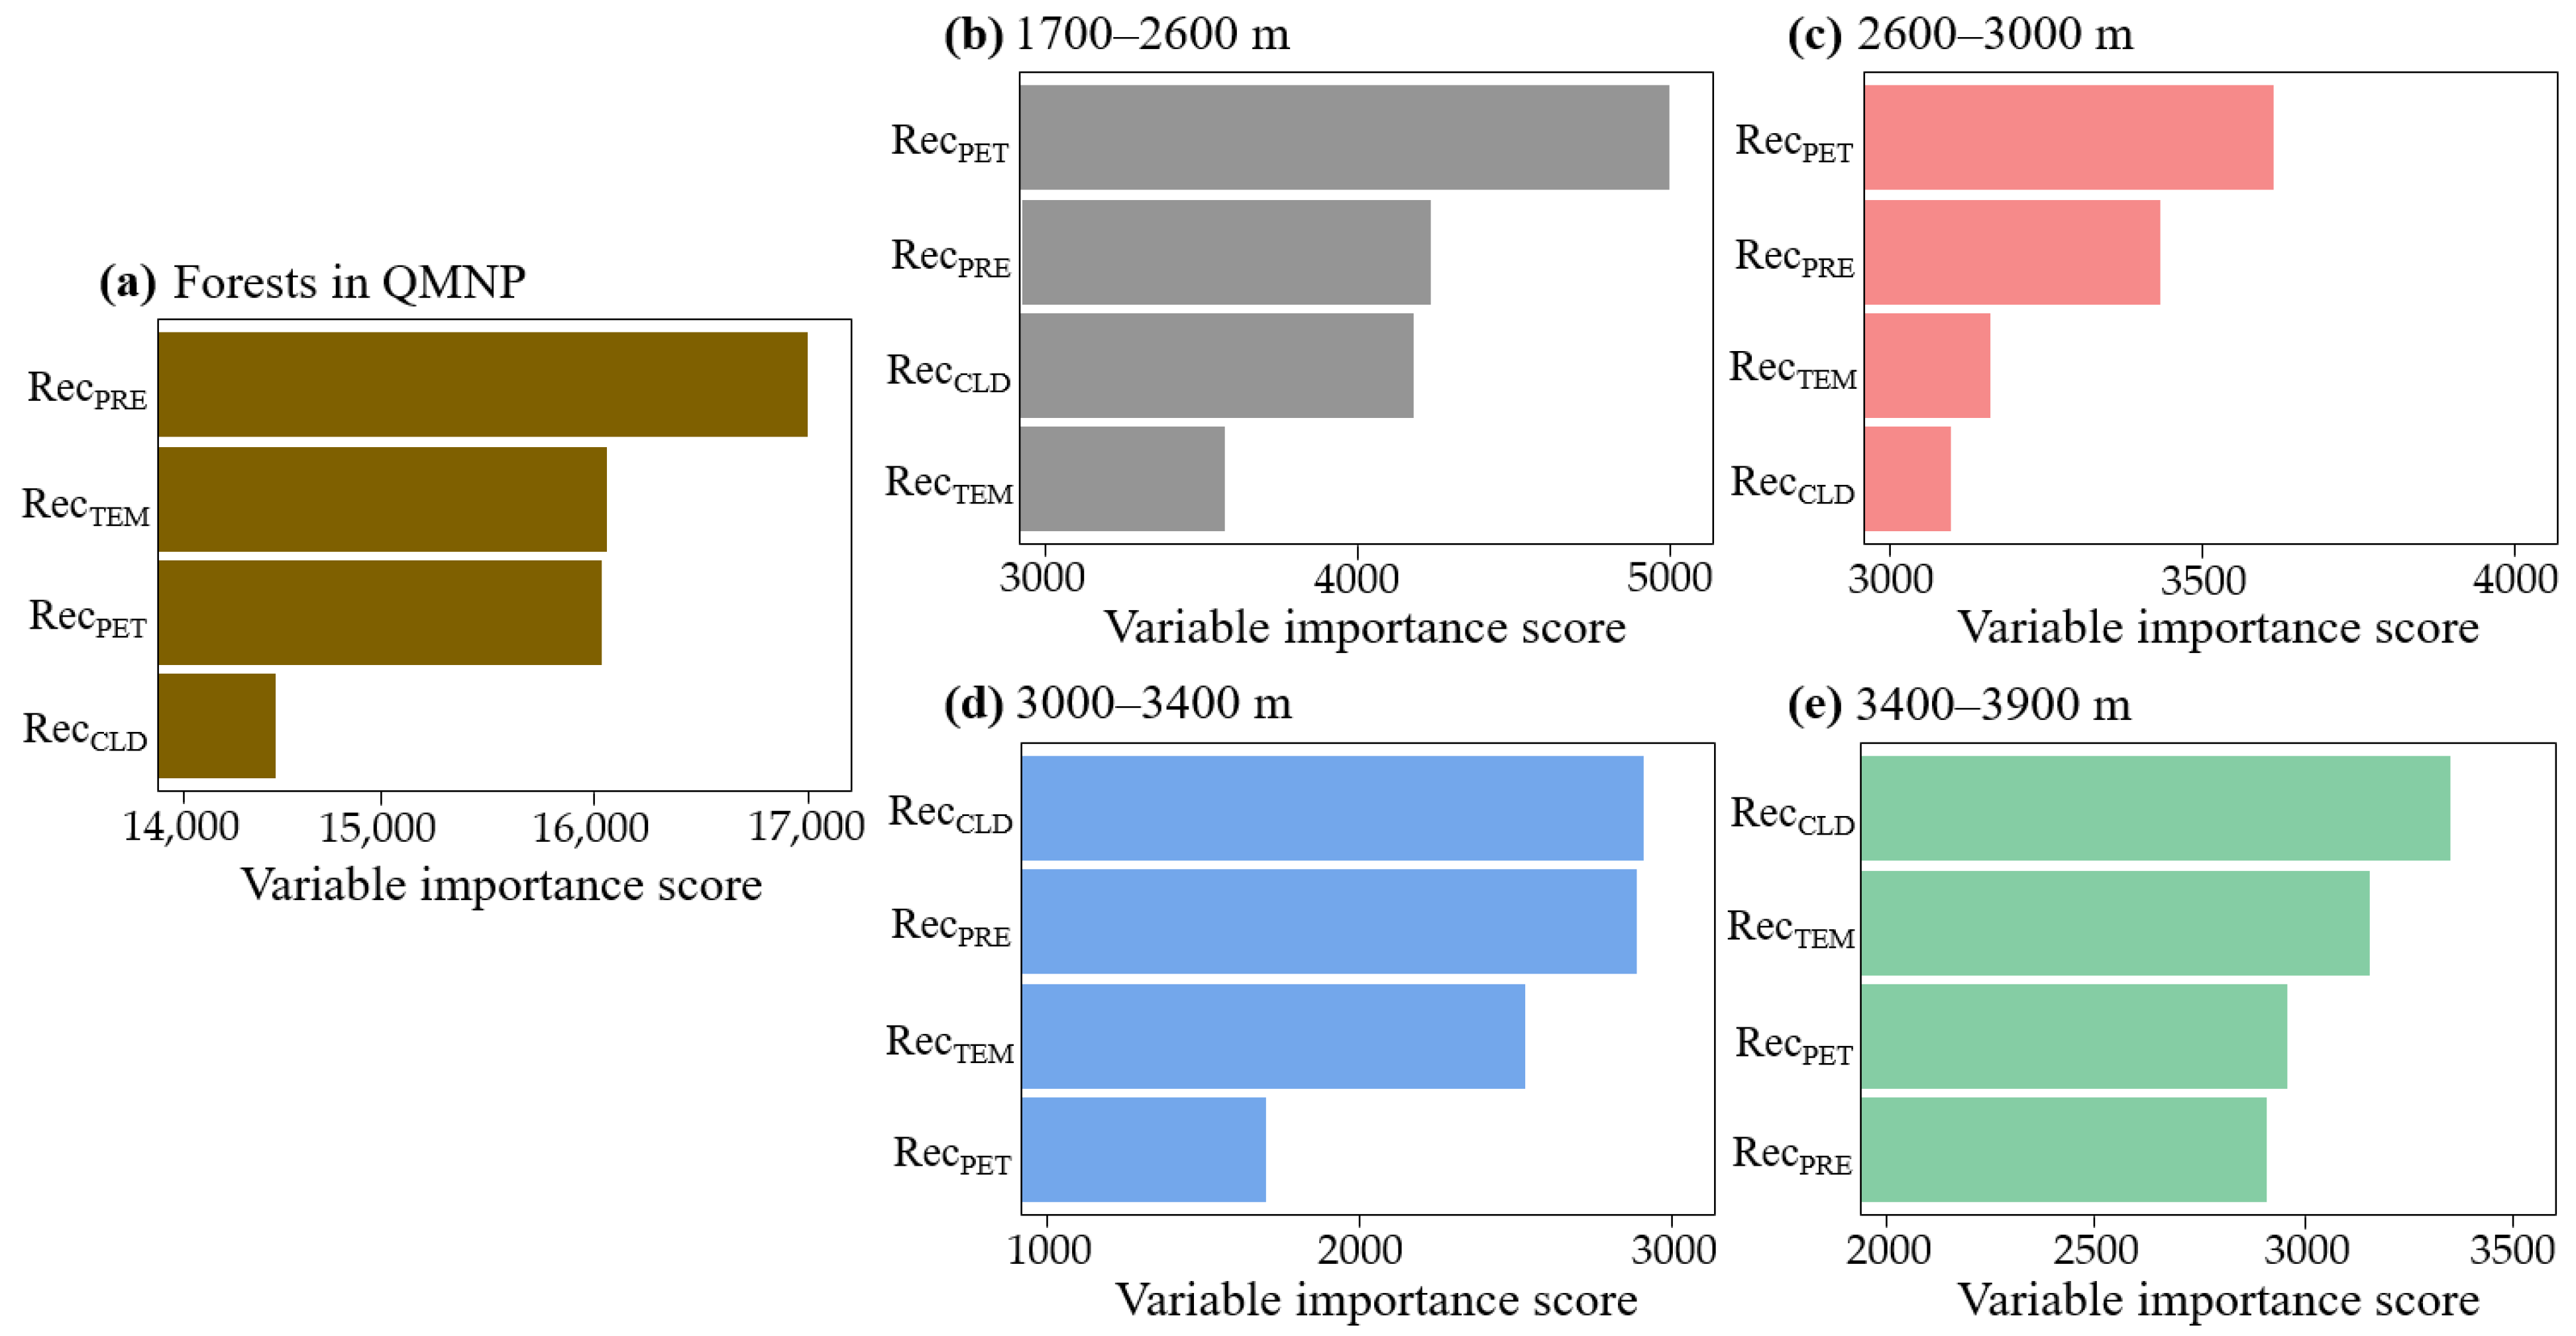
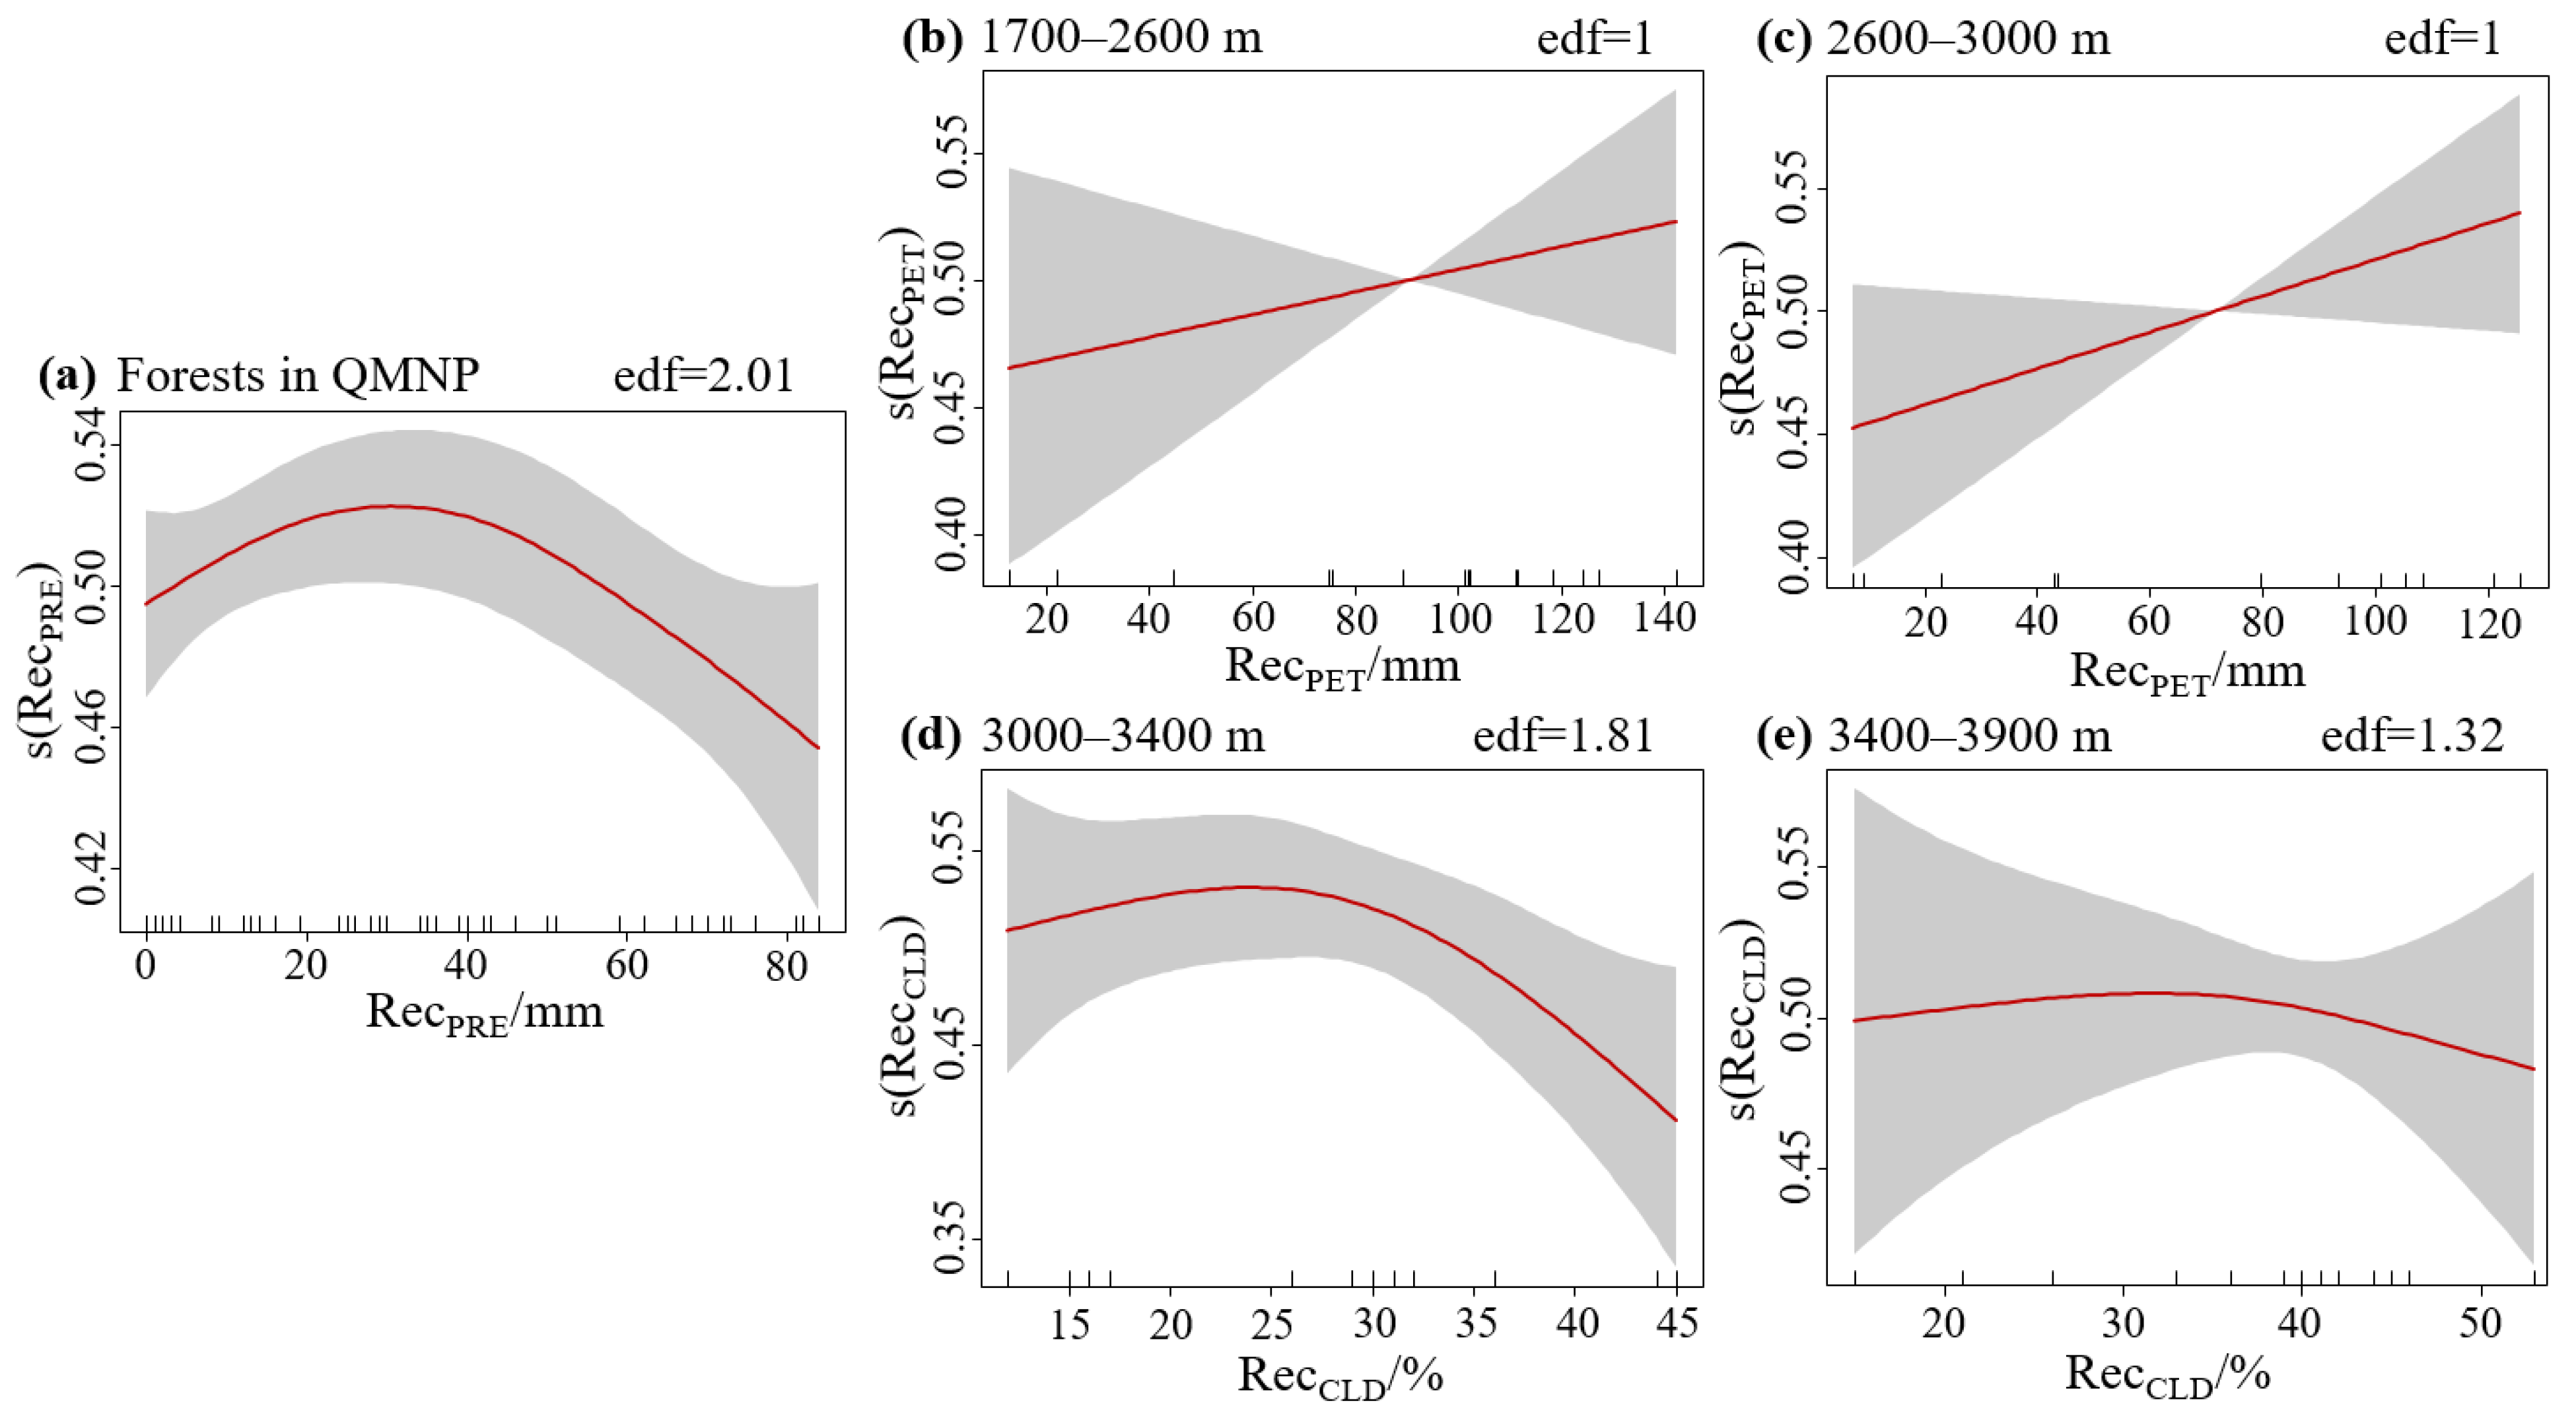
3.3. Dominant Climate Factors of Forest Resilience and Relationships

RecPRE was the dominant climate factor affecting altitude differentiation of forest resilience in QMNP (Figure 10a). With the estimated degree of freedom (edf) value of 2.01 based on GAM, the resilience non-monotonically responded to RecPRE (Figure 11a and Table 2). As precipitation increased, the resilience showed a trend of first increasing and then decreasing, and reached its peak when the precipitation is 30 mm.
In terms of the occurrence of historical drought events, we explored dominant factors of the temporal differentiation of forest resilience at different altitude zones. The results showed that RecPET was the most important climate factor affecting temporal differentiation of forest resilience in the 1700–3000 m altitude zones (Figure 10b,c). The edf value of one indicated the linear relationship, and greater potential evapotranspiration enhanced resilience (Figure 11b,c and Table 2). RecCLD was the most important climatic factor affecting temporal differentiation of forest resilience in the 3000–3900 m altitude zones (Figure 10d,e). The edf values were 1.81 and 1.32, respectively, indicating that the resilience non-monotonically responded to cloud cover (Figure 11d,e and Table 2). As cloud cover increased, the resilience showed a trend of first increasing and then decreasing. Specifically, forest resilience reached its peak at 24% cloud cover over 3000–3400 m and 33% cloud cover over 3400–3900 m.

4. Discussion

4.1. Indicative Significance of the Resilience Curve for Primary Forests within the Protected Area

In this study, we established the link between drought intensity and the correlating recovery time of dryland mountains to fit resilience curves and summarized the altitudinal differentiation of resilience. This can serve as a foundation for sustainable ecological management and environmental protection of dryland mountains.
(1)
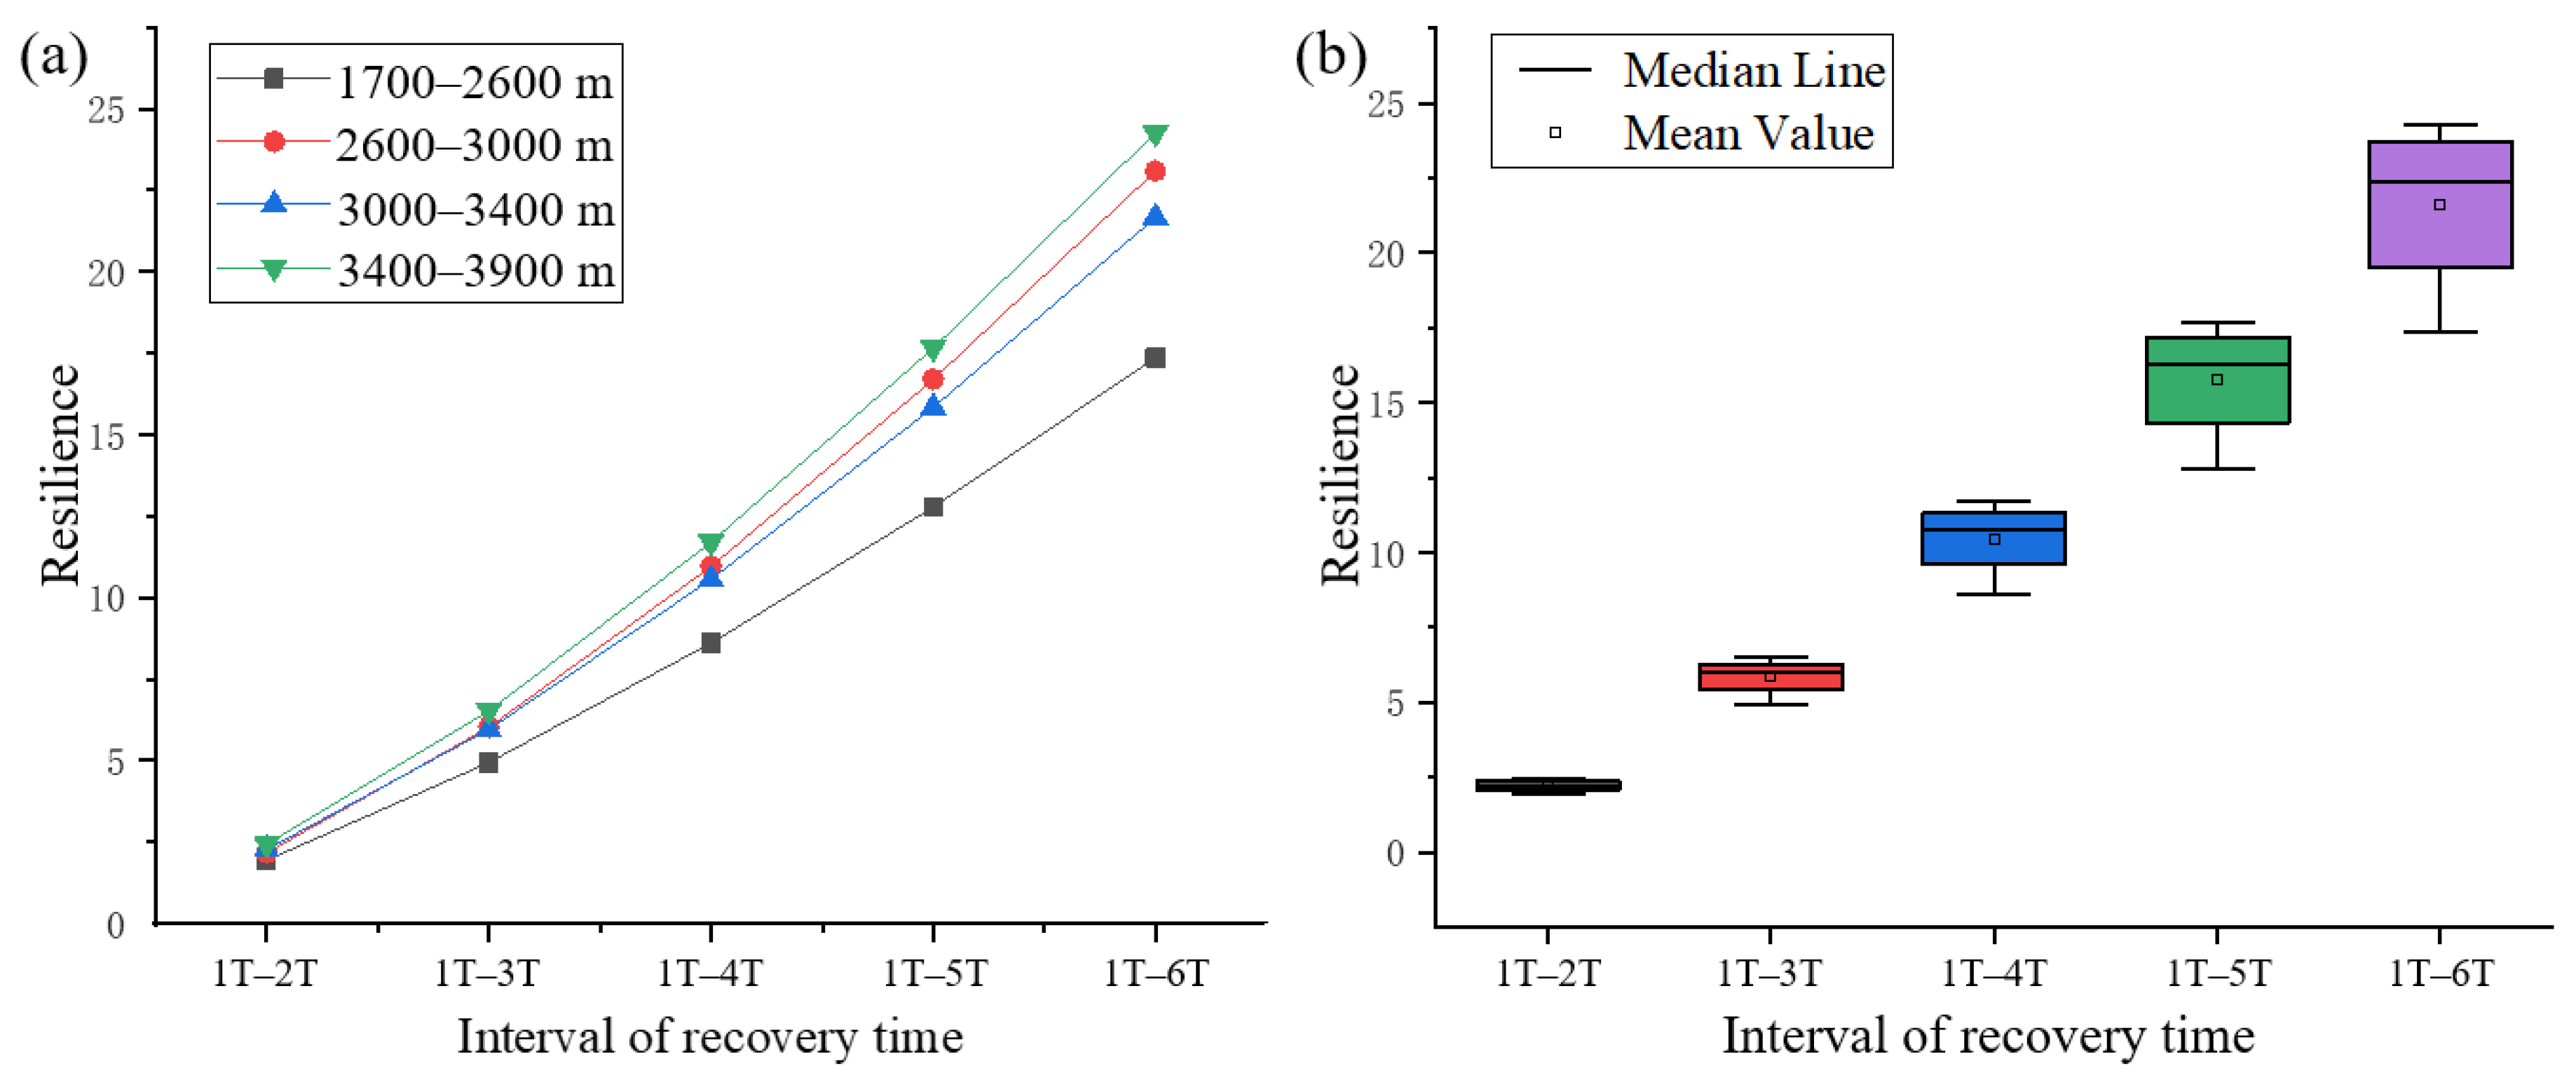
The resilience curves can help ecological departments make decisions by assessing the resilience. The resilience to drought of lower-elevation forests in the QMNP is lower than that of higher-elevation forests, and the sensitivity to drought is higher (Figure 8 and Figure 9). This indicates that the relevant departments should focus on formulating ecological environmental protection policies and strengthening the sustainable management of lower-elevation forests in the future.
(2)
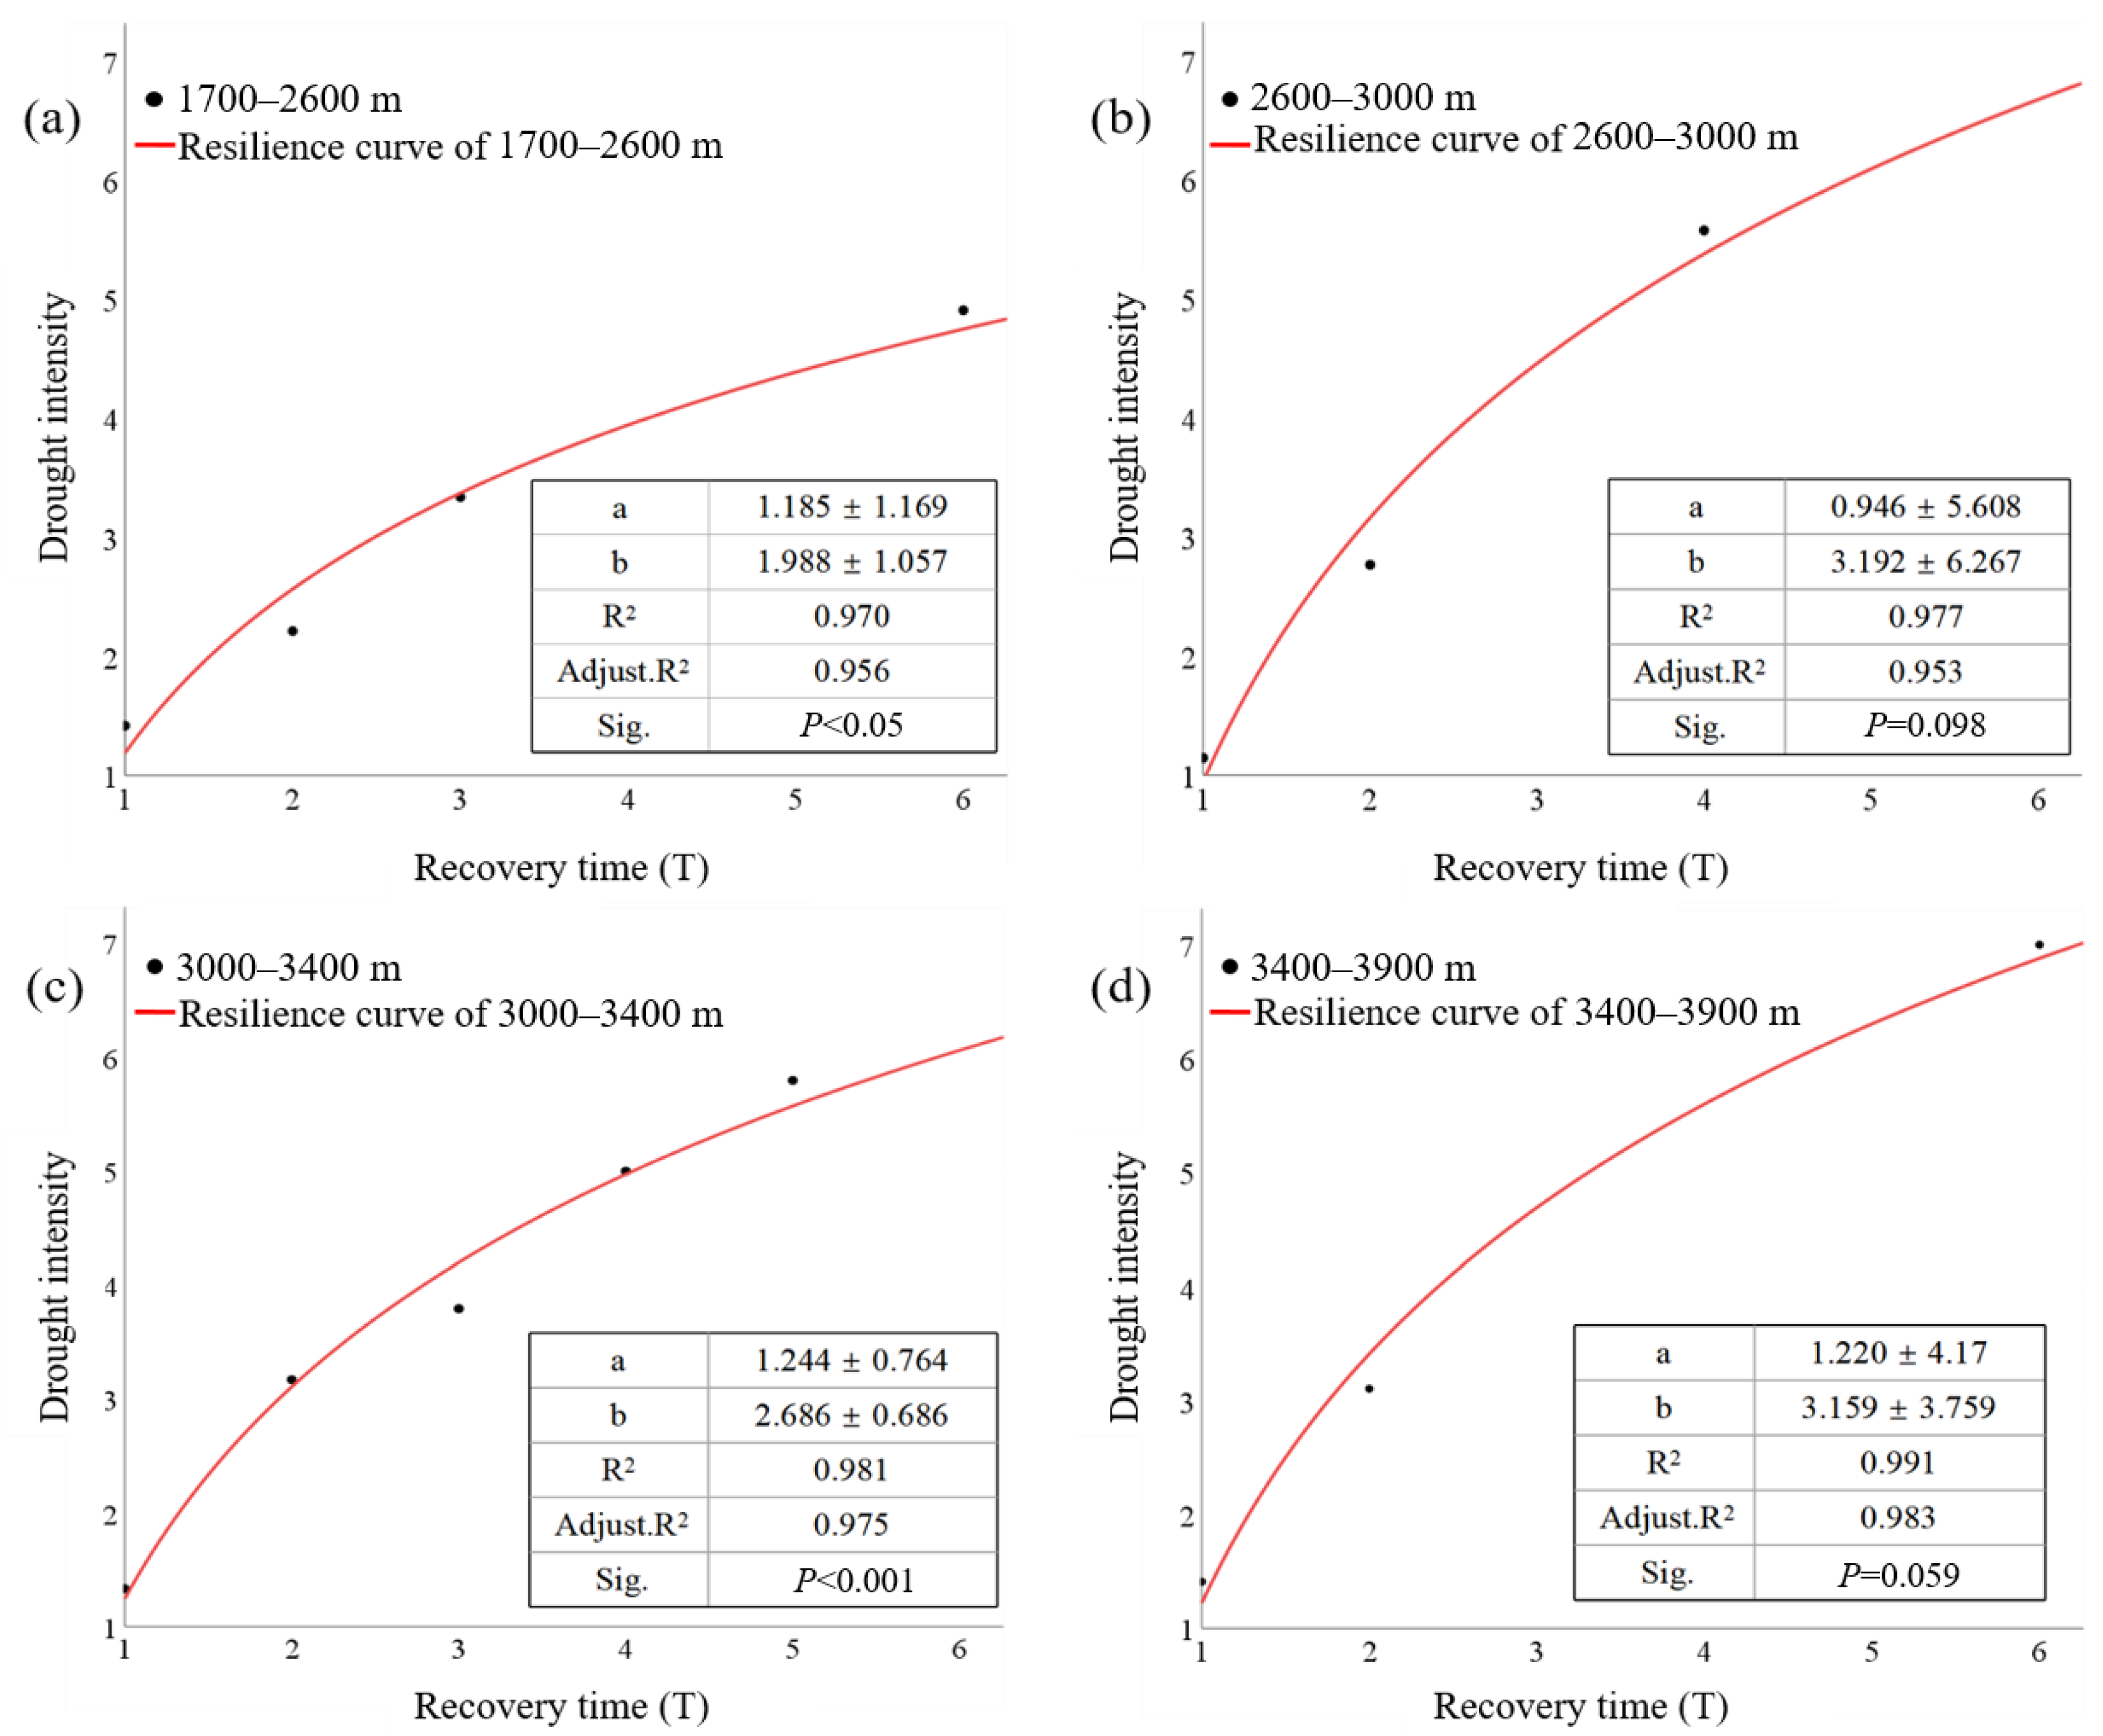
The resilience curves allow us to estimate the recovery time required for ecosystems to recover after a drought event of certain intensity. For instance, if the value of drought intensity in QMNP is five, the recovery times for forests at elevations of 1700–2600 m, 2600–3000 m, 3000–3400 m, and 3400–3900 m are 6.8 T, 3.6 T, 4 T, and 3.3 T, respectively (Figure 8). The resilience curve provides scientific data to help primary forests cope with drought disturbance in order to prevent ecosystem collapse in the future.
(3)
The protected area could predict changes in resilience and tree lines based on future climate change through the resilience curves. The average annual temperature and average annual precipitation in the QMNP have been increasing in recent years, and the climate has tended to become warmer and more humid [25,26]. The average annual temperature in the QMNP increased by 0.048 °C/y and the average annual precipitation increased by 1.17 mm/y from 1985 to 2019. Because March–October is the peak season for forest growth in the Qilian Mountains, the response of forest ecosystem resilience to drought is mainly reflected in spring, summer, and autumn, where the annual average temperature increased by 0.069, 0.056, and 0.044 °C/y, and the annual average rainfall increased by 0.020, 0.545, and 0.669 mm/y, respectively [76]. Therefore, forests in the growing season in the QMNP will become warmer and wetter in the future, forest resilience to drought will become stronger, forests with strong resilience will expand, and the lower forest line will decline and the upper forest line will rise in the future.

4.2. Dominant Climate Factors Underlying Altitude Differentiation of Forest Resilience

The recovery rate and quantitative evaluation value of forest resilience to drought at elevations of 2600–3900 m in QMNP were higher than those at elevations of 1700–2600 m (Figure 8 and Figure 9), indicating greater resilience. We found that precipitation is the most important climate factor influencing the altitude differentiation of resilience (Figure 10a), consistent with previous studies on vegetation response to climate in QMNP [77,78]. As precipitation increased, resilience tended to increase first and then decrease, peaking when the total monthly precipitation reached 30 mm (Figure 11a). Previous studies have shown that soil moisture is the main water source of forest growth. Relatively abundant precipitation increases soil moisture and the accumulation of available water in forests. Furthermore, it has a positive impact on plant physiological processes. Takahashi, F., et al. [79] found that relatively abundant precipitation increases the water film on the surface of plant leaves, improving the water use efficiency and the photosynthetic efficiency. Moreover, relatively abundant precipitation can also improve soil nutrient conditions. A recent study indicated that increased precipitation can enhance soil nutrient content and promote plant restoration [80]. Therefore, under the same tree species, forests in elevation zones with relatively low aridity have a greater chance of survival and are more resilient to drought [81,82]. As the altitude rises, precipitation increases until reaching the peak at approximately 3300 m in QMNP [22,26,27,83]. This contributes to the decreasing frequency of drought, frequency of simultaneous occurrence of drought and LAI anomalies, and sensitivity of forest ecosystems to drought (Figure 7c), which are conducive to enhancing species resilience to drought. Accordingly, forests at higher elevations exhibit greater resilience to drought compared to those at lower elevations.
In exploring the climate factors of forest resilience temporal differentiation at different altitude zones during the recent 40 years, we found that potential evapotranspiration was the dominant climate factor for forest resilience temporal differentiation in the altitude zone of 1700–3000 m (Figure 10b,c). Increased potential evapotranspiration enhanced the resilience, showing a positive correlation relationship (Figure 11b,c). This is because increased potential evapotranspiration can improve soil moisture, promote root expansion, and enhance the nutrient and water absorption capacity of plants [84]. Additionally, in the microenvironment observation in some arid areas, researchers have found that increased potential evapotranspiration can also promote the activity of soil microorganisms that play a crucial role in organic matter decomposition and nutrient cycling [85]. This helps accelerate the decomposition of organic materials and the circulation of nutrients, thereby enhancing forest resilience to drought. We also found that cloud cover was the dominant climate factor for forest resilience temporal differentiation in the altitude zone of 3000–3900 m (Figure 10d,e). With increasing cloud cover, the resilience showed a trend of increasing first and then decreasing (Figure 11d,e). This may be attributed to the phenomenon that increased cloud cover reduces light and temperature, restrains transpiration, promotes soil moisture, and facilitates plant growth [86]. However, excessive cloud cover is not conducive to forest recovery from drought events. Ji et al. [87] pointed out that excessive cloud cover reduces the availability of sunlight, thereby weakening photosynthesis and inhibiting vegetation growth. Moreover, Garcia-Carreras et al. [88] found that increased cloud cover enhanced environmental humidity in forests, resulting in the breeding and spread of diseases and pests, and further reducing forest resilience to drought. While previous studies generally emphasized that temperature and precipitation are the dominant climate factors affecting the differentiation of vegetation response to climate change [25,27,76], in this paper, we tentatively highlight the importance of potential evapotranspiration and cloud cover in future research on this process.

4.3. Limitations and Perspectives

The underlying physiological mechanisms of species influence the ability of the species to recover from drought [88,89,90,91]. In QMNP, the dominant species at an altitude of 1700–2600 m are Ulmus glaucescens Franch., Pinus tabuliformis Carr., and scattered stands of Picea crassifolia Kom. At higher altitudes of 2600–3900 m, Picea crassifolia and Sabina przewalskii Kom. become the dominant species (Figure 3). The results indicated that Picea crassifolia and Sabina przewalskii exhibited stronger resilience to drought compared to Ulmus glaucescens and Pinus tabuliformis (Figure 8 and Figure 9). The stronger resilience of the former species may be attributed to their deep root system and small leaf surface area, which allow them to absorb water from deep soils and reduce water loss of transpiration during droughts [92,93]. Conversely, the latter species have limited access to deep soil moisture or experience higher water loss due to their shallow roots or larger leaf surface areas, resulting in weaker physiological adaptations and resilience to drought events [94,95].
However, our study of forest resilience was based on ecosystem scales, and we only obtained the distribution elevation information of different tree species in QMNP through field investigations. Moreover, Sabina przewalskii, Picea crassifolia, Pinus tabuliformis, and Ulmus glaucescens have significant similarities in morphology, structure, and spectral characteristics [96,97]. It is difficult to distinguish them using remote sensing images, which resulted in the inability to obtain the spatial distribution map of tree species. In addition, the response process of ecosystems to climate is complex, and the impact of species on this process is often multi-channel, involving changes in multiple indicators such as biomass, crown width, tree height, etc. [63,65]. It remains a challenging task in ecology to accurately explore the quantitative effects of tree species on ecosystem scales using specific indicators. Therefore, it is difficult to quantitatively investigate the impact of species on resilience in this study, and it will be the focus of our future work.

5. Conclusions

In this study, Qilian Mountain National Park was selected as a typical area of dryland mountains. We used an improved resilience indicator that coupled drought intensity and corresponding recovery time and analyzed the characteristics of resilience altitude differentiation. Then, the dominant climate factors underlying altitude differentiation of forest resilience were explored using a random forest regression model, and correlations were determined based on a generalized additive model. The main findings are as follows:
(1) Forests at higher altitudes in Qilian Mountain National Park exhibited more significant humid characteristics and trends towards humidification. This may be mainly related to the pattern that precipitation changes as the altitude rises.
(2) Forests in the altitude range of 2600–3900 m recovered faster and had greater resilience to drought compared to those in the range of 1700–2600 m. This altitudinal differentiation of forest resilience was related to precipitation non-monotonically, and resilience was strongest when monthly precipitation reaches 30 mm. This indicates that the relevant departments should focus on helping lower-elevation primary forests recover from drought disturbances by adjusting moisture conditions in the future.
(3) In terms of the occurrence of historical drought events at different altitude ranges, increased potential evapotranspiration improved resilience in the altitude range of 1700–3000 m, and enhanced cloud cover initially enlarged the resilience and then decreased it in the altitude range of 3000–3900 m with resilience being strongest when cloud cover reaches 24% and 33%, respectively.
Our study confirms the altitudinal differentiation of forest resilience to drought and the importance of the altitudinal perspective in studies of dryland mountain evolution. Furthermore, the findings of this study provide a scientific basis for predicting the potential changes in vegetation resilience and developing policies for ecological protection in studies of dryland mountains under future global climate change.

Author Contributions

X.G. and J.L. wrote and edited the main manuscript text; A.Y., S.C. and Q.L. prepared Figure 1, Figure 2, Figure 3, Figure 4, Figure 5, Figure 6, Figure 7, Figure 8, Figure 9 and Figure 10. All authors have read and agreed to the published version of the manuscript.

Funding

This work was financially supported by the National Key Research and Development Program of China (2019YFC0507402).

Data Availability Statement

Data availability upon request.

Conflicts of Interest

The authors declare no conflict of interest.

Appendix A

(1)
Calculation of  PET
We calculated the  PET  through using the Thornthwaite method
PET = 16 × ( 10 T i H ) A
H = i = 1 12 H i = i = 1 12 ( T i 5 ) 1.514
where  i  is the month;  T i  is the monthly average temperature;  H  is the annual heat index; and  A  is a constant,  A  = 0.492 + 0.179  H  − 0.000071  H 2  + 0.000000675  H 3 .
(2)
Calculation of the difference between precipitation and  PET
D i = P i P E T i
where  P i  is the monthly precipitation and  P E T i  is the monthly potential evapotranspiration.
(3)
Normalization of the  D i  data series using the log-logistic probability distribution
F ( x ) = [ 1 + ( α x γ ) β ] 1
α = ( ω 0 2 ω 1 ) β Γ ( 1 + 1 / β ) Γ ( 1 1 / β )
β = 2 ω 1 ω 0 6 ω 1 ω 0 6 ω 2
γ = ω 0 α Γ ( 1 + 1 / β ) Γ ( 1 1 / β )
where  Γ  is the factorial function and  ω 0 ω 1 , and  ω 2  are the probability-weighted moments of the data series  D i .
ω s = 1 N i 1 N ( 1 F i ) s D i
F i = i 0.35 N
where  N  is the number of months involved in the calculation and  ω s  is the probability-weighted moment.
(4)
The cumulative probability distribution  F ( x )  of the calculated  D i  sequence is normalized to yield the  SPEI  value
Normalization of the cumulative probability density
P = 1 F ( x )
When the cumulative probability  P  > 0.5,
ω = 2 l n P
SPEI = ω c 0 + c 1 ω + c 2 ω 3 1 + d 1 ω + d 2 ω 2 + d 3 ω 3
When the cumulative probability  P  ≤ 0.5,
ω = 2 l n P
SPEI = c 0 + c 1 ω + c 2 ω 3 1 + d 1 ω + d 2 ω 2 + d 3 ω 3 ω
where  d 1  = 1.432788,  d 2  = 0.189269,  d 3  = 0.001308,  c 0  = 2.515517,  c 1  = 0.802853, and  c 2  = 0.010328.

References

  1. Berdugo, M.; DelgadoBaquerizo, M.; Soliveres, S.; Hernández-Clemente, R.; Zhao, Y.; Gaitán, J.J.; Gross, N.; Saiz, H.; Maire, V.; Lehmann, A.; et al. Global ecosystem thresholds driven by aridity. Science 2020, 367, 787–790. [Google Scholar] [CrossRef] [Green Version]
  2. Orimoloye, I.R.; Belle, J.A.; Ololade, O.O. Drought disaster monitoring using MODIS derived index for drought years: A space-based information for ecosystems and environmental conservation. J. Environ. Manag. 2021, 284, 112028. [Google Scholar] [CrossRef]
  3. Zhang, Y.; Keenan, T.F.; Zhou, S. Exacerbated drought impacts on global ecosystems due to structural overshoot. Nat. Ecol. Evol. 2021, 5, 1490–1498. [Google Scholar] [CrossRef] [PubMed]
  4. Linares, J.C.; Camarero, J.J.; Carreira, J.A. Competition modulates the adaptation capacity of forests to climatic stress: Insights from recent growth decline and death in relict stands of the Mediterranean fir Abies pinsapo. J. Ecol. 2010, 98, 592–603. [Google Scholar] [CrossRef]
  5. Zhao, M.; Running, S.W. Drought-induced reduction in global terrestrial net primary production from 2000 through 2009. Science 2010, 329, 940–943. [Google Scholar] [CrossRef] [Green Version]
  6. Ledger, M.E.; Brown, L.E.; Edwards, F.K.; Milner, A.M.; Woodward, G. Drought alters the structure and functioning of complex food webs. Nat. Clim. Chang. 2013, 3, 223–227. [Google Scholar] [CrossRef] [Green Version]
  7. Hanke, H.; Borjeson, L.; Hylander, K.; Enfors-Kautsky, E. Corrigendum to “Drought tolerant species dominate as rainfall and tree cover returns in the West African Sahel”. Land Use Policy 2016, 59, 111–120. [Google Scholar] [CrossRef] [Green Version]
  8. Dai, A. Increasing drought under global warming in observations and models. Nat. Clim. Chang. 2013, 3, 52–58. [Google Scholar] [CrossRef]
  9. Zhang, B.; Wang, Z.; Chen, G. A sensitivity study of applying a two-source potential evapotranspiration model in the standardized precipitation evapotranspiration index for drought monitoring. Land Degrad. Dev. 2017, 28, 783–793. [Google Scholar] [CrossRef]
  10. Vicente-Serrano, S.M.; Quiring, S.M.; Peña-Gallardo, M.; Yuan, S.; Domínguez-Castro, F. A review of environmental droughts: Increased risk under global warming? Earth Sci. Rev. 2020, 201, 102953. [Google Scholar] [CrossRef]
  11. Holling, C.S. Resilience and stability of ecological systems. Annu. Rev. Ecol. Syst. 1973, 4, 1–23. [Google Scholar] [CrossRef] [Green Version]
  12. Scheffer, M.; Carpenter, S.; Foley, J.A.; Folke, C.; Walker, B. Catastrophic shifts in ecosystems. Nature 2001, 413, 591–596. [Google Scholar] [CrossRef]
  13. Dakos, V.; Scheffer, M.; Van Nes, E.H.; Brovkin, V.; Petoukhov, V.; Held, H. Slowing down as an early warning signal for abrupt climate change. Proc. Natl Acad. Sci. USA 2008, 105, 14308–14312. [Google Scholar] [CrossRef] [Green Version]
  14. Arani, B.M.S.; Carpenter, S.R.; Lahti, L.; van Nes, E.H.; Scheffer, M. Exit time as a measure of ecological resilience. Science 2021, 372, 4895. [Google Scholar] [CrossRef]
  15. De Faria, B.L.; Marano, G.; Piponiot, C.; Silva, C.A.; Dantas, V.d.L.; Rattis, L.; Rech, A.R.; Collalti, A. Model-based estimation of Amazonian forests recovery time after drought and fire events. Forests 2021, 12, 8. [Google Scholar] [CrossRef]
  16. Schwalm, C.R.; Anderegg, W.R.L.; Michalak, A.M.; Fisher, J.B.; Biondi, F.; Koch, G.; Litvak, M.; Ogle, K.; Shaw, J.D.; Wolf, A.; et al. Global patterns of drought recovery. Nature 2017, 548, 202–205. [Google Scholar] [CrossRef] [PubMed]
  17. Fu, Z.; Li, D.; Hararuk, O.; Schwalm, C.R.; Luo, Y.; Yan, L.; Niu, S. Recovery time and state change of terrestrial carbon cycle after disturbance. Environ. Res. Lett. 2017, 12, 104004. [Google Scholar] [CrossRef]
  18. Ingrisch, J.; Bahn, M. Towards a Comparable Quantification of Resilience. Trends Ecol. Evol. 2018, 33, 251–259. [Google Scholar] [CrossRef]
  19. Zhang, S.; Yang, Y.; Wu, X.; Li, X.; Shi, F. Postdrought recovery time across global terrestrial ecosystems. J. Geophys. Res. Biogeosci. 2021, 126, e2020JG005699. [Google Scholar] [CrossRef]
  20. Yao, Y.; Fu, B.; Liu, Y.; Li, Y.; Wang, S.; Zhan, T.; Wang, Y.; Gao, D. Evaluation of ecosystem resilience to drought based on drought intensity and recovery time. Agric. For. Meteorol. 2022, 314, 108809. [Google Scholar] [CrossRef]
  21. Forzieri, G.; Dakos, V.; McDowell, N.G.; Ramdane, A.; Cescatti, A. Emerging signals of declining forest resilience under climate change. Nature 2022, 608, 534–539. [Google Scholar] [CrossRef]
  22. Liu, J.; Zhao, J.; Wang, J. Response of vegetation cover to drought in the Qilian Mountains Region from 2001 to 2016. Pratac. Sci. 2021, 38, 419–431, (Chinese with English Abstract). [Google Scholar]
  23. Ding, W.; Gou, X.; Li, Y. Annual Report On Development of Qilian Ecosystem (2020); Social Sciences Academic Press (China): Beijing, China, 2020; pp. 18–43. (In Chinese) [Google Scholar]
  24. Li, Y.; Li, Z.; Zhang, X.; Gui, J.; Xue, J. Vegetation variations and its driving factors in the transition zone between Tibetan Plateau and arid region. Ecol. Indic. 2022, 141, 109101. [Google Scholar]
  25. Ma, Y.; Guan, Q.; Sun, Y.; Zhang, J.; Yang, L.; Yang, E.; Li, H.; Du, Q. Three-dimensional dynamic characteristics of vegetation and its response to climatic factors in the Qilian Mountains. CATENA 2022, 208, 105694. [Google Scholar] [CrossRef]
  26. Gou, X.; Hou, F.; Li, Y.; Zhao, C.; Zou, S. Scientific Investigation Report on Ecosystem Changes in Qilian Mountains; Science Press: Beijing, China, 2022; pp. 20–52. (In Chinese) [Google Scholar]
  27. Xu, Z.; Zhao, C.; Feng, Z. A study of the impact of climate change on the potential distribution of Qinghai spruce (Picea crassifolia) in Qilian Mountains. Acta Ecol. Sin. 2009, 29, 278–285. [Google Scholar] [CrossRef]
  28. Zhang, H.; Han, W.; Song, J.; Li, M. Spatial-temporal variations of habitat quality in Qilian Mountain National Park. Chin. J. Ecol. 2021, 40, 1419–1430, (Chinese with English Abstract). [Google Scholar]
  29. Xue, J.; Li, Z.; Feng, Q.; Miao, C.; Deng, X.; Di, Z.; Ye, A.; Gong, W.; Zhang, B.; Gui, J.; et al. Spatiotemporal variation characteristics of water conservation amount in the Qilian Mountains from 1980 to 2017. J. Giaciol. Geocryol. 2022, 44, 1–13, (Chinese with English Abstract). [Google Scholar]
  30. Zhou, X.; Li, Y. Response of dry-wet change to millennial and centennial warm periods in the Qilian Mountains. Acta Geogr. Sin. 2022, 77, 1138–1152, (Chinese with English Abstract). [Google Scholar]
  31. Harris, I.; Jones, P.; Osborn, T.; Lister, D.H. Updated high-resolution grids of monthly climatic observations—The CRU TS3.10 Dataset. Int. J. Climatol. 2014, 34, 623–642. [Google Scholar] [CrossRef] [Green Version]
  32. Fick, S.; Hijmans, R. WorldClim 2: New 1 km spatial resolution climate surfaces for global land areas. Int. J. Climatol. 2017, 37, 4302–4315. [Google Scholar] [CrossRef]
  33. Peng, S.; Ding, Y.; Liu, W.; Li, Z. 1 km monthly temperature and precipitation dataset for China from 1901 to 2017. Earth Syst. Sci. Data 2019, 11, 1931–1946. [Google Scholar] [CrossRef] [Green Version]
  34. Peng, S.; Ding, Y.; Wen, Z.; Chen, Y.; Cao, Y.; Ren, J. Spatiotemporal change and trend analysis of potential evapotranspiration over the Loess Plateau of China during 2011–2100. Agric. For. Meteorol. 2017, 233, 183–194. [Google Scholar] [CrossRef] [Green Version]
  35. Harris, I.; Osborn, T.J.; Jones, P.; Lister, D. Version 4 of the CRU TS monthly high-resolution gridded multivariate climate dataset. Sci. Data 2020, 7, 109. [Google Scholar] [CrossRef] [PubMed] [Green Version]
  36. Chen, J.; Black, T.A. Measuring leaf area index of plant canopies with branch architecture. Agric. For. Meteorol. 1991, 57, 1–12. [Google Scholar] [CrossRef]
  37. Fang, H.; Baret, F.; Plummer, S.; Schaepman-Strub, G. An overview of global leaf area index (LAI): Methods, products, validation, and applications. Rev. Geophys. 2019, 57, 739–799. [Google Scholar] [CrossRef]
  38. Yan, G.; Hu, R.; Luo, J.; Weiss, M.; Jiang, H.; Mu, X.; Xie, D.; Zhang, W. Review of indirect optical measurements of leaf area index: Recent advances, challenges, and perspectives. Agric. For. Meteorol. 2019, 265, 390–411. [Google Scholar] [CrossRef]
  39. Wang, D.; Lv, S.; Han, B.; Meng, X.; Li, Z.; Zhang, J. The characteristics of spring vegetation cover and its response to spring drought over the Loess Plateau. Plateau Meteorol. 2018, 37, 1208–1219, (Chinese with English Abstract). [Google Scholar]
  40. Yang, J.; Huang, X. The 30 m annual land cover datasets and its dynamics in China from 1990 to 2020 (1.0.0) [Data set]. Zenodo 2021, 13, 3907–3925. [Google Scholar]
  41. Li, Y.; Ding, J.; Zhang, J.; Wu, P. Response of vegetation cover to drought in the northern slope of the Tianshan Mountains during 2001--2015 based on the land-use and land-cover change. Acta Ecol. Sin. 2019, 39, 6206–6217, (Chinese with English Abstract). [Google Scholar]
  42. Hou, Q.; Pei, T.; Chen, Y.; Ji, Z.; Xie, B. Variations of drought and its trend in the Loess Plateau from 1986 to 2019. Chin. J. Appl. Ecol. 2021, 32, 649–660, (Chinese with English Abstract). [Google Scholar]
  43. Greenwood, S.; Ruiz-Benito, P.; Martínez-Vilalta, J.; Lloret, F.; Kitzberger, T.; Allen, C.D.; Fensham, R.; Laughlin, D.C.; Kattge, J.; Bönisch, G.; et al. Tree mortality across biomes is promoted by drought intensity, lower wood density and higher specific leaf area. Ecol. Lett. 2017, 20, 539–553. [Google Scholar] [CrossRef] [PubMed] [Green Version]
  44. Slette, I.J.; Post, A.K.; Awad, M.; Even, T.; Punzalan, A.; Williams, S.; Smith, M.D.; Knapp, A.K. How ecologists define drought, and why we should do better. Glob. Chang. Biol. 2019, 25, 3193–3200. [Google Scholar] [CrossRef]
  45. Bachmair, S.; Kohn, I.; Stahl, K. Exploring the link between drought indicators and impacts. Nat. Hazards Earth Syst. Sci. 2015, 15, 1381–1397. [Google Scholar] [CrossRef] [Green Version]
  46. Blauhut, V.; Stahl, K.; Stagge, J.H.; Tallaksen, L.M.; De Stefano, L.; Vogt, J. Estimating drought risk across Europe from reported drought impacts, drought indices, and vulnerability factors. Hydrol. Earth Syst. Sci. 2016, 20, 2779–2800. [Google Scholar] [CrossRef] [Green Version]
  47. Jiao, L.; Chen, K.; Liu, X.; Qi, C.; Xue, R. Comparison of the response stability of Siberian larch to climate change in the Altai and Tianshan. Ecol. Indic. 2021, 128, 107823. [Google Scholar] [CrossRef]
  48. Beguería, S.; Vicente-Serrano, S.M.; Reig, F.; Latorre, B. Standardized precipitation evapotranspiration index (SPEI) revisited: Parameter fitting, evapotranspiration models, tools, datasets and drought monitoring. Int. J. Climatol. 2014, 34, 3001–3023. [Google Scholar] [CrossRef] [Green Version]
  49. Sun, S.; Ren, Y.; Li, Q.; Zhou, S.; Zhao, C.; Chai, R.; Deng, P.; Wang, J. Intra-annual differences of 3-month Standardized Precipitation-Evapotranspiration Index dryness/wetness sensitivity over southwest China. Atmos. Sci. Lett. 2018, 19, e830. [Google Scholar] [CrossRef] [Green Version]
  50. Jiao, W.; Wang, L.; Smith, W.K.; Chang, Q.; Wang, H.; D’Odorico, P. Observed increasing water constraint on vegetation growth over the last three decades. Nat. Commun. 2021, 12, 3777. [Google Scholar] [CrossRef]
  51. Thornthwaite, C.W. An approach towards a rational classification of climate. Geogr. Rev. 1948, 38, 55–94. [Google Scholar] [CrossRef]
  52. Franzke, C. Nonlinear climate change. Nat. Clim. Chang. 2014, 4, 423–424. [Google Scholar] [CrossRef]
  53. Ji, F.; Wu, Z.; Huang, J.; Chassignet, E.P. Evolution of land surface air temperature trend. Nat. Clim. Chang. 2014, 4, 462–466. [Google Scholar] [CrossRef]
  54. Gazol, A.; Camarero, J.J.; Anderegg, W.R.L.; Vicente-Serrano, S.M. Impacts of droughts on the growth resilience of northern hemisphere forests: Forest growth resilience to drought. Glob. Ecol. Biogeogr. 2017, 26, 166–176. [Google Scholar] [CrossRef]
  55. Reyniers, N.; Osborn, T.J.; Addor, N.; Darch, G. Projected changes in droughts and extreme droughts in Great Britain strongly influenced by the choice of drought index. Hydrol. Earth Syst. Sci. 2023, 27, 1151–1171. [Google Scholar] [CrossRef]
  56. Gampe, D.; Zscheischler, J.; Reichstein, M.; O’Sullivan, M.; Smith, W.K.; Sitch, S.; Buermann, W. Increasing impact of warm droughts on northern ecosystem productivity over recent decades. Nat. Clim. Chang. 2021, 11, 772–779. [Google Scholar] [CrossRef]
  57. Rhee, J.; Im, J. Meteorological drought forecasting for ungauged areas based on machine learning: Using long-range climate forecast and remote sensing data. Agric. For. Meteorol. 2017, 237–238, 105–122. [Google Scholar] [CrossRef]
  58. Yao, Y.; Liu, Y.; Zhou, S.; Song, J.; Fu, B. Soil moisture determines the recovery time of ecosystems from drought. Glob. Chang. Biol. 2023, 29, 3562–3574. [Google Scholar] [CrossRef]
  59. Liu, Y.; Kumar, M.; Katul, G.G.; Porporato, A. Reduced resilience as an early warning signal of forest mortality. Nat. Clim. Chang. 2019, 9, 880–885. [Google Scholar] [CrossRef]
  60. Zhai, J.; Mondal, S.K.; Fischer, T.; Wang, Y.; Su, B.; Huang, B.; Tao, H.; Wang, G.; Ullah, W.; Uddin, M.J. Future drought characteristics through a multi-model ensemble from CMIP6 over South Asia. Atmos. Res. 2020, 246, 105111. [Google Scholar] [CrossRef]
  61. Chiang, F.; Mazdiyasni, O.; AghaKouchak, A. Evidence of anthropogenic impacts on global drought frequency, duration, and intensity. Nat. Commun. 2021, 12, 2754. [Google Scholar] [CrossRef]
  62. Jones, S.R. Areas, anti-derivatives, and adding up pieces: Definite integrals in pure mathematics and applied science contexts. J. Math. Behav. 2015, 38, 9–28. [Google Scholar] [CrossRef]
  63. Moore, D.; Bach, V.; Finkbeiner, M.; Honkomp, T.; Ahn, H.; Sprenger, M.; Froese, L.; Gratzel, D. Offsetting environmental impacts beyond climate change: The Circular Ecosystem Compensation approach. J. Environ. Manag. 2023, 329, 117068. [Google Scholar] [CrossRef]
  64. Dang, D.; Li, X.; Li, S.; Lyu, X.; Dou, H.; Li, M.; Wang, K. Changed ecosystem stability to climate anomalies in the context of ecological restoration projects. Land. Degrad. Dev. 2023, 34, 3003–3016. [Google Scholar] [CrossRef]
  65. Higgins, S.I.; Conradi, T.; Muhoko, E. Shifts in vegetation activity of terrestrial ecosystems attributable to climate trends. Nat. Geosci. 2023, 16, 147–153. [Google Scholar] [CrossRef]
  66. Wu, J.; Liang, S. Assessing Terrestrial Ecosystem Resilience using Satellite Leaf Area Index. Remote Sens. 2020, 12, 595. [Google Scholar] [CrossRef] [Green Version]
  67. Elith, J.; Leathwick, J.R.; Hastie, T. A working guide to boosted regression trees. J. Anim. Ecol. 2008, 77, 802–813. [Google Scholar] [CrossRef]
  68. Isabona, J.; Imoize, A.L.; Kim, Y. Machine learning-based boosted regression ensemble combined with hyperparameter tuning for optimal adaptive learning. Remote Sens. 2022, 22, 3776. [Google Scholar] [CrossRef] [PubMed]
  69. Hastie, T.; Tibshirani, R. Generalized Additive Models. Stat. Sci. 1986, 3, 297–318. [Google Scholar] [CrossRef]
  70. Guisan, A.; Edwards, T.C.; Hastie, T. Generalized linear and generalized additive models in studies of species distributions: Setting the scene. Ecol. Model. 2002, 157, 89–100. [Google Scholar] [CrossRef] [Green Version]
  71. Li, R.; Xu, L.; Bjørnstad, O.N.; Liu, K.; Song, T.; Chen, A.; Xu, B.; Liu, Q.; Stenseth, N.C. Climate-driven variation in mosquito density predicts the spatiotemporal dynamics of dengue. Proc. Natl. Acad. Sci. USA 2019, 116, 3624–3629. [Google Scholar] [CrossRef] [Green Version]
  72. Liu, X.; Wang, Y.; Shao, M.; Jia, X.; Li, X. Spatiotemporal analysis of multiscalar drought characteristics across the Loess Plateau of China. J. Hydrol. 2016, 534, 281–299. [Google Scholar] [CrossRef]
  73. Gao, X.; Zhao, Q.; Zhao, X.; Wu, P.; Pan, W.; Gao, X.; Sun, M. Temporal and spatial evolution of the standardized precipitation evapotranspiration index (SPEI) in the Loess Plateau under climate change from 2001 to 2050. Sci. Total Environ. 2017, 595, 191–200. [Google Scholar] [CrossRef]
  74. Dong, Z.; Liu, H.; Baiyinbaoligao; Hu, H.; Khan, M.Y.A.; Wen, J.; Chen, L.; Tian, F. Future projection of seasonal drought characteristics using CMIP6 in the Lancang-Mekong River Basin. J. Hydrol. 2022, 610, 127815. [Google Scholar] [CrossRef]
  75. Xia, S. A discussion of discrete cofficient. Coll. Math. 1997, 2, 144–146, (Chinese with English Abstract). [Google Scholar]
  76. Gao, X.; Huang, X.; Lo, K.; Dang, Q.; Wen, R. Vegetation responses to climate change in the Qilian Mountain Nature Reserve, Northwest China. Glob. Ecol. Conserv. 2021, 28, e01698. [Google Scholar] [CrossRef]
  77. Xu, H.; Zhao, C.; Wang, X. Elevational differences in the net primary productivity response to climate constraints in a dryland mountain ecosystem of northwestern China. Land. Degrad. Dev. 2020, 31, 2087–2103. [Google Scholar] [CrossRef]
  78. Du, Q.; Sun, Y.; Guan, Q.; Pan, N.; Wang, Q.; Ma, Y.; Li, H.; Liang, L. Vulnerability of grassland ecosystems to climate change in the Qilian Mountains, northwest China. J. Hydrol. 2022, 612, 128305. [Google Scholar] [CrossRef]
  79. Takahashi, F.; Suzuki, T.; Osakabe, Y.; Betsuyaku, S.; Kondo, Y.; Dohmae, N.; Fukuda, H.; Yamaguchi-Shinozaki, K.; Shinozaki, K. A small peptide modulates stomatal control via abscisic acid in long-distance signalling. Nature 2018, 556, 235–238. [Google Scholar] [CrossRef]
  80. Gupta, A.; Rico-Medina, A.; Caño-Delgado, A.I. The physiology of plant responses to drought. Science 2020, 368, 266–269. [Google Scholar] [CrossRef]
  81. Bohner, T.; Diez, J. Tree resistance and recovery from drought mediated by multiple abiotic and biotic processes across a large geographic gradientzone. Sci. Total Environ. 2021, 789, 147744. [Google Scholar] [CrossRef]
  82. Marcotti, E.; Amoroso, M.M.; Rodríguez-Caton, M.; Vega, L.; Srur, A.M.; Villalba, R. Growth resilience of Austrocedrus chilensis to drought along a precipitation gradientzone in Patagonia. Argentina. For. Ecol. Manag. 2021, 496, 119388. [Google Scholar] [CrossRef]
  83. Jing, M.; Che, Z.; Jing, W.; Zhao, W.; Ma, Y.; Liu, S. Spatiotemporal Changes of Precipitation and Temperature at Water Resources Conservation Forests Area in Oilian Mountains, China. J. Desert Res. 2012, 32, 1071–1076, (Chinese with English Abstract). [Google Scholar]
  84. Zhang, X.; Zhang, Y.; Tian, J.; Ma, N.; Wang, Y. CO2 fertilization is spatially distinct from stomatal conductance reduction in controlling ecosystem water-use efficiency increase. Environ. Res. Lett. 2022, 17, 054048. [Google Scholar] [CrossRef]
  85. Coban, O.; De Deyn, G.B. Soil microbiota as game-changers in restoration of degraded lands. Science 2022, 375, 6584. [Google Scholar] [CrossRef] [PubMed]
  86. Xu, R.; Li, Y.; Teuling, A.J.; Zhao, L.; Spracklen, D.V.; Garcia-Carreras, L.; Meier, R.; Chen, L.; Zheng, Y.; Lin, H.; et al. Contrasting impacts of forests on cloud cover based on satellite observations. Nat. Commun. 2022, 13, 670. [Google Scholar] [CrossRef]
  87. Ji, D.; Li, Q.; Guo, Y.; An, W.; Manavski, N.; Meurer, J.; Chi, W. NADP+ supply adjusts the synthesis of photosystem I in Arabidopsis chloroplasts. Plant. Physiol. 2022, 189, 2128–2143. [Google Scholar] [CrossRef] [PubMed]
  88. Garcia-Carreras, L.; Parker, D.J.; Taylor, C.M.; Reeves, C.E.; Murphy, J.G. Impact of mesoscale vegetation heterogeneities on the dynamical and thermodynamic properties of the planetary boundary layer. J. Geophys. Res. Atmos. 2010, 115, D03102. [Google Scholar] [CrossRef] [Green Version]
  89. Zlobin, I.E. Linking the growth patterns of coniferous species with their performance under climate aridization. Sci. Total Environ. 2022, 831, 154971. [Google Scholar] [CrossRef]
  90. Lloret, F.; Jaime, L.A.; Margalef-Marrase, J.; Pérez-Navarro, M.A.; Batllori, E. Short-term forest resilience after drought-induced die-off in Southwestern European forests. Sci. Total Environ. 2022, 806, 150940. [Google Scholar] [CrossRef]
  91. Ciceu, A.; Popa, I.; Leca, S.; Pitar, D.; Chivulescu, S.; Badea, O. Climate change effects on tree growth from Romanian forest monitoring Level II plots. Sci. Total Environ. 2020, 698, 134129. [Google Scholar] [CrossRef]
  92. Du, M.; Zhang, F.; Gou, X.; Liu, L.; Xia, J.; Wu, X. Different responses of radial growth of Pica crassifolia to climate warming in the middle and eastern Qilian Mountains. J. Giaciol. Geocryol. 2022, 44, 14–23, (Chinese with English Abstract). [Google Scholar]
  93. Huang, T.; Hao, J.; Du, Y.; Tian, C.; Zhang, J.; Wang, H.; Hou, L. Regeneration characteristics of three natural Junipers forests in the Three-River Headwater Region of Qinghai Province, China. Chin. J. Appl. Ecol. 2022, 33, 297–303, (Chinese with English Abstract). [Google Scholar]
  94. Zhang, F.; Gou, X.; Su, J.; Gao, L.; Liu, W.; Man, Z. Age-Dependent Responses of Tree Radial Growth of Pinus tabulaeformis to Climate in Eastern Section of the Qilian Mountains. J. Giaciol. Geocryol. 2011, 33, 634–639, (Chinese with English Abstract). [Google Scholar]
  95. Zhao, Z.; Wang, S.; Luo, Y.; Liu, R.; Han, F.; Ma, Y. Physiological responses of a young Gansu elm (Ulmus glaucescens) to soil water loss and rehydration. Arid Zone Res. 2022, 39, 1534–1542, (Chinese with English Abstract). [Google Scholar]
  96. Li, X.; Piao, S.; Wang, K.; Wang, X.; Wang, T.; Ciais, P.; Chen, A.; Lian, X.; Peng, S.; Peñuelas, J. Temporal trade-off between gymnosperm resistance and resilience increases forest sensitivity to extreme drought. Nat. Ecol. Evol. 2020, 4, 1075–1083. [Google Scholar] [CrossRef]
  97. Wang, Y.; Fu, B.; Liu, Y.; Li, Y.; Feng, X.; Wang, S. Response of vegetation to drought in the Tibetan Plateau: Elevation differentiation and the dominant factors. Agric. For. Meteorol. 2021, 306, 108468. [Google Scholar] [CrossRef]
Figure 1. Ecosystem type of QMNP.
Forests 14 01284 g001
Figure 2. Forest vertical zone spectrum in QMNP.
Forests 14 01284 g002
Figure 3. Schematic diagram of physiological basis of resilience curves.
Forests 14 01284 g003
Figure 4. Resilience curve based on recovery time and drought intensity. Red circles and green triangles represent the two-dimensional points with recovery time as the abscissa and drought intensity as the ordinate of ecosystem A and ecosystem B, respectively. When the recovery time is tx, DA and DB indicate the drought intensity that ecosystem A and ecosystem B can withstand, respectively. When drought intensity is Dy, tA and tB indicate the recovery time required by system A and system B, respectively.
Forests 14 01284 g004
Figure 5. Drought occurrence and recovery time using SPEI-3 and LAI time-series data. a indicates drought occurrence but no LAI anomalies. b indicates LAI anomalies occurrence but no drought. c, d, and e indicate drought and LAI anomalies that occur concomitantly: c represents that recovery time is 3 T; d represents that recovery time is 2 T; and e represents that recovery time is 5 T, T = 1 month.
Forests 14 01284 g005
Figure 6. Changes in the SPEI values of forests in different elevation zones of the QMNP from 1982 to 2020. (a), (b), (c), and (d) represent elevation ranges of 1700–2600 m, 2600–3000 m, 3000–3400 m, and 3400–3900 m, respectively.
Forests 14 01284 g006
Figure 7. Occurrences of drought and LAI anomaly: (a,b) represent the drought intensity and the total number of drought events in forests of different elevation zones for a given recovery time from 1982 to 2020, respectively, T = 1 month; (c) indicates Mean SPEI-3, the annual average frequency of drought (SPEI-3 < −1), and annual average frequency of the co-occurrence of drought and LAI anomalies in forests of different elevation zones from 1982 to 2020.
Forests 14 01284 g007
Figure 8. Resilience curves of forests in different elevation zones in the form of the function  Y = a + b ln x . Sig. (two-tailed test) < 0.1, and the values after ± for each parameter are 95% confidence intervals. The black dots indicate two-dimensional point data with recovery time as the abscissa and drought intensity as the ordinate for forest ecosystems in different elevation zones. The red curve is the resilience curve fitted by a logarithmic function, T = 1 month. (a), (b), (c), and (d) represent elevation ranges of 1700–2600 m, 2600–3000 m, 3000–3400 m, and 3400–3900 m, respectively.
Forests 14 01284 g008
Figure 9. Resilience differentiation, T = 1 month: (a) indicates the difference in resilience values of different elevation zones at each recovery time; (b) indicates the distribution of resilience values in QMNP at each recovery time.
Forests 14 01284 g009
Figure 10. Variable importance scores of factors of resilience based on the random forest regression model. RecPRE, RecTEM, RecPET, and RecCLD represent the precipitation, temperature, potential evapotranspiration, and cloud cover during the recovery period, respectively.
Forests 14 01284 g010
Figure 11. Relationship between forest resilience and dominant factors based on GAM. The gray area represents the upper and lower bounds of the confidence interval. The horizontal axis represents the measured values of the independent variable, and the vertical axis represents the smooth-fitted values of the forest resilience. The abbreviation edf reflects the complexity of the smoothing function. When edf is 1, the link function is a linear equation, indicating the linear relationship; when edf is >1, the link function is a nonlinear curve equation, indicating the nonlinear relationship. Moreover, the larger the edf value, the stronger the nonlinear relationship.
Forests 14 01284 g011
Table 1. The areas of resilience curves and dispersion coefficients, T = 1 month.
Area1 T–2 T1 T–3 T1 T–4 T1 T–5 T1 T–6 T
1700–2600 m1.95304.94618.614812.785817.3571
2600–3000 m2.17916.028310.962216.702623.0858
3000–3400 m2.28165.968610.568315.846821.6660
3400–3900 m2.44036.533511.700217.665124.2660
Dispersion coefficient0.09230.11340.12590.13400.1398
Table 2. GAM model statistical parameters for single factor analysis.
Dominant FactorStandard ErrorF-Valuep-ValueDeviance Explained/%
Forests in QMNPRecPRE0.035262.5250.093411.7
1700–2600 mRecPET0.075250.7730.3955.61
2600–3000 mRecPET0.076492.6650.13421
3000–3400 mRecCLD0.07322.4570.13238.7
3400–3900 mRecCLD0.066760.1160.8217.03
Disclaimer/Publisher’s Note: The statements, opinions and data contained in all publications are solely those of the individual author(s) and contributor(s) and not of MDPI and/or the editor(s). MDPI and/or the editor(s) disclaim responsibility for any injury to people or property resulting from any ideas, methods, instructions or products referred to in the content.

