
August Temperature Reconstruction Based on Tree-Ring Latewood Blue Intensity in the Southeastern Tibetan Plateau

Abstract
:1. Introduction
2. Materials and Methods
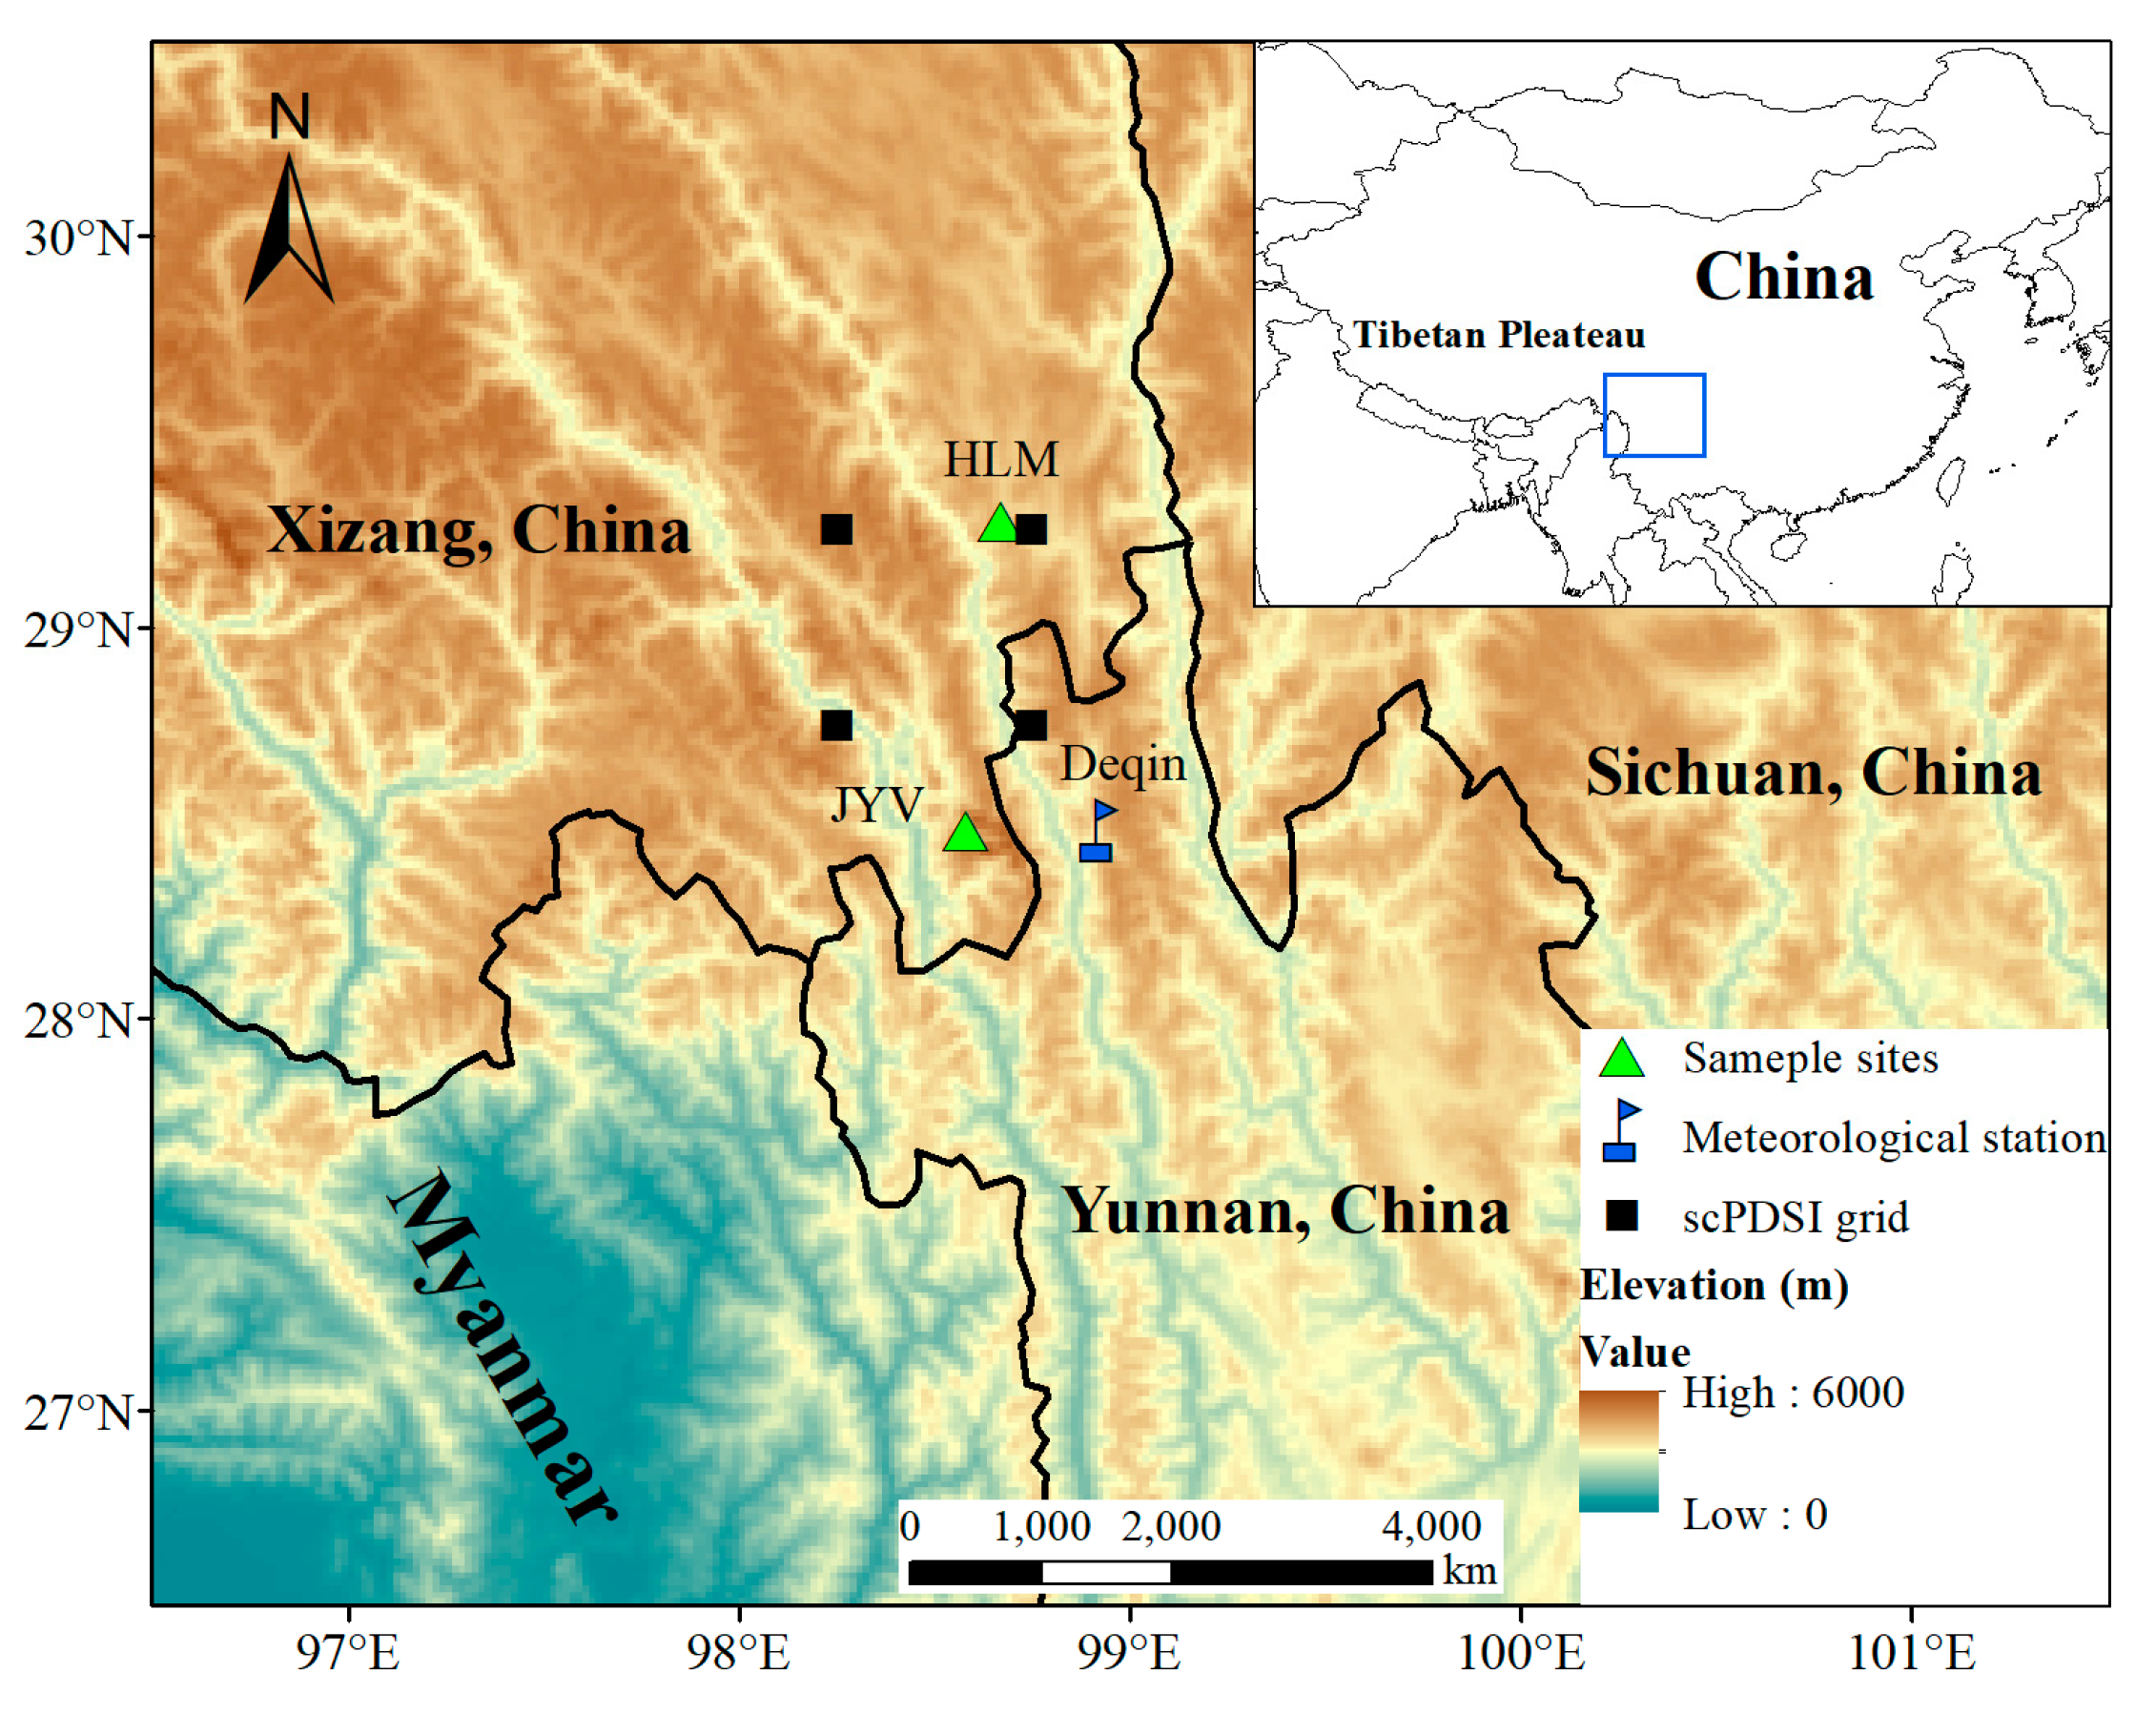
2.1. Study Area
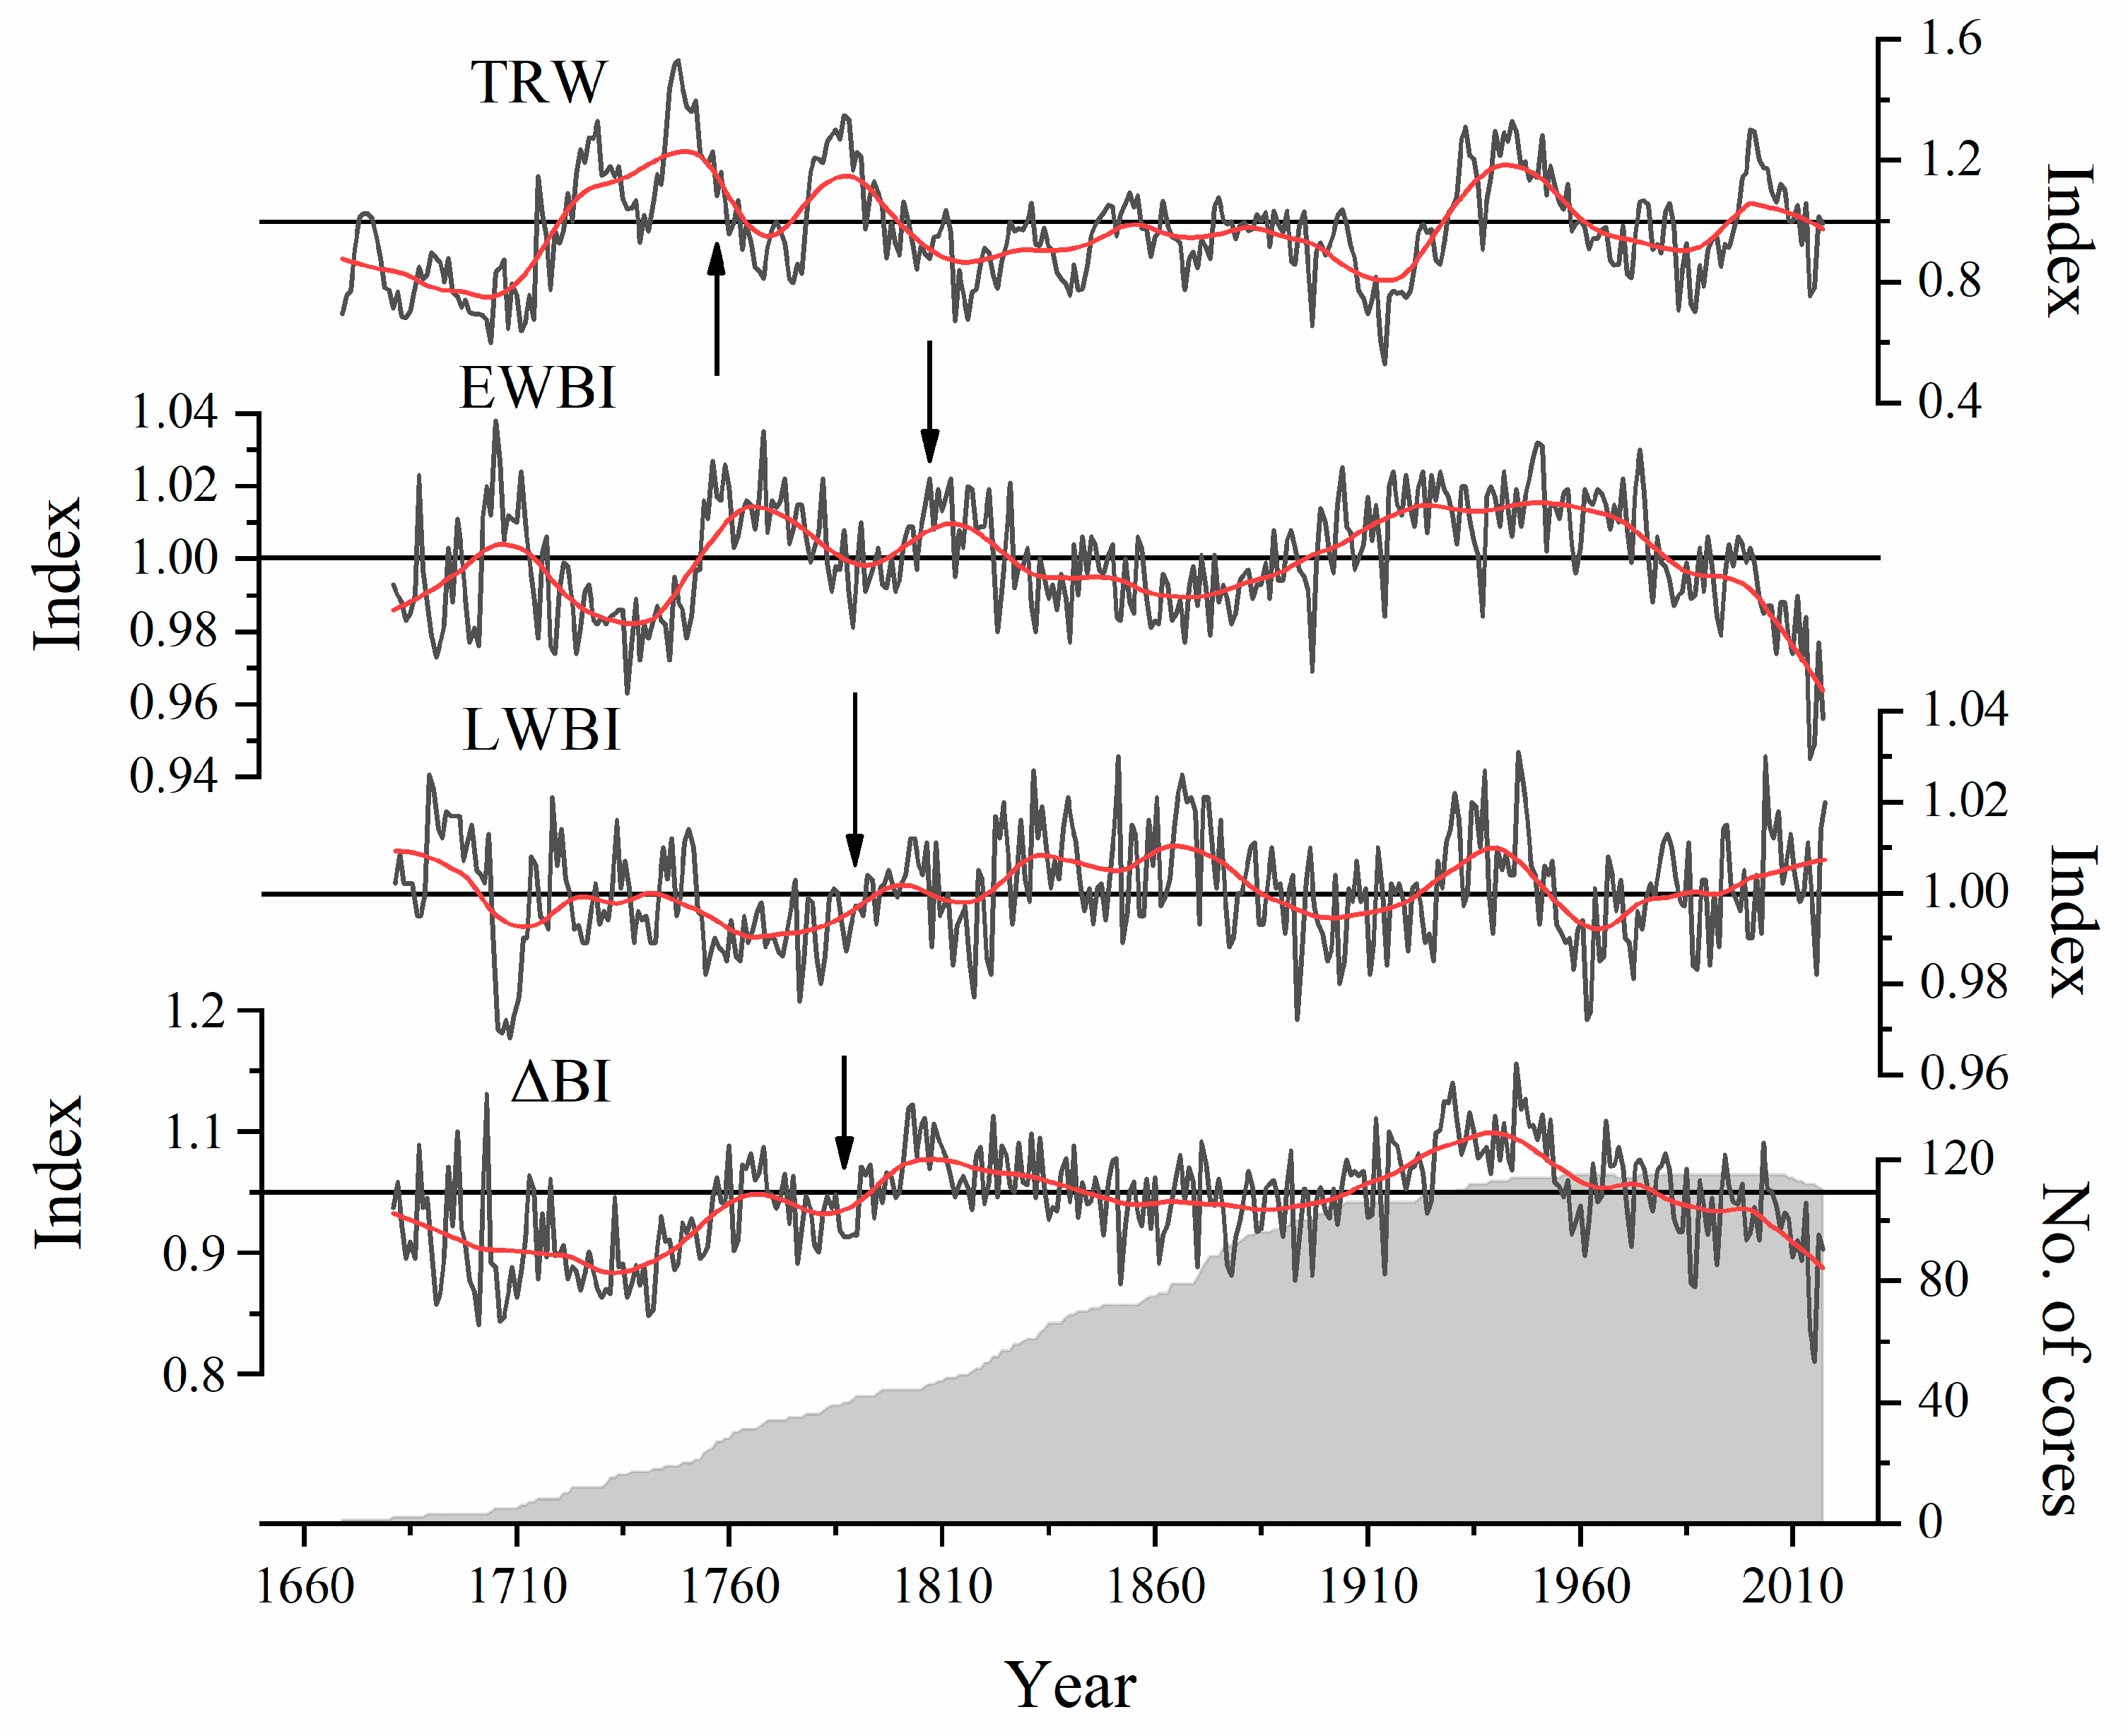
2.2. Tree-Ring Data
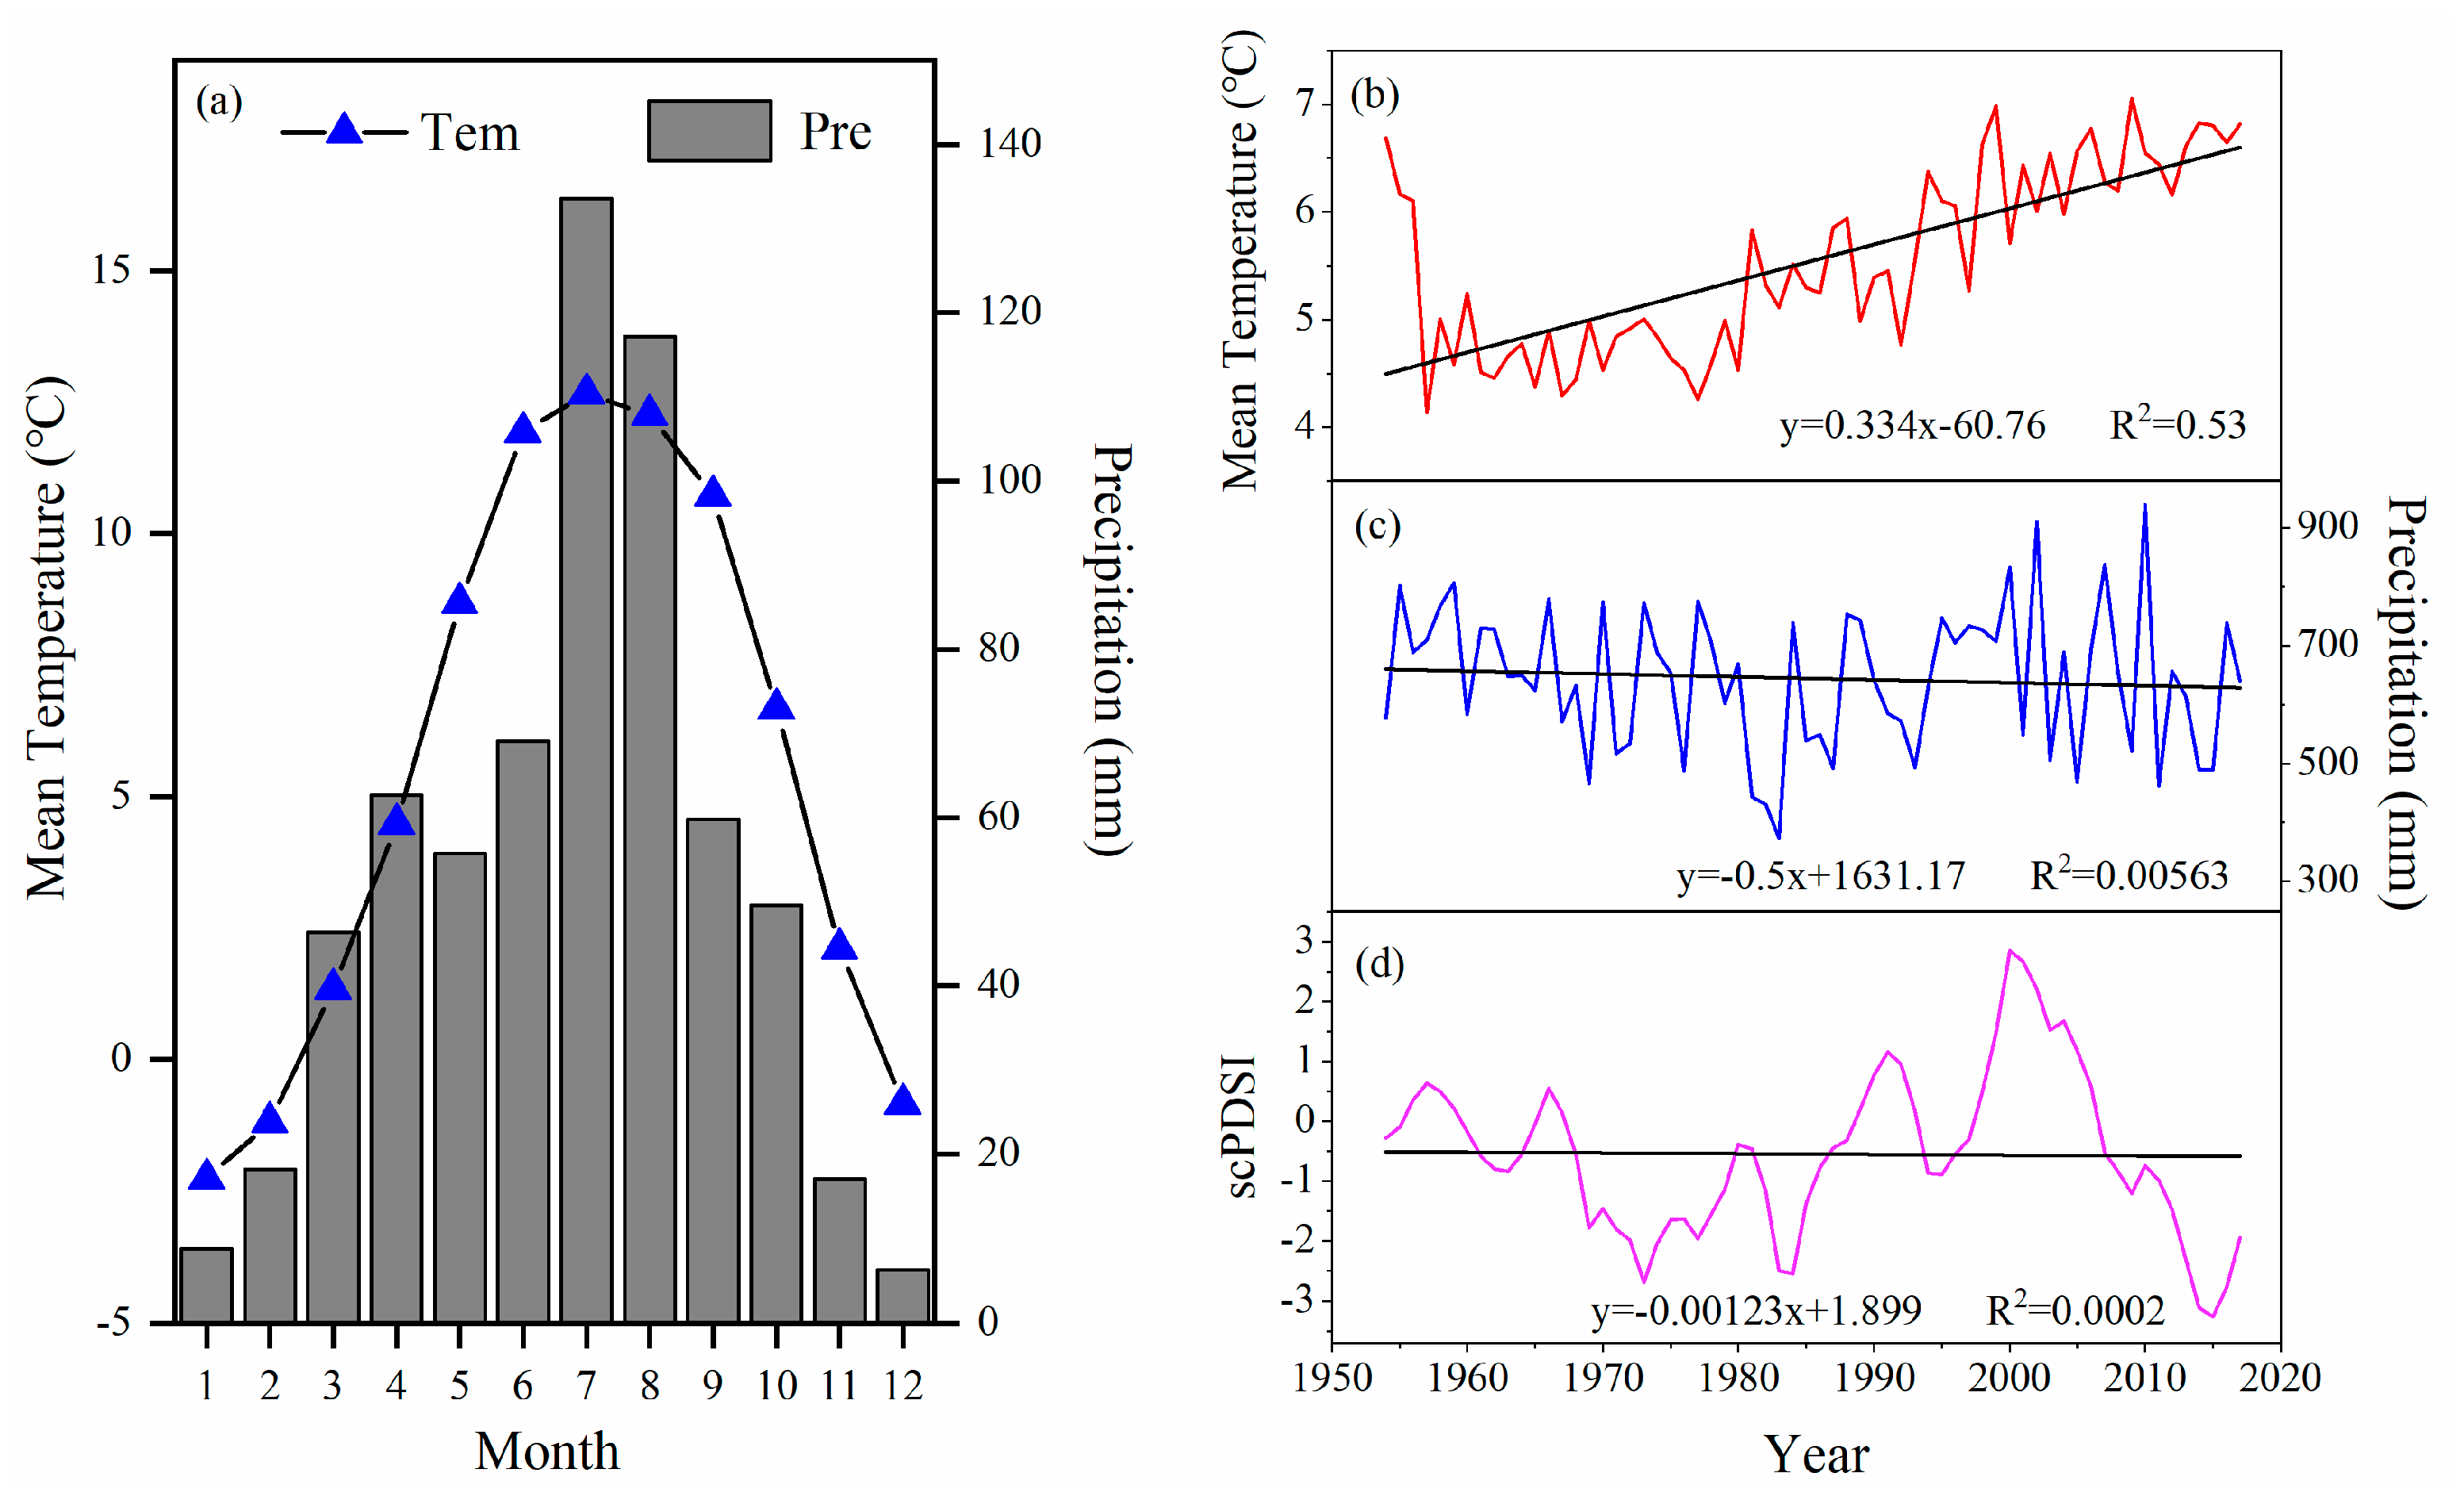
2.3. Climate Data
2.4. Statistical Methods
3. Results
4. Discussion
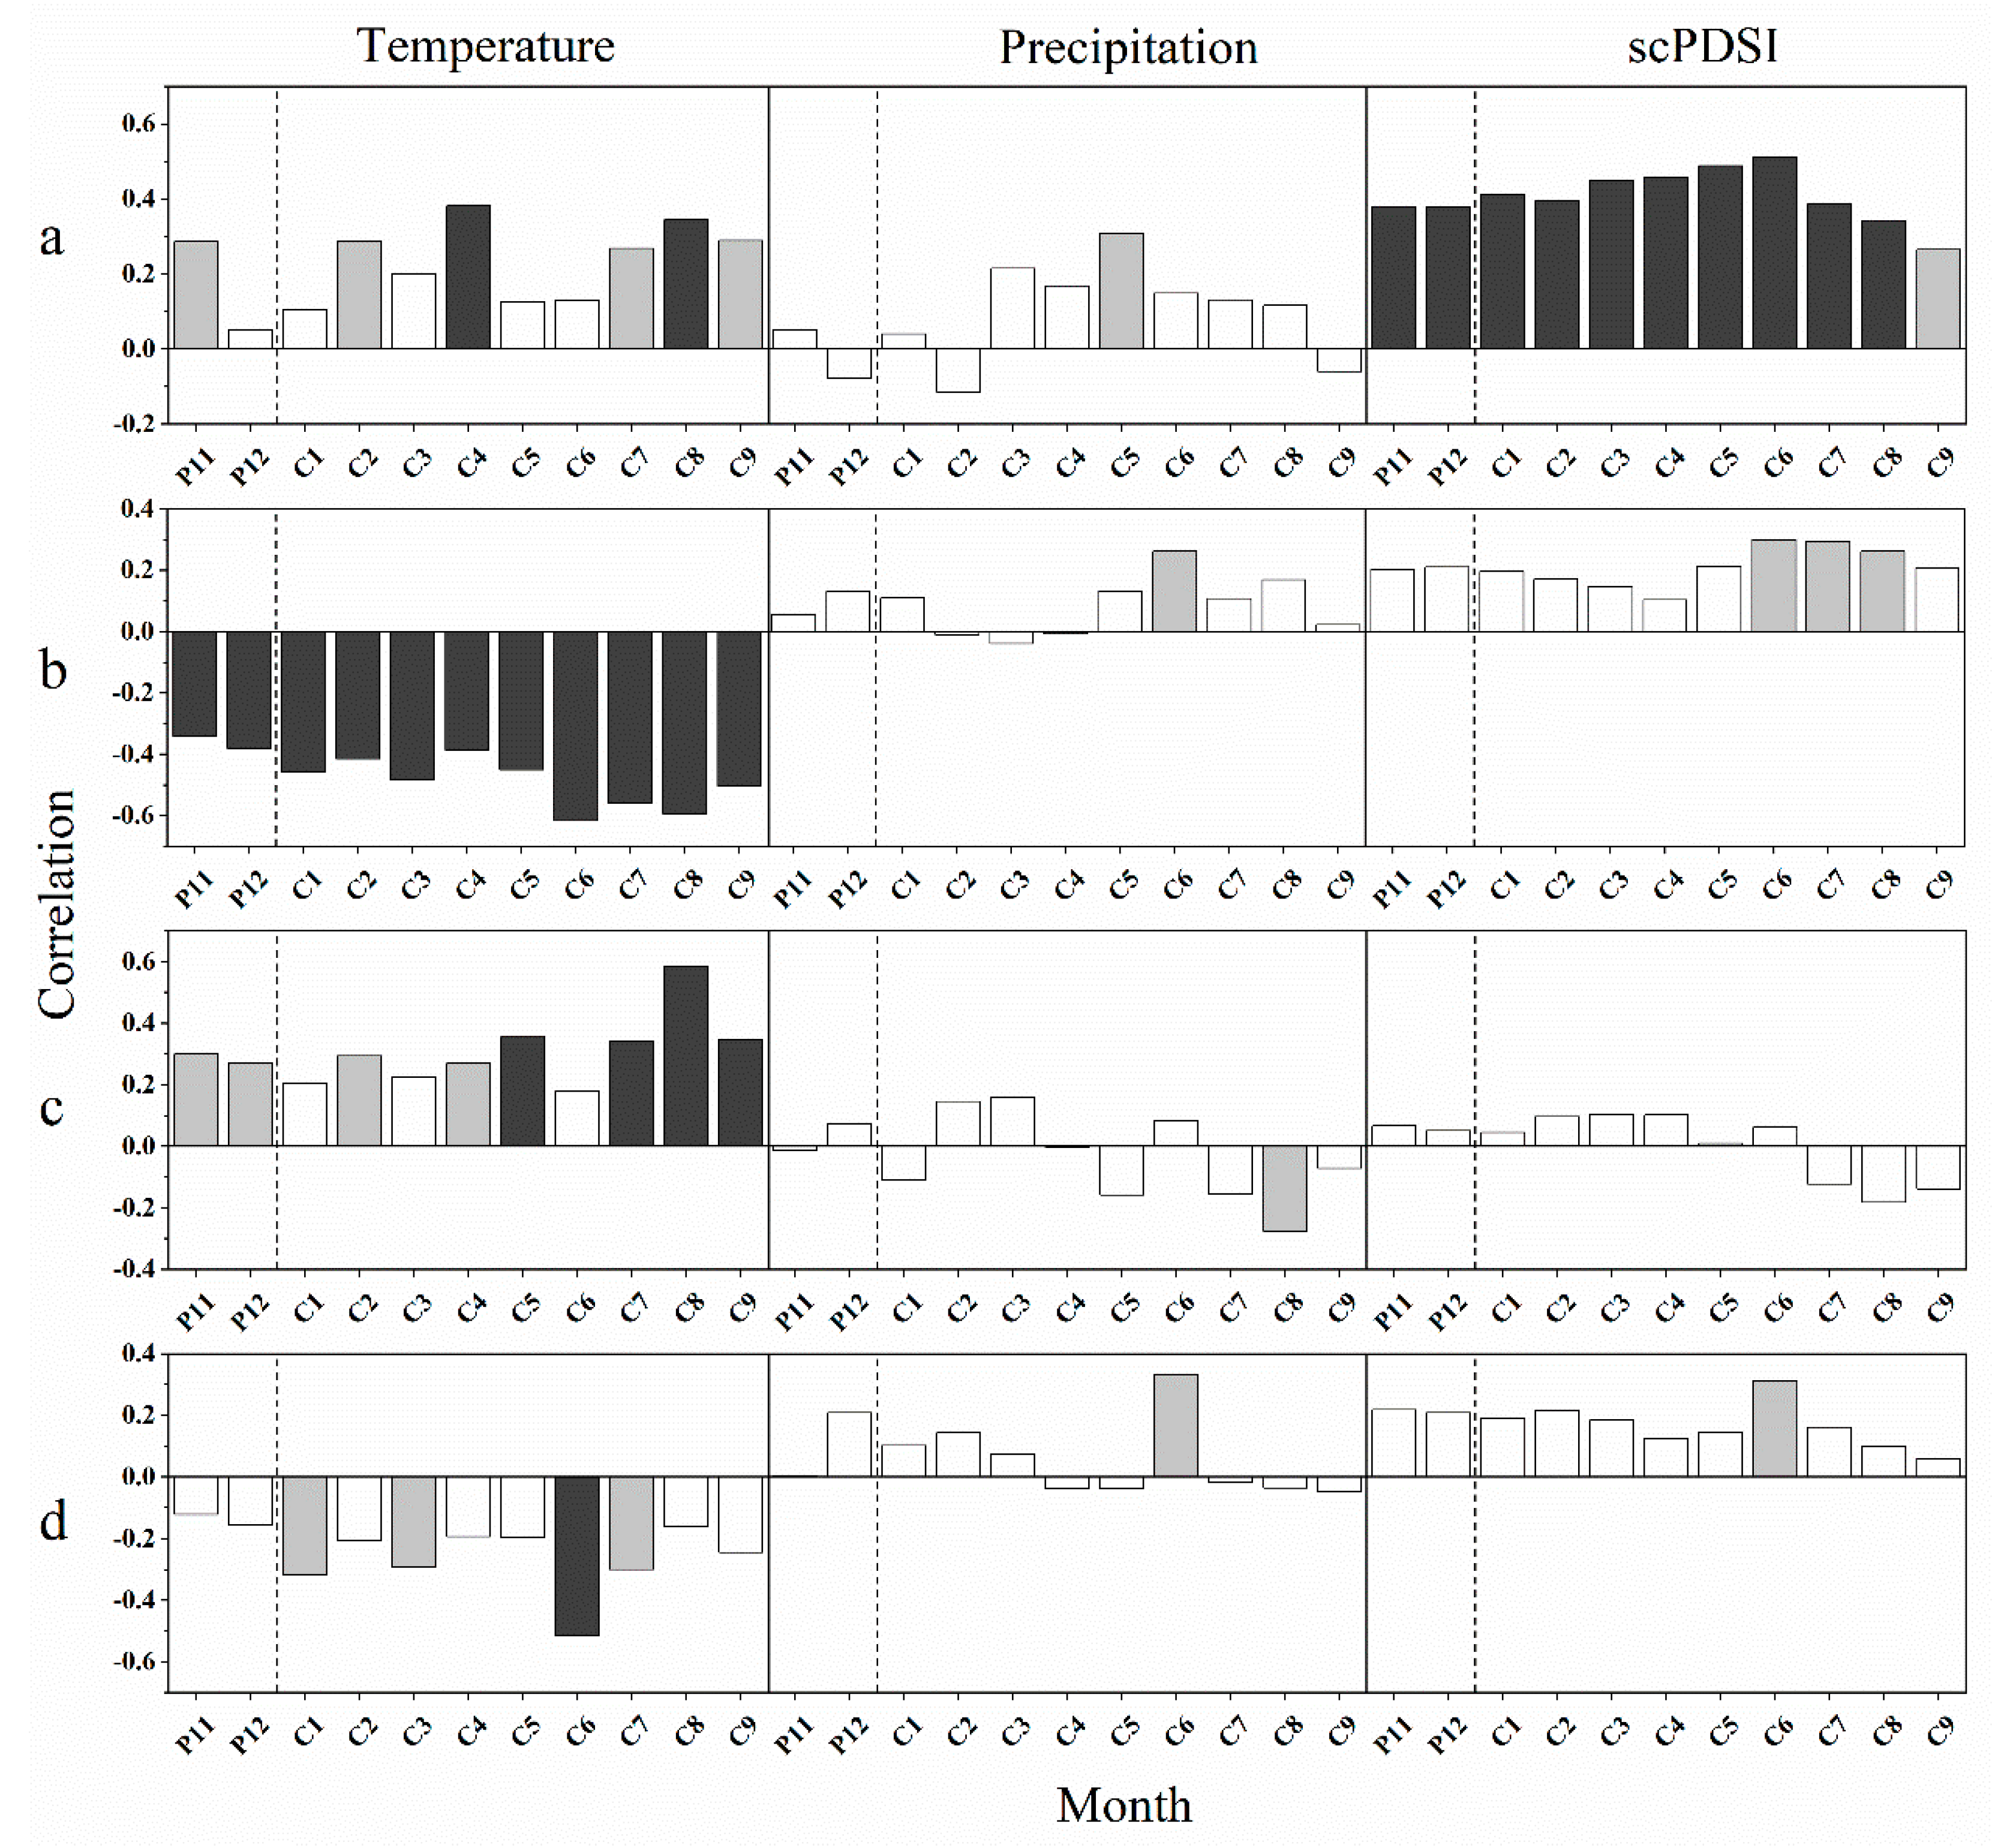
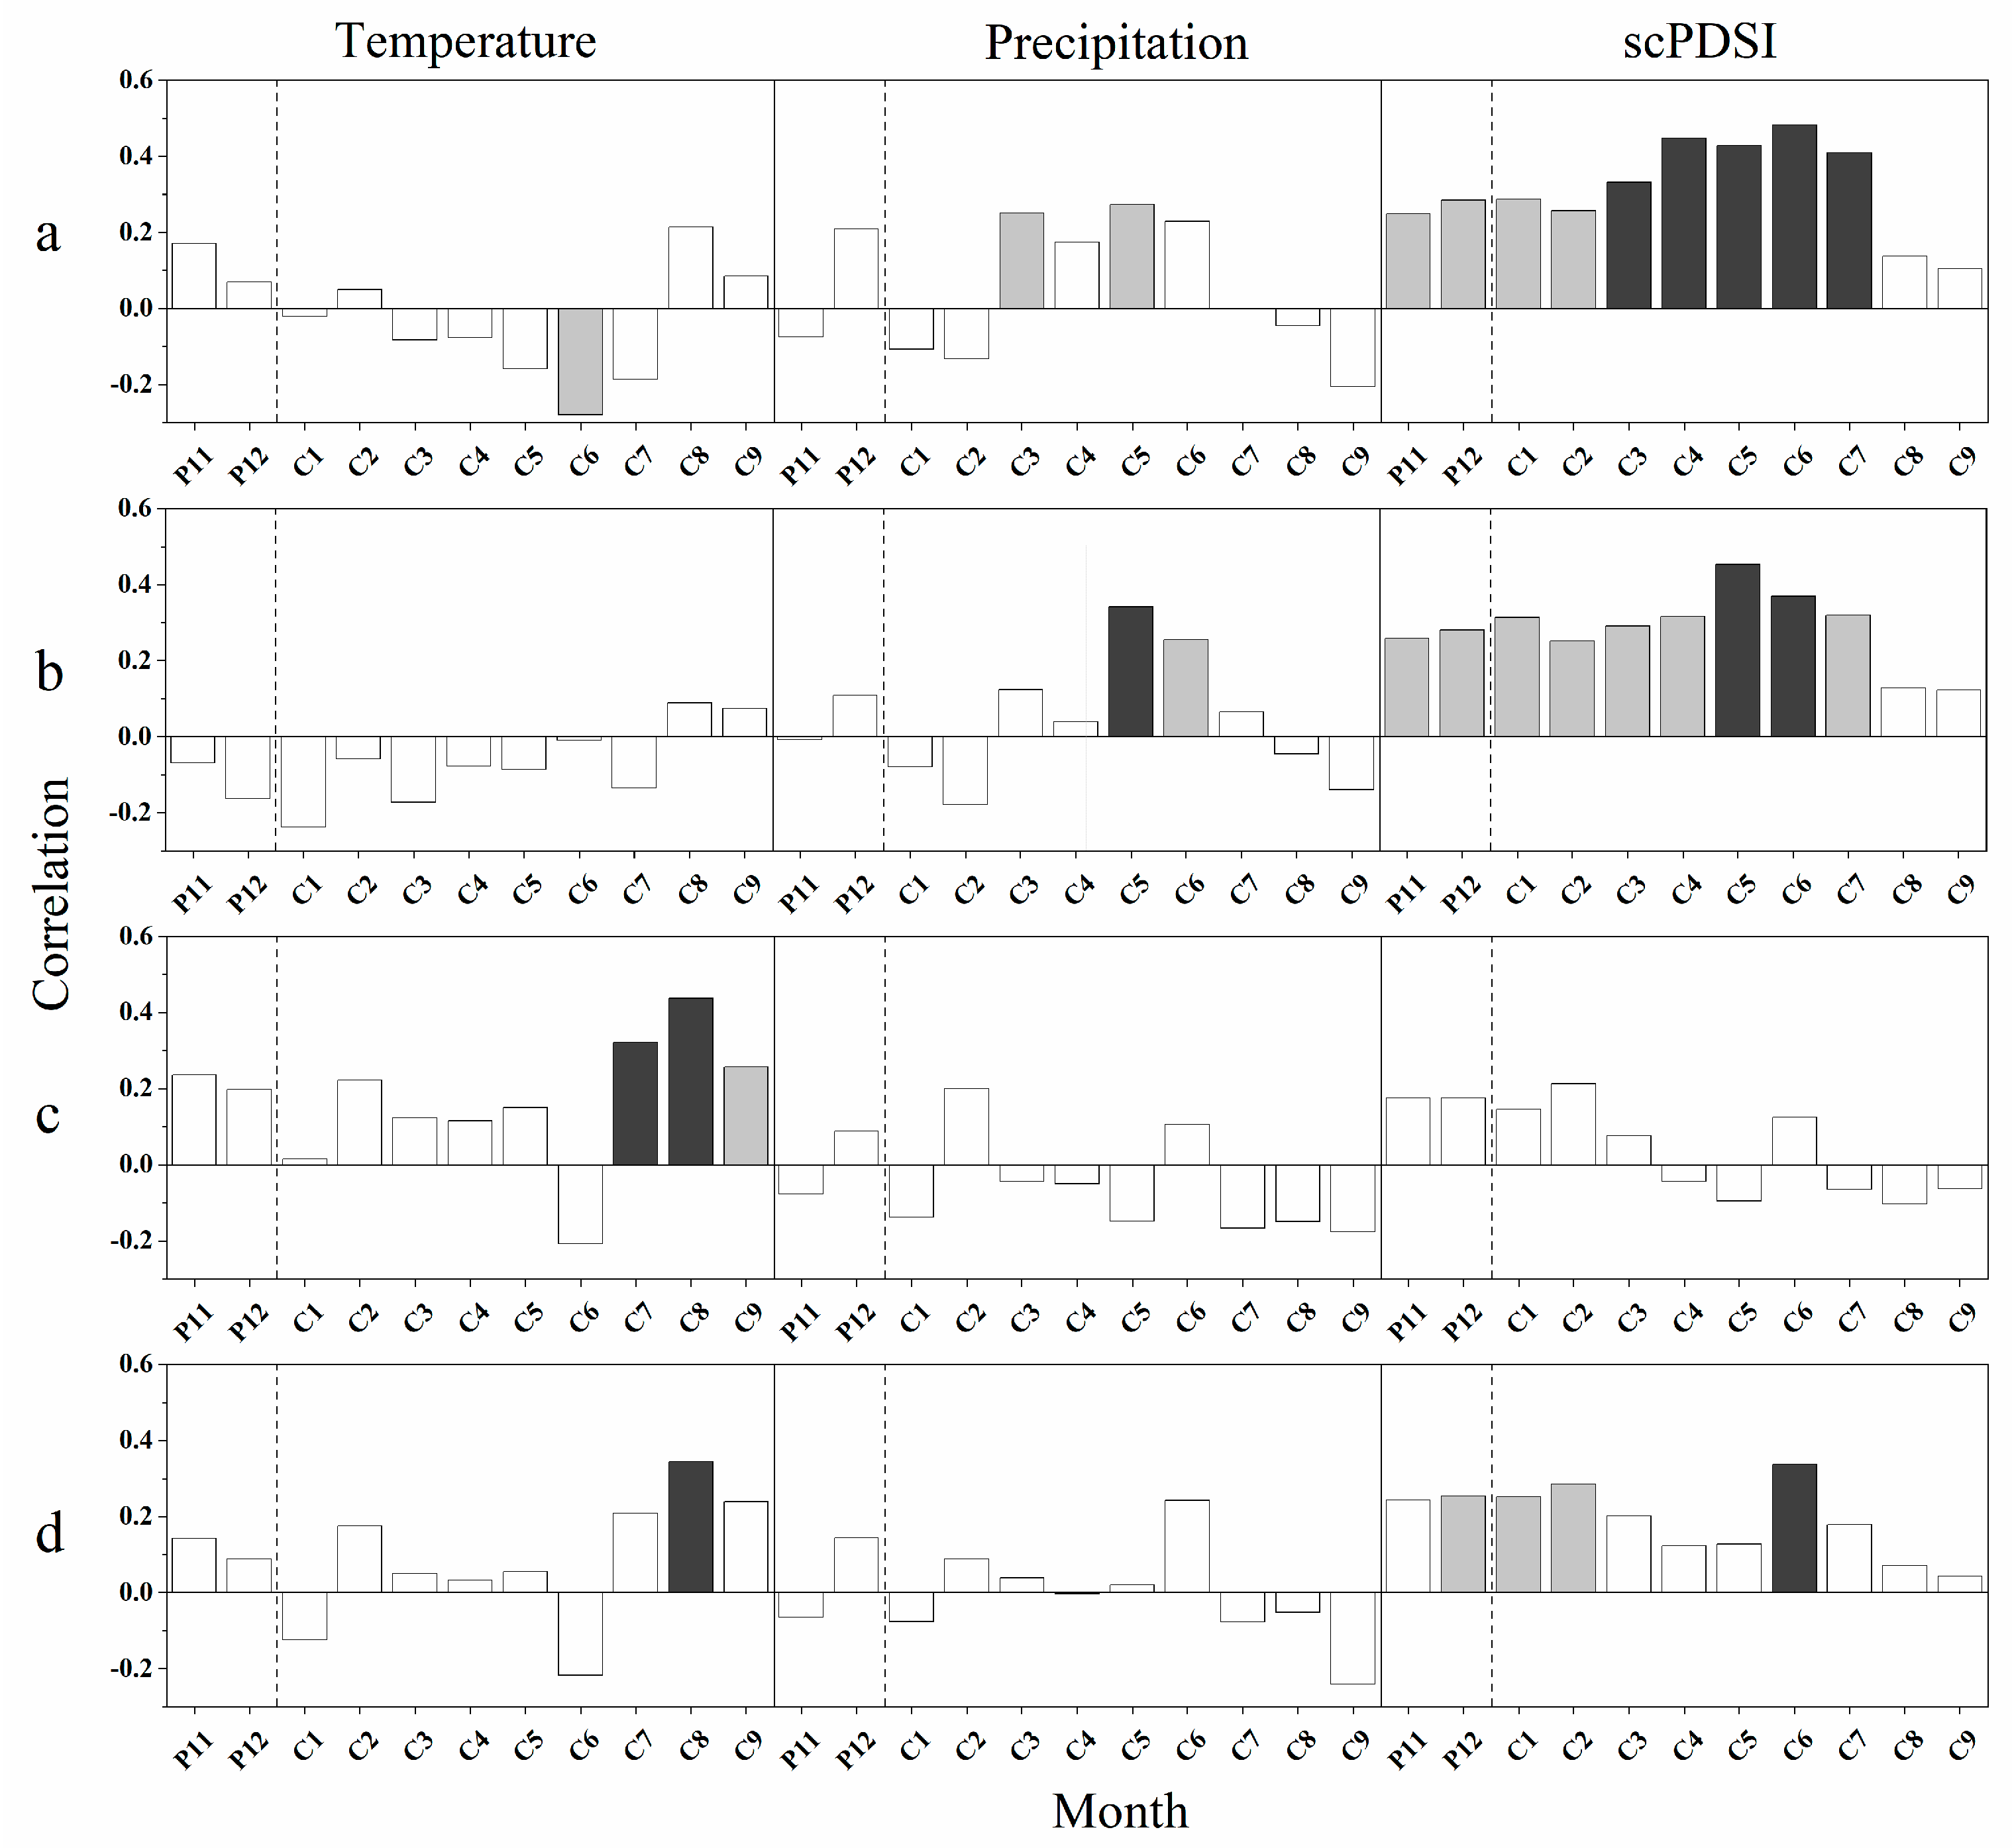
4.1. Climate–Growth Relationships
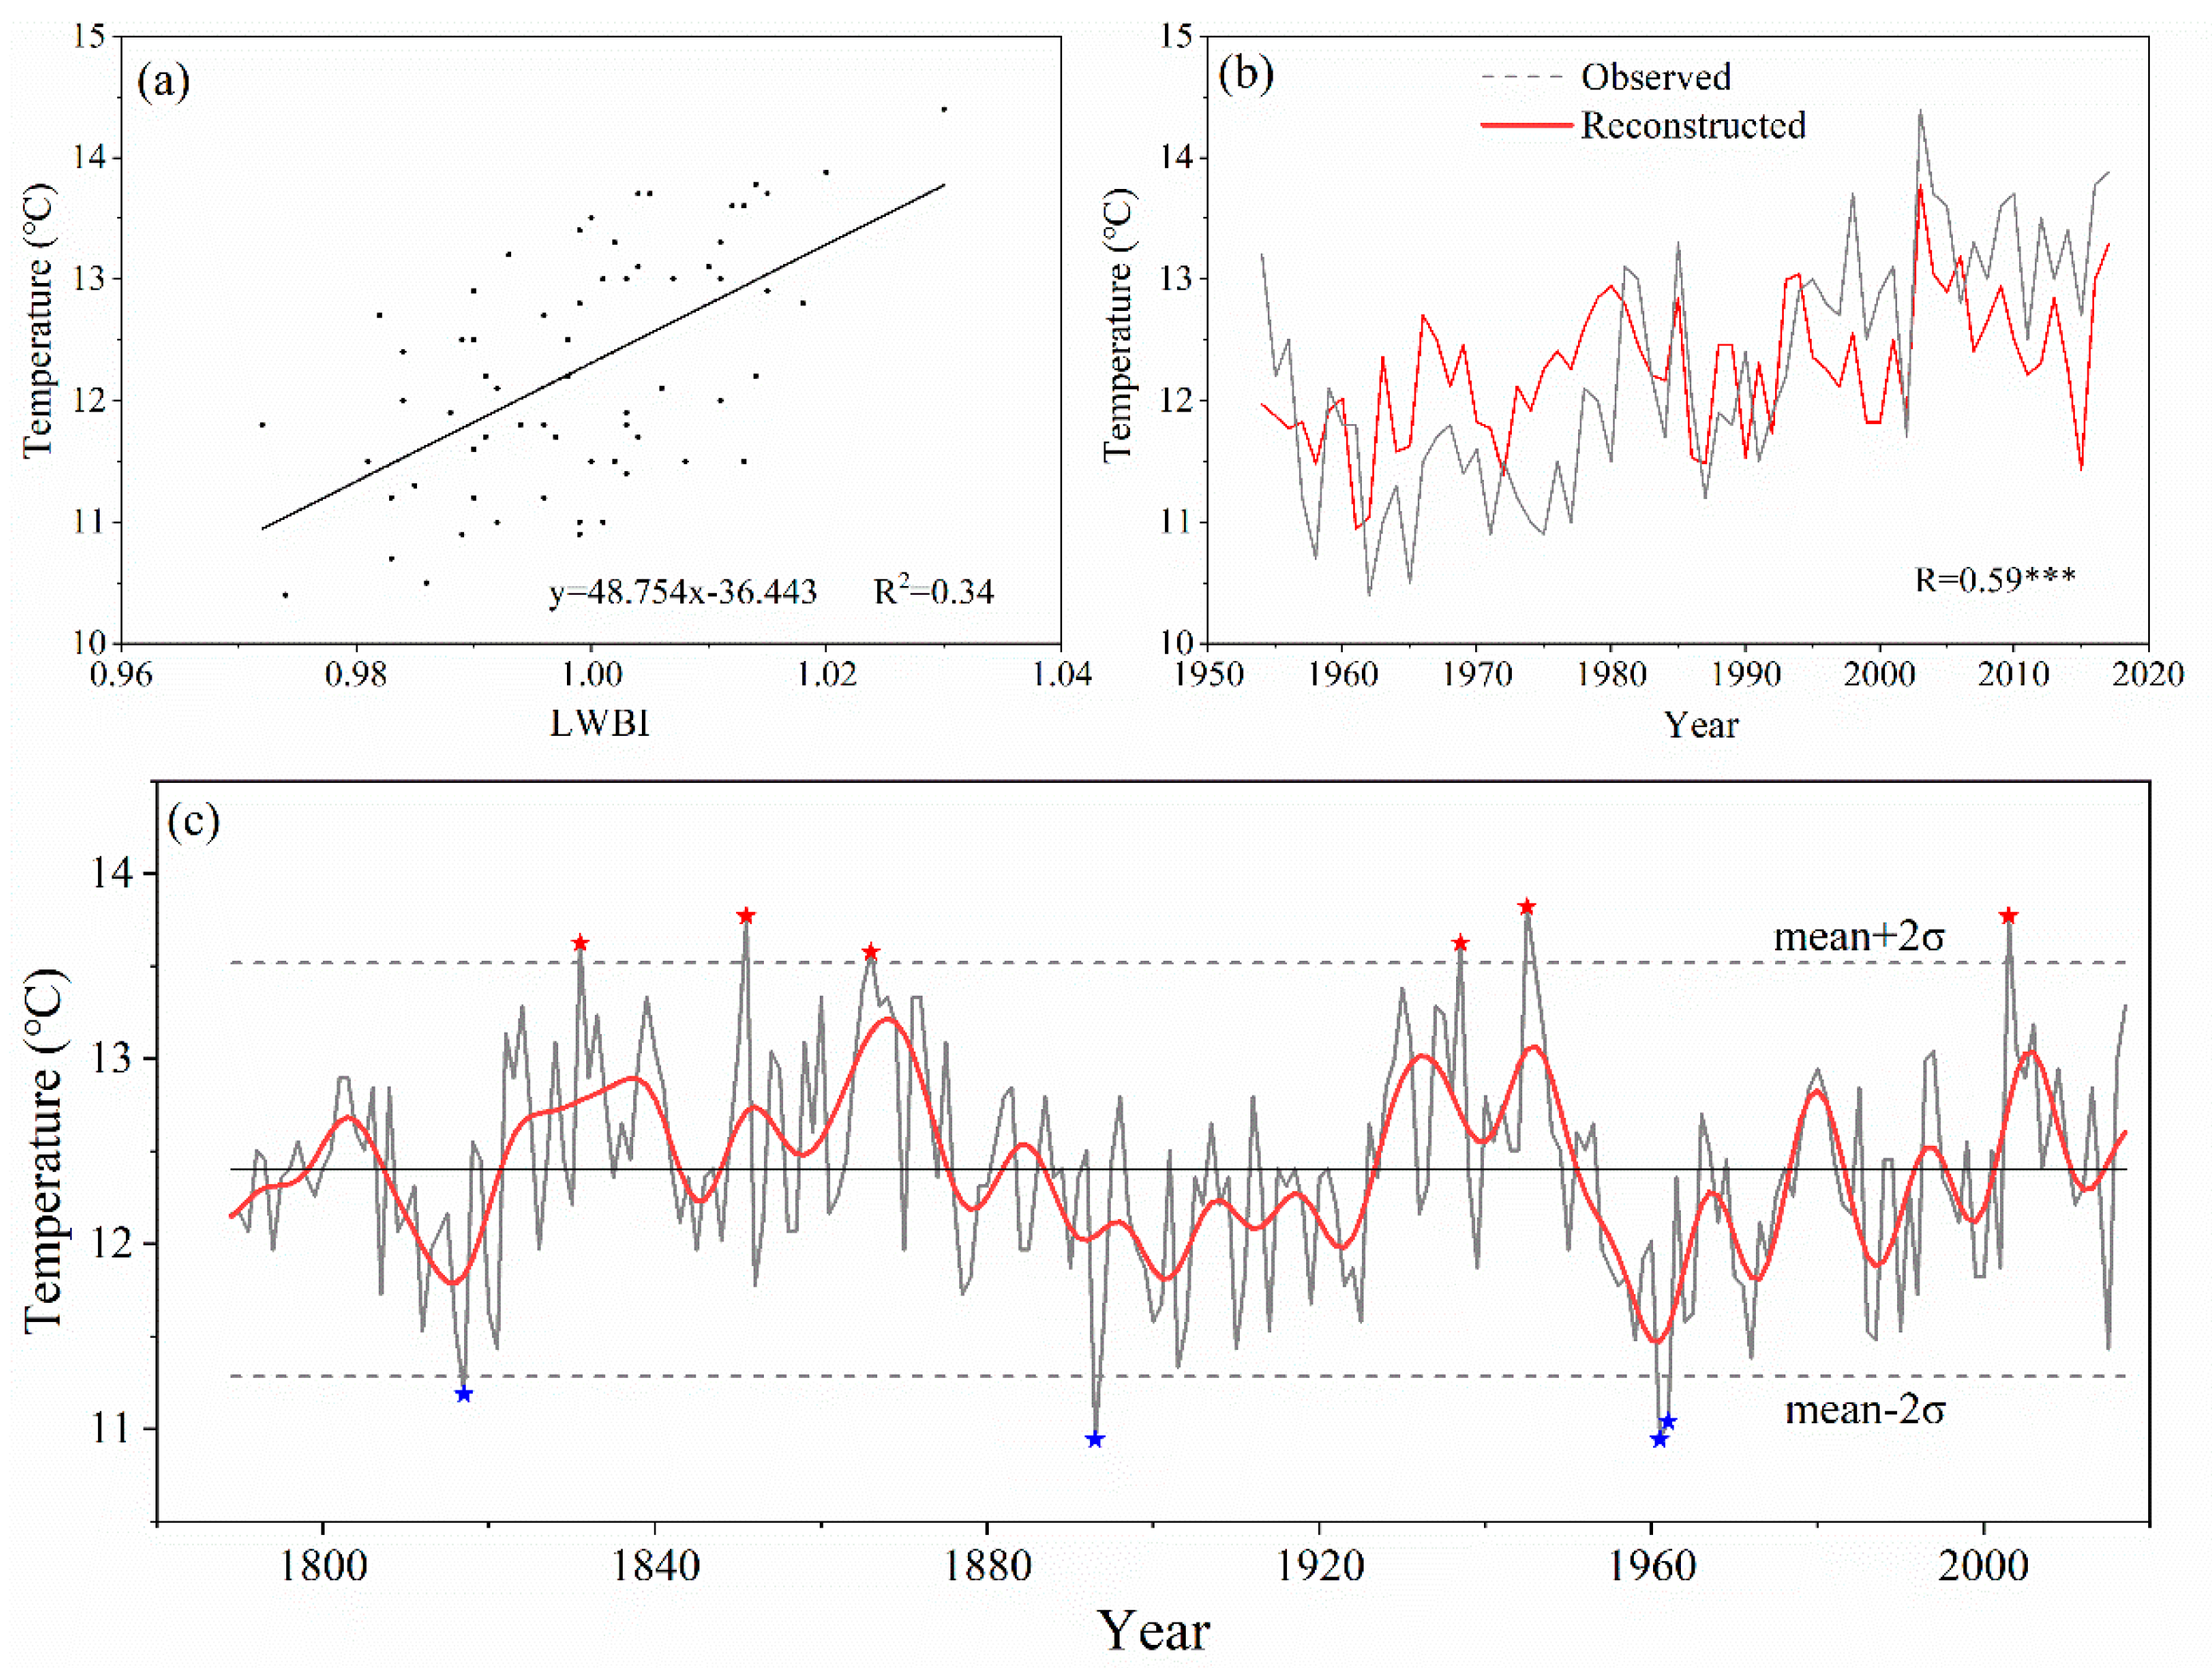
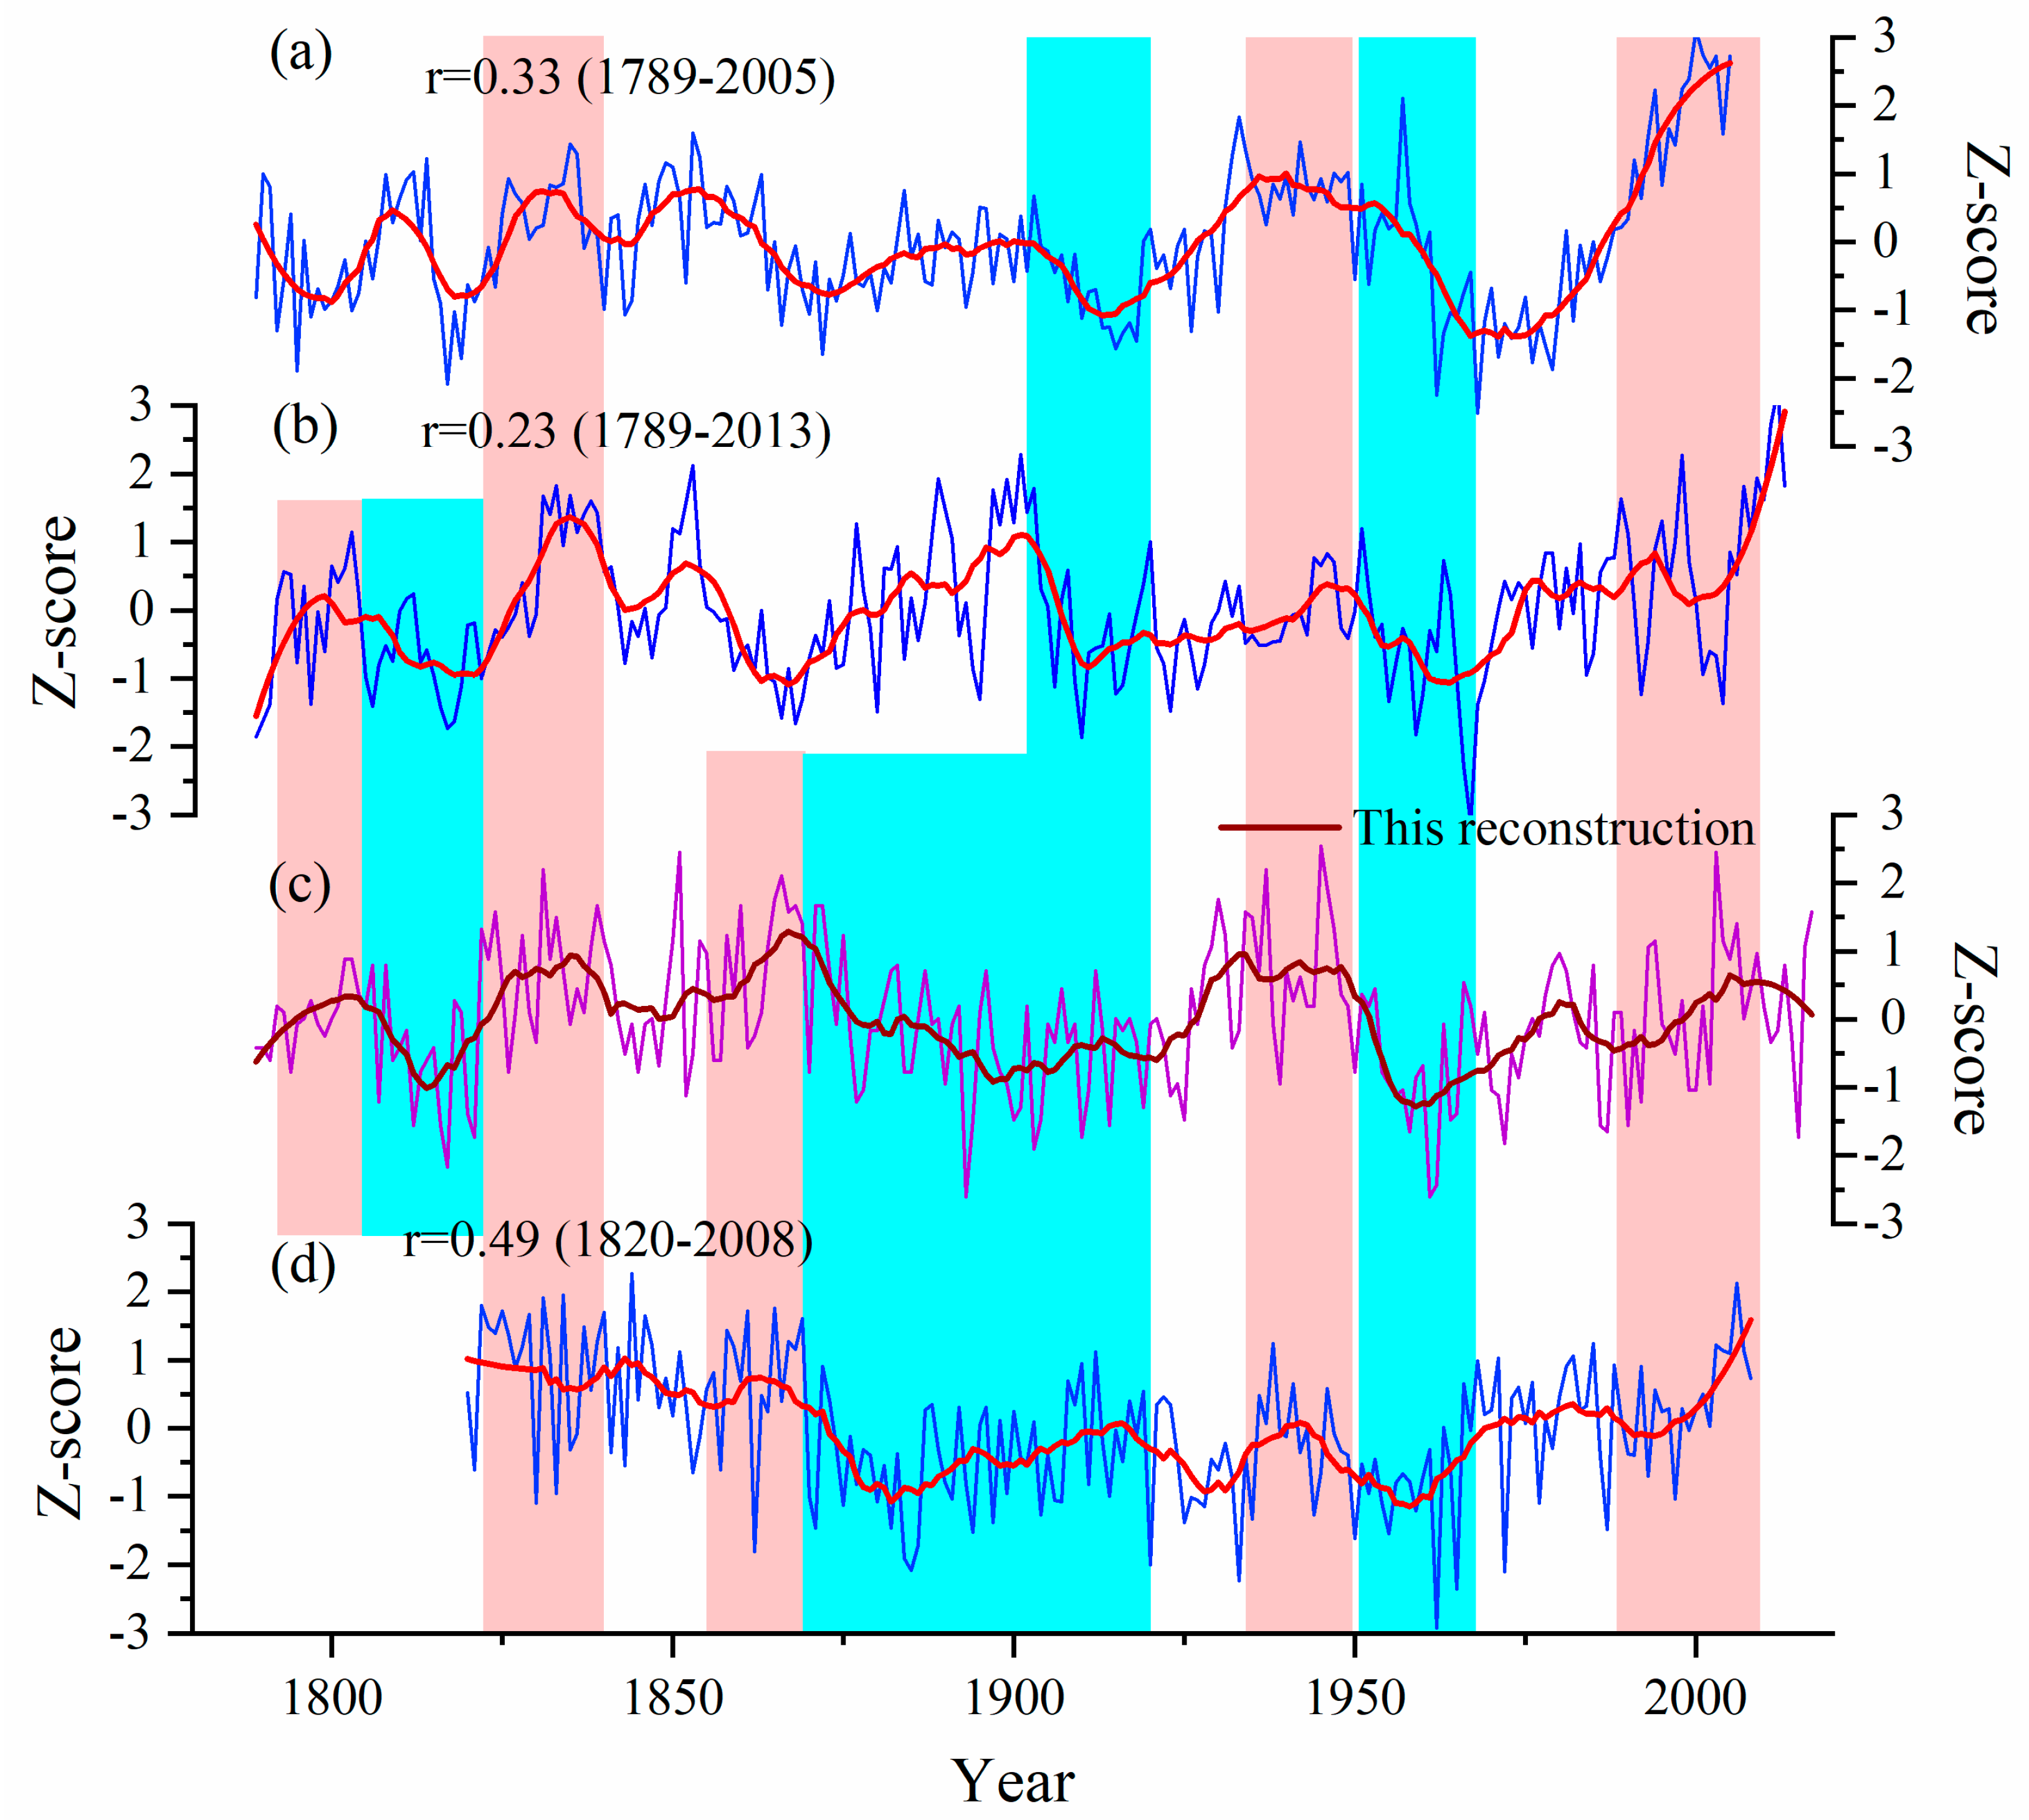
4.2. Two Centuries of August Temperature on the Southeastern TP
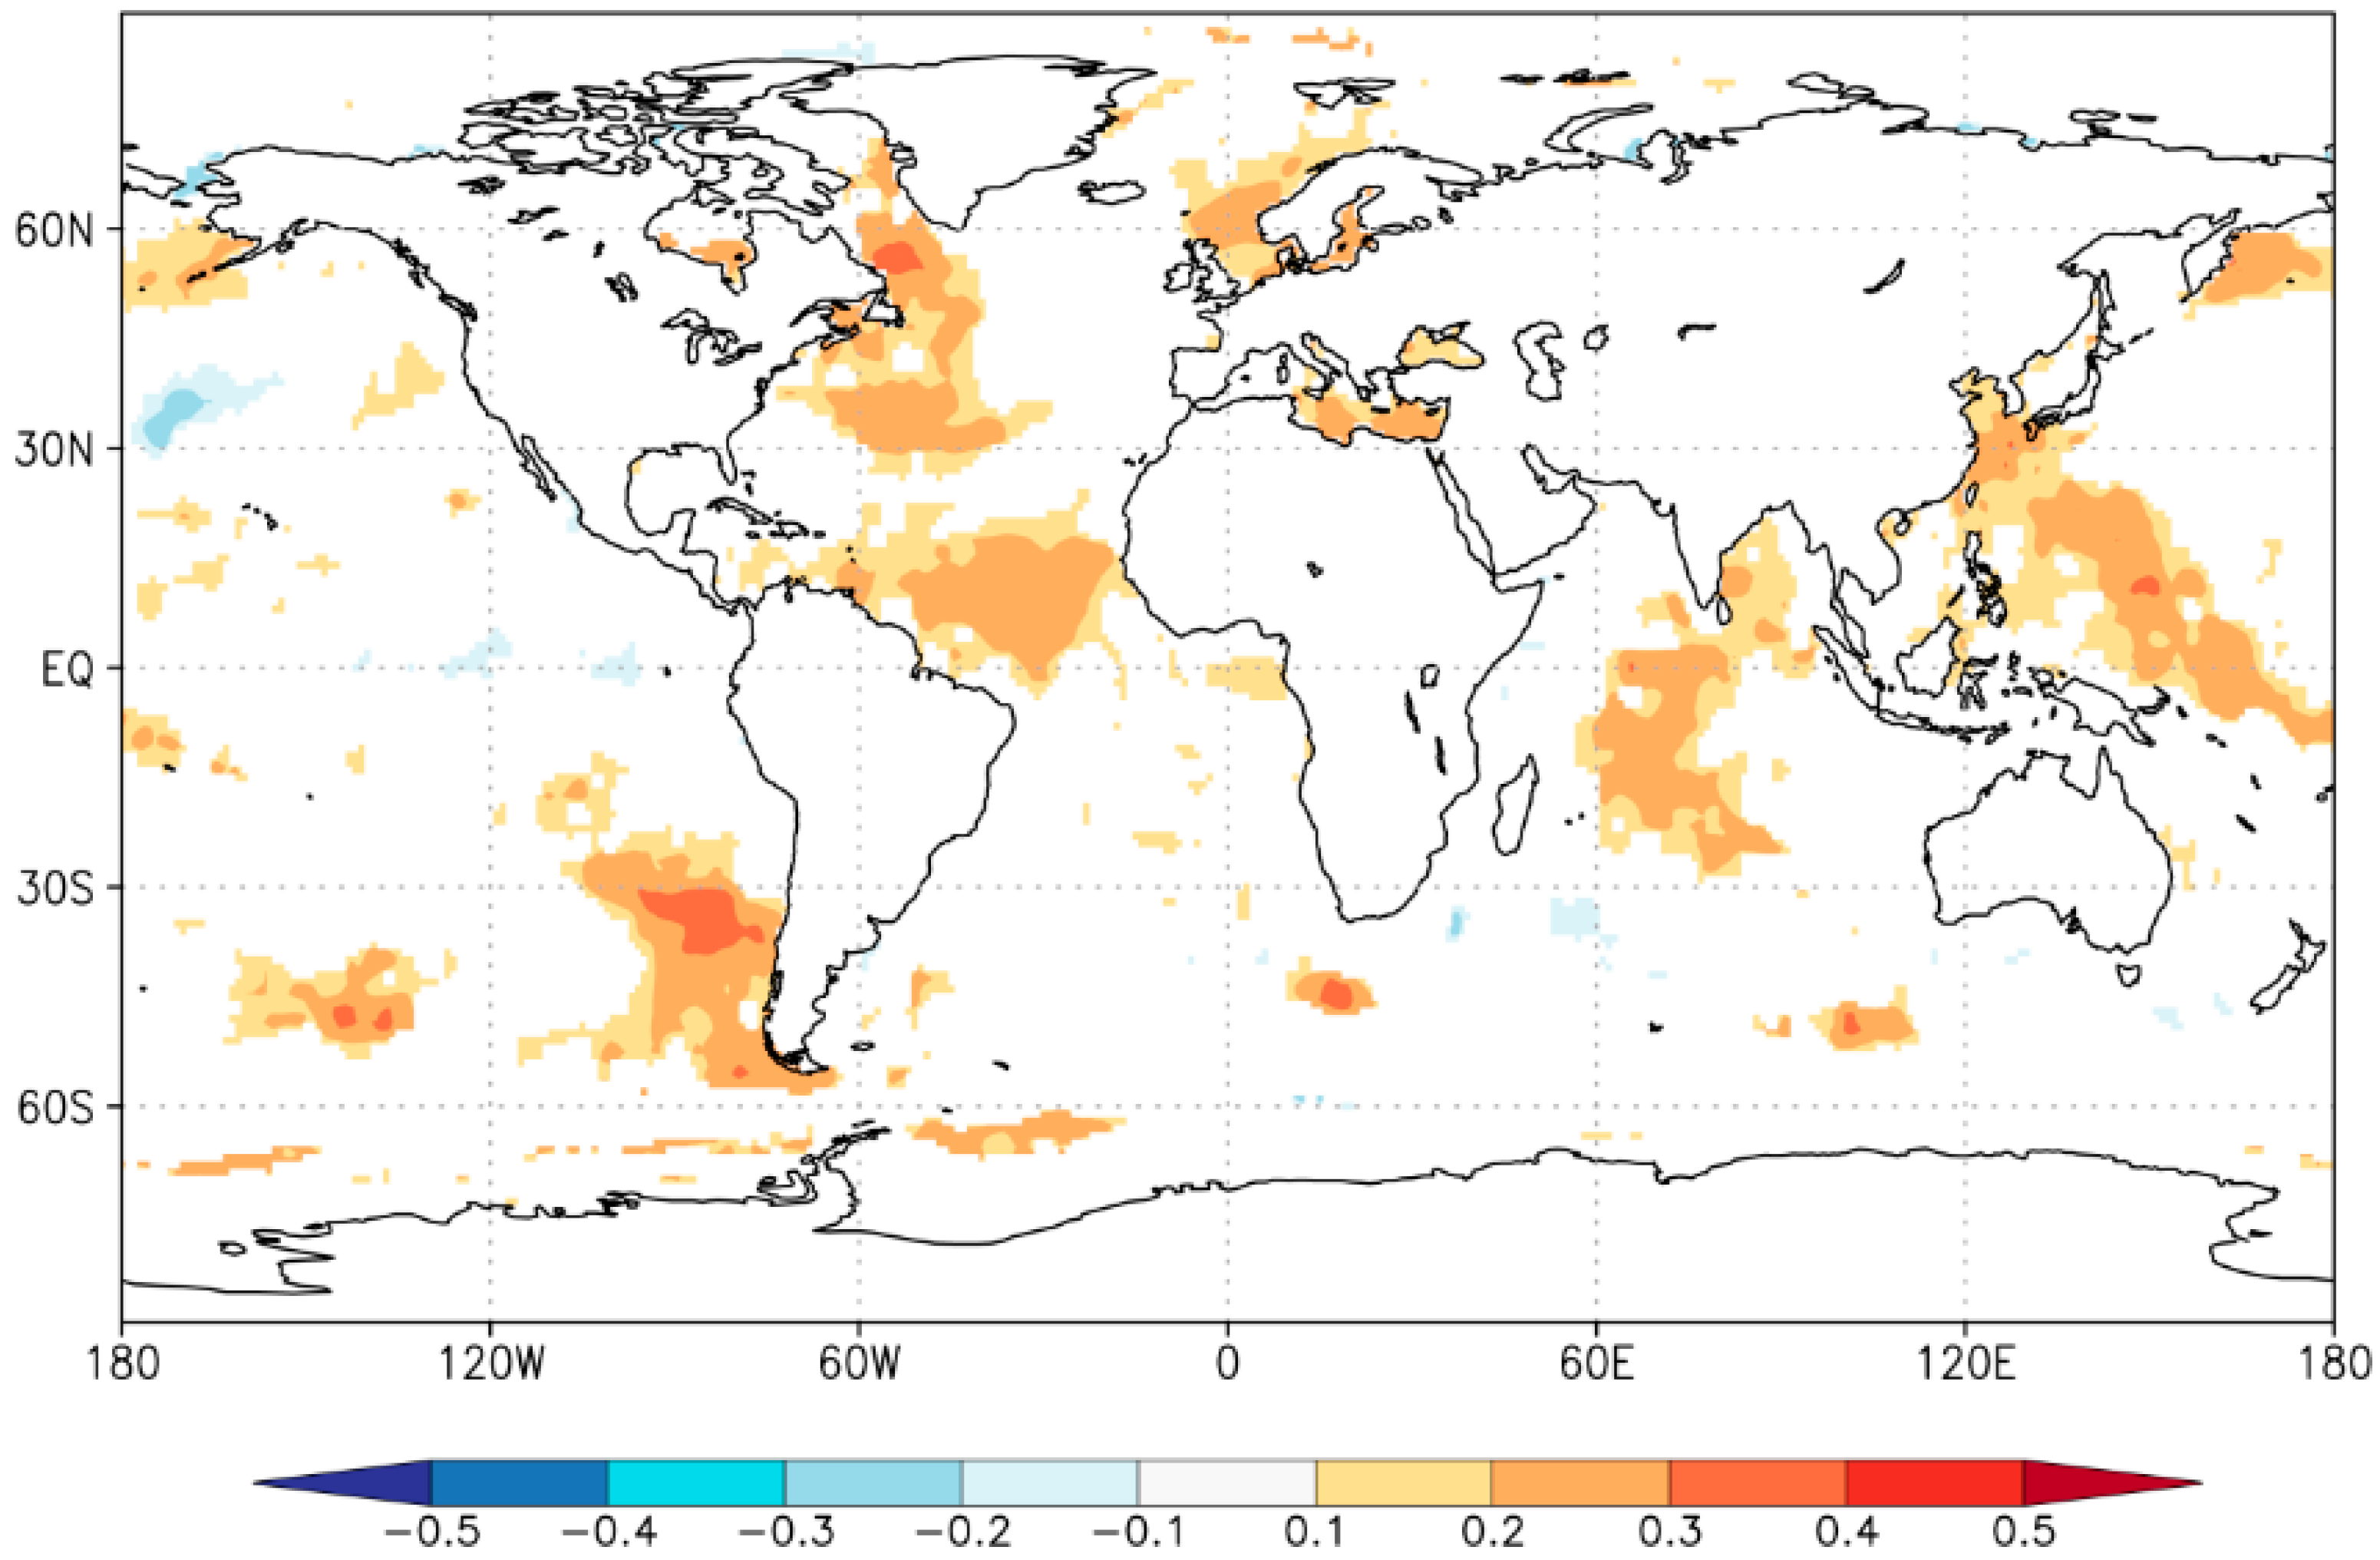
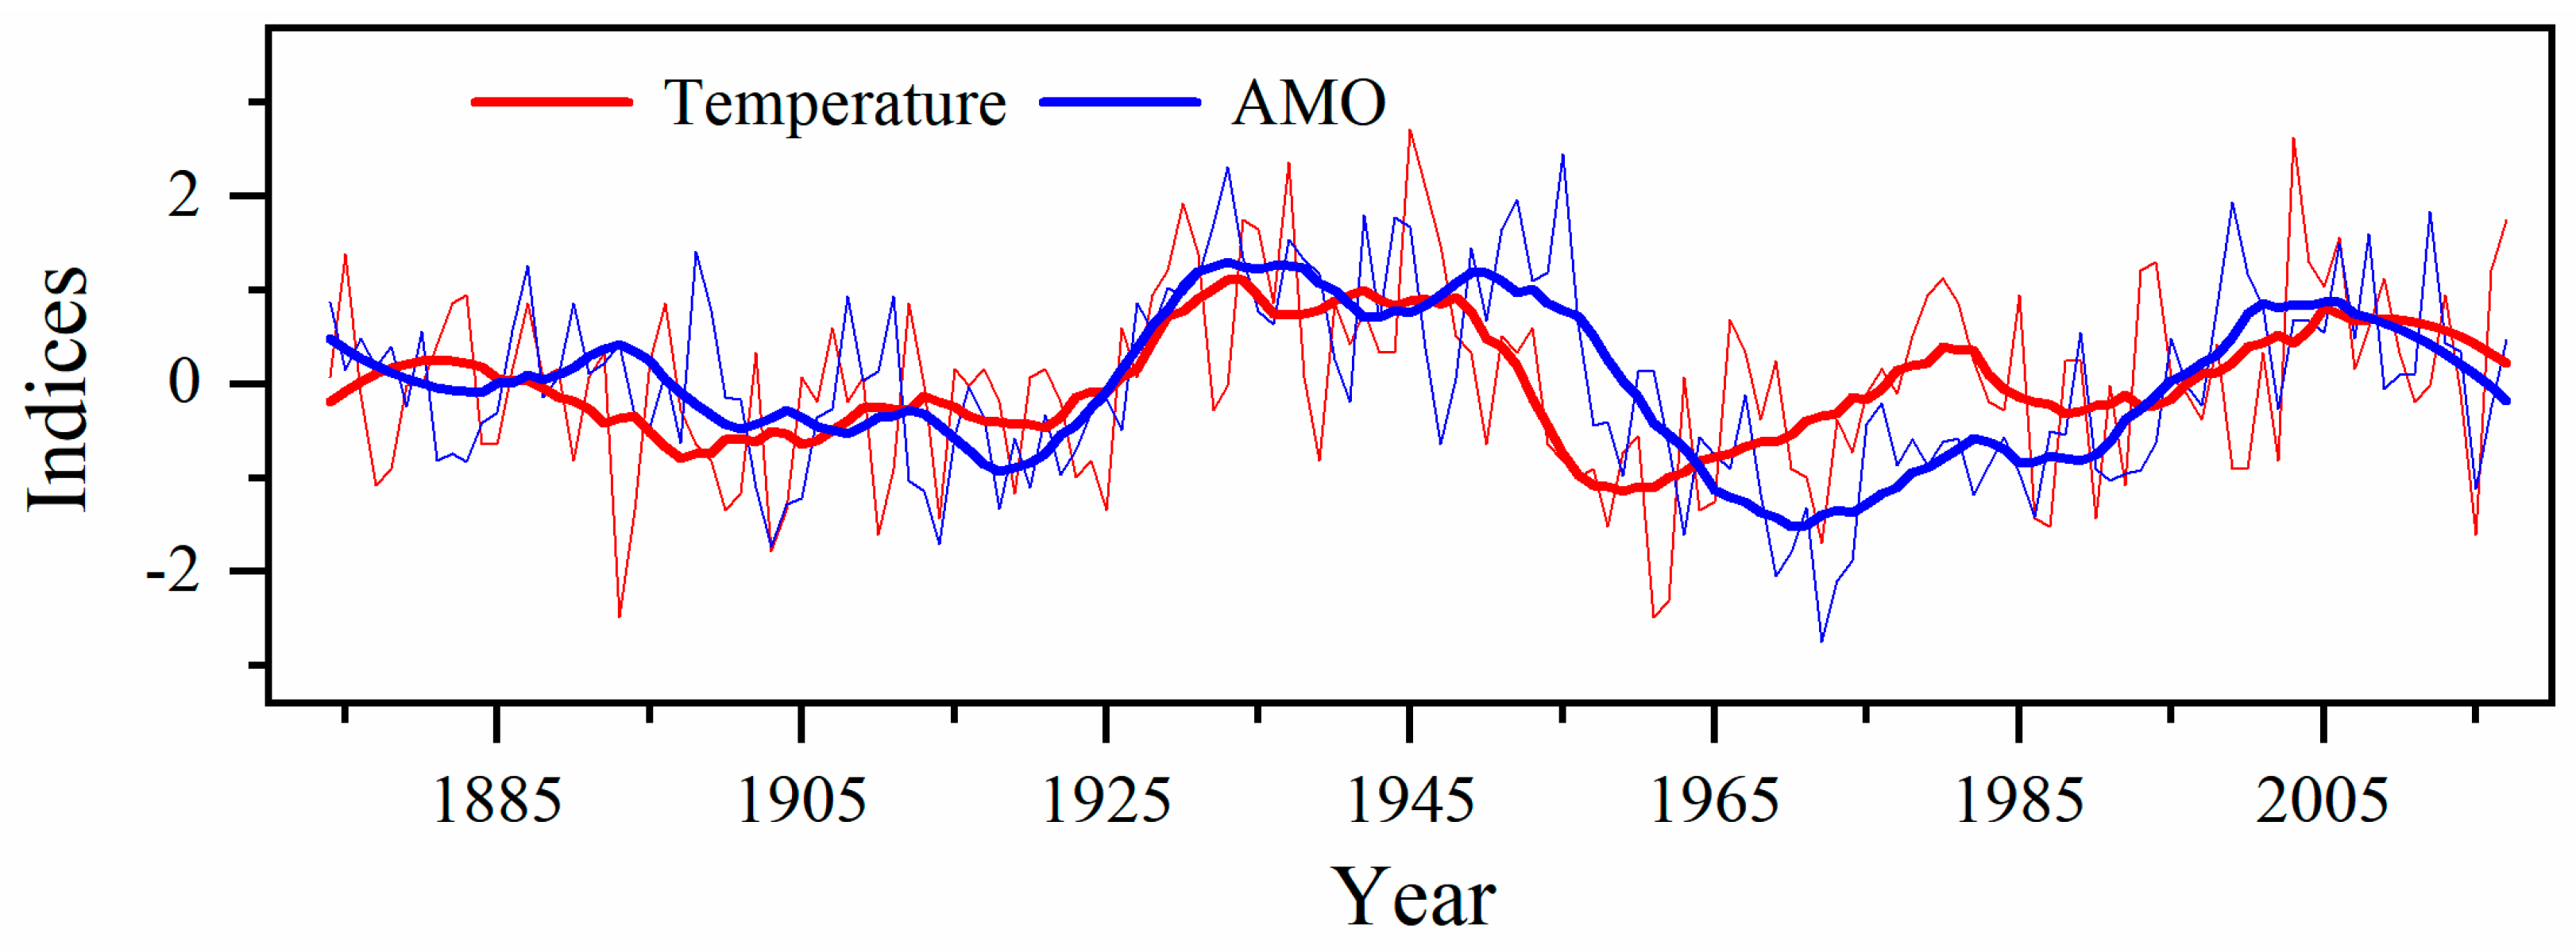
4.3. Linkage of August Temperature with the AMO
5. Conclusions
Author Contributions
Funding
Data Availability Statement
Conflicts of Interest
References
- Yao, T.; Thompson, L.G.; Mosbrugger, V.; Zhang, F.; Ma, Y.; Luo, T.; Xu, B.; Yang, X.; Joswiak, D.R.; Wang, W. Third pole environment (TPE). Environ. Dev. 2012, 3, 52–64. [Google Scholar] [CrossRef]
- Webster, P.J.; Magana, V.O.; Palmer, T.N.; Shukla, J.; Tomas, R.A.; Yanai, M.U.; Yasunari, T. Monsoons: Processes, predictability, and the prospects for prediction. J. Geophys. Res. Ocean. 1998, 103, 14451–14510. [Google Scholar] [CrossRef] [Green Version]
- Ding, Y. Effects of the Qinghai-Xizang (Tibetan) plateau on the circulation features over the plateau and its surrounding areas. Adv. Atmos. Sci. 1992, 9, 112–130. [Google Scholar]
- Mountain Research Initiative EDW Working Group. Elevation-dependent warming in mountain regions of the world. Nat. Clim. Chang. 2015, 5, 424–430. [Google Scholar] [CrossRef] [Green Version]
- You, Q.; Jiang, Z.; Moore, G.W.K.; Bao, Y.; Kong, L.; Kang, S. Revisiting the relationship between observed warming and surface pressure in the Tibetan Plateau. J. Clim. 2017, 30, 1721–1737. [Google Scholar] [CrossRef]
- Yao, T.; Wang, Y.; Liu, S.; Pu, J.; Shen, Y.; Lu, A. Recent glacial retreat in High Asia in China and its impact on water resource in Northwest China. Sci. China Ser. D Earth Sci. 2004, 47, 1065–1075. [Google Scholar] [CrossRef]
- Cyranoski, D. Climate change: The long-range forecast. Nature 2005, 438, 275–277. [Google Scholar] [CrossRef] [PubMed]
- Yang, B.; Qin, C.; Wang, J.; He, M.; Melvin, T.M.; Osborn, T.J.; Briffa, K.R. A 3500-year tree-ring record of annual precipitation on the northeastern Tibetan Plateau. Proc. Natl. Acad. Sci. USA 2014, 111, 2903–2908. [Google Scholar] [CrossRef]
- Zhang, Q.-B.; Fang, O. Tree rings circle an abrupt shift in climate. Science 2020, 370, 1037–1038. [Google Scholar] [CrossRef]
- Cook, E.R.; Anchukaitis, K.J.; Buckley, B.M.; D’Arrigo, R.D.; Jacoby, G.C.; Wright, W.E. Asian monsoon failure and megadrought during the last millennium. Science 2010, 328, 486–489. [Google Scholar] [CrossRef] [Green Version]
- Fan, Z.-X.; Bräuning, A.; Tian, Q.-H.; Yang, B.; Cao, K.-F. Tree ring recorded May–August temperature variations since AD 1585 in the Gaoligong Mountains, southeastern Tibetan Plateau. Palaeogeogr. Palaeoclimatol. Palaeoecol. 2010, 296, 94–102. [Google Scholar] [CrossRef]
- Wang, J.; Yang, B.; Qin, C.; Kang, S.; He, M.; Wang, Z. Tree-ring inferred annual mean temperature variations on the southeastern Tibetan Plateau during the last millennium and their relationships with the Atlantic Multidecadal Oscillation. Clim. Dyn. 2014, 43, 627–640. [Google Scholar] [CrossRef]
- Shi, S.; Li, J.; Shi, J.; Zhao, Y.; Huang, G. Three centuries of winter temperature change on the southeastern Tibetan Plateau and its relationship with the Atlantic Multidecadal Oscillation. Clim. Dyn. 2017, 49, 1305–1319. [Google Scholar] [CrossRef] [Green Version]
- Liang, E.Y.; Shao, X.M.; Xu, Y. Tree-ring evidence of recent abnormal warming on the southeast Tibetan Plateau. Theor. Appl. Climatol. 2009, 98, 9–18. [Google Scholar] [CrossRef]
- Liang, H.; Lyu, L.; Wahab, M. A 382-year reconstruction of August mean minimum temperature from tree-ring maximum latewood density on the southeastern Tibetan Plateau, China. Dendrochronologia 2016, 37, 1–8. [Google Scholar] [CrossRef]
- Li, M.-Y.; Wang, L.; Fan, Z.-X.; Shen, C.-C. Tree-ring density inferred late summer temperature variability over the past three centuries in the Gaoligong Mountains, southeastern Tibetan Plateau. Palaeogeogr. Palaeoclimatol. Palaeoecol. 2015, 422, 57–64. [Google Scholar] [CrossRef]
- He, M.; Yang, B.; Bräuning, A.; Rossi, S.; Ljungqvist, F.C.; Shishov, V.; Grießinger, J.; Wang, J.; Liu, J.; Qin, C. Recent advances in dendroclimatology in China. Earth-Sci. Rev. 2019, 194, 521–535. [Google Scholar] [CrossRef]
- Wang, L.; Duan, J.; Chen, J.; Huang, L.; Shao, X. Temperature reconstruction from tree-ring maximum density of Balfour spruce in eastern Tibet, China. Int. J. Climatol. 2010, 30, 972–979. [Google Scholar] [CrossRef]
- Duan, J.; Zhang, Q.-B. A 449 year warm season temperature reconstruction in the southeastern Tibetan Plateau and its relation to solar activity. J. Geophys. Res. Atmos. 2014, 119, 11–578. [Google Scholar] [CrossRef]
- Xing, P.; Zhang, Q.-B.; Lv, L.-X. Absence of late-summer warming trend over the past two and half centuries on the eastern Tibetan Plateau. Glob. Planet. Chang. 2014, 123, 27–35. [Google Scholar] [CrossRef]
- Schweingruber, F.H.; Fritts, H.C.; Bräker, O.U.; Drew, L.G.; Schär, E. The X-ray technique as applied to dendroclimatology. Tree-Ring Bull. 1978, 38, 61–91. [Google Scholar]
- McCarroll, D.; Pettigrew, E.; Luckman, A.; Guibal, F.; Edouard, J.L. Blue reflectance provides a surrogate for latewood density of high-latitude pine tree rings. Arct. Antarct. Alp. Res. 2002, 34, 450–453. [Google Scholar] [CrossRef]
- Fuentes, M.; Salo, R.; Björklund, J.; Seftigen, K.; Zhang, P.; Gunnarson, B.; Aravena, J.-C.; Linderholm, H.W. A 970-year-long summer temperature reconstruction from Rogen, west-central Sweden, based on blue intensity from tree rings. Holocene 2018, 28, 254–266. [Google Scholar] [CrossRef] [Green Version]
- Rydval, M.; Loader, N.J.; Gunnarson, B.E.; Druckenbrod, D.L.; Linderholm, H.W.; Moreton, S.G.; Wood, C.V.; Wilson, R. Reconstructing 800 years of summer temperatures in Scotland from tree rings. Clim. Dyn. 2017, 49, 2951–2974. [Google Scholar] [CrossRef] [Green Version]
- McCarroll, D.; Loader, N.J.; Jalkanen, R.; Gagen, M.H.; Grudd, H.; Gunnarson, B.E.; Kirchhefer, A.J.; Friedrich, M.; Linderholm, H.W.; Lindholm, M. A 1200-year multiproxy record of tree growth and summer temperature at the northern pine forest limit of Europe. Holocene 2013, 23, 471–484. [Google Scholar] [CrossRef] [Green Version]
- Wilson, R.; Rao, R.; Rydval, M.; Wood, C.; Larsson, L.-Å.; Luckman, B.H. Blue Intensity for dendroclimatology: The BC blues: A case study from British Columbia, Canada. Holocene 2014, 24, 1428–1438. [Google Scholar] [CrossRef]
- Heeter, K.J.; Harley, G.L.; Maxwell, J.T.; Wilson, R.J.; Abatzoglou, J.T.; Rayback, S.A.; Rochner, M.L.; Kitchens, K.A. Summer temperature variability since 1730 CE across the low-to-mid latitudes of western North America from a tree ring blue intensity network. Quat. Sci. Rev. 2021, 267, 107064. [Google Scholar] [CrossRef]
- Brookhouse, M.; Graham, R. Application of the minimum blue-intensity technique to a Southern-Hemisphere conifer. Tree-Ring Res. 2016, 72, 103–107. [Google Scholar] [CrossRef]
- McCarroll, D.; Tuovinen, M.; Campbell, R.; Gagen, M.; Grudd, H.; Jalkanen, R.; Loader, N.J.; Robertson, I. A critical evaluation of multi-proxy dendroclimatology in northern Finland. J. Quat. Sci. 2011, 26, 7–14. [Google Scholar] [CrossRef]
- Österreicher, A.; Weber, G.; Leuenberger, M.; Nicolussi, K. Exploring blue intensity-comparison of blue intensity and MXD data from Alpine spruce trees. Tree Rings Archaeol. Climatol. Ecol. 2015, 13, 56–61. [Google Scholar]
- Rydval, M.; Gunnarson, B.E.; Loader, N.J.; Cook, E.R.; Druckenbrod, D.L.; Wilson, R. Spatial reconstruction of Scottish summer temperatures from tree rings. Int. J. Climatol. 2017, 37, 1540–1556. [Google Scholar] [CrossRef] [Green Version]
- Cao, X.; Fang, K.; Chen, P.; Zhang, P.; Björklund, J.; Pumijumnong, N.; Guo, Z. Microdensitometric records from humid subtropical China show distinct climate signals in earlywood and latewood. Dendrochronologia 2020, 64, 125764. [Google Scholar] [CrossRef]
- Cao, X.; Hu, H.; Kao, P.-k.; Buckley, B.M.; Dong, Z.; Chen, X.; Zhou, F.; Fang, K. Improved spring temperature reconstruction using earlywood blue intensity in southeastern China. Int. J. Climatol. 2022, 42, 6204–6220. [Google Scholar] [CrossRef]
- van der Schrier, G.; Barichivich, J.; Briffa, K.R.; Jones, P.D. A scPDSI-based global data set of dry and wet spells for 1901–2009. J. Geophys. Res. Atmos. 2013, 118, 4025–4048. [Google Scholar] [CrossRef]
- Harris, I.; Jones, P.D.; Osborn, T.J.; Lister, D.H. Updated high-resolution grids of monthly climatic observations—The CRU TS3. 10 Dataset. Int. J. Climatol. 2014, 34, 623–642. [Google Scholar] [CrossRef] [Green Version]
- Stokes, M.A. An Introduction to Tree-Ring Dating; University of Arizona Press: Tucson, AZ, USA, 1996. [Google Scholar]
- Babst, F.; Frank, D.; Büntgen, U.; Nievergelt, D.; Esper, J. Effect of sample preparation and scanning resolution on the Blue Reflectance of Picea abies. TRACE Proc 2009, 7, 188–195. [Google Scholar]
- Rydval, M.; Larsson, L.-Å.; McGlynn, L.; Gunnarson, B.E.; Loader, N.J.; Young, G.H.F.; Wilson, R. Blue intensity for dendroclimatology: Should we have the blues? Experiments from Scotland. Dendrochronologia 2014, 32, 191–204. [Google Scholar] [CrossRef]
- Larsson, L. Cdendro Package Version 7; CooRecorder and Cdendro Programs of the CooRecorder. Cybis: Saltsjöbaden, Sweden, 2014. [Google Scholar]
- Holmes, R.L. Computer-assisted quality control in tree-ring dating and measurement. Tree-Ring Bull. 1983, 43, 69–78. [Google Scholar]
- Björklund, J.A.; Gunnarson, B.E.; Seftigen, K.; Esper, J.; Linderholm, H.W. Blue intensity and density from northern Fennoscandian tree rings, exploring the potential to improve summer temperature reconstructions with earlywood information. Clim. Past 2014, 10, 877–885. [Google Scholar] [CrossRef] [Green Version]
- Cook, E.R.; Briffa, K.R.; Jones, P.D. Spatial regression methods in dendroclimatology: A review and comparison of two techniques. Int. J. Climatol. 1994, 14, 379–402. [Google Scholar] [CrossRef]
- Wigley, T.M.L.; Briffa, K.R.; Jones, P.D. On the average value of correlated time series, with applications in dendroclimatology and hydrometeorology. J. Appl. Meteorol. Climatol. 1984, 23, 201–213. [Google Scholar] [CrossRef]
- van Oldenborgh, G.J.; te Raa, L.A.; Dijkstra, H.A.; Philip, S.Y. Frequency-or amplitude-dependent effects of the Atlantic meridional overturning on the tropical Pacific Ocean. Ocean Sci. 2009, 5, 293–301. [Google Scholar] [CrossRef] [Green Version]
- Robinson, W.J.; Cook, E.; Pilcher, J.R.; Eckstein, D.; Kairiukstis, L.; Shiyatov, S.; Norton, D.A. Some historical background on dendrochronology. In Methods of Dendrochronology: Applications in the Environmental Sciences; Springer: Dordrecht, The Netherlands, 1990; pp. 1–21. [Google Scholar]
- Fritts, H.C. Tree Rings and Climate; Academic Press: New York, NY, USA, 1976. [Google Scholar]
- Mann, M.E.; Lees, J.M. Robust estimation of background noise and signal detection in climatic time series. Clim. Chang. 1996, 33, 409–445. [Google Scholar] [CrossRef]
- Krusic, P.J.; Cook, E.R.; Dukpa, D.; Putnam, A.E.; Rupper, S.; Schaefer, J. Six hundred thirty-eight years of summer temperature variability over the Bhutanese Himalaya. Geophys. Res. Lett. 2015, 42, 2988–2994. [Google Scholar] [CrossRef]
- Li, M.; Duan, J.; Wang, L.; Zhu, H. Late summer temperature reconstruction based on tree-ring density for Sygera Mountain, southeastern Tibetan Plateau. Glob. Planet. Chang. 2018, 163, 10–17. [Google Scholar] [CrossRef]
- Vieira, J.; Campelo, F.; Rossi, S.; Carvalho, A.; Freitas, H.; Nabais, C. Adjustment capacity of maritime pine cambial activity in drought-prone environments. PLoS ONE 2015, 10, e0126223. [Google Scholar] [CrossRef] [Green Version]
- de Luis, M.; Novak, K.; Raventós, J.; Gričar, J.; Prislan, P.; Čufar, K. Climate factors promoting intra-annual density fluctuations in Aleppo pine (Pinus halepensis) from semiarid sites. Dendrochronologia 2011, 29, 163–169. [Google Scholar] [CrossRef]
- Björklund, J.; Seftigen, K.; Schweingruber, F.; Fonti, P.; von Arx, G.; Bryukhanova, M.V.; Cuny, H.E.; Carrer, M.; Castagneri, D.; Frank, D.C. Cell size and wall dimensions drive distinct variability of earlywood and latewood density in Northern Hemisphere conifers. New Phytol. 2017, 216, 728–740. [Google Scholar] [CrossRef] [Green Version]
- Campbell, R.; McCarroll, D.; Robertson, I.; Loader, N.J.; Grudd, H.; Gunnarson, B. Blue intensity in Pinus sylvestris tree rings: A manual for a new palaeoclimate proxy. Tree-Ring Res. 2011, 67, 127–134. [Google Scholar] [CrossRef] [Green Version]
- Björklund, J.; von Arx, G.; Nievergelt, D.; Wilson, R.; Van den Bulcke, J.; Günther, B.; Loader, N.J.; Rydval, M.; Fonti, P.; Scharnweber, T. Scientific merits and analytical challenges of tree-ring densitometry. Rev. Geophys. 2019, 57, 1224–1264. [Google Scholar] [CrossRef] [Green Version]
- Campbell, R.; McCarroll, D.; Loader, N.J.; Grudd, H.; Robertson, I.; Jalkanen, R. Blue intensity in Pinus sylvestris tree-rings: Developing a new palaeoclimate proxy. Holocene 2007, 17, 821–828. [Google Scholar] [CrossRef] [Green Version]
- Li, M.; Huang, L.; Yin, Z.-Y.; Shao, X. Temperature reconstruction and volcanic eruption signal from tree-ring width and maximum latewood density over the past 304 years in the southeastern Tibetan Plateau. Int. J. Biometeorol. 2017, 61, 2021–2032. [Google Scholar] [CrossRef] [PubMed]
- Bräuning, A.; Mantwill, B. Summer temperature and summer monsoon history on the Tibetan plateau during the last 400 years recorded by tree rings. Geophys. Res. Lett. 2004, 31, L24205. [Google Scholar] [CrossRef]
- Liu, X.; Chen, B. Climatic warming in the Tibetan Plateau during recent decades. Int. J. Climatol. 2000, 20, 1729–1742. [Google Scholar] [CrossRef]
- Duan, J.; Esper, J.; Büntgen, U.; Li, L.; Xoplaki, E.; Zhang, H.; Wang, L.; Fang, Y.; Luterbacher, J. Weakening of annual temperature cycle over the Tibetan Plateau since the 1870s. Nat. Commun. 2017, 8, 14008. [Google Scholar] [CrossRef] [PubMed] [Green Version]
- Delworth, T.L.; Mann, M.E. Observed and simulated multidecadal variability in the Northern Hemisphere. Clim. Dyn. 2000, 16, 661–676. [Google Scholar] [CrossRef] [Green Version]
- Kerr, R.A. A North Atlantic climate pacemaker for the centuries. Science 2000, 288, 1984–1985. [Google Scholar] [CrossRef] [Green Version]
- Zhang, R.; Delworth, T.L.; Held, I.M. Can the Atlantic Ocean drive the observed multidecadal variability in Northern Hemisphere mean temperature? Geophys. Res. Lett. 2007, 34, L02709. [Google Scholar] [CrossRef] [Green Version]
- Li, S.; Bates, G.T. Influence of the Atlantic multidecadal oscillation on the winter climate of East China. Adv. Atmos. Sci. 2007, 24, 126–135. [Google Scholar] [CrossRef]
- Sutton, R.T.; Dong, B. Atlantic Ocean influence on a shift in European climate in the 1990s. Nat. Geosci. 2012, 5, 788–792. [Google Scholar] [CrossRef] [Green Version]
- Wang, Y.; Li, S.; Luo, D. Seasonal response of Asian monsoonal climate to the Atlantic Multidecadal Oscillation. J. Geophys. Res. Atmos. 2009, 114, D02112. [Google Scholar] [CrossRef]


| Site | Latitude | Longitude | Elevation (m) | Species | Cores/Trees |
|---|---|---|---|---|---|
| HLM | 29.27° N | 98.67° E | 4160 | Abies spectabilis | 64/30 |
| JYV | 28.48° N | 98.58° E | 4200 | Abies spectabilis | 52/26 |
| Deqin | 28.48° N | 98.92° E | 3319 |
| Statistic | TRW | EWBI | LWBI | ΔBI |
|---|---|---|---|---|
| Mean sensitivity (MS) | 0.180 | 0.026 | 0.024 | 0.028 |
| Standard deviation (SD) | 0.194 | 0.111 | 0.167 | 0.041 |
| First-order autocorrelation (AC1) | 0.848 | 0.828 | 0.742 | 0.555 |
| Correlation for all cores (r1) | 0.359 | 0.142 | 0.240 | 0.135 |
| Correlation between trees (r2) | 0.131 | 0.129 | 0.170 | 0.138 |
| Correlation within trees (r3) | 0.189 | 0.109 | 0.165 | 0.134 |
| Signal-to-noise ratio (SNR) | 11.891 | 4.447 | 6.363 | 6.949 |
| Expressed population signal (EPS) | 0.922 | 0.816 | 0.864 | 0.874 |
| First year SSS > 0.85 | 1757 | 1807 | 1789 | 1783 |
| Calibration (1954–1985) | Verification (1986–2017) | Calibration (1986–2017) | Verification (1954–1985) | Full Calibration (1954–2017) | |
|---|---|---|---|---|---|
| R | 0.414 | 0.641 | 0.641 | 0.414 | 0.586 |
| R2 | 0.172 | 0.410 | 0.410 | 0.172 | 0.343 |
| CE | - | 0.410 | - | 0.172 | - |
| RE | - | 0.821 | - | 0.761 | - |
| Sign test | 19+/13− *** | 28+/4− *** | 21+/11− *** | 27+/5− *** | 22+/42− *** |
Disclaimer/Publisher’s Note: The statements, opinions and data contained in all publications are solely those of the individual author(s) and contributor(s) and not of MDPI and/or the editor(s). MDPI and/or the editor(s) disclaim responsibility for any injury to people or property resulting from any ideas, methods, instructions or products referred to in the content. |
© 2023 by the authors. Licensee MDPI, Basel, Switzerland. This article is an open access article distributed under the terms and conditions of the Creative Commons Attribution (CC BY) license (https://creativecommons.org/licenses/by/4.0/).
Share and Cite
Li, T.; Li, J. August Temperature Reconstruction Based on Tree-Ring Latewood Blue Intensity in the Southeastern Tibetan Plateau. Forests 2023, 14, 1441. https://doi.org/10.3390/f14071441
Li T, Li J. August Temperature Reconstruction Based on Tree-Ring Latewood Blue Intensity in the Southeastern Tibetan Plateau. Forests. 2023; 14(7):1441. https://doi.org/10.3390/f14071441
Chicago/Turabian StyleLi, Teng, and Jinbao Li. 2023. "August Temperature Reconstruction Based on Tree-Ring Latewood Blue Intensity in the Southeastern Tibetan Plateau" Forests 14, no. 7: 1441. https://doi.org/10.3390/f14071441