Article

Temporal Changes in Growth–Climate Relationship of Pinus taiwanensis Hayata in Subtropical China

1
Key Laboratory of Ecological Restoration of Loess Plateau, Institute of Loess Plateau, Shanxi University, Taiyuan 030006, China
2
Shanxi Yellow River Laboratory, Taiyuan 030006, China
3
National Institute of Natural Hazards, Beijing 100085, China
4
Guangdong Provincial Key Laboratory of Applied Botany, South China Botanical Garden, Chinese Academy of Sciences, 723 Xingke Road, Tianhe District, Guangzhou 510650, China
5
Key Laboratory of Conservation Biology for Endangered Wildlife of the Ministry of Education, College of Life Sciences, Zhejiang University, Hangzhou 310058, China
*
Author to whom correspondence should be addressed.
These authors contributed equally to this work.
Forests 2022, 13(9), 1502; https://doi.org/10.3390/f13091502
Submission received: 26 July 2022 / Revised: 4 September 2022 / Accepted: 11 September 2022 / Published: 16 September 2022

Abstract

:
Whether the tree growth–climate relationship is consistent in subtropical China has not yet been reported. To fill this gap, we chose Pinus taiwanensis which grow on Lushan Mountain in a subtropical region of China as the target tree species, established a standard tree-ring width chronology, and conducted a moving correlation analysis with climatic factors. The results showed that the relationship between radial growth of P. taiwanensis and climate changed significantly during 1980–1990. From 1955 to 1985, tree rings were negatively affected mainly by precipitation in September of the current growing season. From 1990 to 2014, however, a significant negative correlation appeared between tree rings and sunshine duration from March to April in the growing season. Our results suggest the need to pay attention to this growth–climate inconsistency when conducting dendroclimatology studies in subtropical China. However, the causes of the inconsistency still require further confirmation.

1. Introduction

Tree rings have been widely used as a proxy of paleo-climate reconstruction because of their high resolution and accurate cross-dating. Tree ring–based paleo-climate reconstructions have been extensively conducted globally, providing important evidence for our understanding of climate change [1,2,3,4,5]. However, the basic principle of homogeneity, which is the most important precondition for paleo-climate reconstruction [6], has been challenged with regard to tree rings due to the unstable relationships between tree rings and climate.
On the one hand, with climate change, the limiting factors of tree growth have changed, leading to an inconsistent growth–climate relationship, which is called the “divergence problem” [7]. For example, Briffa et al. [8] studied the relationship between the tree-ring width and late-wood density of several tree species and the climates in the high latitudes of the Northern Hemisphere and found that the sensitivity of tree growth to climate is decreasing. Recently, similar discoveries have been made in some mid-latitudes, such as in the European region [9,10,11] and Asia [12,13].
On the other hand, studies have shown that tree age also significantly affects growth–climate relationships. For example, Carrer and Urbinati [14] studied the corresponding relationships among four age classes of two tree species (Larix decidua Mill. and Pinus cembra L.) and the climate near the tree line of the Italian Alps and found that older trees had a stronger response to climate. Similar findings have been reported in European [15,16,17] and Asian [18,19,20] regions. These findings remind dendrochronologists to carry out stability tests first when performing reconstruction in order to verify that the growth–climate relationships are consistent.
Recently, with the vigorous development of dendrochronology, people have started paying attention to the warm and humid subtropical monsoon region. The climate pattern of the subtropical monsoon region in China is affected mainly by the uplift of the Qinghai–Tibet Plateau [21]. Compared to other regions at the same latitude, it is warm and humid. In the past, there were relatively few paleo-climate reconstructions using tree rings. However, with the recent increase in field work, tree species and regions that are highly sensitive to climate have been found. For example, Duan et al. [22] reconstructed the winter (January to April) temperature variation in subtropical China using the tree-ring width of Pinus massoniana Lamb. and found that the Ural High ridge might be the cause of extreme cold in winter in subtropical China. Shi et al. [23] reconstructed precipitation from February to April in a subtropical region by using P. massoniana tree-ring width. Cai et al. [24] reconstructed the surface temperature during the growing season in the subtropical region by using the ring width of P. taiwanensis. Apart from these climate reconstructions, other tree-ring studies have been conducted. Liang et al. [25] reported that the growth of P. massoniana in subtropical China was affected mainly by competition, which was followed by the climate factor. They also found that with an increase in latitude, the effect of climate increased and the effect of competition decreased. Huang et al. [26] conducted a meta-analysis to study the tree ring–climate relationship of P. massoniana in 113 sample sites in subtropical China. They found that the growth of P. massoniana was affected by both temperature and precipitation. Su et al. [27] studied the tree rings of 10 tree species on the Yunnan-Guizhou Plateau and found that drought was the climatic factor that extensively restricted tree growth in this region. Yang et al. [28] collected tree-ring samples from two conifer species (Pinus yunnanensis Franch and Pinus kesiya Royle ex Gord) in Yunnan and determined that the tree ring–climate relationship changed with dry-to-humid gradients. Zuidema et al. [29] analyzed tree-ring samples throughout the tropics and found that dry season climate had the greatest impact on tree growth.
Although considerable results have been achieved in tropical and subtropical regions in recent years, whether the tree ring–climate relationship in this subtropical region is consistent has not yet been verified. To fill this gap, we collected tree-ring samples of P. taiwanensis in the Lushan area in subtropical China to verify the stability of the tree ring–climate relationship.

2. Materials and Methods
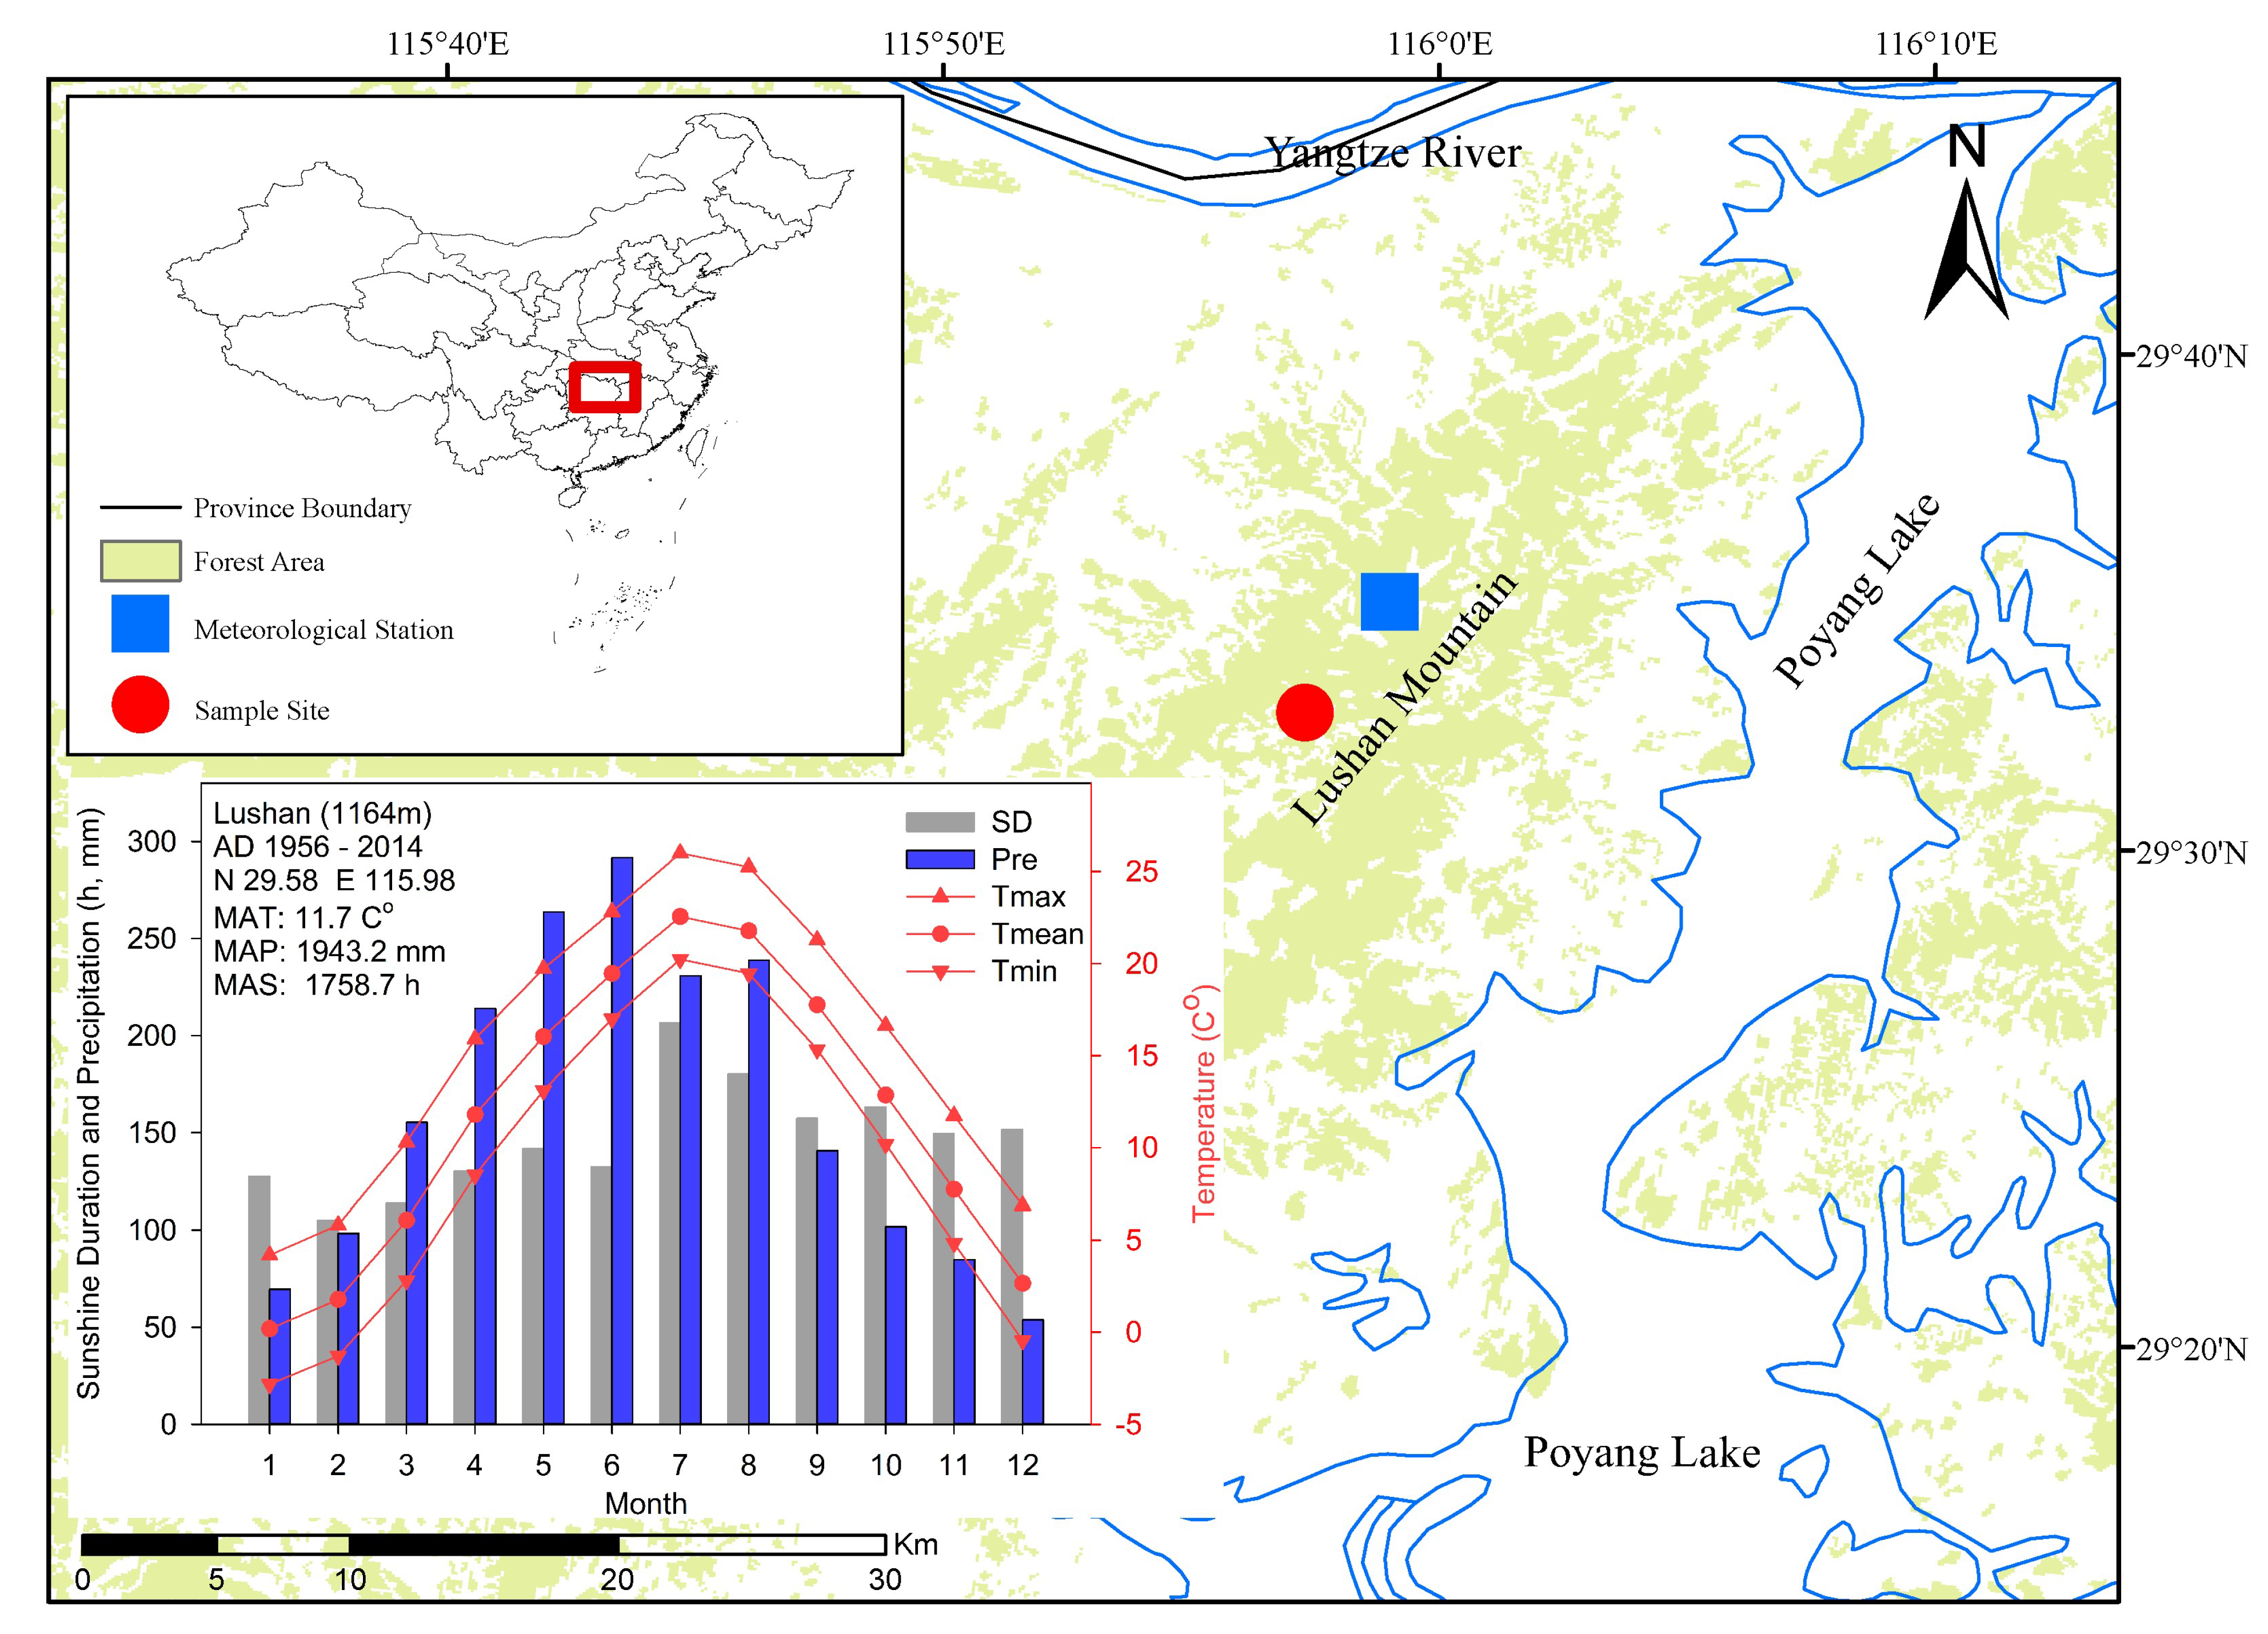
2.1. Study Area

The study area is located in the Lushan National Nature Reserve, Jiangxi Province, China. The area is influenced by the subtropical monsoon climate and has vertical zonal vegetation types. The low altitude comprises evergreen coniferous forest. The dominant tree species are Lithocarpus glaber (Thunb.) Nakai, Castanopsis sclerophylla (Lindl.) Schott, and Cinnamomum camphora (Linn.) Presl. High altitude contains deciduous broadleaved forest, with the dominant species being Castanea henryi (Skam) Rehd. et Wils., and a scattered distribution of coniferous forests, mainly P. massoniana, Cunninghamia lanceolata (Lamb.) Hook., and P. taiwanensis.

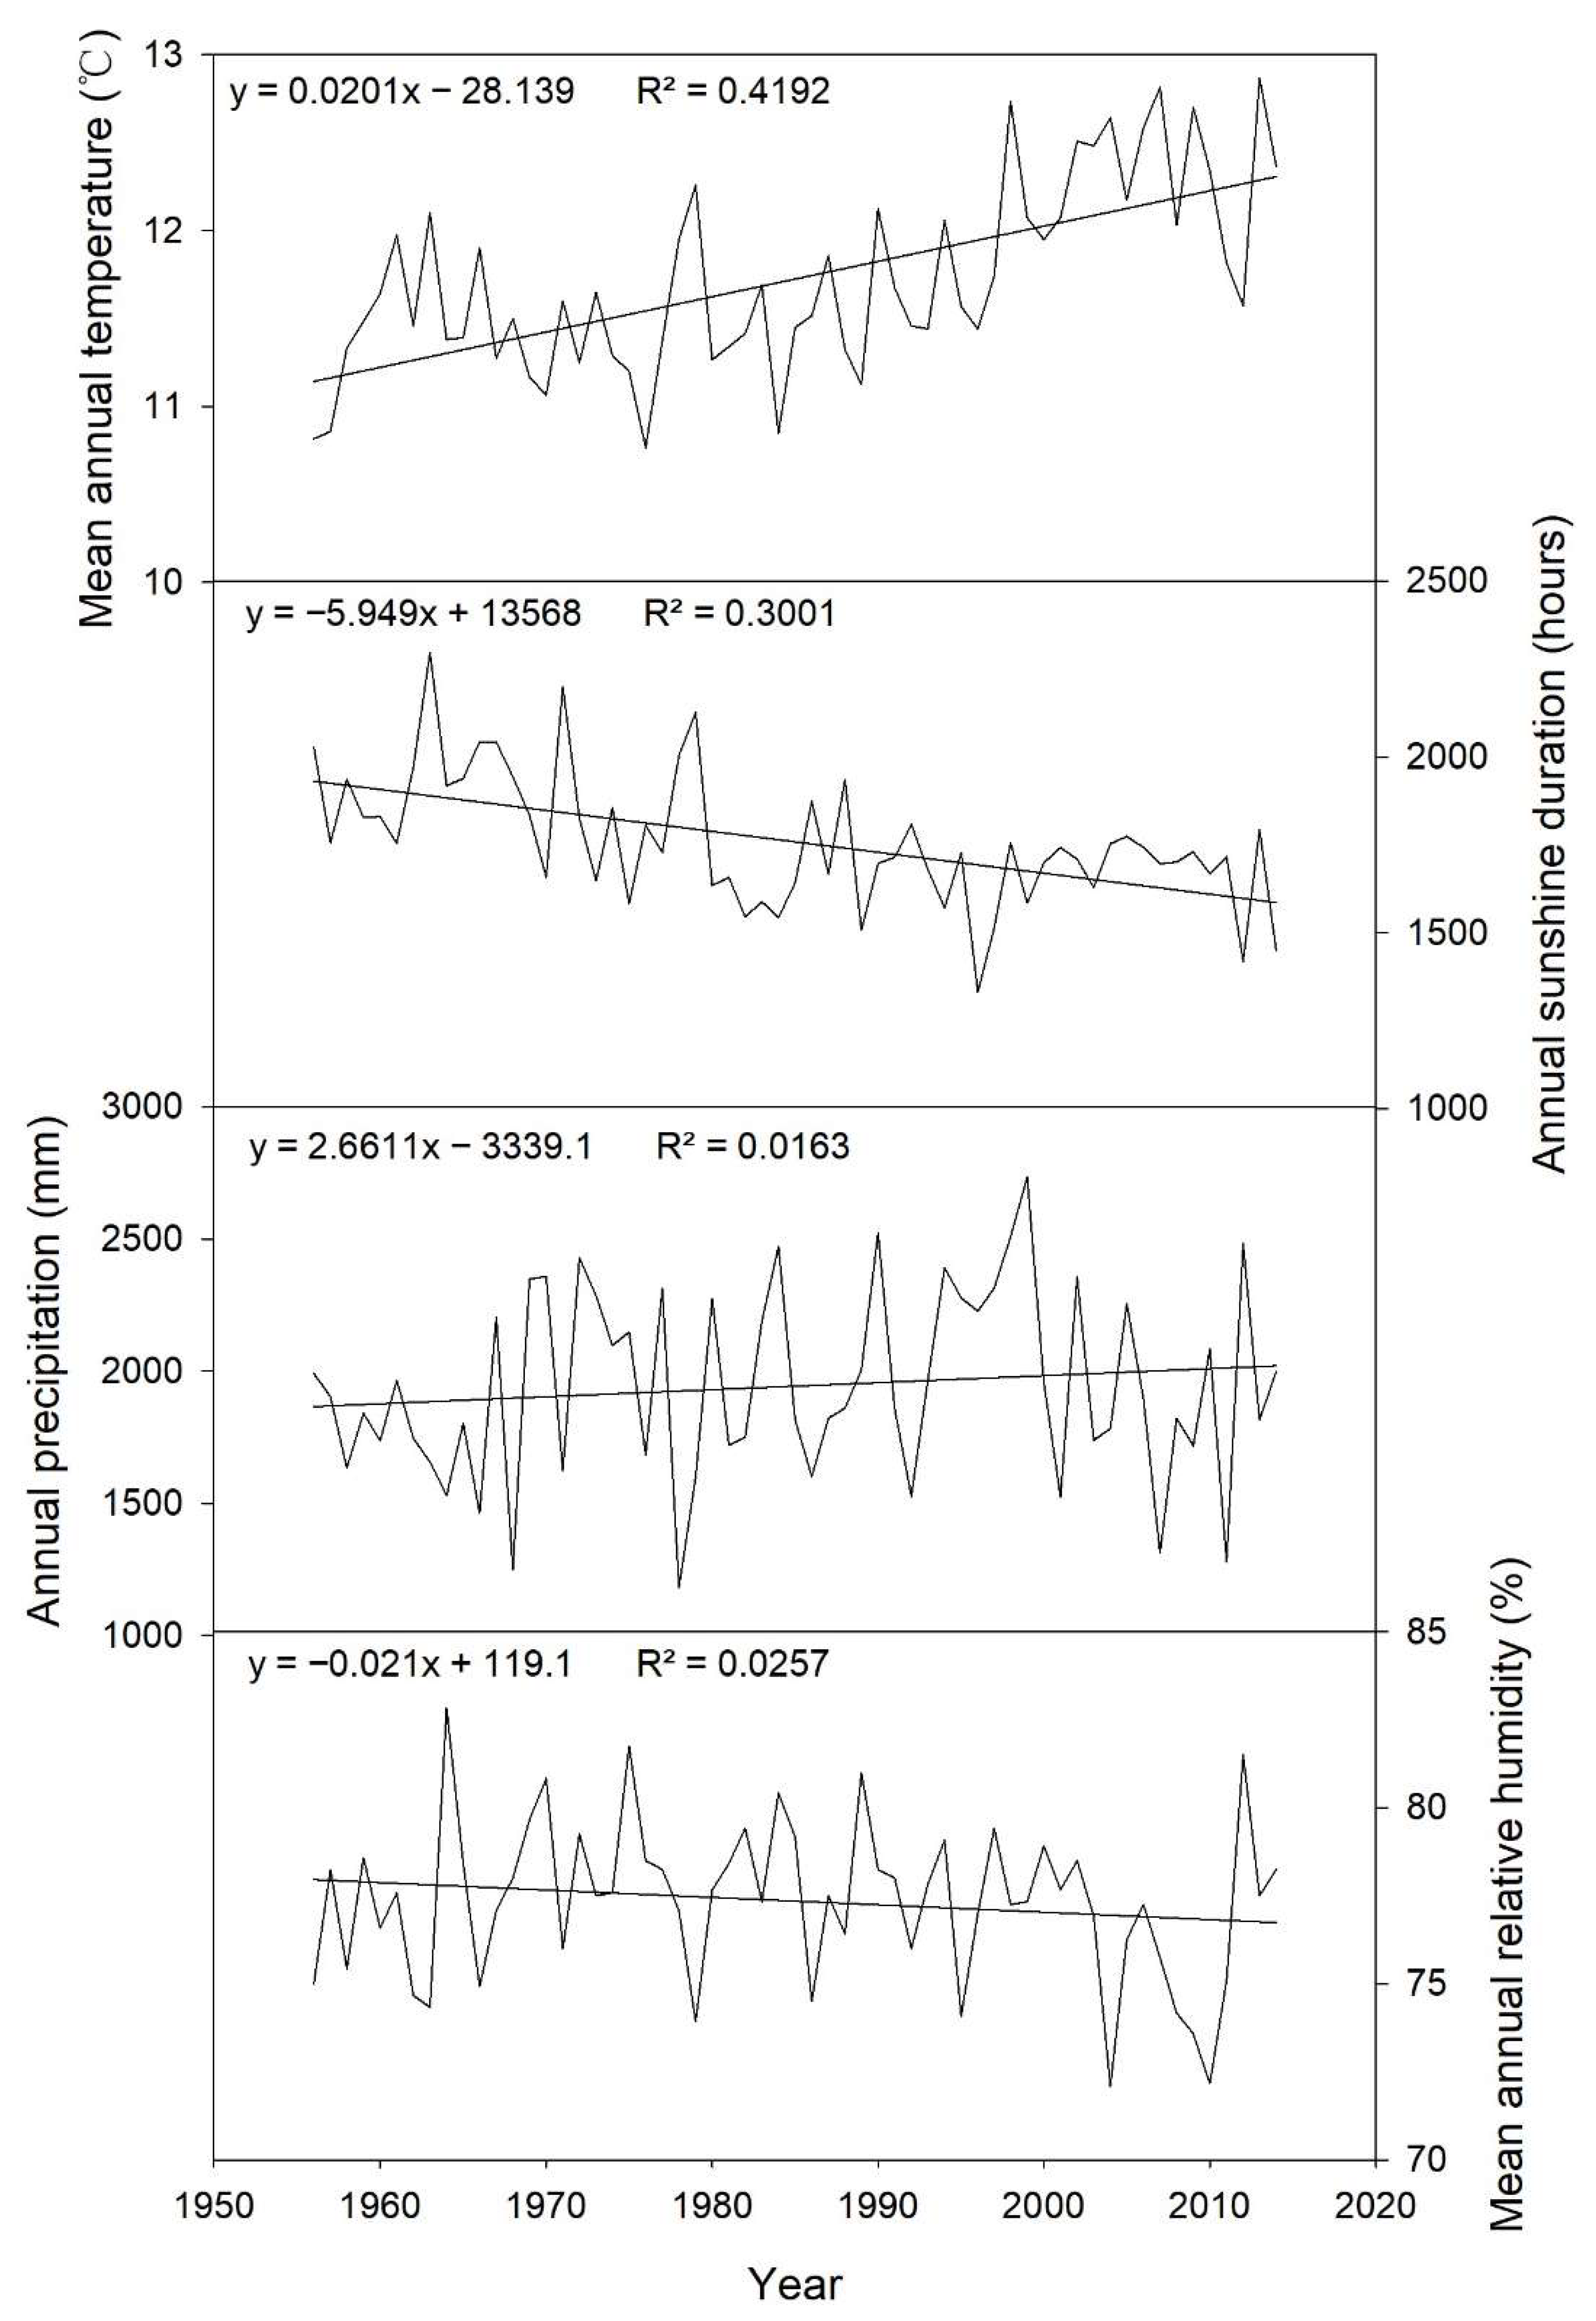
2.2. Meteorological Data

The meteorological data were downloaded from the National Meteorological Information Center of the China Meteorological Administration (http://data.cma.cn/, accessed on 9 July 2018). The nearest meteorological station to the sampling site was Lushan Meteorological Station, which was 5 km from the sampling site, and the altitude difference was within 100 m. The climatic data that were downloaded included six factors: monthly maximum temperature (Tmax), monthly minimum temperature (Tmin), monthly mean temperature (Tmean), monthly precipitation (Pre), monthly sunshine duration (SunD), and monthly relative humidity (RH). According to the Lushan station records (1955–2014), the annual mean temperature, annual cumulated rainfall, and annual cumulated sunshine duration recorded were 11.7 °C, 1943.2 mm, and 1758.7 h, respectively (Figure 1). Precipitation was concentrated in the summer. The trends of mean annual temperature (MAT), annual precipitation (MAP), annual sunshine hours (MAS), and mean annual relative humidity (MARH) from 1955 to 2014 are shown in Figure 2. It can be seen that from 1955 to 2014, the MAT increased significantly, and the MAS decreased significantly, while precipitation and relative humidity did not change significantly. The trends of monthly sunshine duration, monthly temperature, monthly precipitation and monthly relative humidity from 1955–2014 are shown in Appendix A, Figure A1, Figure A2, Figure A3 and Figure A4.

2.3. Tree-Ring Data

P. taiwanensis, which is widely distributed in the subtropical center of China, was selected as the target tree species. It is endemic to China, living mainly in the subtropical region of China, and it is an important afforestation tree in the middle and lower reaches of the Yangtze River. Previous studies have also shown that the tree rings of this species are clear and accurately cross-dated and thus, they can be used in traditional dendroclimatology studies [24,30]. The fieldwork was carried out in 2015. The coordinates of the sampling sites were 29.55° N, 115.96° E, and 1055 m above sea level, and the slope was southward and less than 15° (Figure 1). According to the records of the Lushan Mountain Management Committee, the P. taiwanensis forest was planted artificially in the 1930s and then left in the natural state, without artificial care and destruction. Thus, it can be regarded as almost a natural forest without having experienced any human interference. Tree-ring increment cores (1–2 cores per tree) were drilled using an increment borer with an inner diameter of 5.12 cm at the height of 1.3 m of each tree trunk. Each sample core was as close to the pith of the tree as possible. In all, 36 cores were collected from 22 trees. The samples were brought back to the laboratory and carefully polished with 80–600 mesh sandpaper until the xylem cells were clearly visible. Then, the tree-ring widths of each core were measured using Lintab 6 with TSAP software (Version 4.81c, Frank Rinnthch, Germany). Finally, COFECHA was used to verify the cross-dating results to ensure that all data were accurate [31]. A cubic smoothing spline with a 50% frequency response cutoff that is equal to 32 years was used to remove the tree’s own growth trend. Then, a bi-weight robust mean method was employed to build the final standard tree-ring width chronology (TRW). Common period analysis was conducted for the period of 1950–2014, and three statistical indices of correlation coefficients among all the series (rbar), expressed population signal (EPS), and signal–noise ratio (SNR) were calculated to quantify the quality of the chronology. All methods mentioned above were carried out using the “dplR” package of R software [32].

2.4. Statistical Analysis

The stability of the growth–climate relationship was verified by conducting a moving correlation analysis between TRW and climate factors during 1956–2014, with a 25-year window from October of the previous year to December of the current year. Bootstrap (1000 times) was used to ensure the production of stable results. A heat map was employed to show the final results. This analysis was carried out using the “treeclim” package of R software [33].
The results showed that the growth–climate relationship changed significantly during 1980–1990. Therefore, to further determine the specific transition year, we used climate data of different intervals to linearly fit the tree-ring width to identify the linear model with the best effect and to determine the exact year in which the response difference appeared. The period 1980–1990 was considered the boundary. Precipitation in September was considered the independent variable to fit TRW in the first half, while the mean sunshine duration from March to April was used to fit TRW in the second half. A linear regression was carried out with the “stats” package of R software [34].
To further confirm the growth–climate relationship inconsistency, correlation coefficients between TRW and climate factors during 1955–1985, 1986–2014, and 1955–2014 were calculated, respectively.

3. Results

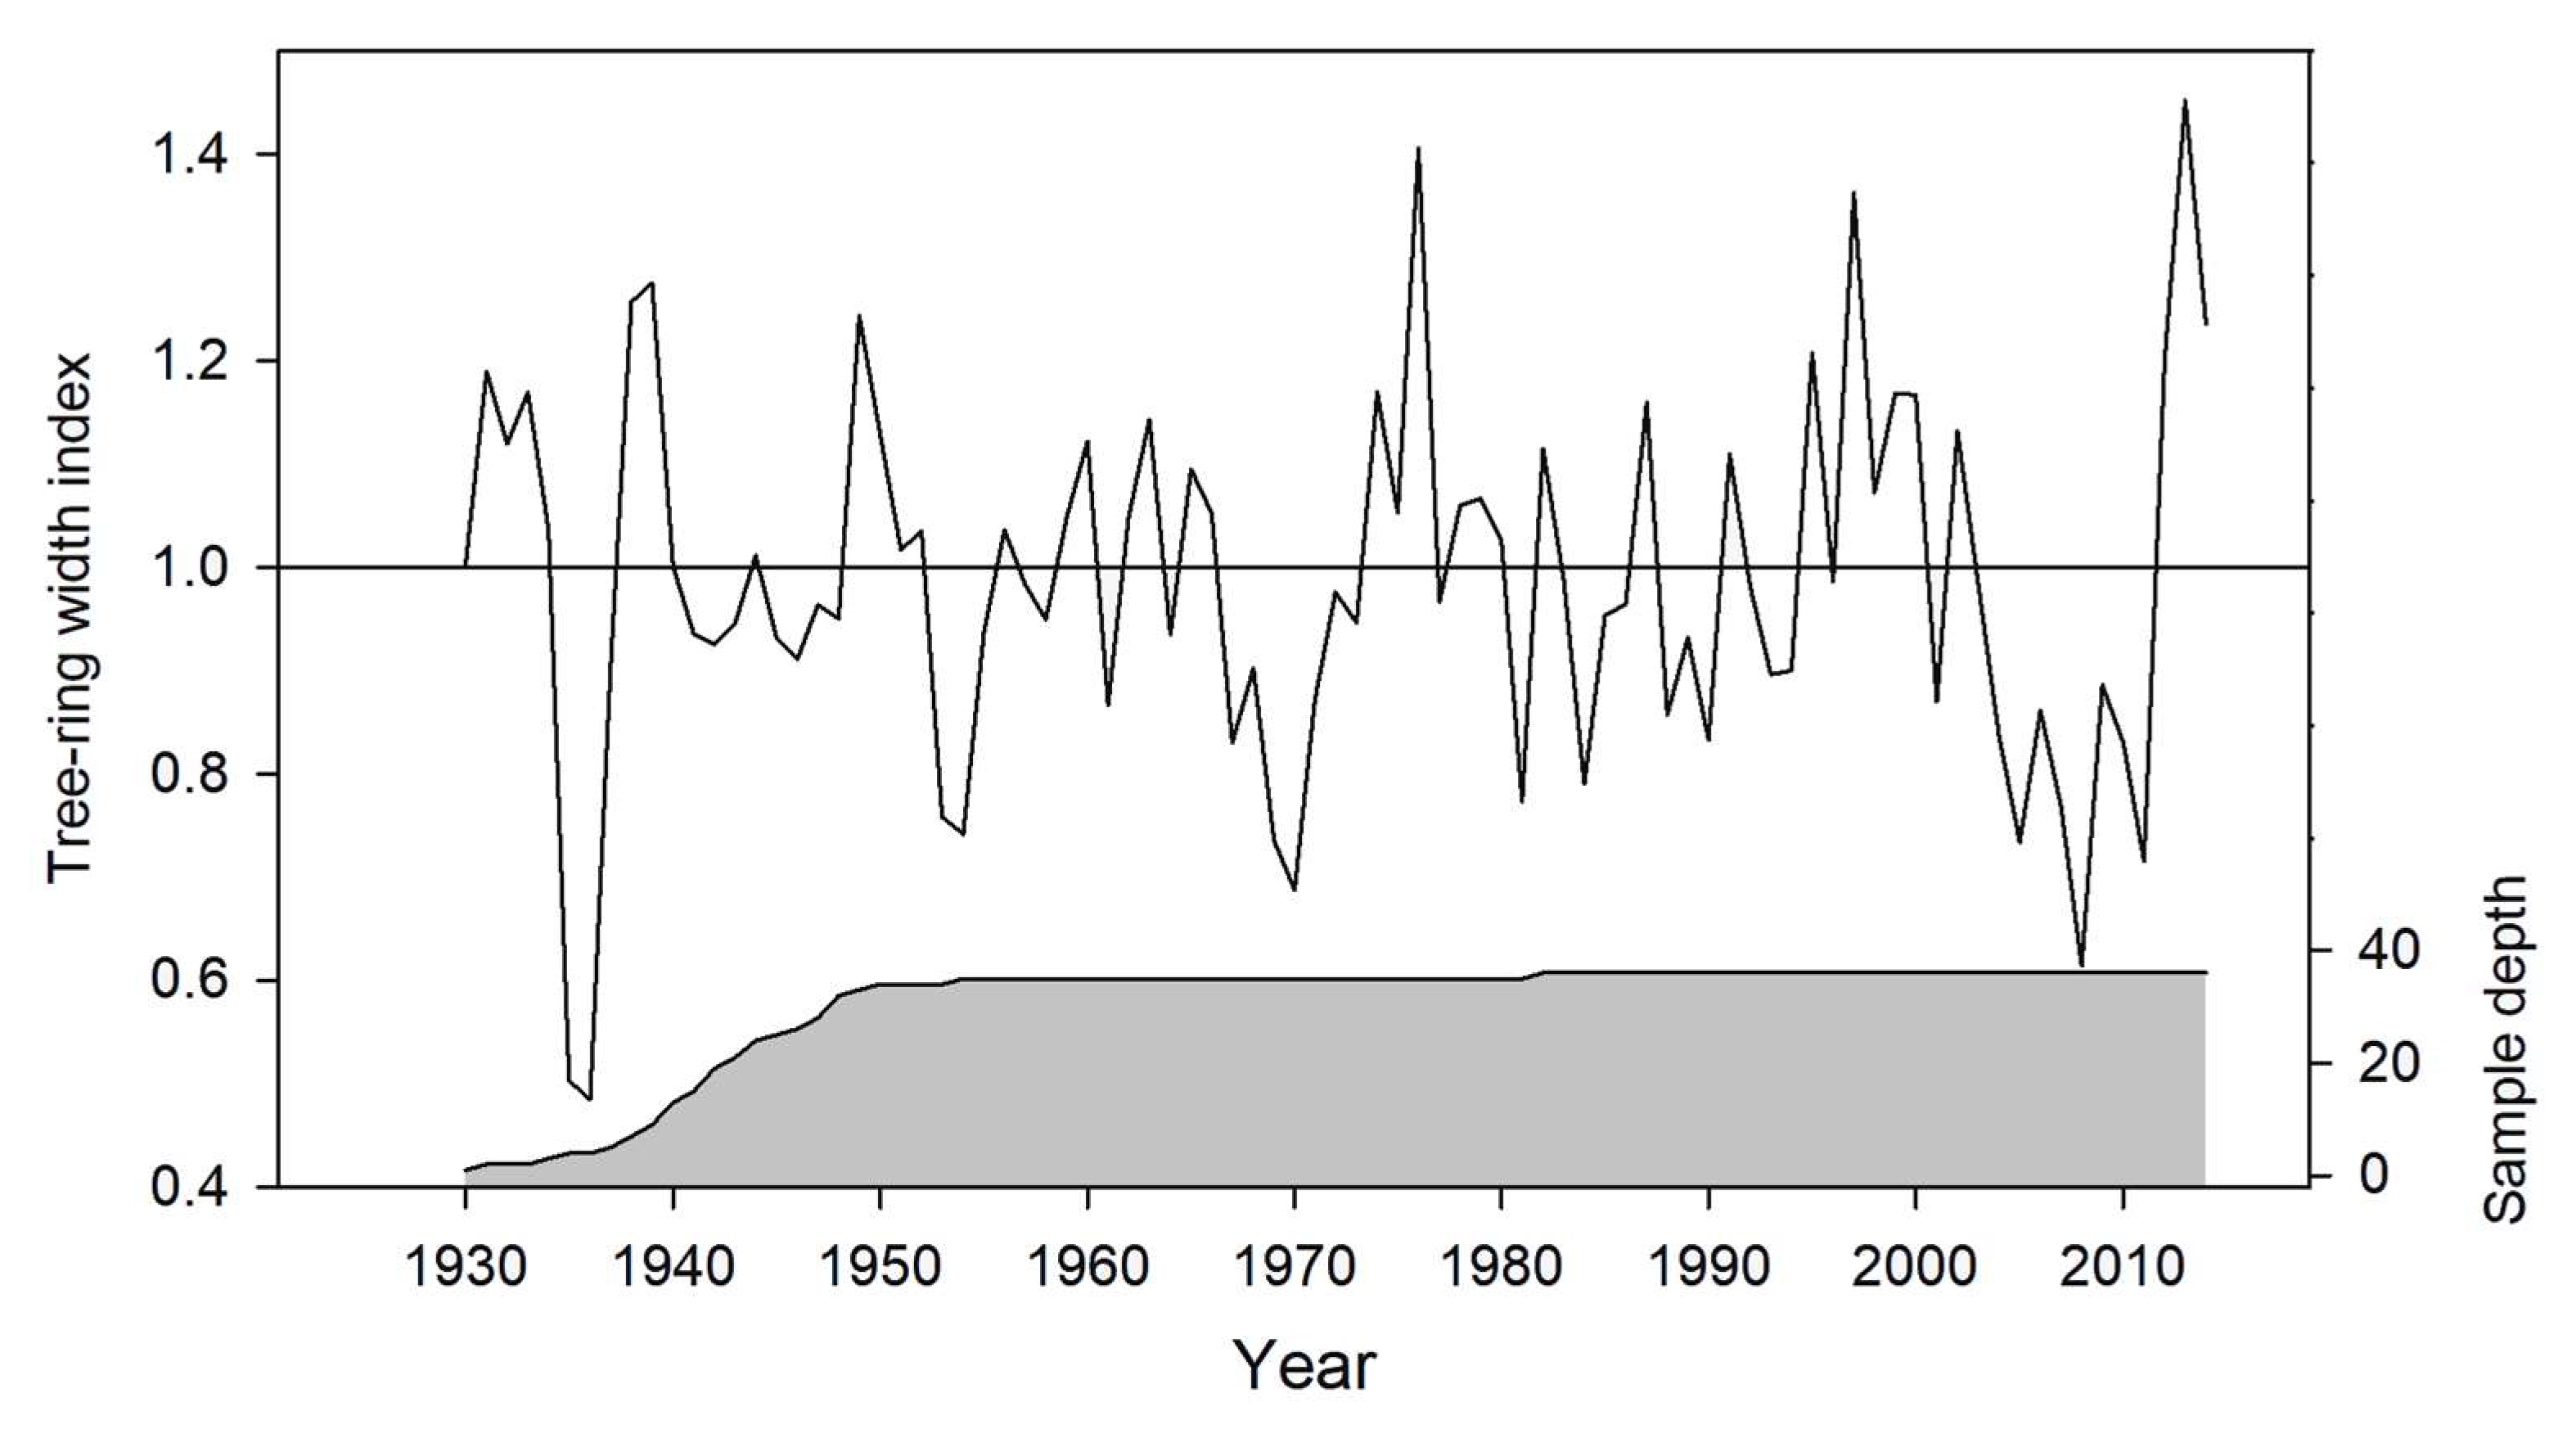
3.1. Statistics of Chronology

The chronology covers a period of 86 years, from 1930 to 2015 (Figure 3, Appendix A, Table A1). The results of the common interval analysis showed that rbar, EPS, and SNR had values of 0.361, 0.941, and 15.99, respectively. Since 1939, the SSS value of chronology has been greater than 0.85, which indicates that the chronology during 1939–2014 is reliable [35,36]. Therefore, the results of subsequent analysis during 1956–2014 in this study are reliable.

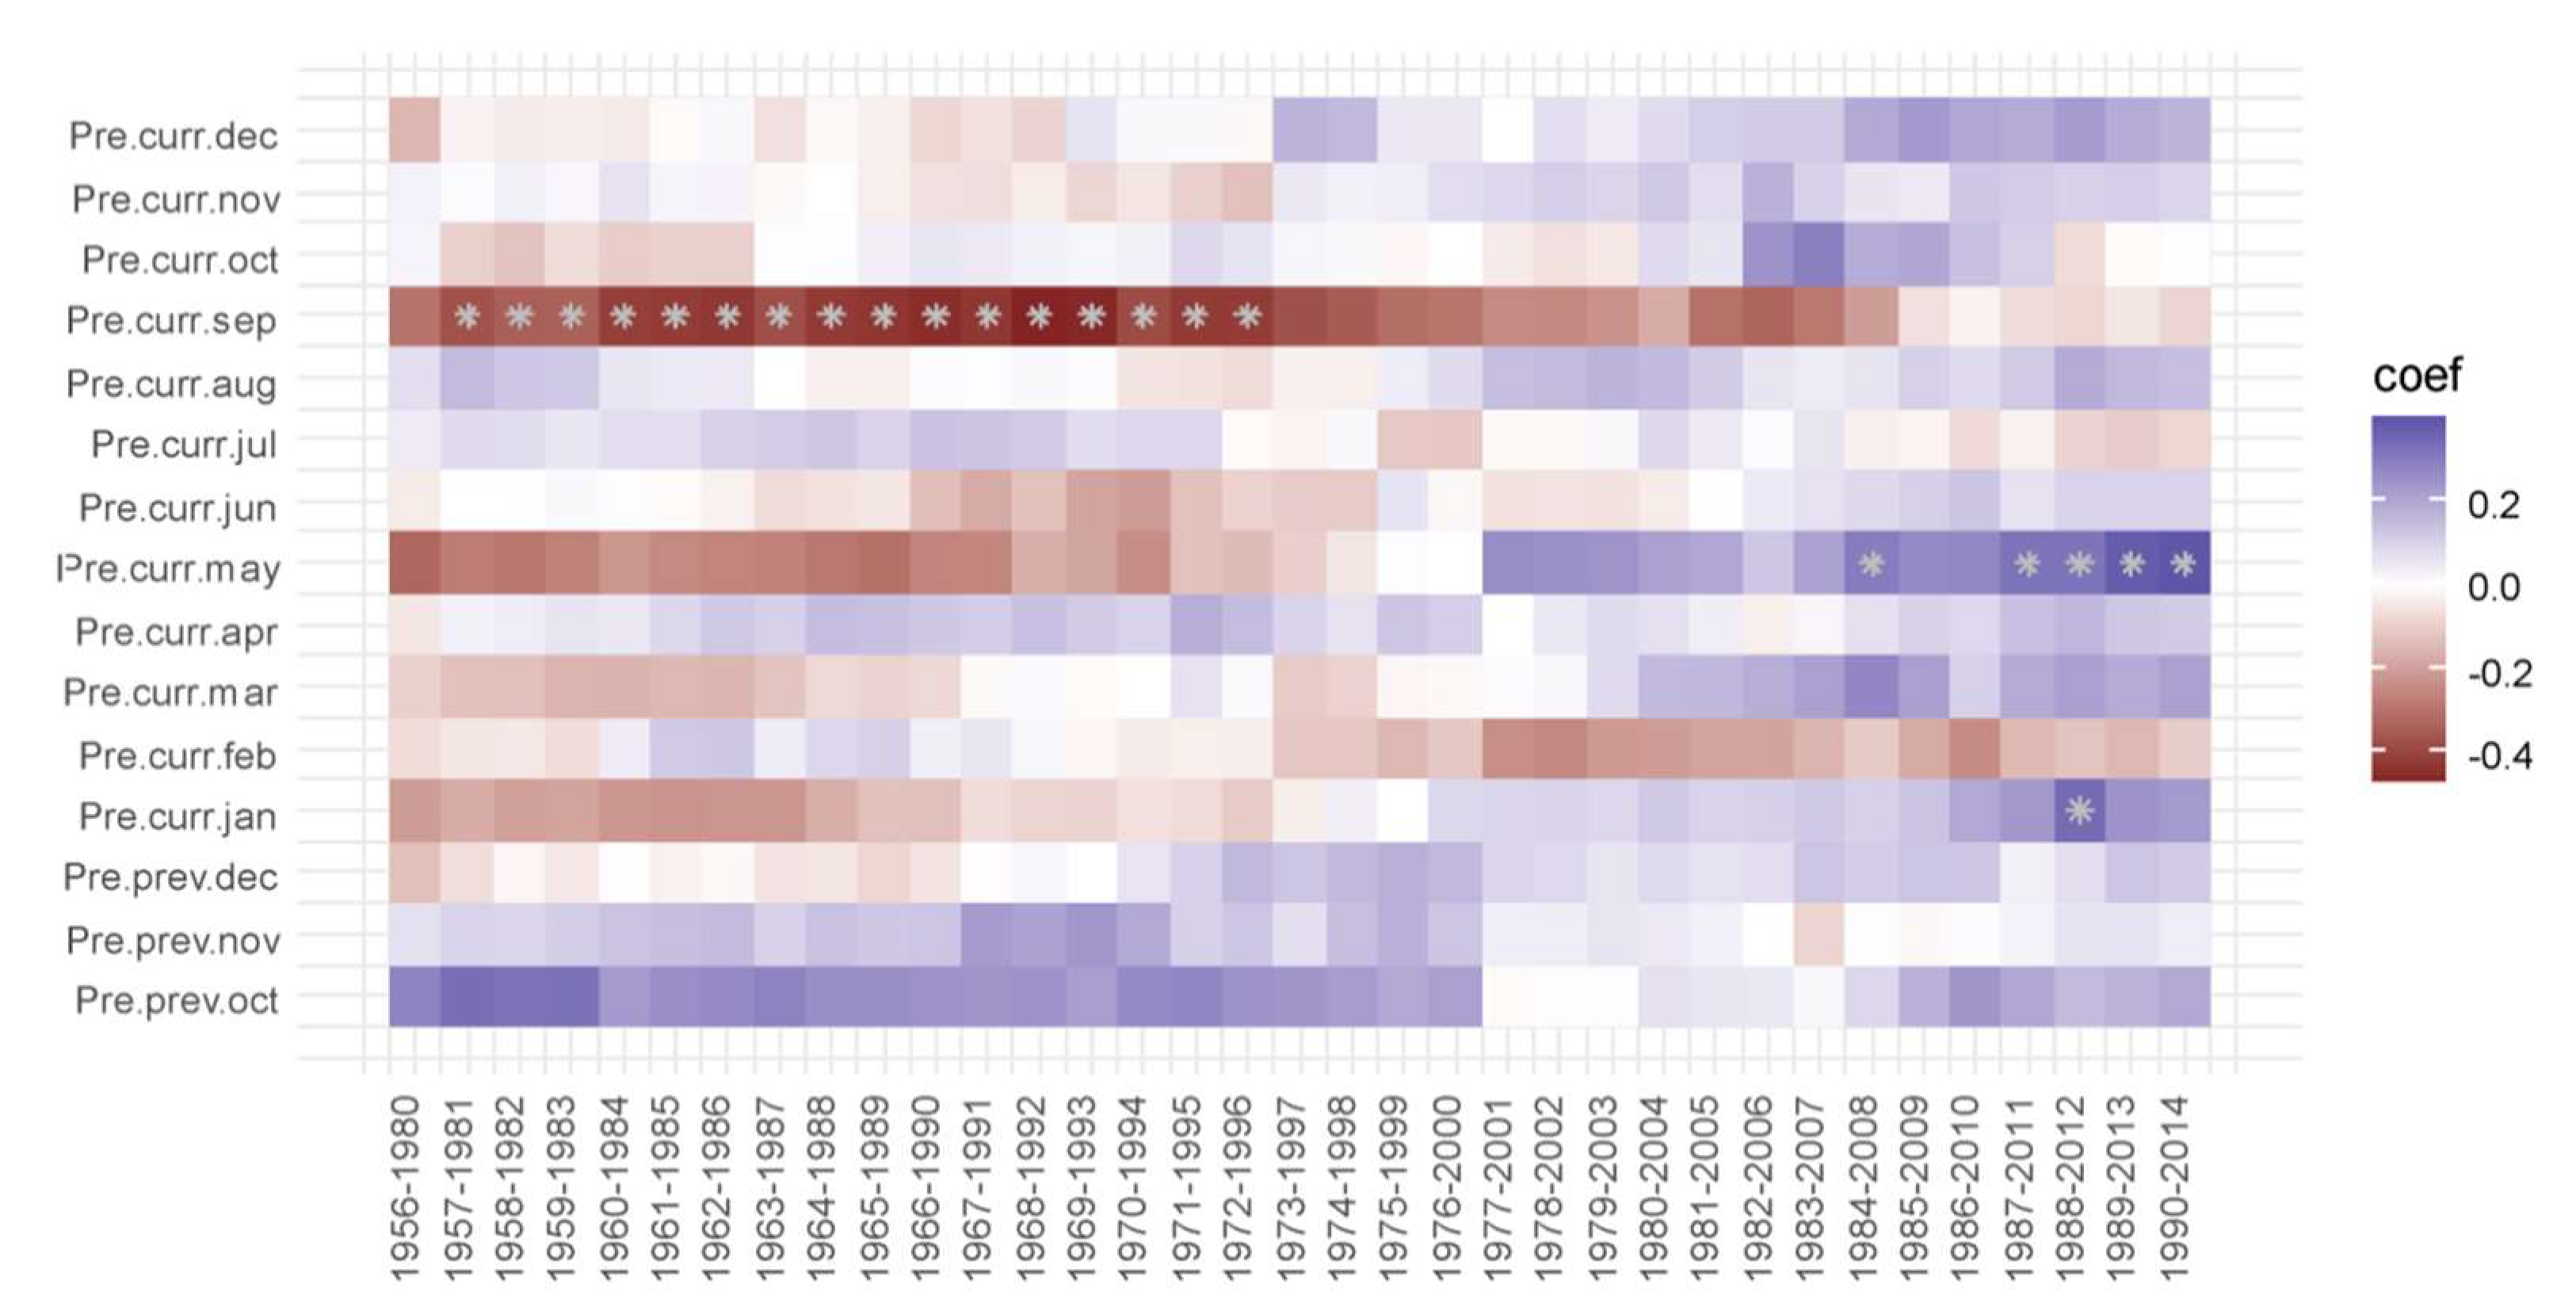
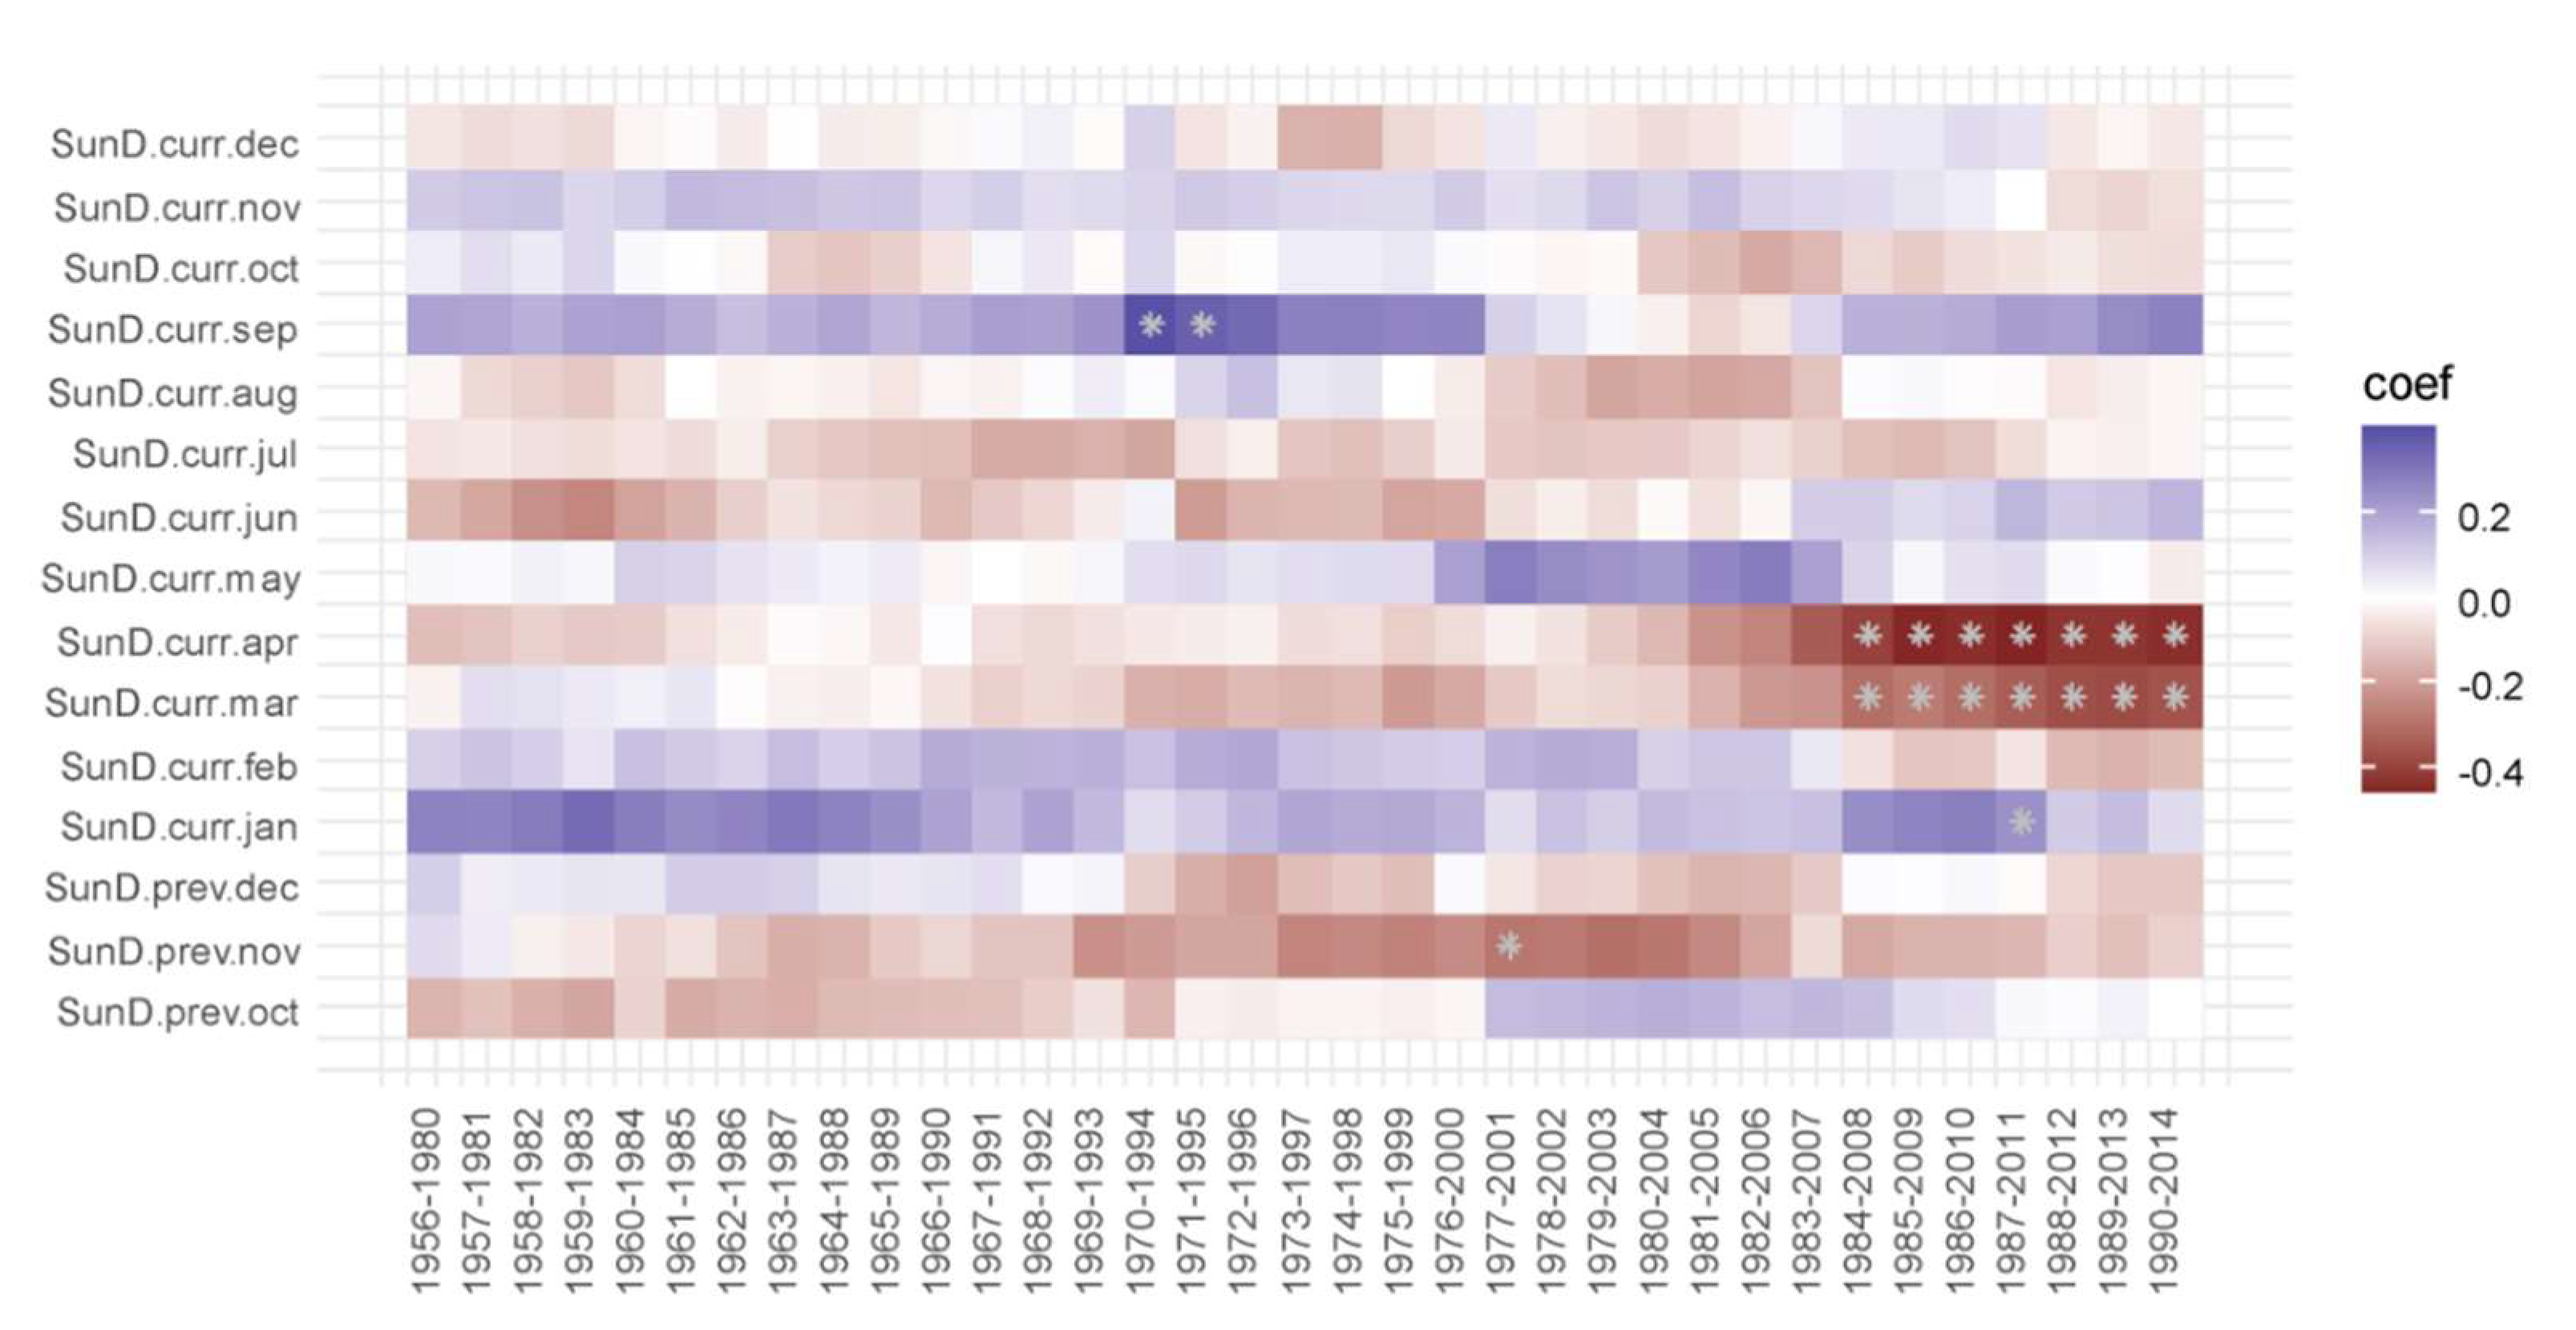
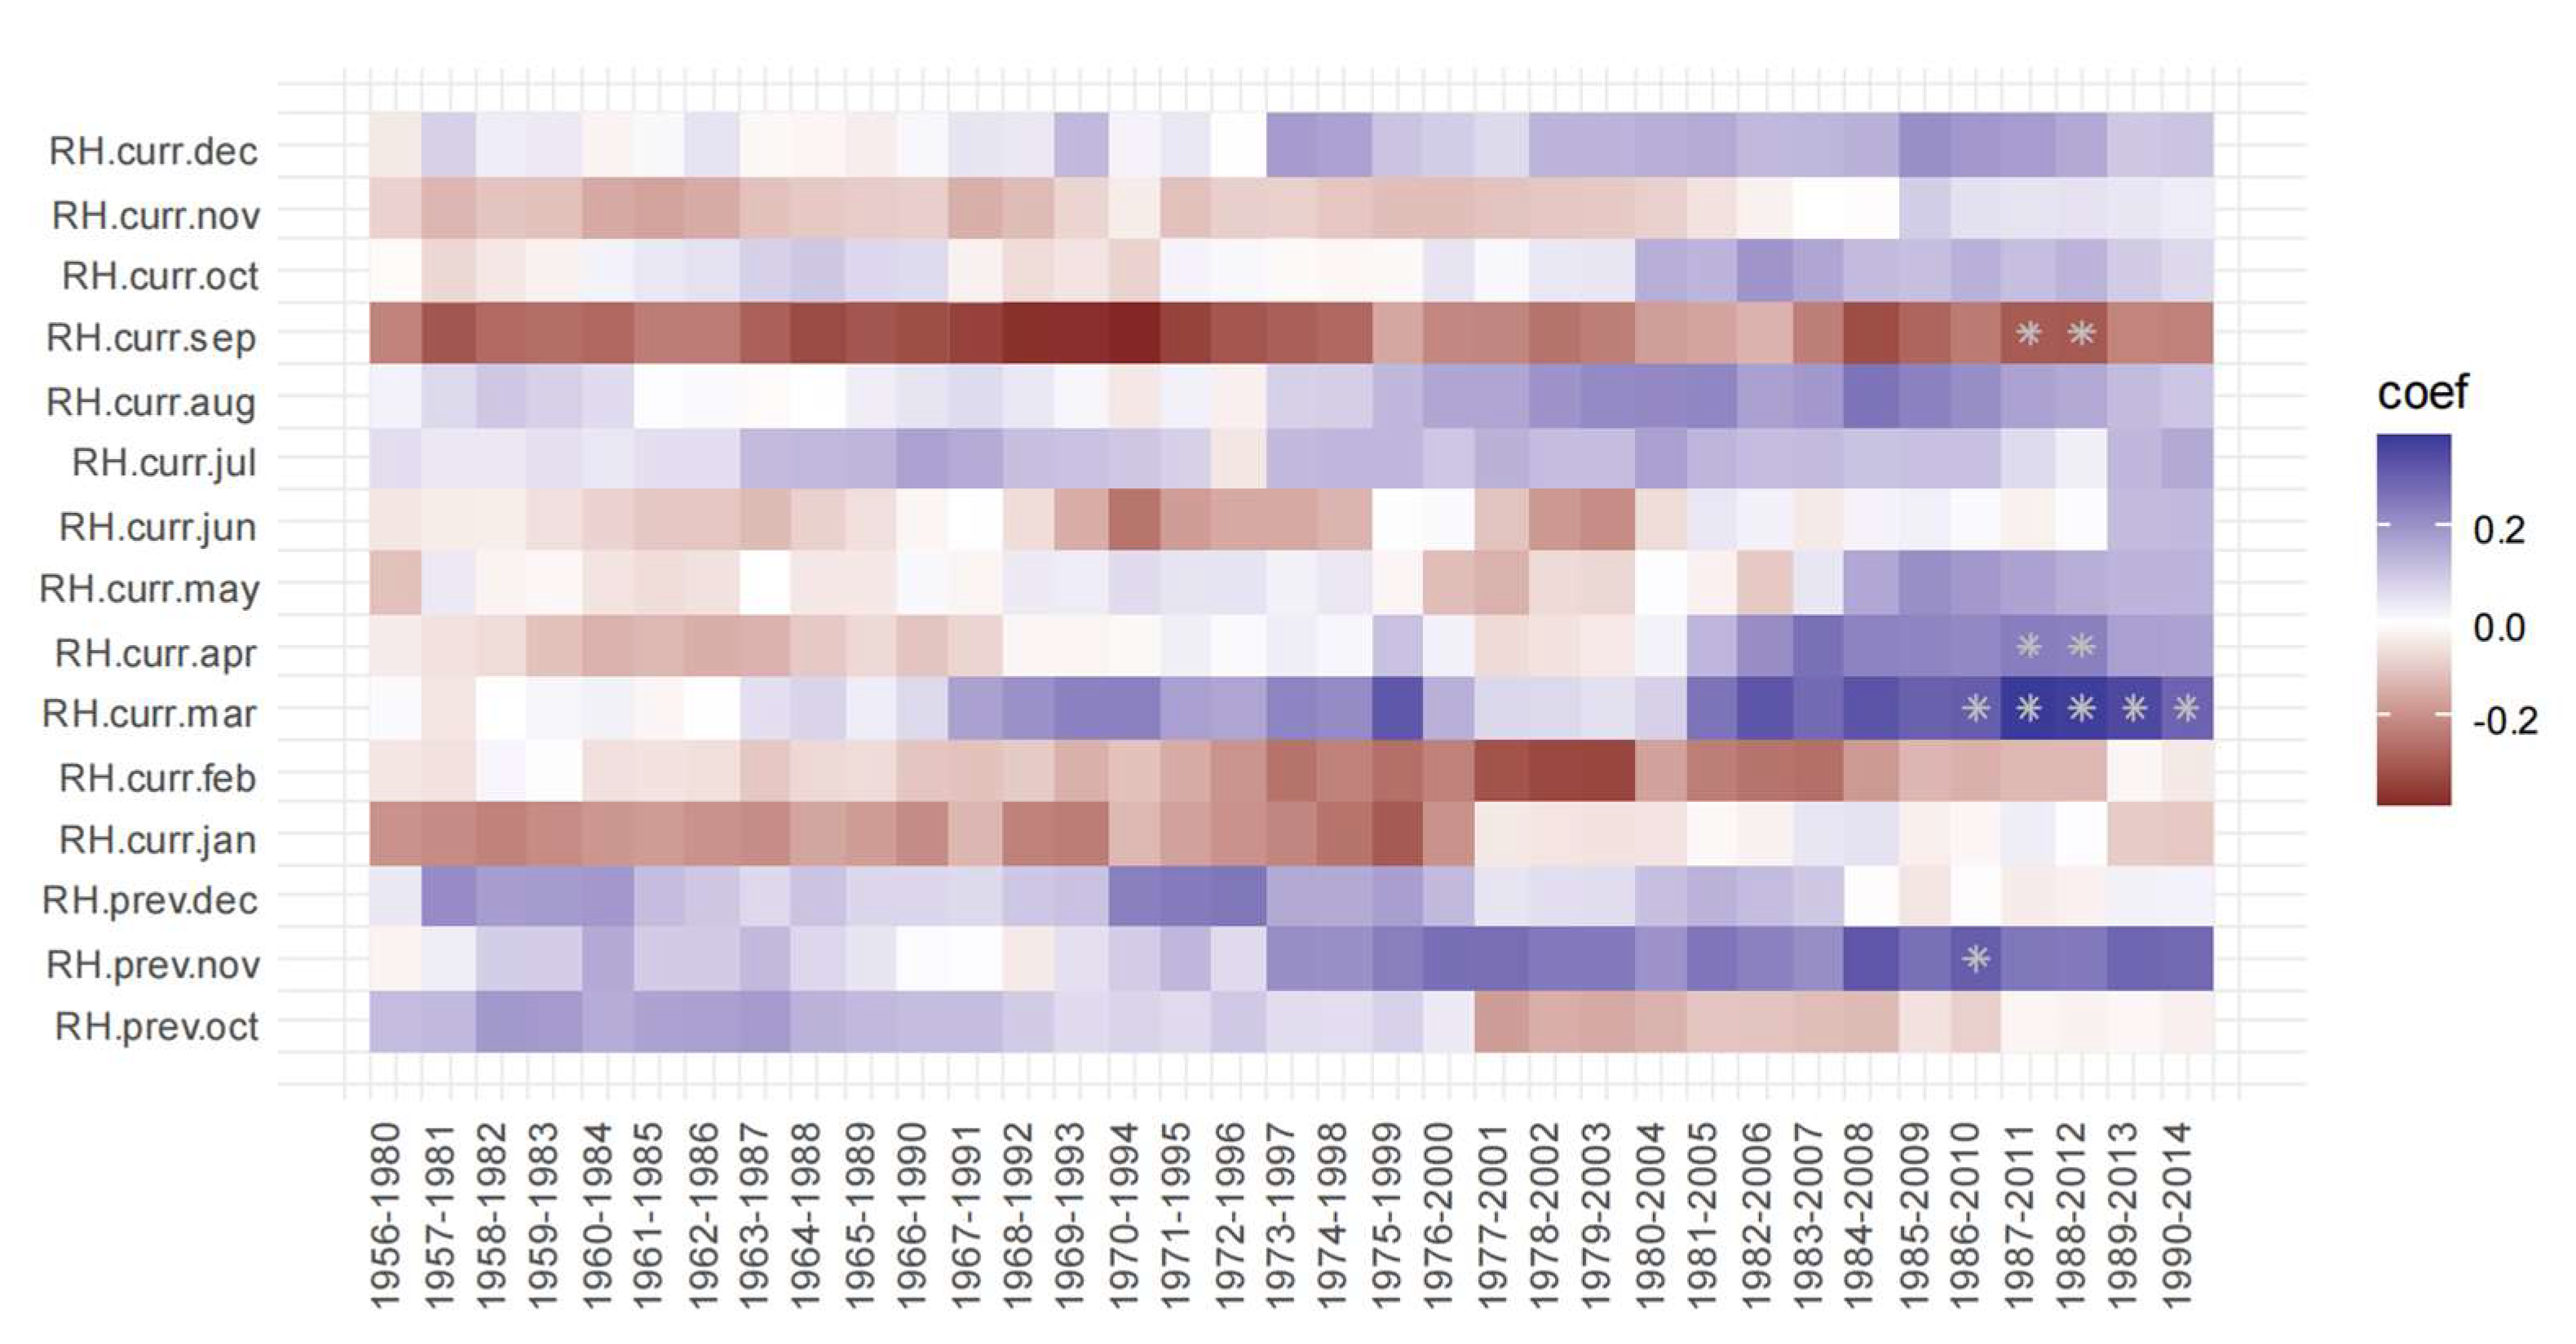
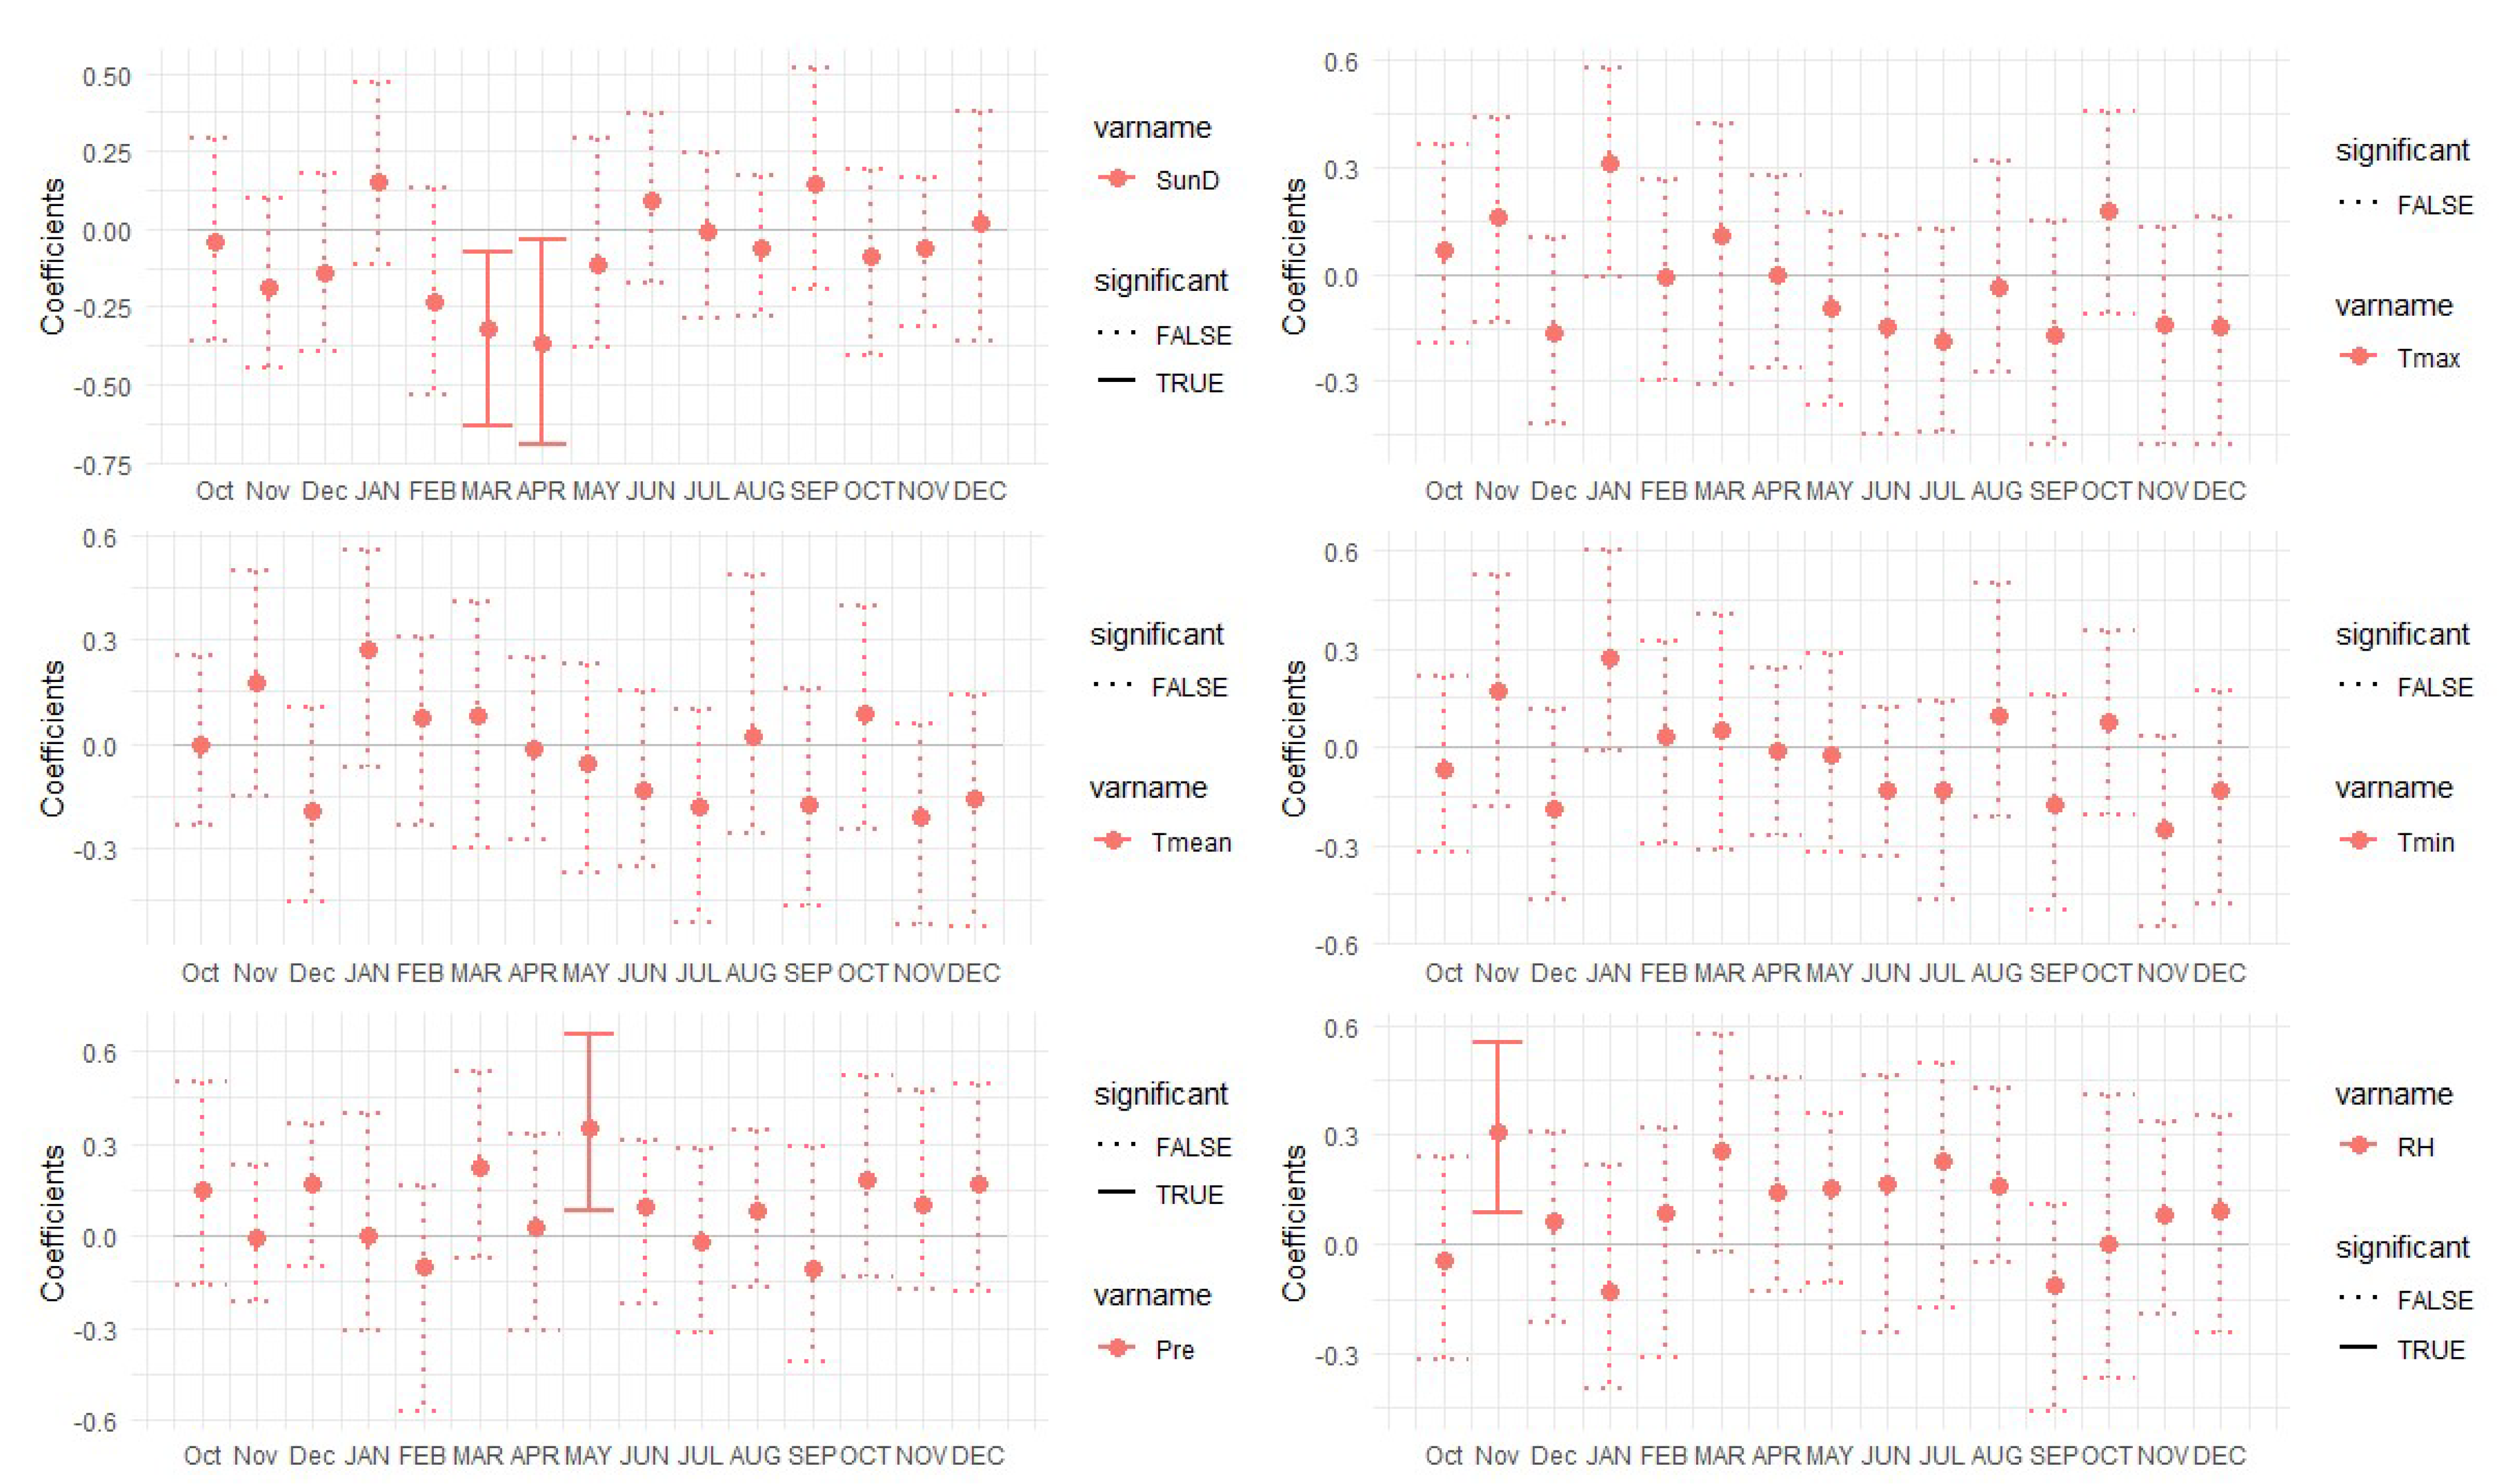
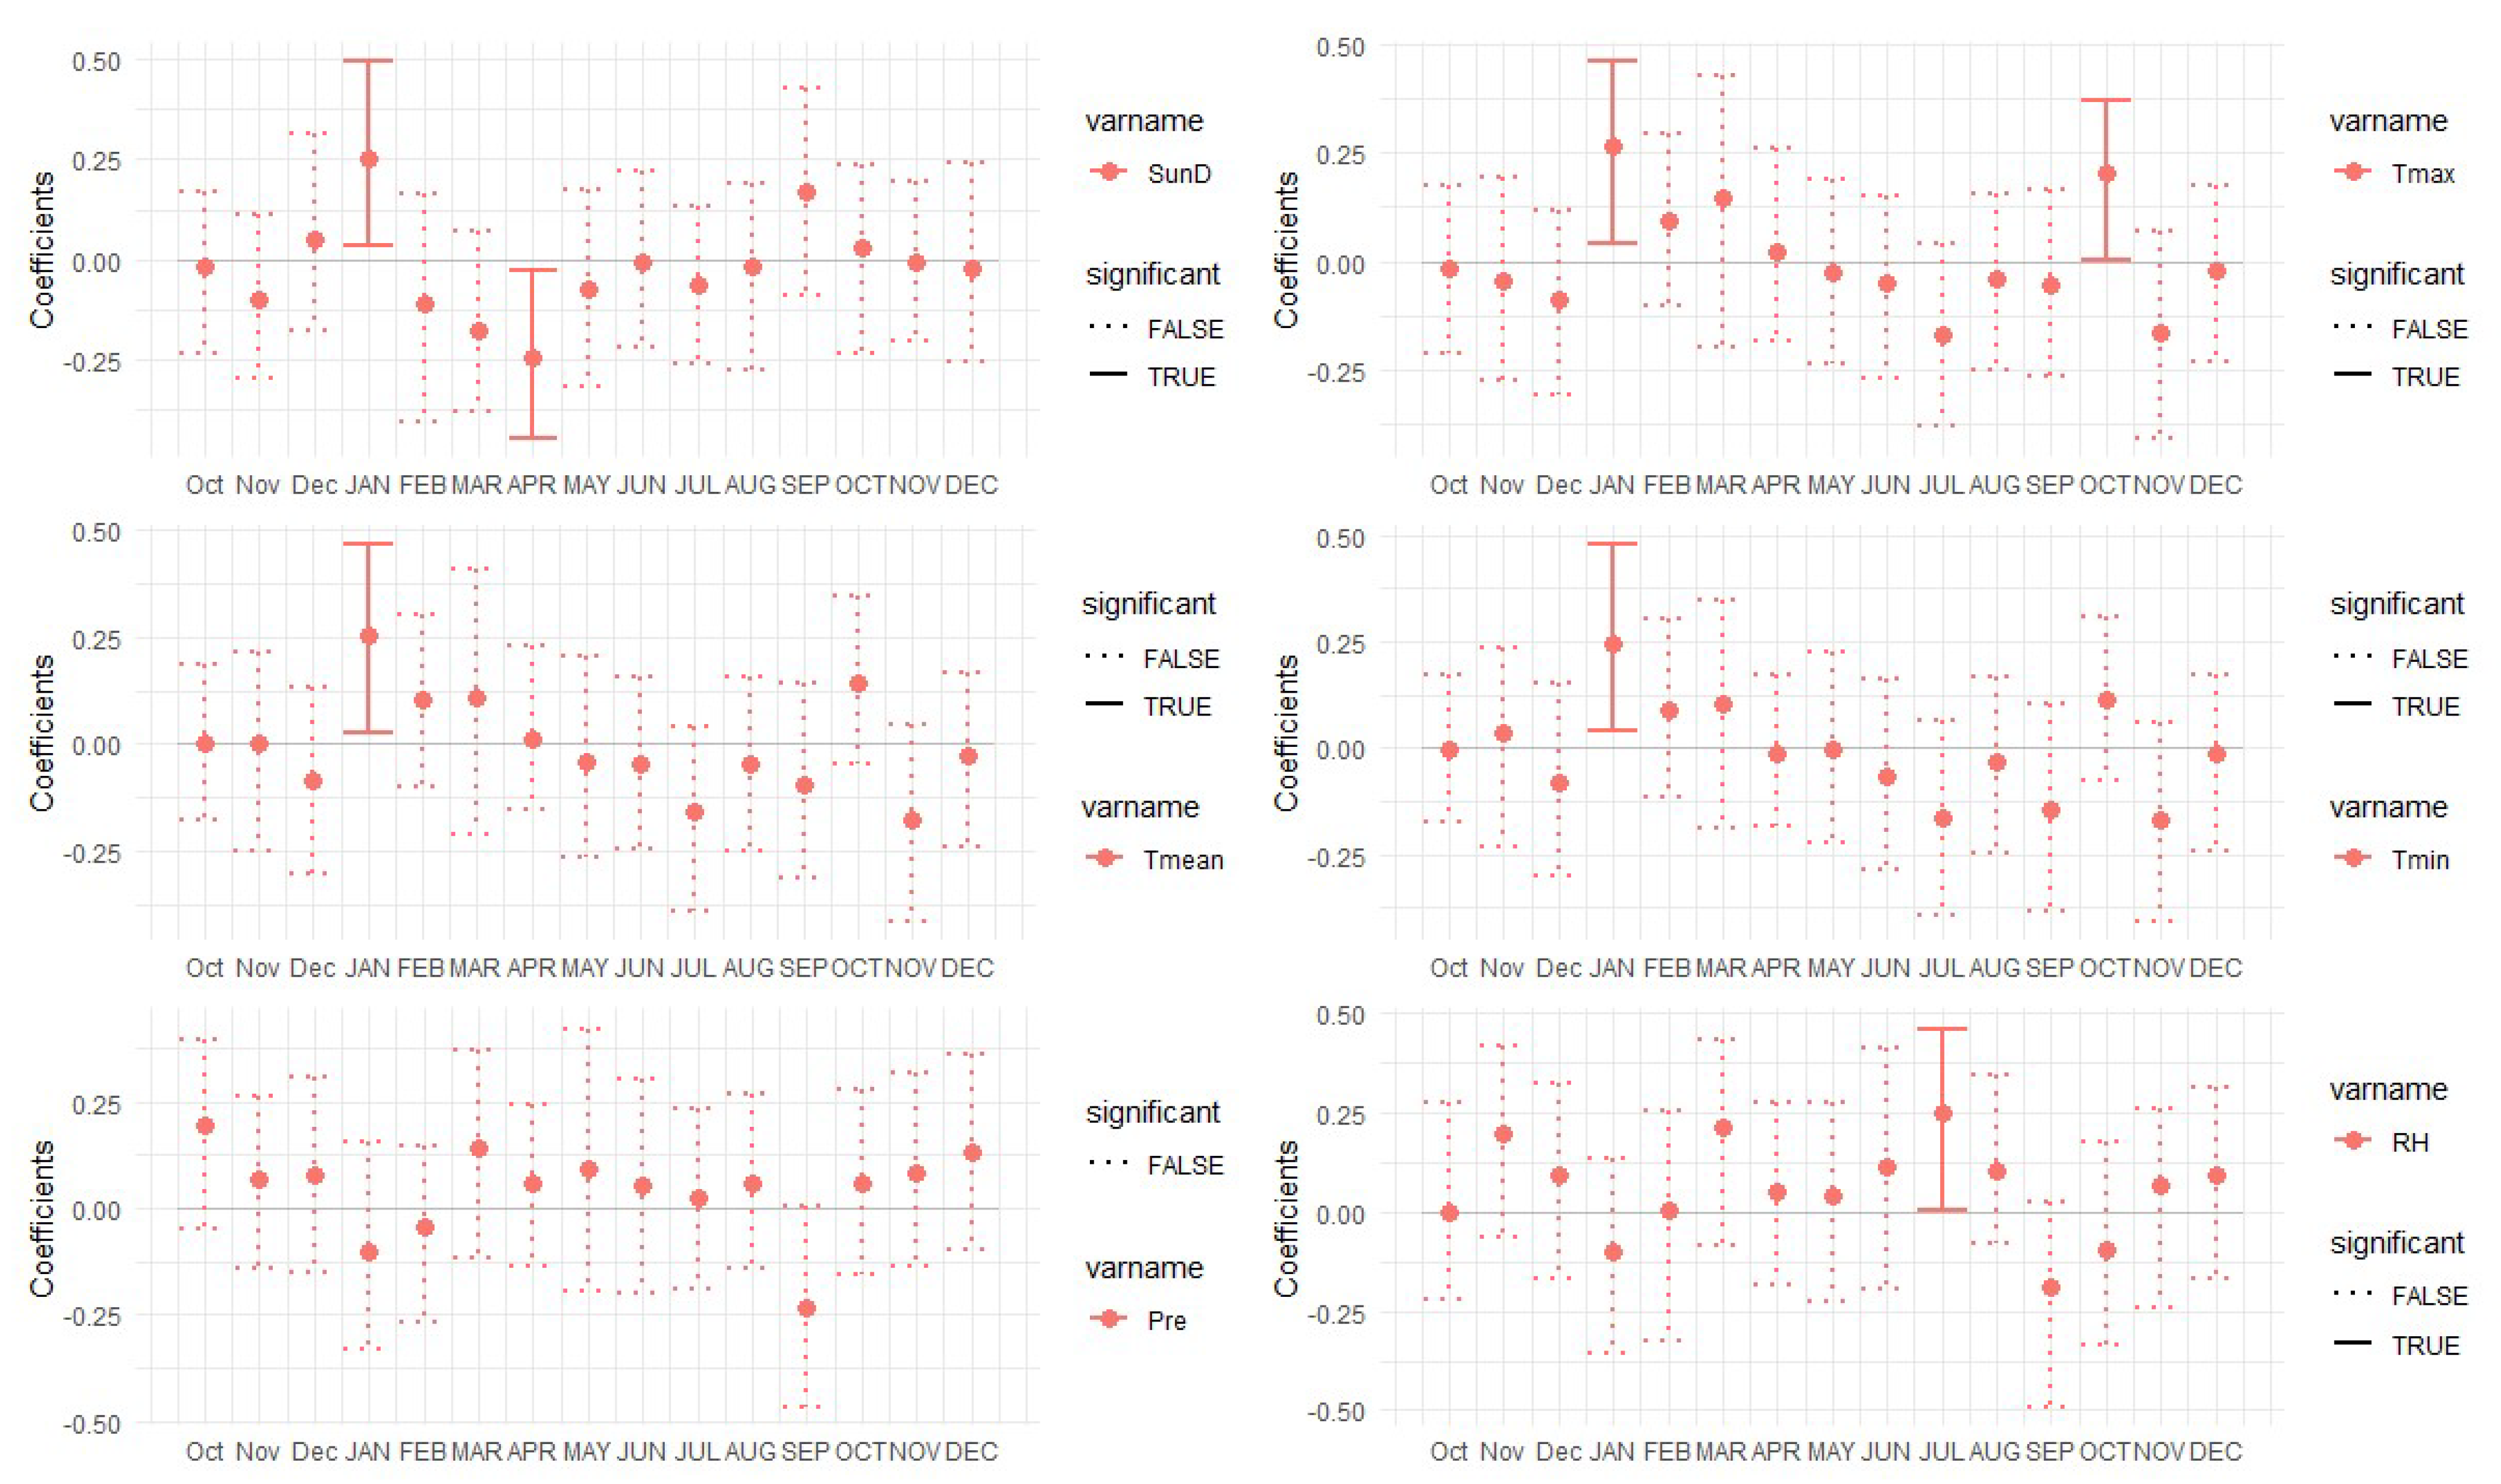
3.2. Correlation Analysis Results

The results of the moving correlation analysis between the tree-ring and climate factors showed that the relationship between TRW and climate changed significantly during 1980–1990. The relationships between TRW and precipitation and sunshine duration were the most significant (Figure 4 and Figure 5). Meanwhile, the relationship between tree ring and relative humidity also changed significantly, but the correlation coefficients were lower than those for precipitation and sunshine duration were (Figure 6). However, the mean maximum temperature, mean temperature, and mean minimum temperature had no meaningful influence on tree growth (not shown).
From 1956 to the 1980s, the tree rings were negatively affected by precipitation in the September of the current growing season. After that, the correlation between tree ring and precipitation in September disappeared, and a significant negative correlation appeared between tree ring and sunshine duration from March to April in the growing season (Figure 4 and Figure 5). The results for relative humidity were similar to those for sunshine duration, with significantly positive effects on tree growth in March since the end of the 1980s (Figure 6). In addition, there has been a significant positive correlation between precipitation in May of the current growing season and tree rings since the end of the 1980s (Figure 4).
The growth–climate relationship from 1955 to 1985 showed that only the maximum temperature in the previous November had a significant limiting effect on tree growth (Appendix A, Figure A5). From 1986 to 2014, however, sunshine duration in March and April significantly inhibited tree growth, while precipitation in May and relative humidity in the previous November significantly promoted tree growth (Appendix A, Figure A6). Thus, the growth–climate relationships are completely different in the two time periods. While the growth–climate relationships during 1955–2014 were relatively complex and the tree rings exhibited a significant correlation with several climate factors, the coefficients were not high (Appendix A, Figure A7). The different relationships between TRW and climate factors that are shown in Appendix A, Figure A5, Figure A6 and Figure A7 confirm the inconsistent relationship between growth and climate over 1955–2014.

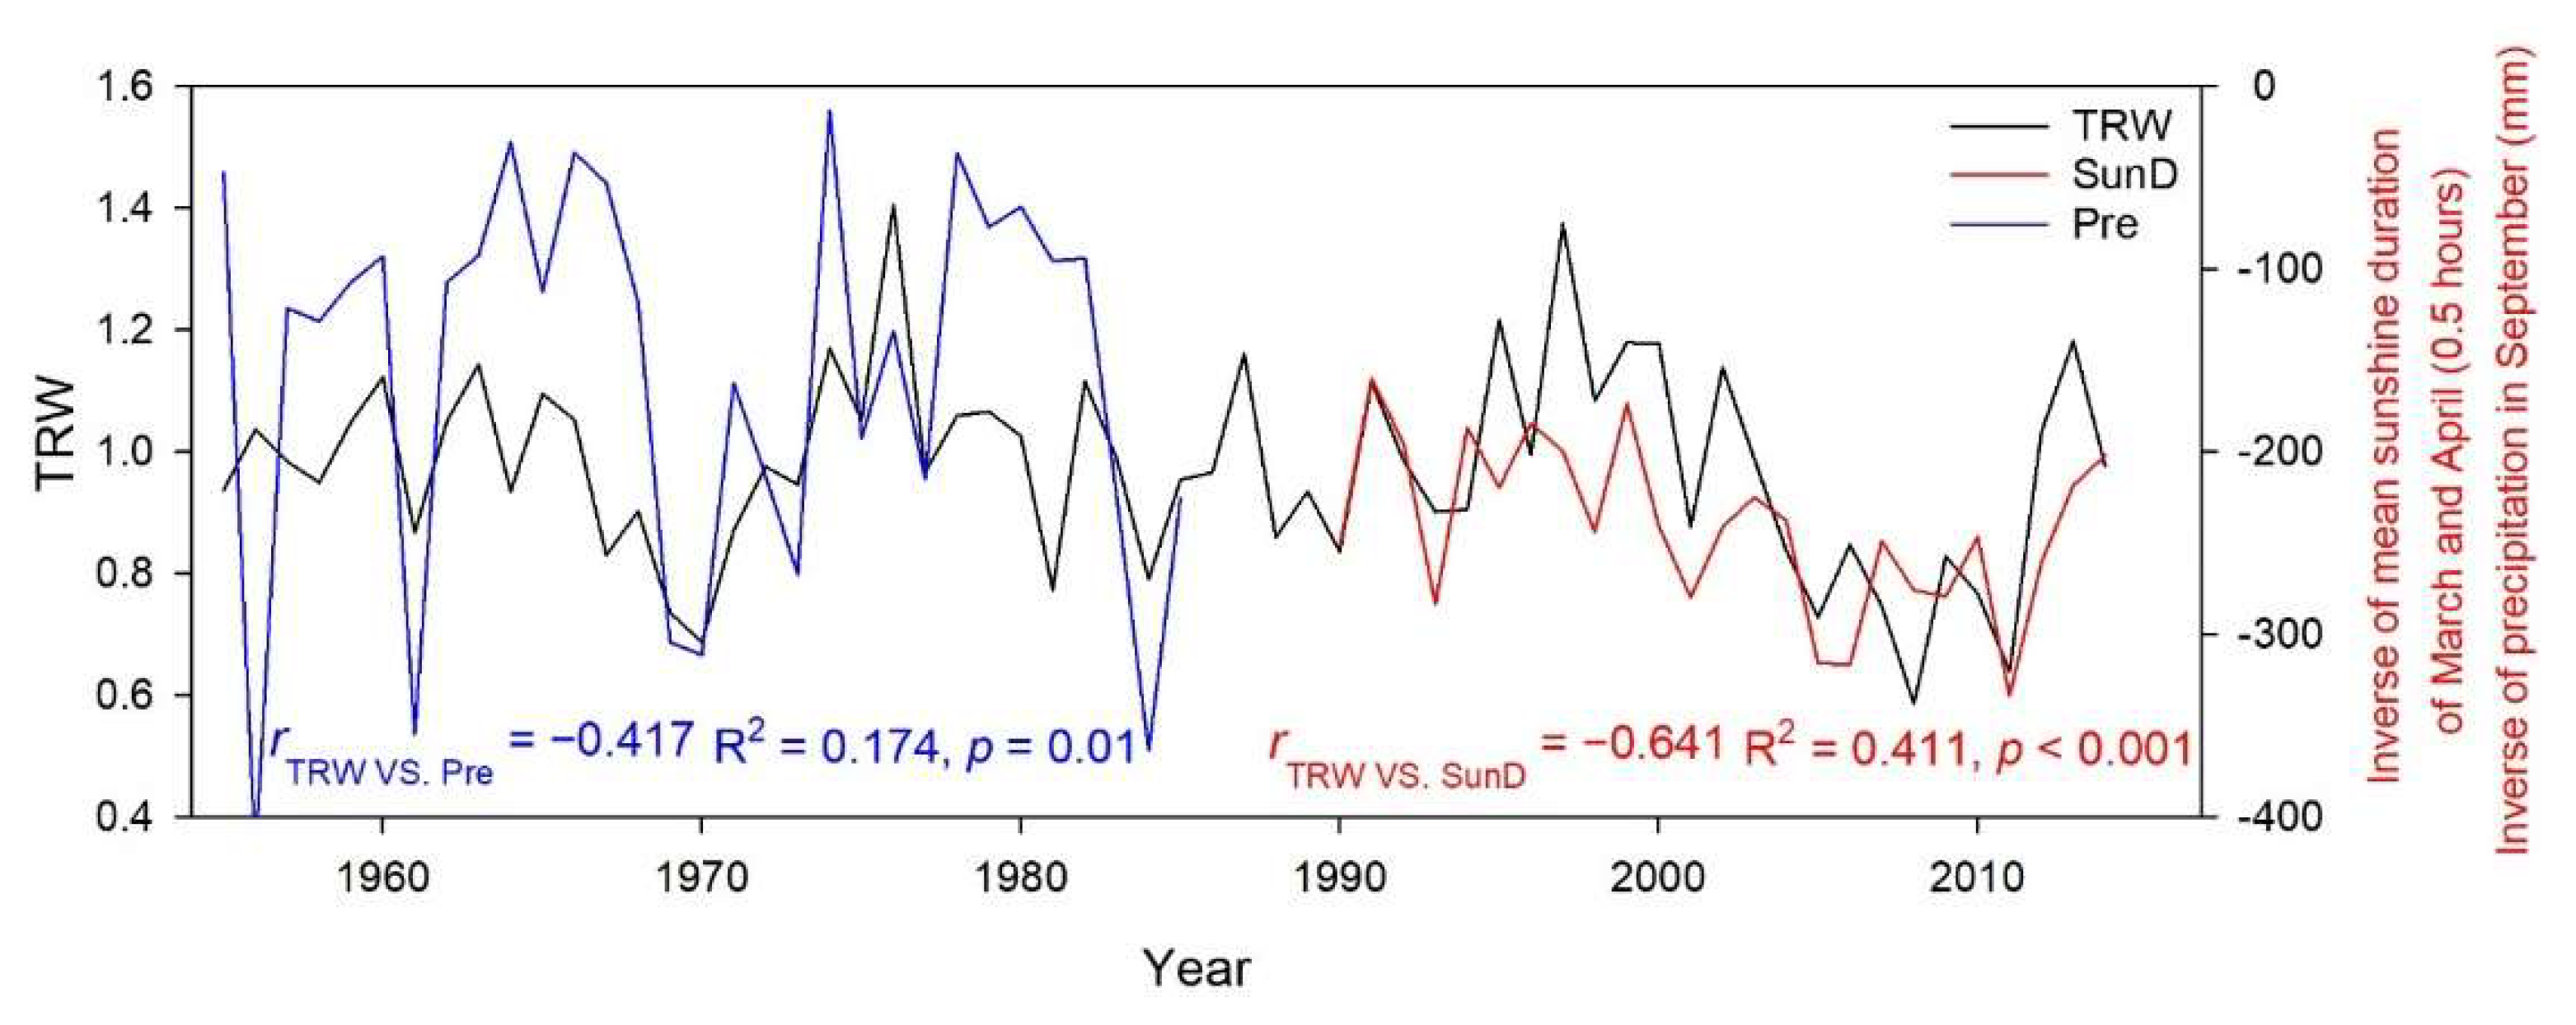
3.3. Linear Regression between TRW and Climate Factors

As the correlation coefficients between relative humidity and tree rings are lower than those for sunshine duration, relative humidity was not considered in the regression. The final results showed that the relationship between TRW and precipitation in September between 1956 and 1985 was the best fitted, with a correlation coefficient of −0.417 and explained variance of 0.174. The relationship between tree ring width and mean sunshine duration of March and April has increased significantly since 1990, and the variance that is explained has reached more than 0.4; indeed, the variance interpretation has reached 0.484 since 1995, indicating its suitability for paleo-climate reconstruction (Table 1). The two best-fitted models are shown in Figure 7.

4. Discussion

Our results showed that the tree growth–climate relationship changed significantly during 1985–1990. Many studies have shown the “divergence problem” in tree growth–climate relationships that are due to the abrupt climatic changes during the 1980–1990 period [7,37]. However, no significant change trends of the limiting climatic factors (precipitation in September and mean sunshine duration from March to April) were observed for 1985–1990 (Appendix A, Figure A1 and Figure A3). Therefore, we think that the change in the relationship between P. taiwanensis and climate factors in subtropical China is not related to climate change.
Another possibility is that stand age had an effect on the growth–climate relationship. According to the forestry industry standard of the People’s Republic of China—Regulations for age-class and age-group divisions of main tree species (LY/T 2908-2017)—the mature forest age of P. taiwanensis is between 41 and 60 years. Since the samples that were collected in this study were planted in around 1930, the age of the samples from 1985 to 1990 was approximately 50 years, which was the stage of transition from a near-mature forest to a mature forest. With the increase in tree age, the physiological and ecological processes of trees will change, resulting in the growth of trees in response to different environmental signals [14]. Therefore, we hypothesized that stand age might be the main factor leading to the change in the relationship between the growth of P. taiwanensis and climate. Similar results for age-altered growth–climate relationships have been found in many places for numerous tree species [15,16,18,20,38].
The results indicate that precipitation in September had a negative effect on tree growth during the young stage (1956–1985), which has also supported the previous findings that conifer trees in the subtropical region still have a growth peak from September to October [25,39,40]. The negative effects of precipitation play the following two roles. One is that precipitation leads to lower temperatures and reduced tree root activity, which affects the peak growth from September to October [3,17,41]. Another reason may be that more September precipitation means that a strong East Asian monsoon and a lot of low-level rainwater could cover the trees, which will reduce the photosynthetic active radiation, and thus narrowing the tree rings [25,28,42]. The latter can also be confirmed by the nonsignificant but stable positive correlation between sunshine and tree rings from 1956 to the 1980s. A similar finding was reported regarding the relationship between P. massoniana and September precipitation in a large region of subtropical China [25].
After P. taiwanensis has matured (i.e., after 1990 here), sunshine duration in March–April became the main limiting factor. This is possibly because, at the beginning of the growing season, water conditions are very important. When sunshine duration is longer, evaporation may increase. At this time, the East Asian monsoon has not started, and it is difficult to replenish moisture, resulting in a water shortage affecting the subsequent growth of trees. This can be well-proved by the correlation between relative humidity and tree rings (Figure 5). Similar findings have been found in the monsoon regions [23,43,44].
In addition, there is a closer relationship between climate and the mature forests of P. taiwanensis. The conclusion that older trees are more sensitive to climate has been reported previously [14,45,46,47]. A possible cause of this is due to the competition condition. In subtropical regions, the climate is suitable, and the growth rate of young stands is faster; thus, the competition might be relatively strong [25]. After maturity, with the closure of the forest, the competition pattern remains stable. As individual trees are larger, their demand for climate resources (i.e., light and water) increases, which leads to a greater sensitivity to climate change [48].

5. Conclusions

Our results show that the correlation between P. taiwanensis and climate factors in subtropical China changed significantly during 1985–1990. This change suggests the need to pay attention to this growth–climate inconsistency when conducting dendroclimatology studies in subtropical China. While the causes of the inconsistency still require further confirmation. In addition, the negative effect of spring sunshine duration on tree growth suggested that humidity may be the main driver of mature forest growth. Given the lack of humidity data, soil moisture monitoring in both mature and young stands is a feasible research topic in the future.

Author Contributions

Conceptualization and methodology, H.L., Z.W. and J.H.; performed the experiments, H.L., C.Z. and S.J.; manuscript writing, H.L., Z.W. and C.Z.; review and editing, H.L., Z.W. and J.H.; supervision, J.H. All authors have read and agreed to the published version of the manuscript.

Funding

This research was funded by the National Natural Science Foundation of China (Grant No. 41701047).

Data Availability Statement

Not applicable.

Conflicts of Interest

The authors declare no conflict of interest.

Appendix A

Figure A1. Climate trends of monthly sunshine duration during 1955–2014.
Forests 13 01502 g0a1
Figure A2. Climate trends of monthly temperature during 1955–2014.
Forests 13 01502 g0a2
Figure A3. Climate trends of monthly precipitation during 1955–2014.
Forests 13 01502 g0a3
Figure A4. Climate trends of monthly relative humidity during 1955–2014.
Forests 13 01502 g0a4
Table A1. Values of standard tree ring width chronology.
YearTRWSample DepthYearTRWSample Depth
19300.998957119720.97752135
19311.192125219730.94580735
19321.123558219741.1697835
19331.175056219751.04871135
19341.05426319761.39824835
19350.505486419770.96385435
19360.488438419781.05681635
19370.91265519791.06120835
19381.255427719801.02283835
19391.267796919810.77051335
19401.0181371319821.1146636
19410.937031519830.98665936
19420.9264291919840.79092936
19430.9495742119850.95485936
19441.0107512419860.96517336
19450.9299432519871.16059836
19460.9090812619880.85761736
19470.9629272819890.93266836
19480.9472373219900.83217836
19491.233443319911.10687836
19501.1215013419920.97751536
19511.0159393419930.89316736
19521.0357113419940.89488736
19530.7588823419951.1997836
19540.7433683519960.97871636
19550.9376553519971.35226636
19561.0361713519981.06354936
19570.9861523519991.16051636
19580.9508143520001.16228136
19591.0497283520010.86706536
19601.1247733520021.12970736
19610.8725793520030.98738836
19621.0511723520040.84139536
19631.1465053520050.739136
19640.9395823520060.86906936
19651.1004433520070.7751436
19661.0586143520080.61925736
19670.8353913520090.89510636
19680.9082113520100.83687736
19690.7411373520110.71912236
19700.6926453520121.20320936
19710.8783363520131.44028536
Figure A5. Correlation coefficient between TRW and climate during 1955–1985.
Forests 13 01502 g0a5
Figure A6. Correlation coefficient between TRW and climate during 1986–2014.
Forests 13 01502 g0a6
Figure A7. Correlation coefficient between TRW and climate during 1955–2014.
Forests 13 01502 g0a7

References

  1. Briffa, K.R.; Schweingruber, F.H.; Jones, P.D.; Osborn, T.J.; Shiyatov, S.G.; Vaganov, E.A. Reduced sensitivity of recent tree-growth to temperature at high northern latitudes. Nature 1998, 391, 678–682. [Google Scholar] [CrossRef]
  2. Esper, J.; Cook, E.R.; Schweingruber, F.H. Low-frequency signals in long tree-ring chronologies for reconstructing past temperature variability. Science 2002, 295, 2250–2253. [Google Scholar] [CrossRef] [PubMed]
  3. Liang, E.; Shao, X.; Qin, N. Tree-ring based summer temperature reconstruction for the source region of the Yangtze River on the Tibetan Plateau. Glob. Planet. Chang. 2008, 61, 313–320. [Google Scholar] [CrossRef]
  4. Lyu, L.; Büntgen, U.; Treydte, K.; Yu, K.; Liang, H.; Reinig, F.; Nievergelt, D.; Li, M.-H.; Cherubini, P. Tree-rings reveal hydroclimatic fingerprints of the Pacific Decadal Oscillation on the Tibetan Plateau. Clim. Dyn. 2019, 53, 1023–1037. [Google Scholar] [CrossRef]
  5. Yang, B.; Qin, C.; Wang, J.; He, M.; Melvin, T.M.; Osborn, T.J.; Briffa, K.R. A 3500-year tree-ring record of annual precipitation on the northeastern Tibetan Plateau. Proc. Natl. Acad. Sci. USA 2014, 111, 2903–2908. [Google Scholar] [CrossRef] [PubMed]
  6. Fritts, H. Tree-Rings and Climate; Elsevier: Amsterdam, The Netherlands, 2012. [Google Scholar]
  7. D’Arrigo, R.; Wilson, R.; Liepert, B.; Cherubini, P. On the ‘Divergence Problem’ in Northern Forests: A review of the tree-ring evidence and possible causes. Glob. Planet. Chang. 2008, 60, 289–305. [Google Scholar] [CrossRef]
  8. Briffa, K.R.; Bartholin, T.S.; Eckstein, D.; Jones, P.D.; Karlén, W.; Schweingruber, F.H.; Zetterberg, P. A 1400-year tree-ring record of summer temperatures in Fennoscandia. Nature 1990, 346, 434–439. [Google Scholar] [CrossRef]
  9. Bastida, J.M.; Rey, P.J.; Alcántara, J.M. Local adaptation to distinct elevational cores contributes to current elevational divergence of two Aquilegia vulgaris subspecies. J. Plant Ecol. 2014, 8, 273–283. [Google Scholar] [CrossRef]
  10. Büntgen, U.; Frank, D.C.; Schmidhalter, M.; Neuwirth, B.; Seifert, M.; Esper, J. Growth/climate response shift in a long subalpine spruce chronology. Trees 2006, 20, 99–110. [Google Scholar] [CrossRef]
  11. Franceschini, T.; Bontemps, J.-D.; Perez, V.; Leban, J.-M. Divergence in latewood density response of Norway spruce to temperature is not resolved by enlarged sets of climatic predictors and their non-linearities. Agric. For. Meteorol. 2013, 180, 132–141. [Google Scholar] [CrossRef]
  12. Li, Q.; Liu, Y.; Song, H.; Yang, Y.; Zhao, B. Divergence of tree-ring-based drought reconstruction between the individual sampling site and the Monsoon Asia Drought Atlas: An example from Guancen Mountain. Sci. Bull. 2015, 60, 1688–1697. [Google Scholar] [CrossRef]
  13. Wang, X.; Zhang, M.; Ji, Y.; Li, Z.; Li, M.; Zhang, Y. Temperature signals in tree-ring width and divergent growth of Korean pine response to recent climate warming in northeast Asia. Trees 2016, 31, 415–427. [Google Scholar] [CrossRef]
  14. Carrer, M.; Urbinati, C. Age-dependent tree-ring growth responses to climate in Larix decidua and Pinus uncinata. Ecology 2004, 85, 730–740. [Google Scholar] [CrossRef]
  15. Čermák, P.; Rybníček, M.; Žid, T.; Steffenrem, A.; Kolář, T. Site and age-dependent responses of Picea abies growth to climate variability. Eur. J. For. Res. 2019, 138, 445–460. [Google Scholar] [CrossRef]
  16. Konter, O.; Büntgen, U.; Carrer, M.; Timonen, M.; Esper, J. Climate signal age effects in boreal tree-rings: Lessons to be learned for paleoclimatic reconstructions. Quaternary. Sci. Rev. 2016, 142, 164–172. [Google Scholar] [CrossRef]
  17. Rossi, S.; Deslauriers, A.; Anfodillo, T.; Carrer, M. Age-dependent xylogenesis in timberline conifers. New Phytol. 2008, 177, 199–208. [Google Scholar] [CrossRef]
  18. Li, X.; Liang, E.; Gričar, J.; Prislan, P.; Rossi, S.; Čufar, K. Age dependence of xylogenesis and its climatic sensitivity in Smith fir on the south-eastern Tibetan Plateau. Tree Physiol. 2012, 33, 48–56. [Google Scholar] [CrossRef]
  19. Wu, G.; Xu, G.; Chen, T.; Liu, X.; Zhang, Y.; An, W.; Wang, W.; Fang, Z.-A.; Yu, S. Age-dependent tree-ring growth responses of Schrenk spruce (Picea schrenkiana) to climate—A case study in the Tianshan Mountain, China. Dendrochronologia 2013, 31, 318–326. [Google Scholar] [CrossRef]
  20. Xu, G.; Wu, G.; Liu, X.; Chen, T.; Wang, B.; Hudson, A.; Trouet, V. Age-related climate response of tree-ring δ13C and δ18O from spruce in northwestern China, with implications for relative humidity reconstructions. J. Geophys. Res. Biogeosci. 2020, 125, e2019JG005513. [Google Scholar]
  21. Yu, G.; Chen, Z.; Piao, S.; Peng, C.; Ciais, P.; Wang, Q.; Li, X.; Zhu, X. High carbon dioxide uptake by subtropical forest ecosystems in the East Asian monsoon region. Proc. Natl. Acad. Sci. USA 2014, 111, 4910–4915. [Google Scholar] [CrossRef]
  22. Duan, J.; Zhang, Q.-B.; Lv, L.; Zhang, C. Regional-scale winter-spring temperature variability and chilling damage dynamics over the past two centuries in southeastern China. Clim. Dyn. 2012, 39, 919–928. [Google Scholar] [CrossRef]
  23. Shi, J.; Lu, H.; Li, J.; Shi, S.; Wu, S.; Hou, X.; Li, L. Tree-ring based February-April precipitation reconstruction for the lower reaches of the Yangtze River, southeastern China. Glob. Planet. Chang. 2015, 131, 82–88. [Google Scholar] [CrossRef]
  24. Cai, Q.; Liu, Y.; Fang, C.; Zhang, H.; Song, H.; Li, Q.; Sun, C.; Wan, C.; Liu, R. Ground surface temperature reconstruction for the Jinggangshan Mountains: Interpreting the hydro-thermal coupling pattern in southeastern China. Quaternary. Sci. Rev. 2020, 249, 106591. [Google Scholar] [CrossRef]
  25. Liang, H.; Huang, J.-G.; Ma, Q.; Li, J.; Wang, Z.; Guo, X.; Zhu, H.; Jiang, S.; Zhou, P.; Yu, B.; et al. Contributions of competition and climate on radial growth of Pinus massoniana in subtropics of China. Agric. For. Meteorol. 2019, 274, 7–17. [Google Scholar] [CrossRef]
  26. Huang, X.; Dai, D.; Xiang, Y.; Yan, Z.; Teng, M.; Wang, P.; Zhou, Z.; Zeng, L.; Xiao, W. Radial growth of Pinus massoniana is influenced by temperature, precipitation, and site conditions on the regional scale: A meta-analysis based on tree-ring width index. Ecol. Indic. 2021, 126, 107659. [Google Scholar] [CrossRef]
  27. Su, J.; Gou, X.; HilleRisLambers, J.; Deng, Y.; Fan, H.; Zheng, W.; Zhang, R.; Manzanedo, R.D. Increasing climate sensitivity of subtropical conifers along an aridity gradient. For. Ecol. Manag. 2021, 482, 118841. [Google Scholar] [CrossRef]
  28. Yang, R.-Q.; Fu, P.-L.; Fan, Z.-X.; Panthi, S.; Gao, J.; Niu, Y.; Li, Z.-S.; Bräuning, A. Growth-climate sensitivity of two pine species shows species-specific changes along temperature and moisture gradients in southwest China. Agric. For. Meteorol. 2022, 318, 108907. [Google Scholar] [CrossRef]
  29. Zuidema, P.A.; Babst, F.; Groenendijk, P.; Trouet, V.; Abiyu, A.; Acuña-Soto, R.; Adenesky-Filho, E.; Alfaro-Sánchez, R.; Aragão, J.R.V.; Assis-Pereira, G.; et al. Tropical tree growth driven by dry-season climate variability. Nat. Geosci. 2022, 15, 269–276. [Google Scholar] [CrossRef]
  30. Cai, Q.; Liu, Y.; Liu, H.; Sun, C.; Wang, Y. Growing-season precipitation since 1872 in the coastal area of subtropical southeast China reconstructed from tree-rings and its relationship with the East Asian summer monsoon system. Ecol. Indic. 2017, 82, 441–450. [Google Scholar] [CrossRef]
  31. Holmes, R.L. Computer-assisted quality control in tree-ring dating and measurement. Tree-Ring Bull. 1983, 43, 69–78. [Google Scholar]
  32. Bunn, A.G. A dendrochronology program library in R (dplR). Dendrochronologia 2008, 26, 115–124. [Google Scholar] [CrossRef]
  33. Zang, C.; Biondi, F. Treeclim: An R package for the numerical calibration of proxy-climate relationships. Ecography 2015, 38, 431–436. [Google Scholar] [CrossRef]
  34. R Core Team. R: A Language and Environment for Statistical Computing. URL. R Foundation for Statistical Computing, Vienna, Austria. 2015. Available online: https://www.R-project.org/ (accessed on 13 June 2022).
  35. Buras, A. A comment on the expressed population signal. Dendrochronologia 2017, 44, 130–132. [Google Scholar] [CrossRef]
  36. Wigley, T.M.L.; Briffa, K.R.; Jones, P.D. On the Average Value of Correlated Time Series, with Applications in Dendroclimatology and Hydrometeorology. J. Appl. Meteorol. Climatol. 1984, 23, 201–213. [Google Scholar] [CrossRef]
  37. Wilson, R.; D’Arrigo, R.; Buckley, B.; Büntgen, U.; Esper, J.; Frank, D.; Luckman, B.; Payette, S.; Vose, R.; Youngblut, D. A matter of divergence: Tracking recent warming at hemispheric scales using tree-ring data. J. Geophys. Res. Atmos. 2007, 112, 107–114. [Google Scholar] [CrossRef]
  38. Trouillier, M.; van der Maaten-Theunissen, M.; Scharnweber, T.; Würth, D.; Burger, A.; Schnittler, M.; Wilmking, M. Size matters—A comparison of three methods to assess age- and size-dependent climate sensitivity of trees. Trees 2018, 33, 183–192. [Google Scholar] [CrossRef]
  39. Cai, Q.F.; Liu, Y. Two centuries temperature variations over subtropical southeast China inferred from Pinus taiwanensis Hayata tree-ring width. Clim. Dyn. 2017, 48, 1813–1825. [Google Scholar] [CrossRef]
  40. Huang, J.G.; Guo, X.; Rossi, S.; Zhai, L.; Yu, B.; Zhang, S.; Zhang, M. Intra-annual wood formation of subtropical Chinese red pine shows better growth in dry season than wet season. Tree. Physiol. 2018, 38, 1225–1236. [Google Scholar] [CrossRef]
  41. Liang, H.; Lyu, L.; Wahab, M. A 382-year reconstruction of August mean minimum temperature from tree-ring maximum latewood density on the southeastern Tibetan Plateau, China. Dendrochronologia 2016, 37, 1–8. [Google Scholar] [CrossRef]
  42. Panthi, S.; Bräuning, A.; Zhou, Z.K.; Fan, Z.X. Growth response of Abies georgei to climate increases with elevation in the central Hengduan Mountains, southwestern China. Dendrochronologia 2018, 47, 1–9. [Google Scholar] [CrossRef]
  43. Fan, Z.X.; Brauning, A.; Cao, K.F. Tree-ring based drought reconstruction in the central Hengduan Mountains region (China) since AD 1655. Int. J. Climatol. 2008, 28, 1879–1887. [Google Scholar] [CrossRef]
  44. Sano, M.; Buckley, B.M.; Sweda, T. Tree-ring based hydroclimate reconstruction over northern Vietnam from Fokienia hodginsii: Eighteenth century mega-drought and tropical Pacific influence. Clim. Dyn. 2009, 33, 331–340. [Google Scholar] [CrossRef]
  45. Esper, J.; Niederer, R.; Bebi, P.; Frank, D. Climate signal age effects—Evidence from young and old trees in the Swiss Engadin. For. Ecol. Manag. 2008, 255, 3783–3789. [Google Scholar] [CrossRef]
  46. Linares, J.C.; Taïqui, L.; Sangüesa-Barreda, G.; Seco, J.I.; Camarero, J.J. Age-related drought sensitivity of Atlas cedar (Cedrus atlantica) in the Moroccan Middle Atlas forests. Dendrochronologia 2013, 31, 88–96. [Google Scholar] [CrossRef]
  47. Yu, G.; Liu, Y.; Wang, X.; Ma, K. Age-dependent tree-ring growth responses to climate in Qilian juniper (Sabina przewalskii Kom.). Trees 2008, 22, 197–204. [Google Scholar] [CrossRef]
  48. Gomez-Aparicio, L.O.; Garcia-Valdes, R.A.; Ruiz-Benito, P.A.; Zavala, M.A. Disentangling the relative importance of climate, size and competition on tree growth in Iberian forests: Implications for forest management under global change. Glob. Chang. Biol. 2011, 17, 2400–2414. [Google Scholar] [CrossRef] [Green Version]
Figure 1. Sampling site and meteorological station locations and climate condition during 1955–2014 (small panel). MAT, mean annual temperature; MAP, mean annual precipitation; MAS, mean annual sunshine duration.
Forests 13 01502 g001
Figure 2. Trends of annual mean temperature, annual precipitation, annual sunshine hours, and annual mean relative humidity during 1955–2014.
Forests 13 01502 g002
Figure 3. Tree-ring width chronology and sample depth.
Forests 13 01502 g003
Figure 4. Moving correlation coefficients between tree-ring chronology and precipitation; prev. and curr. indicate previous and current years; * indicates significance at 0.05 level.
Forests 13 01502 g004
Figure 5. Moving correlation coefficients between tree-ring chronology and sunshine duration; prev. and curr. indicate previous and current years; * indicates significance at 0.05 level.
Forests 13 01502 g005
Figure 6. Moving correlation coefficients between tree-ring chronology and relative humidity; prev. and curr. indicate previous and current years; * indicates significance at the level of 0.05.
Forests 13 01502 g006
Figure 7. Best-fitted linear regression results. TRW, tree-ring width chronology; Pre, inverse of the precipitation in September; SunD, inverse of the mean sunshine duration of March and April.
Forests 13 01502 g007
Table 1. Linear regressions between tree-ring chronology and climate factors (precipitation of September and mean sunshine duration from March to April).
September PrecipitationMean Sunshine Duration from
March to April
Time SpanrR-SquareTime SpanrR-Square
1956–1976−0.3790.1441976–2014−0.5350.286
1956–1977−0.3800.1441977–2014−0.4910.241
1956–1978−0.3900.1521978–2014−0.4910.241
1956–1979−0.3980.1591979–2014−0.5160.267
1956–1980−0.4000.1601980–2014−0.5450.297
1956–1981−0.3540.1251981–2014−0.5450.297
1956–1982−0.3620.1311982–2014−0.5880.346
1956–1983−0.3590.1291983–2014−0.6060.368
1956–1984−0.4160.1731984–2014−0.6240.390
1956–1985−0.4170.1741985–2014−0.6240.389
1956–1986−0.4130.1701986–2014−0.6300.396
1956–1987−0.3890.1511987–2014−0.6300.396
1956–1988−0.4100.1681988–2014−0.6260.392
1956–1989−0.4120.1691989–2014−0.6220.387
1956–1990−0.4140.1721990–2014−0.6410.411
1956–1991−0.4070.1661991–2014−0.6410.411
1956–1992−0.4070.1661992–2014−0.6330.401
1956–1993−0.3920.1531993–2014−0.6450.416
1956–1994−0.3760.1411994–2014−0.6460.418
1956–1995−0.4130.1701995–2014−0.6960.484
Publisher’s Note: MDPI stays neutral with regard to jurisdictional claims in published maps and institutional affiliations.

