Article

The Most Suitable Calcium Concentration for Growth Varies among Different Tree Species—Taking Pinus tabuliformis, Pinus sylvestris var. mongolica, Populus, and Morus alba as Examples

1
College of Forestry, Shenyang Agricultural University, Shenyang 110866, China
2
Research Station of Liaohe River Plain Forest Ecosystem, Chinese Forest Ecosystem Research Network (CFERN), Shenyang Agricultural University, Shenyang 110161, China
3
Institute of Modern Agricultural Research, Dalian University, Dalian 116622, China
4
College of Land and Environment, Shenyang Agricultural University, Shenyang 110866, China
*
Author to whom correspondence should be addressed.
Forests 2023, 14(7), 1437; https://doi.org/10.3390/f14071437
Submission received: 25 May 2023 / Revised: 5 July 2023 / Accepted: 8 July 2023 / Published: 13 July 2023
(This article belongs to the Special Issue Abiotic Stress in Tree Species)

Abstract

:
Ca2+ is a crucial second messenger in plant cells that plays a vital role in various physiological and biochemical processes, including plant growth and development, photosynthesis, and enzyme regulation. Exogenous calcium concentrations can have different effects on plant growth. The purpose of this study was to determine the appropriate calcium concentration for the growth of four tree seedlings, namely Pinus tabuliformis, Pinus sylvestris var. mongolica, Populus, and Morus alba seedlings, and whether this optimal calcium concentration varies among different tree species. This study utilized five calcium concentration gradients (0, 100, 200, 400, 800 mg·kg−1) for each species with three repeated treatments. To determine each species’ calcium concentration needs, several growth indices, photosynthetic metrics, chlorophyll fluorescence parameters, water usage efficiency, and antioxidant enzyme activities were analyzed. The results showed that exogenous calcium significantly affected the growth and development of each seedling. The growth, biomass, photosynthetic parameters, photosynthetic products, photosynthetic pigments, water use efficiency, and antioxidant enzyme activity all increased initially and then decreased with the increasing calcium concentration. The exogenous calcium supply increased the concentration of calcium in the leaves. Thus, there was an optimal calcium concentration for plant growth, and a high or low calcium concentration was not conducive to plant growth. Furthermore, this study found that the optimum calcium concentration of different tree species was different. The optimal calcium concentration for Pinus tabuliformis, Pinus sylvestris var. mongolica, Populus, and Morus alba seedlings was 100, 100, 200, and 400 mg·kg−1, respectively, with broadleaf seedlings requiring higher calcium concentrations than coniferous seedlings.

1. Introduction

Calcium (Ca) is a very essential mineral element and one of the fundamental nutrients for plant growth and development, which has necessary physiological features such as maintaining cell morphology and regulating ion homeostasis and osmotic pressure [1,2]. Calcium absorption by plants is mainly passive absorption, and the calcium nutrient environment of plants directly affects their calcium absorption and distribution [3,4]. Both calcium deficiency and excessive concentrations of calcium have an effect on plant-related physiological and biochemical strategies and are detrimental to plant growth [5,6]. The outcomes of preceding research confirmed that calcium deficiency and calcium excess diminished the boom of Quercus acutissima Carruth and were hazardous to the synthesis and accumulation of photosynthetic pigments, the expansion of the photosynthetic rate, and the synthesis of photosynthetic products, whilst a reasonable calcium cure notably promoted an increase in Quercus acutissima Carruth. The seedlings and accumulation of photosynthetic pigments elevated the photosynthetic parameters and the photosynthetic product content material of the plants [7]. Previous research on optimum calcium concentrations in general centered on single tree species; for example, Huang [8] determined that the increase and photosynthetic traits of fig (Ficus carica Linn.) seedlings had the highest quality beneath pot test conditions with 4 mmol·L−1 calcium treatment, while underneath field test conditions, a 200 mmol·L−1 calcium cure was used as the most tremendous in growing relative chlorophyll content, etc. Li et al. [9] found that an exogenous calcium awareness of 100 mg·kg−1 resulted in the greatest height, basal diameter, and photosynthesis stage of Mongolian pine seedlings. Ren et al. [10] discovered the growth, photosynthetic characteristics, and water use effectivity of Fraxinus mandshurica Rupr. were ideal at a calcium gradient of 200 mg·kg−1. Previous research has not compared different tree species, instead concentrating on investigating how calcium affects a single kind of tree. However, the leaf qualities of broadleaf and coniferous timber can respond differently to resource changes, and there are crucial variations between these two species in regulating their uptake, metabolism, and water and soil nutrients [11]. Therefore, this experiment selected and compared four tree species, namely Pinus tabuliformis, Pinus sylvestris var. mongolica, Populus, and Morus alba, to investigate and compare the differences in calcium requirements between coniferous and broadleaf trees and provide references for the optimal calcium application amount for different tree species.
Pinus tabuliformis, Pinus sylvestris var. mongolica, Populus, and Morus alba are all vital species for the Three North Protection Forest, with important roles in wind control, sand fixation, and soil conservation [12,13]. However, incorrect tree species selection has been noted as a contributing contributor to forest degradation in Liaoning Province. Due to antiquated ideas and methods, the notion of choosing the right trees for certain areas was not always followed in the early stages of afforestation. As a result, the afforestation survival rate was low, and even if trees managed to grow, their resistance to pests and diseases was weakened in later stages, leaving them vulnerable to invasion and significantly diminishing their effectiveness at protection [14,15]. Four tree species have declined over the past decades of construction, experiencing large-scale decline and mortality in many introduced areas, with problems such as terminal shoot death, premature tree decay and mortality, ecosystem degradation, and frequent pests and diseases [16,17,18]. A major tenet of Silviculture is choosing the right tree species for a particular location. This decision was made based on a number of variables, including the soil type and biological properties of the tree species. Some scholars have suggested the use of the soil’s calcium supply potential as an evaluation index for the stand quality and the maximum growth calcium demand of tree species as a biological characteristic index for tree species selection. Matching the maximum growth of calcium demand on the tree species with the stand’s calcium supply potential has facilitated the selection of suitable tree species for the land. In other words, the essence of selecting a suitable tree for a given site lies in selecting a tree species that is suitable for calcium supply. This principle is crucial for ensuring successful silvicultural production activities [19]. The notion being explored is that different tree species’ ideal calcium concentrations differ from one another and that there is an optimal calcium concentration for plant growth.

2. Materials and Methods

2.1. Cultivation and Treatment of Seedlings of Four Tree Species

The experiment was carried out at the Beishan Experimental Station of Shenyang Agricultural University. The 3-year-old live Pinus tabuliformis seedlings and Pinus sylvestris var. mongolica seedlings with Populus cuttings of “Liao Hu No. 1” and live Morus alba seedlings of the identical dimension were selected from Fujia Forestry Farm, Changtu County, Northwest Liaoning Province, respectively. The experimental soil was collected from Tieling City, Liaoning Province, and the basic properties of soil water-soluble calcium and exchange calcium were 0.03 g·kg−1 and 1.01 g·kg−1, respectively, with a pH value of 7.31.
The collected soil was sieved and processed to cast off stones and impurities. Accurately, 3 kg of test soil was weighed and combined with 2 kg of quartz sand as the potting test soil. Select plants with uniform growth were planted in plastic flowerpots with an inner diameter of 23.8 cm, a depth of 24.8 cm, and a capacity of approximately 11.36 L. Different treatments were applied, with each treatment repeated three times, and three mechanical replicates were conducted when measuring the indicators. After carrying out a period of slowing down, nutrient solution treatments were applied. The calcium gradient in the experiment was provided by anhydrous CaCl2 in 0, 100, 200, 400, and 800 mg·kg−1 5 gradients. Other nutrients were prepared in accordance with Xie’s [20] and culture nutrient solution formulation with ultrapure water, using NaOH to adjust the nutrient solution pH to 5–6.

2.2. Measurement Methods and Indicators

2.2.1. Determination of Growth

The plant height and basal diameter of seedlings for each of the four tree species were measured before destructive harvesting. Plant height was measured with a ruler to 0.10 cm, and basal diameter was measured with a vernier caliper to 0.01 mm.

2.2.2. Determination of Biomass

The entire plant was harvested by removing it from the pot, giving it a careful wash, and removing the substrate. After that, the surface water was drained, and the plants were divided into root, stem, and leaf parts with pruning scissors and put into separate envelopes and marked. The plants were then put into an oven at 105 °C for 30 min and then dried at 65 °C for weighing, and the root, stem, and leaf biomass of the plants were determined using an analytical balance [9].

2.2.3. Determination of Calcium Concentration in Leaves

The leaves of four tree species seedlings were killed for 0.5 h in an oven at 105 °C and then dried to a constant weight at 65 °C. The leaves were crushed with a pulverizer, and then a ball mill was used to crush the leaf samples with a 100-mesh sieve and used the wet ashing method to determine the calcium concentration of the plant leaves. Accurately, a sample of 0.1 g was then put into a conical flask with 10 mL of mixed acid of nitric acid and perchloric acid (HNO3:HClO4 = 4:1); a funnel was placed on the conical flask mouth and then transferred to the heating plate, which regulated the temperature of the heating plate to gradually increase, making the sample digest to colorless and transparent, before moving it into a 50 mL volumetric flask and adding a shielding agent (strontium chloride 30 g·L−1). Then a flame atomic absorption spectrophotometer was used to measure the calcium content of its leaves, respectively.

2.2.4. Determination of Photosynthetic Index

Determination of Photosynthetic Parameters

Net photosynthesis (Pn), stomatal conductance (Gs), and transpiration rate (Tr) values were measured between 9:00 and 11:00 a.m. on each sampling day using the LI-COR 6400 system (LI-COR Inc., Lincoln, NE, USA), and each treatment was repeated three times for each tree species, with effective light intensity set at 1000 μmol·m−2·s−1 [9].

Determination of Photosynthetic Pigment

Photosynthetic pigments were determined by the ethanol extraction method. Firstly, the centrifuge tubes were numbered, and 0.1 g of the plant leaves were collected separately according to the number; the main veins were removed and cut and then loaded into the centrifuge tubes according to the number, and 95% ethanol was rapidly added to 9 mL followed by 48 h extraction through immersion away from light. After that, the absorbance values were measured at 665 nm and 649 nm, and the contents of chlorophyll a and chlorophyll b were calculated by paying attention to avoiding light during the process.
Ca = 13.95(A665) − 6.88(A649)
Cb = 24.96(A649) − 7.32(A665)
Chlorophyll a content (mg·g−1) = (Ca × Vt)/(FW × 1000) × n
Chlorophyll b content (mg·g−1) = (Cb × Vt)/(FW × 1000) × n
where Ca and Cb represent chlorophyll a and chlorophyll b, respectively; FW is the fresh weight of the sample of 0.1 g; Vt is the total volume of the extraction solution of 9 mL; A665 and A649 represent the absorbance values of photosynthetic pigment extracts at 665 nm and 649 nm [21,22].

Determination of Photosynthate

The soluble sugar and starch of photosynthate were determined using the anthrone colorimetric method [23]. In total, 5 mg of a dry sample of plant leaves was weighed, anthrone colorimetry was used to measure the absorbance at 625 nm with a spectrophotometer, and then the content of soluble sugar and starch was calculated in the leaves of plant seedlings according to the formula:
Soluble sugar content (mg·g−1) = (C × Vt)/(m × V1)   Vt = 10 mL, m = 50 mg, V1 = 0.2 mL
Starch content (mg·g−1) = (C × Vt × 0.9)/(m × V1)   Vt = 50 mL, m = 50 mg, V1 = 0.2 mL
where C represents the sugar content found on the standard curve (μg); Vt is the total volume of the extraction solution (mL); V1 is the volume taken for determination (mL); m is the weight of the sample (mg) [24].

2.2.5. Determination of Chlorophyll Fluorescence Parameters

The maximum photochemical efficiency (Fv/Fm) and potential photochemical efficiency (Fv/Fo) were measured on plants using a portable pulse-modulated fluorometer (OS-5P+, USA) at 16:00~18:00 on each sampling day. Prior to the measurements, Pinus tabuliformis and Pinus sylvestris var. mongolica leaves were dark-treated using light-exclusion clips for 30 min and Populus and Morus alba for 20 min [9].

2.2.6. Determination of the Stress Tolerance

Determination of Long-Term Water Use Efficiency

The long-term water use efficiency of plants was characterized by WUEL values, which were calculated through the use of δ13C from the leaves of seedlings of Pinus tabuliformis, Pinus sylvestris var. mongolica, Populus, and Morus alba, respectively. After calcium treatment, until growth distinction occurred, destructive sampling was started. The leaves of Pinus tabuliformis, Pinus sylvestris var. mongolica, Populus, and Morus alba seedlings were washed and then put into an oven at 105 °C to kill for 0.5 h, and then dried to a constant mass at 65 °C and ground through a 100-mesh sieve to make samples for standby. Accurately, 0.7 mg of the sample was weighed and wrapped tightly with a tin boat, using the DELTAV Advantage Isotope Ratio Mass Spectrometer to determine δ13C and then using the formula to calculate the WUEL value [21,25]:
WUEL = A/Gs = (Ca − Ci)/1.6 = Ca(1 − Ci/Ca)/1.6 = Ca(b − δ13C)/1.6(b − a)
In the formula, A represents the net photosynthetic rate, Gs represents stomatal conductance, Ca and Ci are the concentrations of CO2 in the atmosphere, and the leaf cells, a and b are the partial effects of CO2 diffusion to the stomata and the partial effects of stomatal photosynthetic carboxylase RUBP on carbon isotopes.

Determination of Antioxidant Enzymes

For the determination of antioxidant enzymes, a 0.4 g sample was extracted from fresh leaves, stored in a frozen tube, fixed with liquid nitrogen, and stored at −80 °C. For measurements, the samples were taken according to the markers and placed in a mortar. Then, 5 mL of the pre-cooled phosphate buffer was added, and the sample was ground and centrifuged at 13,000 rpm for 15 min at 4 °C. The supernatant was placed in a centrifuge tube for stock (each sample was repeated 3 times). Peroxidase (POD) levels were determined by the guaiacol method. Catalase (CAT) levels were determined by the ultraviolet absorption of hydrogen peroxide. Superoxide dismutase (SOD) levels were determined by methionine [26,27].

2.2.7. Statistical Analysis

Excel and SPSS 22.0 software programs were used to sort out and plot the test data and conduct necessary statistical analysis and difference analysis. The data in the figure is the mean value ± standard error (SE) of three repetitions, and the single factor analysis of variance and Duncan’s new multiple extreme difference method were used. The error line in the text was expressed by the standard error, and the different letters in the chart indicated that the difference of each index between different calcium levels was up to a 5% significant level.

3. Results

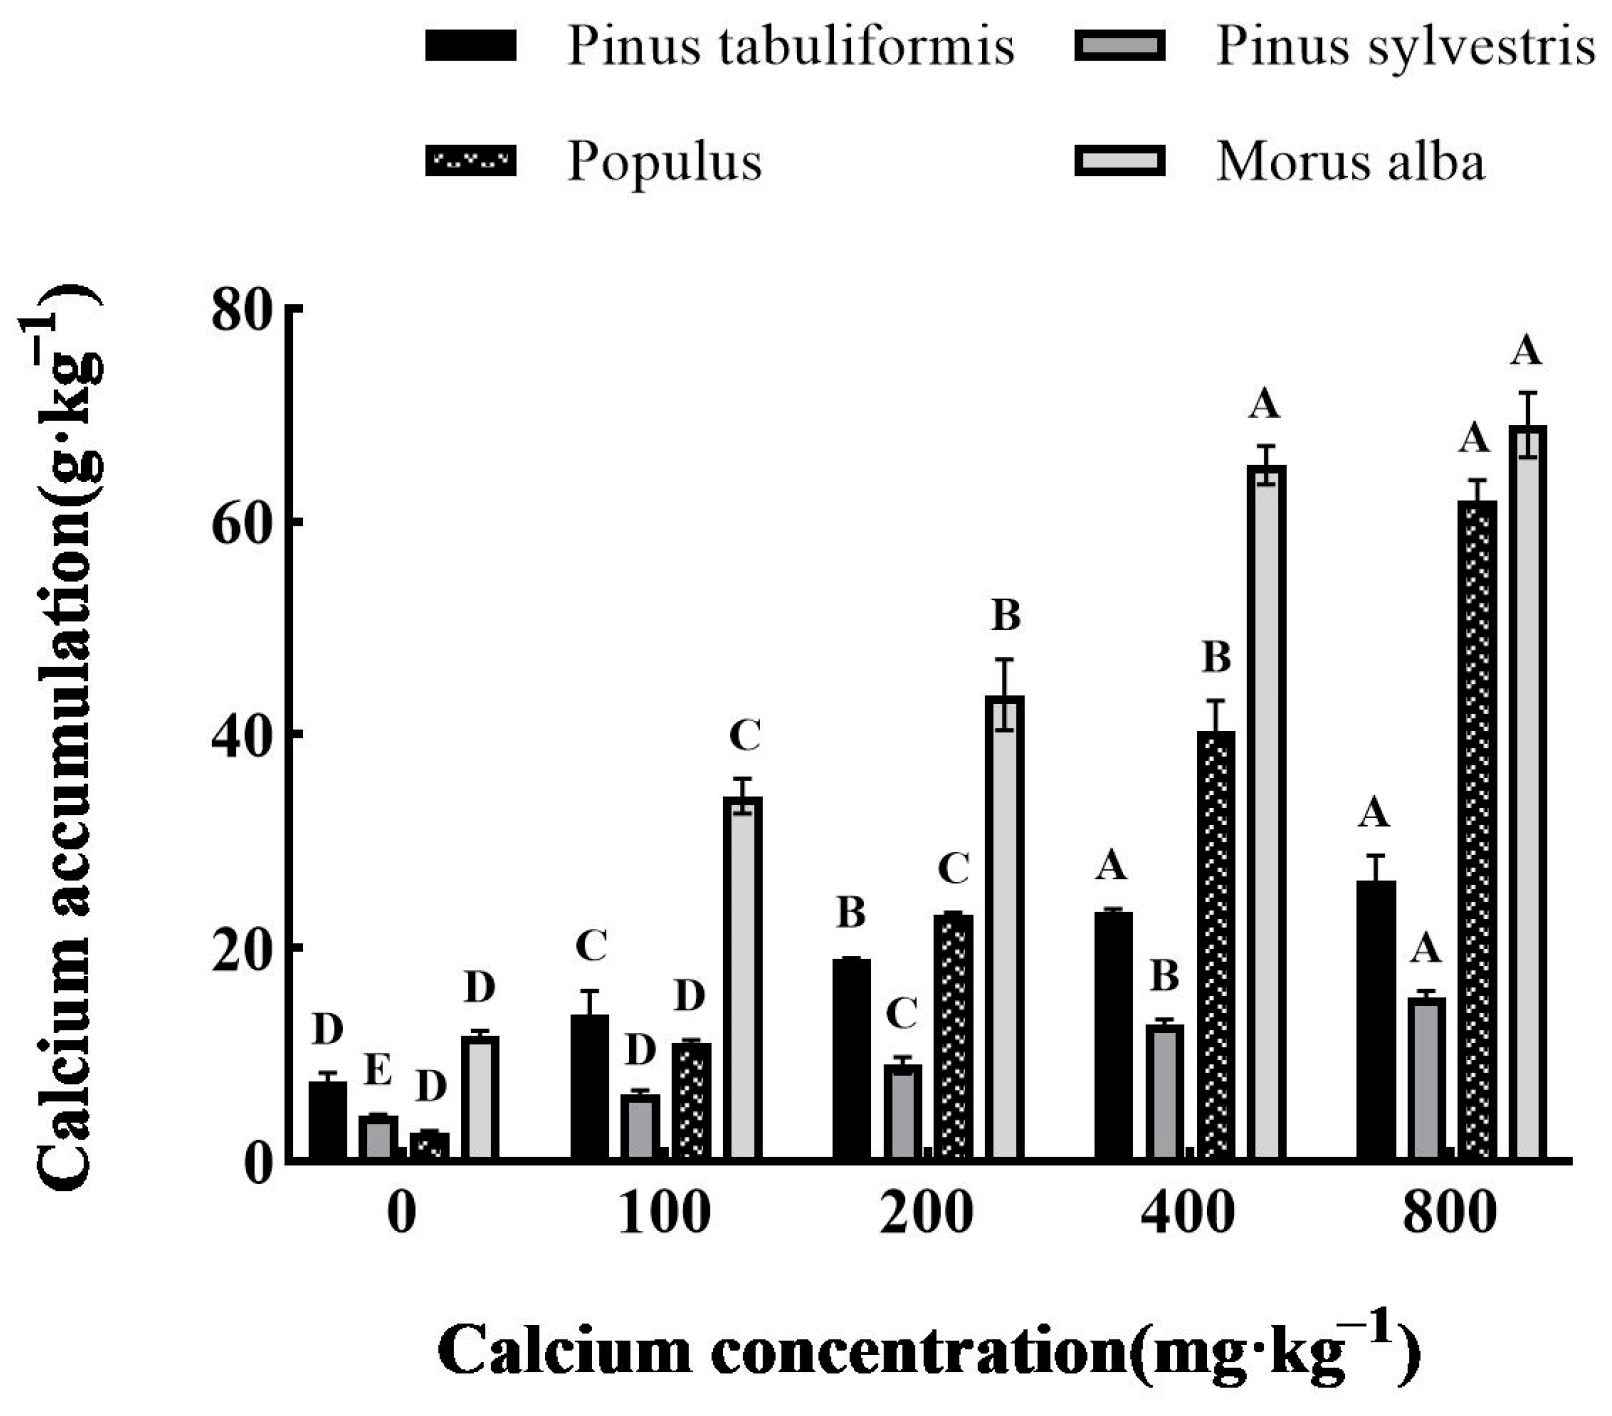
3.1. Effect of Exogenous Calcium on Calcium Content in Leaves of Four Tree Species Seedlings

Under five different exogenous calcium concentrations, the calcium content in the leaves of seedlings of Pinus tabuliformis, Pinus sylvestris var. mongolica, Populus, and Morus alba increased significantly with the increase in the calcium concentration (p < 0.05). When the concentration of exogenous calcium increased to 800 mg·kg−1, it showed the maximum value, which was 26.32 g·kg−1, 15.44 g·kg−1, 61.97 g·kg−1 and 69.05 g·kg−1, respectively, and was significantly increased by 250.93%, 259.91%, 2121.15%, and 486.16% compared with the treatment without calcium (p < 0.05). Among them, the growth of Populus was the largest, and the calcium content of the plant leaf tissue when the exogenous calcium concentration was 800 mg·kg−1 was 22.21 times higher than that without calcium treatment (Figure 1).

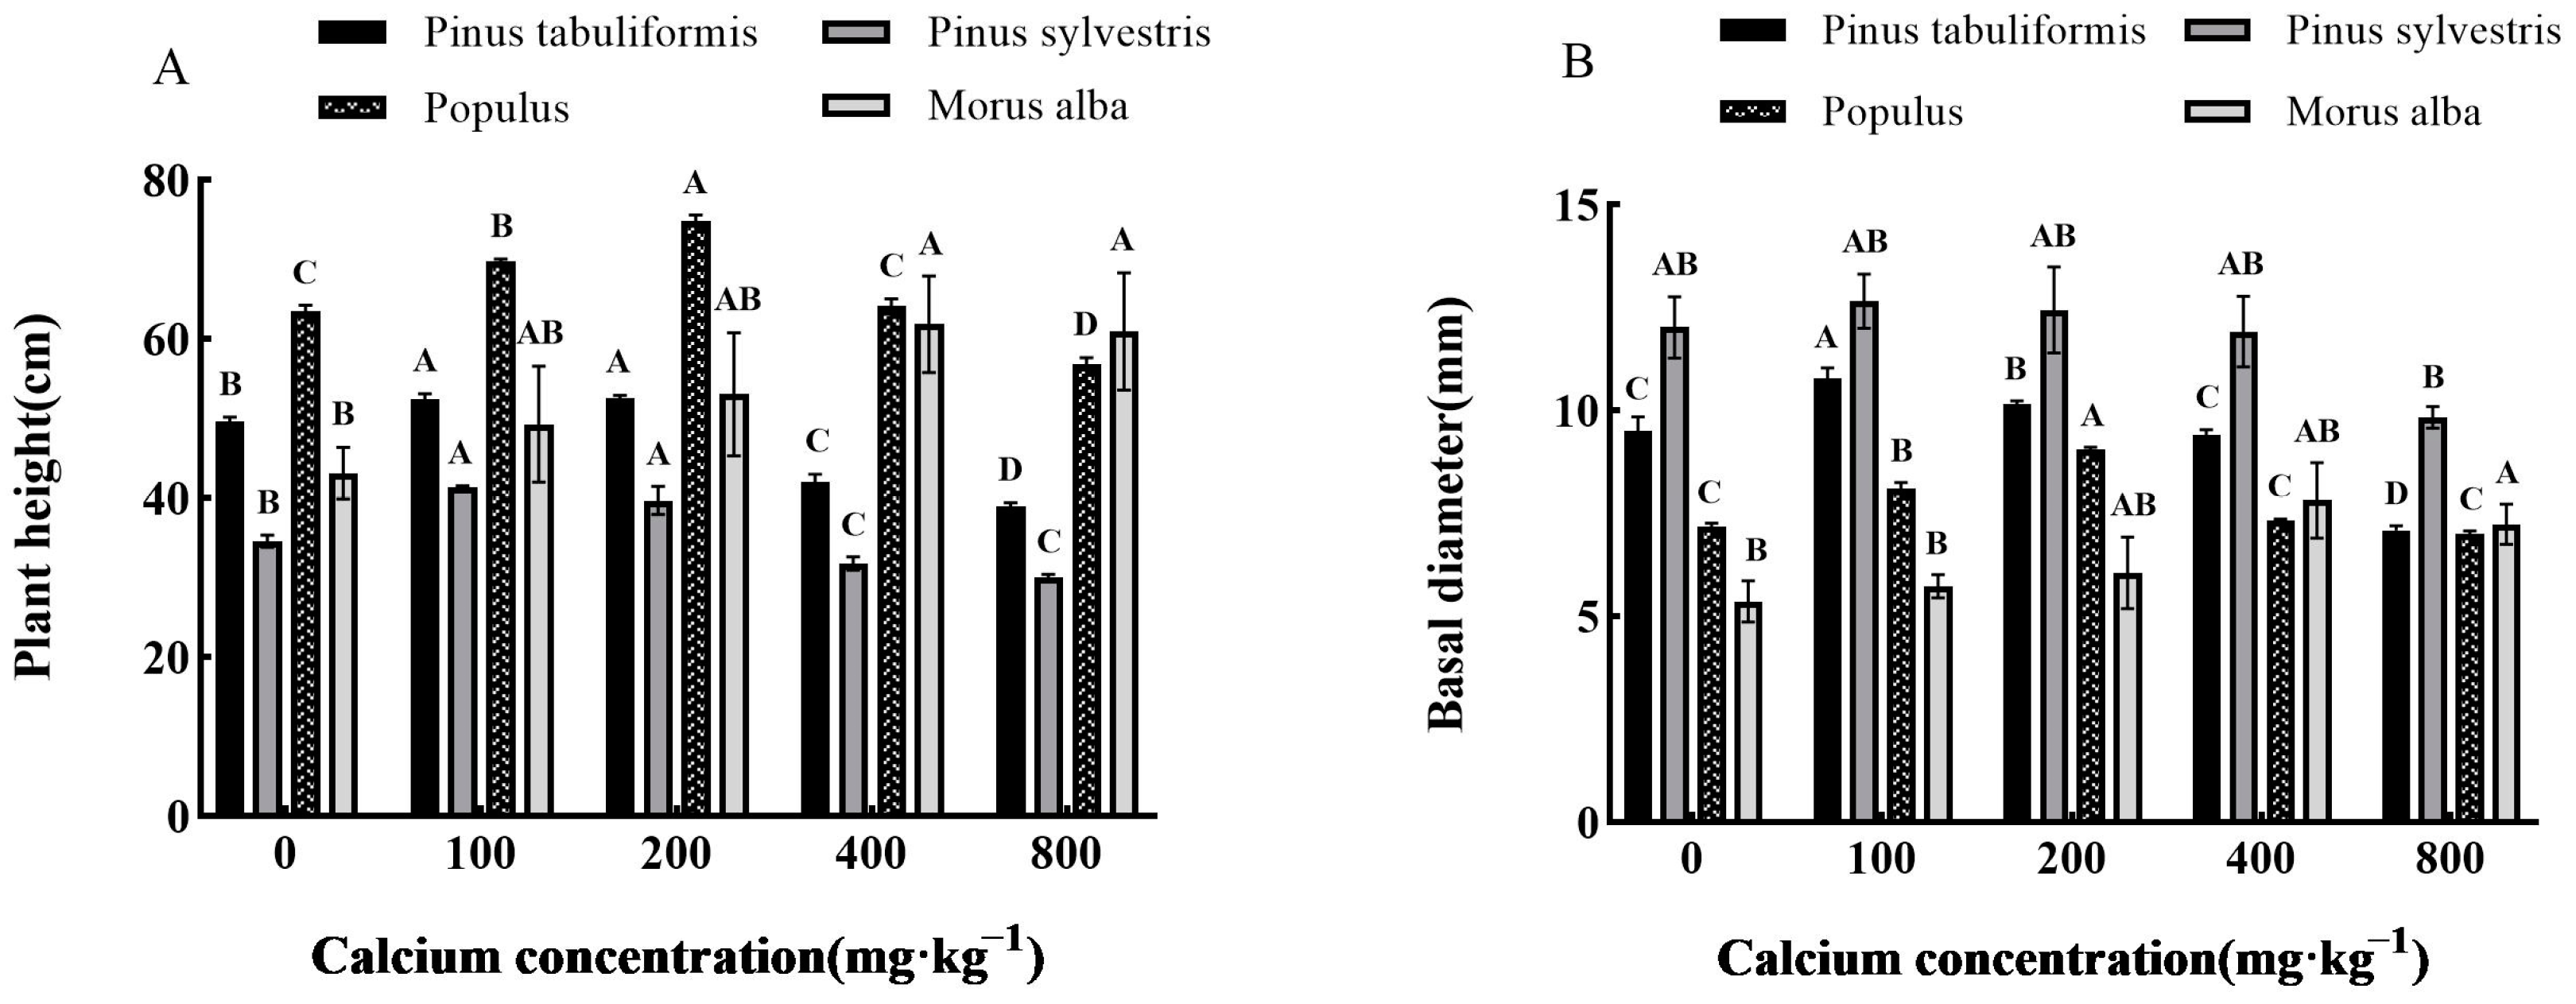
3.2. Effects of Exogenous Calcium on the Growth of Seedlings of Four Tree Species

The plant height and basal diameter of Pinus tabuliformis, Pinus sylvestris var. mongolica, Populus, and Morus alba were significantly different from those of the control group without calcium application (p < 0.05), which showed a trend that first increased and then decreased with the increase in the calcium concentration (Figure 2A,B). The plant height of Pinus tabuliformis reached its maximum at a calcium concentration of 200 mg·kg−1 and was slightly higher than that at 100 mg·kg−1, increasing by 6.05% and 5.79%, respectively, compared to that without a calcium addition. The basal diameter reached its maximum at 100 mg·kg−1 and increased by 13.58% compared to that without a calcium addition. The plant height and basal diameter of Pinus sylvestris var. mongolica, Populus, and Morus alba reached their maximum at 100 mg·kg−1, 200 mg·kg−1, and 400 mg·kg−1, respectively, and increased by 19.69% and 5.24%, 17.94% and 25.91%, 43.37% and 45.76%, respectively, compared with no calcium addition. However, with the continuous increase in the calcium concentration, the plant height and basal diameter of the four planting plants gradually decreased, and the other three tree species, except Morus alba, were even lower than the control without calcium application under the treatment of 800 mg·kg−1 calcium concentration. It can be seen from the above results that the most suitable calcium concentration for the growth of the tree height and basal diameter of Pinus tabuliformis, Pinus sylvestris var. mongolica, Populus, and Morus alba was 100–200 mg·kg−1, 100 mg·kg−1, 200 mg·kg−1 and 400 mg·kg−1, respectively.
The total biomass of the seedlings of these four species also showed a trend that first increased and then decreased with the increase in the exogenous calcium concentration (Table 1). The highest total biomass was observed in Pinus tabuliformis, Pinus sylvestris var. mongolica, Populus, and Morus alba at calcium concentrations of 100 mg·kg−1, 100 mg·kg−1, 200 mg·kg−1, and 400 mg·kg−1, respectively. These values were found to be 65.34 g, 81.73 g, 33.54 g, and 46.75 g, respectively, indicating a significant increase of 10.43%, 17.29%, 17.31%, and 94.87% compared to the control without calcium treatment. However, the total biomass of Pinus tabuliformis, Pinus sylvestris var. mongolica, and Populus declined to its lowest value at a calcium concentration of 800 mg·kg−1, which was found to be 39.96 g, 27.49 g, and 25.15 g, respectively. This was 32.47%, 60.55%, and 12.03% lower compared to no calcium application (p < 0.05).

3.3. Effect of Exogenous Calcium on Photosynthetic Characteristics of Seedlings of Four Tree Species

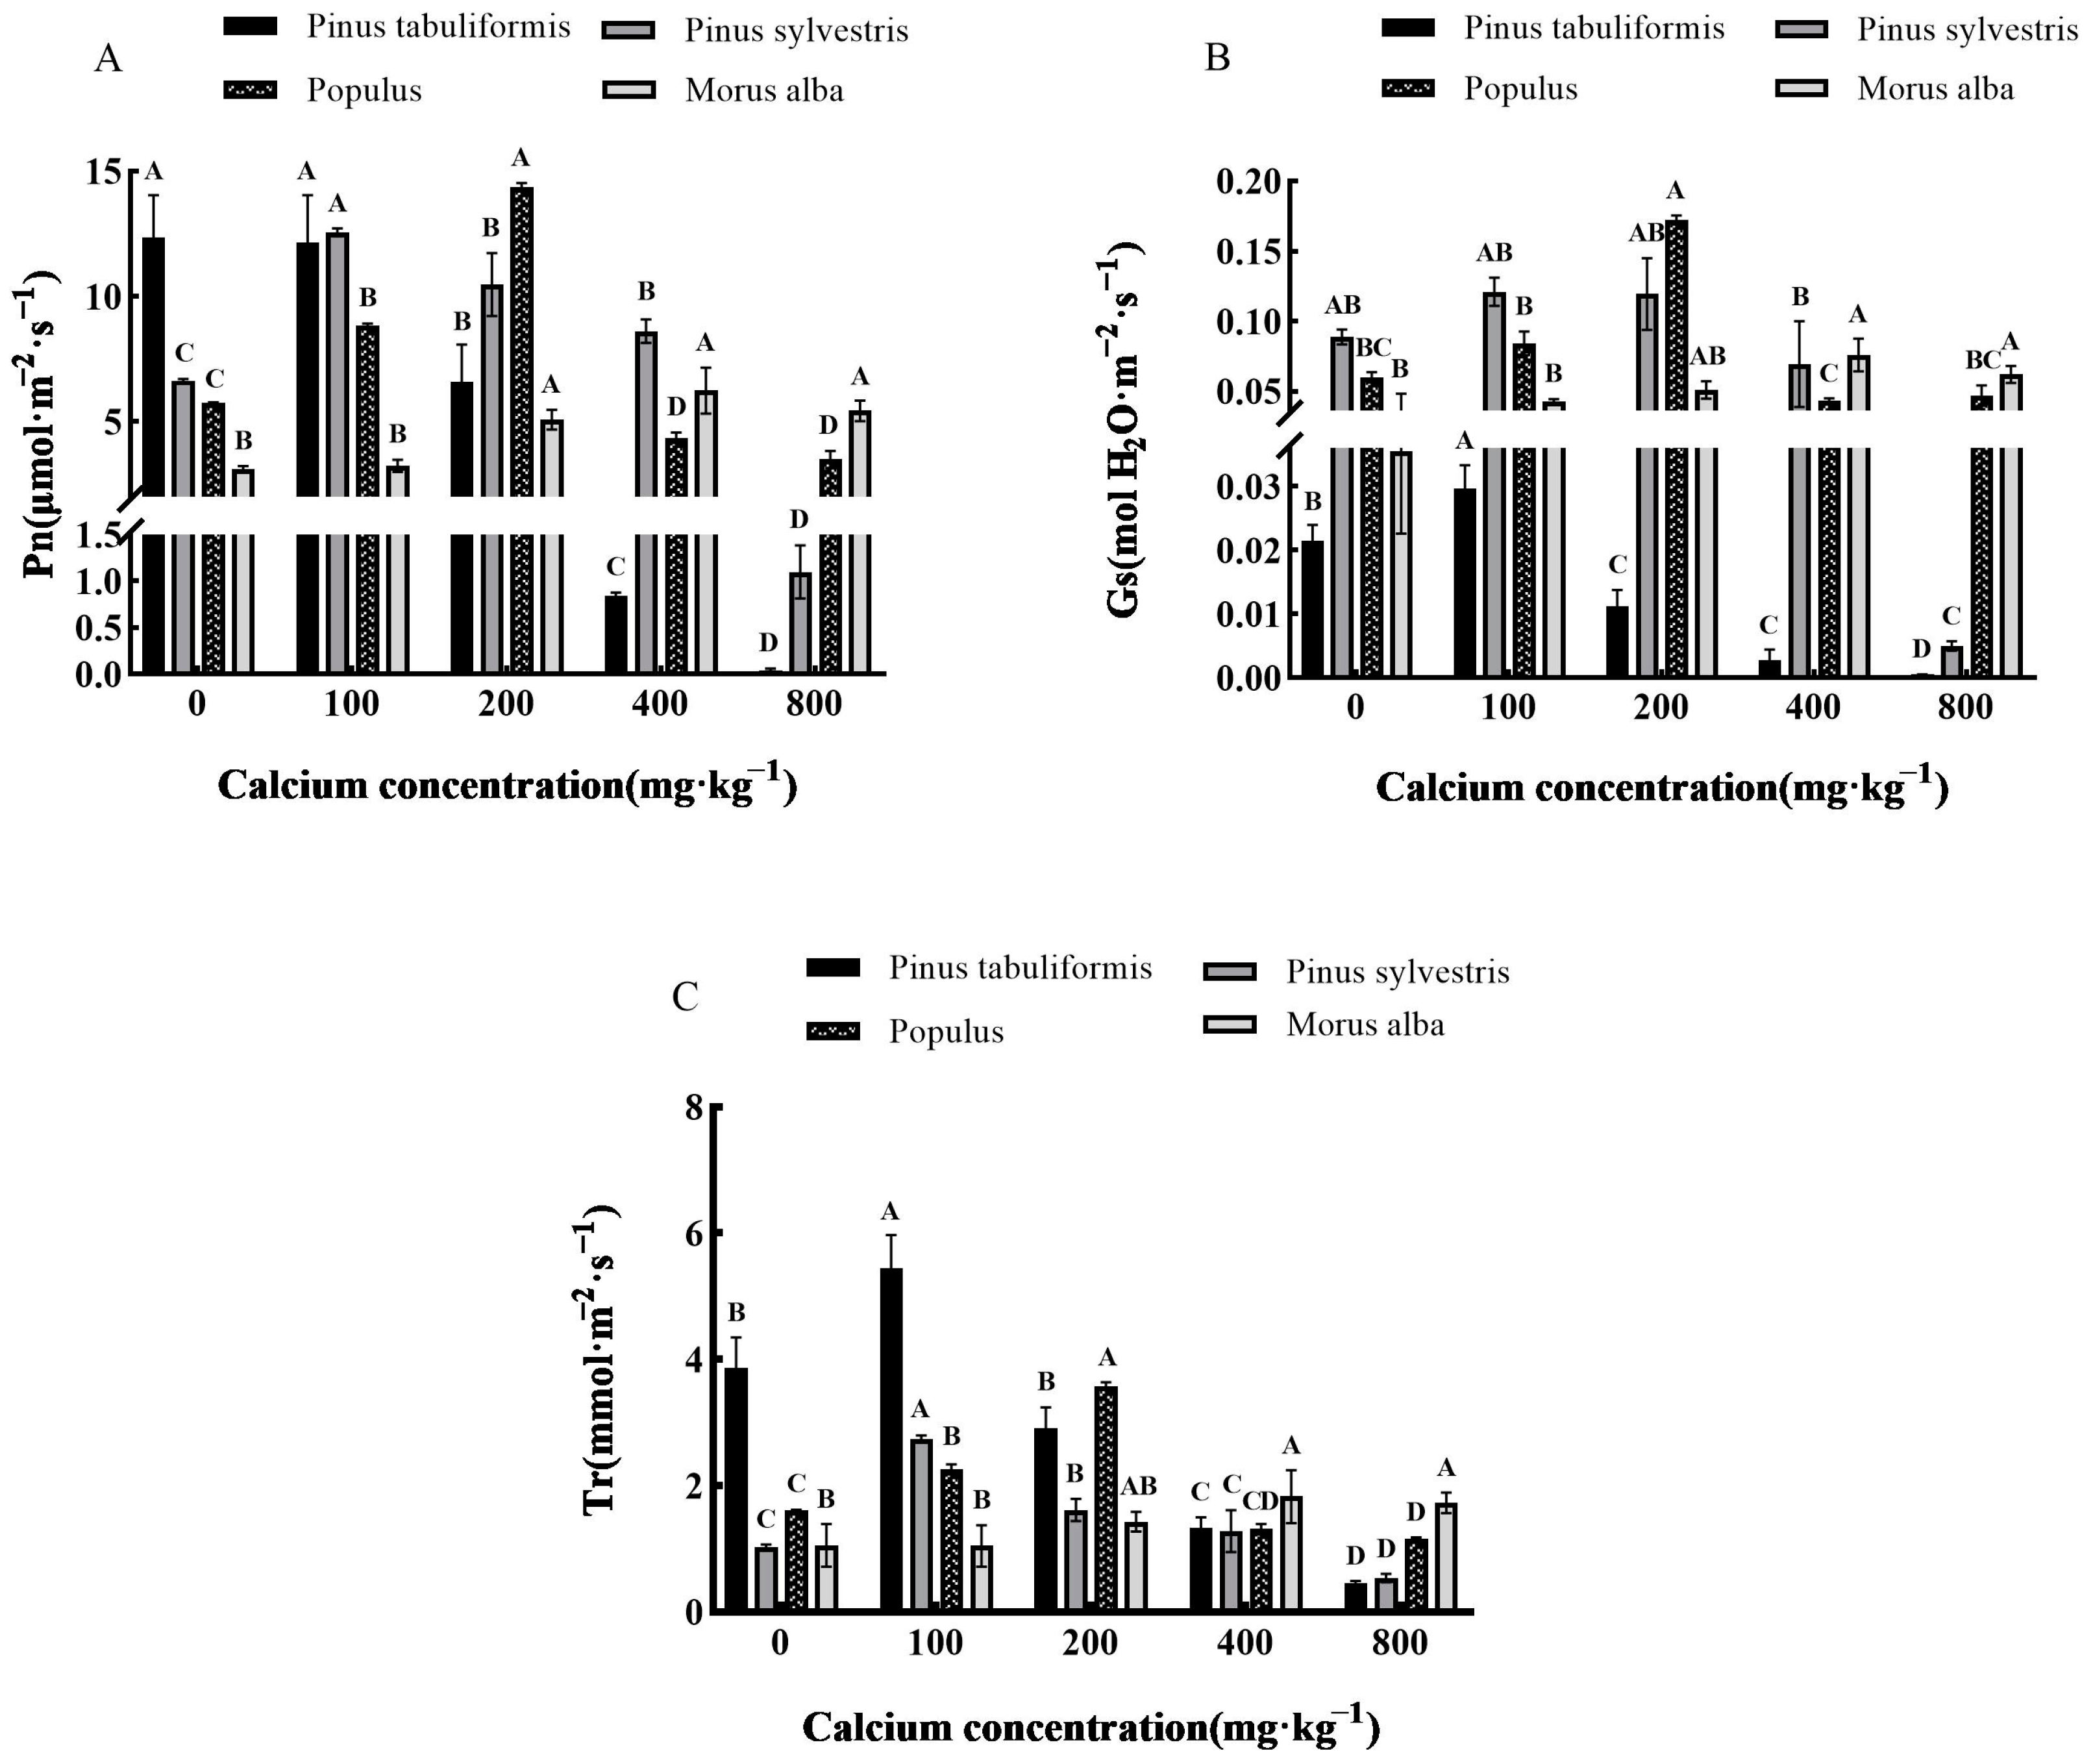
3.3.1. Effect of Exogenous Calcium on Photosynthetic Parameters of Seedlings of Four Tree Species

Overall, different concentrations of calcium treatments had significant effects (p < 0.05) on all the indicators of photosynthetic parameters of Pinus tabuliformis, Pinus sylvestris var. mongolica, Populus, and Morus alba seedlings, which first increased and then decreased with increasing exogenous calcium concentrations (Figure 3A–C).
However, the net photosynthetic rate of Pinus tabuliformis in the seedlings gradually decreased with an increase in the calcium concentration. The treatment of 100–800 mg·kg−1 calcium concentration decreased by 1.38%, 46.60%, 93.19%, and 99.68% compared with the treatment without calcium. Its stomatal conductance and transpiration rate showed a trend that first increased and then decreased after applying calcium, and both reached the maximum value when the calcium concentration was 100 mg·kg−1, which was 0.03 mol·m−2·s−1 and 5.45 molH2O·m−2·s−1, respectively, and increased by 42.86% and 41.19% compared with the treatment without calcium. The photosynthetic index of Pinus sylvestris var. mongolica, Populus, and Morus alba seedlings expanded first and then reduced with the increase in the calcium concentration and reached the maximum value when the calcium concentration was 100 mg·kg−1, 200 mg·kg−1, and 400 mg·kg−1, respectively. Under the treatment of 100 mg·kg−1 of the calcium concentration, the net photosynthetic rate of Pinus sylvestris var. mongolica seedlings reached 12.55 μmol·m−2·s−1, stomatal conductance reached 0.12 molH2O·m−2·s−1, and the transpiration rate reached 2.75 mmol·m−2·s−1. When the calcium concentration was 800 mg·kg−1, the photosynthetic index was 1.09 μmol·m−2·s−1, 0.005 molH2O·m−2·s−1, 0.54 mol·m−2·s−1, and decreased by 83.58%, 94.44%, and 47.06%, respectively, compared with those without calcium application. The net photosynthetic rate, stomatal conductance, and transpiration rate of Populus seedlings reached the maximum at 200 mg·kg−1, which was 14.36 μmol·m−2·s−1, 0.17 molH2O·m−2·s−1 and 3.58 mol·m−2·s−1, respectively. When the calcium concentration was 800 mg·kg−1, its photosynthetic index decreased to the lowest value, which was 3.49 μmol·m−2·s−1, respectively, 0.05 molH2O·m−2·s−1 and 1.16 mmol·m−2·s−1, respectively. Compared with that without calcium, it increased and decreased by 149.74% and 39.30%, 183.33% and 16.67%, 122.36% and 27.95%, respectively. The net photosynthetic rate of Morus alba reached 6.24 μmol·m−2·s−1 when the calcium concentration was 400 mg·kg−1, stomatal conductance was 0.076 molH2O·m−2·s−1, the transpiration rate was 1.83 mmol·m−2·s−1, and all reached the maximum value, which increased by 100.64%, 117.14%, and 72.64%, respectively, compared to that without calcium.
The above results show that when the calcium concentrations were 0–100 mg·kg−1, 100 mg·kg−1, 200 mg·kg−1, and 400 mg·kg−1, respectively, the photosynthesis of the seedlings of the four tree species could be best promoted, and these calcium concentrations were the most suitable calcium concentrations for the photosynthesis of the four tree species.

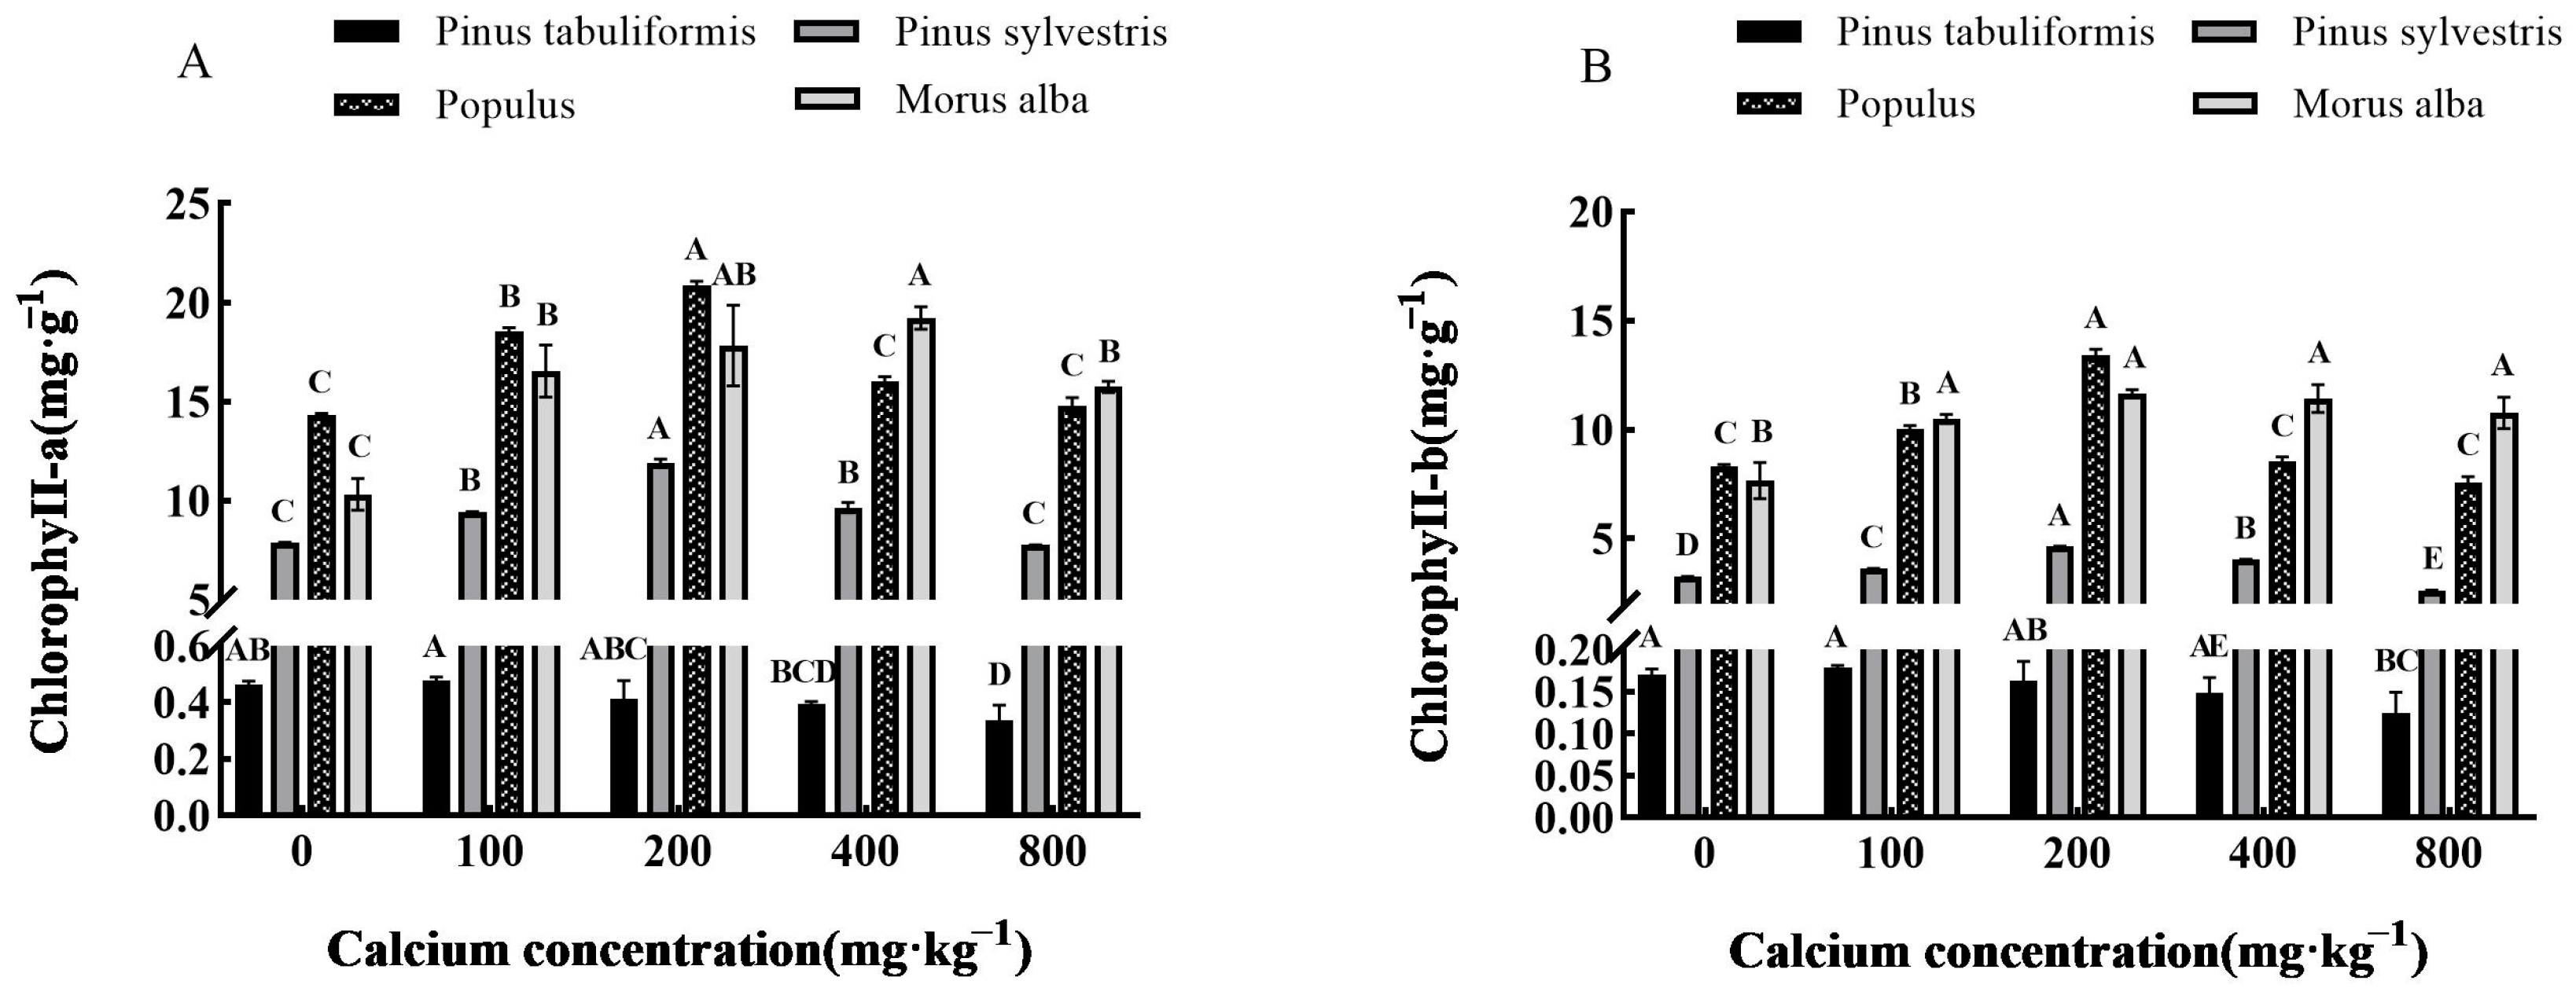
3.3.2. Effect of Exogenous Calcium on Photosynthetic Pigments of Seedlings of Four Tree Species

Overall, the levels of chlorophyll a and chlorophyll b present in the leaves of Pinus tabuliformis, Pinus sylvestris var. mongolica, Populus, and Morus alba seedlings demonstrated a trend of initially increasing followed by a decrease with rising concentrations of calcium (Figure 4A,B). The highest concentrations of Chlorophyll a and chlorophyll b were observed at calcium concentrations of 100 mg·kg−1, 200 mg·kg−1, 200 mg·kg−1, and 200–400 mg·kg−1, respectively, which were shown to be significantly different from other treatments (p < 0.05).
The levels of chlorophyll a and chlorophyll b in the leaves of Pinus tabuliformis seedlings exhibited a 3.24% and 5.29% increase, respectively, when treated with the 100 mg·kg−1 calcium concentration relative to those without calcium treatment, reaching their maximum value. Subsequently, their levels gradually decreased with an increase in the concentration of calcium. The highest levels of chlorophyll a and chlorophyll b in Pinus sylvestris var. mongolica seedlings were achieved with 200 mg·kg−1 of calcium concentration. This resulted in a remarkable 50.57% increase in chlorophyll a content and a 42.77% increase in chlorophyll b content compared to those without calcium application. In the case of Populus seedlings, the content of chlorophyll a and chlorophyll b was highest under the 200 mg·kg−1 calcium concentration treatment, with increases of 45.49% and 61.18%, respectively. This was in comparison to those without calcium application. The addition of calcium at 100 mg·kg−1, 200 mg·kg−1, and 400 mg·kg−1 concentrations resulted in significant increases in the content of chlorophyll a and chlorophyll b in Morus alba seedling leaves (p < 0.05). Specifically, the content of chlorophyll a rose by 60.52%, 72.94%, and 86.32%, respectively, while the content of chlorophyll b increased by 36.95%, 52.22%, and 49.22%, respectively, compared to the control group without calcium. The highest levels of both chlorophyll a and chlorophyll b were observed at 400 mg·kg−1 and 200 mg·kg−1 concentrations of calcium.

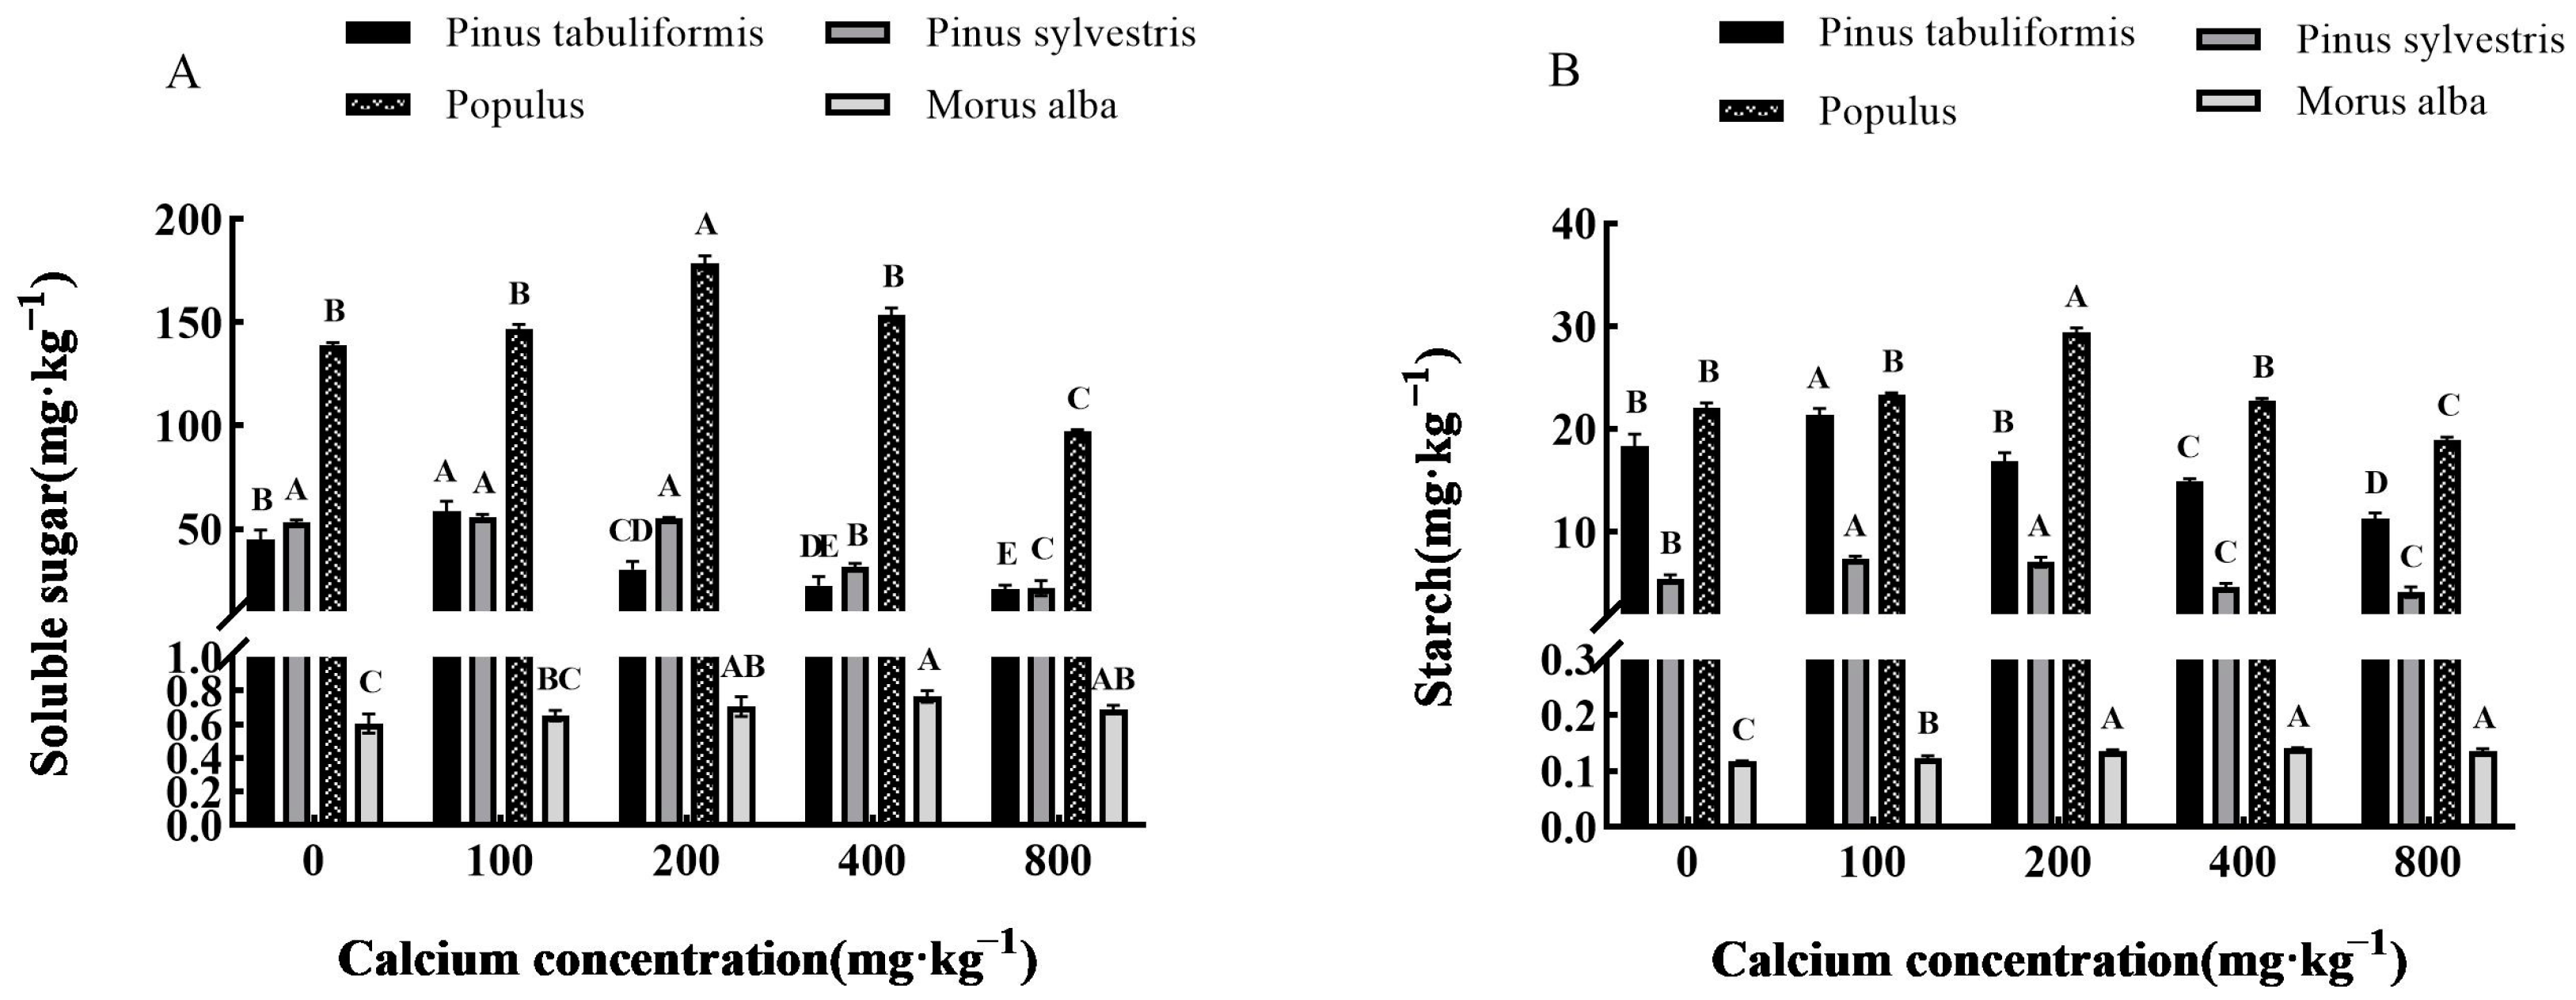
3.3.3. Effect of Exogenous Calcium on Photosynthetic Products of Seedlings of Four Tree Species

Generally, the levels of soluble sugar and starch, the photosynthetic products of Pinus tabuliformis, Pinus sylvestris var. mongolica, Populus, and Morus alba seedlings, followed a pattern of increasing and then decreasing in response to varying levels of calcium concentration (Figure 5A,B). The maximum values were observed at calcium concentrations of 100 mg·kg−1, 100 mg·kg−1, 200 mg·kg−1, and 400 mg·kg−1 for Pinus tabuliformis, Pinus sylvestris var. mongolica, Populus, and Morus alba, respectively, which were significantly different from other treatments (p < 0.05).
When the calcium concentration was 100 mg·kg−1, the soluble sugar and starch contents of Pinus tabuliformis seedlings were 58.53 mg·kg−1 and 21.39 mg·kg−1, respectively. These values increased by 30.24% and 16.25%, respectively, compared to the calcium concentration of 0 mg·kg−1. However, as the calcium concentration increased, a gradual decrease in these values was observed. At a calcium concentration of 800 mg·kg−1, the values decreased by 70.87% and 38.64% compared to the calcium concentration of 0 mg·kg−1. The Pinus sylvestris var. mongolica seedlings had a maximum soluble sugar and starch content of 55.65 mg·kg−1 and 7.35 mg·kg−1, respectively, at a calcium concentration of 100 mg·kg−1. This represented a 4.51% and 35.36% increase, respectively, compared to the calcium concentration of 0 mg·kg−1. The soluble sugar and starch contents of Populus were significantly reduced by 59.69% and 23.20% (p < 0.05), respectively, when treated with a calcium concentration of 800 mg·kg−1 compared to 0 mg·kg−1. The treatment with a calcium concentration of 200 mg·kg−1 resulted in the maximum soluble sugar and starch content for Populus, at 178.96 mg·kg−1 and 29.47 mg·kg−1, respectively. This represented an increase of 28.99% and 33.29% compared to the 0 mg·kg−1 calcium concentration. In contrast, the soluble sugar and starch content of the 800 mg·kg−1 calcium treatment decreased by 30.02% and 14.02% compared to the 0 mg·kg−1 calcium treatment. For Morus alba seedlings, the maximum content of soluble sugar and starch occurred at a calcium concentration of 400 mg·kg−1, with levels of 0.766 mg·kg−1 and 0.142 mg·kg−1, respectively. These levels were 26.40% and 20.34% higher than those observed at a 0 mg·kg−1 calcium concentration. When the calcium concentration increased to 800 mg·kg−1, its value decreased to 0.690 mg·kg−1 and 0.136 mg·kg−1, respectively.

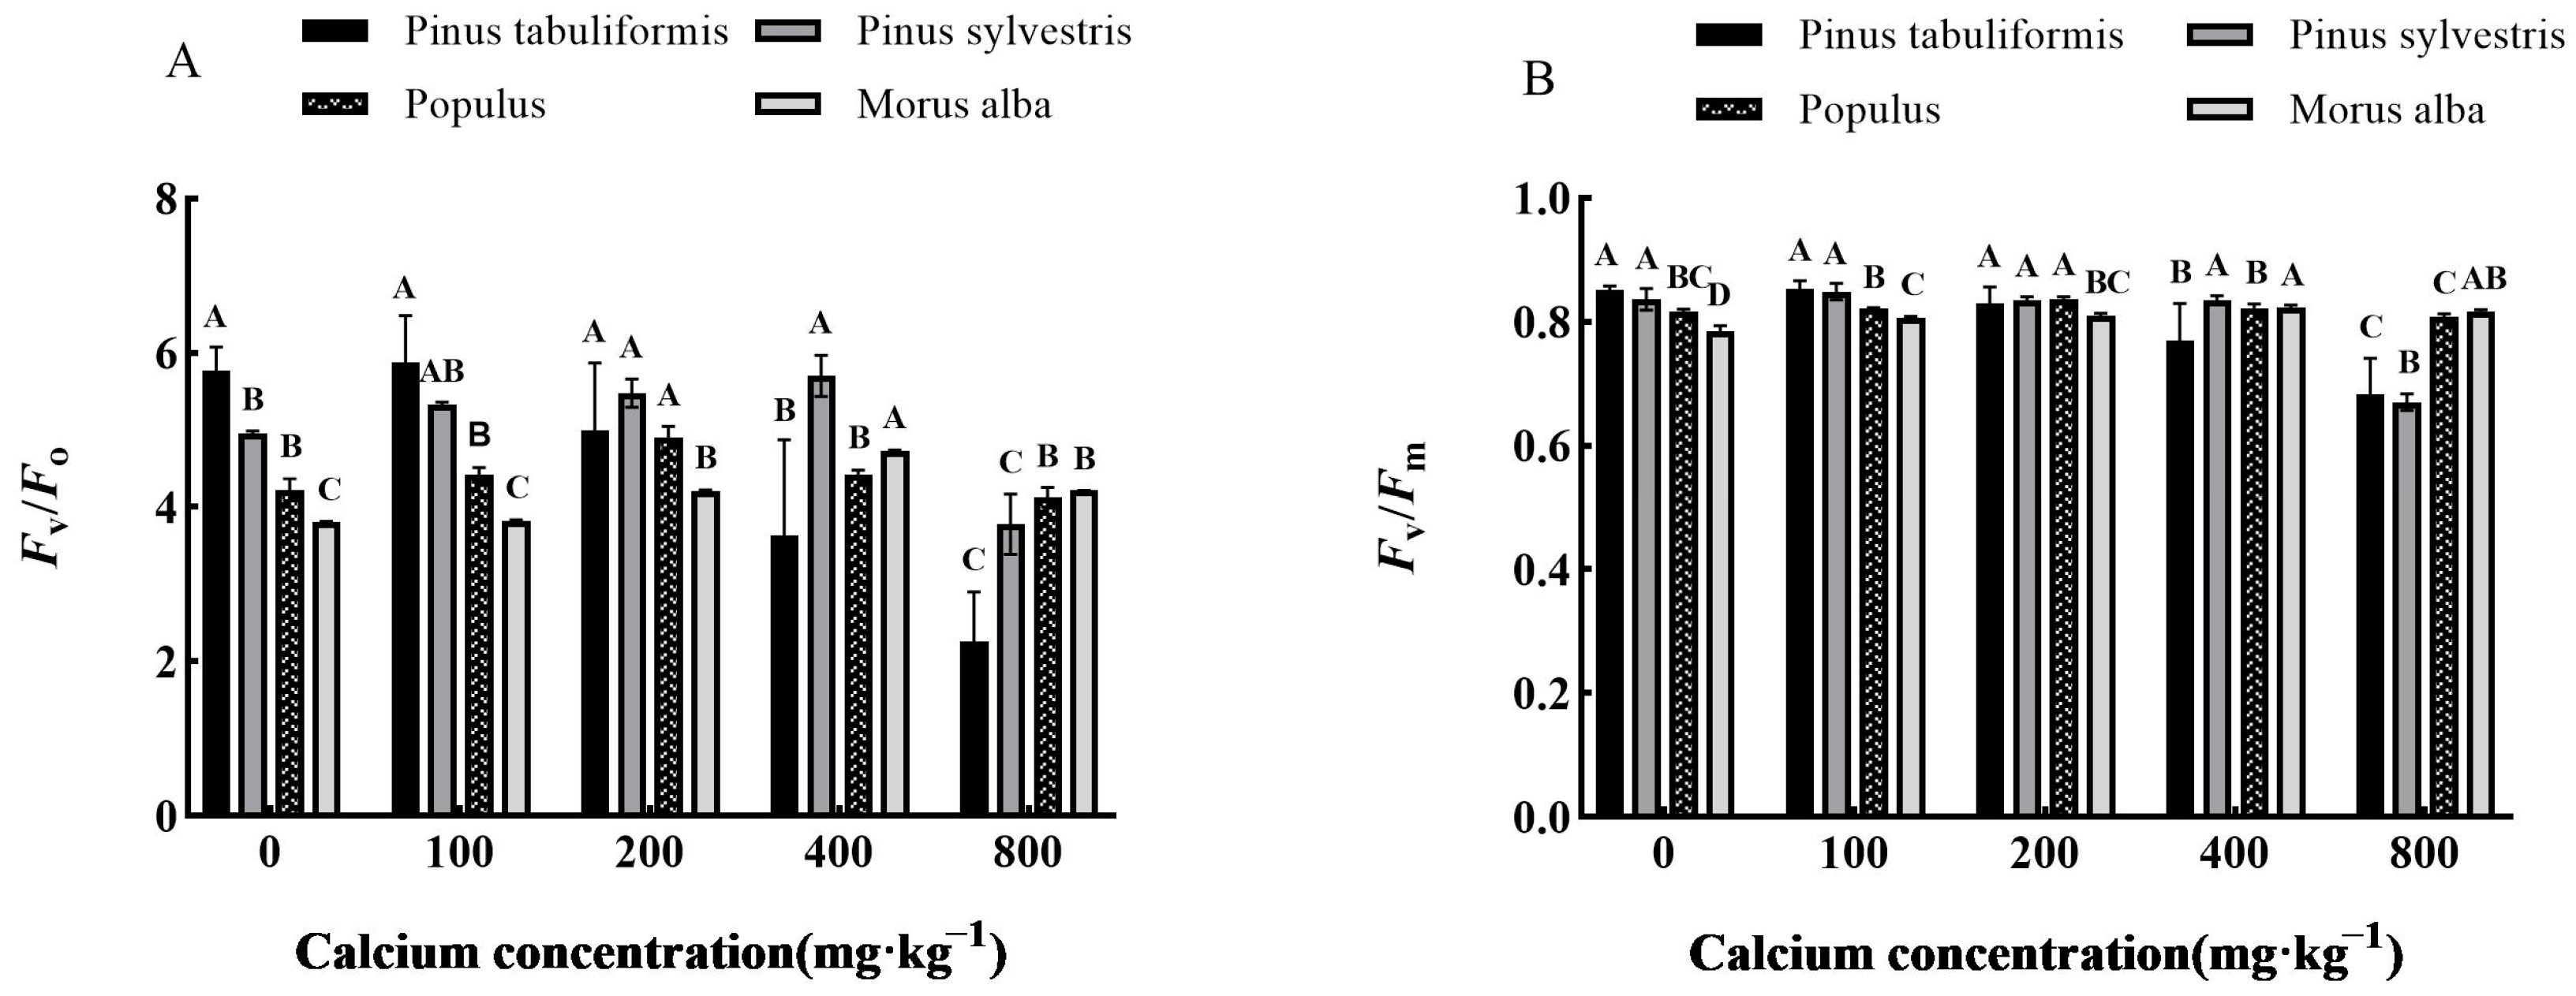
3.4. Effect of Exogenous Calcium on Chlorophyll Fluorescence of Seedlings of Four Tree Species

Generally, as the concentration of calcium increased, there was a trend that first increased and then decreased in the chlorophyll fluorescence parameters of Pinus tabuliformis, Pinus sylvestris var. mongolica, Populus, and Morus alba seedlings (Figure 6A,B). The maximum value was achieved when the calcium concentration was 100 mg·kg−1, 100–400 mg·kg−1, 200 mg·kg−1, and 400 mg·kg−1, respectively, which showed significant differences from the other treatments (p < 0.05).
The Fv/Fo and Fv/Fm values of Pinus tabuliformis seedlings were observed to reach their maximum at a calcium concentration of 100 mg·kg−1. Specifically, the Fv/Fo value increased by 1.91%, and the Fv/Fm value increased by 0.23% when compared to the values obtained without the presence of calcium. These values were found to be 5.88 and 0.854, respectively. However, when the calcium concentration exceeded 400 mg·kg−1, the Fv/Fm value of Pinus tabuliformis seedlings dropped below 0.8. The Fv/Fo value of Pinus sylvestris var. mongolica seedlings reached its peak at a calcium concentration of 400 mg·kg−1, with a maximum value of 5.70—a remarkable 14.92% increase from the value without calcium. Similarly, the maximum Fv/Fm value of 0.849 was achieved at a lower calcium concentration of 100 mg·kg−1, showing a 1.56% improvement over the absence of calcium. However, as the calcium concentration increased to 800 mg·kg−1, the Fv/Fm value dropped to 0.671. The Fv/Fo and Fv/Fm values of Populus seedlings exhibited noticeable peaks at a calcium concentration of 200 mg·kg−1, with Fv/Fo reaching 4.91 and Fv/Fm achieving 0.836—a significant 16.35% and 2.33% improvement, respectively, compared to the values without calcium. The Fv/Fo value of Morus alba seedlings peaked at a calcium concentration of 400 mg·kg−1, with a value of 4.73. This was a significant increase of 24.15% when compared to values without calcium (p < 0.05). Additionally, the Fv/Fm value initially registered at 0.786 in the absence of calcium. However, after the application of various exogenous calcium concentrations, the Fv/Fm value increased and then decreased, ultimately ranging between 0.8 and 0.84. The maximum value of 0.823 was achieved through a calcium treatment of 400 mg·kg−1.

3.5. Effect of Exogenous Calcium on the Stress Resistance of Seedlings of Four Tree Species

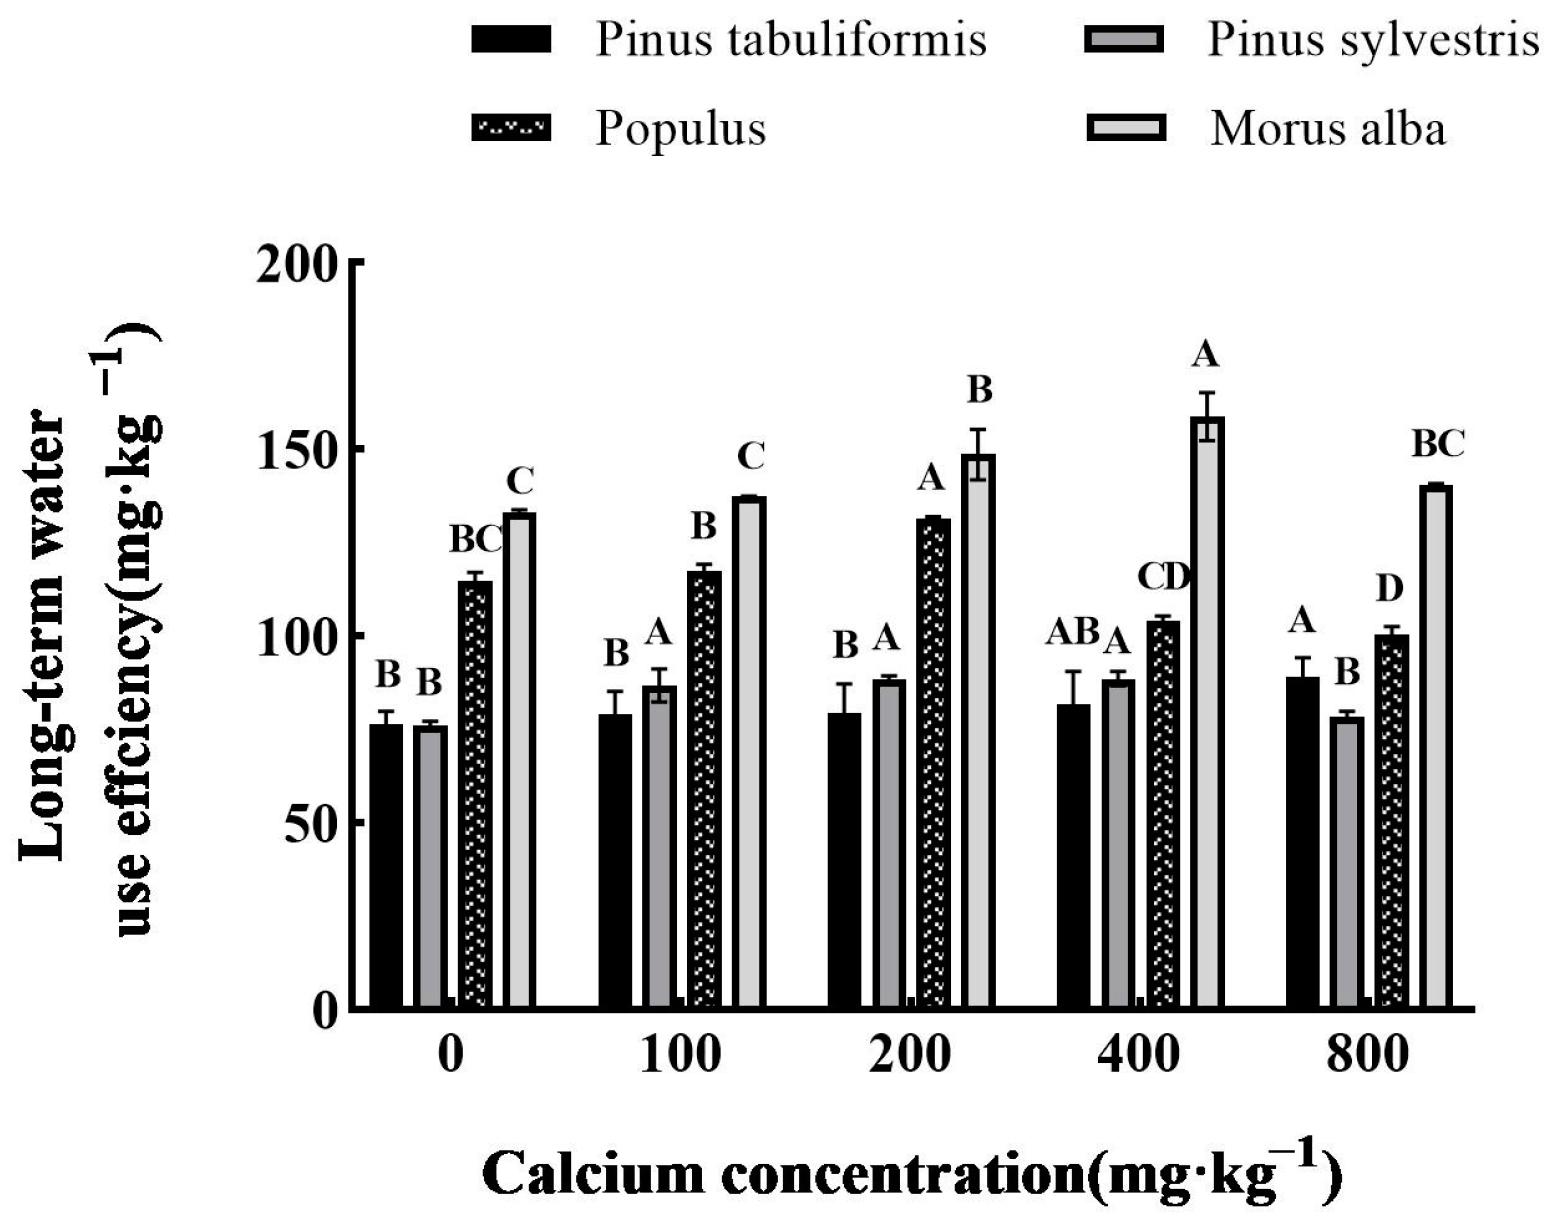
3.5.1. Effect of Exogenous Calcium on Water Use Efficiency of Seedlings of Four Tree Species

In general, the long-term water use efficiency (WUEL) of Pinus tabuliformis seedlings showed a continuous increase in their calcium concentration. However, for Pinus sylvestris var. mongolica, Populus, and Morus alba seedlings, the long-term water use efficiency first increased and then decreased as the calcium concentration increased (Figure 7).
The long-term water use efficiency of Pinus tabuliformis seedlings substantially increased after making use of the exogenous calcium in contrast to that without calcium (p < 0.05). When the calcium concentration was 800 mg·kg−1, its water use efficiency reached a maximum value of 89.25 mg·kg−1, which was 16.61% greater than that without calcium. The long-term water use efficiency of Pinus sylvestris var. mongolica, Populus, and Morus alba seedlings reached its maximum value when the calcium concentration was 400 mg·kg−1, 200 mg·kg−1, and 400 mg·kg−1, respectively, which improved by means of 16.32%, 14.28%, and 19.13% in contrast to that without a calcium application. Overall, the long-term water use efficiency of the four tree species reached a maximum at 800 mg·kg−1, 400 mg·kg−1, 200 mg·kg−1, and 400 mg·kg−1, respectively.

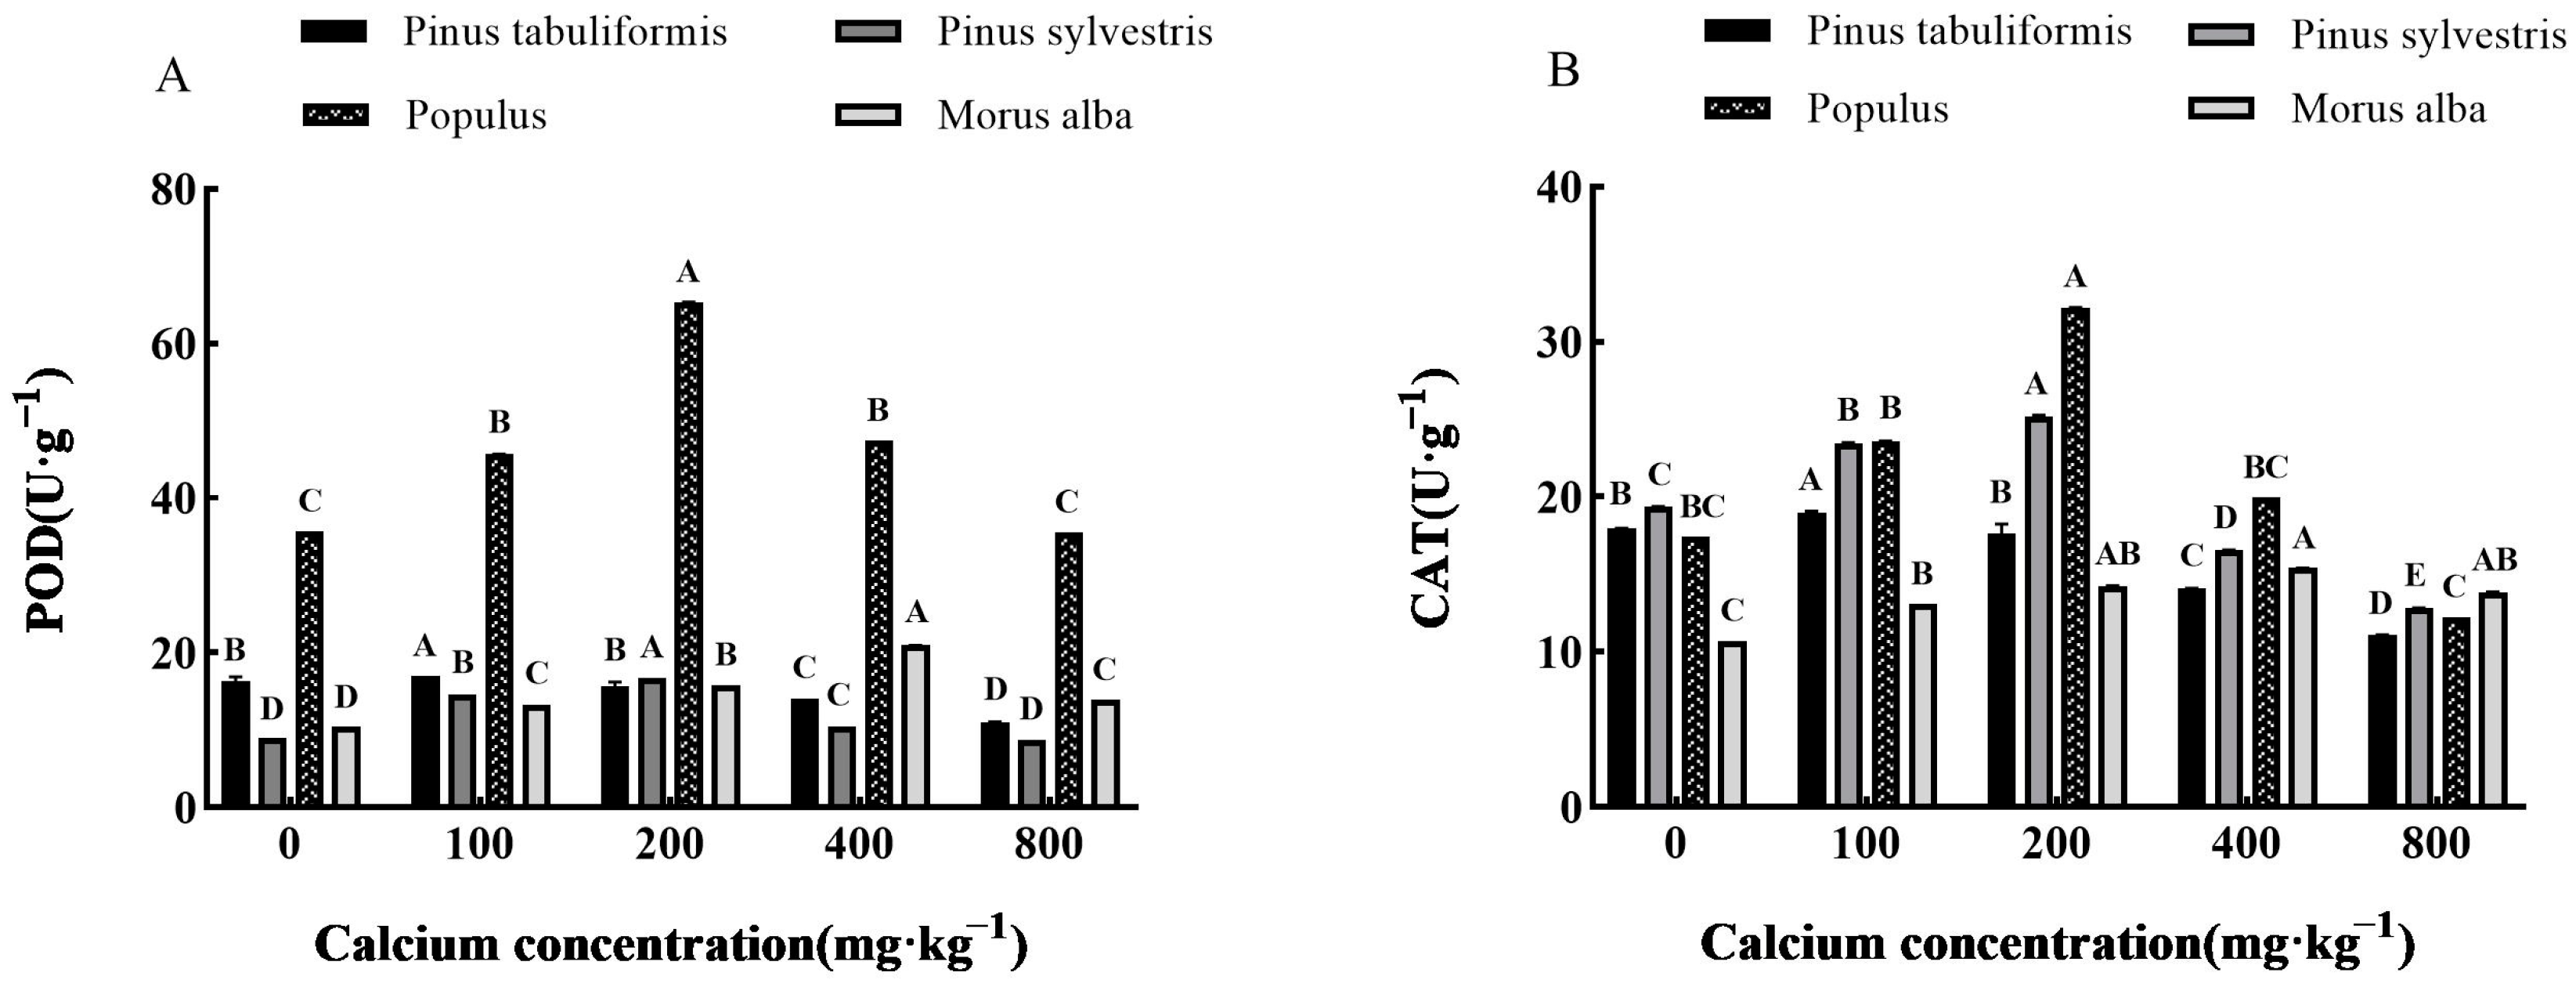
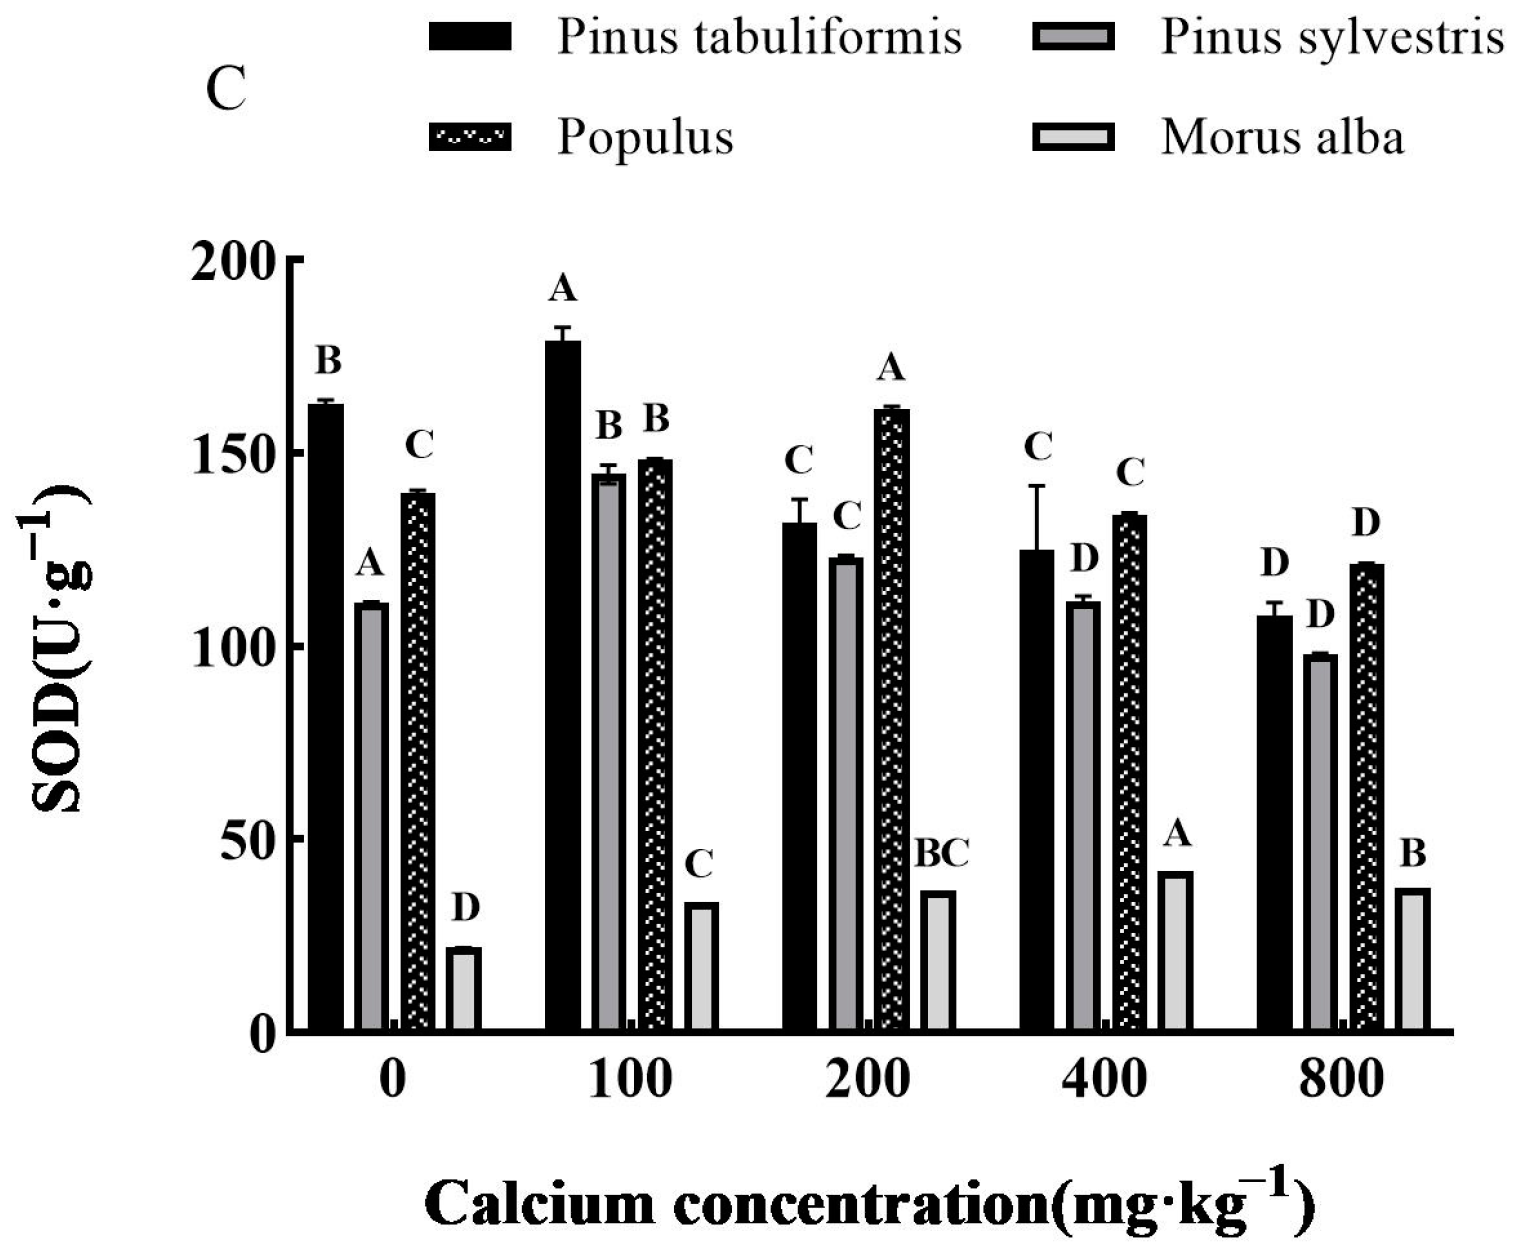
3.5.2. Effect of Exogenous Calcium on Antioxidant Enzyme Activities of Seedlings of Four Tree Species

Overall, the antioxidant enzyme activities of Pinus tabuliformis, Pinus sylvestris var. mongolica, Populus, and Morus alba seedlings showed a trend that increased and then decreased with a growing calcium concentration (Figure 8A–C), achieving maximum values at 100 mg·kg−1, 100–200 mg·kg−1, 200 mg·kg−1 and 400 mg·kg−1, respectively, with significant differences from other treatments (p< 0.05).
The activities of POD, CAT, and SOD in Pinus tabuliformis seedlings peaked at a calcium concentration of 100 mg·kg−1, showing increases of 4.10%, 5.69%, and 10.13%, respectively, over the concentration of 0 mg·kg−1. Meanwhile, in Pinus sylvestris var. mongolica seedlings, the maximum activities of POD and CAT were recorded at a calcium concentration of 200 mg·kg−1, with an increase of 29.98% and 85.08%, respectively, compared to no calcium addition. Similarly, the maximum SOD activity occurred at a concentration of 100 mg·kg−1 calcium, showing a 29.65% increase over no calcium addition. Populus seedlings also exhibited their maximum POD, CAT, and SOD activities under the 200 mg·kg−1 calcium treatment, with increases of 83.03%, 84.36%, and 15.57%, respectively, compared to no addition of calcium. Finally, the activities of POD, CAT, and SOD in Morus alba seedlings reached their peak values when subjected to a calcium concentration of 400 mg·kg−1, showing increases of 100.38%, 44.06%, and 89.59%, respectively, when compared to a concentration of 0 mg·kg−1.

4. Discussion

4.1. There Is an Optimum Calcium Concentration for Plant Growth

Ca2+ is an important nutrient and a signaling molecule that regulates plant growth and development [28]. Previous studies have demonstrated that treatment with 10 mmol·L−1 CaCl2 significantly increases the biomass of Zoysia japonica and cucumber [29,30]. Moreover, the foliar application of Ca2+ promotes peanut growth and improves the quality of sweet cherries [31,32,33]. However, calcium deficiency inhibits the growth and development of Pinus massoniana and navel orange seedlings, causing needle withering and death in Pinus massoniana and reduced plant height in navel orange [34,35]. This is likely due to calcium being a necessary nutrient for building cell walls and membrane structures; therefore, calcium deficiency prevents the formation of new cell walls, leading to impaired cell division and formation. Additionally, calcium deficiency can lead to lysine degradation, acid accumulation, and potential physiological disorders, thereby inhibiting plant growth [36,37,38]. On the other hand, excessive Ca2+ can cause a reduction in tomato leaf size and plant biomass [39], as well as inhibit the growth of Fragaria vesca seedlings and reduce root elongation [40]. This is possible because excessive calcium disrupts normal biochemical and nutrient metabolism in plants, affecting their morphology and internal structure, and high concentrations of calcium ions can cause cellular toxicity and abnormal plant development [41,42]. Consistent with previous studies, this research showed that optimal external calcium concentrations for the height, basal diameter, and total biomass of Pinus tabuliformis, Pinus sylvestris var. mongolica, Populus, and Morus alba seedlings were 100–200 mg·kg−1, 100 mg·kg−1, 200 mg·kg−1, and 400 mg·kg−1, respectively. However, when the external calcium concentration was too high or too low, it produced a significant inhibitory effect. These findings indicate that there is an optimal calcium concentration for the growth of plant seedlings.
Plants cannot grow and develop without photosynthesis; photosynthesis is crucial to ensure the cellular homeostasis necessary for normal plant development [43]. Chlorophyll fluorescence parameters are instrumental in describing the photosynthetic functioning and physiological status of plants. They are commonly used to investigate the correlation between a plant’s photosynthetic activities and its environmental conditions [44]. The measurement of these parameters can help identify the adaptation mechanisms of plants in stressful environments. An Fv/Fm ratio of less than 0.8 indicated that a plant was under stress, leading to severe growth and developmental restrictions [22,45,46]. The maximum photochemical efficiency (Fv/Fm) of Fraxinus mandshurica Rupr. was less than 0.8 in both unapplied calcium and Ca2+ concentrations above 400 mg·kg−1 [10]. When excessive calcium was applied, the photosynthetic capacity of poplar seedlings was weakened, and the chlorophyll content of Parachlorella kessleri was significantly inhibited. [22,47]. This could be due to the chemical reaction of excess calcium in the cells with phosphate substances, producing impurities such as precipitates that interfere with phosphorus metabolism and other related processes, resulting in blocked calcium signaling and ultimately affecting plant photosynthesis and respiration [48]. It has been found that the optimum calcium concentrations that promote photosynthesis in Quercus acutissima Carruth. and Fraxinus mandshurica Rupr. are 200–400 mg·kg−1 and 200 mg·kg−1, respectively [7,10]. In the present study, the photosynthesis of seedlings of Pinus tabuliformis, Pinus sylvestris var. mongolica, Populus, and Morus alba reached their maximum at exogenous calcium concentrations of 0–100 mg·kg−1, 100–400 mg·kg−1, 200 mg·kg−1 and 200–400 mg·kg−1, respectively, and was significantly inhibited when the exogenous calcium concentration was too high or too low. This indicates that there was also an optimum calcium concentration for the photosynthesis of plant seedlings.
Environmental stress can lead to an increase in the production of reactive oxygen species (ROS) compared to the number produced under normal metabolic processes [49,50]. These ROS usually comprise hydrogen peroxide (H2O2), superoxide ( O 2 ), and hydroxyl radicals (OH) [51]. Plants have innate defense mechanisms to neutralize the overproduction of ROS, including enzymatic (SOD, POD, CAT, etc.) and non-enzymatic (glutathione, proline, carotenoids, tocopherols, etc.) antioxidants [52]. Furthermore, leaf water use efficiency is crucial for determining the optimal water supply requirements for plant growth and development [53,54]. This efficiency represents the efficiency of water consumption in generating organic matter during plant physiological activities and can be used to assess the impact of environmental factors on plants. Plant species that exhibit high water use efficiency values often thrive in low water availability environments [55]. Xu et al. [56] found that exogenous calcium application under salt stress conditions increased the activities of POD, CAT, and SOD in Calligonum mongolicum, with enzyme activity reaching a maximum at a 10 mM calcium concentration, showing a more significant enhancement compared to 5 mM and 20 mM calcium concentrations. Li et al. [9] found that the peak of water use efficiency of Mongolian pine in dark brown soil appeared at the 200 mg·kg−1 calcium treatment, which was significantly higher than that at 100 mg·kg−1 and 800 mg·kg−1 calcium treatments. This was consistent with our research results, where the antioxidant enzyme activity of Pinus tabuliformis, Pinus sylvestris var. mongolica, Populus, and Morus alba seedlings reached its peak at calcium concentrations of 100, 100–200, 200, and 400 mg·kg−1, respectively. The promoting effect of low or high calcium treatments was lower than that at these concentrations, and the same phenomenon was observed for water use efficiency. This indicated that there existed an optimal calcium concentration for improving plant resistance.
In conclusion, adequate calcium can promote plant growth by promoting photosynthesis and improving plant stress resistance; therefore, there is an optimal calcium concentration during plant growth.

4.2. Different Plants Have Different Optimal Calcium Concentrations

Our study found that there was an optimal calcium concentration for the growth of seedlings in all four tree species, with different tree species having different optimal calcium concentrations. Broad-leaved tree species require more calcium than coniferous tree species. Pinus sylvestris var. mongolica had its highest POD and CAT activity at a calcium concentration of 200 mg·kg−1, while SOD activity reached its peak at a calcium concentration of 100 mg·kg−1. This difference could be related to the complexity of their physiological functions. In an experiment testing the effects of different storage temperatures and times on the antioxidant enzyme activity of mad tree seeds, Gao et al. [57] found that the interaction between storage temperature and time did not significantly affect CAT activity but had a significant effect on POD and SOD activity. Glusac et al. [58] measured relatively high SOD activity and low CAT activity in houseleeks (Sempervivum tectorum L.) after one month of drought treatment. The indicators of tree height, Pn for Pinus tabuliformis, and Fv/Fo for Pinus sylvestris var. mongolica also exhibited similar situations. Their optimal calcium concentration values were not uniform, which could be caused by differences in seedling growth processes or the complexity of physiological functions. However, growth was promoted at a concentration of 100 mg·kg−1 for all species. Therefore, based on the comprehensive measurements of all indicators, the optimal calcium concentrations for the growth of Pinus tabuliformis, Pinus sylvestris var. mongolica, Populus, and Morus alba were 100, 100, 200, and 400 mg·kg−1, respectively. The author provided a hypothesis that this occurrence might be attributed to the distinct functional traits of various plants and their diverse responses to alterations in resources. This theory is supported by previous studies [59,60,61,62]. When vegetation is deficient in calcium, cell walls cannot be formed, affecting cell division and formation and additionally making ginseng much less resistant to adversity [63]. Calcium over-treatment can, to some extent, provide a motive injury to the membrane structure of the photosynthetic system, leading to blockage of the electron transport chain and reduced light energy use efficiency in tea leaves, hence affecting the boom of new tea leaves [64]. The dissimilar features of needle and broad-leaved tree species that employ resources may account for this difference. Broadleaf species show traits of “rapid growth” leaves, featuring a high specific leaf area and a low leaf carbon-to-nitrogen ratio. On the other hand, conifer species exhibit typical “slow growing” characteristics with a low specific leaf area and a high carbon-to-nitrogen ratio [61,65,66]. This “fast” strategy offers the advantage of the efficient use of abundant resources, enabling plants to outcompete those following the “slow” strategy. On the other hand, this “slow” strategy facilitates survival under conditions of limited resources and low growth capacity [61,67,68,69]. Similar to our findings, numerous studies have reported that different concentrations of calcium produce varying effects on plant growth and that an optimal calcium concentration exists for optimal plant growth. For instance, the optimal calcium concentration for Mongolian pine seedlings grown in dark brown soil is 100–200 mg·kg−1 [9]. Guo et al. [70] also discovered that supplementing 10 mmol·L−1 of exogenous calcium chloride under salt stress had a beneficial effect on the growth and photosynthetic characteristics of Gleditsia sinensis. Among the different calcium application treatments ranging from 0 to 12 g·plant−1 CaCl2, the 9 g·plant−1 treatment resulted in the highest levels of chlorophyll and soluble protein contents in the leaves of Ilex rotunda Thunb, according to Zhang’s [71] findings. It is evident that in afforestation production activities, selecting different afforestation tree species based on their calcium needs and applying appropriate concentrations of calcium fertilizer to regulate their growth for optimal growth effects is crucial.
Calcium plays a significant role in plant growth and development processes, and future research can investigate the physiological, biochemical, and molecular mechanisms of calcium in the growth and development processes of different tree species using more experiments to explore the differences in calcium requirements. It is hoped that this can provide a theoretical basis for improving the productivity of plantation forests, promoting economic development, and maintaining ecosystem stability.

5. Conclusions

In conclusion, the optimum calcium concentration required for the growth of the four tree species was determined, and the difference of the optimum calcium among the tree species was found. Pinus tabuliformis, Pinus sylvestris var. mongolica, Populus, and Morus alba exhibited maximum growth at exogenous calcium concentrations of 100 mg·kg−1, 100 mg·kg−1, 200 mg·kg−1, and 400 mg·kg−1, respectively. Furthermore, this study found that broadleaf and conifer species have different calcium requirements, with Morus alba exhibiting the highest requirement, followed by Populus and then Pinus sylvestris var. mongolica and Pinus tabuliformis. It is important to note that excess calcium in tree seedlings can lead to stress and inhibit growth and development.

Author Contributions

H.L.: Conceptualization, Investigation, Methodology, Visual-Ization, Writing—review and editing. Y.Z. (Yaoyao Zhao): Data analysis and sorting, testing, writing—original draft, cultivating seedlings. X.W.: Cultivating seedlings, Writing—review and editing. Y.Z. (Yongbin Zhou), Conceptualization, Methodology. S.Z.: Methodology. L.L.: Methodology. J.P.: Methodology, Writing—review and editing; Conceptualization. All authors have read and agreed to the published version of the manuscript.

Funding

This research was supported by the National Natural Science Foundation of China-Research (No. 3170030160, No. 41450007, No. 31800364, No. 31400611) and the Doctoral research start-up fund (No. 880416020).

Data Availability Statement

The data provided in this study are available from the authors upon request.

Conflicts of Interest

The authors declare no conflict of interest.

References

  1. Bai, R.; Bai, C.; Han, X.; Liu, Y.; Yong, J.W.H. The significance of calcium-sensing receptor in sustaining photosynthesis and ameliorating stress responses in plants. Front. Plant Sci. 2022, 13, 1019505. [Google Scholar] [CrossRef] [PubMed]
  2. Yang, S.; Wang, F.; Guo, F.; Meng, J.; Li, X.; Wan, S. Calcium contributes to photoprotection and repair of photosystem II in peanut leaves during heat and high irradiance. J. Integr. Plant Biol. 2015, 57, 486–495. [Google Scholar] [CrossRef] [PubMed]
  3. Zhou, W.; Wang, H. Physiological and molecular mechanisms of calcium uptake, transport and metabolism in plants. Bot. Bull. 2007, 6, 762–778. [Google Scholar]
  4. Kadota, Y.; Furuichi, T.; Ogasawara, Y.; Goh, T.; Higashi, K.; Muto, S.; Kuchitsu, K. Identification of putative voltage-dependent Ca2+-permeable channels involved in cryptogein-induced Ca2+ transients and defense responses in tobacco BY-2 cells. Biochem. Biophys. Res. Commun. 2004, 317, 823–830. [Google Scholar] [CrossRef] [PubMed]
  5. Aras, S.; Keles, H.; Bozkurt, E. Physiological and histological responses of peach plants grafted onto different rootstocks under calcium deficiency conditions. Sci. Hortic. 2021, 281, 109967. [Google Scholar] [CrossRef]
  6. Blatt, M.R. Ca2+ signalling and control of guard-cell volume in stomatal movements. Curr. Opin. Plant Biol. 2000, 3, 196–204. [Google Scholar] [CrossRef] [PubMed]
  7. Han, F. The Optimum Concentration of Calcium of Quercus acutissima Carruth Seedlings and Its Effect on Growth and Physiology. Master’s Thesis, Shenyang Agricultural University, Shenyang, China, 2018. [Google Scholar]
  8. Huang, Y. Effect of Calcium on the Growth and Physiological Characteristics of Fig. Master’s Thesis, Nanjing Agricultural University, Nanjing, China, 2019. [Google Scholar] [CrossRef]
  9. Li, H.; Li, X.; Zhang, G.; Weng, X.; Huang, S.; Zhou, Y.; Zhang, S.; Liu, L.; Pei, J. The Optimum Calcium Concentration for Seedling Growth of Mongolian Pine (Pinus Sylvestris Var. Mongolica) Under Different Soil Types in Northern Semi-Arid Areas of China. Front. Environ. Sci. 2022, 10, 812. [Google Scholar] [CrossRef]
  10. Ren, C.; Li, H.; Weng, S.; Zhang, S.; Liu, L.; Zhou, Y. Effect of exogenous calcium on growth, photosynthetic characteristics and water use efficiency of Fraxinus mandshurica. J. Shenyang Agric. Univ. 2020, 6, 663–669. [Google Scholar]
  11. Zhang, Y.L. Study on Leaf Functional Traits of Eight European Conifer and Broadleaved Seedlings. Master’s Thesis, China Academy of Forestry Science, Beijing, China, 2020. [Google Scholar] [CrossRef]
  12. Wang, Y.; Li, R.; Xia, J.; Wang, T. Economic value of mulberry tree and its application in ecological conservation. China Mark. 2017, 11, 239–240. [Google Scholar] [CrossRef]
  13. Ahmed, A.K.M.; Fu, Z.; Ding, C.; Jiang, L.; Han, X.; Yang, A.; Ma, Y.; Zhao, X. Growth and wood properties of a 38-year-old Populus simonii × P. nigra plantation established with different densities in semi-arid areas of northeastern China. J. For. Res. 2020, 31, 497–506. [Google Scholar] [CrossRef]
  14. Li, Z. An analysis of the causes and definition criteria of forest degradation in the Three Northern Protected Forests in Liaoning Province. Liaoning For. Sci. Technol. 2021, 4, 51–53. [Google Scholar]
  15. Xu, J. Problems and countermeasures of the Three Northern Protective Forests in Liaoning Province. Mod. Agric. 2021, 1, 94–95. [Google Scholar] [CrossRef]
  16. Zhou, H.; Chen, Y.; Zhu, C.; Li, Z.; Fang, G.; Li, Y.; Fu, A. Climate change may accelerate the decline of desert riparian forest in the lower Tarim River, Northwestern China: Evidence from tree-rings of Populus euphratica. Ecol. Indic. 2020, 111, 105997. [Google Scholar] [CrossRef]
  17. Guo, M.; Gao, G.; Ding, G.; Zhang, Y. Drivers of Ectomycorrhizal Fungal Community Structure Associated with Pinus sylvestris var. mongolica Differ at Regional vs. Local Spatial Scales in Northern China. Forests 2020, 11, 323. [Google Scholar] [CrossRef] [Green Version]
  18. Zhao, Y.; Cai, L.; Jin, Y.; Li, J.; Cui, D.; Chen, Z. Warming-drying climate intensifies the restriction of moisture on radial growth of Pinus tabuli-formis plantation in semi-arid area of Northeast China. Ying Yong Sheng Tai Xue Bao J. Appl. Ecol. 2021, 32, 3459–3467. [Google Scholar] [CrossRef]
  19. Zhou, Y.; Zou, X. From matching site with trees towards matching calcium with trees. J. Nanjing For. Univ. Nat. Sci. Ed. 2017, 60, 1–8. [Google Scholar] [CrossRef]
  20. Xie, X. Soil and Plant Nutrition Experiments; Zhejiang University Press: Hangzhou, China, 2014. [Google Scholar]
  21. Li, H.; Huang, S.; Ren, C.; Weng, X.; Zhang, S.; Liu, L.; Pei, J. Optimal exogenous calcium alleviates the damage of Snow-melting agent to Salix matsudana seedlings. Front. Plant Sci. 2022, 13, 928092. [Google Scholar] [CrossRef]
  22. Weng, X.; Li, H.; Ren, C.; Zhou, Y.; Zhu, W.; Zhang, S.; Liu, L. Calcium Regulates Growth and Nutrient Absorption in Poplar Seedlings. Front. Plant Sci. 2022, 13, 887098. [Google Scholar] [CrossRef]
  23. Zhao, S.J. The Experimental Guide for Plant Physiology, 3rd ed.; China Agriculture Press: Beijing, China, 2002. [Google Scholar]
  24. Chen, G.; Li, S. Plant Physiology Experiment; Higher Education Press: Beijing, China, 2016; pp. 2–63. [Google Scholar]
  25. Song, L.; Zhu, J.; Yan, Q.; Li, M.; Yu, G. Comparison of intrinsic water use efficiency between different aged Pinus sylvestris var. mongolica wide windbreaks in semiarid sandy land of northern China. Agrofor. Syst. 2015, 89, 477–489. [Google Scholar] [CrossRef]
  26. Perveen, S.; Saeed, M.; Parveen, A.; Javed, M.; Zafar, S.; Iqbal, N. Modulation of growth and key physiobiochemical attributes after foliar application of zinc sulphate (ZnSO4) on wheat (Triticum aestivum L.) under cadmium (Cd) stress. Physiol. Mol. Biol. Plants 2020, 26, 1787–1797. [Google Scholar] [CrossRef]
  27. Sheng, L.; Sun, X.; Mo, C.; Hao, M.; Wei, X.; Ma, A. Relationship between antioxidant enzymes and sclerotial formation of Pleurotus tuber-regium under abiotic stress. Appl. Microbiol. Biotechnol. 2023, 107, 1391–1404. [Google Scholar] [CrossRef] [PubMed]
  28. Zhang, X.; Ma, C.; Sun, L.; Hao, F. Roles and mechanisms of Ca2+ in regulating primary root growth of plants. Plant Signal. Behav. 2020, 15, 1748283. [Google Scholar] [CrossRef] [PubMed]
  29. Xu, C.; Li, X.; Zhang, L. The effect of calcium chloride on growth, photosynthesis, and antioxidant responses of Zoysia japonica under drought conditions. PLoS ONE 2013, 8, e68214. [Google Scholar] [CrossRef] [PubMed]
  30. Wang, X.; Lan, Z.; Tian, L.; Li, J.; Yang, G.; Gao, Y.; Zhang, X. Change of Physiological Properties and Ion Distribution by Synergistic Effect of Ca2+ and Grafting under Salt Stress on Cucumber Seedlings. Agronomy 2021, 11, 848. [Google Scholar] [CrossRef]
  31. Liu, Y.; Han, X.; Zhan, X.; Yang, J.; Wang, Y.; Song, Q.; Chen, X. Regulation of Calcium on Peanut Photosynthesis Under Low Night Temperature Stress. J. Integr. Agric. 2013, 12, 2172–2178. [Google Scholar] [CrossRef]
  32. Song, Q.; Liu, Y.; Pang, J.; Yong, J.; Chen, Y.; Bai, C.; Lambers, H. Supplementary Calcium Restores Peanut (Arachis hypogaea) Growth and Photosynthetic Capacity Under Low Nocturnal Temperature. Front. Plant Sci. 2019, 10, 1637. [Google Scholar] [CrossRef] [Green Version]
  33. Correia, S.; Queirós, F.; Ribeiro, C.; Vilela, A.; Aires, A.; Barros, A. Effects of calcium and growth regulators on sweet cherry (Prunus avium L.) quality and sensory attributes at harvest. Sci. Hortic. 2019, 248, 231–240. [Google Scholar] [CrossRef]
  34. Hu, W.; Liu, J.; Liu, T.; Zhu, C.; Wu, F.; Jiang, C.; Zheng, H. Exogenous calcium regulates the growth and development of Pinus massoniana detecting by physiological, proteomic, and calcium-related genes expression analysis. Plant Physiol. Biochem. 2023, 196, 1122–1136. [Google Scholar] [CrossRef]
  35. Zhang, Y.; Ma, J.; Guan, G.; Yao, F.; Zhou, G.; Liu, G. Effect of calcium and magnesium deficiency on growth and mineral nutrient uptake distribution of navel orange seedlings. Jiangsu Agric. Sci. 2023, 4, 171–179. [Google Scholar] [CrossRef]
  36. Xing, Y.; Zhu, Z.; Wang, F.; Zhang, X.; Li, B.; Liu, Z.; Wu, X. Role of calcium as a possible regulator of growth and nitrate nitrogen metabolism in apple dwarf rootstock seedlings. Sci. Hortic. 2021, 276, 109740. [Google Scholar] [CrossRef]
  37. Činčerová, A. Effect of calcium deficiency on L-lysine-α-ketoglutarate aminotransferase in wheat plants. Z. Pflanzenphysiol. 1976, 80, 348–353. [Google Scholar] [CrossRef]
  38. Liu, Y.; Riaz, M.; Yan, L.; Zeng, Y.; Cuncang, J. Boron and calcium deficiency disturbing the growth of trifoliate rootstock seedlings (Poncirus trifoliate L.) by changing root architecture and cell wall. Plant Physiol. Biochem. 2019, 144, 345–354. [Google Scholar] [CrossRef] [PubMed]
  39. Hao, X.; Papadopoulos, A. Effects of calcium and magnesium on plant growth, biomass partitioning, and fruit yield of winter greenhouse tomato. HortScience 2004, 39, 512–515. [Google Scholar] [CrossRef] [Green Version]
  40. Wu, Z. Effect and Mechanism of High Calcium on Seedlings and Fruits in Fragaria vesca. Master’s Thesis, Guizhou Normal University, Guizhou, China, 2022. [Google Scholar]
  41. Conn, S.; Gilliham, M.; Athman, A.; Schreiber, A.; Baumann, U.; Moller, I. Cell-specific vacuolar calcium storage mediated by CAX1 regulates apoplastic calcium concentration, gas exchange, and plant productivity in Arabidopsis. Plant Cell 2011, 23, 240–257. [Google Scholar] [CrossRef] [Green Version]
  42. Cybulska, J.; Zdunek, A.; Konstankiewicz, K. Calcium effect on mechanical properties of model cell walls and apple tissue. J. Food Eng. 2011, 102, 217–223. [Google Scholar] [CrossRef]
  43. Soares, C.; Pereira, R.; Martins, M.; Tamagnini, P.; Serôdio, J.; Moutinho-Pereira, J.; Fidalgo, F. Glyphosate-dependent effects on photosynthesis of Solanum lycopersicum L.—An ecophysiological, ultrastructural and molecular approach. J. Hazard. Mater. 2020, 398, 122871. [Google Scholar] [CrossRef] [PubMed]
  44. Zhao, Y.; Wu, M.; Deng, P.; Zhou, X.; Huang, S. Effect of salt stress on growth and chlorophyll fluorescence parameters of seedlings of Luo Han Guo. Fruit Trees South China 2021, 2, 103–107. [Google Scholar] [CrossRef]
  45. Peng, J.; Feng, Y.; Wang, X.; Li, J.; Xu, G.; Phonenasay, S. Effects of nitrogen application rate on the photosynthetic pigment, leaf fluorescence characteristics, and yield of indica hybrid rice and their interrelations. Sci. Rep. 2021, 11, 7485. [Google Scholar] [CrossRef]
  46. Zheng, E.; Zhang, C.; Qi, Z.; Zhang, Z. The effects of different water and nitrogen methods on fluorescence characteristic and growth of rice in black soil region on Songnen plain, northeast China. Agric. Res. 2021, 10, 665–674. [Google Scholar] [CrossRef]
  47. Liu, X.; Zhao, J.; Nan, F.; Liu, Q.; Lv, J.; Feng, J.; Xie, S. Transcriptome Analysis Reveals the Mechanisms of Tolerance to High Concentrations of Calcium Chloride Stress in Parachlorella kessleri. Int. J. Mol. Sci. 2022, 24, 651. [Google Scholar] [CrossRef]
  48. Li, X.; Zhang, G.; Li, H.; Sun, Y.; Huo, Y.; Huang, S.; Zhou, Y. Effect of exogenous calcium on the growth and physiological characteristics of sandy camphor pine seedlings. Soil Bull. 2021, 5, 1095–1103. [Google Scholar] [CrossRef]
  49. Mittler, R. Abiotic stress, the field environment and stress combination. Trends Plant Sci. 2006, 11, 15–19. [Google Scholar] [CrossRef]
  50. Hu, S.; Li, Y.; Wang, W.; Jiao, J.; Kou, M.; Yin, Q.; Xu, H. The antioxidation-related functional structure of plant communities: Understanding antioxidation at the plant community level. Ecol. Indic. 2017, 78, 98–107. [Google Scholar] [CrossRef]
  51. Zeng, H.; Tang, Q.; Hua, X. Arabidopsis brassinosteroid mutants det2-1 and bin2-1 display altered salt tolerance. J. Plant Growth Regul. 2010, 29, 44–52. [Google Scholar] [CrossRef]
  52. Melorose, J.; Perroy, R.; Careas, S. Brassinosteriods: A Class of Plant Hormone. Statewide Agricultural Land Use Baseline; Cambridge University Press: Cambridge, UK, 2015. [Google Scholar] [CrossRef]
  53. Song, F.; Wu, Z.; Yu, T.; Shi, Y.; Zhuo, Z.; Luo, Q. Seasonal variation in carbon isotope composition and WUEi correspond with weather factors for five cultivars of Chinese jujube in Xinjiang. J. Fruit Trees 2012, 1, 66–70. [Google Scholar] [CrossRef]
  54. Yan, C.; Han, X.; Chen, L.; Huang, J.; Su, B. Foliar δ13C Within Temperate Deciduous Forest: Its Spatial Change and Interspecies Variation. J. Integr. Plant Biol. 1998, 40, 9. [Google Scholar]
  55. Ma, C.; Gao, Y.; Guo, H.; Wang, J. Photosynthesis, transpiration, and water use efficiency of Caragana microphylla, C. intermedia, and C. korshinskii. Photosynthetica 2004, 42, 65–70. [Google Scholar] [CrossRef]
  56. Xu, D.; Wang, W.; Gao, T.; Fang, X.; Gao, X.; Li, J.; Mu, J. Calcium alleviates decreases in photosynthesis under salt stress by enhancing antioxidant metabolism and adjusting solute accumulation in Calligonum mongolicum. Conserv. Physiol. 2017, 5, cox060. [Google Scholar] [CrossRef] [Green Version]
  57. Gao, S.; Yan, R.; Chen, F. Effects of different storage temperatures and times on germination and antioxidant responses of Jatropha curcas seeds. J. Agric. Sci. Technol. 2015, 17, 1619–1628. [Google Scholar]
  58. Glusac, J.; Morina, F.; Veljovic-Jovanovic, S.; Boroja, M.; Kukavica, B. Changes in the antioxidative metabolism induced by drought and Cd excess in the leaves of houseleek (Sempervivum tectorum L.). Fresenius Environ. Bull. 2013, 22, 1770–1776. [Google Scholar]
  59. Chapin, F.S., III. The mineral nutrition of wild plants. Annu. Rev. Ecol. Syst. 1980, 11, 233–260. [Google Scholar] [CrossRef]
  60. Westoby, M.; Wright, I. Land-plant ecology on the basis of functional traits. Trends Ecol. Evol. 2006, 21, 261–268. [Google Scholar] [CrossRef] [PubMed]
  61. Reich, P.B. The world-wide ‘fast–slow’ plant economics spectrum: A traits manifesto. J. Ecol. 2014, 102, 275–301. [Google Scholar] [CrossRef]
  62. Luo, Y.; Hu, H.; Zhao, M.; Li, H.; Liu, S.; Fang, J. Latitudinal pattern and the driving factors of leaf functional traits in 185 shrub species across eastern China. J. Plant Ecol. 2019, 12, 67–77. [Google Scholar] [CrossRef]
  63. Yang, Z. Study on the Effect of Calcium on the Growth and Development of Ginseng. Master’s Thesis, Chinese Academy of Agricultural Sciences, Beijing, China, 2015. [Google Scholar]
  64. Wang, Y.; Zhang, L.; Sun, Q. Effect of calcium excess on photosynthetic properties and chloroplast ultrastructure of tea plants. J. Plant Nutr. Fertil. 2010, 2, 432–438. [Google Scholar]
  65. Reich, P.; Ellsworth, D.; Walters, M.; Vose, J.; Gresham, C.; Volin, J. Generality of Leaf Trait Relationships: A Test across Six Biomes. Ecology 1999, 80, 1955–1969. [Google Scholar] [CrossRef]
  66. Salguero-Gómez, R. Applications of the fast–slow continuum and reproductive strategy framework of plant life histories. New Phytol. 2017, 213, 1618–1624. [Google Scholar] [CrossRef]
  67. Grime, J. Plant Strategies and Vegetation Processes Vegetation Processes; John Wiley and Sons, Ltd.: Hoboken, NJ, USA, 1979. [Google Scholar]
  68. Craine, J. Resource strategies of wild plants. In Resource Strategies of Wild Plants; Princeton University Press: Princeton, NJ, USA, 2009. [Google Scholar] [CrossRef]
  69. Damián, X.; Ochoa-López, S.; Gaxiola, A.; Fornoni, J.; Domínguez, C.; Boege, K. Natural selection acting on integrated phenotypes: Covariance among functional leaf traits increases plant fitness. New Phytol. 2020, 225, 546–557. [Google Scholar] [CrossRef] [Green Version]
  70. Guo, Y.; Liu, Y.; Zhang, Y.; Liu, J.; Gul, Z.; Guo, X. Effects of exogenous calcium on adaptive growth, photosynthesis, ion homeostasis and phenolics of Gleditsia sinensis Lam. plants under salt stress. Agriculture 2021, 11, 978. [Google Scholar] [CrossRef]
  71. Zhang, G. Effect of exogenous calcium on physiological characteristics of iron holly seedlings at high temperature. Green Technol. 2022, 19, 76–79. [Google Scholar] [CrossRef]
Figure 1. Effect of exogenous calcium on calcium content in leaves of seedlings for different tree species. Note: Every column shows the average value ± SE, n = 3. Different capital letters indicate significant differences between different treatments of the same tree species (p < 0.05).
Forests 14 01437 g001
Figure 2. Effect of exogenous calcium on seedling growth index for different tree species. Note: Every column shows the mean ± SE, n = 3. Different capital letters indicate significant differences between different treatments of the same tree species (p < 0.05). (A) Plant height; (B) Basal diameter.
Forests 14 01437 g002
Figure 3. Effect of exogenous calcium on photosynthetic parameters of seedlings for different tree species. Note: Every column shows the mean ± SE, n = 3. Different capital letters indicate significant differences between different treatments of the same tree species (p < 0.05). (A) Pn (Photosynthetic rate); (B) Gs (Stomatal conductivity); (C) Tr (Transpiration rate).
Forests 14 01437 g003
Figure 4. Effect of exogenous calcium on photosynthetic pigments of seedlings for different tree species. Note: Every column shows the mean ± SE, n = 3. Different capital letters indicate significant differences between different treatments of the same tree species (p < 0.05). (A) Chlorophyll a; (B) Chlorophyll b.
Forests 14 01437 g004
Figure 5. Effect of exogenous calcium on photosynthetic products of seedlings for different tree species. Note: Every column shows the mean ± SE, n = 3. Different capital letters indicate significant differences between different treatments of the same tree species (p < 0.05). (A) Soluble sugar; (B) Starch.
Forests 14 01437 g005
Figure 6. Effect of exogenous calcium on chlorophyll fluorescence of seedlings for different tree species. Note: Every column shows the mean ± SE, n = 3. Different capital letters indicate significant differences between different treatments of the same tree species (p < 0.05). (A) Fv/Fo (Potential photochemical efficiency). (B) Fv/Fm (Maximal photochemical efficiency).
Forests 14 01437 g006
Figure 7. Effect of exogenous calcium on long-term water use efficiency of seedlings for different tree species. Note: Every column shows the mean ± SE, n = 3. Different capital letters indicate significant differences between different treatments of the same tree species (p < 0.05).
Forests 14 01437 g007
Figure 8. Effect of exogenous calcium on antioxidant enzyme activities of seedlings for different tree species. Note: Every column shows the mean ± SE, n = 3. Different capital letters indicate significant differences between different treatments of the same tree species (p < 0.05). (A) SOD (Superoxide dismutase); (B) CAT (Catalase); (C) POD (Peroxidase).
Forests 14 01437 g008aForests 14 01437 g008b
Table 1. Effect of exogenous calcium on total biomass of seedlings for different tree species.
Calcium Concentration/mg·kg−1Pinus tabuliformis SeedlingsPinus sylvestris Var. mongolica SeedlingsPopulus SeedlingsMorus alba Seedlings
059.17 ± 0.35 B69.68 ± 0.70 C28.59 ± 0.08 C23.99 ± 0.82 D
10065.34 ± 0.72 A81.73 ± 0.04 A30.27 ± 0.17 B27.44 ± 0.40 BD
20053.74 ± 1.41 C75.21 ± 0.44 B33.54 ± 0.23 A30.26 ± 2.93 C
40045.07 ± 0.80 D45.38 ± 0.40 D28.46 ± 0.10 C46.75 ± 1.13 A
80039.96 ± 0.63 E27.49 ± 0.38 E25.15 ± 0.29 D35.15 ± 8.38 B
Note: The values in the table show the mean ± SE, n = 3. Different capital letters indicate significant differences between different treatments of the same tree species (p < 0.05).
Disclaimer/Publisher’s Note: The statements, opinions and data contained in all publications are solely those of the individual author(s) and contributor(s) and not of MDPI and/or the editor(s). MDPI and/or the editor(s) disclaim responsibility for any injury to people or property resulting from any ideas, methods, instructions or products referred to in the content.

