Article

Comparative Transcriptome Analysis between Embryogenic and Non-Embryogenic Callus of Davidia involucrata

College of Forestry, Northwest A&F University, Yangling 712100, China
*
Author to whom correspondence should be addressed.
These authors contributed equally to this work.
Forests 2023, 14(6), 1256; https://doi.org/10.3390/f14061256
Submission received: 24 April 2023 / Revised: 31 May 2023 / Accepted: 12 June 2023 / Published: 16 June 2023
(This article belongs to the Section Genetics and Molecular Biology)

Abstract

:
Davidia involucrata Baill. (D. involucrata), a rare and endangered wild plant, is native to China and is globally recognized as an ornamental tree species. However, D. involucrata exhibits inherent biological characteristics that contribute to its low reproductive efficiency. To address this challenge, somatic embryogenesis, a biotechnological method, offers numerous advantages, including enhanced reproductive efficiency, a large reproductive coefficient, and a complete structural composition. Consequently, somatic embryogenesis holds significant value in the propagation and genetic improvement of this particular tree species. In a previous study, we utilized immature zygotic embryos of D. involucrata as explants and induced somatic embryogenesis from embryogenic callus, thereby establishing a rapid propagation and plant regeneration scheme. In this study, we utilized Illumina RNA sequencing to compare the transcriptomes of the embryogenic callus (EC) and non-embryogenic callus (NEC) of D. involucrata. The analysis revealed 131,109 unigenes assembled from EC and NEC, and 12,806 differentially expressed genes (DEGs) were identified. To verify the authenticity of the transcriptome sequencing results, qRT-PCR was performed and 16 DEGs were screened, with the stable reference gene UBQ being selected. Our analysis focused on genes related to plant growth regulators and somatic embryogenesis, such as the Aux, IAA, ARF, GH3, AHP, ARR, CYCD, BBM, WUS, GRF, SERK, and WOX gene families. We found that certain genes in these families were significantly upregulated in EC induction compared to NEC, indicating that they play crucial roles in D. involucrata cell proliferation, differentiation, and cell totipotency. These results offer new insights into the role of these gene families in EC, and may guide efforts to improve the somatic embryo induction, culture conditions, and genetic transformation efficiency of D. involucrata.

1. Introduction

Davidia involucrata Baill. (D. involucrata) is a deciduous tree belonging to the Nyssaceae, and is commonly known as the dove tree. It is native to China, and is a relic species of the Tertiary paleotropical flora dating back more than 60 million years. Its ancient phylogeny is recognized as a “living fossil”. As one of the key protected wild plants in China, it has gained worldwide fame as a precious ornamental tree species, known for its beautiful shape, distinct flower patterns, and white flower bracts [1]. Propagation of D. involucrata is primarily through seeds, which can take 2–3 years to germinate due to the fruit shell’s thick peel and severe lignification; together with a low fruit set rate and seed defeat, this severely limits field population expansion and garden applications [2]. Although scholars have reported on seed dormancy release, reproductive efficiency remains very low. Propagation by cuttings and plant regeneration by organogenesis in asexual propagation of D. involucrata are challenging [3]. Therefore, developing an efficient mass propagation technique is necessary in order to conserve D. involucrata as a rare and endangered woody plant while meeting the market demand.
Somatic embryogenesis as a vegetative propagation technique denotes the process of producing embryonic structures resembling zygotic embryos directly from somatic cells without gamete fusion. It offers several advantages, including high reproductive efficiency and rapid subculture time, making it an ideal method for large-scale commercial reproduction [4]. This biotechnological technique has been successfully employed for the propagation of rare plant species [5], enabling the commercial production of numerous superior genotyped forest and horticultural plants [6]. Additionally, it serves as an efficient regeneration system for the plant transgene [7]. In addition, because somatic embryos are more readily obtainable and mass-produceable than zygotes, this technique is a valuable research tool for investigating the mechanisms underlying embryonic development [8].
Studies have shown that the formation of embryogenic callus plays a crucial role in limiting plant somatic embryogenesis across various species [9]. This process is influenced by multiple genetic and physiological factors [10]. In particular, reports on somatic embryogenesis in woody plants such as Catalpa bungei C. A. Mey. ( C. bungei) and Tillia amurensis Rupr. (T. amurensis) et al. indicate that plant hormones are among the most important physiological factors regulating this process [11,12]. However, the specific mechanisms by which these hormones regulate callus formation and promote the induction of somatic embryos remain unclear, and have become a focal point for scholarly investigation [13]. Transcriptome sequencing has proven to be an important method for exploring these mechanisms. The term “transcriptome” refers to the complete set of RNA transcripts produced by tissues or cells in a particular condition [14]. The use of transcriptome technology in the research and analysis of plants can elucidate the dynamic mechanisms underlying gene expression changes in individual cells or tissues, and can provide scientific support for gene manipulation and biological regulation [15]. Ahn et al. [16] performed transcriptome analysis of genes involved in somatic embryogenesis in Thuja koraiensis Nakai (T. koraiensis) using Illumina RNA sequencing. They discovered that the transcription factors TkBBM (BABY BOOM), TkWOX (WUSCHEL-related homeobox), and TkSERK (somatic embryogenesis receptor-like kinase), which are associated with somatic embryogenesis, were highly expressed in embryogenic callus and seedling roots, while being less expressed in seedling leaves. This provided novel insights into the functions of BBM, WOX, and SERK in somatic embryogenesis. In their study, Liu et al. [11] compared the transcriptome sequencing data and hormone levels of embryogenic callus (EC) and non-embryogenic callus (NEC) from C. bungei. They observed a significant increase in auxin and abscisic acid (ABA) levels in EC, as well as enrichment of differentially expressed genes (DEGs) in phytohormone signaling pathways. This study highlights the impact of hormones on somatic embryogenesis in the C. bungei tree species, providing a theoretical basis for investigating the molecular mechanism of somatic embryogenesis. Furthermore, the same study offers an experimental basis for the selection and rapid propagation of C. bungei. Lai and Lin [17] conducted an analysis of the EC transcriptome data of Dimocarpus longan Lour. (D. longan), focusing on unigenes with a length of ≥1000 bp (base pair). They identified 328 unigenes associated with somatic embryogenesis as well as a substantial number of unigenes expressed in embryogenic callus that were linked to reproductive growth and vegetative growth. Using quantitative real-time polymerase chain reaction (qRT-PCR), they identified 23 unigenes related to somatic embryogenesis, reproduction, and vegetative growth in samples from different stages of somatic embryogenesis. These unigenes may potentially be involved in the plant’s somatic embryogenesis process.
In a recent study, we utilized immature zygotic embryos of D. involucrata as explants to obtain EC. Subsequently, we induced somatic embryos from the EC and successfully regenerated plants through somatic embryogenesis. For the first time, this study established a plant regeneration scheme of D. involucrata through somatic embryogenesis. As reported in successful induction cases of somatic embryos in many plants, embryogenic callus production is a crucial step for inducing somatic embryogenesis [18]. This process requires specific growth conditions, such as the proper concentration and proportional combination of plant hormones [19]. To further explore the molecular basis of this crucial step, we utilized RNA sequencing (RNA-seq) to conduct a comparative analysis of the EC and NEC transcriptome data of D. involucrata. We then selected genes related to plant hormones and somatic embryos and analyzed their role in the induction process of EC formation in D. involucrata. This study enhances our understanding of the molecular network involved in EC formation, and may provide guidance for improving the induction of somatic embryos and ensuring the quality of regenerated plants by enhancing culture conditions [20].

2. Materials and Methods

2.1. Materials and Establishment of Somatic Embryogenesis in D. involucrata

In Chengguan Town, Langao County, Ankang City, Shaanxi Province, China, a plantation of 30 years age located at 108° east longitude, 32° north latitude, and 1400 m above sea level in the Bashan Rare Plant Breeding Base, was selected for the study. Mature individual plants that underwent free pollination were randomly chosen for seed collection. Immature D. involucrata seeds were harvested 80 days after pollination for use as experimental materials. The seeds (Figure S1a) were rinsed under tap water for 20 min and disinfected for 10 min in 75% (v/v) ethanol. Immature zygotic embryos encased by the endosperm (Figure S1d) were then extracted from the seeds using pruning shears on an ultra-clean bench and placed in a disinfection bottle. Subsequently, the zygotic embryos were soaked and disinfected for 2.5 min in 10% (v/v) sodium hypochlorite, then washed 4~5 times with sterile water. The endosperm was peeled off using a scalpel, then the immature zygotic embryos (Figure S1e) were placed horizontally in a culture plate containing medium and incubated in a plant culture room at 25 ± 2 °C under dark conditions. The culture medium used was MS (Murashige and Skoog) medium [21] supplemented with 3% (w/v) sucrose, 0.3% phytagel, 400 mg/L L-glutamine, and 800 mg/L hydrolyzed casein.
We utilized immature zygotic embryos of D. involucrata as explants based on our prior research findings. We selected three treatments with superior EC induction effects under different conditions, namely, 1.0 mg/L 2,4-dichlorophenoxyacetic (2,4-D) + 0.2 mg/L 6-Benzylaminopurine (6-BA), 0.5 mg/L Naphth aleneacetic acid (NAA) + 1.0 mg/L 6-BA, and 1.0 mg/L NAA + 1.0 mg/L 6-BA. These treatments were designated as samples EC1, EC2, and EC3, respectively. After approximately 30 days, the explants developed into well-dispersed light yellow EC with evident granular protrusions on the surfaces (Figure 1a–c). Subsequently, the calluses were transformed into somatic embryos which matured after passing through the globular, heart-shaped, torpedo-shaped, and cotyledonary stages (Figure S2a–d). The mature somatic embryos (Figure S2e) were then transferred to L-Glutamine and hydrolyzed casein and supplemented with 0.5 mg/L 6-BA and 0.25 mg/L 3-Indole butyric acid (IBA) on half-strength MS somatic embryo germination medium. A cool white fluorescent lamp (40 μ mol m 2   s 1 ) was utilized as the light source with illumination for 16 h/day. After 30 days of cultivation, the somatic embryos germinated and took root, then were transferred to germination medium supplemented with 1 mg/L activated carbon (AC) for approximately 30 days to obtain healthy plants with two to three leaflets and a well-developed root system (Figure S3). Additionally, non-embryogenic callus was induced on 1.5 mg/L Thidiazuron (TDZ) MS medium, which was recorded as sample NEC. After roughly 30 days, the callus developed into a compact brown tumor-shaped non-embryogenic mass. Continued culture failed to induce somatic embryos of D. involucrata (Figure 1d).

2.2. Total RNA Extraction, Library Construction, and Transcriptome Sequencing

We next aimed to isolate total RNA from both EC and NEC samples of D. involucrata. Approximately 100 mg of callus from each sample was ground into a powder using liquid nitrogen. An RNA Prep Pure Plant Kit (TIANGEN, Beijing, China) was then used to extract total RNA. The extracted RNA was subsequently sent to Shanghai Meiji Biological Co., Ltd., Shanghai, China to detect its purity and concentration, initially through 1% agarose gel electrophoresis and Nanodrop 2000 (Thermo Scientific, Pleasanton, CA, USA) analysis. Afterwards, an Agilent 2100 Bioanalyzer (Agilent, Santa Clara, CA, USA) was used to precisely detect RNA integrity. Next, cDNA sequencing libraries of qualified samples were constructed and sequenced using the Ilumina HiseqX Ten (Illumina, San Diego, CA, USA) high-throughput sequencing platform [22]. RNA-seq analysis was conducted using three independent biological replicates for each sample.

2.3. Bioinformatics Analysis of RNA-seq Data

The presence of sequencing adapter sequences, low-quality reads, high N-rate sequences (N represents uncertain base information), and sequences in the original sequencing data that are too short can all significantly affect the quality of analysis. To ensure accuracy in our bioinformatics analysis, the original sequencing data were first filtered using fastp software (accessed on 2 December 2022) (https://github.com/OpenGene/fastp) to obtain clean high-quality sequencing data in order to guarantee a smooth follow-up analysis.
The filtered and cleaned RNA-seq data were assembled de novo using Trinity software (accessed on 2 December 2022) (https://github.com/trinityrnaseq/trinityrnaseq/wiki). The resulting initial assembly sequence was then optimized using TransRate software (accessed on 2 December 2022) (http://hibberdlab.com/transrate/) and CD-HIT software (accessed on 2 December 2022) (http://weizhongli-lab.org/cd-hit/). The optimized assembly sequence was finally evaluated using BUSCO (Benchmarking Universal Single-Copy Orthologs) software (accessed on 2 December 2022) (http://busco.ezlab.org). For subsequent analysis, the longest transcript in each gene was taken as the Unigene from the qualified transcript sequences obtained by splicing.
The transcripts obtained from this transcriptome sequencing were compared with six major databases (the Non-Redundant Protein Sequence (Nr), Swiss-Prot Protein Sequence (Swiss-Prot), Protein Family (Pfam), Cluster of Orthologous Groups (COG), Gene Ontology (GO), and Kyoto Encyclopedia of Genes and Genomes (KEGG) databases) to obtain the annotation information from each database. The annotations in each database were statistically analyzed. In RNA-Seq analysis, gene expression levels were calculated using the read counts of clean reads mapped to genomic regions. The expression levels of genes and transcripts were quantitatively analyzed using RSEM software (accessed on 18 December 2022) (http://deweylab.github.io/RSEM/), with the results of expression quantification provided in TPM/FPKM. The normalization process of TPM (Transcripts Per Million)/FPKM (Fragments Per Kilobase Million) made the total expression level consistent across different samples.
The Read Counts of the genes were obtained, then DESeq2 software (accessed on 18 December 2022) (http://bioconductor.org/packages/stats/bioc/DESeq2/) was used to analyze the differences in gene expression between groups in the samples. This analysis was used to identify genes that were differentially expressed between samples. The default screening criteria for significantly DEGs were FDR (False Discovery Rate) <0.05 and |log 2 FC| 1 . If a gene met both conditions, it was considered a differentially expressed gene (DEG).
The GO database (accessed on 14 January 2023) (http://www.geneontology.org/) is a useful tool for classifying genes based on the Biological Process (BP), Cellular Component (CC), and Molecular Function (MF) they participate in. Therefore, we performed GO annotation on the DEGs to obtain information on their functional classification. We then plotted the results as a histogram of GO annotation for both upregulated and downregulated genes. Using the KEGG database (accessed on 14 January 2023) (http://www.genome.jp/kegg/), genes can be classified according to their associated pathways and functions. DEGs were annotated using KEGG and presented in the form a KEGG-annotated pathway diagram to illustrate the upregulated and downregulated genes.
All expressed genes were uploaded to the plant transcription factor database (plant-TFDB) (accessed on 11 March 2023) (http://planttfdb.cbi.pku.edu.cn) for comparison, and transcription factors related to EC induction of D. involucrata were screened. The gene expressions of different comparison combinations were sorted statistically. GO enrichment analysis revealed that several genes linked to plant hormones were enriched in the GO:04075 pathway, particularly auxin and cytokinin, as were genes linked to somatic embryogenesis.
The dynamic changes in gene expression of D. involucrata EC and NEC were analyzed through qRT-PCR. Three candidate internal reference genes, namely, ACT (Actin), CAC (Clathrin adaptor complexes), and UBQ (Polyubiquitin), were selected by searching for the reported internal reference gene sequence information of the plant. The expression levels of the candidate internal reference genes were measured using qRT-PCR and their expression stability was evaluated using the ΔCt method [23]. The results enabled us to identify the internal reference genes suitable for studying the embryogenic callus of D. involucrata.
To validate the reliability of the RNA-Seq transcriptome sequencing results obtained through our experiments, we randomly selected sixteen genes and quantified their expression levels using real-time fluorescence quantitative measurements. We then compared these results to the sequencing data using Log 2 (FoldChange) as a reference. Primer design, as detailed in Table S1, was completed using Primer 5.0 software and synthesized by Xi’an Qingke Biotechnology Co., Ltd. (Xi’an, China). The RNA from each sample group was reverse transcribed using a reverse transcription kit from TaKaRa Company following the reaction system and program outlined in Table S2 and Table S3, respectively. The resulting cDNA was stored in a −20 °C refrigerator. For qRT-PCR reactions, we utilized the reaction system and program outlined in Table S4 and Table S5, respectively, and compared the different treatments of D. involucrata EC and NEC using screened internal reference genes. qRT-PCR reactions were performed using the LightCycler96 platform. We calculated relative gene expression using the 2−ΔΔCT method [24].

3. Results

3.1. Transcriptome Sequencing Analysis

We extracted total RNA from D. involucrata callus and validated it before constructing a cDNA library. We sequenced the library using the Illumina platform, generating 714,945,156 reads, which were reduced to 709,247,312 after quality control. After removing low-quality reads, the average Q20 (the probability of a correct base call is 99%), Q30 (the probability of a correct base call is 99.9%), and GC (the percentage of G and C bases in the clean reads) values were 97.92%, 93.80%, and 46.04%, respectively, indicating that transcriptome sequencing quality met the relevant standard (Table 1). De novo assembly of the clean data produced 131,109 unigenes, which resulted in 195,250 transcripts with an average length of 1040.76 bp (Table 2). A large number of long sequences were generated by sequencing; specifically, 75% (98,235) of the transcripts were 200–1000 bp in length, 15% (19,772) of the transcripts were 1000–2000 bp, and the remaining 10% (13,102) of the transcripts were longer than 2000 bp (Figure 2).

3.2. Functional Annotation

The unigenes of the transcriptome underwent sequence similarity analysis using six databases: Nr, Swiss-Prot, Pfam, COG, GO, and KEGG. The obtained results are presented in Table 3. From the Nr database, 51,909 annotations (39.59%) were retrieved, while the KEGG database yielded the lowest number of annotations at 16,027 (12.22%). Overall, 52,420 unigenes (39.98%) were annotated in at least one of the databases.
The Nr annotations were used to analyze the 51,909 assembled unigenes. Figure 3a displays the E-value distribution of the Nr annotations, with 61.04% of the unigenes found to have high homology to species in the Nr database when the E-value is < 10 30 . Figure 3b presents the distribution of similar species, indicating that 42.08%, or 21,842 unigenes, were present in Nyssa sinensis Oliver (N. sinensis), which aligns with the close relationship between the two tree species. Moreover, 8.41%, or 4364 unigenes, existed in Vitis vinifera L. (V. vinifera); 8.04%, or 4173 unigenes, existed in Camellia sinensis (L.) O. Ktze. (C. sinensis); and 3.57%, or 1854 unigenes, were identified in Carya illinoinensis (Wangenh.) K. Koch. (C. illinoinensis).

3.3. Functional Classification

The functions of D. involucrata genes were classified using the GO and KEGG databases. The analysis revealed that out of 131,272 unigenes, 42,019 (32.05%) were assigned as GO items, with 10.05% representing biological processes, 11.84% representing cellular components, and 10.16% assigned to molecular function categories (Figure 4a). Additionally, the GO functional classification identified twenty functional groups, with the biological process category containing a majority of unique sequences distributed across eight subcategories. The cellular process (17,052) and metabolic process (14,869) subcategories were the most commonly matched unigenes. Among the seven subcategories in cellular components, cell part (17,883), membrane part (16,408), and organelle (10,076) were the most commonly matched unigenes. In terms of molecular function, the analysis identified five subcategories, with the two largest categories being binding (23,922) and catalytic activity (22,369).
The KEGG database was able to annotate 16,027 (12.22%) unigenes, out of which 11,034 were associated with nineteen KEGG pathways (Figure 4b). Notably, the pathways related to metabolism and genetic information processing were among the top annotated pathways.

3.4. Analysis of DEGs

To improve the reliability of the transcriptome experiment, this study conducted three biological replicates of the experimental samples, thereby reducing the potential for random errors during the experimental process and providing more accurate genetic data for subsequent analysis.
Following completion of sequencing, each sample’s transcriptome database contained raw data ranging from 42,191,988 to 55,913,282 reads. The raw data underwent standardization and correction. First, the RSEM quantitative expression software (accessed on 18 December 2022) (http://deweylab.github.io/RSEM/) was used for quantitative analysis and correction of gene and transcript expression levels, using FPKM as a quantitative index. The Pearson correlation coefficient [25] was then utilized to assess data correlation among biological replicates for each sample. The calculated results indicated that the Pearson correlation coefficient between the respective replicates of the samples in this study ranged from 0.969 to 0.996 (Table 4), demonstrating high correlation among biological replicates. Conversely, the Pearson correlation coefficient between EC and NEC was relatively small, indicating a lower degree of correlation. However, there was a moderate degree of correlation among the three ECs (Figure 5), rendering subsequent data analysis reasonable.
This study utilized DESeq2 software (accessed on 18 December 2022) (http://bioconductor.org/packages/stats/bioc/DESeq2/) to screen DEGs using the criteria of absolute value of log 2 (FoldChange) ≥ 1 and FDR value < 0.05 [26]. By comparing the transcriptome data of D. involucrata EC and NEC, 12,806 DEGs were identified. Among these, 8516 were in EC1 vs. NEC, with 3947 upregulated genes and 4569 downregulated genes. In EC2 vs. NEC, 4959 DEGs were identified, with 2474 upregulated genes and 2485 downregulated genes. In EC3 vs. NEC, 7458 DEGs were found, with 3905 upregulated genes and 3553 downregulated genes (Figure 6a). The comparison of EC and NEC under different treatments revealed many DEGs (Figure 7). Moreover, 2188 DEGs were commonly found in all three comparison combinations (Figure 6b); these could be the key genes involved in the regulation of embryogenic callus induction of D. involucrata.
RSEM software (accessed on 18 December 2022) (http://deweylab.github.io/RSEM/) was employed to perform cluster analysis on all DEGs of D. involucrata EC and NEC and to visualize the gene sets in each sample [27]. Clustering was conducted based on the relative expression level of the genes to group genes with similar expression level into the same cluster. Genes within the same cluster may regulate common metabolic processes or have similar functions [28]. The results showed marked differences in gene expression between samples of D. involucrata EC and NEC (Figure 8).

3.5. Analysis of Differentially Expressed Transcription Factors

Transcription factors (TFs) are crucial upstream regulatory proteins that play a significant role in the regulation of plant callus formation [29]. In this study, the PlantTFDB database was used to predict transcription factors and analyze their families among all unigenes assembled from the transcriptomes of the samples. Our analysis showed that 466 transcription factors belonging to 29 different TF families (Table 5) were predicted out of 12,806 DEGs. The MYB (v-myb avian myeloblastosis viral oncogene homolog) family had the highest proportion (13.73%), followed by the AP2/ERF (APETALA2/ethylene response factor) family (12.02%), bHLH (basic helix-loop-helix) family (10.30%), NAC (NAM-ATAF1/2-CUC2 (namely, NAM (No Apical Meristem), ATAF1-2, and CUC2 (Cup-shaped Cotyledon))) family (8.37%), C2C2 family (7.51%), WRKY family (6.22%), and LOB (lateral organ boundaries) family (5.15%). The proportion of these transcription factor families was significantly higher than that of the remaining families. The overall analysis showed that most differentially expressed factors were upregulated during the induction of EC. Furthermore, common transcription factor families such as MYB, bHLH, bZIP (basic region/leucine zipper motif), and C3H (p-coumarate 3-hydroxylase) were identified in EC induction or cell pluripotency expression, and their expression was upregulated in D. involucrata EC samples, indicating their positive regulatory role under the treatment conditions of embryogenic callus induction. Certain transcription factors, such as the WRKY family, were downregulated, suggesting different regulatory mechanisms during callus induction. The transcriptional results of EC induced by different treatments, along with a small number of unreported specific transcription family genes showing differential expression, indicate the involvement of specific transcription family members in transcriptional regulation. The above results indicate that a significant number of transcription factors are differentially expressed during the induction of D. involucrata EC, initiating the differentiation of EC.

3.6. Expression Analysis of Growth Hormone, Cytokinin, and Stress-Related Genes

The in vitro induction of somatic embryogenesis in plants commonly involves treating factors such as plant hormones or stress [30]. As plant cells respond differently to environmental conditions and stress, these factors can affect the direction of cell division and differentiation, ultimately leading to somatic embryogenesis [31]. Thus, investigating the expression of genes associated with plant hormones and stress during the induction of D. involucrata EC is crucial to comprehending the process of somatic embryogenesis and development [32].
During in vitro culture of plants, explants lack the ability to synthesize auxin and cytokinin. However, these two hormones work jointly to regulate the direction of cell division and differentiation during the process of dedifferentiation and redifferentiation in plant somatic embryogenesis [33]. GO enrichment analysis showed that tens of thousands of genes related to auxin and cytokinin were enriched in the GO:04075 pathway. Nevertheless, members of the same gene family displayed different expression patterns in the three comparisons, indicating the complexity of the regulatory role of the cytokinin signaling pathway network in the process of EC differentiation. We selected 46 DEGs that were consistent and significant in the three comparisons; their dynamic changes are illustrated in Figure 9. Multiple auxin pathway-related DEGs showed significant dynamic changes, including the Auxin (auxin) family, IAA (indole-3-acetic acid) family, ARF (auxin response factor) family, and GH3 (gretchen hagen 3) family. Under EC treatment, the transcript abundance of almost all auxin-related genes was higher than that of NEC, except for a few genes in the IAA family for which expression decreased. This suggests that these auxin-related genes may promote cell dedifferentiation and regeneration during the differentiation of D. involucrata EC. Notably, four related genes of the GH3 family were significantly upregulated in the three ECs relative to other genes of other families, suggesting that the genes of the GH3 family may play a critical role in EC regeneration. The AHP (arabidopsis histidine phosphotransfer proteins) family, ARR (arabidopsis response regulator) family, CYCD (cyclin D) family, and many other genes were found to be closely related to cytokinin signaling pathways in the induction process of D. involucrata EC. Two genes of the AHP family were significantly upregulated when inducing EC of D. involucrata, while six genes of the ARR family and one gene of the CYCD family were downregulated. These findings indicate that the regulation of gene expression by cytokinins is closely related to the process of cell dedifferentiation and redifferentiation. The expression of auxin, cytokinin, and ABA signaling pathway genes was significantly different between EC and NEC, suggesting that auxin, cytokinin, and ABA may be primarily involved in the formation of EC in this tree species.
ABI (abscisic acid-insensitive) family genes have crucial roles in several stages of plant growth and development, including seed maturation, germination, and stress response. Within the ABA signaling pathway, plant ABI5 has an essential function [34]. The higher transcript abundance of DiABI5 in EC compared to NEC implies that ABA is involved in the regeneration process of EC of D. involucrata as well, and affects the formation of somatic embryos. Brassinosteroids (BRs) are natural plant hormones that control plant growth and development, and are often associated with plant responses to water stress [35]. DiBRI1 and DiBSK1.1, which are important members of the BR signaling pathway respectively belonging to the BRI (brassinosteroid insensitive) and BSK (brassinosteroid-signaling kinase) families, may be related to plant response to water stress. However, their expression in D. involucrata is inconsistent during induction, indicating that the regulatory mechanism of stress-related genes in the process of EC differentiation in D. involucrata is complex. NPR1 (Non-expresser of pathogenesis related genes 1) is a critical regulator of plant defense signaling, and may participate in the response of plants to cold stress [36]. The TGA (tgacg-binding) transcription factor, which belongs to the D group (basic leucine zipper, bZIP) of the bZIP family, plays a significant role in plant growth and development as well as in response to heavy metal stress [37]. Xyloglucan endotransglycosidase/hydrolase (XTH) is closely linked to the physiological activities of the cell wall and to the stress response during plant growth and development [38]. Corresponding expression changes of stress-related genes were observed during the induction process of D. involucrata, and these genes may further affect the process of somatic embryogenesis in D. involucrata.

3.7. Expression Analysis of Somatic Embryogenesis-Related Genes

In addition to genes associated with plant hormones and stress signaling pathways, the induction of EC in D. involucrata involves genes associated with somatic embryogenesis (Figure S4), such as the AGL (agamous-like), AIL (aintegumenta-like), BBM, WUS (WUSCHEL), and SERK genes. These genes have previously been identified as markers of somatic embryogenesis [39,40]. To elucidate the dynamic changes in somatic embryogenesis-related gene families and their functional genes during the induction process of EC in D. involucrata, we analyzed the transcriptome’s dynamic expression levels for the main somatic embryogenesis-related genes under three comparisons. We identified 80 genes with significant differential expression among multiple somatic embryogenesis-related genes (Figure 10), including an AIL family gene (DiAIL5), SERK family genes (DiSERK1, DiSERK2, DiSERK2.4), WUS family genes (DiWUS11.1, DiWUS11.2, DiWUS5.1, DiWUS5.2, DiWUS7), BBM family genes (DiBBM2.1, DiBBM2.2, DiBBM1), and AGL family genes (DiAGL15.1, DiAGL15.2), among others. Most of the DEGs were upregulated in the three ECs, indicating that they are likely closely related to somatic embryogenesis in D. involucrata and play a crucial role in maintaining the embryogenic state of cells during the induction of EC in this species.

3.8. qRT-PCR

Using the screening method for internal reference genes mentioned above, we selected three genes from the transcriptome databases of EC and NEC of D. involucrata as candidate internal reference genes. However, during the measurement of gene expression using qRT-PCR, the internal reference gene ACT was not detected. Therefore, we compared the expression levels of the two remaining candidate internal reference genes, CAC and UBQ.
The Ct (Cycle threshold) value is a useful indicator of the expression and stability of candidate internal reference genes in various samples. Upon analyzing the Ct values of the two candidate internal reference genes in different samples, we found that their Ct values ranged from 18.20 to 25.26. UBQ exhibited the highest transcription level among these, with a Ct value of 18.20, while CAC had the lowest transcription level, with a Ct value of 25.26 (Table 6).
Based on the Q = EΔCt calculation results, the expression stability of candidate internal reference genes during the induction of EC by immature zygotic embryos of D. involucrata was evaluated. A smaller ΔCt value indicates better stability of the selected internal reference genes. Among the different samples analyzed, UBQ exhibited a ΔCt value of 1.82, which was lower than that of CAC (2.19), indicating that UBQ was more stable than CAC. Therefore, UBQ was selected as the internal reference gene.
To validate the transcriptome sequencing results of D. involucrata EC and NEC using DiUBQ as the internal reference gene, transcriptome data on sixteen genes were randomly selected for qRT-PCR testing. The results indicated that the qRT-PCR expression changes of the sixteen tested genes were consistent with the expression changes of the corresponding genes in the transcriptome sequencing data (Figure 11). Therefore, the transcriptome sequencing data of D. involucrata EC and NEC in this study can be considered sufficiently reliable to serve as a foundation for differential expression analysis.

4. Discussion

D. involucrata is an important Chinese tree species with a long history as a fine wood and ornamental tree, and possesses significant ecological value. Unfortunately, factors such as poor adaptability, strict habitat requirements, long seed dormancy, seed abortion, and human interference have led to a sharp decline in the natural population of D. involucrata, making it an endangered species [1]. Although many scholars have researched methods to save this species, including seed dormancy release, cutting seedlings, and organ regeneration plants, asexual reproduction of D. involucrata remains difficult [2]. Somatic embryogenesis has proven advantageous in large-scale plant seedling production, and can preserve plant genetic resources as well as save endangered species from extinction [41]. In our previous study, we established a somatic embryogenesis and plant regeneration protocol for D. involucrata. In the present study, we have investigated the key step in this process, namely, the molecular mechanism of EC induction, laying a scientific foundation for future research into the molecular mechanism of somatic embryogenesis in D. involucrata. This work contributes to a comprehensive understanding of the mechanism of somatic embryogenesis, which is important for genetic transformation and the preservation of germplasm resources.
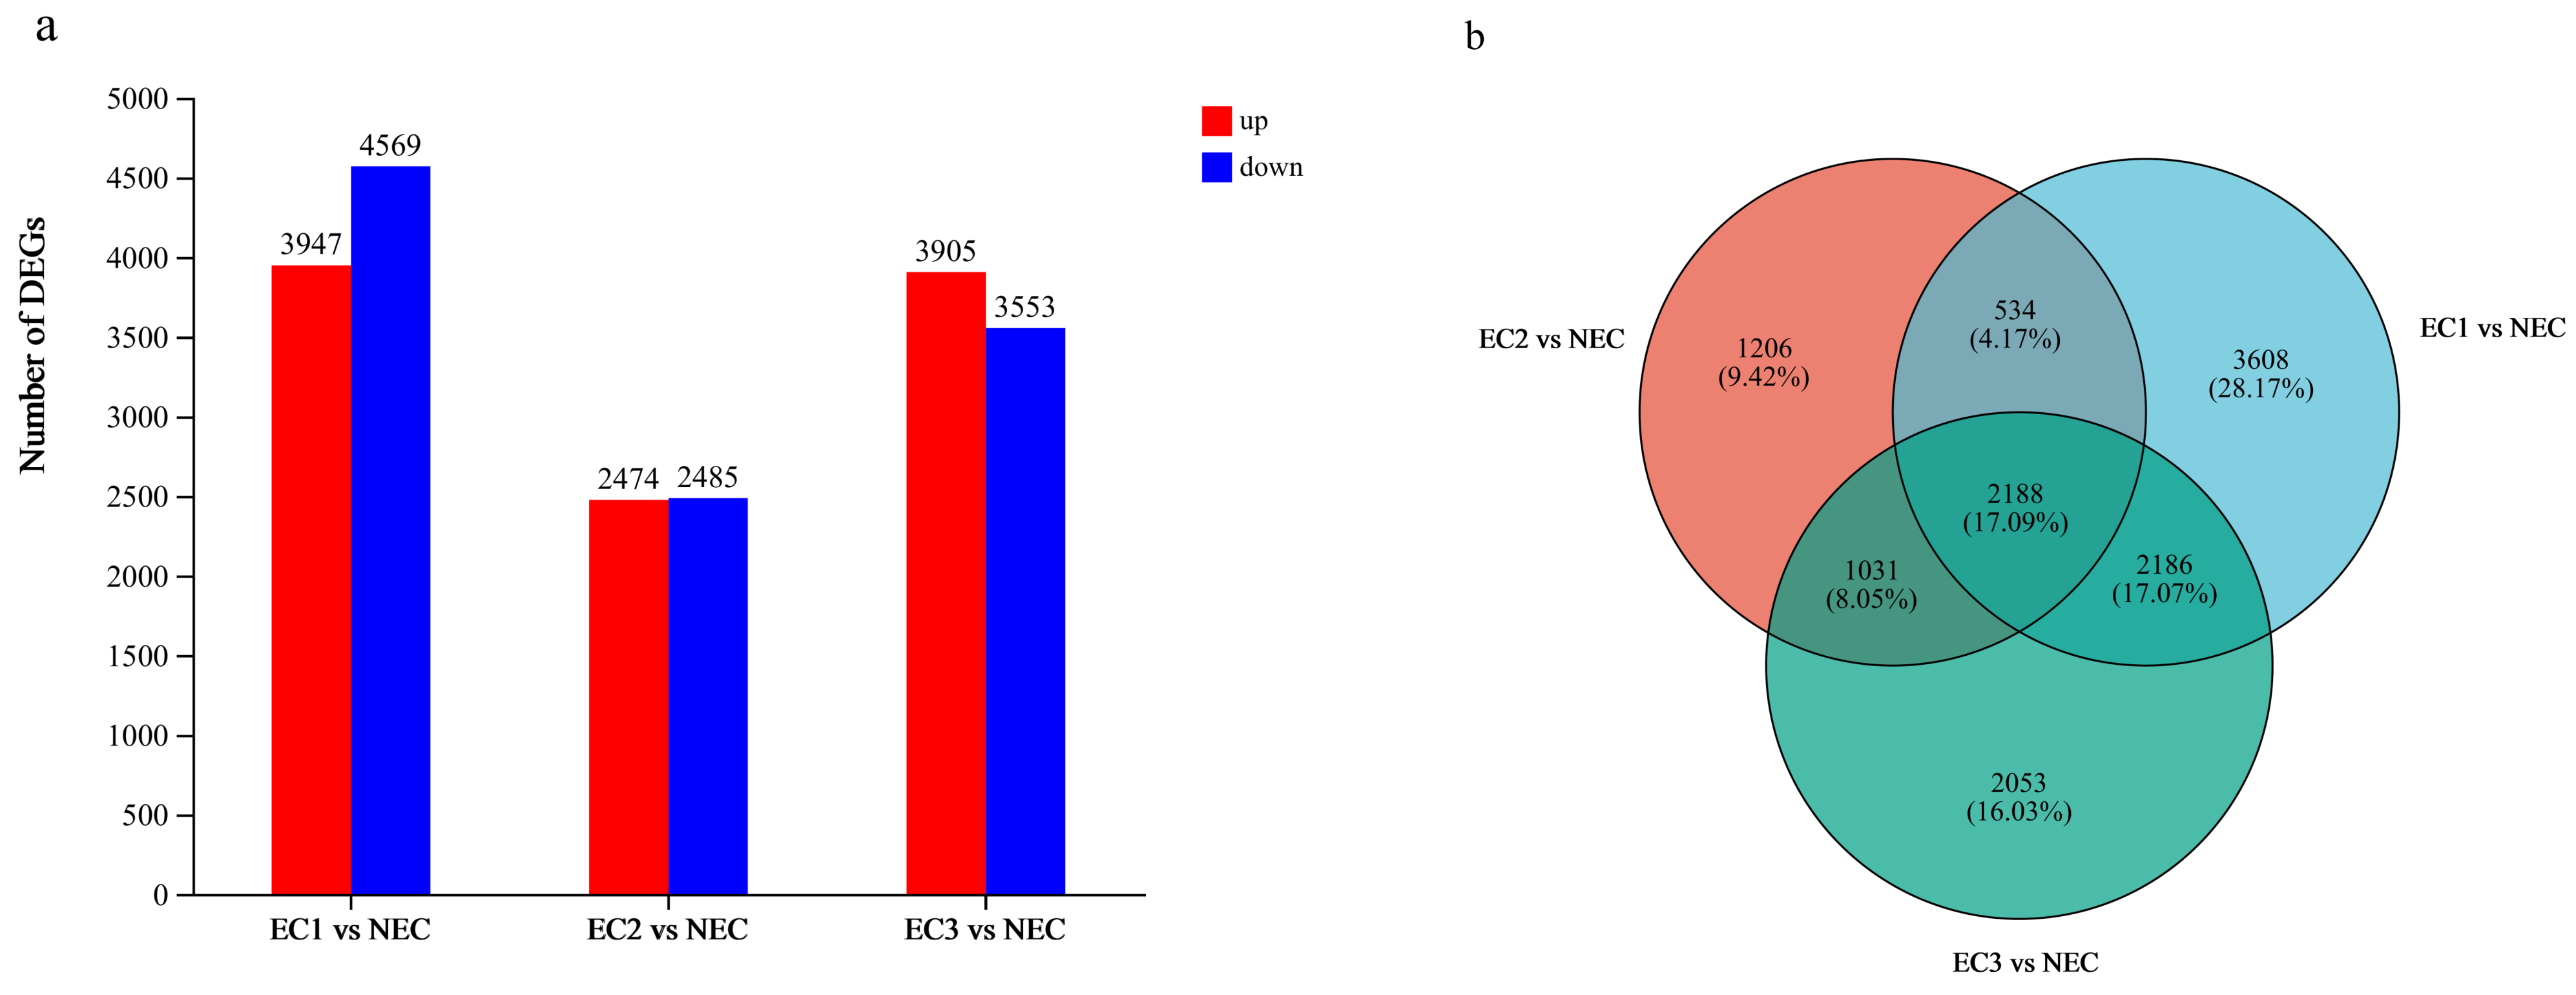
During somatic embryogenesis, ECs and NECs exhibit distinct developmental rates. For the first time, we used RNA-seq to compare global transcriptome reprogramming, revealing the regulatory mechanisms underlying EC formation. We identified a total of 12,806 DEGs which may contribute to callus differentiation. To further investigate these DEGs, we classified them using GO and KEGG analysis (Figure 4). GO term cluster analysis showed that the most abundant category was biological processes (1037 DEGs), followed by molecular functions (1138 DEGs) and cellular components (1192 DEGs). KEGG functional classification revealed that the DEGs were significantly enriched in nineteen pathways, mainly metabolism, genetic information processing, and environmental information processing, suggesting their involvement in the induction of EC. Additionally, this study is the first to report transcriptome data for the embryogenic callus of D. involucrata. We assembled a total of 131,109 unigenes, of which 52,420 unigenes were annotated in at least one of the databases, providing sufficient information for further gene function analysis.

4.1. The Role of Growth Hormone, Cytokinin, and Stress-Related Genes

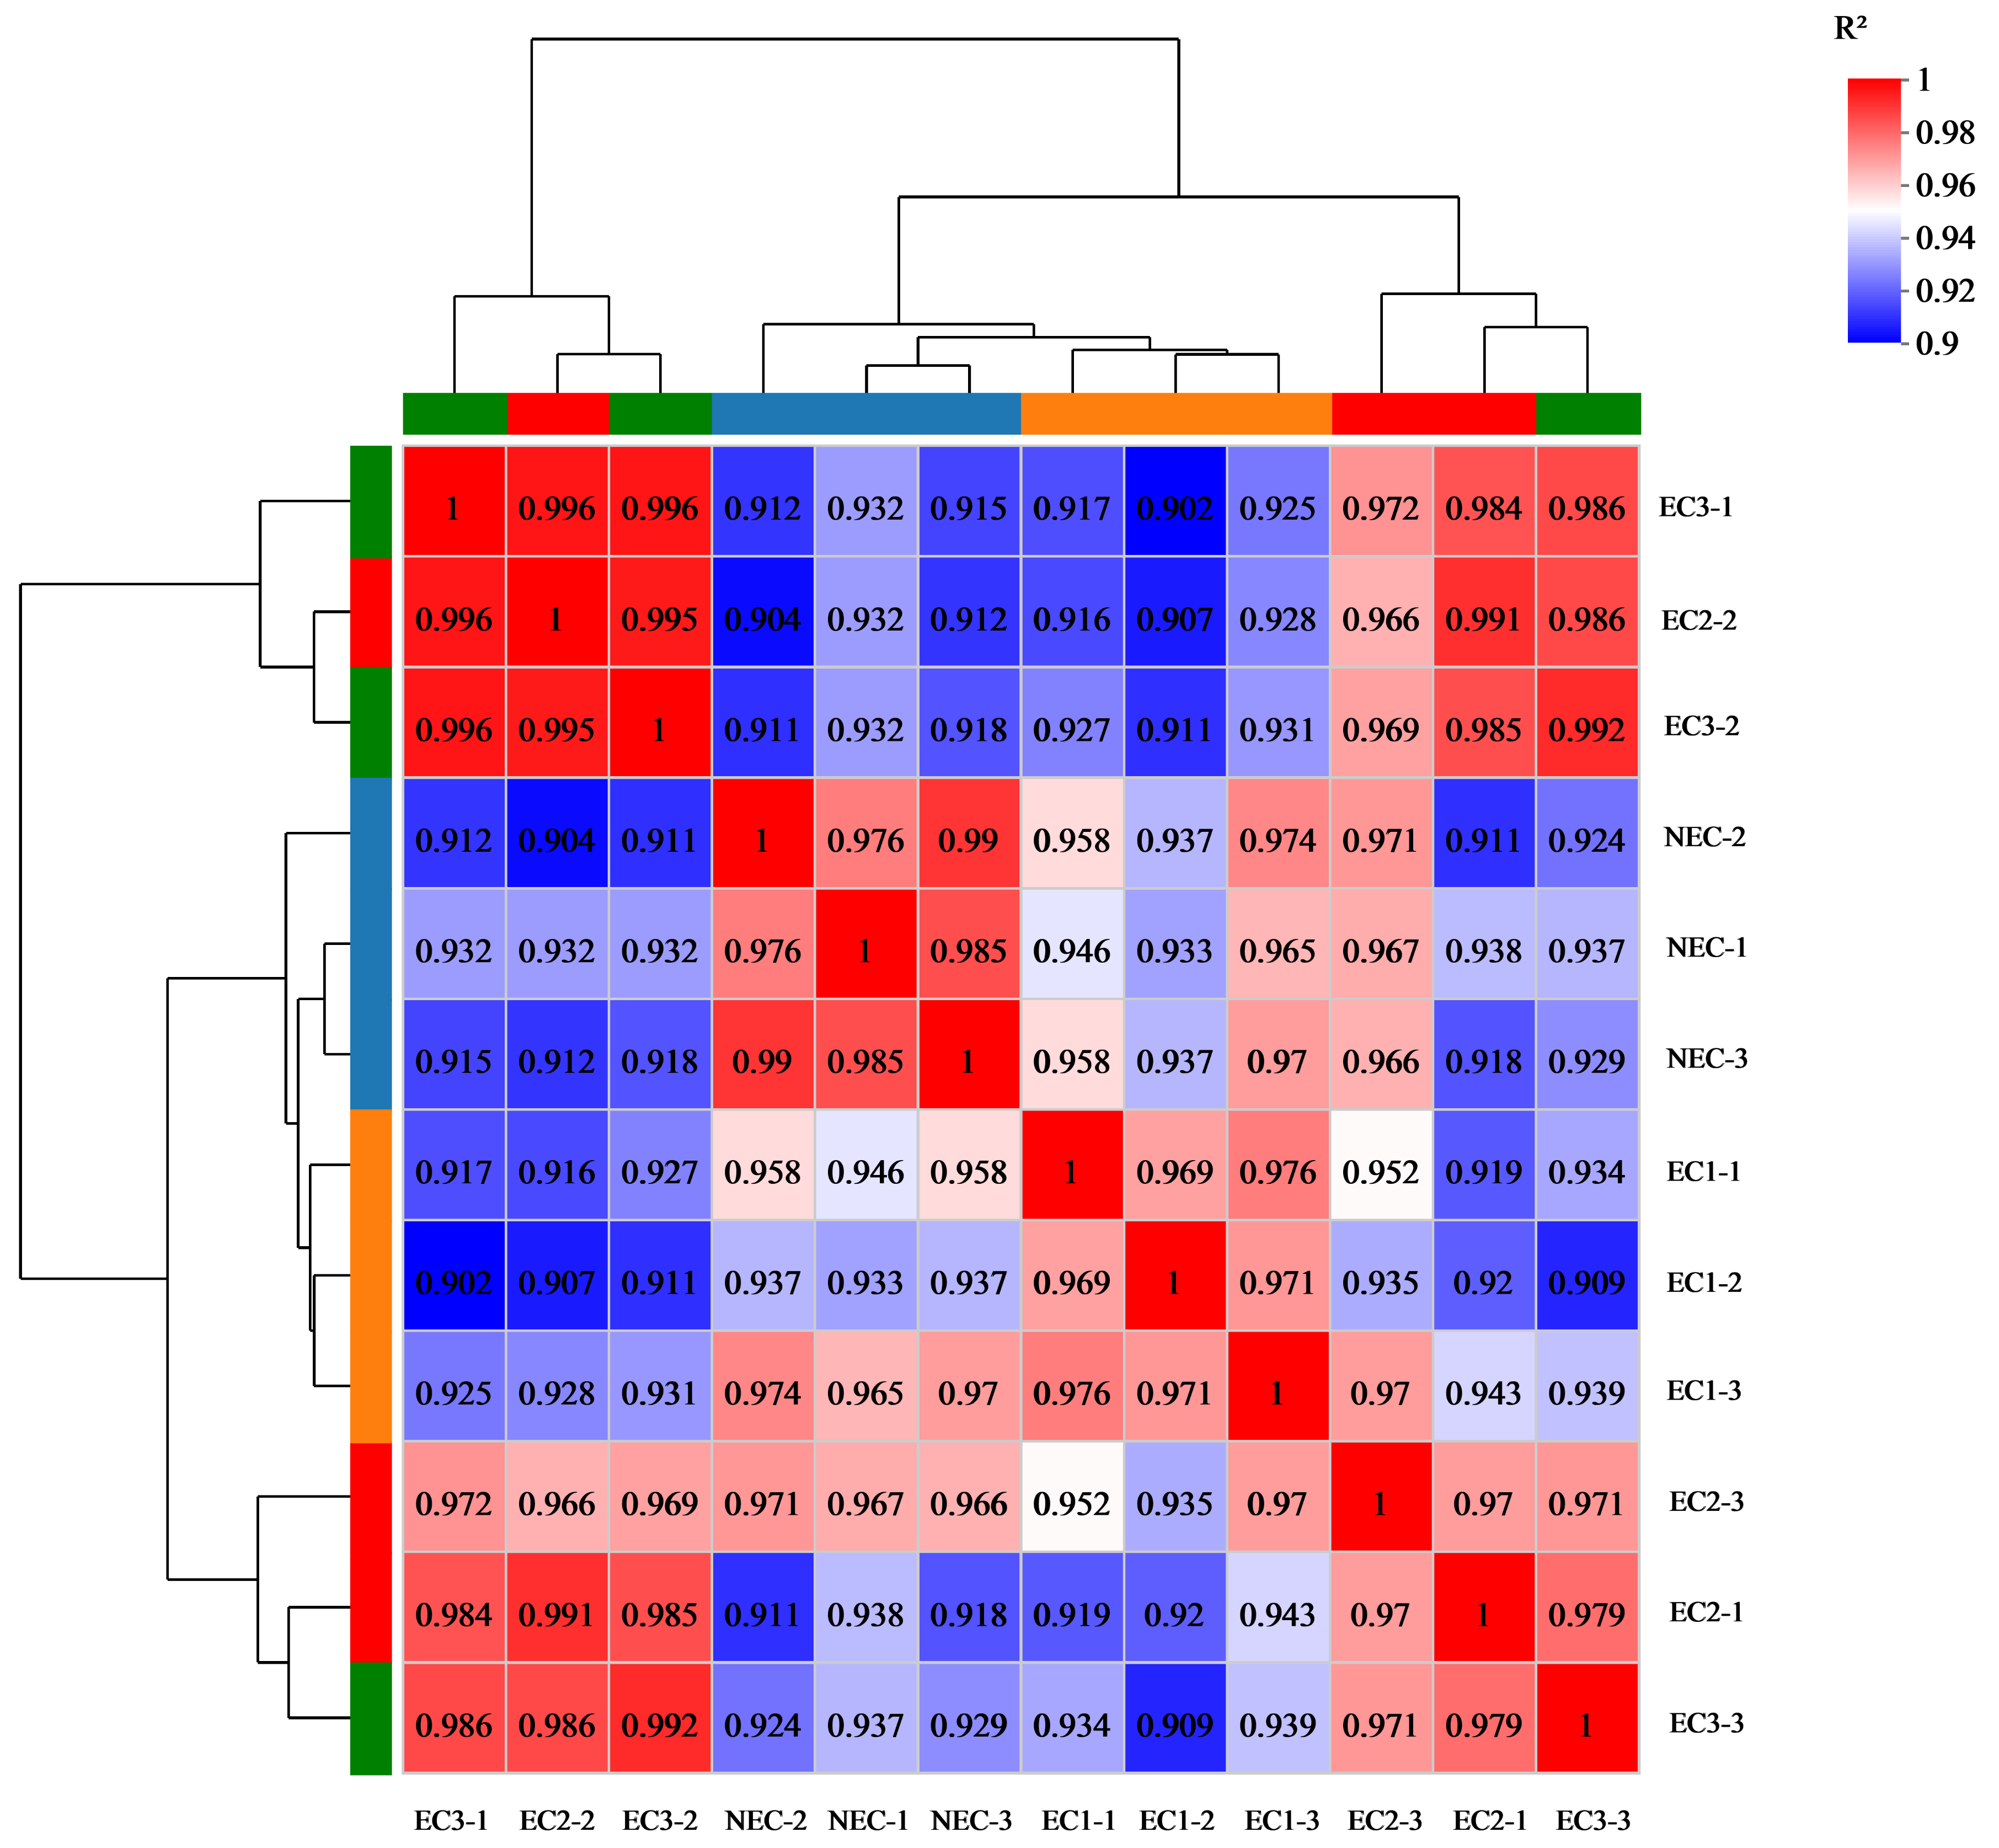
The low homologous matching rate between the transcriptome sequencing data of D. involucrata EC and NEC can be attributed to the lack of genomic information. Although we screened 46 genes related to plant hormones and stress by comparing the sequencing data of D. involucrata with key genes and functions reported in other model plants, this approach has limitations, as important genes possibly related to the EC of D. involucrata remained unannotated and unexplored. This issue has been reported in other species-related studies as well [42].
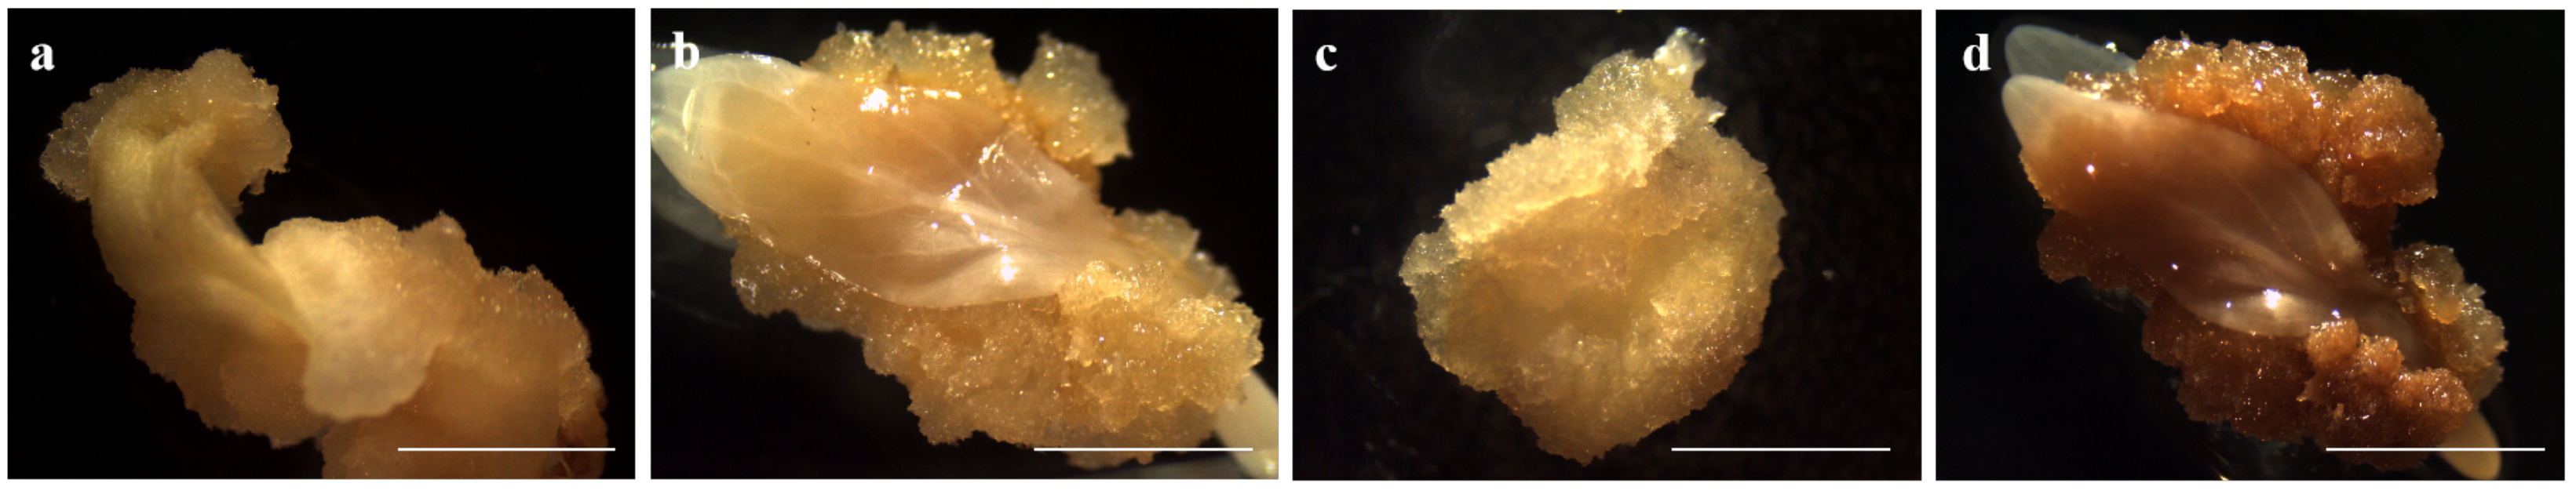
Plant somatic cells can undergo dedifferentiation and redifferentiation, resulting in the formation of EC with cell pluripotency, ultimately leading to the development of embryos in somatic embryogenesis. Hormonal treatments and stress are commonly used to induce this process [43]. The genome-wide expression patterns during EC induction may differ among various plant species. In this study, we identified genes related to plant hormones and stress that exhibited consistent differential expression patterns by comparing three EC treatments with NEC treatment. Among these, the DEGs from families such as Aux, IAA, ARF, GH3, AHP, ARR, and CYCD were associated with the auxin and cytokinin signaling pathways. This result is consistent with the expression patterns of genes related to EC formation in Arabidopsis thaliana (L.) Heynh. (A. thaliana), Carica papaya L. (C. papaya), and other plant species [44,45]. The addition of exogenous auxin during the induction of embryogenic callus in plants can significantly affect the synthesis and metabolism of endogenous auxin. During EC induction of Neolamarckia cadamba (Roxb.) Bosser (N. cadamba), Li et al. [46] found Aux/IAA (auxin/indole-3-acetic acid) genes, GH3 genes, and SAUR (small auxin-up RNA) genes related to auxin through sequencing at different stages of EC induction. These genes were dynamically expressed, with significant upregulation and downregulation during early and later stages of callus differentiation. Our study identified auxin-related genes with a common expression trend in EC compared to NEC under different treatments, with most of these family genes being upregulated in EC. This finding suggests that auxin-responsive genes may be involved in the regulatory network of cell differentiation and regeneration during the growth of D. involucrata EC. Although there have been few reports on the mechanism of cytokinin action, most studies have suggested its coordination with auxin in the process of EC and somatic embryogenesis, promoting cell growth, division, differentiation, and other pathways [18].
This study identified multiple genes that are related to cell response to adverse stress during the process of EC induction. For instance, the ABI gene, which plays a vital role in the ABA signaling pathway, might be associated with environmental stimuli such as maturation, aging, or stress [34]. Additionally, the BRI family gene DiBRI1 and BSK family gene DiBSK1.1 might respond to plant water stress [35]. Furthermore, TGA family genes might play a significant role in the response to heavy metal stress [37]. Lastly, XTH family genes have been reported to play a critical role in drought stress in Glycine max (L.) Merr. (G. max) [47]. However, the expression of these genes related to cell response to adverse stress is inconsistent during the induction of EC, indicating that the regulation mechanism of stress-related genes in the process of EC differentiation is complex and that their specific gene function requires further research and analysis.

4.2. Molecular Regulation of Somatic Embryo-Related Genes in Healing Tissues

Plant cell regeneration research suggests that certain genes may be specifically expressed during the transformation of somatic or vegetative cells into EC, providing them with meristem ability when cultured in vitro [48]. To identify common somatic embryogenesis-related genes, we compared transcript abundance from three sets of EC treatments. Although certain genes showed inconsistent expression trends, we found 80 genes with consistent expression trends and obvious expression levels, including genes in the BBM family, WUS family, GRF family (growth-regulating factor), SERK family, WOX family, etc. These gene families are known to promote plant regeneration and development during somatic embryogenesis [39]. BBM gene, a member of the AP2/ERF transcription factor family, was first identified in somatic embryo cells of Brassica napus L. (B. napus), and has been found to be helpful in somatic embryo induction [49]. The participation of the BBM gene in the EC differentiation of D. involucrata was detected in the present study, where DiBBM2 transcript abundance was significantly higher in the three EC treatment groups than in the NEC treatment group. This suggests that the BBM gene may promote cell dedifferentiation and regeneration ability during the process of embryogenic callus differentiation in D. involucrata.
The WOX family is a plant-specific family of transcription factors mostly involved in important biological processes such as growth, development, and responses to abiotic stress [50]. WUS was the first gene identified in the WOX family, and studies have shown that it has a similar effect to BBM. WUS mainly plays a vital role in cellular processes such as the maintenance of shoot apical meristem and the totipotency of plant cells [51]. There are many successful reports of these two genes being used in plant genetic transformation, including Zea mays L. (Z. mays), Oryza sativa L. (O. sativa), Sorghum bicolor (L.) Moench (S. bicolor), and other plants. Their application in meristem induction and maintenance, plant regeneration, and genetic transformation technology systems has been successful [48].
In this study, multiple genes of multiple WOX families were detected in D. involucrata callus. However, members of the same gene family showed different expression patterns. For example, the downregulated expression of the WOX11 gene and the upregulated expression of the WOX1, WOX5, and WOX8 genes suggest that the regulation of the auxin signaling network during callus differentiation is extremely complex. The negative feedback of WOX11 may affect the upregulated expression of WIND (wound-induced dedifferentiation) to further promote cell reprogramming and organ regeneration. This phenomenon has been reported in A. thaliana, where WOX13 expression is rapidly induced after injury, mainly through the activity of the AP2/ERF transcription factor WIND1. Additionally, WOX13 negative feedback can directly upregulate WIND2 and WIND3 [13]. The overexpression of WOX5 shows its close relationship with callus induction. For instance, Zhao et al. [52] found that in Triticum aestivum L. (T. aestivum) the TaWOX5 gene was mainly expressed in roots and callus induced by auxin and cytokinin, suggesting that TaWOX5 may be related to root formation and hormone regulation of somatic embryogenesis, which is similar to the results of this study.
GRFs are a plant-specific family of transcription factors that often form a complex with the transcription cofactor GIF (GRF-Interacting Factor) [53]. Our study identified multiple GRF genes that were significantly and dynamically expressed in EC. This finding is consistent with a previous study by Luo et al. [54] which demonstrated that the GRF-GIF complex regulates the transition between stem cells and their rapidly dividing daughter cells, thereby promoting cell proliferation and endowing proliferating cells with meristem potential during organogenesis. Our results support the notion that GRF family genes are closely involved in the differentiation and proliferation of D. involucrata callus. Previous studies have shown that using GRFs or GRF-GIF complexes from different species can improve plant transformation and regeneration efficiency by promoting cell proliferation and differentiation. For instance, the GRF4-GIF1 complex has been shown to significantly enhance the transformation efficiency of T. aestivum, O. sativa, and Citrus reticulata Blanco. (C. reticulata) [55,56].
SERK was initially discovered during somatic cell development of Daucus carota L. (D. carota) [57]. Subsequently, studies in plants such as A. thaliana, O. sativa, T. aestivum, and Z. mays have demonstrated that the upregulation of SERK is indicative of explants possessing somatic embryogenesis ability, which further enhances genetic transformation efficiency [18,48]. In this study, the SERK gene was screened and found to be significantly upregulated in the EC of D. involucrata, suggesting that somatic embryo-related genes are vital for the induction of embryogenic callus. This highlights the potential of EC for somatic embryogenesis, emphasizing the importance of EC as a prerequisite for somatic embryogenesis.
In addition, our study revealed a significant upregulation of a large number of SAUR family genes in EC treated with auxin and cytokinin. SAUR is a type of auxin early response gene that is closely linked to plant growth and development [58], as confirmed by our results. Moreover, ZANIN et al. [59] discovered that CaSAUR12 and CaSAUR18 of Coffea arabica L. (C. arabica) are highly expressed in all stages of somatic embryonic development, suggesting that these genes may be involved in auxin-induced cell growth and expansion. Thus, we infer that SAUR genes are closely related to somatic embryogenesis of D. involucrata.
Understanding the mechanism of EC is critical in the study of plant somatic embryogenesis as well as to plant improvement and reproduction [11]. In this study, we investigated the EC of D. involucrata and found that it is closely related to somatic embryogenesis. These findings can advance our knowledge of the initial stages of somatic embryogenesis in this tree species, including the dynamic changes of endogenous hormone levels and potential key regulatory genes. Somatic embryogenesis can be promoted by regulating these key elements, leading to faster plant regeneration through improved culture conditions and ultimately the improving efficiency of plant genetic transformation [60].

5. Conclusions

In this study, we conducted RNA sequencing on EC and NEC of D. involucrata. Our analysis revealed 131,109 unigenes and 12,806 DEGs between EC and NEC. qRT-PCR was performed to verify the authenticity of the transcriptome sequencing results, with sixteen DEGs screened. Our focus was on genes related to plant growth regulators and somatic embryogenesis, revealing that certain genes in these families were significantly upregulated in EC induction compared to NEC. These findings provide new insights into the role of these gene families in EC induction, which may guide efforts to improve somatic embryo induction, culture conditions, and genetic transformation efficiency of D. involucrata. Understanding the mechanism of EC induction is critical in the study of plant somatic embryogenesis and plant improvement and reproduction. However, this study only provides a starting point for study of the key genes and functions of somatic embryogenesis in D. involucrata. To understand the true function of DEGs, functional research such as gene cloning and transgenic experiments is necessary. In the future, multi-omics data could be utilized for proteomic and metabolomic research on D. involucrata somatic embryos, which would aid in understanding the internal mechanism of somatic embryogenesis at the gene, transcription, protein, and metabolism levels.

Supplementary Materials

The following supporting information can be downloaded at: https://www.mdpi.com/article/10.3390/f14061256/s1, Figure S1: Seed structure and callus induction of D. involucrata: (a) Immature D. involucrata seeds. (b) Lignified seeds without exocarp and mesocarp. (c) Cross and vertical cutting of seeds. (d) Immature zygotic embryo surrounded by endosperm. (e~h) immature zygotic embryo 0 d, 5 d, 10 d, 15 d. Bar: 1 cm; Figure S2: Different developmental stages and histology of somatic embryos from D. involucrata. (a,a1) Globular stage somatic embryo. (b,b1) Heart-shaped stage somatic embryo. (c,c1) Torpedo-shaped stage somatic embryo. (d,d1) Cotyledonary stage somatic embryo. (e,e1) Mature somatic embryo. (a~e) Bar: 1 mm. (a1~e1) Bar: 100 μ m; Figure S3: Somatic embryo germination and conversion of D. involucrata. (a) Anomalously germinated somatic embryo with cotyledons only. (b) Anomalously germinated somatic embryo with root only. (c) Normally germinated somatic embryo with both shoot and root. (d) Conversion plantlets. (a~c) Bar: 1 mm. (d) Bar: 1cm; Figure S4: Genes associated with somatic embryogenesis from EC of D. involucrata; Table S1: qRT-PCR primer design; Table S2: Reverse transcription reaction system; Table S3: Reverse transcriptional response program; Table S4: qRT-PCR reaction system; Table S5: qRT-PCR procedure.

Author Contributions

Conceptualization, G.L. and Y.K.; methodology, G.L.; software, Z.Y.; validation, G.L., M.L. and A.W.; data curation, G.L.; writing—original draft preparation, G.L.; writing—review and editing, Z.Y., M.L. and A.W.; visualization, Z.Y.; supervision, Y.K.; project administration, G.L., Z.Y.; funding acquisition, Y.K. All authors have read and agreed to the published version of the manuscript.

Funding

This research was funded the Shaanxi Forestry Science and Technology Innovation Project of Shaanxi Academy of Forestry, China (No. SXLK2021-01-03); and Qinling Research Institute of Northwest A&F University, China.

Data Availability Statement

All data included in this study are available upon request by contact with the corresponding author.

Acknowledgments

We wish to thank Lili Zhang, Rongyi Duan, Gangzhen Ma, Xiaoqiang Zhou, Rui Liu, Zhao Dai, Jiaming Dong and Jinhao Xu for their technical assistance, enthusiasm, and involvement in the work.

Conflicts of Interest

The authors declare no conflict of interest.

References

  1. Gang, W.; Shan-Heng, H.; Hong-Chang, W.; Yue-Chu, L.; Hong-Bing, D.; Jing-Zhu, Z. Living characteristics of rare and endangered species—Davidia involucrata. J. For. Res. 2004, 15, 39–44. [Google Scholar] [CrossRef]
  2. Jinsheng, H.; Jie, L.; Weilie, C. The current status of endemic and endangered species Davidia involucrata and the preserving strategies. Biodivers. Sci. 1995, 3, 213. [Google Scholar]
  3. Jiaxun, Z. Studies on Chinese dovetree propagation and cultivation techniques. J. Beijing For. Univ. 1995, 17, 24–29. [Google Scholar]
  4. Zimmerman, J.L. Somatic embryogenesis: A model for early development in higher plants. Plant Cell 1993, 5, 1411. [Google Scholar] [CrossRef] [Green Version]
  5. Ebrahimi, M.; Mokhtari, A.; Amirian, R. A highly efficient method for somatic embryogenesis of Kelussia odorotissima Mozaff., an endangered medicinal plant. Plant Cell Tissue Organ Cult. PCTOC 2018, 132, 99–110. [Google Scholar] [CrossRef]
  6. Guan, Y.; Li, S.G.; Fan, X.F.; Su, Z.H. Application of somatic embryogenesis in woody plants. Front. Plant Sci. 2016, 7, 938. [Google Scholar] [CrossRef] [PubMed] [Green Version]
  7. Deng, W.; Luo, K.; Li, Z.; Yang, Y. A novel method for induction of plant regeneration via somatic embryogenesis. Plant Sci. 2009, 177, 43–48. [Google Scholar] [CrossRef]
  8. Isah, T. Induction of somatic embryogenesis in woody plants. Acta Physiol. Plant. 2016, 38, 118. [Google Scholar] [CrossRef]
  9. De Jong, A.J.; Schmidt, E.D.; De Vries, S.C. Early events in higher-plant embryogenesis. Plant Mol. Biol. 1993, 22, 367–377. [Google Scholar] [CrossRef]
  10. Karami, O.; Aghavaisi, B.; Mahmoudi Pour, A. Molecular aspects of somatic-to-embryogenic transition in plants. J. Chem. Biol. 2009, 2, 177–190. [Google Scholar] [CrossRef] [Green Version]
  11. Liu, W.; Wang, C.; Shen, X.; Liang, H.; Wang, Y.; He, Z.; Zhang, D.; Chen, F. Comparative transcriptome analysis highlights the hormone effects on somatic embryogenesis in Catalpa bungei. Plant Reprod. 2019, 32, 141–151. [Google Scholar] [CrossRef]
  12. Kang, H.I.; Lee, C.B.; Kwon, S.H.; Park, J.M.; Kang, K.S.; Shim, D. Comparative transcriptome analysis during developmental stages of direct somatic embryogenesis in Tilia amurensis Rupr. Sci. Rep. 2021, 11, 6359. [Google Scholar] [CrossRef] [PubMed]
  13. Ikeuchi, M.; Iwase, A.; Rymen, B.; Lambolez, A.; Kojima, M.; Takebayashi, Y.; Heyman, J.; Watanabe, S.; Seo, M.; De Veylder, L.; et al. Wounding triggers callus formation via dynamic hormonal and transcriptional changes. Plant Physiol. 2017, 175, 1158–1174. [Google Scholar] [CrossRef] [Green Version]
  14. Lowe, R.; Shirley, N.; Bleackley, M.; Dolan, S.; Shafee, T. Transcriptomics technologies. PLoS Comput. Biol. 2017, 13, e1005457. [Google Scholar] [CrossRef] [Green Version]
  15. Li, P.; Ponnala, L.; Gandotra, N.; Wang, L.; Si, Y.; Tausta, S.L.; Kebrom, T.H.; Provart, N.; Patel, R.; Myers, C.R.; et al. The developmental dynamics of the maize leaf transcriptome. Nat. Genet. 2010, 42, 1060. [Google Scholar] [CrossRef] [PubMed]
  16. Lee, N.N.; Lee, S.A.; Kang, M.J.; Joo, H.J.; Kim, J.A.; Park, E.J. Comparative transcriptome analysis between embryogenic and nonembryogenic callus of Kalopanax septemlobus. For. Sci. Technol. 2020, 16, 145–153. [Google Scholar] [CrossRef]
  17. Lai, Z.; Lin, Y. Analysis of the global transcriptome of longan (Dimocarpus longan Lour.) embryogenic callus using Illumina paired-end sequencing. BMC Genom. 2013, 14, 561. [Google Scholar] [CrossRef] [Green Version]
  18. Fehér, A. Somatic embryogenesis—stress-induced remodeling of plant cell fate. Biochim. Biophys. Acta BBA Gene Regul. Mech. 2015, 1849, 385–402. [Google Scholar] [CrossRef] [PubMed]
  19. Cuenca, B.; San-José, M.C.; Martinez, M.; Ballester, A.; Vieitez, A. Somatic embryogenesis from stem and leaf explants of Quercus robur L. Plant Cell Rep. 1999, 18, 538–543. [Google Scholar] [CrossRef]
  20. Altamura, M.M.; Della Rovere, F.; Fattorini, L.; D’Angeli, S.; Falasca, G. Recent advances on genetic and physiological bases of in vitro somatic embryo formation. Vitr. Embryog. High. Plants 2016, 1359, 47–85. [Google Scholar]
  21. Murashige, T.; Skoog, F. A revised medium for rapid growth and bio assays with tobacco tissue cultures. Physiol. Plant. 1962, 15, 473–497. [Google Scholar] [CrossRef]
  22. Reuter, J.A.; Spacek, D.V.; Snyder, M.P. High-throughput sequencing technologies. Mol. Cell 2015, 58, 586–597. [Google Scholar] [CrossRef] [PubMed] [Green Version]
  23. Schmittgen, T.D.; Livak, K.J. Analyzing real-time PCR data by the comparative CT method. Nat. Protoc. 2008, 3, 1101–1108. [Google Scholar] [CrossRef] [PubMed]
  24. Livak, K.J.; Schmittgen, T.D. Analysis of relative gene expression data using real-time quantitative PCR and the 2-ΔΔCT method. Methods 2001, 25, 402–408. [Google Scholar] [CrossRef] [PubMed]
  25. Cohen, I.; Huang, Y.; Chen, J.; Benesty, J.; Benesty, J.; Chen, J.; Huang, Y.; Cohen, I. Pearson correlation coefficient. In Noise Reduction in Speech Processing; Springer: Berlin/Heidelberg, Germany, 2009; pp. 1–4. [Google Scholar]
  26. Love, M.I.; Huber, W.; Anders, S. Moderated estimation of fold change and dispersion for RNA-seq data with DESeq2. Genome Biol. 2014, 15, 550. [Google Scholar] [CrossRef] [Green Version]
  27. Ernst, J.; Bar-Joseph, Z. STEM: A tool for the analysis of short time series gene expression data. BMC Bioinform. 2006, 7, 191. [Google Scholar] [CrossRef] [Green Version]
  28. Segal, E.; Taskar, B.; Gasch, A.; Friedman, N.; Koller, D. Rich probabilistic models for gene expression. Bioinformatics 2001, 17, S243–S252. [Google Scholar] [CrossRef] [Green Version]
  29. Ge, F.; Luo, X.; Huang, X.; Zhang, Y.; He, X.; Liu, M.; Lin, H.; Peng, H.; Li, L.; Zhang, Z.; et al. Genome-wide analysis of transcription factors involved in maize embryonic callus formation. Physiol. Plant. 2016, 158, 452–462. [Google Scholar] [CrossRef]
  30. Gaj, M.D. Factors influencing somatic embryogenesis induction and plant regeneration with particular reference to Arabidopsis thaliana (L.) Heynh. Plant Growth Regul. 2004, 43, 27–47. [Google Scholar] [CrossRef]
  31. Jin, F.; Hu, L.; Yuan, D.; Xu, J.; Gao, W.; He, L.; Yang, X.; Zhang, X. Comparative transcriptome analysis between somatic embryos (SE s) and zygotic embryos in cotton: Evidence for stress response functions in SE development. Plant Biotechnol. J. 2014, 12, 161–173. [Google Scholar] [CrossRef]
  32. Thomas, C.; Jiménez, V.M. Mode of action of plant hormones and plant growth regulators during induction of somatic embryogenesis: Molecular aspects. In Somatic Embryogenesis; Springer: Berlin/Heidelberg, Germany, 2005; pp. 157–175. [Google Scholar]
  33. Yang, X.; Zhang, X.; Yuan, D.; Jin, F.; Zhang, Y.; Xu, J. Transcript profiling reveals complex auxin signalling pathway and transcription regulation involved in dedifferentiation and redifferentiation during somatic embryogenesis in cotton. BMC Plant Biol. 2012, 12, 110. [Google Scholar] [CrossRef] [PubMed] [Green Version]
  34. Garcia, M.E.; Lynch, T.; Peeters, J.; Snowden, C.; Finkelstein, R. A small plant-specific protein family of ABI five binding proteins (AFPs) regulates stress response in germinating Arabidopsis seeds and seedlings. Plant Mol. Biol. 2008, 67, 643–658. [Google Scholar] [CrossRef] [PubMed]
  35. Nolan, T.M.; Vukašinović, N.; Liu, D.; Russinova, E.; Yin, Y. Brassinosteroids: Multidimensional regulators of plant growth, development, and stress responses. Plant Cell 2020, 32, 295–318. [Google Scholar] [CrossRef] [PubMed] [Green Version]
  36. Singh, K.B.; Foley, R.C.; Oñate-Sánchez, L. Transcription factors in plant defense and stress responses. Curr. Opin. Plant Biol. 2002, 5, 430–436. [Google Scholar] [CrossRef] [PubMed]
  37. Alves, M.S.; Dadalto, S.P.; Gonçalves, A.B.; De Souza, G.B.; Barros, V.A.; Fietto, L.G. Plant bZIP transcription factors responsive to pathogens: A review. Int. J. Mol. Sci. 2013, 14, 7815–7828. [Google Scholar] [CrossRef] [PubMed] [Green Version]
  38. Rose, J.K.; Braam, J.; Fry, S.C.; Nishitani, K. The XTH family of enzymes involved in xyloglucan endotransglucosylation and endohydrolysis: Current perspectives and a new unifying nomenclature. Plant Cell Physiol. 2002, 43, 1421–1435. [Google Scholar] [CrossRef] [PubMed] [Green Version]
  39. Salaün, C.; Lepiniec, L.; Dubreucq, B. Genetic and molecular control of somatic embryogenesis. Plants 2021, 10, 1467. [Google Scholar] [CrossRef] [PubMed]
  40. Gulzar, B.; Mujib, A.; Malik, M.Q.; Sayeed, R.; Mamgain, J.; Ejaz, B. Genes, proteins and other networks regulating somatic embryogenesis in plants. J. Genet. Eng. Biotechnol. 2020, 18, 31. [Google Scholar] [CrossRef]
  41. Hussain, A.; Qarshi, I.A.; Nazir, H.; Ullah, I. Plant tissue culture: Current status and opportunities. In Recent Advances in Plant in Vitro Culture; IntechOpen: London, UK, 2012; Volume 6, pp. 1–28. [Google Scholar]
  42. Chen, C.J.; Liu, Q.; Zhang, Y.C.; Qu, L.H.; Chen, Y.Q.; Gautheret, D. Genome-wide discovery and analysis of microRNAs and other small RNAs from rice embryogenic callus. RNA Biol. 2011, 8, 538–547. [Google Scholar] [CrossRef] [Green Version]
  43. Von Aderkas, P.; Bonga, J.M. Influencing micropropagation and somatic embryogenesis in mature trees by manipulation of phase change, stress and culture environment. Tree Physiol. 2000, 20, 921–928. [Google Scholar] [CrossRef] [Green Version]
  44. Su, Y.H.; Liu, Y.B.; Bai, B.; Zhang, X.S. Establishment of embryonic shoot–root axis is involved in auxin and cytokinin response during Arabidopsis somatic embryogenesis. Front. Plant Sci. 2015, 5, 792. [Google Scholar] [CrossRef] [PubMed] [Green Version]
  45. Zhao, X.; Song, J.; Zeng, Q.; Ma, Y.; Fang, H.; Yang, L.; Deng, B.; Liu, J.; Fang, J.; Zuo, L.; et al. Auxin and cytokinin mediated regulation involved in vitro organogenesis of papaya. J. Plant Physiol. 2021, 260, 153405. [Google Scholar] [CrossRef] [PubMed]
  46. Li, J.; Zhang, D.; Ouyang, K.; Chen, X. High frequency plant regeneration from leaf culture of Neolamarckia cadamba. Plant Biotechnol. 2019, 36, 13–19. [Google Scholar] [CrossRef] [PubMed] [Green Version]
  47. Leisner, C.P.; Ming, R.; Ainsworth, E.A. Distinct transcriptional profiles of ozone stress in soybean (Glycine max) flowers and pods. BMC Plant Biol. 2014, 14, 335. [Google Scholar]
  48. He, W.; Zhu, M.r.; Shan, H.y.; Jiang, Y.l.; An, X.l.; Wan, X.Y. Development Regulatory Factors Promoting Efficient Plant Genetic Transformation and Their Application in Maize. China Biotechnol. 2022, 42, 85–98. [Google Scholar]
  49. Boutilier, K.; Offringa, R.; Sharma, V.K.; Kieft, H.; Ouellet, T.; Zhang, L.; Hattori, J.; Liu, C.M.; Van Lammeren, A.A.; Miki, B.L.; et al. Ectopic expression of BABY BOOM triggers a conversion from vegetative to embryonic growth. Plant Cell 2002, 14, 1737–1749. [Google Scholar] [CrossRef] [Green Version]
  50. Cheng, S.; Huang, Y.; Zhu, N.; Zhao, Y. The rice WUSCHEL-related homeobox genes are involved in reproductive organ development, hormone signaling and abiotic stress response. Gene 2014, 549, 266–274. [Google Scholar] [CrossRef]
  51. Horstman, A.; Bemer, M.; Boutilier, K. A transcriptional view on somatic embryogenesis. Regeneration 2017, 4, 201–216. [Google Scholar] [CrossRef]
  52. Zhao, S.; Jiang, Q.T.; Ma, J.; Zhang, X.W.; Zhao, Q.Z.; Wang, X.Y.; Wang, C.S.; Cao, X.; Lu, Z.X.; Zheng, Y.L.; et al. Characterization and expression analysis of WOX5 genes from wheat and its relatives. Gene 2014, 537, 63–69. [Google Scholar] [CrossRef]
  53. Debernardi, J.M.; Tricoli, D.M.; Ercoli, M.F.; Hayta, S.; Ronald, P.; Palatnik, J.F.; Dubcovsky, J. A GRF–GIF chimeric protein improves the regeneration efficiency of transgenic plants. Nat. Biotechnol. 2020, 38, 1274–1279. [Google Scholar] [CrossRef]
  54. Luo, G.; Palmgren, M. GRF-GIF chimeras boost plant regeneration. Trends Plant Sci. 2021, 26, 201–204. [Google Scholar] [CrossRef] [PubMed]
  55. Ding, M.; Dong, H.; Xue, Y.; Su, S.; Wu, Y.; Li, S.; Liu, H.; Li, H.; Han, J.; Shan, X.; et al. Transcriptomic analysis reveals somatic embryogenesis-associated signaling pathways and gene expression regulation in maize (Zea mays L.). Plant Mol. Biol. 2020, 104, 647–663. [Google Scholar] [CrossRef] [PubMed]
  56. Zhou, C.; Wang, S.; Zhou, H.; Yuan, Z.; Zhou, T.; Zhang, Y.; Xiang, S.; Yang, F.; Shen, X.; Zhang, D. Transcriptome sequencing analysis of sorghum callus with various regeneration capacities. Planta 2021, 254, 33. [Google Scholar] [CrossRef] [PubMed]
  57. Schmidt, E.D.; Guzzo, F.; Toonen, M.A.; Vries, S.C.d. A leucine-rich repeat containing receptor-like kinase marks somatic plant cells competent to form embryos. Development 1997, 124, 2049–2062. [Google Scholar] [CrossRef]
  58. Ren, H.; Gray, W.M. SAUR proteins as effectors of hormonal and environmental signals in plant growth. Mol. Plant 2015, 8, 1153–1164. [Google Scholar] [CrossRef] [Green Version]
  59. Zanin, F.C.; Freitas, N.C.; Pinto, R.T.; Máximo, W.P.F.; Diniz, L.E.C.; Paiva, L.V. The SAUR gene family in coffee: Genome-wide identification and gene expression analysis during somatic embryogenesis. Mol. Biol. Rep. 2022, 49, 1973–1984. [Google Scholar] [CrossRef] [PubMed]
  60. Sahoo, K.K.; Tripathi, A.K.; Pareek, A.; Sopory, S.K.; Singla-Pareek, S.L. An improved protocol for efficient transformation and regeneration of diverse indica rice cultivars. Plant Methods 2011, 7, 49. [Google Scholar] [CrossRef] [Green Version]
Figure 1. EC and NEC of D. involucrata derived from immature zygotic embryos. Immature zygotic embryos of D. involucrata were utilized as explants to induce callus formation on MS medium with varying ratios of plant growth regulators. (a) Callus induced by adding 1.0 mg/L 2,4-D + 0.2 mg/L 6-BA, labeled as EC1. (b) Callus induced by adding 0.5 mg/L NAA + 1.0 mg/L 6-BA, labeled as EC2. (c) Callus induced by adding 1.0 mg/L NAA + 1.0 mg/L 6-BA, labeled as EC3. (d) Callus induced by adding 1.5 mg/L TDZ, labeled as NEC. Bar: 1 cm.
Forests 14 01256 g001
Figure 2. Length distribution of the final assembled unigenes; the X-axis shows the sequence lengths of the unigenes and the-Y axis shows the number of unigenes.
Forests 14 01256 g002
Figure 3. Characteristics of the homology search of unigenes in the Nr database: (a) E-value distribution of unigene hits against the Nr database and (b) percentage of unigene matches to the main species in the Nr database.
Forests 14 01256 g003
Figure 4. GO and KEGG classifications of the assembled unigenes. (a) The ordinate on the left represents the secondary GO classification, the abscissa represents the number of unigenes contained in the secondary classification, and the three colors on the right represent the three major branches of GO (i.e., BP, CC, and MF). (b) The X-axis displays the number of unigenes annotated to the pathway, while the Y-axis shows the name of the KEGG metabolic pathway.
Forests 14 01256 g004
Figure 5. Pearson correlation coefficients between replicates. The right and lower sides of the figure are sample names, the left and upper sides are sample clustering, and different colors represent the size of the correlation coefficient between samples.
Forests 14 01256 g005
Figure 6. DEG statistics of different comparative combinations between EC and NEC. (a) DEG statistics: the X-axis represents different difference comparison groups and the Y-axis represents the number of corresponding downregulated genes. Red represents upregulation and blue represents downregulation. (b) Venn diagram of total DEGs in different comparisons. The different colored circles represent different gene sets, and the values represent the number of shared and unique genes among the different gene sets. The sum of all numbers inside the circle represents the sum of the number of genes in the gene set, and the intersection area of the circle represents the number of genes in each gene set.
Forests 14 01256 g006
Figure 7. DEG volcano maps of different comparative combinations between EC and NEC. The X-axis displays the fold change value of the gene expression difference between the two samples, that is, the value obtained by dividing the expression level of the treatment sample by the expression level of the control sample. The Y-axis shows the statistical test value of the difference in gene expression, that is, the p-value; the higher the p-value, the more significant the expression difference. The values of both axes have been logarithmized. Each point in the figure represents a specific unigene; red points represent significantly upregulated unigenes, blue points represent significantly downregulated unigenes, and gray points represent unigenes without significant differences. After mapping all the genes, it can be seen that the point on the left is the unigene with differentially downregulated expression and the point on the right is the unigene with differentially upregulated expression.
Forests 14 01256 g007
Figure 8. Hierarchical cluster analysis of DEGs between EC and NEC. Each column in the figure represents a sample, while each row represents a unigene. The colors in the figure represents the expression levels of the unigenes in the samples. The default red color represents a high expression level of the unigene in the sample, while blue indicates a low expression level. Please refer to the number label under the color bar at the upper right for the specific expression change trends. The dendrograms for unigene clustering are displayed on the left; the closer the two unigene branches are, the closer their expression levels are. The upper part shows the dendrogram of sample clustering; the closer the two sample branches are, the closer the expression clustering patterns of the two samples.
Forests 14 01256 g008
Figure 9. Transcriptional fold changes of auxin, cytokinin, and stress signaling pathway-related genes in EC and NEC. Selected genes are indicated on the right, while samples are indicated on the bottom. These genes were identified as being differentially expressed (with fold change expression values provided as log-base 2) between EC samples and NEC samples. Upregulated genes are shown in red and downregulated genes are shown in green. Please refer to the number label under the color bar at the upper right for the specific expression change trends.
Forests 14 01256 g009
Figure 10. Transcriptional fold changes of somatic embryogenesis-related genes in EC and NEC. Selected genes are indicated on the right, while samples are indicated on the bottom. These genes were identified as being differentially expressed (with fold change expression values provided as log-base 2) between EC samples and NEC samples. Upregulated genes are shown in red and downregulated genes are shown in green. Please refer to the number label under the color bar at the upper right for the specific expression change trends.
Forests 14 01256 g010
Figure 11. qRT-PCR validation. Comparison of the relative log 2 (FoldChange) between RNA-seq and qRT-PCR in EC and NEC. The X-axis displays the selected genes, while the Y-axis shows the log 2 (FoldChange).
Forests 14 01256 g011
Table 1. Original sequencing data and quality control data.
SampleRaw ReadsClean ReadsQ20(%)Q30(%)GC(%)
EC1-146,199,65645,868,45297.9793.9145.47
EC1-247,204,67046,872,52498.0194.0345.73
EC1-345,304,08444,904,79897.9893.8945.89
EC2-156,352,53255,913,28297.8993.7646.17
EC2-251,604,73851,177,09097.9994.0446.41
EC2-347,956,02647,574,05897.8593.6046.05
EC3-150,727,81050,209,17497.7493.4546.44
EC3-249,086,68848,718,58097.9093.7746.36
EC3-342,768,29642,412,91297.8093.5346.06
NEC-142,526,44642,191,98897.9793.8945.89
NEC-248,282,19447,874,35497.9994.0245.98
NEC-345,549,36245,213,08497.9293.7446.00
Total714,945,156709,247,312
Table 2. Results of de novo transcriptome assembly performed with Trinity.
TypeUnigeneTranscript
Total number131,109195,250
Total base113,852,321203,207,453
Largest length (bp)14,07014,070
Smallest length (bp)201201
Average length (bp)868.381040.76
N50 length (bp)13821710
E90N50 length (bp)26832236
Fragment mapped percent (%)58.6383.452
GC percent (%)39.2739.97
TransRate score0.26180.37417
BUSCO scoreC: 76.9% [S: 72.1%;D: 4.8%]C: 94.2% [S: 49.7%;D: 44.5%]
Table 3. Unigene annotations in the six databases used for analysis.
Data BaseAll Unigene NumberPercent (%)
GO42,01932.05
KEGG16,02712.22
eggNOG41,03531.30
Nr51,90939.59
Swiss-Prot30,40723.19
Pfam27,17620.73
Total_anno52,42039.98
Total131,109
Table 4. Pearson correlation coefficients between biological replicates of different samples.
SampleSampleSamplePearson Correlation Coefficient (r2)
EC1120.969
EC1130.976
EC1230.971
EC2120.991
EC2130.970
EC2230.966
EC3120.996
EC3130.986
EC3230.992
NEC120.976
NEC130.985
NEC230.990
Table 5. Differentially expressed transcription factor families between EC and NEC.
FamilyNumberProportionEC1 vs. NECEC2 vs. NECEC3 vs. NEC
UpDownUpDownNo ChangeUpDown
MYB superfamily6413.73%41233628 4024
AP2/ERF5612.02%2828292613026
bHLH4810.30%3993711 3810
NAC398.37%1029132511326
C2C2357.51%1817827 1619
WRKY296.22%722722 524
LOB245.15%1311159 186
LBD234.94%176176 185
GRAS183.86%1266111126
bZIP153.22%8787 96
TCP143.00%11395 104
B3 superfamily132.79%10376 112
HSF132.79%5839149
MADS122.58%93831102
Nin-like91.93%9 9 9
ZF-HD81.72%8 52171
GRF71.50%5252 52
C2H261.29%3351 42
NF-Y61.29%6 6 6
FAR151.07%2323 23
C3H51.07%3232 32
SBP40.86%4 22 4
GeBP30.64%2121 21
CPP30.64%1212 12
SRS30.64%3 3 3
BES110.21% 1 1 1
S1Fa-like10.21% 1 1 1
Whirly10.21%1 1 1
E2F/DP10.21%1 1 1
Table 6. Selection of candidate reference genes based on the transcriptome database.
SampleCACUBQ
EC1-124.6320.02
EC1-223.9319.63
EC1-324.4418.64
EC3-123.0718.20
EC3-224.1819.14
EC3-325.2619.40
NEC-124.7619.95
NEC-224.5619.30
NEC-325.0419.12
Disclaimer/Publisher’s Note: The statements, opinions and data contained in all publications are solely those of the individual author(s) and contributor(s) and not of MDPI and/or the editor(s). MDPI and/or the editor(s) disclaim responsibility for any injury to people or property resulting from any ideas, methods, instructions or products referred to in the content.

