Article

Tree Species Classification Based on PointNet++ and Airborne Laser Survey Point Cloud Data Enhancement

College of Transportation and Civil Engineering, Fujian Agriculture and Forestry University, Fuzhou 350100, China
*
Author to whom correspondence should be addressed.
Forests 2023, 14(6), 1246; https://doi.org/10.3390/f14061246
Submission received: 29 April 2023 / Revised: 29 May 2023 / Accepted: 14 June 2023 / Published: 15 June 2023
(This article belongs to the Special Issue Artificial Intelligence and Machine Learning Applications in Forestry)

Abstract

:
Compared with ground-based light detection and ranging (LiDAR) data, the differential distribution of the quantity and quality of point cloud data from airborne LiDAR poses difficulties for tree species classification. To verify the feasibility of using the PointNet++ algorithm for point cloud tree species classification with airborne LiDAR data, we selected 11 tree species from the Minjiang River Estuary Wetland Park in Fuzhou City and Sanjiangkou Ecological Park. Training and testing sets were constructed through pre-processing and segmentation, and direct and enhanced down-sampling methods were used for tree species classification. Experiments were conducted to adjust the hyperparameters of the proposed algorithm. The optimal hyperparameter settings used the multi-scale sampling and grouping (MSG) method, down-sampling of the point cloud to 2048 points after enhancement, and a batch size of 16, which resulted in 91.82% classification accuracy. PointNet++ could be used for tree species classification using airborne LiDAR data with an insignificant impact on point cloud quality. Considering the differential distribution of the point cloud quantity, enhanced down-sampling yields improved the classification results compared to direct down-sampling. The MSG classification method outperformed the simplified sampling and grouping classification method, and the number of epochs and batch size did not impact the results.

1. Introduction

As the largest terrestrial ecosystem and gene bank, forests not only have important economic value but also play a huge role in maintaining ecological balance and carbon neutrality [1,2]. With rapid global climate change and the overexploitation of natural resources by humans, the loss of diversity of forest tree species has become an important environmental issue [3]. Therefore, rapid and accurate identification of forest tree species at the individual tree level has important implications and far-reaching significance for the protection of forest tree species diversity and macro-monitoring of forest ecosystems [4]. Additionally, the identification results can provide data for research on alien species invasion [5], rare tree species monitoring [6], forest resource surveys [7], and pest monitoring [8].
Traditional methods for tree species identification rely mainly on field exploration and plot investigation, and identification is based on the visual interpretation of the external morphology or structural characteristics of tree species [9]. With the advancement of remote sensing technology, researchers initially developed and utilized medium-resolution satellite remote sensing data for regional-scale forest classification. However, due to the constraints of spatial resolution, it was impossible to accurately delineate individual trees. This approach was only suitable for identifying the species composition of forest communities [10,11,12]. To achieve tree species identification at the individual tree level, high-resolution images capable of distinguishing individual tree crowns are required [13,14]. Yet, the high cost of collecting high-resolution satellite remote sensing image data and the complexity of data processing hinder its widespread application [15]. Optical remote sensing images struggle to overcome dependence on sunlight (due to object anisotropic reflection) and the impact of constantly changing and differing lighting conditions on radiation measurements [16,17]. With the development of active remote sensing technology, specifically Light Detection and Ranging (LiDAR) technology [18], the three-dimensional shape and structure of trees can be described and modeled in detail, including factors such as tree height, crown width, tree crown shape, and branch structure. Moreover, LiDAR can obtain vertical structural information of vegetation, including information on the understory and ground layer [19,20]. As an active remote sensing technology, LiDAR emits its own light source and receives reflected signals. The quality of its data is not affected by weather and lighting conditions, and it has a high spatial resolution. Due to these features, LiDAR technology has significant advantages in tree species identification at the individual tree level [21,22,23]. Currently, the main LiDAR techniques are Airborne Laser Scanning (ALS) [24,25], Terrestrial Laser Scanning (TLS) [26,27], and Backpacked Laser Scanning (BLS) [28]. The difference between these lies primarily in the relative spatial position between the sensor and the data to be acquired, which can cause significant differences in efficiency, point cloud density, and completeness. Generally, BLS and TLS obtain high-quality point clouds, whereas ALS has an advantage in terms of point cloud acquisition efficiency [29].
Currently, commonly used point cloud tree species classification methods include those based on point cloud feature extraction [30], such as individual tree features or point cloud features. The disadvantage of this is the dependency on the point cloud quality, such that the selected features directly affect the final classification result. Classification methods are based on point cloud data projection transformation [31], such as projecting point clouds onto different 2D planes for image recognition classification, with a disadvantage in the loss of geometric structural information. Moreover, point cloud classification is based on deep learning, such as PointNet [32] and its improved version, PointNet++ [33]. Currently, these methods are rarely used for tree species classification and exhibit many problems but could fully exploit the three-dimensional structural information of point cloud data, thereby improving classification accuracy. At the same time, PointNet++ eliminates the need for preprocessing and feature engineering, simplifying the data processing workflow. Moreover, PointNet++ can automatically learn high-level features and patterns, enhancing the model’s generalization ability.
PointNet++ is a deep learning network structure based on point cloud data [34] and uses a hierarchical method to divide the point cloud data from the global point cloud set into smaller local regions, layer-by-layer, until the number of points in each region reaches a fixed threshold. Feature extraction and coding are then performed on the points of each local region, and the features of different levels are finally merged and aggregated to obtain a feature representation of the entire point cloud. This method has been applied to point cloud classification. For example, Xin [35] used X-ray computed tomography to obtain 3D volume data of metal powder particles, classified them into six categories using PointNet++, and achieved an accuracy of 93.8%. Further, Yang [36] collected 300 clinical CT data points on femurs and used the improved PointNet++ network to divide femurs into three parts: femoral head, neck, and shaft, and acquired a result accuracy of >95%. Jing [37] integrated the Squeeze-and-Excitation (SE) attention mechanism into PointNet++ for multispectral LiDAR point cloud classification tasks and used the PointNet++ model to classify roads, buildings, grasslands, trees, soils, and power lines, achieving an overall accuracy of 91.16%. In tree species classification, Liu et al. [38] used BLS as the data source to study several tree species, and the results showed that the Farthest Point Sampling (FPS) down-sampling method had the most significant effect, with a tree species classification accuracy of over 95%. BLS has a lower survey efficiency than ALS, but better data quality and consistency.
Accordingly, this study used the PointNet++ algorithm to classify airborne point cloud data of tree species to improve the efficiency and accuracy of tree species identification.

2. Overview of Study Area and Data Prediction Processing

2.1. Study Area and Experimental Instruments

As depicted in Figure 1, the point cloud data used in this study consist of two parts. The first set of data was obtained from the Minjiang Estuary National Wetland Park in Fuzhou (119°5′36″ E–119°41′5″ E, 25°50′43″ N–26°9′42″ N). The forest here is a natural forest with an approximate canopy closure of 0.5. The main tree species are Formosa acacia (Acacia confusa), Birch (Betula fujianensis), and Camphor (Cinnamomum camphora), with a distribution of species such as Mango (Mangifera indica), Bodhi (Ficus religiosa), and Simon poplar (Populus simonii). The second set of data is from the Sanjiangkou Ecological Park in Fuzhou (119°22′42″ E–119°23′35″ E, 26°1′10″ N–26°0′34″ N). The forest here is man-made with an approximate canopy closure of 0.6. The primary tree species are Winged Soapberry, Council trees (Ficus altissima), Cotton trees (Bombax ceiba), and Terminalia neotaliala (Terminalia neotaliala), with a distribution of species such as wingleaf soapberry (Sapindus saponaria) and Scholar trees (Alstonia scholaris). The ALS data of the two study areas were acquired using a SAL-1500 3D scanning system on 15 March 2022, and 11 October 2022. Table 1 presents the key parameters of the SAL-1500 system.
A deep learning framework, PyTorch (1.8 + CUDA 11.4), was used for the experiments. The experiments were conducted on Ubuntu 20.04, with a computer configuration that included an Intel Xeon W-2255 CPU @ 3.70 GHz, 64 GB of RAM, and an NVIDIA GeForce RTX 3080Ti (12 GB) graphics card.

2.2. Data Preprocessing

To obtain single tree point clouds that satisfy the input requirements of the PointNet++ model, the raw point cloud data collected using airborne LiDAR sensors was preprocessed. The implementation of the data preprocessing was completed in GreenValley International’s LiDAR 360 processing software (V6.0.1.0) [39]. Following are the preprocessing steps: (1) removal of interfering noise; (2) identification of ground points and segmentation of ground data; (3) single-tree segmentation using the watershed algorithm; and (4) field survey and manual adjustment.

2.2.1. Noise Removal

To improve the accuracy of point cloud processing, it is first necessary to eliminate noise caused by the sensor itself, drone movement, and surrounding environmental interference, including high-altitude gross errors, low-altitude gross errors, and isolated points. In this study, we utilized morphological filtering methods [40], eroding isolated data points or small clusters of points that were incongruous with the overall data structure. This strategy effectively eliminates noise while preserving the overall structure of the point cloud. It’s important to note that the noise reduction effectiveness of this method depends on the size of the chosen structuring element and the erosion threshold. Therefore, manual inspection is necessary to assess the outcome after the noise reduction process.

2.2.2. Ground Point Classification

After denoising, the obtained point cloud data contains both tree point clouds and ground points that are irrelevant to the research. Therefore, it is necessary to separate the ground data by segmentation to obtain complete tree point clouds. In this study, we employ the Progressive TIN Densification (PTD) method [41]. This method creates a triangulation network from initial ground points and successively adds the remaining points to this network. Upon adding each point, TIN checks whether certain slope conditions are satisfied. If they are, the point is added to the network; otherwise, it’s skipped. In this way, the PTD algorithm gradually increases the density of ground points, separating the ground point cloud from the tree point cloud.

2.2.3. Single-Tree Segmentation

To acquire single-tree point clouds for classification learning, this study used the watershed algorithm [42] for single-tree segmentation. We obtained the Canopy Height Model (CHM) by subtracting the Digital Elevation Model (DEM) from the Digital Surface Model (DSM). Then, we extracted the CHM markers and applied the watershed algorithm, forming enclosed, coherent crown contour polygons around tree apexes, thus accomplishing single-tree segmentation.

2.2.4. Field Investigation and Manual Adjustment

Relying solely on the results of automated computer processing and analysis may introduce some errors and biases. Therefore, a subsequent field survey was conducted upon completion of single-tree segmentation. Factors such as sample noise, remaining ground points, and canopy integrity are considered, and the accuracy of the segmented point cloud data was compared with actual trees in the field. Manual adjustments were made to over-segmented and unsegmented sample data, ensuring the acquisition of the final single-tree point cloud data.

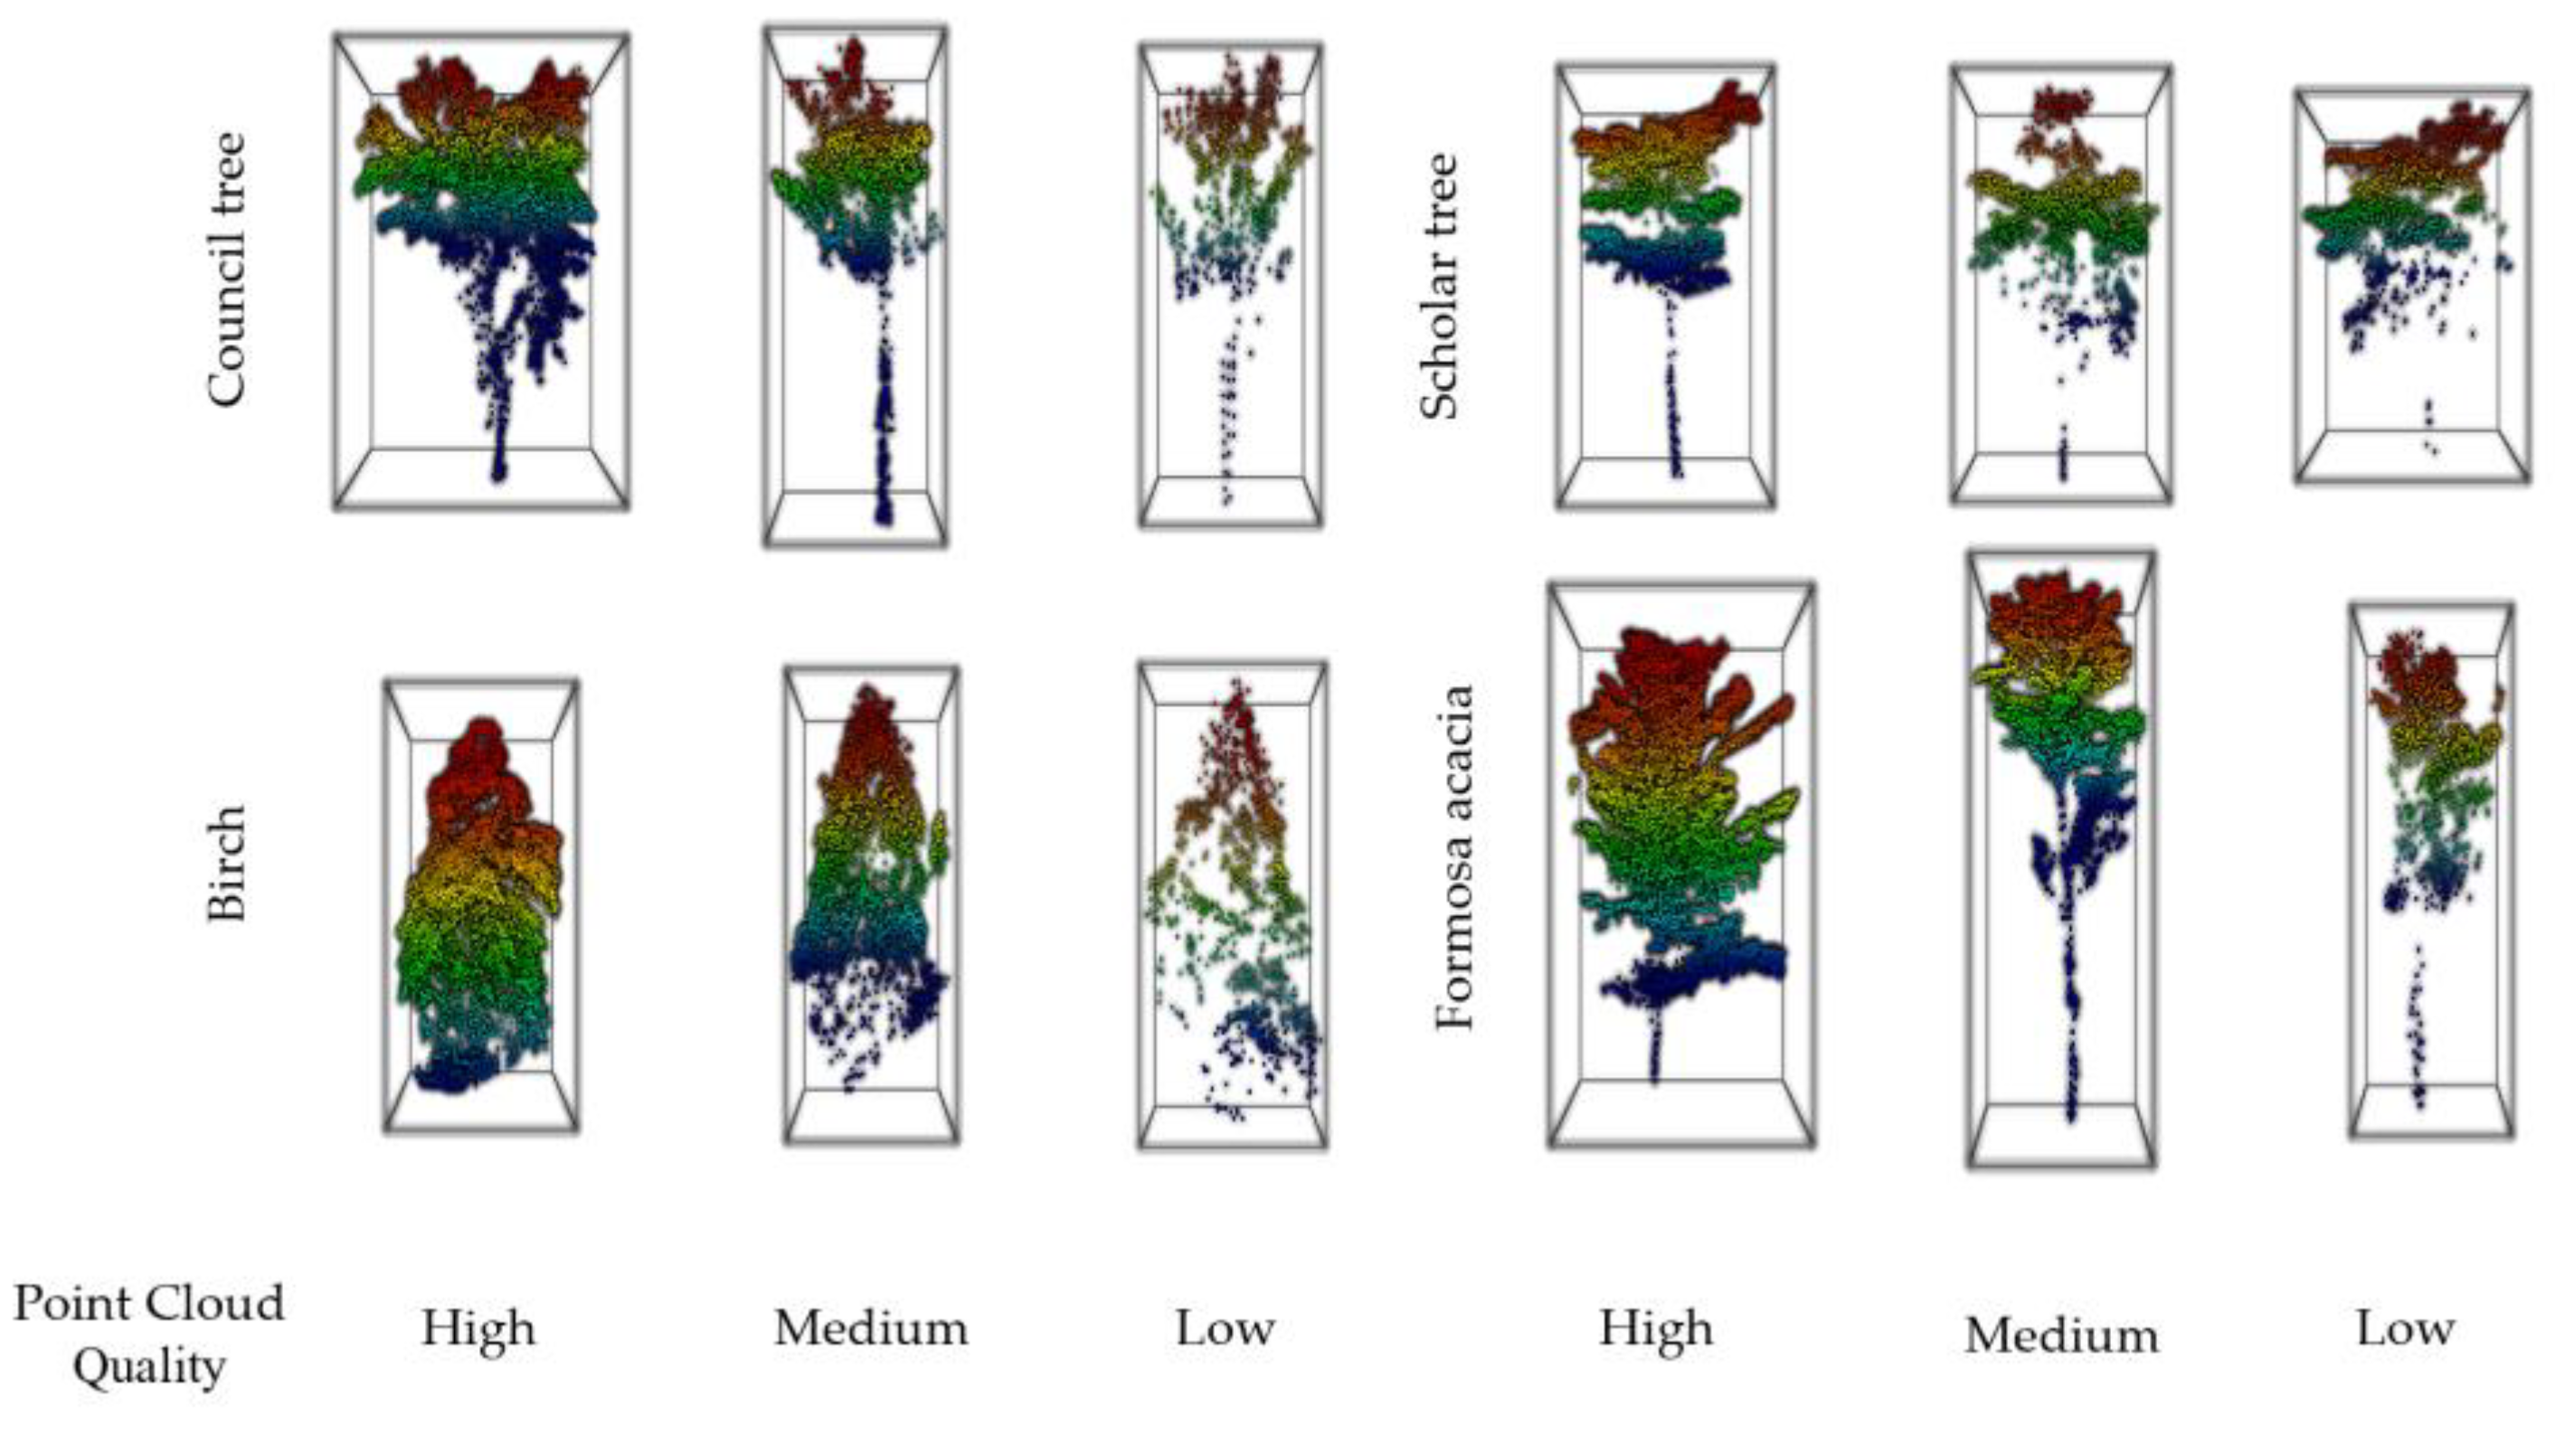
2.3. Down-Sampling of Point Clouds
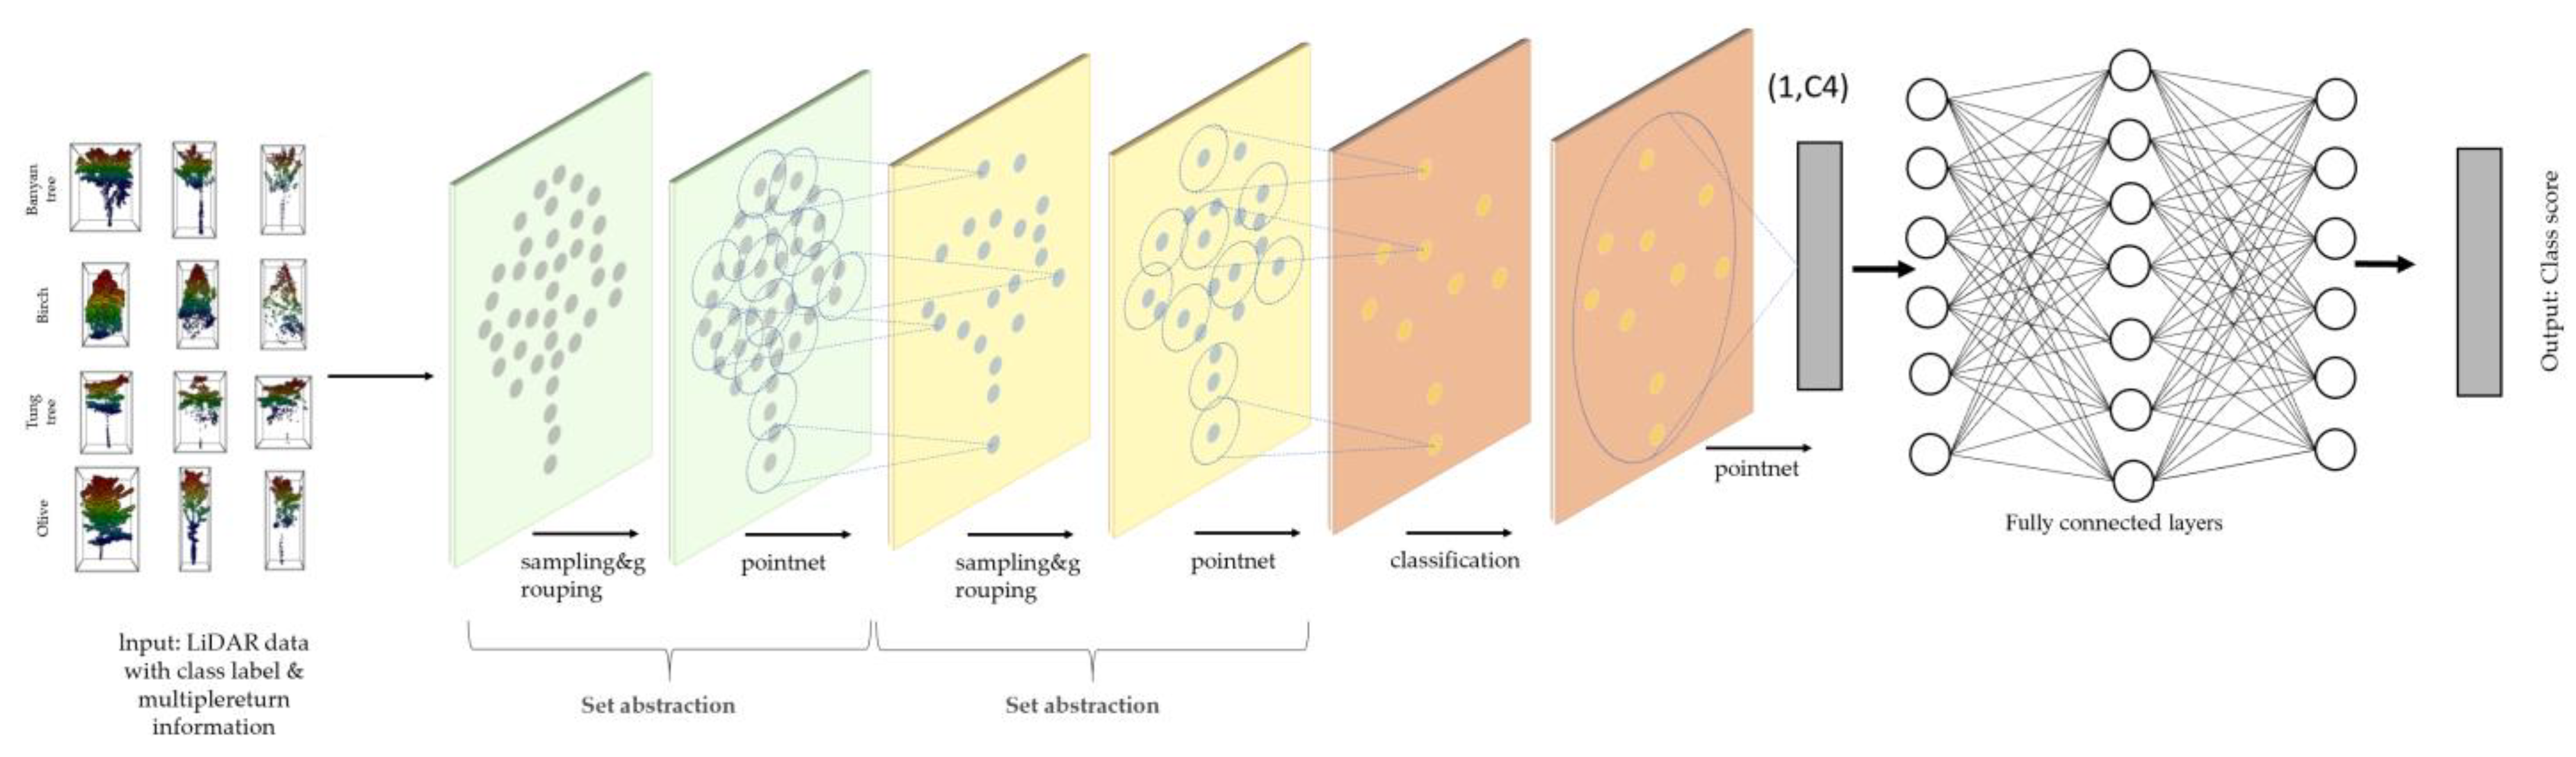
It’s worth noting that due to the limitations of canopy blockage and the characteristics of ALS, there’s a significant disparity in the quality of point cloud data obtained from different regions. In areas with high canopy closure, the lack of comprehensive under-canopy point cloud data may result in lower point cloud density and smaller coverage. In contrast, in areas with low canopy closure, where under-canopy point cloud data are relatively complete, higher density and more comprehensive point cloud data can be obtained. Consequently, when compared with single tree point cloud data points extracted by TLS and BLS, there’s a significant difference in the total number and quality of single tree point cloud data points obtained by ALS. The quality of the point clouds varied, as shown in Figure 2, with an obvious difference in the quality of the point clouds of different scholar trees (Alstonia scholaris). In some cases, missing points were evidently observed in the point clouds, which led to unsatisfactory classification results in both feature-based and projection-based point cloud classification.
The segmented single-tree point clouds were unevenly distributed (Table 2), with the number of point clouds in some single-tree segmentation results reaching over 20,000, but less than 400 point clouds for other tree species.
Given that the PointNet++ model employs a hierarchical structure, where each level corresponds to a different sampling layer, point cloud data are sampled into a fixed number of points at each level. This consistency ensures reliable information transfer and comparison between different levels, but also necessitates that the number of points inputted for each tree in the model remains constant. When setting the number of sampling points, if the sampling quantity is too large, the dimension of the input tensor will increase, thereby increasing computational and memory demands and leading to difficulties in effectively processing point cloud data. If the sampling quantity is too small, vital information from the original point cloud may be lost. This could result in the model failing to adequately comprehend the geometric structure and features of the point cloud, significantly impacting final classification accuracy [43]. This study employed the following two methods to ensure final classification accuracy: (1) the down-sampling parameter is set to 512 to meet the minimum point number requirement for down-sampling. (2) Point cloud augmentation methods are used to supplement the point cloud count of tree species with fewer total point clouds to pre-down-sampling totals of 1024, 2048, 4096, or more. This ensures that the majority of the data have sufficient point cloud numbers to extract meaningful features.
Considering that an insufficient number of point clouds may not provide effective feature information, in this experiment, individual tree data with a total point cloud count of less than 512 were excluded. Each individual tree point cloud was manually numbered, and its corresponding tree species information was determined by combining the Real-time kinematic (RTK) field survey method to obtain coordinates. For the acquired individual tree point clouds, 80% were chosen as the training set to classify the 11 tree species, while 20% were selected as the test set for accuracy evaluation. All samples involved in training and testing were mutually independent. The final sample types, training set, and test set constructed for model training are shown in Table 3.

3. Model Training

PointNet++ first extracted local features by capturing local information and then merged these local features to obtain global features (Figure 3). Finally, the combination of global and local features was used for classification tasks. This approach could effectively process point cloud data and achieve good results in multiple point cloud-related tasks. In order to select a set of the most representative points from the single-tree point cloud for further analysis and processing, we used the Farthest Point Sampling (FPS) method. The basic idea of this algorithm is to, first, randomly select an initial point as the first point in the sample point set, and then find the point with the farthest distance from the selected point set among the remaining points, adding it to the sample point set. Subsequently, with the newly added point as the starting point, the aforementioned steps are repeated until the number of sample points reaches the preset value. This method can effectively preserve the shape features and structural information of the point cloud, as well as control the number and distribution density of the sampling points [44]. The hyperparameters and optimization configurations selected for this study are listed in Table 4. Batch size refers to the number of samples used in each iteration of training. This size dictates the number of samples employed in each training iteration. Larger batch sizes can accelerate training speed but may lead to increased memory consumption. Smaller batch sizes can enhance the model’s generalization capabilities but may render the training process more unstable. The “number of points” refers to the number of points selected from each point cloud. Selecting an appropriate quantity of points allows the preservation of vital features while controlling computational and memory requirements. An epoch is a complete traverse through the entire training dataset during training. Selecting an appropriate number of epochs usually requires a balance between the convergence speed of the model and the training time. The optimizer is the algorithm that determines how parameters are updated. The selection of an appropriate optimizer depends on the specific task and data, as well as the nature of the model. For example, the Adam optimizer often performs well when training deep learning models [45,46]. The learning rate is a crucial hyperparameter in the optimization algorithm that dictates the step size of parameter updates in each iteration. An excessively high learning rate could destabilize the optimization process, whereas an overly low learning rate could result in excessively slow convergence. The decay rate is used to gradually reduce the learning rate during training to further optimize training effectiveness. Decaying the learning rate can render the model more stable and accurate in the later stages of training. Referencing other research in the domain of point cloud deep learning, such as [47,48,49,50], we selected the Adam optimizer and set the learning rate and decay rate at 0.001 and 0.0001, respectively. We explored batch sizes of 4, 8, 12, 16, and 20; numbers of points at 512, 1024, 2048, 4096, and 8192; and epochs at 50, 100, 200, 300, and 500. By conducting cross-validation under different parameter combinations, we can compare the model’s performance on the validation set and select the parameter combination with the highest classification accuracy as our final choice. In this way, we can identify the hyperparameter combination most suited for the point cloud deep learning task under the given conditions.
The simplified sampling and grouping (SSG) method was used in PointNet++. In the SSG, a set of points is randomly selected from the original point cloud as seed points, and a local region is selected from the original point cloud within a certain range around these seed points. Finally, these local regions are used as batch input to the network. The advantage of SSG is its fast calculation speed; however, for point clouds with uneven point distributions, information loss may occur [32].
Additionally, PointNet++ also used the multi-scale sampling and grouping (MSG) method. Unlike the SSG, the MSG selects a set of seed points and multiple sets of seed points to sample point clouds at different scales, which are then combined into a batch input to the network. The advantage of the MSG is that it can effectively capture information at different scales in point clouds and is suitable for point clouds with uneven point distributions [33].

4. Results

4.1. Results Acquired after Down-Sampling

We selected the SSG and MSG classification methods and classified the training set data after down-sampling to 512. The number of epochs and the batch size were set to 200 and 16, respectively. A confusion matrix for the classification results is shown in Figure 4 and Table 5.
The results showed that the sampling performance of the MSG was superior to that of the SSG; however, the accuracy of both methods was unsatisfactory.

4.2. Down-Sampling Results of Point Clouds after Enhancement

As mentioned earlier, there are noticeable inconsistencies in point cloud quantity and density acquired from ALS data. Considering PointNet++’s requirements for training data, the classification performance after down-sampling to 512 points is not satisfactory. Therefore, this study opted to enhance point clouds with fewer points for certain tree species. In order to maintain the geometric structure and semantic information of the point cloud, we employ point cloud jittering to augment the point cloud data to meet the down-sampling requirements [51]. Specifically, we randomly selected some points from the point cloud data and added random numbers sampled from a normal distribution with a mean of 0 and a standard deviation of 0.01 to the three-dimensional coordinates of these points. The transformed point cloud was then merged with the original point cloud to generate new point cloud data. This process was repeated until the number of points in the point cloud met the preset value. In point cloud deep learning models, the input of different sample points has varying impacts on the model’s accuracy. In order to investigate the influence of sample points on classification accuracy, we utilized both SSG and MSG classification methods for the augmented point cloud data, and classified after down-sampling to 1024, 2048, 4096, and 8192 points, respectively. The number of epochs was set to 200, and the batch size was set to 16. The confusion matrix results of the classification outcomes are shown in the following Figure 5.
A comparison of the recall and precision results at a sampling rate of 512 is shown in Figure 6.
As can be seen from Table 6 and Figure 6, when the sampling number is below 4096, the MSG method has higher recall and precision than SSG, but when the number of sampling points is set to 8192, the Recall and Precision of the MSG method decrease, but improve for the SSG method. Moreover, the results of magnifying before downsampling are noticeably superior to direct sampling at 512 points. There exists a certain relationship between the increase in sample points and the accuracy of the classification results. In the MSG method, when the number of sampling points is set to 2048, the recall and precision rates peak, and when the number of sampling points further increases to 4096 and 8192, the recall rate starts to decline. This could be because an excessive number of sampling points may introduce noise and redundant information, leading to overfitting, causing the recall and precision to decrease. From the confusion matrix and the recall and precision of individual tree species, it can be observed that, regardless of the original point cloud quantity, the classification recognition accuracy after augmentation demonstrates good performance, indicating that the quality of tree species point clouds does not have a significant impact on the classification results.

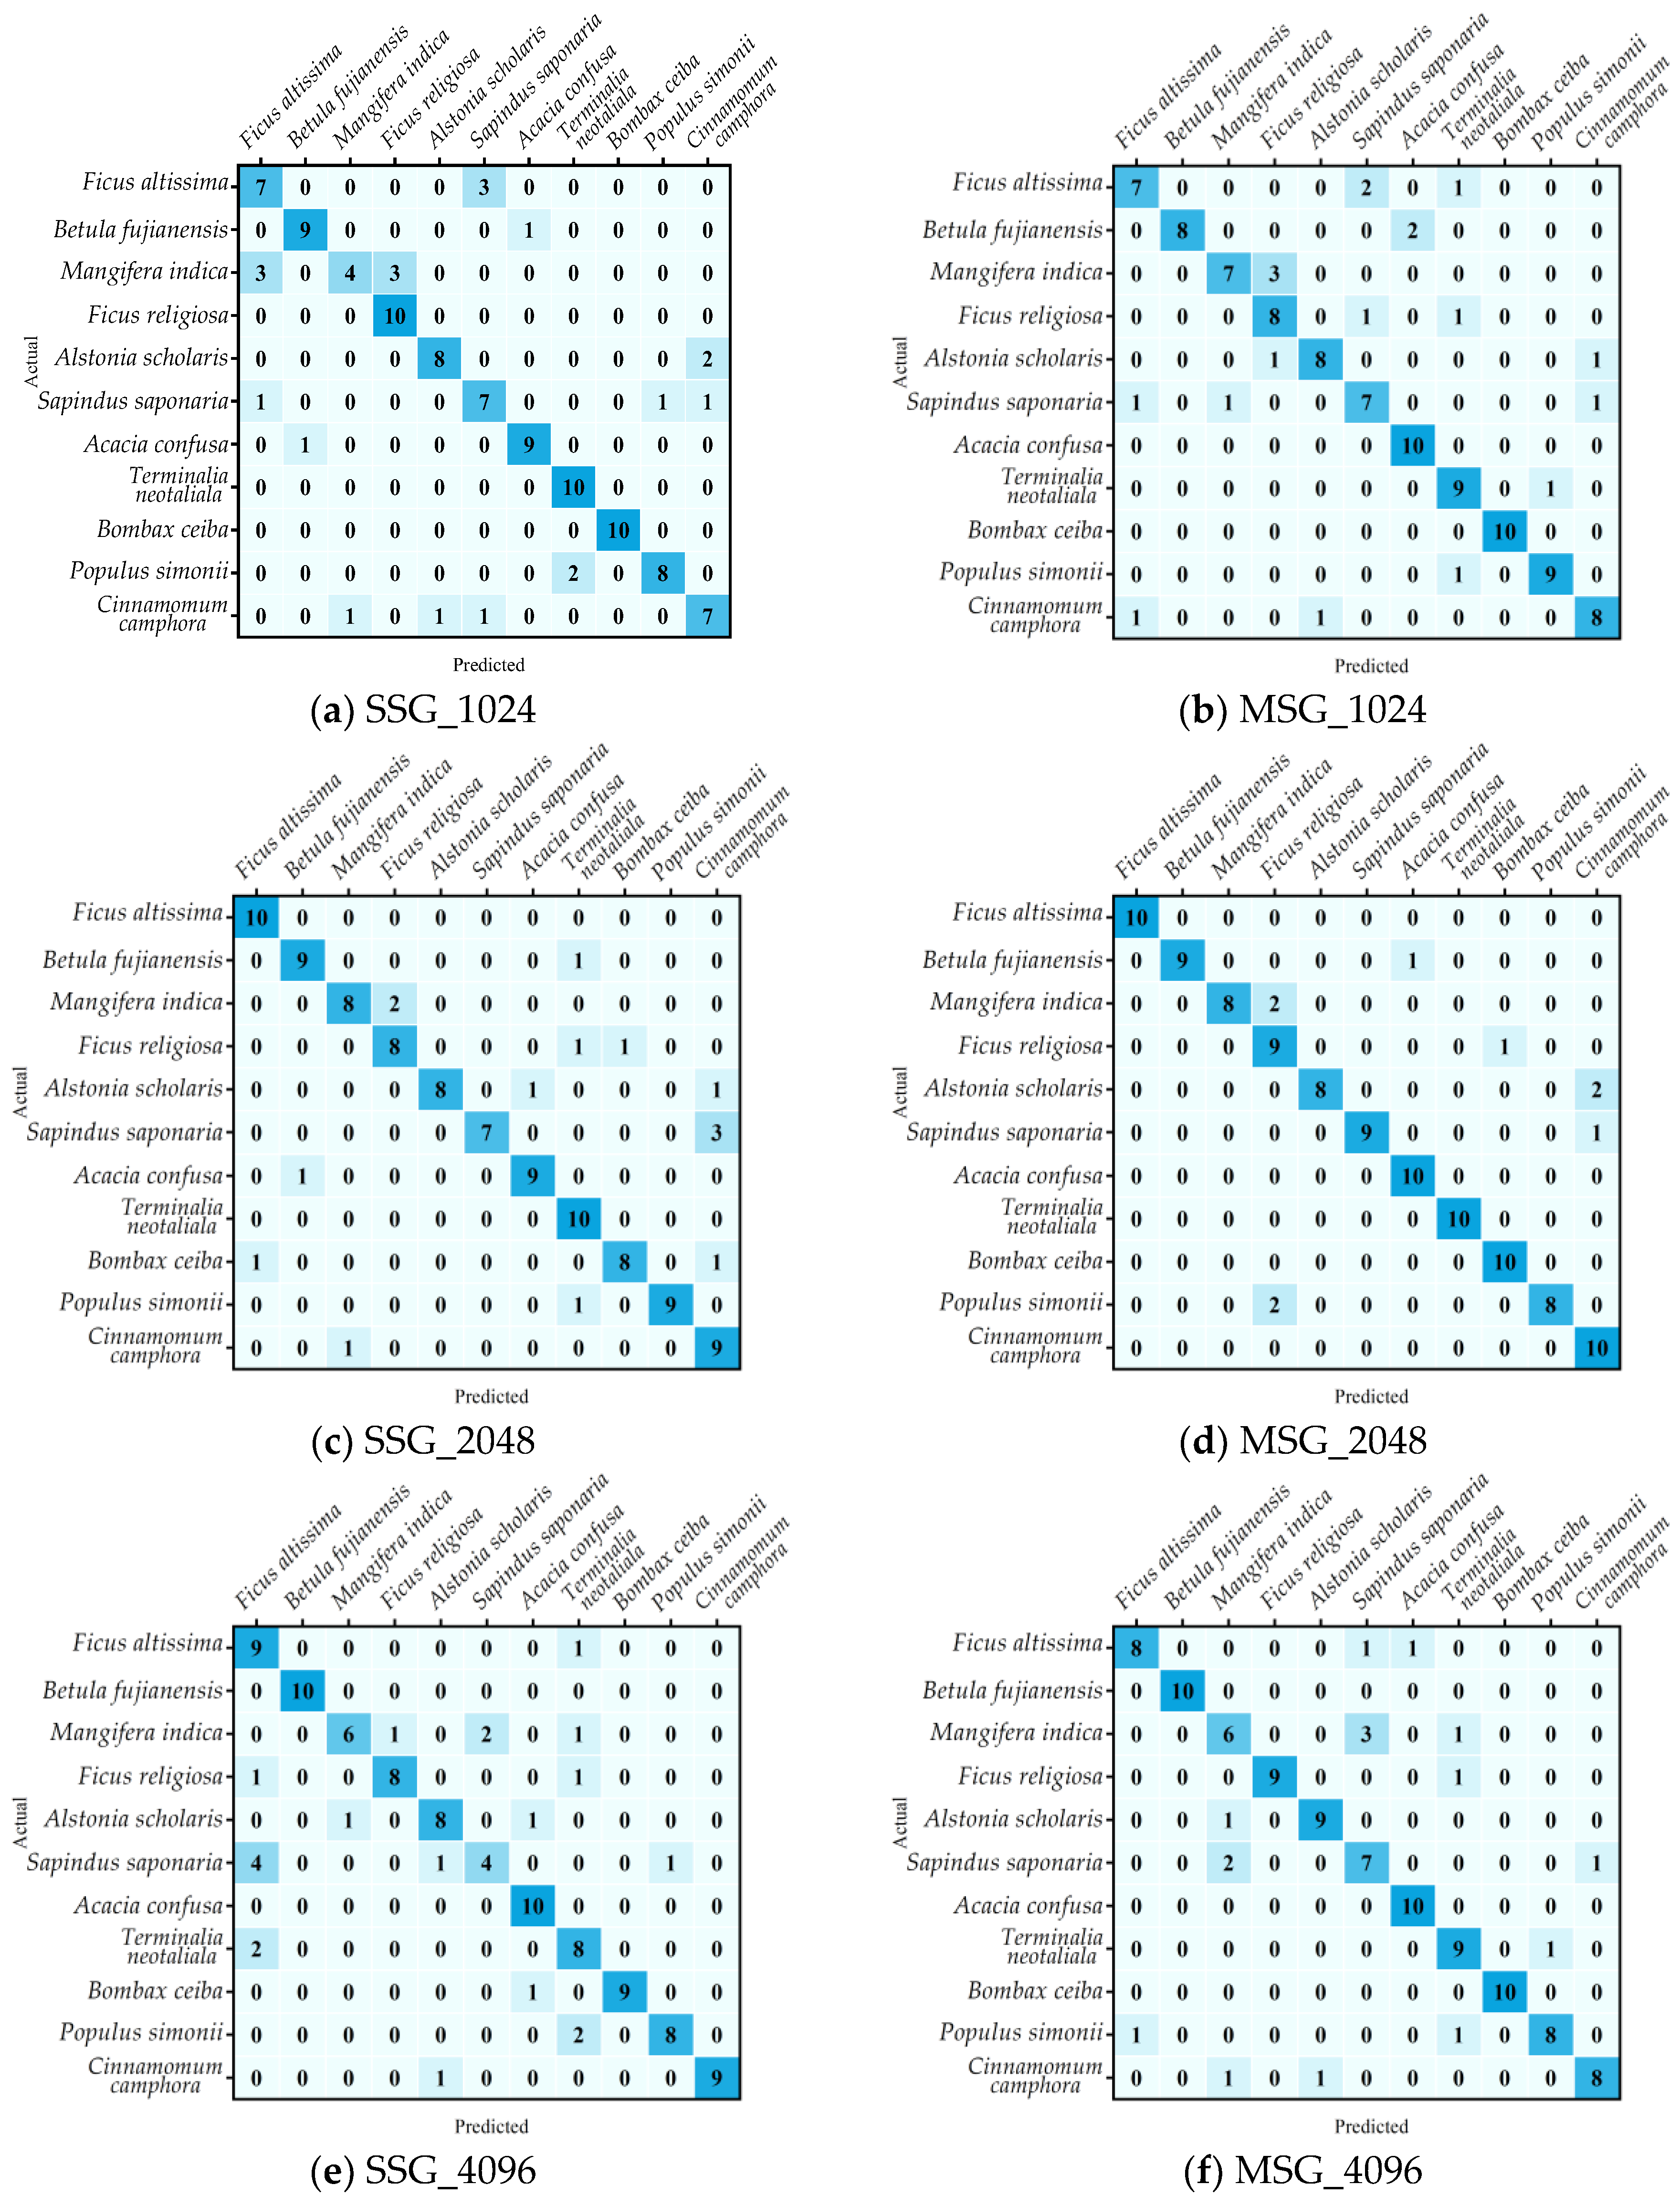
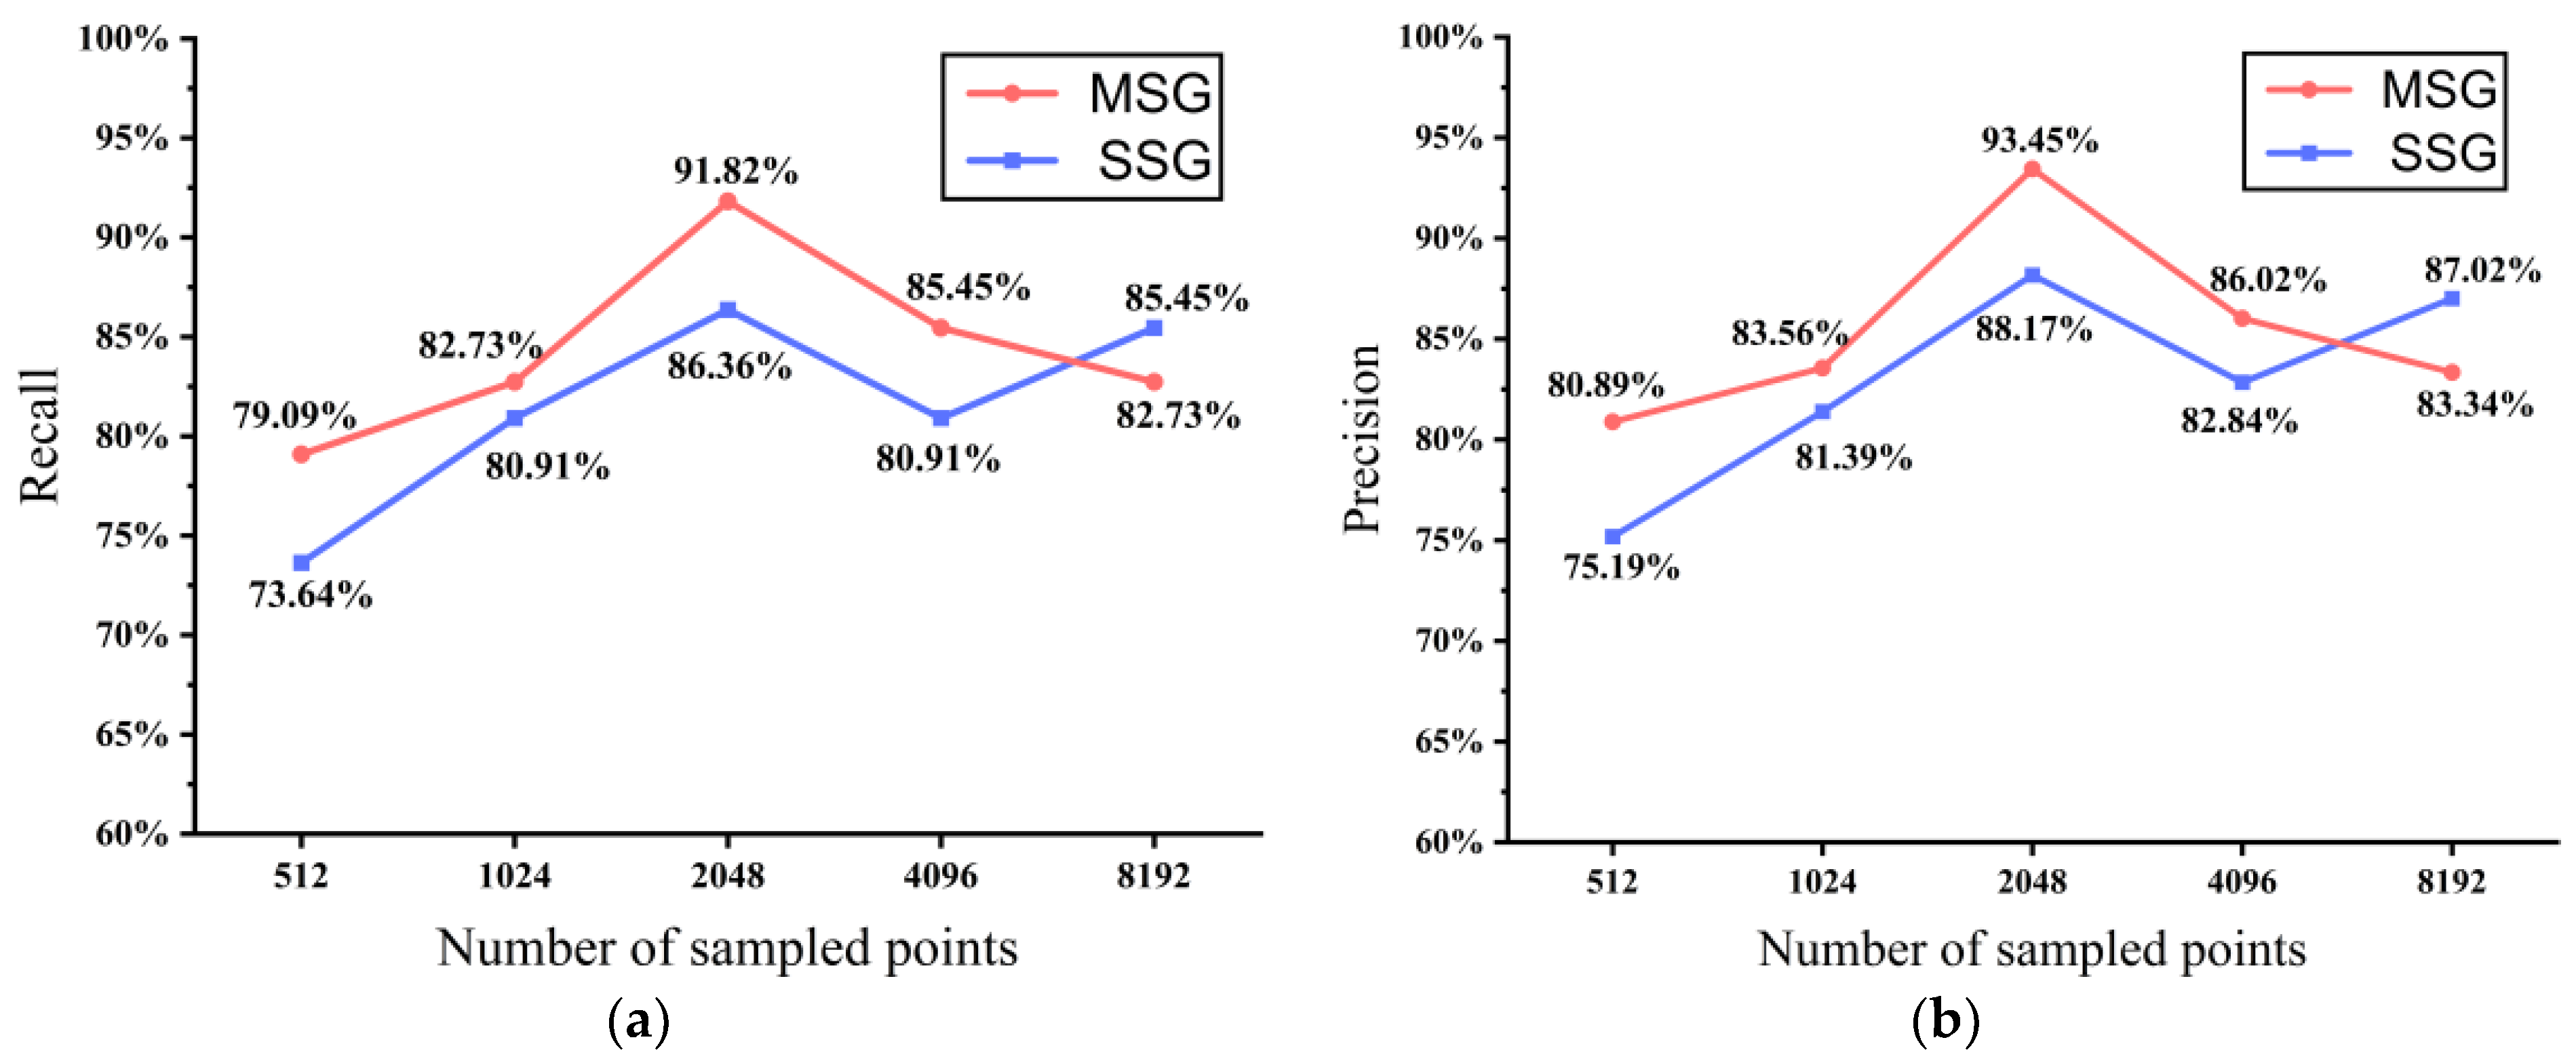
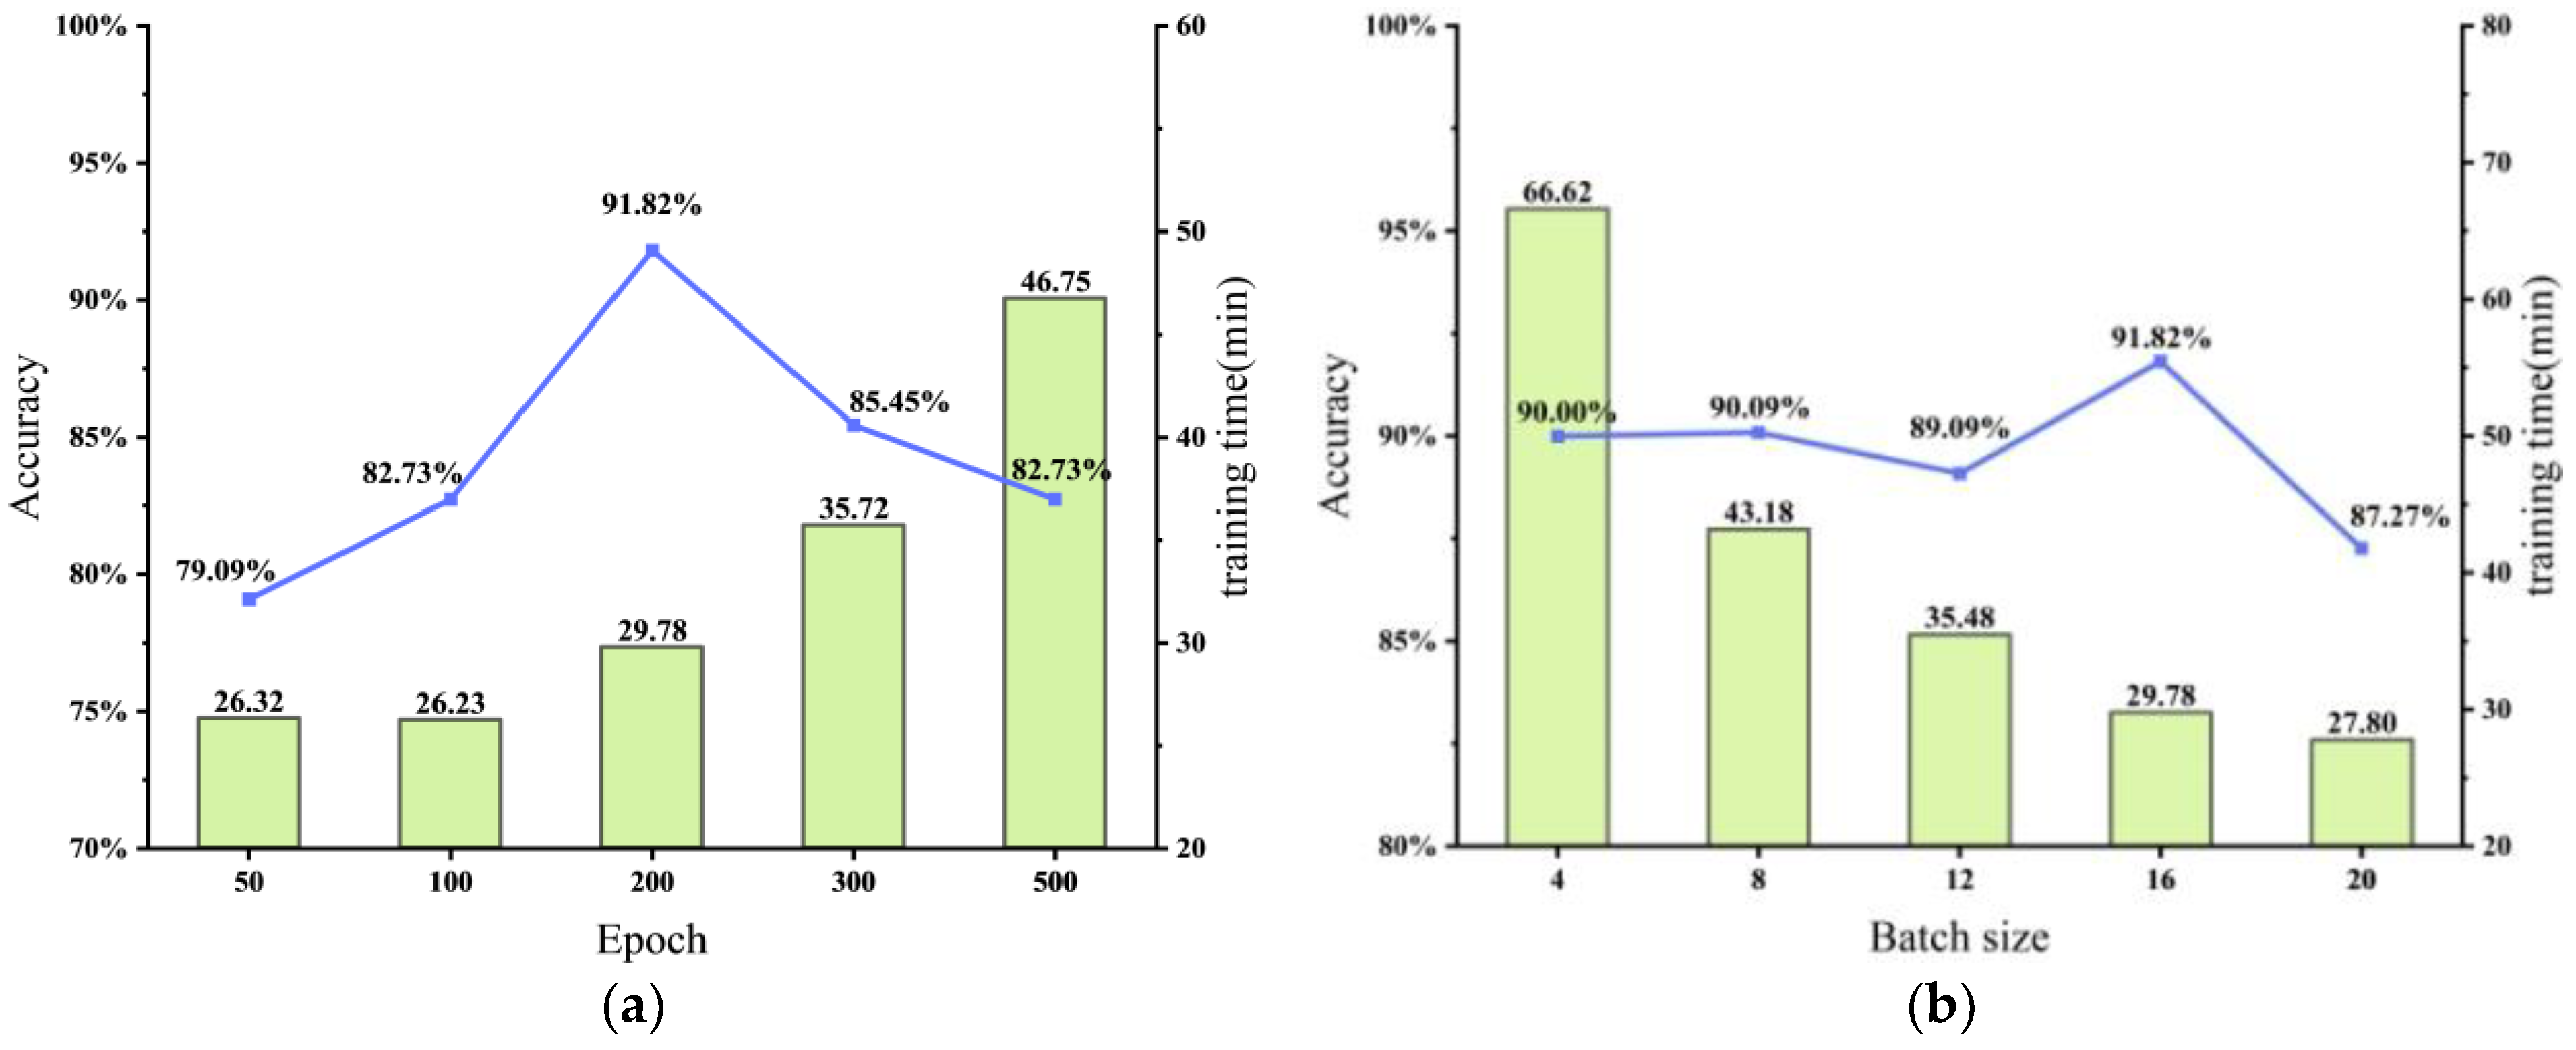
4.3. Comparison of the Results with Other Hyperparameters

To verify the influence of batch size and epoch count on model accuracy and training time, we selected the MSG classification method, set the downsampling count to 2048, and tested different batch sizes and iteration counts. We calculated their classification accuracy and recorded their training durations. The results are shown in the following Figure 7.
As can be seen from Figure 7a, when the number of epochs increases from 50 to 200, the precision significantly improves, from 79% to 91%. This could be because a lower number of epochs might be insufficient to adequately train the model, and as the number of epochs increases, the model receives more opportunities to learn the features and patterns of the data, thus improving precision. However, as the number of epochs continues to increase to 300 and 500, the precision declines slightly. This might be because the model begins to overfit the training data, resulting in worse performance on unseen testing data. As the number of epochs increases, the duration also increases accordingly. This is reasonable, as each iteration requires forward and backward propagation in the model and updated parameters. A larger number of epochs requires more computational resources and time for completion, thus increasing the duration. After weighing the relationship between precision and duration, we found that the highest precision rate of 91% is achieved when the number of epochs is 200, with a duration of 29 min. Further increasing the number of epochs does not significantly improve precision but increases the duration. Therefore, 200 epochs might be a good choice to achieve high precision within a reasonable timeframe.
As can be seen from Figure 7b, the accuracy remains around 90% when the batch size is between 4 and 8. As the batch size increases from 8 to 12, the precision slightly drops, to 89%. Then, as the batch size further increases to 16, the precision rises back to 91%. However, when the batch size increases to 20, the precision falls to 87%. This indicates that the influence of batch size on precision is not linear, and different batch sizes might have different impacts on model training. As the batch size increases, the duration generally decreases. This is because a larger batch size can process more samples in parallel, thus improving computational efficiency. When the batch size is 4, the duration is longest, at 66 min. Afterward, as the batch size increases, the duration gradually decreases, finally reaching the shortest duration of 27 min when the batch size is 20. Balancing the relationship between precision and duration, a batch size of 16 should be chosen to achieve higher precision within a reasonable time.

5. Discussion

The method of using eigenvalues for classification is a common approach in tree species classification within point cloud data, which achieves classification by extracting and analyzing the eigenvalues of point cloud data. The current eigenvalue classifiers can all achieve a classification accuracy of more than 80% [22,52,53]. However, they require the extraction and input of a large number of structural feature parameters of the trees, which increases the time and complexity of data preprocessing. Furthermore, the feature extraction process may be influenced by parameter selection, and inappropriate parameters could lead to poor feature extraction results. In addition, eigenvalue classification methods have limited capabilities in recognizing complex structures and may perform poorly when dealing with point cloud data with intricate structures, thereby affecting the accuracy of tree species classification. Point cloud classification based on projection images is a method that transforms LiDAR point cloud data into two-dimensional grid data for classification. The transformation process can involve projecting the point cloud data onto the ground, making horizontal or vertical slices. Thereafter, image classification or deep learning algorithms, such as Convolutional Neural Networks (CNN) and Deep Residual Networks (ResNets), are employed to classify the transformed data [31,54,55]. Although the method of transforming point cloud projections might remove a spatial dimension from the initial point cloud data, potentially causing feature loss for the classification task, it does enable additional image augmentation. This can greatly increase the sample size of the training data and is suitable for existing image classification and deep learning methods, providing good scalability. However, in complex canopy structures, the image transformation process could lead to information loss. The two aforementioned methods do not maximize the 3D structural information of point clouds and have limitations in point cloud classification and understanding. Therefore, a deep learning framework directly based on 3D data holds significant research value [56]. Increasingly, researchers are beginning to use point-based deep learning models for tree species classification on individual tree point clouds and have validated the research value of using deep learning for direct tree species classification from point cloud data.
In this study, we chose the challenging, widely applicable, and efficient Airborne Laser Scanning (ALS) as our data source. Using PointNet++, we performed classification tasks on 11 common tree species in southern China, achieving an accuracy rate of 91.82%. Chen et al. [57] proposed the point cloud tree species classification network PCTSCN that used data from TLS and ALS to classify white birch and larch. The classification accuracy of single tree samples obtained from TLS and ALS reached 96% and 92%, respectively. Maohua et al. [58] proposed a point-based deep neural network, LayerNet, to identify birch and pine trees. The overall classification accuracies for the TLS and ALS LiDAR datasets were 92.5% and 88.8%, respectively. Although the two aforementioned studies achieved satisfactory accuracy, their experimental samples only contained two categories. In contrast, we expanded the experimental samples to 11 classes in our research, which served to validate the model’s generalization capability. Furthermore, these studies showed that the accuracy of tree species classification using ALS data was lower than that using TLS data because of the lack of information below the canopy. Liu et al. [38] collected point cloud data for eight tree species from three regions using the BLS system. Their results indicated that the deep learning network offered the most accurate tree species classification when the count of individual tree point clouds was between 2048 and 5120, achieving a classification accuracy of 98.26%. Despite the fact that Liu’s data source was BLS, their conclusion regarding the optimal point cloud quantity for classification training coincided with our ALS-based findings, where the best classification accuracy was achieved when the point cloud count was 2048. Xi et al. [59] investigated thirteen machine learning classifiers, nine deep learning classifiers, and fifteen classifiers for filtering timber points from TLS plot scans. The PointNet++ classification model achieved the highest classification accuracy at 95.8%, satisfying the high stability and moderate time–cost requirements. Seidel et al. [31] used a CNN-based image classification method to classify tree species from TLS-acquired point cloud data, projecting 3D point clouds into 2D images and using convolutional neural networks to classify seven tree species, achieving an accuracy of 86%. Although this method achieved high efficiency, its accuracy was slightly lower than that of other studies, including our present study. In the studies mentioned above, the vast majority employed BLS or TLS data. Such data collection methods can acquire more comprehensive point cloud information, especially under the forest canopy. The ALS data used in our research has limitations in collecting point cloud information under the canopy and in capturing the complete structural features of individual trees. However, we still achieved high classification accuracy for the 11 tree species. Nevertheless, it is important to note that the efficiency and approach of ALS data acquisition are unparalleled by other methods. Moreover, for some hard-to-reach forest stands, ALS is the only way to obtain point cloud data, so our study still holds research significance.
Due to the aerial nature of Airborne Laser Scanning (ALS), it cannot penetrate the tree canopy when the canopy closure is high and therefore cannot acquire point cloud data underneath the canopy. This implies that in the same region, areas with lower canopy closure will possess more point cloud data, whereas areas with high canopy closure may lack complete point cloud data. Consequently, there could be significant discrepancies in the quality of point cloud data obtained by ALS within the same region. This difference was reflected in the distribution of point cloud quantities for different trees (Figure 2 and Table 2). Because the number of points for each tree in the PointNet++ input model must remain consistent, this study first downsampled all samples to a point cloud quantity approaching the minimum value of 512, with the experiment showing the highest classification accuracy of 80.89%. Subsequently, we applied jitter augmentation to samples with less point cloud data prior to classification. Recall and precision rates of unenhanced point clouds with 512 points were significantly lower than those of the augmented point cloud data (Figure 6), suggesting that jitter augmentation can effectively improve ALS data classification accuracy. In recent studies, numerous valuable point cloud augmentation methods have emerged. For instance, Chen et al. [60] introduced PointMixup, which optimizes allocation to find the shortest path between two point clouds, with interpolation being allocation-invariant and linear. Li et al. [61] proposed a novel automatic augmentation framework, PointAugment, which is a learnable point augmentation function with shape transformation and point-wise displacement, and they meticulously designed a loss function in accordance with the classifier’s learning progress to adopt enhanced samples. PolarMix, proposed by Xiao et al. [62], employs two cross-scanning augmentation strategies to cut, edit, and mix point clouds along the scanning direction, enriching point cloud distribution while maintaining point cloud fidelity. In future research, we plan to introduce other augmentation methods and evaluate their effectiveness in improving classification accuracy.
Our results indicate that blindly increasing the number of sample points does not significantly improve the model’s classification accuracy and may even reduce it. As the number of sample points increases, so does the training time for the deep learning network. When the number of points in a single tree sample exceeds 2048, the classification accuracy for all corresponding down-sampling methods fluctuates and even exhibits a clear overfitting trend. This may be because when there are too many sample points, the deep learning model might rely too heavily on the training set, leading to the inclusion of noise and outliers in the training data. This, in turn, can lower the model’s ability to generalize to new data, resulting in overfitting [63]. Therefore, we recommend keeping the number of sampling points for single tree classification based on ALS point cloud at around 2048. This ensures a high classification accuracy and allows training within a reasonable timeframe. By limiting the number of sampling points, point cloud data can be effectively handled and the risk of overfitting reduced.
This study, however, falls short of sufficiently exploring augmentation methods and requires manual assistance for segmentation. Going forward, we aim to directly use PointNet++ for single tree point cloud segmentation and to investigate the influence of different augmentation methods on classification accuracy. The point cloud data in this study were obtained from forests with medium canopy closure (approximately 0.5), hence to a certain degree overcoming the limitation of lacking under-canopy information when using ALS data. In future research, we hope to incorporate point cloud data from forests with higher canopy closure, validating the classification accuracy under conditions where point cloud data is incomplete. In summary, this study verifies the feasibility of using PointNet++ for tree species classification with ALS point cloud data, addresses the issues of point cloud quantity and quality through point cloud augmentation, and conducts relevant research on hyperparameter settings during the classification process. Our research results hold certain value and can provide a reference for point cloud-based tree species classification studies.

6. Conclusions

The PointNet++ method was feasible for the tree species classification of point cloud data acquired by airborne LiDAR, and the highest accuracy rate among the 11 selected tree species was 91.82%.
Although the point cloud data extracted from individual trees in ALS differed significantly from those in TLS and BLS in terms of the total number and quality of the point clouds, the quality of the point clouds did not significantly affect the PointNet++ algorithm. The problem of inconsistent point cloud numbers could be addressed by means of point cloud enhancement, and the classification results of the enhanced point clouds were significantly better than those of the raw point clouds.
In terms of the down-sampling parameters, the most suitable sampling rate was 2048. Oversampling could lead to overfitting and decreased classification accuracy.
Increasing the sampling time and changing the batch size had no significant effect on the results. Therefore, selecting more efficient hyperparameter settings is advantageous.
On comparing the two classification methods, we found that the classification results of the MSG were superior to those of the SSG, which may be due to the non-uniformity of the tree species point clouds collected by ALS.
However, this study has several limitations, including inadequate research on enhancement methods and the need for manual assistance with segmentation. Further research could be conducted on the impact of other enhancement and segmentation methods on classification results, and the integration of unsupervised methods to recognize non-sampled tree species.
In future research, we will: (1) consider utilizing various classification methods (including eigenvector-based classification [64] and projection-image classification [31]) to identify and classify tree species within the same region, followed by a comparison of the accuracies of these methods; (2) select a bigger the study area than the one tested in this study and investigate the similarities between the same tree species in different regions; (3) consider the feasibility of enhancing incomplete point clouds in high-density forest areas for classification; and (4) explore relevant methods for identifying and classifying a number of companion, invasive, and precious tree species with severely insufficient sample sizes.

Author Contributions

Conceptualization, Z.F.; data curation, J.W., R.Z. and W.Z.; formal analysis, J.W., W.Z. and Z.F.; funding acquisition, Z.F.; software, J.W. and R.Z.; supervision, Z.F.; writing—original draft, Z.F.; writing—review and editing, J.W., R.Z. and W.Z. All authors have read and agreed to the published version of the manuscript.

Funding

This research was funded by “National Natural Science Foundation of China, grant number 32101523”, “Major Project Funding for Social Science Research Base in Fujian Province Social Science Planning, grant number FJ2020JDZ035” and “Fujian Provincial Natural Science Foundation of China, grant number 2023J01080”.

Data Availability Statement

Not applicable.

Acknowledgments

Thanks to all colleagues for the fruitful discussions on this work.

Conflicts of Interest

The authors have no conflict of interest.

References

  1. Zhang, Y.; Pan, C.-L.; Liao, H.-T. Carbon neutrality policies and technologies: A scientometric analysis of social science disciplines. Front. Environ. Sci. 2021, 9, 1736. [Google Scholar] [CrossRef]
  2. Wu, W.; Zhu, Y.; Wang, Y. Spatio-temporal pattern, evolution and influencing factors of forest carbon sinks in Zhejiang Province, China. Forests 2023, 14, 445. [Google Scholar] [CrossRef]
  3. Roberge, C. Inventory Strategies for Monitoring and Evaluation of Forest Damage. Ph.D. Thesis, Swedish University of Agricultural Sciences, Uppsala, Sweden, 2017. [Google Scholar]
  4. Shi, Y.; Wang, S.; Zhou, S.; Kamruzzaman, M.M. Study on modeling method of forest tree image recognition based on CCD and theodolite. IEEE Access 2020, 8, 159067–159076. [Google Scholar] [CrossRef]
  5. Xu, H.; Qiang, S.; Han, Z.; Guo, J.; Huang, Z.; Sun, H.; He, S.; Ding, H.; Wu, H.; Wan, F.J.B. The status and causes of alien species invasion in China. Biodivers. Conserv. 2006, 15, 2893–2904. [Google Scholar] [CrossRef]
  6. Libby, R.; Sato, A.Y.; Alapai, L.; Brawner, W.P.; Carter, Y.Y.; Carter, K.A.; Tomich, K.; Ticktin, T. A Hawaiian tropical dry forest regenerates: Natural regeneration of endangered species under biocultural restoration. Sustainability 2022, 14, 1159. [Google Scholar] [CrossRef]
  7. Tewari, V.P. Forest inventory, assessment, and monitoring, and long-term forest observational studies, with special reference to India. For. Sci. Technol. 2016, 12, 24–32. [Google Scholar] [CrossRef]
  8. Gao, D.; Sun, Q.; Hu, B.; Zhang, S. A framework for agricultural pest and disease monitoring based on Internet-of-things and unmanned aerial vehicles. Sensors 2020, 20, 1487. [Google Scholar] [CrossRef] [PubMed] [Green Version]
  9. Cao, K.; Zhang, X. An improved res-UNet model for tree species classification using airborne high-resolution images. Remote Sens. 2020, 12, 1128. [Google Scholar] [CrossRef] [Green Version]
  10. Liu, Y.; Gong, W.; Hu, X.; Gong, J. Forest type identification with random forest using Sentinel-1A, Sentinel-2A, multi-temporal Landsat-8 and DEM data. Remote Sens. 2018, 10, 946. [Google Scholar] [CrossRef] [Green Version]
  11. Immitzer, M.; Vuolo, F.; Atzberger, C. First experience with Sentinel-2 data for crop and tree species classifications in Central Europe. Remote Sens. 2016, 8, 166. [Google Scholar] [CrossRef]
  12. Bolyn, C.; Michez, A.; Gaucher, P.; Lejeune, P.; Bonnet, S. Forest mapping and species composition using supervised per pixel classification of Sentinel-2 imagery. BASE 2018, 22, 172–187. [Google Scholar] [CrossRef]
  13. Immitzer, M.; Atzberger, C.; Koukal, T. Tree species classification with random forest using very high spatial resolution 8-band WorldView-2 satellite data. Remote Sens. 2012, 4, 2661–2693. [Google Scholar] [CrossRef] [Green Version]
  14. Ballanti, L.; Blesius, L.; Hines, E.; Kruse, B. Tree species classification using hyperspectral imagery: A comparison of two classifiers. Remote Sens. 2016, 8, 445. [Google Scholar] [CrossRef] [Green Version]
  15. Krahwinkler, P.; Rossmann, J. Tree Species Classification and Input Data Evaluation. Eur. J. Remote Sens. 2013, 46, 535–549. [Google Scholar] [CrossRef] [Green Version]
  16. Tuominen, S.; Näsi, R.; Honkavaara, E.; Balazs, A.; Hakala, T.; Viljanen, N.; Pölönen, I.; Saari, H.; Ojanen, H. Assessment of classifiers and remote sensing features of hyperspectral imagery and stereo-photogrammetric point clouds for recognition of tree species in a forest area of high species diversity. Remote Sens. 2018, 10, 714. [Google Scholar] [CrossRef] [Green Version]
  17. Pellikka, P.; King, D.J.; Leblanc, S.G. Quantification and reduction of bidirectional effects in aerial cir imagery of deciduous forest using two reference land surface types. Remote Sens. Rev. 2000, 19, 259–291. [Google Scholar] [CrossRef]
  18. Wehr, A.; Lohr, U. Airborne laser scanning—An introduction and overview. ISPRS J. Photogramm. 1999, 54, 68–82. [Google Scholar] [CrossRef]
  19. Korpela, I.; Ørka, H.O.; Maltamo, M.; Tokola, T.; Hyyppä, J. Tree species classification using airborne LiDAR–effects of stand and tree parameters, downsizing of training set, intensity normalization, and sensor type. Silva Fenn. 2010, 44, 319–339. [Google Scholar] [CrossRef] [Green Version]
  20. Budei, B.C.; St-Onge, B.; Hopkinson, C.; Audet, F.-A. Identifying the genus or species of individual trees using a three-wavelength airborne lidar system. Remote Sens. Environ. 2018, 204, 632–647. [Google Scholar] [CrossRef]
  21. Hovi, A.; Korhonen, L.; Vauhkonen, J.; Korpela, I. LiDAR waveform features for tree species classification and their sensitivity to tree- and acquisition related parameters. Remote Sens. Environ. 2016, 173, 224–237. [Google Scholar] [CrossRef]
  22. Blomley, R.; Hovi, A.; Weinmann, M.; Hinz, S.; Korpela, I.; Jutzi, B. Tree species classification using within crown localization of waveform LiDAR attributes. ISPRS J. Photogramm. 2017, 133, 142–156. [Google Scholar] [CrossRef]
  23. Kukkonen, M.; Maltamo, M.; Korhonen, L.; Packalen, P. Multispectral airborne LiDAR data in the prediction of boreal tree species composition. IEEE Trans. Geosci. Remote Sens. 2019, 57, 3462–3471. [Google Scholar] [CrossRef]
  24. Michałowska, M.; Rapiński, J. A review of tree species classification based on airborne LiDAR data and applied classifiers. Remote Sens. 2021, 13, 353. [Google Scholar] [CrossRef]
  25. Sanaa, F.; Imane, S.; Mohamed, B.; Kenza, A.E.K.; Souhail, K.; Lfalah, H.; Khadija, M. Biomass and carbon stock quantification in cork Oak Forest of Maamora using a new approach based on the combination of aerial laser scanning carried by unmanned aerial vehicle and terrestrial laser scanning data. Forests 2022, 13, 1211. [Google Scholar] [CrossRef]
  26. Kuma, P.; McDonald, A.J.; Morgenstern, O.; Querel, R.; Silber, I.; Flynn, C.J. Ground-based lidar processing and simulator framework for comparing models and observations (ALCF 1.0). Geosci. Model Dev. 2021, 14, 43–72. [Google Scholar] [CrossRef]
  27. Ruhan, A.; Du, W.; Ying, H.; Wei, B.; Shan, Y.; Dai, H. Estimation of aboveground biomass of individual trees by backpack LiDAR based on parameter-optimized quantitative structural models (AdQSM). Forests 2023, 14, 475. [Google Scholar] [CrossRef]
  28. Su, Y.; Guo, Q.; Jin, S.; Guan, H.; Sun, X.; Ma, Q.; Hu, T.; Wang, R.; Li, Y. The development and evaluation of a backpack LiDAR system for accurate and efficient forest inventory. IEEE Geosci. Remote Sens. Lett. 2021, 18, 1660–1664. [Google Scholar] [CrossRef]
  29. Okyay, U.; Telling, J.; Glennie, C.L.; Dietrich, W.E. Airborne lidar change detection: An overview of earth sciences applications. Earth Sci. Rev. 2019, 198, 102929. [Google Scholar] [CrossRef]
  30. Wu, H.; Yang, H.; Huang, S.; Zeng, D.; Liu, C.; Zhang, H.; Guo, C.; Chen, L. Classification of point clouds for indoor components using few labeled samples. Remote Sens. 2020, 12, 2181. [Google Scholar] [CrossRef]
  31. Seidel, D.; Annighöfer, P.; Thielman, A.; Seifert, Q.E.; Thauer, J.H.; Glatthorn, J.; Ehbrecht, M.; Kneib, T.; Ammer, C. Predicting tree species from 3D laser scanning point clouds using deep learning. Front. Plant Sci. 2021, 12, 635440. [Google Scholar] [CrossRef]
  32. Qi, C.R.; Su, H.; Mo, K.; Guibas, L.J. Pointnet: Deep learning on point sets for 3-d classification and segmentation. In Proceedings of the IEEE Conference on Computer Vision and Pattern Recognition, Honolulu, HI, USA, 21–26 July 2017; pp. 652–660. [Google Scholar]
  33. Qi, C.R.; Yi, L.; Su, H.; Guibas, L.J. Pointnet++: Deep hierarchical feature learning on point sets in a metric space. Adv. Neural Inf. Process. Syst. 2017, 30, 5105–5114. [Google Scholar]
  34. Shrestha, A.; Mahmood, A. Review of deep learning algorithms and architectures. IEEE Access 2019, 7, 53040–53065. [Google Scholar] [CrossRef]
  35. Zhou, X.; Dai, N.; Cheng, X.; Thompson, A.; Leach, R. Intelligent classification for three-dimensional metal powder particles. Powder Technol. 2022, 397, 117018. [Google Scholar] [CrossRef]
  36. Yang, J.; Li, Z.; Zhan, P.; Li, X.; Wang, K.; Han, J.; Yang, P. Proximal femur parameter measurement via improved PointNet++. Int. J. Med. Robot. Comput. Assist. Surg. 2022, 19, e2494. [Google Scholar] [CrossRef] [PubMed]
  37. Jing, Z.; Guan, H.; Zhao, P.; Li, D.; Yu, Y.; Zang, Y.; Wang, H.; Li, J. Multispectral LiDAR point cloud classification using SE-PointNet++. Remote Sens. 2021, 13, 2516. [Google Scholar] [CrossRef]
  38. Liu, B.; Chen, S.; Huang, H.; Tian, X. Tree species classification of backpack laser scanning data using the PointNet++ point cloud deep learning method. Remote Sens. 2022, 14, 3809. [Google Scholar] [CrossRef]
  39. LiDAR360—Point Cloud Processing Software. Available online: https://greenvalleyintl.com/LiDAR360/ (accessed on 5 February 2023).
  40. Chen, C.; Guo, J.; Wu, H.; Li, Y.; Shi, B. Performance comparison of filtering algorithms for high-density airborne LiDAR point clouds over complex LandScapes. Remote Sens. 2021, 13, 2663. [Google Scholar] [CrossRef]
  41. Nie, S.; Wang, C.; Dong, P.; Xi, X.; Luo, S.; Qin, H. A revised progressive TIN densification for filtering airborne LiDAR data. Measurement 2017, 104, 70–77. [Google Scholar] [CrossRef]
  42. Persson, A.; Holmgren, J.; Soderman, U. Detecting and measuring individual trees using an airborne laser scanner. Photogramm. Eng. Remote Sens. 2002, 68, 925–932. [Google Scholar]
  43. Zhao, Y.; Chen, H.; Zeng, L.; Li, Z.; Chen, G.; Chen, H.; Li, Z. Improved Pointnet++ algorithm based on density related-farthest point sampling. SSRN Electron. J. 2023. preprint. [Google Scholar] [CrossRef]
  44. Dovrat, O.; Lang, I.; Avidan, S. Learning to sample. In Proceedings of the IEEE/CVF Conference on Computer Vision and Pattern Recognition, Long Beach, CA, USA, 16–17 June 2019; pp. 2755–2764. [Google Scholar] [CrossRef]
  45. Sarode, V.; Li, X.; Goforth, H.; Aoki, Y.; Srivatsan, R.A.; Lucey, S.; Choset, H. Pcrnet: Point Cloud Registration Network Using Pointnet Encoding. arXiv 2019, arXiv:1908.07906. [Google Scholar]
  46. Zhang, Y.; Liang, G.; Salem, T.; Jacobs, N. Defense-pointnet: Protecting pointnet against adversarial attacks. In Proceedings of the 2019 IEEE International Conference on Big Data (Big Data), Los Angeles, CA, USA, 9–12 December 2019; pp. 5654–5660. [Google Scholar] [CrossRef] [Green Version]
  47. Li, Z.; Li, W.; Liu, H.; Wang, Y.; Gui, G. Optimized PointNet for 3D Object Classification; Springer: Cham, Switzerland, 2019; pp. 271–278. [Google Scholar]
  48. Cao, X.; Wang, W.; Nagao, K.; Nakamura, R. Psnet: A style transfer network for point cloud stylization on geometry and color. In Proceedings of the IEEE/CVF Winter Conference on Applications of Computer Vision, Snowmass Village, CO, USA, 1–5 March 2020; pp. 3326–3334. [Google Scholar] [CrossRef]
  49. Qian, G.; Li, Y.; Peng, H.; Mai, J.; Hammoud, H.; Elhoseiny, M.; Ghanem, B. Pointnext: Revisiting Pointnet++ with improved training and scaling strategies. Adv. Neural Inf. Process. Syst. 2022, 35, 23192–23204. [Google Scholar]
  50. Sakharova, E.K.; Nurlyeva, D.D.; Fedorova, A.A.; Yakubov, A.R.; Kanev, A.I. Issues of Tree Species Classification from LiDAR Data Using Deep Learning Model; Springer: Cham, Switzerland, 2022; pp. 319–324. [Google Scholar]
  51. Zhan, D.; Liang, D.; Jin, H.; Wu, X.; Mbbos, G.C.N. MBBOS-GCN: Minimum bounding box over-segmentation—Graph convolution 3D point cloud deep learning model. J. Appl. Remote Sens. 2022, 16, 016502. [Google Scholar] [CrossRef]
  52. Yao, W.; Krzystek, P.; Heurich, M. Tree species classification and estimation of stem volume and DBH based on single tree extraction by exploiting airborne full-waveform LiDAR data. Remote Sens. Environ. 2012, 123, 368–380. [Google Scholar] [CrossRef]
  53. Terryn, L.; Calders, K.; Disney, M.; Origo, N.; Malhi, Y.; Newnham, G.; Raumonen, P.; Kerblom, M.Å.; Verbeeck, H. Tree species classification using structural features derived from terrestrial laser scanning. ISPRS J. Photogramm. 2020, 168, 170–181. [Google Scholar] [CrossRef]
  54. Zou, X.; Cheng, M.; Wang, C.; Xia, Y.; Li, J. Tree classification in complex forest point clouds based on deep learning. IEEE Geosci. Remote Sens. Lett. 2017, 14, 2360–2364. [Google Scholar] [CrossRef]
  55. Mizoguchi, T.; Ishii, A.; Nakamura, H.; Inoue, T.; Takamatsu, H. Lidar-based individual tree species classification using convolutional neural network. In Proceedings of the Videometrics, Range Imaging, and Applications XIV, Munich, Germany, 26–27 June 2017; pp. 193–199. [Google Scholar]
  56. Diab, A.; Kashef, R.; Shaker, A. Deep Learning for LiDAR Point Cloud Classification in Remote Sensing. Sensors 2022, 22, 7868. [Google Scholar] [CrossRef]
  57. Chen, J.; Chen, Y.; Liu, Z. Classification of typical tree species in laser point cloud based on deep learning. Remote Sens. 2021, 13, 4750. [Google Scholar] [CrossRef]
  58. Liu, M.; Han, Z.; Chen, Y.; Liu, Z.; Han, Y. Tree species classification of LiDAR data based on 3D deep learning. Measurement 2021, 177, 109301. [Google Scholar] [CrossRef]
  59. Xi, Z.; Hopkinson, C.; Rood, S.B.; Peddle, D.R. See the forest and the trees: Effective machine and deep learning algorithms for wood filtering and tree species classification from terrestrial laser scanning. ISPRS J. Photogramm. 2020, 168, 1–16. [Google Scholar] [CrossRef]
  60. Chen, Y.; Hu, V.T.; Gavves, E.; Mensink, T.; Mettes, P.; Yang, P.; Snoek, C.G.M. PointMixup: Augmentation for Point Clouds; Springer: Cham, Switzerland, 2020; pp. 330–345. [Google Scholar]
  61. Li, R.; Li, X.; Heng, P.-A.; Fu, C.-W. Pointaugment: An auto-augmentation framework for point cloud classification. In Proceedings of the IEEE/CVF Conference on Computer Vision and Pattern Recognition, Seattle, WA, USA, 13–19 June 2020; pp. 6377–6386. [Google Scholar] [CrossRef]
  62. Xiao, A.; Huang, J.; Guan, D.; Cui, K.; Lu, S.; Shao, L. PolarMix: A General Data Augmentation Technique for LiDAR Point Clouds. arXiv 2022, arXiv:2208.00223. [Google Scholar]
  63. Arief, H.A.A.; Indahl, U.G.; Strand, G.-H.; Tveite, H. Addressing overfitting on point cloud classification using Atrous XCRF. ISPRS J. Photogramm. 2019, 155, 90–101. [Google Scholar] [CrossRef] [Green Version]
  64. Guan, H.; Yu, Y.; Ji, Z.; Li, J.; Zhang, Q. Deep learning-based tree classification using mobile LiDAR data. Remote Sens. Lett. 2015, 6, 864–873. [Google Scholar] [CrossRef]
Figure 1. Spatial distribution of the study area.
Forests 14 01246 g001
Figure 2. Point cloud samples of 11 tree species used in this experiment.
Forests 14 01246 g002
Figure 3. Workflow of PointNet++ used in the experiment.
Forests 14 01246 g003
Figure 4. Confusion matrix for SSG and MSG methods with 512 sampled point clouds.
Forests 14 01246 g004
Figure 5. Confusion matrix for SSG and MSG methods with varying number of sampled point clouds (1024, 2048, 4096, 8129).
Forests 14 01246 g005aForests 14 01246 g005b
Figure 6. (a) Recall and (b) precision results for different number of sampled points.
Forests 14 01246 g006
Figure 7. Accuracy of different (a) epochs (200) and (b) batch sizes (16).
Forests 14 01246 g007
Table 1. SAL-1500 instrument parameters.
ModelSAL-1500
Measurement Rate2,000,000 points/s
Scanning Speed400 lines/s
Flight Altitude200 m
System Relative Accuracy20 mm
Field of View360°
Table 2. Point cloud data of the tree species used in this experiment.
Tree SpeciesScientific NamesNumber of Points
AverageMaximumMinimum
BirchBetula fujianensis423213,642933
Bodhi treeFicus religiosa483811,3451539
Scholar treeAlstonia scholaris16875278398
Formosa acaciaAcacia confusa376389751113
Terminalia neotalialaTerminalia neotaliala601715,5091350
Simon poplarPopulus simonii453410,499664
Camphor treeCinnamomum camphora19655426607
Council treeFicus altissima22536558701
Mango treeMangifera indica407910,0201509
Wingleaf soapberrySapindus saponaria336780301120
Cotton treeBombax ceiba5111454134
Others 595138,124152
Table 3. Sample data of the tree species used in this experiment.
Tree SpeciesScientific NamesNumber of
Samples
Average Number of Points
TrainTestTrainTest
BirchBetula fujianensis401044532947
Bodhi treeFicus religiosa401045735602
Scholar treeAlstonia scholaris401017311232
Formosa acaciaAcacia confusa401034515012
Terminalia neotalialaTerminalia neotaliala401059826159
Simon poplarPopulus simonii381043995048
Camphor treeCinnamomum camphora401014961858
Council treeFicus altissima401022361924
Mango treeMangifera indica401043354063
Wingleaf soapberrySapindus saponaria381036332356
Cotton treeBombax ceiba4010525391
Total 438110//
Table 4. Configuration of the model hyperparameters.
HyperparameterValueDeclaration
Training ModelSSG/MSGSimplified sampling and grouping
Multi-scale sampling and grouping
Batch size4\8\12\16\20Number of batches in each epoch
Number of points512\1024\2048\4096\8192Number of points per individual tree sample
Epoch50\100\200\300\500Number of times to traverse the entire training dataset during training
OptimizerAdamAn algorithm to update and calculate the internal parameters of the model to reduce the training error
Learning rate0.001The step size to update in each iteration
Decay rate0.0001Used to reduce the learning rate to help the model converge better
Table 5. Evaluation results of down-sampling point clouds directly to 512.
RecallPrecisionAccuracy
SSG_51273.6473.6475.19
MSG_51279.0979.0980.89
Table 6. Evaluation results of point clouds with different sampling quantities after enhancement.
RecallPrecisionAccuracy
SSG_102480.9180.9181.39
MSG_102482.7382.7383.56
SSG_204886.3688.1788.17
MSG_204891.8293.4593.45
SSG_409681.8281.8285.48
MSG_409687.2787.2790.99
SSG_819280.9180.9182.84
MSG_819285.4585.4586.02
Disclaimer/Publisher’s Note: The statements, opinions and data contained in all publications are solely those of the individual author(s) and contributor(s) and not of MDPI and/or the editor(s). MDPI and/or the editor(s) disclaim responsibility for any injury to people or property resulting from any ideas, methods, instructions or products referred to in the content.

