Article

Critical Analysis of Payments for Ecosystem Services: Case Studies in Kenya, Uganda and Tanzania

Department of Forest Engineering, Faculty of Silviculture and Forest Engineering, Transilvania University of Brașov, Șirul Beethoven No. 1, 500123 Brașov, Romania
*
Author to whom correspondence should be addressed.
Forests 2023, 14(6), 1209; https://doi.org/10.3390/f14061209
Submission received: 27 April 2023 / Revised: 5 June 2023 / Accepted: 9 June 2023 / Published: 11 June 2023
(This article belongs to the Special Issue Political Ecology of Forests Ecosystem Services)

Abstract

:
The concept of payments for ecosystem services (PES) has been identified as a promising mechanism for use in Kenya, Uganda, and Tanzania, with several potential advantages and benefits, including the ability to raise new funding for landscape management, increase the efficiency of conservation approaches, secure ecosystem services (ES), and benefit poor rural communities. Starting from understanding the complex relationship between human dependence on natural resources and the environment, this paper aims to determine the degree to which the various criteria affect the success of PES that involve forests. Primary data were collected using a mixed questionnaire that was sent to institutions that had implemented PES schemes in the region and 25 case studies of PES implemented in the region from various publications were used for the secondary data. The data were mainly analyzed using comparative analysis. The results indicated that PES success is higher when bundled ES are considered, financing is medium- to long-term, implementation is at the regional level, combined transaction types (cash and in-kind) are used, and both private buyers and public sellers are involved. This paper provides a good benchmark for decision makers on PES performance and the model presented may serve as one of the tools for improving livelihoods and ensuring the achievement of sustainable development goals.

1. Introduction

The concept of ES, bridging environmental and social science ideas, was conceived by the authors of [1] and was built upon earlier work that elucidates human dependence on natural resources [2]. The idea was born out of a desire to arouse public interest and create a framework to highlight the societal advantages of ES protection as the rate of biodiversity loss became more apparent [3,4]. The millennium ecosystem assessment was essential in sustaining the approach in that it demonstrated the connection between human beings and ES [5].
Ecosystems offer services that are vital to human existence and well-being. However, many ES exist beyond the market system [6]. There are several options available to address this market failure. The traditional and most popular method is to use governmental authority-enforced command-and-control techniques. As a more modern strategy to address environmental externalities globally, PES as financial incentives are increasingly being considered [6,7,8]. PES are founded on the principle whereby the beneficiary pays and the provider receives, in which beneficiaries who are willing to pay for ES are connected to ES providers in a contract-like manner [9].
The PES concept was initially created for developing nations, such as the three East African countries included in this study, where many of the people that inhabit important ecosystems are found in underdeveloped rural areas, with unstable livelihoods and few options for employment and income [10]. Government conservation organizations, which are generally very underfunded, as well as weak institutions and bad governance frequently limit the effectiveness of command-and-control systems [11]. While primitive variants of PES have existed for decades, it was only in the 1990s that PES became widely accepted as an integrated conservation and development method [12]. This increased frequency of use is mostly attributable to PES’s reputation as a potential instrument for addressing issues of justice, equality, and poverty eradication, although there is conflicting evidence regarding PES’s contribution to poverty reduction [13]. PES schemes are not without their detractors as, aside from the broader criticism that natural resource pricing is unethical [14], PES systems’ technical implementation has also been heavily criticized [15].
Despite the criticism, hundreds of PES programs (mainly local-level setups) are in operation today globally and in the East African region. Most of them involve forest ecosystems; they can relate to carbon PES schemes, where carbon is the traded type of ES [16], or cover other traded ES, such as biodiversity conservation, landscape protection, and watershed protection [17,18,19]. This induces the need to implement successful PES schemes and therefore to identify the factors that influence their success. To support their identification, in this paper, the analyzed PES schemes were classified as successful, partially successful, or unsuccessful.
Various studies have analyzed the performance of PES for different ecosystems and in other parts of the world, and each has its limitations. In 2017, the authors of [20] published a study about the status of PES in Indonesia, focusing solely on four schemes involving water and five schemes involving carbon. They evaluated how stakeholders (donors, government, and NGOs) perceive PES programs and the factors that encourage or hinder their success. Another study on the assessment of PES performance [10] was the most substantial as it considered many types of ES. It addressed why and under what circumstances PES systems may be beneficial and how PES programs could be improved. The data were presented from PES programs in Germany and the United States, comparing how the programs’ attributes contributed to their overall success. However, their classification is unsuitable for use in developing countries where the information is insufficient and not all requirements can be met.
The study in Latin America [21] provided methodological orientation and gave insight into what factors influence the potential for PES success. The study aimed to take a comprehensive perspective to understand the prerequisites and variables that contribute to the various levels of PES systems’ success. They used an appropriate set of criteria to represent the environmental and social components of the PES scenario, in addition to various ES [21]. Several studies focus on analyzing PES performance using authors’ established criteria and various methodologies. What is missing is concern for the performance of a larger system that utilizes a set of interconnected social and environmental criteria.
This study, applied particularly to forest ecosystems, aims to determine the degree to which the various criteria affect PES success and analyze the perspective of some experts who contributed to the implementation of PES schemes, comparing the findings from the secondary and primary sources of data in the East Africa region, specifically for Kenya, Uganda, and Tanzania. Over recent years, this region has seen an increase in the number of implemented PES schemes. Using 25 PES case studies from the study area that have not yet been adequately analyzed, this research aims to contribute to the ongoing important process of analyzing PES performance.

2. Materials and Methods
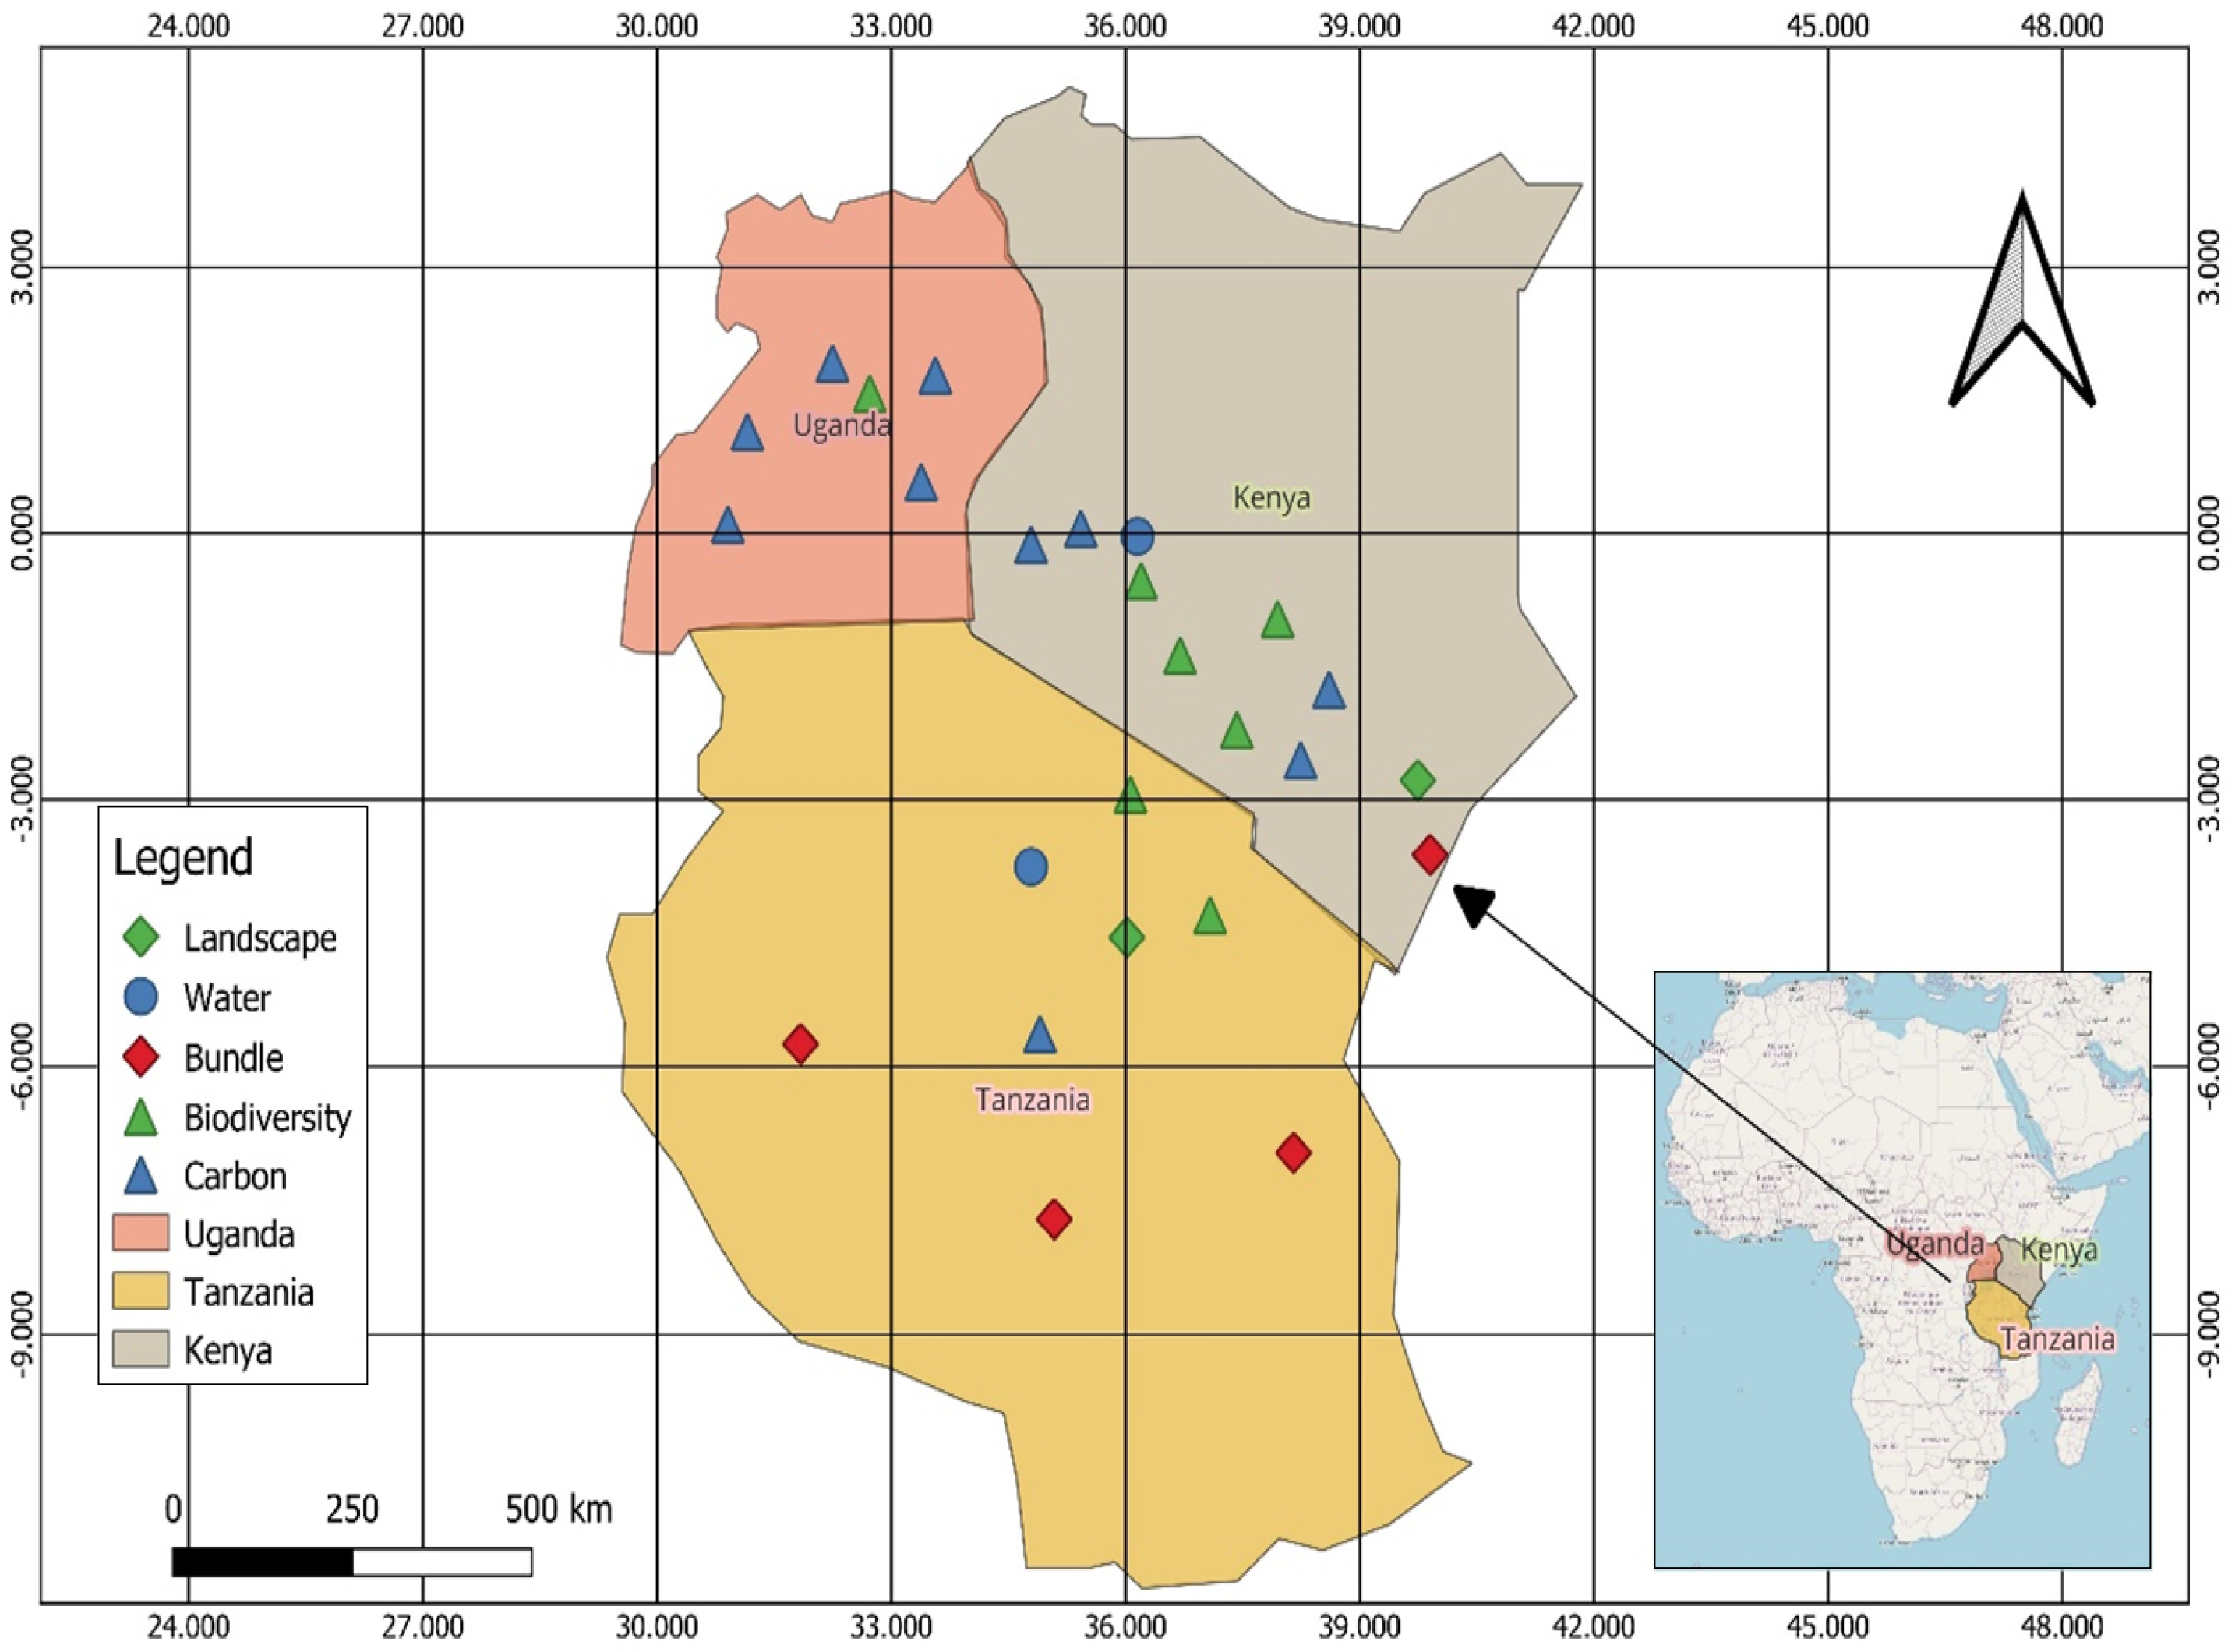
2.1. Study Area

The East African region has a wide variety of forests that are home to a vast range of biological richness, with a percentage of forest area of 6.3% for Kenya, 51.6% for Tanzania, and 11.7% for Uganda [22]. The main types of forests are mangroves, tropical and subtropical forests, plantations, miombo woods, savannah, and acacia woodlands. The provision of goods and services by forests is essential for sustaining human life and regional socioeconomic growth [23]. The regional catchments known as the Water Towers of the region serve as vital sources of water for major lakes, such as Lake Victoria (Kenya), Lake Tanganyika (Tanzania), and ultimately the White Nile (Uganda). A group of mountain ecosystems and connected river basins makes up eastern Africa’s “Water Towers”. These regions significantly affect local hydrological and climate cycles on a global scale [24].
For this study, PES case studies were selected using the following criteria: implementation (finished) and information availability for further analysis that allows for the the evaluation of whether the PES scheme has been successful or not (Figure 1). The list and summary description of the selected 25 PES case studies can be found in Appendix A (Table A1).

2.2. Methods

The primary source of data for this paper was a questionnaire that was developed to contain questions to assess perceptions of PES success. The questionnaire (Table A2) had one open question (in which asked experts their associated institution and country) and five closed multiple-choice questions. The latter questions asked actors involved in PES implementation regarding their perception of the extent to which the criteria (one question for each criterion: 1—temporal scale, 2—spatial scale, 3—type of ES being traded, 4—transaction type, 5—involved actors) influence PES success. The Likert scale [25] was used to evaluate the actors’ perception; therefore, the answer options were: 1 = irrelevant, 2 = less relevant, 3 = relevant, 4 = very relevant, and 5 = extremely relevant. This questionnaire was sent to the experts who planned the PES schemes through Google Drive (Vi Agroforestry, World Agroforestry, PAMS Foundation), to the officers that performed administrative roles and who were associated with intermediary institutions (Kenya Forest Service, National Forestry Authority, Tanzania Forestry Authority), and to a consultant researcher from Egerton University. The response rate was 32%. No statistical analyses were performed due to the small number of responses received. However, the answers to the questionnaires are important because they provide some valuable complementary information to the case studies.
The secondary data source was the documentation on PES case studies. The information was collected using computerized searches in January 2023 through the Science Direct and Google Scholar search engines. PES implementation, PES, PES case study, PES report, and PES project were among the searched phrases in the title, abstract, or keywords, and anywhere in the text. Using filters to identify case studies since 1993 and peer-reviewed papers, a total of 225 research papers resulted from this. After analyzing them, only 18 research papers were identified as reviewing PES in Africa, from which we were able to select 25 PES schemes implemented in Kenya, Uganda, and Tanzania that met our selection criteria (Table A1). For each of the PES schemes, we had to go to the websites of the project implementing partners to find some reports and gather more details, such as the scale types, the types of ES being traded, transaction types, actors involved, and more details on if the PES scheme had achieved its intended objectives (Table S1). Some of the implementing partners were the Satoyama Initiative, Tanzania Forest Conservation Group (TFCG), Dar-es-salaam Water Supply and Sanitation Authority (DAWASA), and Consultative Group on International Agricultural Research (CGIAR). We also had to go to the international buyers/donors’ websites, including FACE foundation, Global Environment Facility (GEF), United Nations Environmental Program (UNDP), BirdLife International, Kilombero Valley Teak Company (KVTC), Food and Agriculture Organisation of the United Nations (FAO), and World Bank.
Based on the secondary data source, the subset of criteria first suggested by the authors of [10] and later adjusted by [21] was used. Following the selection of cases, the next step was to assess the level of success for each case study. Qualitative information provided for each case study was used to determine if the case was successful, partially successful, or unsuccessful. Extra sources, such as additional papers, studies, or the websites of the institutions that participated in PES implementation were used to double-check the data. The definition of success that was used was the one given by the authors of [21], where “success” was defined as a mix of (a) the extent to which the PES scheme’s original or stated aims were reached, and (b) the added value in terms of an overall improvement of the region’s ecological, economic, and social conditions, beyond the original or established goals. Partially successful PES systems attained the main goals, but also had unforeseen consequences such as societal conflicts/trade-offs with other ES. Unsuccessful cases failed to fulfill their initial goals and jeopardized ES, social well-being, or the economy. The results were organized in an MS Office Excel sheet and plotted against each of the established criteria to yield a statistical result on how frequently a particular option was recurrent.
The first evaluation criterion was the scale (Table 1). This was founded on the recommendations of the authors of [8], who stated that temporal and spatial scales should be considered when evaluating PES implementation as they influence the outcome. Although the provision of ES can have global consequences and benefits, the three levels utilized in our categorization (local, regional, and national) corresponded to the region of land that the scheme was nominally addressing. The temporal scale matched the time duration during which financing was available for the scheme. Long-term funding schemes had financing of over 30 years, while those with funding of between 10 to 30 years were defined as mid-term, and those with financing of less than ten years were categorized as short-term. Spatial scale considerations arise from the understanding that the provision of ES is not evenly spread throughout an area. The spatial distribution of ES can be described by examining the direction in which they flow and the geographical range over which their benefits are experienced [6]. For example, services that regulate climate are all-encompassing and provide advantages on a worldwide level [26]. Water services flow from higher points to lower points in a specific direction, moving from upstream to downstream, and are observed on a larger scale, encompassing a particular region or watershed. On the other hand, biodiversity and habitat services are confined to their original locations but have effects that extend beyond their spatial boundaries, influencing the local, regional, and even global levels. These attributes must all be considered when designing a PES program for a particular ES [27]. PES agreements can vary significantly in duration. Opting for long-term contracts can provide greater security for the ES provider, ensuring a reliable additional income. Furthermore, long-term contracts may enhance the sustainability of a program [28]. However, during the testing phase of a program, shorter-term contracts are often seen as advantageous since any shortcomings can be promptly addressed to benefit all parties involved [29]. Additionally, flexibility is necessary when circumstances change in a way that raises doubts about the effectiveness or efficiency of the PES program [30].
The second criterion identified was the traded type of ES. ES are categorized as regulating, provisioning, cultural, and supporting [5]. Supporting services are directly linked to biodiversity protection (through habitat and species protection), cultural services are linked to scenic value from landscape protection for tourism, provisioning services are linked to water quantity and quality, and regulating services are linked to increasing carbon sequestration or avoiding carbon emission. Multiple forest ES are incorporated into the PES arrangement when “bundled” services are used [12]. Biodiversity-related PES encompass the safeguarding of one or multiple species, as well as the conservation or restoration of their habitats. The classification of schemes based on landscape types focuses on initiatives that promote the enhancement of landscapes for tourism purposes or the preservation of specific landscapes by supporting traditional land uses or practices. The water category includes all ES associated with the improvement of water quality, such as services that reduce pesticide or nutrient levels, and increasing water quantities, such as ES that boost the volume of water in a river or retained within a watershed. The carbon category pertains to schemes that aim to prevent carbon emissions or enhance carbon sequestration. Lastly, bundled ES include a combination of more than two ES. Even though bundled ES can have a negative effect on potential trade-offs, they can also have synergistic effects [29]. For instance, promoting agricultural intensification to increase food production may conflict with goals of water quality improvement or habitat conservation. Balancing these trade-offs can be complex and requires careful consideration and negotiation among stakeholders. PES schemes that integrate equity considerations should ensure that the distribution of benefits and costs is fair and equitable. However, it can be challenging to allocate payments among different ES and participating landowners in a way that considers social, economic, and environmental justice [12].
The third criterion concerned how buyers compensated the administrators of ES. The goal of this criterion was to determine if the vendors received monetary payments, in-kind compensation, or a mixture of both. In-kind payments might be services and items supplied to the administrators without using money, whereas cash payments signified a direct monetary exchange. The analyzed in-kind payments include microcredits, training courses, technical assistance, education and health, community projects and material infrastructure. In a PES scheme, payments need to encompass various types of costs. Typically, these include opportunity, implementation, and transaction costs [31,32]. For PES to be appealing to sellers of ES, the payments offered must at least compensate their opportunity costs (the costs incurred by forgoing alternative land uses) and implementation costs (the actual costs of implementing the agreed-upon measures or practices that generate the ES). These payments depend on the sellers’ “willingness to accept” the effort required to create the services, rather than the buyers’ “willingness to pay” for them. Additionally, the PES entails transaction costs, which arise from activities such as gathering information, making decisions, contracting, administering funds, monitoring, and ensuring the delivery of ES in the agreed-upon quality and quantity [10]. Transaction costs also involve controlling any potential breaches of contract between the parties involved [32]. Transaction costs are typically higher during the start-up phase (e.g., negotiation, baseline assessment of ES, system design) compared to the operational phase, which involves administration, monitoring, and enforcement/sanctioning [12]. Expenses can be covered by either private or public funding, or a combination of both. When it comes to public funding, governmental entities participate as partners in PES. According to Gutman [33], funding can include various sources such as public budget, additional funding obtained through specific laws, taxes, charges, fees, fines, penalties, bank loans, debt-for-nature swaps, or environmental funds. Private funding sources, on the other hand, encompass not-for-profit funding (provided by charities, non-governmental organizations, foundations) or for-profit funding (such as funding obtained from households, local or non-local businesses through private investments, etc.).
According to Ferraro [9], payments for PES can be made in two forms: cash or in-kind. It is also possible to have a combination of both types [21]. In-kind payment refers to the provision of materials required for the agreed management activities, such as seeds or saplings for reforestation. Additionally, it can take the form of technical support or training for the providers of ES. Economic incentives are important in this context. When the significance of monetary incentives decreases, the importance of other types of incentives, including intrinsic motivations, increases [13]. Regarding the frequency of payments, they can either be one-off or periodic, such as monthly or annual payments. The timing of payment can be upfront, particularly when investments need to be made before implementing the PES program, or it can be postponed until after the services have been provided. Blank [34] highlights the downside that gains from education (or similar forms of compensation) may appear more appealing to society rather than to the individual. This is because the benefits derived from such investments could be enjoyed by individuals other than the one undergoing the training. Additionally, it is reasonable to assume that the value of additional training diminishes over time. Once a certain number of days of practical training have been completed, the advantages gained from enhanced knowledge, which could potentially result in increased income through improved or novel production methods on the farm, may be outweighed by the time cost associated with each additional day of training. Several researchers [35] conducted a study in the East Usambara Mountains, Tanzania, to examine landowners’ payment preferences. They employed a choice experiment and explored four payment methods: consistent and fluctuating annual cash payments to individual farmers, a consistent annual cash payment to a village fund on behalf of farmers, and an initial payment of manure fertilizer. The results indicated that both cash payments and the provision of manure fertilizer significantly incentivized participation in the PES program, whereas the group payment method did not have a significant impact.
The final criterion for comparing PES examples was whether the actors involved (sellers, buyers, and PES mechanism intermediaries) were private or public. The term public refers to the government (local or national) or agencies of the government and community forest, whereas private refers to farmers, landowners, NGOs, and private corporations who fund the conservation of a certain ecosystem or landscape through their fees. Buyers are those who benefited from ES, while sellers are those who provided them. Even though they may be public institutions, sellers were mostly land users or private landowners who carried out management actions to ensure that ES were provided continuously. Private buyers include NGOs, private corporations, and individuals, and public buyers are governments. While private sellers include landowners, public sellers include governments and community forests, and intermediaries include government agencies. This criterion also revealed whether there were any intermediaries engaged in the process. They could be private or public corporations or groups that operate as sellers’ or buyers’ intermediaries. One crucial initial matter revolves around the identity of the “buyers” of ES. It is essential to differentiate between situations where the buyers are the direct beneficiaries and users of ES, and situations where buyers are entities such as government, NGO, or an international agency who act on behalf of ES users [29]. PES participants from various sectors such as the market, government, civil society, or science, play different roles as sellers of ES, buyers of ES, or intermediaries who help to facilitate or oversee the corresponding activities. ES sellers, also known as providers, encompass individuals or entities responsible for ensuring the delivery of ES [29]. These providers typically include landowners or land managers, who can be private individuals like farmers, ranchers, or forest owners, as well as businesses, communities, or even government entities. ES can originate from privately owned, collectively owned, or publicly owned land, regardless of whether it is actively managed or left in its natural state. Ideally, in the best-case scenario, the land is privately owned, and the ES seller possesses complete ownership, title, and corresponding property rights. However, some PES schemes have unclear property rights due to community management [36]. ES buyers consist of two categories, i.e., those who directly benefit from the delivered services, and those who act as intermediaries on behalf of others. The direct beneficiaries encompass various entities such as private individuals, businesses, and communities. For instance, individuals or companies who own or manage land downstream in a watershed rely on the services provided by landowners upstream [12,29]. Entities acting as buyers on behalf of the ultimate recipients encompass governments, which represent society’s requirement for public assets such as pure potable water and uncontaminated air, and civil society endeavors such as NGOs that are funded by voluntary contributions from individual funders. Intermediaries serve various purposes, such as acting as a mediator, assisting with contract negotiation, managing payment collection and administration, and overseeing, controlling, and verifying the delivery of essential services. Experienced intermediaries have the potential to decrease the total expenses of a system [6,7]. Additionally, intermediaries are seen as valuable in establishing trust between parties [12] because their primary focus is on achieving conservation benefits rather than making profits.
Summarizing the cases examined for each criterion allowed us to assess the factors that appeared to have the greatest impact on the PES scheme’s success. Particularly, the percentage of schemes classed as successful for each option of the various criteria gave us an indicator of how probable the use of an alternative was to achieve a good outcome for the various schemes in our sample using comparative analysis. The information obtained from the questionnaire was used to show the qualitative perspective of the different criteria.

3. Results and Discussion

3.1. Results from the Case Study Analysis (Secondary Data)

Out of 25 forest ecosystem-related PES case studies analyzed from Kenya, Uganda, and Tanzania (Table A1), based on [21] definition of success, 13 case studies were categorized as successful, 10 were classified as mid-successful, and two were classified as unsuccessful. Table 2 gives a summary of the cases examined for each criterion. This allowed us to highlight the factors that most influenced the success of the PES scheme. Particularly, the proportion of schemes classed as successful for each option of various criteria gave an indicator of how promising an alternative was to achieve a good outcome for the various sampled schemes.

3.2. Factors Related to PES Succes According to Comparative Analysis of PES Cases

Comparative analysis was used to determine whether the PES instances that were determined to be successful shared any traits that might be responsible for PES success. We performed a case-by-case assessment of data from two or more sets.

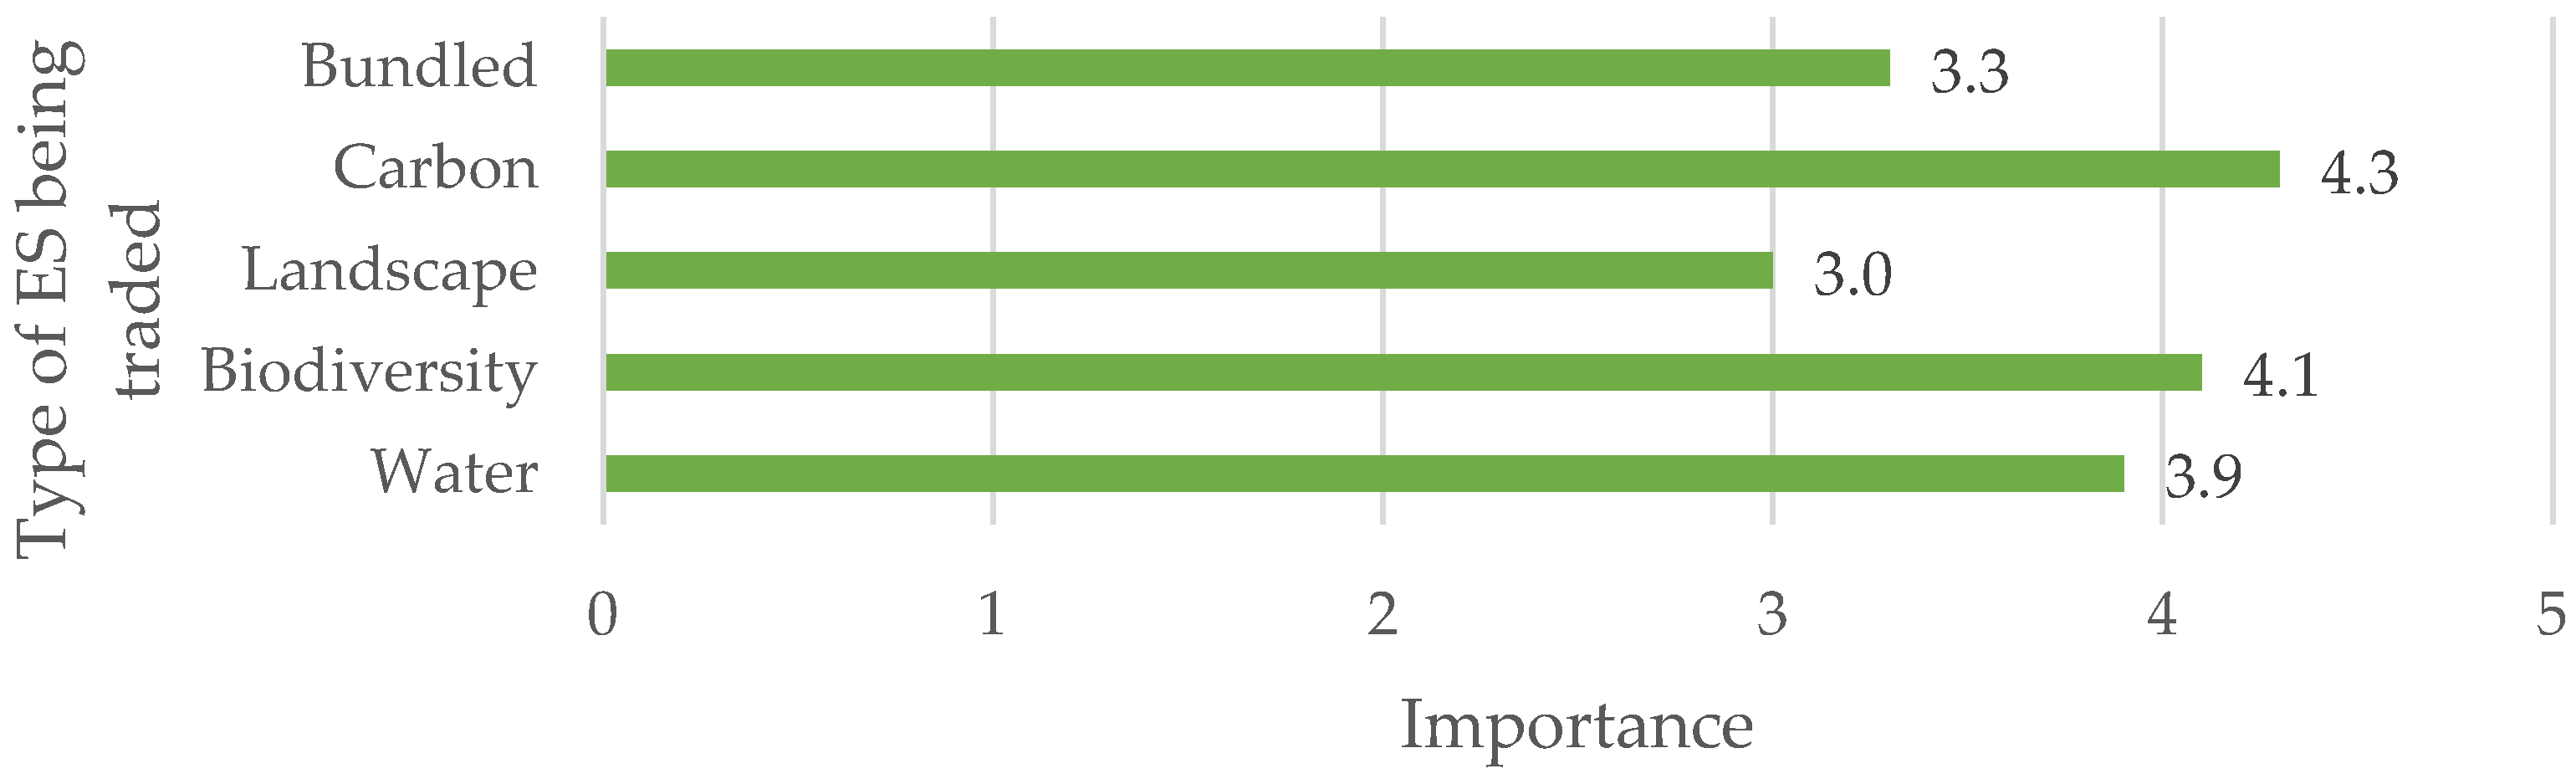
3.2.1. Type of ES Being Traded

In most of the analyzed case studies, we found that carbon was the most dominant type of ES being traded in the three countries, accounting for 40% of the analyzed case studies (Table 2). Carbon sequestration was the preferred destination for carbon investors in East Africa. This was mostly attributed to companies performing social corporate responsibility with the aim of offsetting their carbon emissions, and to international buyers of carbon credits in the region [16]. Carbon sequestration had a success rate of 40% from our analysis, which could be credited to the challenges addressed by Berttram [37] that were identified during feasibility studies. However, some case studies were successful beyond expectations. For example, in Uganda [38], for carbon sequestration, the scheme operators employed some of the people in the surrounding forest reserve and continued with the project due to the gained positive externalities. Due to the transaction type (cash) mostly being used in carbon sequestration PES schemes, 20% of case studies were unsuccessful. This transaction type exhibits a lot of challenges [39,40].
Bundled ES being traded, which represented 16% of the analyzed case studies, had a 75% success rate, the highest rate of success in our analysis. An example that was successful and improved livelihood in the area is the Malewa river basin in Kenya [17]. As the water quality and quantity improved over the years, while also protecting biodiversity (pink flamingo), tourism increased in the area. Biodiversity, as the type of ES being traded comprised 28% of our analyzed case studies, with a 57% success rate. An example was seen in Kenya [41], where pollinator bee and wild silk moth abundance ratings were steady or rising. Forest-dependent birds that depend on forests revealed no extinctions or declines in population size in core and buffer areas. Both water and landscape, as types of ES being traded, had 32% success rates and each represented 8% of our analyzed case studies. Even though there was a small number of PES schemes implemented in this area related to landscape and water, this limitation was compensated for by finding other factors that influence PES success. For example, in Kenya [42], for landscape PES scheme, the expectations were relatively low regarding women respondents due to discrimination because of the customary laws in the rural population which they saw in the pilot phase, even after public campaigns. In contrast, after implementation, 47% of participants were women. Regarding water PES schemes, another example can be seen in Kenya in Lake Naivasha [43], where the displacement of degradation practices to neighboring Kabati area occurred due to non-participating farmers in the area who continued to use agrochemicals and did not apply embankments on steep slopes.

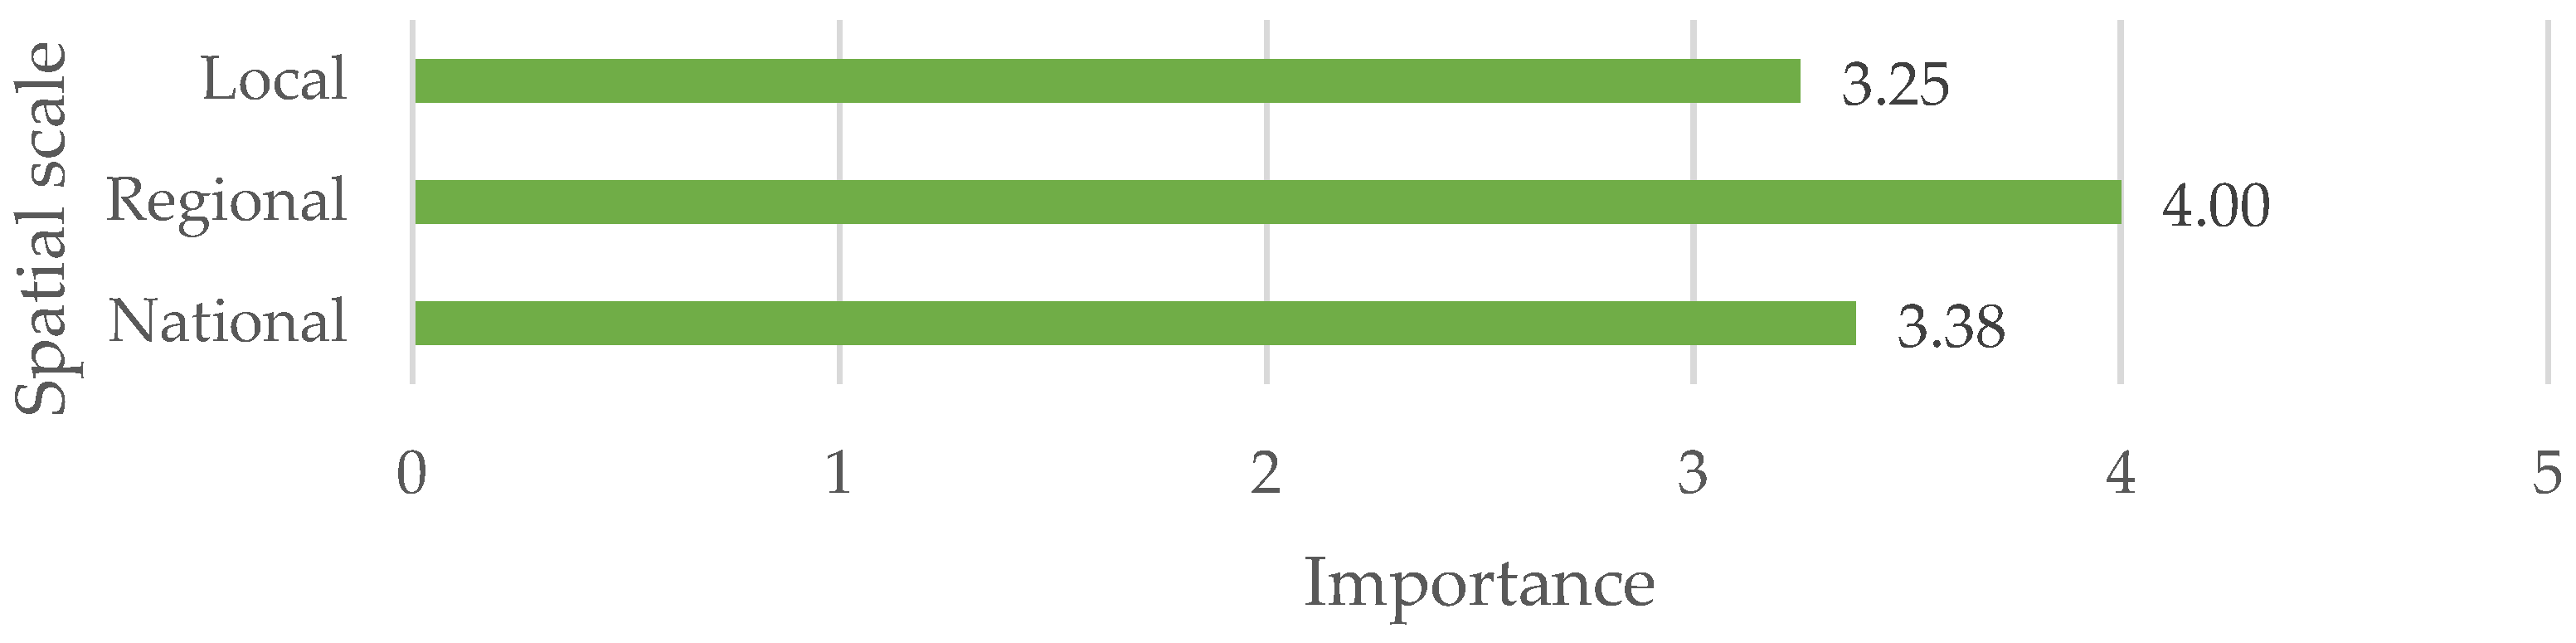
3.2.2. Spatial Scale

Just over half (52%) of the analyzed case studies (Table 2) were implemented at a regional scale and had a success rate of 62%, while PES implementation at a local scale had a success rate of 40% (representing 40% of the analyzed case studies) which was attributed to the fact that communities can better identify buyers and intermediaries at the regional and local levels, while also tracking benefits and costs together. An example is from Kibale, Uganda [38], where the scheme implemented at regional scale was so successful because the residents of the communities surrounding the park were supportive. They used a portion of the project’s profits to help people in the community within the park, and the initiative produced 340 paid jobs over the last 25 years. While PES implemented at the national scale had a 50% success rate and this represented 8% of the analyzed case studies, this could be attributed to the significantly low number of PES implemented at the national scale (2) to make a significant impact. The authors of [44] state that operations at a regional or local scale have a greater effect than on a national scale for PES programs relating to the conservation of the natural resource base (water, landscape, biodiversity, and carbon). An example is in Kenya [45], where during a short-term implemented PES scheme, some of landowners did not feel the effect of opportunity cost between alternative land use and biodiversity conservation due to delayed payments, which derailed PES success.

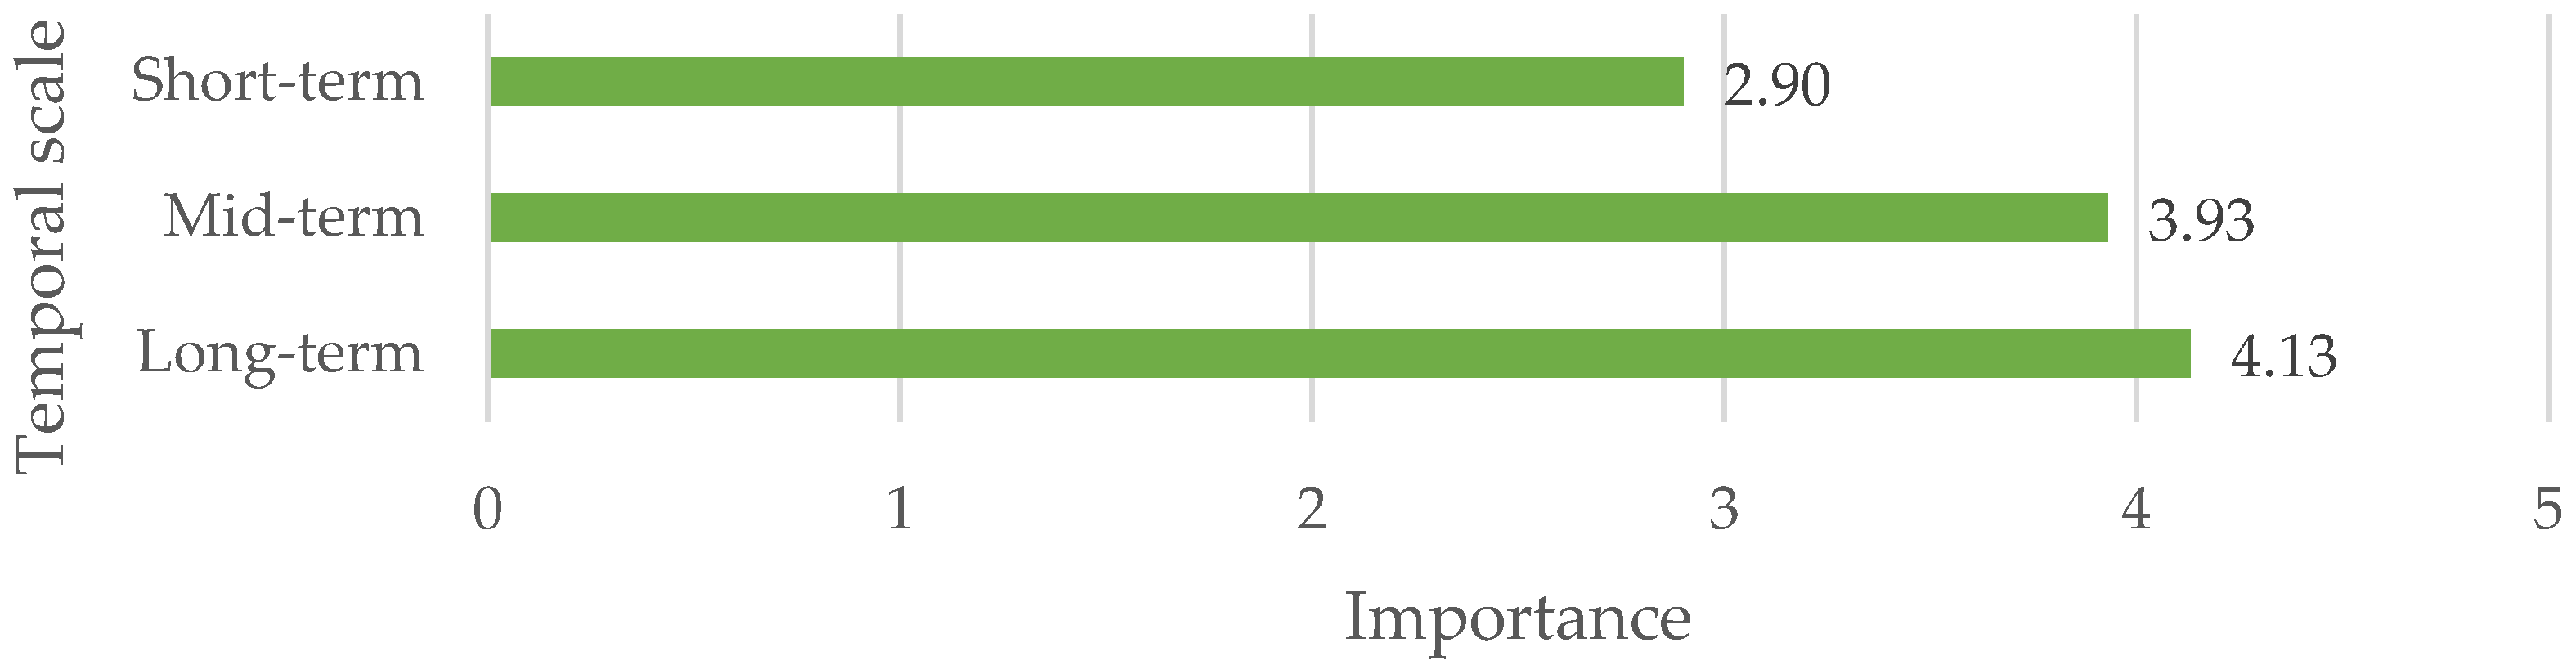
3.2.3. Temporal Scale

One significant issue raised in the PES-related literature is the limited PES longevity [28,29]. It has to do with the concern that, if contracts are too short-term, ES sellers may abruptly withdraw from the schemes if a financially more appealing alternative to the PES is presented, with the risk of ES provision declining once more. In our analysis, long-term-implemented case studies had 100% success, which represented 12% (Table 2) of the case studies, while mid-term implemented PES schemes had 44% success rates and represented 36% of our analyzed case studies. Other authors [46] have also emphasized the relevance of mid-term-implemented PES schemes. This timeframe with long-term implemented PES schemes is particularly important for implementing sustainable management regimes and changing people’s attitudes towards the use of natural resources. An example is in Uganda [47], where the PES scheme (mid-term) was so successfully that it led to the creation of a national organic certification body known as Ugocert. Another example, also in Uganda [38], saw long-term-implemented PES establish nature-based tourism on the basis of the rehabilitated landscape facilitate the growth of eco-businesses that provided more income to the local communities.
Short-term-implemented PES schemes had success rates of 46% and represented 52% of the analyzed PES schemes. The success was moderate because finding buyers for ES proved to be cumbersome. This aspect is also supported by Berttram [37] findings. One good example is Lake Naivasha in Kenya [43]. Here, after PES schemes came to an end, it was necessary to find more buyers of ES because it was implemented short-term. As a result, it was recommended to make the scheme sustainable in the long-term. As another example from Kenya [48], the unexpected outcomes were noticed by researchers from the University of Alberta in Canada that conducted a study on Arabuko Sokoke Forest and discovered the visitors to be willing to pay a significantly higher amount compared to the existing 5 USD entrance fee to have the opportunity to observe various bird species within the reserve. This could have been addressed and more income generated if the PES scheme was implemented long-term.

3.2.4. Transaction Type

The in-kind transaction type consisted of 48% (Table 2) of the analyzed PES case studies and had a 58% success rate, while cash and in-kind transaction types had the highest success rate of 63% and represented 32% of our analyzed case studies. In contrast, the cash transaction type had a success rate of 20% and a 40% rate of not being successful. This finding is backed up by the authors of [7] who emphasize the advantages of using the in-kind transaction instead of cash in areas where the distribution of cash to sellers is unfair and the occurrence of corrupt practices decrease intrinsic motivation associated with cash transactions. An example comes from the Lake Naivasha PES scheme in Kenya [43], where a voucher system (in-kind) was used for each farmer which was redeemable at selected agro-input supplier shops mainly for certified seeds. This proved to contribute to the overall success of the scheme as this was one of the reasons the farmers perceived it as an incentive for them to join the PES scheme. This is also seen in other parts of the world where the in-kind transaction type has proved to be successful. In Nicaragua, for example, we see the Gil Gonzalez case [49], where there was a provision of materials such as seedlings, fences, and tools. An example of in-kind and cash transaction type can be seen in Uganda [50], where farmers received cash and opened village banks to access more credit in order to open income-generating business ventures, but also received additional training on conservation agriculture (in-kind).

3.2.5. Actors

The degree of success was the highest (60%) when private buyers of the ES were involved. This can be attributed to the fact that East Africa is a popular destination for private carbon buyers [37] and a lot of carbon sequestration projects are implemented. For example, in Uganda [50], where the private buyers of the carbon were IIED (International Life-line Fund, International Institute for Environment and Development) and Blue Green Carbon with the goal of raising family incomes through carbon payments, providing technical assistance to farmers, allowing them access to other markets such as lumber, fuel wood, fruit, fodder, and poles, and maintaining biodiversity by fostering indigenous tree species. Another example can also be seen in Uganda [16]. It is within a project that is a component of Uganda’s Energy for Rural Transformation Project, a private–public (government of Uganda is the public seller) partnership managed by the World Bank which receives significant contributions from the World Bank and Norway (3 million USD) to the private buyer known as the prototype carbon fund (PCF). The fund is responsible for purchasing the carbon emission reductions (CER) resulting from this project. There are two sources of revenue: the sale of electricity to the communities in five districts of Uganda’s West Nile region, and the revenue generated from the sale of CERs. Another example is in Tanzania [47], where a private company (KVTC) pays village groups for the establishment of plantations. This is also seen in other parts of the world, such as in Lampung, Indonesia [20], where a company pays three villages for watershed services to construct terraces and sediment pits, plant trees and conserve riverbank.
Public buyers for ES accounted for 16% (Table 2) of the analyzed case studies and had a 50% success. This was not as high as the level for private buyers due to the challenge of finding public buyers. There is exemplified in Uganda [51] by a governmental agreement marking Africa’s inaugural conservation fund, which is due to receive support from the GEF. The trust allocates financial aid in the form of grants to support local community organizations in fostering socio-economic endeavors. These initiatives aim to showcase beneficial outcomes for the preservation of parks and offer alternative methods of fulfilling needs that were conventionally met by exploiting park resources. The trust fund allocates 60% of its income to support community development initiatives. Out of this amount, 20% is dedicated to conducting ecological and socioeconomic research, which generates valuable data for enhancing park management and fostering positive park–community relations. Another 20% of the income is utilized for park management activities, covering the expenses associated with implementing management plans. Public and private buyers of ES in our analysis had a 33% success rate and this represented 24% of our analyzed case studies. This low success rate can be attributed to the fact that most East African countries do not have enough resources to invest in the PES schemes. However, in some cases, the government also becomes a buyer of the ES. There is an example of this practice in Kenya [41], where the government and international NGOs were public and private buyers and contributed with 0.25 million USD and 1 million USD, respectively. After the project, at least 900 community people had received training in the management and use of wild and mulberry silk moths and African honeybees for income creation (0.33 million USD). A minimum of six community forest associations are responsible for overseeing a combined area of at least 12,000 hectares of forest across multiple locations (0.56 million USD).
In our analyzed case studies, we had more public sellers of ES than private, with success rates of 71% and 44%, respectively. An example is the Kibale National Park, Uganda [48]. The Uganda National Parks (UNP), acting on behalf of the government of Uganda, made a deal with the FACE Foundation (on behalf of The Netherlands) to restore the depleted regions of Kibale and Mt. Elgon National Park, the farmers were paid about 32 USD per year for every hectare of forest left intact. As of 2008, according to the project manager, the Government of Uganda has received a total of 7 billion Ugandan shillings (equivalent to 430,000 USD) from the FACE Foundation for the project up to this point [52]. The main objectives of this are to absorb carbon emissions, oversee water conservation, and establish a new habitat for a variety of wildlife species. Regarding the intermediaries, the analyzed PES case studies that had intermediaries saw a greater degree success (53%) compared to the ones that did not (50%). This could be explained by the findings of the authors of [53] who stated that the capacity of water management institutions to implement these policies is lagging, especially in East Africa for watershed ES. There is an example of this issue in Kenya [51], where an intermediary aided in PES success. The Kenya Forest Service (KFS) is a government agency that acts as the central coordinating body for all entities engaged in tree cultivation and administration throughout the nation. It provides expertise and guidance on nursery operations, seedling generation, and the selection of appropriate tree species. In designated forests, the KFS collaborates with community forest management (CFM), user groups, and community-based organizations (CBO). Additionally, some KFS personnel are affiliated with TIST Small Groups. The Kenya Forestry Research Institute (KEFRI) is another government agency that conducts research, undertakes seed collection, and oversees seed quality standards, among other responsibilities [51].

3.3. Perceived Degree of the Criteria Contribution to PES Succes in Kenya, Uganda, and Tanzania (Primary Data from the Questionnaire)

The prepared questionnaire was sent to the institutions involved in the implementation of various PES case studies that we sampled in the three countries from East Africa. We received feedback from 16 respondents in total: 11 from Kenya, 2 from Uganda, and 3 from Tanzania. Despite the unbalanced response between nations, these data can help us to double-check the findings from the case study analysis.
According to the respondents (Figure 2), when biodiversity is the type of ES being traded, the PES mechanism is more likely to be successful (4.1 out of 5) and our findings show a 57% success rate. Landscape (3.0 out of 5) and water (3.9 out of 5) in our analyzed case studies both had 50% rates of success. Because the number of analyzed case studies for landscape and water was low, more PES schemes should be assessed on these ES to obtain a more definitive outcome. In contrast, according to the respondents, carbon as the type of ES being traded contributed most to PES success when implemented (4.3 out of 5)—in our analysis, it had a success rate of 40%. Bundled ES being traded in our analysis had the highest rate of success at 75%, but the respondents perceived that bundled ES (3.3 out of 5) was almost the least likely among them to contribute to PES success. This can be attributed to the fact that, in our criteria for the selection of successful PES schemes, they not only achieved their aim but also added value in terms of an overall improvement of the region’s ecological, economic, and social conditions.
Implemented according to the recommendations of the respondents (Figure 3), the regional implementation of PES contributed more to the success of this (4.0 out of 5), followed by national (3.38 out of 5) and local (3.25 out of 5) on a spatial scale. This is backed by our finding from the qualitative analysis, which indicates a regional spatial scale implementation success rate of 62% given the fact that 52% of our analyzed PES case studies were implemented at the regional level. Our national PES implementation had a 50% success rate, which can be attributed to the fact that we only had two cases implemented at the national level, accounting for only 8% of the analyzed case studies. Locally implemented PES schemes in our sampled case studies had a 40% success rate, which is not a fair reflection with accordance to the respondents’ perception of its contribution to PES success (3.25 out of 5). This is attributed to the fact that most of the analyzed PES schemes implemented at the local scale included carbon as the type of ES being traded and most were not successful due to the cash transaction type most of the schemes used. This outcome contrasts with what other authors argue [54], namely, that most studies implemented at regional and local levels are more successful on a spatial scale.
According to the respondents (Figure 4), long-term- (4.1 out of 5) and mid-term (3.9 out of 5)-funded PES schemes were the most successful kind. This is also reflected in our results with both long- and mid-term-funded PES schemes having 100% and 44% success rates, respectively. This time range is especially important for establishing sustainable management regimes and changing people’s attitudes toward the use of natural resources. Short-term-funded PES schemes were moderately successful according to the respondents (2.9 out of 5), and in our analyzed case studies they had a 46% rate of success. This is attributed to the fact that this time frame is suitable for implementing sustainable management regimes and changing behavior concerning the use of natural resources.
In terms of the transaction type (Figure 5), most of the respondents indicated that the in-kind transaction type had more success: in particular, technical assistance (4.3 out of 5), education and health (4.1 out of 5), training course (3.9 out of 5), and community projects (3.6 out of 5). This finding is backed up with our analyzed case studies, in which in-kind transaction type had a success rate of 58%. Cash with in-kind transaction type was successful according to the respondents (3.9 out of 5) and in our analyzed case studies, it was most successful payment type, with a rate of 63%. Cash (2.7 out of 5) as a transaction type had 20% success in our analyzed case studies, a finding that is supported by Nordén’s [55] data, which indicate a favorable relationship between PES contract participation and the size of the cash payment. This is particularly factual in carbon payment PES schemes in the three analyzed countries.
According to the respondents (Figure 6), private buyers of ES had a higher contribution to PES success: specifically, NGOs (3.8 out of 5) and private companies (3.2 out of 5). This is supported by our findings from the analyzed case studies in which private buyers of ES also had a higher contribution (60% success rate). Public sellers of ES had a moderate success rate according to the respondents, i.e., land users (3.8 out of 5). This is supported by our analyzed case studies, where public sellers of ES had a 71% success rate.
Many respondents (63%) thought that intermediaries were relevant to success. This is supported by findings showing a 53% success rate if intermediaries are involved in PES implementation. Government agencies (4.4 out of 5) acted as intermediaries in some of the case studies, providing as natural resource administration and, in some situations, management, as well as administering natural resource usage rights.
The results from the respondents’ answers (Figure 7), as we saw above, do not correspond for the most part with the analyzed PES case studies.
More emphasis should be placed on the bundled ES being traded to be more implemented compared to the other ES being traded, as this proved to be a more successful strategy and delivered more benefits to the participants and improved their livelihoods, and also improved the sustainable management of the natural resources.
For PES implementation to be a success in the future, they should consider implementing mid- and long-term-funded PES schemes, as from our analysis they are likely to have a higher success rate.
Another factor to consider for a successful PES implementation should be the in-kind transaction type as it provides more positive externalities to the beneficiaries. Additionally, if stakeholders decide that the transaction type should be cash, like in most of our analyzed PES case studies for carbon trading, they should consider the use of informal banking system like the village banks. There is an example of this in Uganda [51] where the village banks give loans to the participants of the project to enhance farm development as well as to expand their businesses, as capital was stated by participants to be the limiting factor in farm development.
PES success depends on intermediaries in PES implementation to ensure transparency, accountability, and equity in sharing its benefits.

4. Conclusions

We endeavored to understand the forest-related PES schemes’ performance in East Africa for Kenya, Uganda, and Tanzania in this study, employing a set of criteria to determine those factors crucial to the success of PES. We sampled 25 PES case studies in the three countries to analyze PES success in this region and the conclusions are as follows:
  • Type of ES being traded. East African countries are the preferred destination for carbon buyers. However, carbon had, in our study, a low success rate of 40%. This was mainly due to its use of the cash transaction type, although in some PES schemes they incorporated in-kind transactions (Uganda ECOTRUST PES schemes) with more success. In contrast, bundled ES contributed to livelihood improvement and had a 75% success rate and many of the stakeholders perceived the bundled ES as being relevant for PES success. Water had a 50% success rate with a perception of being relevant to PES success. This rate could have been better. However, in one of the cases, there was a displacement of land degradation practices.
  • Temporal scale. Most of the analyzed case studies were implemented at short- and mid-term temporal scales, with optimal timing in terms of funding for PES schemes being mid-term and long-term funding. Long-term implementation had a 100% success rate, while many of the stakeholders perceived long-term implementation as being very relevant for PES success.
  • Spatial scale. Regarding spatial scale, regional implemented PES schemes had a 62% success rate, which aligned with the fact that many stakeholders perceived the regional scale as being very relevant to PES success. This can be attributed to the long-term sustainability of the scheme, which provide more income and employment opportunities as seen in Kibale, Uganda. Locally implemented PES schemes had a 40% success rate.
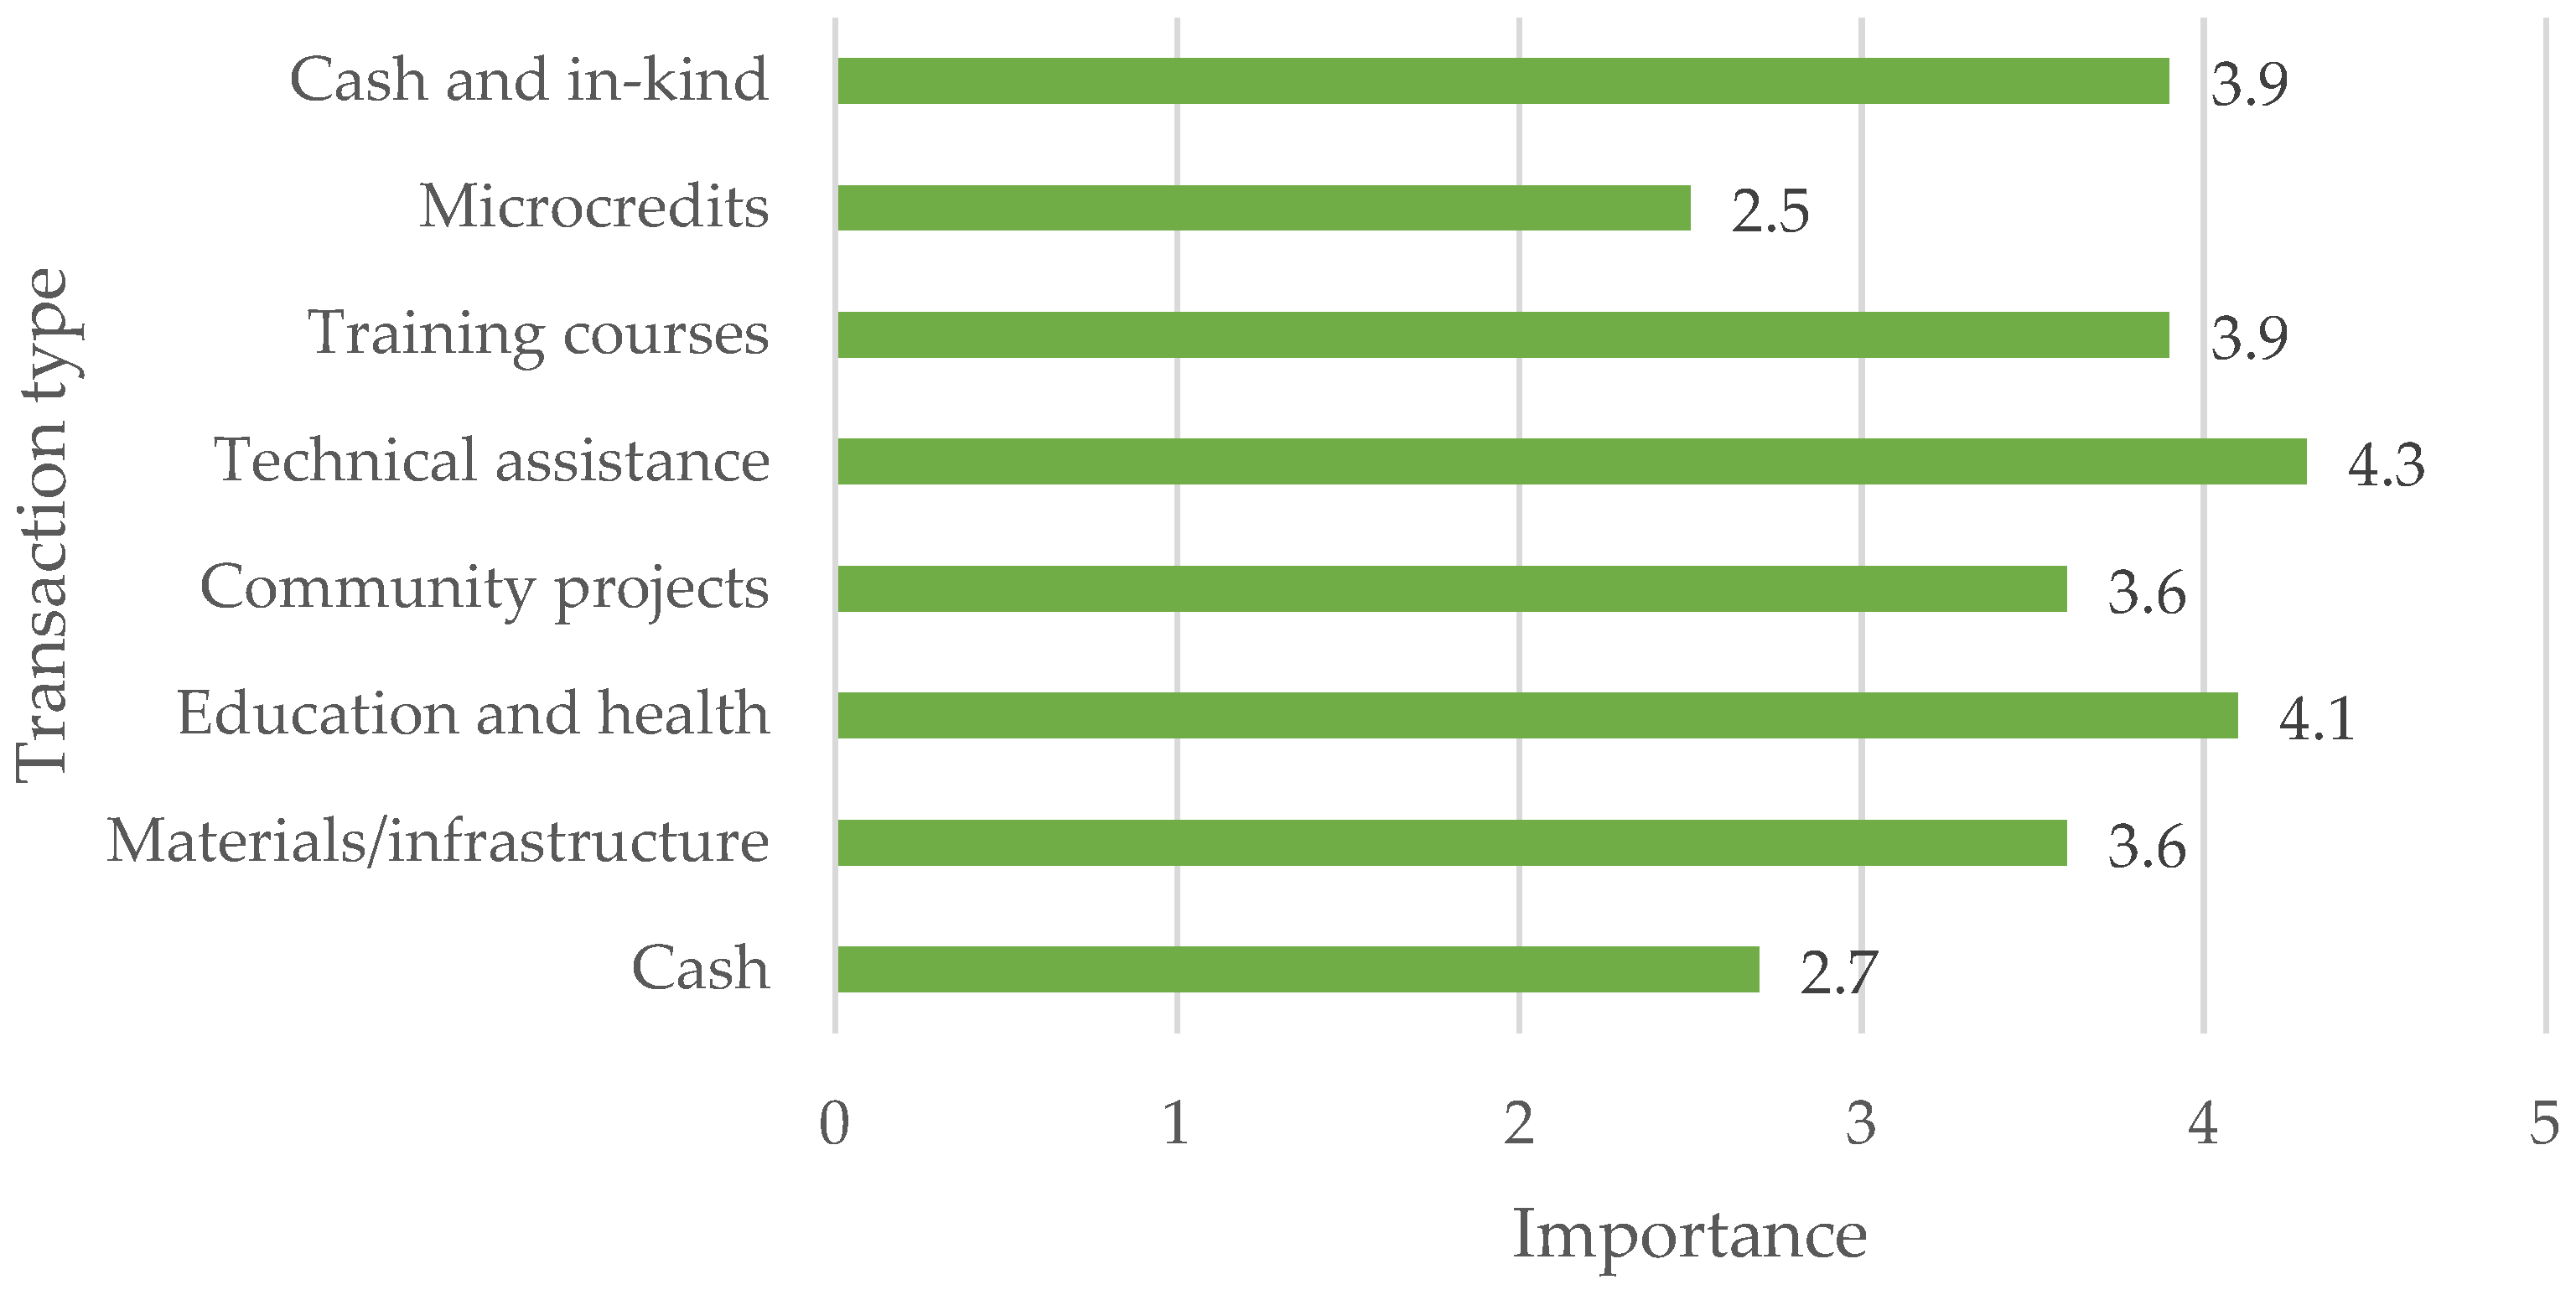
  • Transaction type. Use of combined in-kind and cash payments had a 63% rate of success, given that majority of the ES being traded are carbon and carbon sequestration services which involved a combination of cash and in-kind transaction used by participants to improve farms and expand their business. The complementary findings of our survey indicate that this transaction type has a perception of being very relevant for PES success.
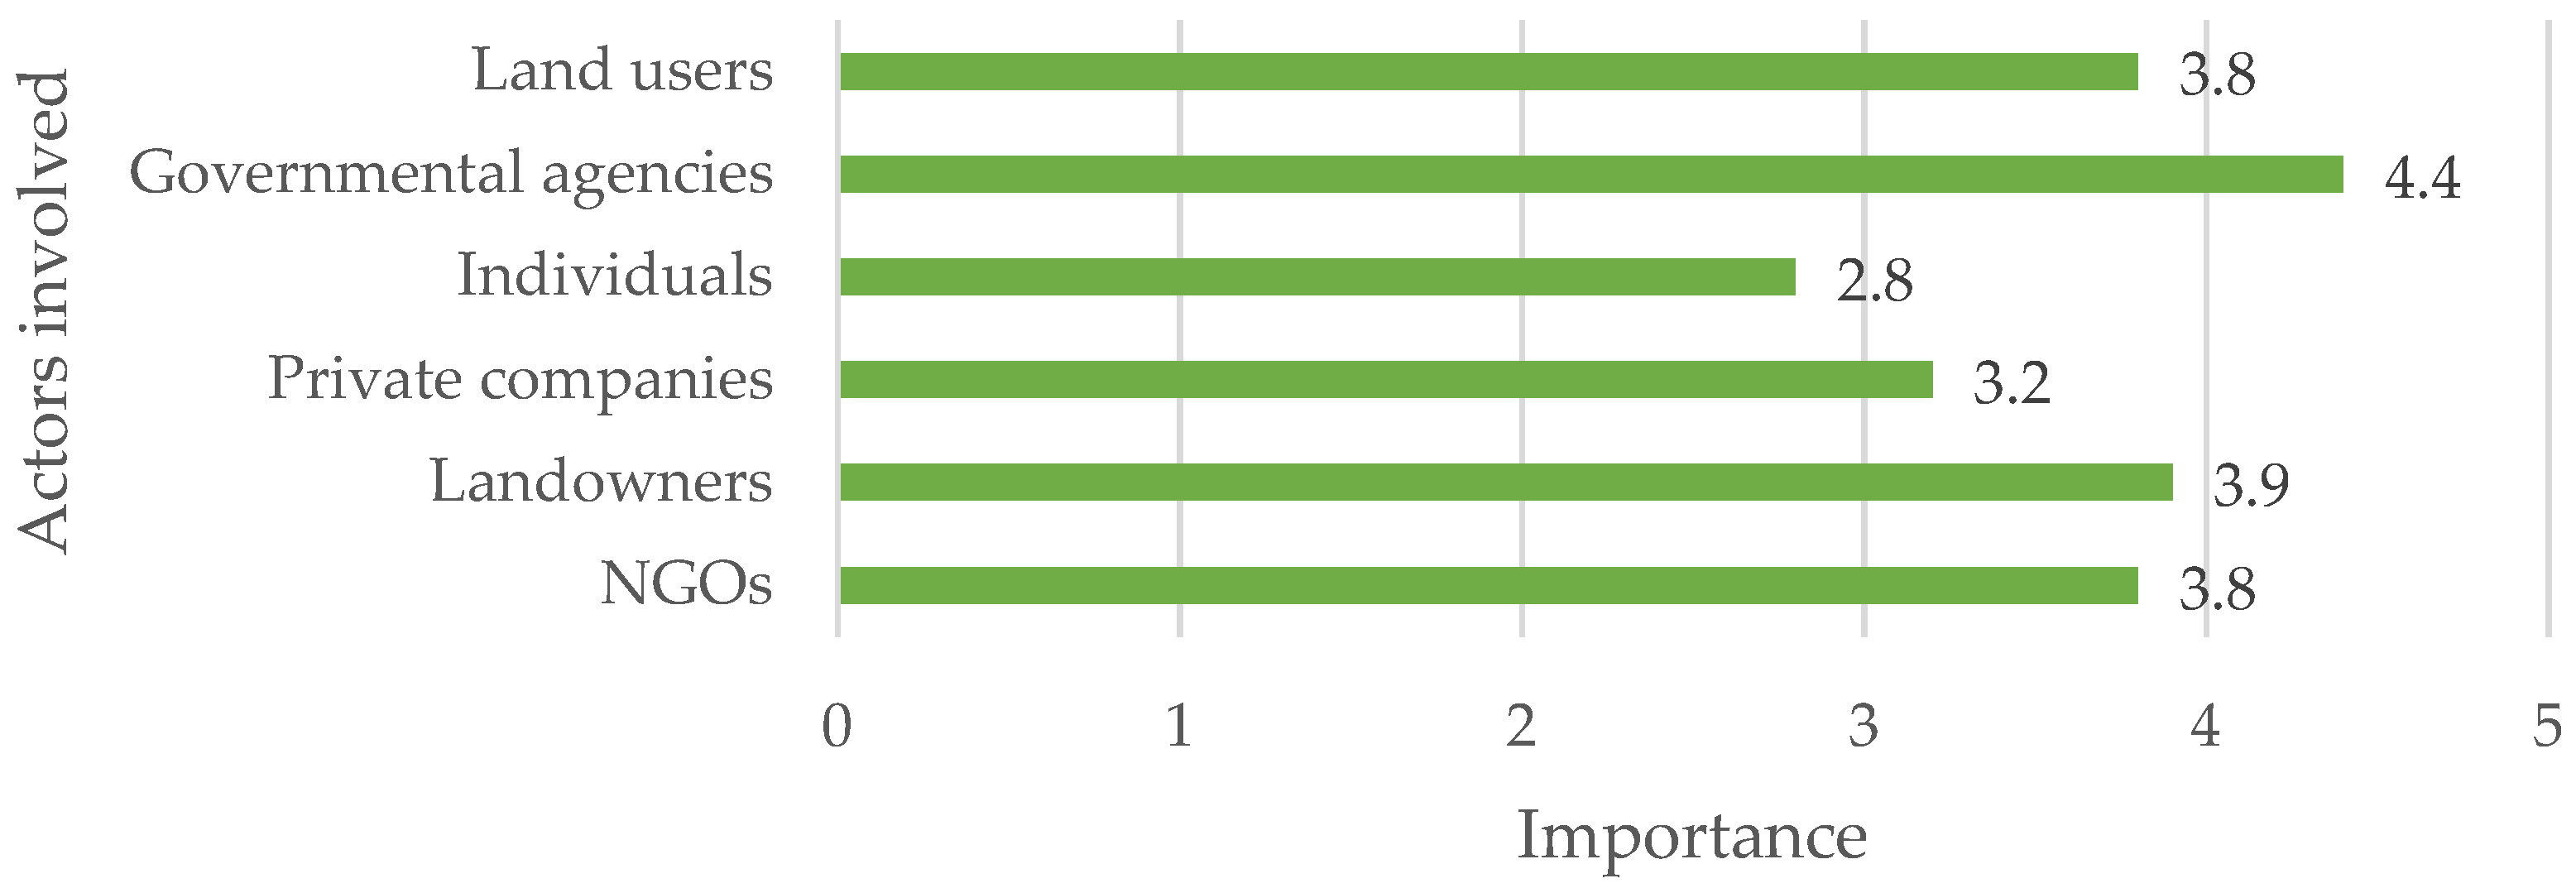
  • Actors involved. Private buyers of ES had a high degree of success at 60% and many of the stakeholders saw the presence of private buyers as being very relevant to PES success. They achieved significant success due to some of them providing alternative sources of income to the ES sellers, as seen in Uganda’s Energy for Rural Transformation Project. They also offer more financial backing compared to public buyers of the ES, such as governments. Public sellers of ES were more successful (71%), while the implementation of PES involving intermediaries had a 53% rate of success.
An important limitation of the study is the small number of respondents we obtained from the questionnaire. Therefore, the information we received from the actors that implemented the schemes did not help us to establish a very robust outcome of PES performance. However, the information is valuable in that it provides some complementary information to the case studies.
PES success in the region depends highly on the duration of the funding scheme, which should be 10–30 years long, in-kind and cash transaction types, implementation at a regional level, bundled ES, public sellers of ES with private buyers of ES with intermediaries. Policy makers’ consideration for these criteria in PES design and implementation can create premises for improving sustainable management of natural resources and enhancing contributions to poverty alleviation in the region. This will also be in line with meeting some of the sustainable development goals in the three East African countries.

Supplementary Materials

The following supporting information can be downloaded at: https://www.mdpi.com/article/10.3390/f14061209/s1, Table S1: Stated aims, current outcomes, and the unexpected effects of analyzed PES schemes.

Author Contributions

Conceptualization, I.O. and B.P.; methodology, B.P.; validation, B.P., A.-F.H. and N.T.; formal analysis, I.O.; investigation, I.O.; data curation, B.P.; writing—original draft preparation, I.O.; writing—review and editing, B.P., A.-F.H. and N.T.; visualization, I.O.; supervision, B.P. All authors have read and agreed to the published version of the manuscript.

Funding

This research received no external funding.

Acknowledgments

Special thanks are addressed to everyone who agreed to respond to our survey, particularly to the researchers who implement PES schemes (Vi agroforestry, World agroforestry, PAMS Foundation), to the officers that performed administrative roles and who were associated with intermediary institutions (Kenya Forest Service, National Forestry Authority, Tanzania Forestry Authority), and to a consultant researcher from Egerton University.

Conflicts of Interest

The authors declare no conflict of interest.

Appendix A

Table A1. List of analyzed case studies in Kenya, Uganda, and Tanzania.
Nr.ReferenceStarting Year of ImplementationBuyerStudy Area or CountryES Type (BIO, L, W, C, B) *Project
1[38]1994FACE Foundation-Dutch Electricity Generating BoardKibale national park, UgandaCNatural High Forest Rehabilitation Project on degraded land of Kibale National Park
2[47]2000Local District AuthoritiesTanzaniaBCommunity Based Forest Management
3[47]2002KVTCTanzaniaCKilombero Valley Teak Company Ltd.
4[48]2002KNH-NABU, USAID Birdlife International, WWFKenyaBArabuko Sokoke Forest Management and Conservation
5[56]2003Tetrapak; Future Forests U&W Humbleside IndividualsUgandaCTGB Plan Vivo (PV)
6[42]2003GEFKenyaLAgricultural Productivity and Sustainable Land Management
7[57]2003GEFTanzaniaBIONovel Forms of Livestock & Wildlife Integration Adjacent to Protected Areas in Africa
8[58]2003GEFKenyaBIOWildlife Conservation Leasing Demonstration
9[41]2004GEF/Government of KenyaKenyaBIODeveloping Incentives for Community Participation in Forest Conservation through the Use of Commercial Insects in Kenya
10[36]2004TetraPak UK; Future Forests, INSAP, Katoomba Group (one-time buyer)UgandaCTrees for global benefit program: Environmental Conservation Trust (ECOTRUST)
11[47]2005DAWASCO, Coca ColaTanzaniaWEquitable Payments for
Watershed Services
12[52]2005Government (UWA/NFA)UgandaBIOCo-Management in national parks and Forest Reserves
13[59]2005GEFTanzaniaLSIP: Reducing Land Degradation on the Highlands of Kilimanjaro
14[60]2005CARE, TFCGTanzaniaBParticipatory Environmental Management
15[16]2006PCF (prototype carbon fund)UgandaCNile Basin
16[47]2006Local District AuthoritiesTanzaniaBCommunity Based Forest Management
17[47]2006Forestry & Bee keeping Division, Ministry of Natural Resources & TourismTanzaniaBIOJoint Forest Management
18[61]2006World Bank BioCarbon FundKenya (Eastern Kenya)CSustaining Agriculture through Climate Change (SACC): CARE International
19[16]2007European Banks (EBRD, EIB, EMI)UgandaCThe Namwasa
Forestation Project
20[51]2007World Bank BioCarbon FundKenya (Eastern Kenya, Meru)CThe international small group tree planting program (TIST)
21[62]2007World Bank BioCarbon FundKenya (Western Kenya)CVi Agroforestry: Western Kenya Smallholder Agriculture Carbon Finance Project
22[43]2008LANAWRUAKenyaWFrom payment to co-investment for ecosystem services: Stewardship and livelihood improvement in the Lake Naivasha agro-production landscape
23[47]2010NedBank Group Ltd.KenyaCWildlife Works
24[45]2010GEFKenyaBIOStrengthening the Protected Area Network within the Eastern Montane Forest Hotspot of Kenya
25[63]2016UNDPKenyaBIOReforesting landscapes for biodiversity (Amboseli)
* BIO = biodiversity; L = landscape; C = carbon; W = water; B = bundled.
Table A2. Questionnaire applied to assess perceptions of PES success.
Nr.Question
1Associated institution and country.
2PES implementation, according to spatial scale, it’s divided into different categories: national (country level), regional (county level in Kenya or provincial level in Uganda and Tanzania) and local (locality level). To what extent do you consider the spatial scale is relevant to the success of the PES mechanism?
3PES mechanisms can be implemented on different temporal scales: long-term (>30 years), mid-term (10–30 years), and short-term (<10 years). To what extent do you consider the temporal scale is relevant to the success of the PES mechanism?
4PES can consider different types of ES, such as carbon, water, landscape, biodiversity and bundled (a combination of ES). To what extent do you consider that the type of ES being traded is relevant for the success of the PES mechanism?
5In PES mechanisms, buyers can compensate the administrators of ES using different types of transaction: cash, in-kind (materials/infrastructure, education and health, community projects, technical assistance, micro-credits, training courses, etc.) and a combination of cash with in-kind. To what degree to you consider that the type of transaction is relevant for the success of the PES mechanism?
6Several categories of actors are involved in PES mechanisms: buyers, sellers, and intermediaries (act as mediators between buyers and sellers or have an administrative role) of ES. They can be private and public entities. Public buyers include governmental agencies (national or local) and land users. Private buyers include landowners, farmers, private companies, NGOs or individuals such as tourists who, through their fees, financed the maintenance of a given landscape or an ecosystem. Private sellers include landowners, meanwhile public sellers and intermediaries include governmental agencies. To what degree do you consider that the type of organizations is relevant to the success of the PES mechanism?

References

  1. Ehrlich, P.R.; Ehrlich, A.H. Extinction: The Causes and Consequences of the Disappearance of Species; Random House: New York, NY, USA, 1981; p. 305. ISBN 0394513126. [Google Scholar]
  2. Braat, L.C.; van der Ploeg, S.W.F.; Bouman, F. Functions of the Natural Environment: An Economic—Ecological Analysis; Institute for Environmental Studies, Free University: Amsterdam, The Netherlands, 1979; p. 73. [Google Scholar]
  3. de Groot, R.S. Environmental functions as a unifying concept for ecology and economics. Environmentalist 1987, 7, 105–109. [Google Scholar] [CrossRef]
  4. Westman, W.E. How Much Are Nature’s Services Worth? Science 1977, 197, 960–964. [Google Scholar] [CrossRef]
  5. Millenium Ecosystem Assessment (MEA). Ecosystems and Human Well-Being: Synthesis; Island Press: Washington, DC, USA, 2005; 155p, ISBN 1-59726-040-1. [Google Scholar]
  6. Kemkes, R.J.; Farley, J.; Koliba, C.J. Determining when payments are an effective policy approach to ecosystem service provision. Ecol. Econ. 2010, 69, 2069–2074. [Google Scholar] [CrossRef]
  7. Vatn, A.; Barton, D.N.; Porras, I.; Rusch, G.M.; Stenslie, E. Payments for Nature Values-Market and Non-Market Instruments; Norad Report 5; Norad: Oslo, Norway, 2014. [Google Scholar]
  8. Kinzig, A.P.; Perrings, C.; Chapin, F.S.; Polasky, S.; Smith, V.K.; Tilman, D.; Turner, B.L. Paying for Ecosystem Services—Promise and Peril. Science 2011, 334, 603–604. [Google Scholar] [CrossRef]
  9. Ferraro, P.J. Asymmetric Information and Contract Design for Payments for Environmental Services. Ecol. Econ. 2008, 65, 810–821. [Google Scholar] [CrossRef] [Green Version]
  10. Sattler, C.; Trampnau, S.; Schomers, S.; Meyer, C.; Matzdorf, B. Multi-Classification of Payments for Ecosystem Services: How Do Classification Characteristics Relate to Overall PES Success? Ecosyst. Serv. 2013, 6, 31–45. [Google Scholar] [CrossRef]
  11. Tetra Tech, Land Trees, Sustainability Africa (LTSA). Experiences and Lessons Learned in Payments for Ecosystem Services (PES) in East Africa. United States Agency for International Development (USAID) East Africa Planning for Resilience in East Africa Through Policy, Adaptation, Research, and Economic Development (PREPARED) Program. 2018. Available online: https://www.climatelinks.org/resources/experiences-and-lessons-learned-payments-ecosystem-services-pes-east-africa (accessed on 19 December 2022).
  12. Wunder, S.; Engel, S.; Pagiola, S. Taking Stock: A Comparative Analysis of Payments for Environmental Services Programs in Developed and Developing Countries. Ecol. Econ. 2008, 65, 834–852. [Google Scholar] [CrossRef]
  13. Muradian, R.; Corbera, E.; Pascual, U.; Kosoy, N.; May, P.H. Reconciling Theory and Practice: An Alternative Conceptual Framework for Understanding Payments for Environmental Services. Ecol. Econ. 2010, 69, 1202–1208. [Google Scholar] [CrossRef]
  14. McCauley, D.J. Selling out on Nature. Nature 2006, 443, 27–28. [Google Scholar] [CrossRef]
  15. Schröter, M.; van der Zanden, E.H.; van Oudenhoven, A.P.E.; Remme, R.P.; Serna-Chavez, H.M.; de Groot, R.S.; Opdam, P. Ecosystem Services as a Contested Concept: A Synthesis of Critique and Counter-Arguments. Conserv. Lett. 2014, 7, 514–523. [Google Scholar] [CrossRef] [Green Version]
  16. Jindal, R.; Swallow, B.; Kerr, J. Forestry-Based Carbon Sequestration Projects in Africa: Potential Benefits and Challenges. Nat. Resour. Forum 2008, 32, 116–130. [Google Scholar] [CrossRef]
  17. Ogweno, L.P. Hydrologic Analysis of Malewa Watershed as a Basis for Implementing Payment for Environmental Services (PES). 2009. Available online: http://ir.jkuat.ac.ke/handle/123456789/1878 (accessed on 19 December 2022).
  18. Omeja, P.A.; Chapman, C.A.; Obua, J.; Lwanga, J.S.; Jacob, A.L.; Wanyama, F.; Mugenyi, R. Intensive Tree Planting Facilitates Tropical Forest Biodiversity and Biomass Accumulation in Kibale National Park, Uganda. For. Ecol. Manag. 2011, 261, 703–709. [Google Scholar] [CrossRef]
  19. Schreckenberg, K.; Mwayafu, D.M.; Nyamutale, R. Finding Equity in Carbon Sequestration. A Case Study of the Trees for Global Benefits Project, Uganda. Ecosystem Services for Poverty Alleviation. 2013. Available online: https://www.espa.ac.uk/files/espa/Case%20Study%20Trees%20for%20Global%20Benefits%20Project,%20Uganda.pdf (accessed on 19 December 2022).
  20. Suich, H.; Lugina, M.; Muttaqin, M.Z.; Alviya, I.; Sari, G.K. Payments for ecosystem services in Indonesia. Oryx 2017, 51, 489–497. [Google Scholar] [CrossRef] [Green Version]
  21. Grima, N.; Singh, S.J.; Smetschka, B.; Ringhofer, L. Payment for Ecosystem Services (PES) in Latin America: Analysing the Performance of 40 Case Studies. Ecosyst. Serv. 2016, 17, 24–32. [Google Scholar] [CrossRef]
  22. World Bank. Data for Kenya, Tanzania, Uganda. 2020. Available online: https://data.worldbank.org/?locations=KE-TZ-UG (accessed on 21 December 2022).
  23. Natural Resources Management. 2022. Available online: https://www.eac.int/travel/index.php?option=com_content&id=112-eapassport&Itemid=78 (accessed on 21 December 2022).
  24. Wamucii, C.N.; van Oel, P.R.; Ligtenberg, A.; Gathenya, J.M.; Teuling, A.J. Land Use and Climate Change Effects on Water Yield from East African Forested Water Towers. Hydrol. Earth Syst. Sci. 2021, 25, 5641–5665. [Google Scholar] [CrossRef]
  25. Joshi, A.; Kale, S.; Chandel, S.; Pal, D.K. Likert scale: Explored and explained. Br. J. Appl. Sci. Technol. 2015, 7, 396–403. [Google Scholar] [CrossRef]
  26. Dietz, T.; Ostrom, E.; Stern, P.C. The Struggle to Govern the Commons. Science 2003, 302, 1907–1912. [Google Scholar] [CrossRef] [Green Version]
  27. Norgaard, R.B. Ecosystem Services: From Eye-Opening Metaphor to Complexity Blinder. Ecol. Econ. 2010, 69, 1219–1227. [Google Scholar] [CrossRef]
  28. Nsoh, W.; Reid, C. Privatisation of Biodiversity: Who Can Sell Ecosystem Services? Environ. Law Manag. 2013, 25, 12–20. Available online: https://ssrn.com/abstract=2304817 (accessed on 20 December 2022).
  29. Engel, S.; Pagiola, S.; Wunder, S. Designing Payments for Environmental Services in Theory and Practice: An Overview of the Issues. Ecol. Econ. 2008, 65, 663–674. [Google Scholar] [CrossRef]
  30. Mickwitz, P. A Framework for Evaluating Environmental Policy Instruments: Context and Key Concepts. Evaluation 2003, 9, 415–436. [Google Scholar] [CrossRef] [Green Version]
  31. Bohlen, P.J.; Lynch, S.; Shabman, L.; Clark, M.; Shukla, S.; Swain, H. Paying for Environmental Services from Agricultural Lands: An Example from the Northern Everglades. Front. Ecol. Environ. 2009, 7, 46–55. [Google Scholar] [CrossRef]
  32. Vatn, A. An Institutional Analysis of Payments for Environmental Services. Ecol. Econ. 2010, 69, 1245–1252. [Google Scholar] [CrossRef]
  33. Gutman, P. From Goodwill to Payments for Environmental Services: A Survey of Financing Options for Sustainable Natural Resource Management in Developing Countries; WWF Macroeconomics for Sustainable Development Program Office: Washington, DC, USA, 2003; Available online: https://vtechworks.lib.vt.edu/handle/10919/66934 (accessed on 20 December 2022).
  34. Blank, R.M. Can Equity and Efficiency Complement Each Other? Labour Econ. 2002, 9, 451–468. [Google Scholar] [CrossRef] [Green Version]
  35. Kaczan, D.; Swallow, B.M.; Adamowicz, W.L. Designing a Payments for Ecosystem Services (PES) Program to Reduce Deforestation in Tanzania: An Assessment of Payment Approaches. Ecol. Econ. 2013, 95, 20–30. [Google Scholar] [CrossRef]
  36. Lockie, S. Market Instruments, Ecosystem Services, and Property Rights: Assumptions and Conditions for Sustained Social and Ecological Benefits. Land Use Policy 2013, 31, 90–98. [Google Scholar] [CrossRef]
  37. Berttram, D.V.I. Payments for Ecosystem Services—A Feasible Mechanims for Natural Resource Mangagement in East Africa? 2011. Available online: https://studenttheses.uu.nl/handle/20.500.12932/7055 (accessed on 21 December 2022).
  38. FACE. Face the Future, 1994. Available online: https://facethefuture.com/#projects (accessed on 21 December 2022).
  39. Kerr, J.M.; Vardhan, M.; Jindal, R. Incentives, Conditionality and Collective Action in Payment for Environmental Services. Int. J. Commons 2014, 8, 595–616. [Google Scholar] [CrossRef]
  40. Thompson, B.S. Can Financial Technology Innovate Benefit Distribution in Payments for Ecosystem Services and REDD+? Ecol. Econ. 2017, 139, 150–157. [Google Scholar] [CrossRef]
  41. Global Environment Facility. Developing Incentives for Community Participation in Forest Conservation through the Use of Commercial Insects in Kenya. 2004. Available online: https://www.thegef.org/projects-operations/projects/2237 (accessed on 24 December 2022).
  42. Global Environment Facility. Agricultural Productivity and Sustainable Land Management. 2003. Available online: https://www.thegef.org/projects-operations/projects/2355 (accessed on 20 December 2022).
  43. Nyongesa, J.M.; Bett, H.K.; Lagat, J.K.; Ayuya, O.I. Estimating Farmers’ Stated Willingness to Accept Pay for Ecosystem Services: Case of Lake Naivasha Watershed Payment for Ecosystem Services Scheme-Kenya. Ecol. Process. 2016, 5, 15. [Google Scholar] [CrossRef] [Green Version]
  44. Corbera, E.; Soberanis, C.G.; Brown, K. Institutional Dimensions of Payments for Ecosystem Services: An Analysis of Mexico’s Carbon Forestry Programme. Ecol. Econ. 2009, 68, 743–761. [Google Scholar] [CrossRef]
  45. Global Environment Facility. Strengthening the Protected Area Network within the Eastern Montane Forest Hotspot of Kenya, GEF. 2008. Available online: https://www.thegef.org/projects-operations/projects/3693 (accessed on 20 December 2022).
  46. Perrot-Maître, D. The Vittel Payments for Ecosystem Services: A Perfect PES Case? International Institute for Environmental and Development: London, UK, 2006. [Google Scholar]
  47. Namirembe, S.; Leimona, B.; van Noordwijk, M.; Bernard, F.; Bacwayo, K.E. Co-Investment Paradigms as Alternatives to Payments for Tree-Based Ecosystem Services in Africa. Curr. Opin. Environ. Sustain. 2014, 6, 89–97. [Google Scholar] [CrossRef] [Green Version]
  48. BirdLife International. BirdLife Data Zone. Improved Livelihoods at Arabuko-Sokoke Forest in Kenya. 2008. Available online: http://datazone.birdlife.org/sowb/casestudy/improved-livelihoods-at-arabuko-sokoke-forest-in-kenya (accessed on 24 December 2022).
  49. Hack, J.; Kosmus, M.; Kräuter, H.J.; Weiskopf, B.; Somarriba, D. TEEB Case: Payments for Hydrological Ecosystem Services in the Gil González Watershed? A Public-Private-Partnership Case Study. The Economics of Ecosystems and Biodiversity (TEEB) Case Studies; TEEB: Geneva, Switzerland, 2013. [Google Scholar]
  50. Masiga, M.; Mwima, P.; Kiguli, L. Trees for Global Benefit Program: Environmental Conservation Trust (ECOTRUST) of Uganda. 2012. Available online: https://cgspace.cgiar.org/handle/10568/21218 (accessed on 24 December 2022).
  51. Masiga, M.; Yankel, C.; Iberre, C. The International Small Group Tree Planting Program (TIST) Kenya, June 2012. Available online: https://cgspace.cgiar.org/handle/10568/21216 (accessed on 24 December 2022).
  52. Ruhweza, A.; Biryahwaho., B.; Kalanzi, C. An Inventory of PES Schemes in Uganda; Forest Trends: Washington, DC, USA, 2008. [Google Scholar]
  53. Grieg-Gran, M.; Noel, S.; Porras, I.; Dent, D.L. Green Water Credits: Lessons Learned from Payments for Environmental Services (No. 2); ISRIC—World Soil Information; ISRIC: Wageningen, The Netherlands, 2006. [Google Scholar]
  54. Robertson, N.; Wunder, S. Fresh Tracks in the Forest: Assessing Incipient Payments for Environmental Services Initiatives in Bolivia; Center for International Forestry Research: Bogor, Indonesia, 2005. [Google Scholar] [CrossRef] [Green Version]
  55. Nordén, A. Payment Types and Participation in Payment for Ecosystem Services Programs: Stated Preferences of Landowners; Environment for Development Initiative: Westlake, OH, USA, 2014; Available online: http://www.jstor.org/stable/resrep14997 (accessed on 20 December 2022).
  56. Fisher, J. No Pay, No Care? A Case Study Exploring Motivations for Participation in Payments for Ecosystem Services in Uganda. Oryx 2012, 46, 45–54. [Google Scholar] [CrossRef] [Green Version]
  57. Global Environment Facility. Novel Forms of Livestock & Wildlife Integration Adjacent to Protected Areas in Africa. 2003. Available online: https://www.thegef.org/projects-operations/projects/2151 (accessed on 20 December 2022).
  58. Global Environment Facility. Wildlife Conservation Leasing Demonstration. 2003. Available online: https://www.thegef.org/projects-operations/projects/1999 (accessed on 20 December 2022).
  59. Global Environment Facility. SIP: Reducing Land Degradation on the Highlands of Kilimanjaro. 2005. Available online: https://www.thegef.org/projects-operations/projects/3391 (accessed on 20 December 2022).
  60. Woodcock, K.A.; Meshack, C.; Bildsten, C. Review of TFCG-Facilitated Participatory Forest Management in the Eastern Arc and Coastal Forests of Tanzania. 2006. Available online: www.tfcg.org (accessed on 20 December 2022).
  61. Shames, S.; Onyango, G. Sustaining Agriculture through Climate Change (SACC); CARE International: Geneva, Switzerland, 2012; Available online: https://cgspace.cgiar.org/handle/10568/21219 (accessed on 20 December 2022).
  62. Shames, S.; Wekesa, A.; Wachiye, E. Institutional Analysis and Capacity Building of African Agricultural Carbon Projects Case Study. Kenya Smallholder Agriculture Carbon Finance Project: Vi Agroforestry. June 2012. Available online: https://cgspace.cgiar.org/handle/10568/21215 (accessed on 20 December 2022).
  63. United Nations Development Program. Publications. 2014. Available online: https://www.undp.org/publications (accessed on 20 December 2022).
Figure 1. Location of PES schemes included in the study.
Forests 14 01209 g001
Figure 2. Perception of type of ES being traded contribution to PES success.
Forests 14 01209 g002
Figure 3. Perception of spatial scale contribution to PES success.
Forests 14 01209 g003
Figure 4. Perception of temporal scale contribution to PES success.
Forests 14 01209 g004
Figure 5. Perception of transaction type contribution to PES success.
Forests 14 01209 g005
Figure 6. Perception of actors involved contribution to PES success.
Forests 14 01209 g006
Figure 7. Summary of perception of factors affecting PES success in Kenya, Uganda, and Tanzania.
Forests 14 01209 g007
Table 1. Used criteria to analyze PES cases in Kenya, Uganda, and Tanzania (based on [21]).
CriteriaOption
1. Scale:
SpatialLocal, regional, national
TemporalShort-term, mid-term, long-term
2. Type of ES being tradedCarbon, water, landscape, biodiversity, bundled
3. Transaction typesIn-kind, cash, both in-kind and cash
4. Actors involved:
BuyersPublic, private, both public and private
SellersPublic, private
IntermediariesYes, no
Table 2. Analyzed PES schemes classification.
CriteriaOptionN *F **
(%)
SuccessfulPartially
Successful
UnsuccessfulSuccessful (%)Unsuccessful (%)
Type of ES being tradedBiodiversity728430570
Landscape28110500
Water281105020
Carbon1040442400
Bundled416310750
Spatial scaleNational28110500
Regional1352841628
Local10404514010
Temporal scaleLong-term: >30 years3123001000
Mid-term: 10–30 years9364414411
Short-term: <10 years1352661468
Transaction typesCash5201222040
In-kind1248750580
Cash and in-kind832530630
Actors involved: buyersPrivate1560960600
Public416220500
Public and private6242223333
Actors involved: sellersPrivate11443622718
Public14561040710
Actors involved: intermediariesYes197610725311
No624330500
* The number and ** the frequency of cases that meet each of the criteria and options, with a total of 25 cases for each criterion.
Disclaimer/Publisher’s Note: The statements, opinions and data contained in all publications are solely those of the individual author(s) and contributor(s) and not of MDPI and/or the editor(s). MDPI and/or the editor(s) disclaim responsibility for any injury to people or property resulting from any ideas, methods, instructions or products referred to in the content.

