Article

Keystone Soil Microbial Modules Associated with Priming Effect under Nitrogen- and Glucose-Addition Treatments

1
College of Geographical Science, Fujian Normal University, Fuzhou 350007, China
2
State Key Laboratory of Subtropical Mountain Ecology, Fujian Normal University, Fuzhou 350007, China
3
Department of Environmental Engineering, National Ilan University, Ilan 260, Taiwan
4
College of Tourism, Wuyi University, Wuyishan 354300, China
5
Institute of Geography, Fujian Normal University, Fuzhou 350007, China
*
Authors to whom correspondence should be addressed.
Forests 2023, 14(6), 1207; https://doi.org/10.3390/f14061207
Submission received: 25 April 2023 / Revised: 1 June 2023 / Accepted: 9 June 2023 / Published: 11 June 2023
(This article belongs to the Special Issue Forest Soil Carbon Cycle in Response to Global Change)

Abstract

:
The priming effect (PE) is important for understanding the decomposition of soil organic matter (SOM) and forecasting C-climate feedback. However, there are limited studies on microbial community-level properties and the keystone taxa involved in the process. In this study, we collected soil from a subtropical Phyllostachys edulis forest undergoing long-term N-addition and conducted an incubation experiment to evaluate the effects of single and repeated addition of 13C-labeled glucose. Our results demonstrated that previously N-fertilized soil had a smaller cumulative PE compared with that of the control (11% average decrease). This could be primarily explained (26%) by the lower abundance of bacterial r-strategy group members (B_mod#2, constituting Proteobacteria, Firmicutes, and Actinobacteria phyla) under N-addition treatments. A single C-addition induced a greater PE than that of repeated C-additions (2.66- to 3.11-fold). Single C addition led to greater C to N ratios of microbial biomass and fungi to bacteria, positively impacting cumulative PE, indicating that the shifts in fungal/bacterial dominance play an important role in regulating PE. Moreover, a saprophytic taxa group (F_Mod#3, primarily composed of the phyla Ascomycota) explained 62% of the differences in cumulative PE between single and repeated C-additions. Compared with repeated C-additions, a greater abundance of B_Mod#2 and F_Mod#3, as well as C-related hydrolase activity, was observed under single C-addition, inducing greater cumulative PE. Therefore, sufficient C may facilitate the proliferation of r-strategy bacterial taxa and saprophytic fungal taxa, thereby increasing SOM decomposition. Our findings provide novel insights into the relationship between microbial community-level properties and PE.

1. Introduction

The priming effect (PE) is the increase in the decomposition rate of native soil organic matter (SOM) after input of fresh organic matter into the soil [1]. PE is commonly observed in different ecosystems, and it plays crucial roles in regulating SOM decomposition, soil C stock, and global C cycling [2]. The input of C or other nutrients usually leads to changes in vegetation properties [3], soil nutrient levels [4], and microbial characteristics [5], thereby altering SOM decomposition and PE. Among these factors, microbial properties such as biomass [6], enzyme activity [3], and community composition [7] are considered key factors regulating soil PE. However, microbial community-level properties associated with PE have not been sufficiently investigated [8]. Recently, the taxa that share similar niche and ecological functions have been grouped into the same ecological cluster (module) based on microbial co-occurrence network analysis [9], providing insights into the role of microbial community-level properties in specific functions such as carbon-use and respiration [10,11]. However, information on specific microbial taxa or modules that drive SOM-decomposition, which is imperative for better forecasting C-climate feedback, is lacking.
Due to increasing N deposition and the use of N fertilizers in agricultural fields, it is important to understand the effects of progressive enrichment of N in soil on PE. Previous studies have revealed that the N-addition induced positive, negative, or no effects on PE [12,13]. Such inconsistent results could be attributed to the differences in experimental conditions (e.g., the form and rate of nutrient and substrate addition), soil nutrient status, and shifts in microbial community composition [12,14]. For example, the N-addition could increase the activity of copiotrophs (r-strategists) and the production of extracellular enzymes, thus leading to a positive PE [7]. However, increasing N availability may also cause C and P deficiency and a decline in soil pH [15], which could facilitate the abundance of oligotrophs (K-strategists). Indeed, the successional dynamics of r- and K-strategists within microbial communities reportedly influence C decomposition [16]. However, there is a lack of information regarding how soil microbial community composition and life strategies influence PE under long-term N-addition.
In terrestrial ecosystems, native C input to soil (e.g., from plant litter and below the surface) commonly occurs continuously throughout the year or during the growing season. However, only a few studies have investigated the effects of C-addition patterns on PE [17]. Wang et al. [18] reported that single C-addition led to greater PE than repeated C-additions; however, the opposite trend was reported by Hamer and Marschner [19]. Moreover, several studies have reported that frequent C-addition facilitates the growth of bacteria rather than that of fungi [17]. In contrast, a recent study reported that repeated litter additions facilitated fungal growth [20]. These contradictory results may be responsible for the differences in the PE responses under different C-addition modes. Indeed, changes in fungal/bacterial dominance are related to C-use efficiency and stable soil organic C formation [21]; however, the relationship between these changes and PE remains unclear. Additionally, although fungi and bacteria utilize labile C sources to decompose SOM [22], fungi incorporate a greater proportion of new C because of the predominant role of saprophytic fungi in litter decomposition [23]. For instance, a previous study reported that the population size of Ascomycota, the most diverse group of saprotrophic fungi [24], increased in response to C input [25].
Moreover, the coexistence characteristics of microbial networks based on biogeography have received considerable attention [9]. Network complexity and correlation between microbes in a typical network could be used to elucidate potential intertaxon relationships (e.g., cooperation or competition) and the stability of the community structure [26]. For example, straw addition reduced the negative correlations between bacteria and fungi in the soil, suggesting that microbial competition for nutrients was reduced [27]. Moreover, excess N fertilizer reduced the connections between bacteria and fungi, thus enhancing the stability of the network [28]. However, it remains unclear how N- and C-addition influence the topological characteristics of microbial networks and thus influence PE.
In the present study, we aimed to explore the intricate relationships between PE and community-level microbial properties under different N- and C-addition treatments. We selected a Moso bamboo (Phyllostachys edulis) forest, which had received six years of inorganic N input, to conduct a 90-day incubation trial with different C-addition modes. We hypothesized that (1) bacteria (especially r-strategists) account for the changes in PE under N-addition treatment because they are sensitive to N-addition; (2) changes in the fungal or bacterial dominance and specific saprophytic taxa dominate the changes in PE under different C-addition modes; (3) connections between bacteria and fungi would be reduced by N-addition and increased by C-addition (especially with a single addition).

2. Materials and Methods

2.1. Study Site and Soil Sampling

The soil used in the present study was collected from a Phyllostachys heterocycle forest in the Daiyun Mountain Nature Reserve (25°43′ N, 118°05′ E; ~1200 m a.s.l.), Fujian Province, southeast China. The study site has a humid subtropical monsoon climate [6], characterized by high temperatures and rainfall (mean annual temperature: 20 °C; mean precipitation: 1800 mm). The soil at this site was classified as Ultisol according to the United States Department of Agriculture (USDA) soil classification system. In July 2014, nine 3 m × 10 m experimental plots were randomly selected within the study site. Thereafter, each plot was assigned to one of three levels of N fertilization (NH4NO3 as the N source): control (CT; N input: 0 kg·ha−1·yr−1), low N deposition (LN; N input: 20 kg·ha−1·yr−1), and high N deposition (HN; N input: 80 kg·ha−1·yr−1). The soil samples were collected in July 2020. After removing surface debris, five soil blocks were dug out from the top layer (0–15 cm) in an “S” shape in each plot, using a spade. These blocks were subsequently mixed and homogenized to prepare a composite sample for each plot. Thereafter, the soil samples were maintained at a low temperature (4 °C) prior to pre-incubation.

2.2. Laboratory-Based Sample Processing and Gas Sampling

After carefully removing the visible rock fragments, plant residues, and roots, the soil was thoroughly homogenized, passed through a 2 mm sieve, and all soil samples were pre-incubated for 15 days at 25 °C. The physicochemical properties of soil before incubation were shown in Table S1. Thereafter, microcosms were constructed by placing fresh soil (100 g dry soil per jar) into 500 mL Mason jars with airtight lids. In this incubation experiment, we added 13C-glucose (3.0 atom% 13C) to soils, based on 2% of SOC content, at two frequencies: a single addition on the first day of incubation and split evenly between nine applications during the incubation period (Figure S1). The incubation experiment was carried out for 90 days, and the soil moisture was maintained at 60% of the water-holding capacity by adding deionized water at regular intervals during the incubation period. Gas samples were collected at 0, 1, 2, 3, 4, 5, 7, 10, 12, 15, 20, 22, 27, 30, 33, 35, 40, 42, 45, 50, 52, 55, 60, 70, 80, and 90 days after trial commencement, respectively.

2.3. CO2 Analysis and PE

The concentration and C isotope compositions of CO2 in the samples were determined using a gas chromatograph (GC-2014, Shimadzu, Kyoto, Japan) and an elemental analyzer (MAT 253; Thermo Fisher Scientific, Waltham, MA, USA), respectively. The C isotopic signature (δ13C) was expressed as per mil (‰) relative to the Pee Dee Belemnite standard [6].
The amounts of CO2 derived from glucose (Cglucose) and native SOM (CSOM) were calculated as follows [29]:
C glucose = C total   ×   ( δ total     δ SOM )   /   ( δ glucose     δ SOM )
C SOM = C total     C golucose
where Ctotal is the total CO2-C evolved from the soil with or without C-addition during a particular period, δtotal and δSOM are the δ13C values of the total CO2-C evolved from soil under glucose addition and unamended control treatments, respectively, and δglucose is the 13C isotopic composition of glucose.
The intensity of PE induced by glucose addition was calculated by comparing the difference in SOM-derived CO2-C efflux between glucose addition [Csoil (glucose addition)] and unamended control treatments [Csoil (control)] [14]:
PE = C soil   ( glucose   addition )     C soil   ( control )

2.4. Soil Physicochemical Analysis

Soil pH was measured using a pH meter (STARTER 300 pH Portable; OHAUS, Parsippany, NJ, USA) in a 1:2.5 soil:water (w/v) mixture. Soil total C (TC) and total N (TN) contents were determined using an elemental analyzer (Elementar Vario EL III; Langenselbod, Germany). Dissolved organic C (DOC) was extracted with 0.5 M K2SO4 and its concentration was measured using a SHIMADZU TOC-VCPH/CPN analyzer (Elementar Analysensysteme GmbH, Langenselbold, Germany) [30]. Soil NH4+-N and NO3-N were extracted with 2 M KCl, and their concentrations were measured using a continuous-flow analytical system (San++; Skalar, Breda, The Netherlands); the sum of their values was considered mineral N (MN) concentration. Total P (TP) and available P (AP) were extracted using H2SO4-HClO4 and NaHCO3, respectively [31], and their concentrations were determined using a continuous-flow autoanalyzer.

2.5. Microbial Biomass and Enzyme Activity

C, N, and P concentrations of the soil microbial biomass (MBC, MBN, and MBP, respectively) were measured using the chloroform fumigation–extraction method [32,33]. The activities of six soil extracellular enzymes, including β-1,4-glucosidase (BG), cellobiohydrolase (CBH), β-1,4-N-acetylglucosaminidase (NAG), acid phosphomonoesterase (ACP), polyphenol oxidase (PHO), and peroxidase (PEO), were measured fluorometrically using 200 μM solution of the corresponding substrates labeled with 4-methyl umbelliferone (MUB) or 7-amino-4-methylcoumarin (AMC) [34,35].

2.6. Analysis of Phospholipid Fatty Acids (PLFAs)

The soil microbial community characteristics were analyzed using PLFAs, as described by Zhang et al. [6]. Briefly, 10 g of freeze-dried soil was added to a solvent consisting of chloroform, methanol, and phosphate buffer (1:2:0.8) and separated using a silica column (Supelco, Bellefonte, PA, USA). Fatty acid methyl esters were determined using gas chromatography (Agilent 7890 A; Agilent Technologies, Santa Clara, CA, USA), and methyl nonadecanoate was used as the internal standard for quantitative determination. Fatty acids are used as biomarkers to define microbial groups including Gram-positive bacteria (GP), Gram-negative bacteria (GN), and fungi. The total number of bacterial groups was calculated as the sum of GP and GN groups [36].
Thereafter, the δ13C-labeled glucose allocations for each PLFA (nmol g−1 dry soil) were determined using a Trace GC Ultra gas chromatograph (Thermo Electron Corp., Milan, Italy) containing a combustion column attached via a GC Combustion III to a Delta V Advantage isotope ratio mass spectrometer (IRMS; Thermo Finnigan, Bremen, Germany). The amount of glucose-derived labeled C in each PLFA (δPLFA) was estimated as follows [37,38]:
δ PLFA = C PLFA   ×   ( δ glucose   addition     δ control ) / ( δ glucose     δ control )
where CPLFA is the molecular C content in the individual PLFAs, δglucose addition and δcontrol are the δ13C of individual PLFAs in the samples with and without glucose-addition treatment, respectively, and δglucose is the 13C isotopic composition of glucose.

2.7. DNA Extraction, PCR Amplification, and Sequencing

Soil DNA was extracted using an E.Z.N.A.® soil DNA Kit (Omega Bio-tek, Norcross, GA, USA), according to the manufacturer’s instructions. The variable V3-V4 regions of the bacterial 16S rRNA gene were amplified using the primer pair 338F (5′-ACTCCTACGGGAGGCAGCAG-3′) and 806 R (5′-GGACTACNNGGGTATCTAAT-3′) [39]. We amplified the ITS1 region of fungal rRNA gene from the extracted DNA using ITS1 (5′-CTTGGTCATTTAGAGGAAGTAA-3′) and ITS2 (5′-TGCGTTCTTCATCGATGC-3′) primer sets [40]. PCR was conducted with an initial denaturation at 94 °C for 3 min, followed by 27 cycles of denaturation at 95 °C for 30 s, annealing at 55 °C for 30 s, elongation at 72 °C for 45 s, and a final extension at 72 °C for 10 min. PCR assays were performed in triplicate, and the 20 μL reaction mixture contained 5 × FastPfu Buffer (4 μL), 2.5 mM dNTPs (2 μL), primer (0.8 μL), FastPfu Polymerase (0.4 μL), and DNA template (10 ng). Paired-end sequencing was performed on an Illumina MiSeq platform (Illumina, San Diego, CA, USA) according to standard protocols provided by Majorbio Bio-Pharm Technology Co., Ltd. (Shanghai, China).

2.8. Processing of Sequencing Data

Raw fastq files were quality-filtered using Trimmomatic and merged using FLASH as per the following criteria: (i) the reads were truncated at any site receiving an average quality score < 20 over a 50-bp sliding window; (ii) sequences whose overlap was longer than 10 bp were merged according to their overlap with mismatch of no more than 2 bp; (iii) sequences of each sample were separated according to barcodes (exactly matching) and primers (allowing 2 nucleotide mismatching), and reads containing ambiguous bases were removed. Subsequently, the sequences were clustered into operational taxonomic units (OTUs) with 97% similarity using UPARSE (version 7.1; http://drive5.com/uparse/; accessed on 7 October 2022) [41]. The taxonomic identification of representative sequences for each OTU was determined using the RDP Classifier algorithm (http://rdp.cme.msu.edu/; accessed on 7 October 2022) against the SILVA database for bacteria [42] and the UNITE database for fungi [43].

2.9. Statistical Analysis

Statistical analyses were performed using IBM SPSS Statistics for Windows (version 21.0; IBM Corp., Armonk, NY, USA) and R version 4.1.2 (R Development Core Team). Observed species and the Shannon–Wiener index in QIIME were used to estimate alpha diversity QIIME. Principal coordinate analysis (PCoA) based on the Bray–Curtis distance matrix was used to compare the beta diversity between the samples. In addition, we tested for differences in microbial community composition among N- and C-addition treatments, based on Bray–Curtis distance and permutation multivariate analysis of variance (PERMANOVA), using the R “vegan” package. Two-way analysis of variance (ANOVA) was performed to test the effects of the N- and C-addition treatments on the variables. Multiple comparisons were performed using Tukey’s post hoc test. Before applying two-way ANOVA, the normality of residuals and homogeneity of variance were tested using the Shapiro–Wilk and Levene’s tests, respectively. Some observations that did not have a normal distribution were Box–Cox transformed. Spearman’s rank correlation and partial correlation were used to analyze the relationships between the measured soil and microbial properties, and PE using the R “psych” and “ppcor” packages [44].
To reduce rare OTUs in the dataset, OTUs with relative abundance of less than 0.01% of the bacterial and fungal sequences were removed [9]. Thereafter, co-occurrence networks based on the relative abundance of bacterial and fungal OTUs were constructed, and the main ecological modules of the strongly associated OTUs were identified. Spearman correlation coefficients between all the OTUs were calculated using the “WGCNA” package in R (version 4.1.2) [45]. To reduce false-positive results, Benjamini and Hochberg’s false-discovery rate (FDR) was used to adjust all p-values [46]. Robust correlations with Spearman correlation coefficients > 0.60 and FDR adjusted p-value < 0.01 were used to construct the network, which was further visualized using the interactive Gephi platform (https://gephi.org/; accessed on 7 October 2022). Module construction was also performed using Gephi. We standardized our data by normalizing (z-score) the relative abundance of all taxa (OTUs) belonging to each module. The standardized relative abundances of all taxa within a module were then averaged to obtain the relative abundance of each module. Furthermore, mixed linear regression models were used to analyze the extent to which the bacterial and fungal ecological modules explained variances in PE under different N-addition gradient treatments or C-addition modes, whereby the variance of one treatment was eliminated by selecting either N- or C-addition treatment as a random factor.

3. Results

3.1. Physicochemical Properties of Soil

Physicochemical properties of soil, except TP content, were significantly affected by N-addition (p < 0.05; Table 1). The soil from high N-addition showed greater MN and TN contents than those from the control, while opposite results were observed for soil pH and AP content. Overall, the soils under repeated addition had lower pH and MN content than those with single C-addition.

3.2. Cumulative CO2 Emission and PE

N- and C-addition treatments changed cumulative CO2 emissions and cumulative PE (Figure S2 and Figure 1). During the incubation period, the soil with high N-addition had greater CO2 emission than that of CT in the absence of C-addition (Figure S2a), whereas this gap was reduced by C-addition treatments (Figure S2b,c). Moreover, among the N-addition treatments, the soil from high addition showed the lowest cumulative PE (Figure 1). Cumulative PE decreased by an average of 11% compared with that of the control. Compared with repeated C-addition, single C-addition led to greater cumulative CO2 (Figure S2b) and 2.66- to 3.11-fold greater cumulative PE (Figure 1).

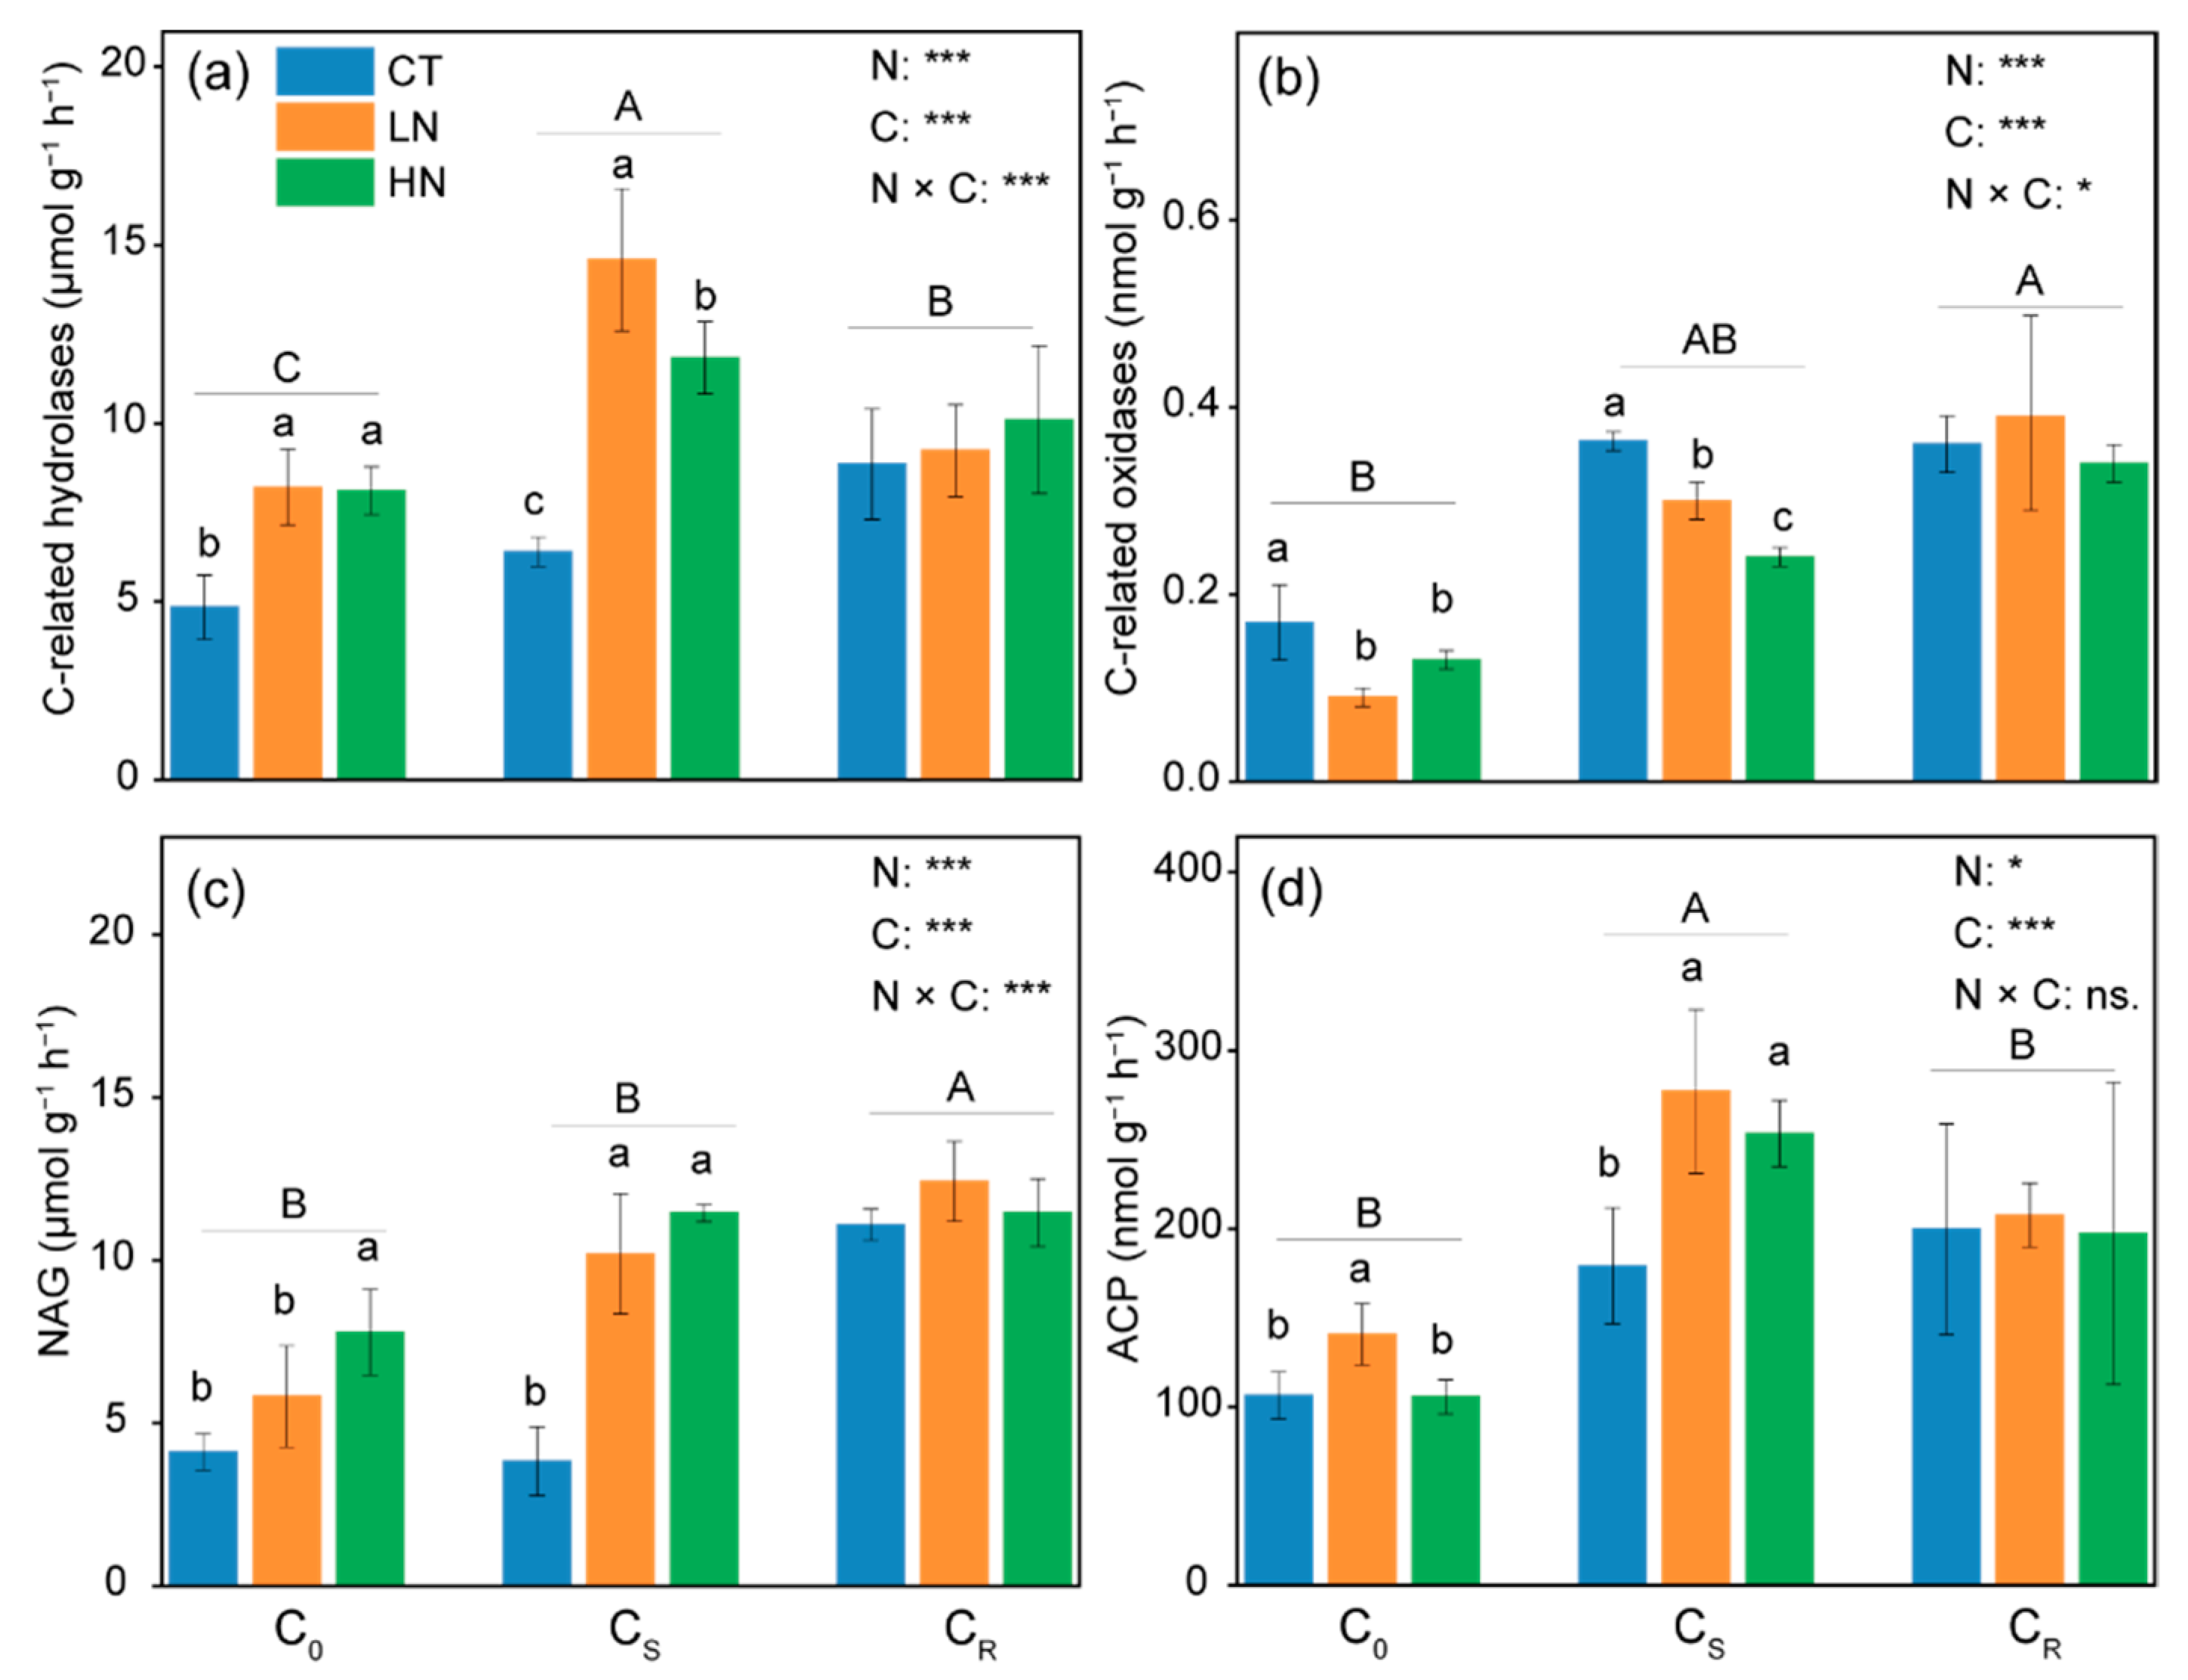
3.3. Extracellular Enzyme Activity and Microbial Biomass in Soil

Activities of all extracellular enzymes were significantly influenced by both N- and C-addition treatments (p < 0.05; Figure 2). Overall, C-related oxidase activity was lower in previously fertilized soils (Figure 2b), but the opposite trend was observed for other enzyme activities (Figure 2a,c,d). Moreover, single C-addition led to significantly greater C-related hydrolase and ACP activity than that by repeated additions (p < 0.05; Figure 2a,d); however, no significant difference was observed for C-related oxidases between single and repeated C-addition treatments (p > 0.05; Figure 2b).
N-addition had a significant effect on the soil microbial biomass and stoichiometry (p < 0.05; Figure S3). Previously, N-fertilized soil showed lower MBP but greater MBN and MBN/MBP ratio (p < 0.05; Figure S3c,b,f). Soil with single C-addition had greater MBN and MBP (p < 0.05; Figure S3b,c) but lower MBC/MBN and MBC/MBP compared with that under repeated C-additions (p < 0.05; Figure S3d,e).

3.4. Distribution of 13C-PLFA in Microbial Groups

At the end of the incubation period, the soil under high N-addition had greater glucose-C into GP compared with that of the control, but the opposite result was observed for GN (p < 0.05; Figure 3a,b). The incorporation of glucose-derived C into GN was significantly greater with single addition, but the opposite trends were observed for fungal abundance and the ratio of fungi to bacteria (p < 0.05; Figure 3b–d).

3.5. Diversity and Community Composition of Soil Bacteria and Fungi

The number of observed bacterial species was significantly decreased by N-addition (Figure S4a). Both the number of observed species and Shannon–Wiener index of fungi were decreased by C-addition (Figure S4c,d). Moreover, the bacterial community structure was clearly separated along PCoA1, indicating that the bacterial community was sensitive to N-addition (Figure 4a). In addition, fungal community composition was significantly different between PCoA1 and PCoA2. The C-addition modes changed the fungal community composition along the direction of PCoA1, whereas N-addition treatments changed the community composition along the direction of PCoA2 (Figure 4b).

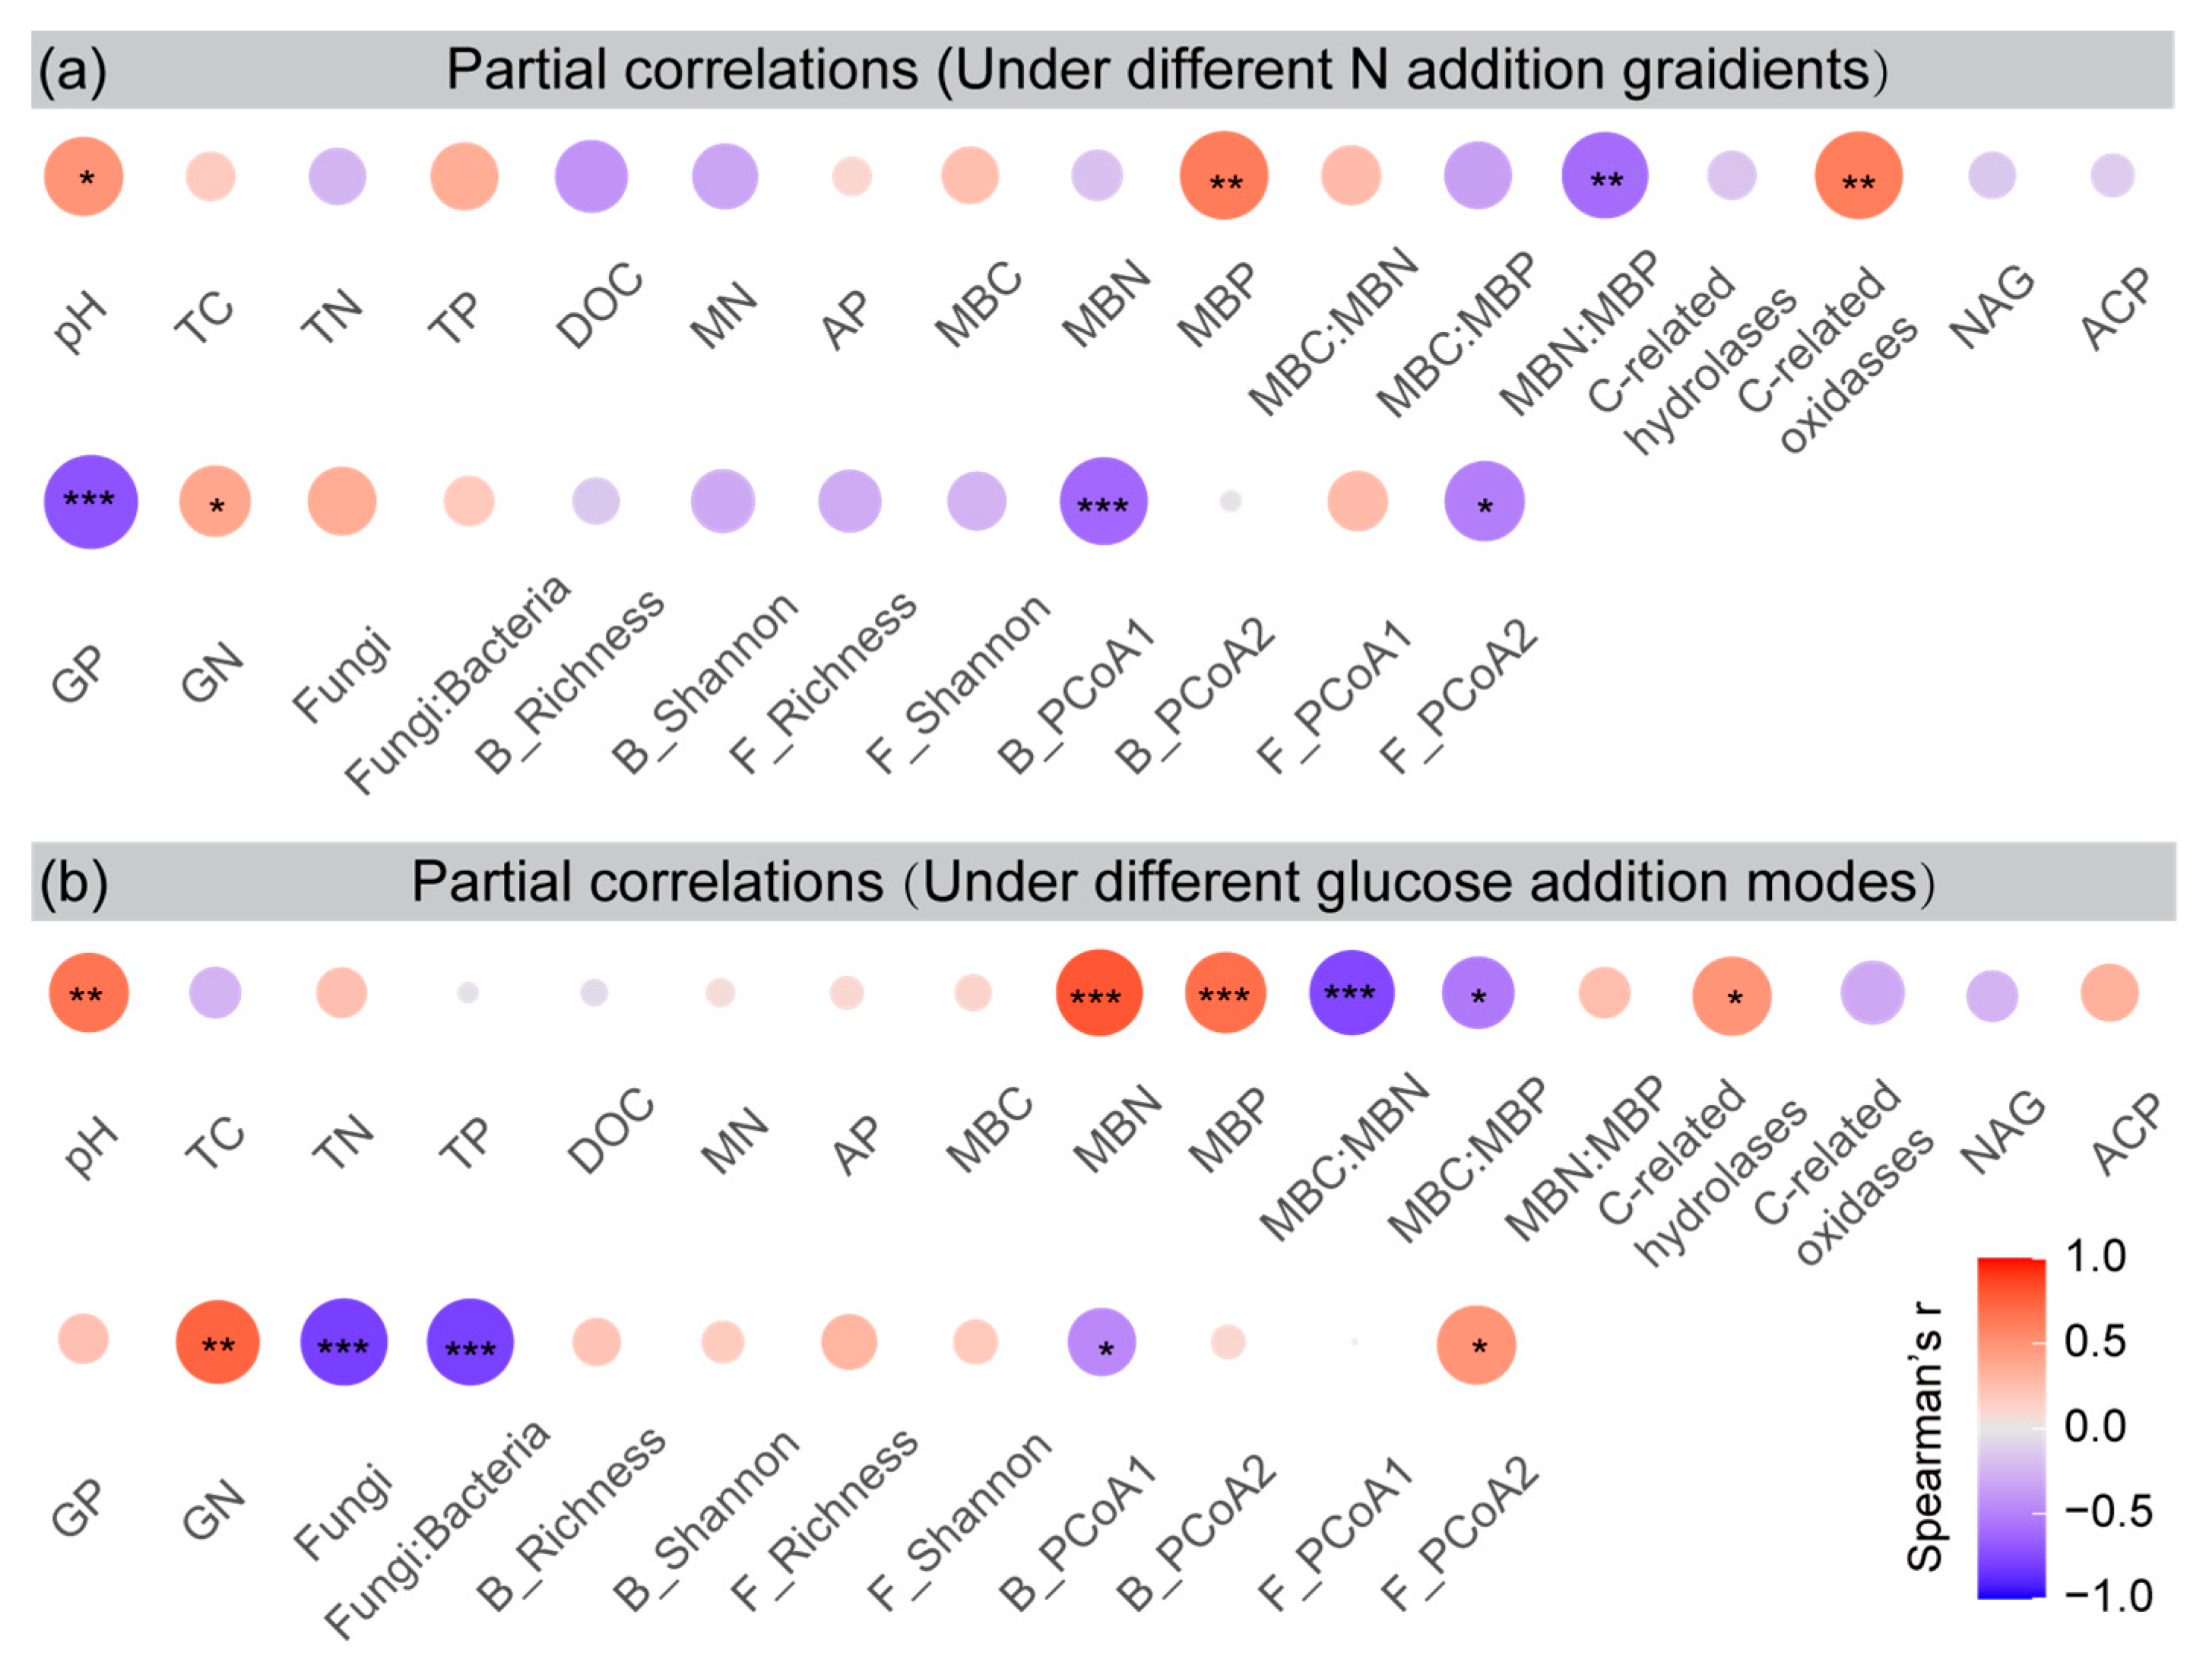
3.6. Predictors of Cumulative PE

Under different N-addition gradients, cumulative PE was significantly negatively correlated with MBC/MBP, GP, the Shannon–Wiener index of fungi, and fungal PCo1, and significantly positively correlated with pH, MBP, C-related oxidases, and GN (p < 0.01; Figure 5a). Under different C-addition modes, cumulative PE was significantly negatively correlated with MBP, MBC/MBN, fungal abundance, the ratio of fungal and bacterial abundances, and the Shannon–Wiener index of fungi, and significantly positively correlated with pH, MBC, MBP, MBN/MBP, GN, and fungal PCoA1 (p < 0.01; Figure 5b). Moreover, we found that cumulative PE was significantly positively correlated with Proteobacteria under different N-addition gradients and C-addition modes (Table S2).

3.7. Microbial Assemblies and Their Relationships with Cumulative PE

To evaluate the roles of bacterial and fungal modules in cumulative PE under different N and C treatments, we established co-occurrence networks of bacteria and fungi, respectively. Bacterial and fungal OTUs were divided into four and six modules, respectively (Figure 6a,b). Under different N-addition gradients, bacterial modules 1 and 3 (B_Mod#1 and B_Mod#3) and fungal modules 1 and 4 (F_Mod#1, F_Mod#4) were significantly correlated with cumulative PE (Table S3 and Figure 6c–f). Moreover, we found that B_Mod#3, whose relative abundance was significantly reduced by high N-addition, predominantly contributed to changes in cumulative PE (Figure S5d and Figure 6d). However, a minor contribution of the other modules to cumulative PE was observed (Figure 6c,e,f). Compared with repeated C-addition, the relative abundances of B_Mod#1 and fungal module 5 (F_Mod#5) were significantly greater with single C-addition (Figure S5d and Figure S6f), which had a positive impact on cumulative PE (Table S3 and Figure 6g,h).
Further analysis indicated that Proteobacteria, Firmicutes, and Actinobacteria accounted for 99.35% of all nodes in B_Mod#3 (Figure 7a). Rhizobiales and Bradyrhizobium were the dominant taxa at the order and genus levels of B_Mod#3, respectively (Figure 7b,c). Moreover, Ascomycota was the dominant phylum in F_Mod#5, accounting for 88.35% of all nodes (Figure 7a). In addition, Hypocreales and Xylariales were the dominant taxa at the order level of F_Mod #5 (Figure 7b).

3.8. Co-Occurrence of Bacteria and Fungi Using Network Analysis

To explore the potential interactions between fungi and bacteria under different treatments, we established co-occurrence networks of bacteria and fungi. We found that the number of nodes and edges of co-occurrence networks reduced with increasing N-addition levels (Figure 8). N-addition led to greater modularity and lower average clustering coefficient (avgCC) values and markedly reduced the number of links between bacteria and fungi (Figure 8a–c). C-addition increased the number of nodes and edges of co-occurrence networks (Figure 8d–f). Among the C-addition treatments, the network with single C-addition had the highest number of nodes, edges, and links between bacteria and fungi but had the lowest modularity value.

4. Discussion

4.1. Effects of N- and C-Addition on Cumulative CO2 Emission and PE

Without C addition, previously N-fertilized soil exhibited greater cumulative CO2 emissions (Figure S2a). Similarly, previous studies also revealed that microbial respiration was stimulated after two years of N-addition in subtropical forest soils [18,47]. These results could be explained by the fact that N-addition may cause intense microbial C limitation, and thus microorganisms cause SOM decomposition by increasing microbial metabolism (e.g., enzyme production). Evidently, without C-addition, N input promoted soil enzyme activities (except for C-related oxidases) but reduced MBC (Figure S3). Moreover, greater N-addition-induced cumulative CO2 emissions were not obtained from the soils under C-addition (Figure S2b,c). Therefore, previously fertilized soils showed lower cumulative PE compared with that of the control. The decrease in cumulative PE with increasing N-addition gradient can also be explained by the microbial nutrient mining theory, which is a widely known process stating that microbes use glucose as an energy source to decompose SOM and acquire nutrients, especially N [2].
With respect to C-addition modes, single C-addition induced greater cumulative CO2 and PE. This is consistent with previous studies [18] because single C-addition (with particular amounts of labile C) may stimulate microbial activity more strongly than the repeated mode. Evidently, we found that single C input led to overall greater microbial biomass and enzyme activities than those of the repeated mode (Figure S3 and Figure 2). Indeed, apart from the frequency of C input, the types of organic matter might have different impacts on PE intensity [48]. Therefore, more experiments with different substrate inputs are needed to specifically investigate the effects of organic matter leached from litter or tree canopies on C soil reactions to calibrate C model parameters under climate change.

4.2. Drivers of Cumulative PE under N-Addition Treatment

In this study, the variance in cumulative PE was significantly associated with soil microbial community-level properties when C-addition modes were not considered (Figure 5a). This inference is supported by several results. First, phylum Proteobacteria was significantly positively correlated with cumulative PE (Table S2). Furthermore, we found that B_Mod#3, whose major taxa (e.g., Proteobacteria, Firmicutes, and Actinobacteria) are known r-strategists, primarily contributed to the changes in cumulative PE (Figure 6d), which grow rapidly and enhance soil C decomposition by consuming labile SOM [49]. This confirms our first hypothesis that r-strategists would be responsible for the changes in cumulative PE under different N-addition treatments. Moreover, because the growth and metabolism of microorganisms require high energy and P levels [50], lower available-P content due to N-addition may limit the growth of microorganisms [51], especially the r-strategist taxa (e.g., Proteobacteria), and therefore, reduce SOM degradation and PE. Moreover, long-term N-addition induces soil acidification (Table 1), which is also unsuitable for the growth of r-strategists [52].
In addition, we found that the relative abundance of Bradyrhizobium (the dominant genus of B_Mod#3), a typical diazotroph, was markedly reduced by N-addition (Figure 7c and Table S4). Diazotrophs are involved in coupled C- and N-cycling processes since they use large amounts of soil C and energy to produce soil bioavailable N [53]. Therefore, high inorganic N content in the soil may suppress the N-fixation process and the C demand of microbes [54].
Moreover, compared to the control, previously N-fertilized soil had greater modularity and lower avgCC values (Figure 8a–c), suggesting that the interactions within microbes were weaker under N-addition treatments, especially high N-addition. Similarly, a recent study reported that high N-addition decreased bacterial–fungal interactions, which may be due to the reduced pH in the soil [28]. In the present study, previously N-fertilized soil showed more negative links within different microbial communities (Figure 8a–c), which might contribute to network stability because competition can stabilize co-oscillation in microbial communities [55]. Therefore, microorganisms under long-term N-addition might be more resistant to environmental changes (e.g., pH and nutrients) [28]. As a double-edged sword, microorganisms may form a conservative nutrient cycling strategy that may be partly responsible for the reduction in cumulative PE induced by N-addition. These findings partly support our third hypothesis that N-addition would reduce both bacterial–fungal interactions and cumulative PE.
In summary, our findings provide new insights into the role of keystone bacterial taxa and the interactions of microorganisms (indicated by co-occurrence networks) in PE under the context of increasing N deposition.

4.3. Drivers of Cumulative PE under Different C-Addition Modes

Compared with repeated C-addition, single C-addition led to significantly greater cumulative PE (Figure 1), and similar results have been reported in forests and farmlands [3,18]. This phenomenon can be attributed to several reasons. The most plausible explanation is that single C-addition increases the overall size of microbial communities and promotes greater microbial activity, thereby increasing PE. This is supported by the generally greater microbial biomass and enzyme activity observed in our study with single C-addition (Figure S3b,c and Figure 2). An alternative explanation is that repeated C-additions may be more conducive to the efficient use of C in the soil by microorganisms, thereby reducing the C resource allocated for respiration. This inference is supported by a recent study, which proposed that repeated C-additions promoted the dominance of fungi, which possess greater C-use efficiency, in microbial communities [20]. However, to the best of our knowledge, there is no direct evidence for the contribution of a shift in microbial community composition to cumulative PE following repeated C input. In this study, repeated C-additions led to a greater MBC/MBN ratio (Figure S3d), which showed significant a negative relationship with cumulative PE (Figure 5a). Typically, fungi have a greater MBC/MBN ratio than that bacteria [56]. Thus, fungal growth may be more advantageous with repeated C-addition treatments. This inference is supported by the result that greater fungi-to-bacteria ratio (based on 13C-PLFA) was found with repeated C-additions than with single C-addition (Figure 3d). Previous publications proposed that microbial communities dominated by fungi exhibited lower nutrient requirements [52]. Furthermore, compared with bacteria, fungi are more conducive to the formation of recalcitrant components [57]. Therefore, repeated C-addition might reduce SOM breakdown.
In this study, we aimed to provide deeper correlations between cumulative PE and community-level microbial properties. We found that 84% of the total variation in cumulative PE was shared by B_Mod#3 and F_Mod#5 under different C-addition modes (Figure 6d,h). B_Mod#3, a group of microbes defined as r-strategists, had a significantly positive correlation with cumulative PE (Figure 6d). This could be because a large amount of labile C-addition may facilitate the proliferation of rapidly growing microbes (e.g., Proteobacteria), thereby stimulating SOM decomposition [5]. This is consistent with previous studies indicating that Proteobacteria abundance is highly correlated with PE [49]. In addition, Rhizobiales was the dominant order of B_Mod#3 (Figure 7b), and its role in soil C cycling and PE has been confirmed in previous studies [58,59].
F_Mod#5 contributed the most to the changes in cumulative PE compared to the bacteria under different C-addition modes (Figure 6h), which proves the dominant role of fungi in soil C cycling. The consistency of the changes in the abundance of F_Mod#5 and CO2 emissions from SOM under different C-addition treatments demonstrate that F_Mod#5 was the keystone module of the SOM-decomposition community. For instance, Sordariales, Hypocreales, and Xylariales, from Ascomycota, were the dominant orders of F_Mod#5 (Figure 7b) and acted as saprotrophic fungi [60]. This supports our second hypothesis that different C-addition modes primarily affect cumulative PE via specific saprophytic taxa. Previous studies have revealed that Ascomycota grows faster than other fungal taxa [61]. This could be because most members of Ascomycota possess genes encoding α-glucosidase and β-glucosidase and are able to facilitate the breakdown of major carbohydrate constituents in the soil such as soluble saccharides, cellulose, and hemicelluloses [62,63]. In agreement with these results, we found that the activity of C-related hydrolases was significantly greater with single C-addition than with repeated C-additions (Figure 2a). However, these results were not observed for C-related oxidases (Figure 2b). Given that the C-related hydrolases and C-related oxidases can break down readily available (e.g., hemicellulose) and recalcitrant (e.g., lignin and phenol) C sources [64], respectively, one explanation for this finding could be that these microorganisms prefer decomposable organic matter as an energy source. This inference is supported by the fact that we observed lower labile organic C content in the soil with single C-addition after a 90-day incubation, whereas the opposite trend was observed for resistant C content (unpublished data). Similar to our findings, Kong et al. [65] reported that Ascomycota were the major unstable C-degrading fungi in 13C glucose-amended soils.
Moreover, we found that some taxa in F_Mod#5 are considered phosphate-solubilizing microorganisms (PSMs). For instance, the genus Trichoderma (order Hypocreales) not only secretes cellulase but is also able to produce acid and alkaline phosphatases [66]. In accordance with these reports, we found greater ACP activity and MBP content with single C-addition (Figure 2d and Figure S3c). These results indicate that the addition of a large amount of labile C may facilitate PSM, thereby promoting soil P mineralization and resulting in greater CO2 emissions from the soil [67]. Moreover, we observed a greater abundance of Xylariales (a major order in F_Mod#5) under single C-addition compared with repeated C-addition. The secondary metabolites of Xylariales might act as signaling compounds that regulate interactions between fungi and bacteria in soil [68]. This is strongly supported by the greater network complexity and associations between bacteria and fungi under single C-addition (Figure 8e). These results suggest that high amounts of labile C input may strongly shift the microbial community and their interactions, and thus, enhance C metabolism and decomposition processes, which also support our third hypothesis. Thus, the present study indicates that single C-addition promoted the decomposition of labile SOM by promoting fungal dominance in microbial communities.
Overall, our study determined the influence of soil community-level microbial properties on cumulative PE. We believe that the microbial community composition is responsible for cumulative PE. The bacterial and fungal communities predominantly contributed to cumulative PE under different N-addition gradients and C-addition modes, respectively. We further identified the key microbial modules associated with cumulative PE. In particular, N-addition reduced the abundance of B_Mod#3, a group of r-strategists (e.g., Proteobacteria), thereby reducing cumulative PE. F_ Mod#3, a group of unstable C-degrading compounds (e.g., Ascomycota), showed greater activity under single C-addition. Single C-addition may facilitate the proliferation of PSM (e.g., Trichoderma genera), which promotes soil P mineralization and fixation by microorganisms. Moreover, we provide evidence that N- and C-addition treatments regulated cumulative PE by strongly shifting the interactions between bacteria and fungi, suggesting that further investigation of functional genes for C degradation and other processes is needed to determine the extent to which these changes are related to microbial composition-level shifts.

5. Conclusions

The soil under five-year N-addition had lower cumulative CO2 emissions and PE; this could be explained by several reasons: (i) N-addition increased soil N availability and thus reduced microbial N demand and mining; (ii) N-addition negatively impacted the abundance of a key bacteria module (a group of r-strategists) and the activities of C-related oxidases. Moreover, single C-addition led to greater CO2 emissions and PE than repeated addition, suggesting that previous studies might overestimate the effect of exogenous C input on PE following single organic matter addition. Such phenomenon could be attributed to the following findings: (i) the soils under single C-addition exhibited overall greater microbial biomass and enzyme activities; (ii) repeated C-addition might promote the dominance of fungi in microbial communities; (iii) single C-addition induced a greater abundance of bacterial r-strategists and a key fungal module (mainly composed of saprophytic and PSM taxa). These changes were consistent with C-related hydrolases and ACP activities, which might increase labile SOM decomposition and cumulative PE. Therefore, our results highlight the importance of changes in bacterial and fungal communities in affecting PE under N- and C-addition.

Supplementary Materials

The following supporting information can be downloaded at: https://www.mdpi.com/article/10.3390/f14061207/s1, Figure S1: Experimental design of the study. The numbers on the timeline indicate soil CO2 emission and C isotopic signature (δ13C) of CO2. Soil and microbial properties were detected after a 90-day incubation period; Figure S2: Temporal changes in CO2 emission in different C-addition treatments. (a) C0, no C addition; (b) CS, single C addition; (c) CR, repeated C additions. Abbreviations: CT, control; LN, low-level N addition; HN, high-level N addition; Figure S3: C, N, and P concentrations in soil microbial biomass (a–c) and their stoichiometry (d–f). Two-way analysis of variance (ANOVA) was used to determine the effect of N addition, C addition mode, and the interaction (N × C) between N- and C-addition treatments. Asterisks (*) indicate a significant difference (* p < 0.05, ** p < 0.01, *** p < 0.001, ns. p > 0.05). Different lower-case and upper-case letters indicate significant differences among N- and C-addition treatments, respectively. Abbreviations: MBC, microbial biomass C; MBN, microbial biomass N; MBP, microbial biomass phosphorus; C0, no C addition; CS, single C addition; CR, repeated C additions; CT, control; LN, low-level N addition; HN, high-level N addition; Figure S4: Diversity of soil microbial community. (a,b) and (c,d) indicate the observed species and Shannon–Wiener index of bacteria and fungi, respectively. Two-way analysis of variance (ANOVA) was used to determine the effect of N addition, C addition mode, and the interaction (N × C) between N- and C-addition treatments. Asterisks (*) indicate a significant difference (* p < 0.05, ** p < 0.01, *** p < 0.001, ns. p > 0.05). Different lower-case and upper-case letters indicate significant differences among N- and C-addition treatments, respectively. Abbreviations: C0, no C addition; CS, single C addition; CR, repeated C additions; CT, control; LN, low-level N addition; HN, high-level N addition; Figure S5: Relative abundance of the bacterial modules in different treatments. Two-way analysis of variance (ANOVA) was used to determine the effect of N addition, C-addition mode, and the interaction (N × C) between N- and C-addition treatments. Asterisks (*) indicate a significant difference (** p < 0.01, *** p < 0.001, ns. p > 0.05). B_Mod#0–3 were the major bacterial modules (a–d). Different lower-case and upper-case letters indicate significant differences among N- and C-addition treatments, respectively. Abbreviations: C0, no C addition; CS, single C addition; CR, repeated C additions; CT, control; LN, low-level N addition; HN, high-level N addition; Figure S6: Relative abundance of the fungal modules under different treatments. Two-way analysis of variance (ANOVA) was used to determine the effect of N addition, C-addition mode, and the interaction (N × C) between N- and C-addition treatments. Asterisks (*) indicate a significant difference (* p < 0.05, ** p < 0.01, *** p < 0.001, ns. p > 0.05). F_Mod#0–5 were the major fungal modules (a–f). Different lower-case and upper-case letters indicate significant differences among N- and C-addition treatments, respectively. Abbreviations: C0, no C addition; CS, single C addition; CR, repeated C additions; CT, control; LN, low-level N addition; HN, high-level N addition; Table S1: Effect of long-term N addition on physicochemical properties of soil before incubation. Different lowercase letters indicate significant differences between different N-addition treatments. Abbreviations: TC, total carbon; TN, total N; TP, total phosphorus; DOC, dissolved organic carbon; MN, mineral N; AP, available phosphorus; CT, control; LN, low-level N addition; HN, high-level N addition; Table S2: Correlation coefficients between the relative abundances of dominant bacterial and fungal taxa at the phylum level and cumulative priming effect. * p < 0.05; numbers are partial correlation coefficients (r) of Spearman’s correlation; Table S3: Correlations between the relative abundances of dominant bacterial and fungal modules and cumulative priming effect (PE). Mixed linear-model regressions were used to analyze to the relationship between cumulative PE and bacterial and fungal dominant modules under different N-addition addition treatments or C-addition modes, whereby variance of one treatment was eliminated by selecting either N- or C-addition treatment as a random factor. B_Mod#0, B_Mod#1, B_Mod#2, B_Mod#3, and B_Mod#4 were the key bacterial modules; F_Mod#0, F_Mod#1, F_Mod#2, F_Mod#3, F_Mod#4, and F_Mod#5 were the key fungal modules. p values represent significant levels; F values represent the proportion of total variance explained for the dependent variable of cumulative PE. Microbial ecological modules significantly related to PE are indicated in bold text; Table S4: Effects of long-term nitrogen (N) addition and carbon (C) addition mode on bacteria and fungi in different phylogenetic levels (%).

Author Contributions

Conceptualization, Y.C. and Q.Z. (Quanxin Zeng); methodology, Y.L. and K.M.; software, Q.Z. (Quanxin Zeng); validation, Y.C. and Q.Z. (Quanxin Zeng); formal analysis, Y.L., Q.Z. (Qiufang Zhang), and K.M.; investigation, X.Z.; resources, Y.C.; data curation, Y.L., M.X. and Q.Z. (Quanxin Zeng); writing—original draft preparation, M.X. and Q.Z. (Quanxin Zeng); writing—review and editing, Q.Z. (Quanxin Zeng), C.L. and Y.C.; visualization, M.X., Q.Z. (Quanxin Zeng), and Q.Z. (Qiufang Zhang); supervision, Y.C.; project administration, X.Y. and Y.C.; funding acquisition, X.Y. and Y.C. All authors have read and agreed to the published version of the manuscript.

Funding

This research was funded by the Natural Science Foundation of Fujian Province (Nos. 2020J01142 and 2020J01397).

Data Availability Statement

The data presented in this study are available on request from the corresponding author. The data are not publicly available due to privacy restrictions.

Acknowledgments

We thank Lei Li, Lanying Liu, and Liuming Yang for helping with laboratory work.

Conflicts of Interest

The authors declare that they have no known competing financial interest or personal relationships that could have appeared to influence the work reported in this paper.

References

  1. Kuzyakov, Y.; Friedel, J.K.; Stahr, K. Review of mechanisms and quantification of priming effects. Soil Biol. Biochem. 2000, 32, 1485–1498. [Google Scholar] [CrossRef]
  2. Dijkstra, F.A.; Carrillo, Y.; Pendall, E.; Morgan, J.A. Rhizosphere priming: A nutrient perspective. Front. Microbiol. 2013, 4, 1–8. [Google Scholar] [CrossRef] [PubMed] [Green Version]
  3. Fanin, N.; Alavoine, G.; Bertrand, I. Temporal dynamics of litter quality, soil properties and microbial strategies as main drivers of the priming effect. Geoderma 2020, 377, 114576. [Google Scholar] [CrossRef]
  4. Bastida, F.; García, C.; Fierer, N.; Eldridge, D.J.; Bowker, M.A.; Abades, S.; Alfaro, F.D.; Asefaw Berhe, A.; Cutler, N.A.; Gallardo, A.; et al. Global ecological predictors of the soil priming effect. Nat. Commun. 2019, 10, 3481. [Google Scholar] [CrossRef] [PubMed] [Green Version]
  5. Razanamalala, K.; Razafifimbelo, T.; Maron, P.A.; Ranjard, L.; Chemidlin, N.; Lelievre, M.; Dequiedt, S.; Ramaroson, V.H.; Marsden, C.; Becquer, T.; et al. Soil microbial diversity drives the priming effect along climate gradients: A case study in Madagascar. ISME J. 2018, 12, 451–462. [Google Scholar] [CrossRef] [Green Version]
  6. Zhang, Q.; Cheng, L.; Feng, J.; Mei, K.; Zeng, Q.; Zhu, B.; Chen, Y. Nitrogen addition stimulates priming effect in a subtropical forest soil. Soil Biol. Biochem. 2021, 160, 108339. [Google Scholar] [CrossRef]
  7. Fu, X.; Song, Q.; Li, S.; Shen, Y.; Yue, S. Dynamic changes in bacterial community structure are associated with distinct priming effect patterns. Soil Biol. Biochem. 2022, 169, 108671. [Google Scholar] [CrossRef]
  8. Zhao, F.; Wang, J.; Li, Y.; Xu, X.; He, L.; Wang, J.; Ren, C.; Guo, Y. Microbial functional genes driving the positive priming effect in forest soils along an elevation gradient. Soil Biol. Biochem. 2022, 165, 108498. [Google Scholar] [CrossRef]
  9. Ma, B.; Wang, H.; Dsouza, M.; Lou, J.; He, Y.; Dai, Z.; Brookes, P.C.; Xu, J.; Gilbert, J.A. Geographic patterns of co-occurrence network topological features for soil microbiota at continental scale in eastern China. ISME J. 2016, 10, 1891–1901. [Google Scholar] [CrossRef]
  10. Feng, J.; Zeng, X.M.; Zhang, Q.; Zhou, X.Q.; Liu, Y.R.; Huang, Q. Soil microbial trait-based strategies drive metabolic efficiency along an altitude gradient. ISME J. Commun. 2021, 1, 71. [Google Scholar] [CrossRef] [PubMed]
  11. Zeng, X.M.; Feng, J.; Chen, J.; Delgado-Baquerizo, M.; Zhang, Q.; Zhou, X.Q.; Yuan, Y.; Feng, S.; Zhang, K.; Liu, Y.R.; et al. Microbial assemblies associated with temperature sensitivity of soil respiration along an altitudinal gradient. Sci. Total Environ. 2022, 820, 153257. [Google Scholar] [CrossRef]
  12. Nottingham, A.T.; Turner, B.L.; Stott, A.W.; Tanner, E.V.J. Nitrogen and phosphorus constrain labile and stable carbon turnover in lowland tropical forest soils. Soil Biol. Biochem. 2015, 80, 26–33. [Google Scholar] [CrossRef]
  13. Chen, R.; Senbayram, M.; Blagodatsky, S.; Myachina, O.; Dittert, K.; Lin, X.; Blagodatskaya, E.; Kuzyakov, Y. Soil C and N availability determine the priming effect: Microbial N mining and stoichiometric decomposition theories. Glob. Chang. Biol. 2014, 20, 2356–2367. [Google Scholar] [CrossRef] [PubMed]
  14. Feng, J.G.; Tang, M.; Zhu, B. Soil priming effect and its responses to nutrient addition along a tropical forest elevation gradient. Glob. Chang. Biol. 2021, 27, 2793–2806. [Google Scholar] [CrossRef]
  15. Zhu, Z.; Ge, T.; Luo, Y.; Liu, S.; Xu, X.; Tong, C.; Shibistova, O.; Guggenberger, G.; Wu, J. Microbial stoichiometric flexibility regulates rice straw mineralization and its priming effect in paddy soil. Soil Biol. Biochem. 2018, 121, 67–76. [Google Scholar] [CrossRef]
  16. Ren, C.; Zhao, F.; Shi, Z.; Chen, J.; Han, X.; Yang, G.; Feng, Y.; Ren, G. Differential responses of soil microbial biomass and carbon-degrading enzyme activities to altered precipitation. Soil Biol. Biochem. 2017, 115, 1–10. [Google Scholar] [CrossRef]
  17. Zhou, J.; Wen, Y.; Shi, L.; Marshall, M.R.; Kuzyakov, Y.; Blagodatskaya, E.; Zang, H. Strong priming of soil organic matter induced by frequent input of labile carbon. Soil Biol. Biochem. 2021, 152, 108069. [Google Scholar] [CrossRef]
  18. Wang, Q.; Chen, L.; Yang, Q.; Sun, T.; Li, C. Different effects of single versus repeated additions of glucose on the soil organic carbon turnover in a temperate forest receiving long-term N addition. Geoderma 2019, 341, 59–67. [Google Scholar] [CrossRef]
  19. Hamer, U.; Marschner, B. Priming effects in soils after combined and repeated substrate additions. Geoderma 2005, 128, 38–51. [Google Scholar] [CrossRef]
  20. Wei, Y.; Xiong, X.; Ryo, M.; Badgery, W.B.; Bi, Y.; Yang, G.; Zhang, Y.; Liu, N. Repeated litter inputs promoted stable soil organic carbon formation by increasing fungal dominance and carbon use efficiency. Biol. Fertil. Soils 2022, 58, 1–13. [Google Scholar] [CrossRef]
  21. Malik, A.A.; Chowdhury, S.; Schlager, V.; Oliver, A.; Puissant, J.; Vazquez, P.G.; Jehmlich, N.; von Bergen, M.; Grifths, R.I.; Gleixner, G. Soil fungal:bacterial ratios are linked to altered carbon cycling. Front. Microbiol. 2016, 7, 1247. [Google Scholar] [CrossRef] [Green Version]
  22. Müller, K.; Marhan, S.; Kandeler, E.; Poll, C. Carbon flow from litter through soil microorganisms: From incorporation rates to mean residence times in bacteria and fungi. Soil Biol. Biochem. 2017, 115, 187–196. [Google Scholar] [CrossRef]
  23. Esperschütz, J.; Perez-de-Mora, A.; Schreiner, K.; Welzl, G.; Bruegger, F.; Zeyer, J.; Hagedorn, F.; Munch, J.C.; Schloter, M. Microbial food web dynamics along a soil chronosequence of a glacier forefifield. Biogeosciences 2011, 8, 3283–3294. [Google Scholar] [CrossRef] [Green Version]
  24. Xiong, J.; Peng, F.; Sun, H.; Xue, X.; Chu, H. Divergent responses of soil fungi functional groups to short-term warming. Microb. Ecol. 2014, 68, 708–715. [Google Scholar] [CrossRef] [PubMed]
  25. Wang, H.; Zeng, Y.; Guo, C.; Bao, Y.; Lu, G.; Reinfelder, J.R.; Dang, Z. Bacterial, archaeal, and fungal community responses to acid mine drainage-laden pollution in a rice paddy soil ecosystem. Sci. Total Environ. 2018, 616, 107–116. [Google Scholar] [CrossRef] [PubMed]
  26. De Menezes, A.B.; Prendergast-Miller, M.T.; Richardson, A.E.; Toscas, P.; Farrell, M.; Macdonald, L.M.; Baker, G.; Wark, T.; Thrall, P.H. Network analysis reveals that bacteria and fungi form modules that correlate independently with soil parameters. Environ. Microbiol. 2015, 17, 2677–2689. [Google Scholar] [CrossRef]
  27. Banerjee, S.; Kirkby, C.A.; Schmutter, D.; Bissett, A.; Kirkegaard, J.A.; Richardson, A.E. Network analysis reveals functional redundancy and keystone taxa amongst bacterial and fungal communities during organic matter decomposition in an arable soil. Soil Biol. Biochem. 2016, 97, 188–198. [Google Scholar] [CrossRef]
  28. Li, B.B.; Roley, S.S.; Duncan, D.S.; Guo, J.; Quensen, J.F.; Yu, H.Q.; Tiedje, J.M. Long-term excess nitrogen fertilizer increases sensitivity of soil microbial community to seasonal change revealed by ecological network and metagenome analyses. Soil Biol. Biochem. 2021, 160, 108349. [Google Scholar] [CrossRef]
  29. Keith, A.; Singh, B.; Singh, B.P. Interactive priming of biochar and labile organic matter mineralization in a smectite-rich soil. Environ. Sci. Technol. 2011, 45, 9611–9618. [Google Scholar] [CrossRef]
  30. Jones, D.L.; Willett, V.B. Experimental evaluation of method to quantify dissolved organic nitrogen (DON) and dissolved organic carbon (DOC) in soil. Soil Biol. Biochem. 2006, 38, 991–999. [Google Scholar] [CrossRef]
  31. Olsen, S.R.; Sommers, L.E. Phosphorous. In Methods of Soil Analysis, Part 2, Chemical and Microbial Properties; Agronomy Society of America, Agronomy Monograph 9; Page, A.L., Miller, R.H., Keeney, D.R., Eds.; Soil Science Society of America: Madison, WI, USA, 1982; pp. 403–430. [Google Scholar]
  32. Vance, E.D.; Brookes, P.C.; Jenkinson, D.S. An extraction method for measuring soil microbial biomass C. Soil Biol. Biochem. 1987, 19, 703–707. [Google Scholar] [CrossRef]
  33. Turner, B.L.; Wrigh, S.J. The response of microbial biomass and hydrolytic enzymes to a decade of nitrogen, phosphorus, and potassium addition in a lowland tropical rain forest. Biogeochemistry 2014, 117, 115–130. [Google Scholar] [CrossRef]
  34. Saiya-Cork, K.R.; Sinsabaugh, R.L.; Zak, D.R. The effects of long-term nitrogen deposition on extracellular enzyme activity in an acer saccharum, forest soil. Soil Biol. Biochem. 2002, 34, 1309–1315. [Google Scholar] [CrossRef]
  35. German, D.P.; Weintraub, M.N.; Grandy, A.S.; Lauber, C.L.; Rinkes, Z.L.; Allison, S.D. Optimization of hydrolytic and oxidative enzyme methods for ecosystem studies. Soil Biol. Biochem. 2011, 43, 1387–1397. [Google Scholar] [CrossRef]
  36. Frostegård, Å.; Tunlid, A.; Bååth, E. Use and misuse of PLFA measurements in soils. Soil Biol. Biochem. 2011, 43, 1621–1625. [Google Scholar] [CrossRef]
  37. Wang, Q.K.; Wang, S.; He, T.X.; Liu, L.; Wu, J.B. Response of organic carbon mineralization and microbial community to leaf litter and nutrient additions in subtropical forest soils. Soil Biol. Biochem. 2014, 71, 13–20. [Google Scholar] [CrossRef]
  38. Qiao, N.; Wang, J.; Xu, X.; Shen, Y.; Long, X.E.; Hu, Y.; Schaefer, D.; Li, S.; Wang, H.; Kuzyakov, Y. Priming alters soil carbon dynamics during forest succession. Biol. Fertil. Soils 2019, 55, 339–350. [Google Scholar] [CrossRef]
  39. Caporaso, J.G.; Lauber, C.L.; Walters, W.A.; Berg-Lyons, D.; Lozupone, C.A.; Turnbaugh, P.J.; Fierer, N.; Knight, R. Global patterns of 16S rRNA diversity at a depth of millions of sequences per sample. Proc. Natl. Acad. Sci. USA 2011, 108, 4516–4522. [Google Scholar] [CrossRef] [Green Version]
  40. Wang, X.; Sheng, L.; Li, Y.; Jiang, H.; Lv, Z.; Qi, W.; Luo, W. Soil labile organic carbon indicating seasonal dynamics of soil organic carbon in northeast peatland. Ecol. Indic. 2022, 138, 108847. [Google Scholar] [CrossRef]
  41. Edgar, R.C. UPARSE: Highly accurate OTU sequences from microbial amplicon reads. Nat. Methods 2013, 10, 996–998. [Google Scholar] [CrossRef]
  42. Quast, C.; Pruesse, E.; Yilmaz, P.; Gerken, J.; Schweer, T.; Yarza, P.; Peplies, J.; Glöckner, F.O. The SILVA ribosomal RNA gene database project: Improved data processing and web-based tools. Nucleic Acids Res. 2012, 41, D590–D596. [Google Scholar] [CrossRef]
  43. Nilsson, R.H.; Larsson, K.H.; Taylor, A.F.S.; Bengtsson-Palme, J.; Jeppesen, T.S.; Schigel, D.; Kennedy, P.; Picard, K.; Glöckner, F.O.; Tedersoo, L.; et al. The UNITE database for molecular identification of fungi: Handling dark taxa and parallel taxonomic classifications. Nucleic Acids Res. 2019, 47, D259–D264. [Google Scholar] [CrossRef] [PubMed]
  44. Revelle, W. psych: Procedures for Psychological, Psychometric, and Personality Research; Northwestern University: Evanston, IL, USA, 2021; R Package Version 2.1.3.; Available online: https://CRAN.R-project.org/package=psych (accessed on 15 October 2021).
  45. Langfelder, P.; Horvath, S. Fast R functions for robust correlations and hierarchical clustering. J. Stat. Softw. 2012, 46, i11. [Google Scholar] [CrossRef] [Green Version]
  46. Benjamini, Y.; Krieger, A.M.; Yekutieli, D. Adaptive linear step-up procedures that control the false discovery rate. Biometrika 2006, 93, 491–507. [Google Scholar] [CrossRef]
  47. Tu, L.H.; Hu, T.X.; Zhang, J.; Li, X.W.; Hu, H.L.; Liu, L.; Xiao, Y.L. Nitrogen addition stimulates different components of soil respiration in a subtropical bamboo ecosystem. Soil Biol. Biochem. 2013, 58, 255–264. [Google Scholar] [CrossRef]
  48. Wang, X.; Li, S.; Zhu, B.; Homyak, P.M.; Chen, G.; Yao, X.; Wu, D.; Yang, Z.; Lyu, M.; Yang, Y. Long-term nitrogen deposition inhibits soil priming effects by enhancing phosphorus limitation in a subtropical forest. Glob. Chang. Biol. 2023, 1–13. [Google Scholar] [CrossRef]
  49. Yu, G.; Zhao, H.; Chen, J.; Zhang, T.; Cai, Z.; Zhou, G.; Li, Z.; Qiu, Z.; Wu, Z. Soil microbial community dynamics mediate the priming effects caused by in situ decomposition of fresh plant residues. Sci. Total Environ. 2020, 737, 139708. [Google Scholar] [CrossRef] [PubMed]
  50. Mooshammer, M.; Wanek, W.; Zechmeister-Boltenstern, S.; Richter, A. Stoichiometric imbalances between terrestrial decomposer communities and their resources: Mechanisms and implications of microbial adaptations to their resources. Front. Microbiol. 2014, 5, 22. [Google Scholar] [CrossRef] [Green Version]
  51. Cui, Y.; Moorhead, D.L.; Wang, X.; Xu, M.; Wang, X.; Wei, X.; Zhu, Z.; Ge, T.; Peng, S.; Zhu, B.; et al. Decreasing microbial phosphorus limitation increases soil carbon release. Geoderma 2022, 419, 115868. [Google Scholar] [CrossRef]
  52. Ho, A.; Di Lonardo, D.P.; Bodelier, P.L.E. Revisiting life strategy concepts in environmental microbial ecology. FEMS Microbiol. Ecol. 2017, 93, fix006. [Google Scholar] [CrossRef] [Green Version]
  53. Tang, Y.; Yu, G.; Zhang, X.; Wang, Q.; Tian, J.; Niu, S.; Tian, J.; Ge, J. Different strategies for regulating free-living N2 fixation in nutrient-amended subtropical and temperate forest soils. Appl. Soil Ecol. 2019, 136, 21–29. [Google Scholar] [CrossRef]
  54. Hu, X.; Liu, J.; Wei, D.; Zhou, B.; Chen, X.; Jin, J.; Liu, X.; Wang, G. Long-term application of nitrogen, not phosphate or potassium, significantly alters the diazotrophic community compositions and structures in a Mollisol in northeast China. Res. Microbiol. 2019, 170, 147–155. [Google Scholar] [CrossRef]
  55. Zhou, H.; Gao, Y.; Jia, X.; Wang, M.; Ding, J.; Cheng, L.; Bao, F.; Wu, B. Network analysis reveals the strengthening of microbial interaction in biological soil crust development in the Mu Us Sandy Land, northwestern China. Soil Biol. Biochem. 2020, 144, 107782. [Google Scholar] [CrossRef]
  56. Deng, F.; Liang, C. Revisiting the quantitative contribution of microbial necromass to soil carbon pool: Stoichiometric control by microbes and soil. Soil Biol. Biochem. 2022, 165, 108486. [Google Scholar] [CrossRef]
  57. Thiet, R.K.; Frey, S.D.; Six, J. Do growth yield efficiencies differ between soil microbial communities differing in fungal: Bacterial ratios? Reality check and methodological issues. Soil Biol. Biochem. 2006, 38, 837–844. [Google Scholar] [CrossRef]
  58. Zhou, S.; Wang, J.; Chen, L.; Wang, J.; Zhao, F. Microbial community structure and functional genes drive soil priming effect following afforestation. Sci. Total Environ. 2022, 825, 153925. [Google Scholar] [CrossRef]
  59. Wang, S.S.; Meade, A.; Lam, H.M.; Luo, H.W. Evolutionary timeline and genomic plasticity underlying the lifestyle diversity in rhizobiales. Msystems 2020, 5, e00438-20. [Google Scholar] [CrossRef] [PubMed]
  60. Liu, S.; Trevathan-Tackett, S.M.; Jiang, Z.; Cui, L.; Wu, Y.; Zhang, X.; Huang, X. Nutrient loading decreases blue carbon by mediating fungi activities within seagrass meadows. Environ. Res. 2022, 212, 113280. [Google Scholar] [CrossRef]
  61. Challacombe, J.F.; Hesse, C.N.; Bramer, L.M.; McCue, L.A.; Lipton, M.; Purvine, S.; Nicora, C.; Gallegos-Graves, L.V.; Porras-Alfaro, A.; Kuske, C.R. Genomes and secretomes of Ascomycota fungi reveal diverse functions in plant biomass decomposition and pathogenesis. BMC Genom. 2019, 20, 1–27. [Google Scholar] [CrossRef] [PubMed] [Green Version]
  62. Štursová, M.; Žifčáková, L.; Leigh, M.B.; Burgess, R.; Baldrian, P. Cellulose utilization in forest litter and soil: Identification of bacterial and fungal decomposers. FEMS Microbiol. Ecol. 2012, 80, 735–746. [Google Scholar] [CrossRef]
  63. Eichlerová, I.; Homolka, L.; Žifčáková, L.; Lisá, L.; Dobiášová, P.; Baldrian, P. Enzymatic systems involved in decomposition reflects the ecology and taxonomy of saprotrophic fungi. Fungal Ecol. 2015, 13, 10–22. [Google Scholar] [CrossRef]
  64. Ren, C.; Wang, J.; Bastida, F.; Delgado-Baquerizo, M.; Yang, Y.; Wang, J.; Zhong, J.; Zhou, Z.; Zhang, S.; Guo, Y.; et al. Microbial traits determine soil C emission in response to fresh carbon inputs in forests across biomes. Glob. Chang. Biol. 2022, 28, 1516–1528. [Google Scholar] [CrossRef] [PubMed]
  65. Kong, Y.L.; Zhu, C.; Ruan, Y.; Luo, G.W.; Wang, M.; Ling, N.; Shen, Q.R.; Guo, S. Are the microbial communities involved in glucose assimilation in paddy soils treated with different fertilization regimes for three years similar? J. Soils Sediments 2018, 18, 2476–2490. [Google Scholar] [CrossRef]
  66. Novy, V.; Nielsen, F.; Seiboth, B.; Nidetzky, B. The influence of feedstock characteristics on enzyme production in Trichoderma reesei: A review on productivity, gene regulation and secretion profiles. Biotechnol. Biofuels 2019, 12, 238. [Google Scholar] [CrossRef] [Green Version]
  67. Fang, Y.; Van Zwieten, L.; Rose, M.T.; Vasileiadis, S.; Donner, E.; Vancov, T.; Rigg, J.; Weng, Z.; Lombi, E.; Drigo, B.; et al. Unraveling microbiomes and functions associated with strategic tillage, stubble, and fertilizer management. Agric. Ecosyst. Environ. 2022, 323, 107686. [Google Scholar] [CrossRef]
  68. Li, S.; Wang, S.; Fan, M.; Wu, Y.; Shangguan, Z. Interactions between biochar and nitrogen impact soil carbon mineralization and the microbial community. Soil Tillage Res. 2020, 196, 104437. [Google Scholar] [CrossRef]
Figure 1. Influence of N- and C- addition on soil cumulative priming effect after a 90-day incubation period. Two-way analysis of variance (ANOVA) was used to determine the effect of N-addition, C-addition mode, and the interaction (N × C) between N- and C-addition treatments. Asterisks (*) indicate a significant difference (** p < 0.01, *** p < 0.001, ns. p > 0.05). Differences among N- and C-addition treatments were estimated using Tukey’s post hoc test and two-group t-test, respectively. Different lower-case and upper-case letters indicate significant differences among N- and C-addition treatments, respectively. Abbreviations: CS, single C-addition; CR, repeated C-additions; CT, control; LN, low-level N-addition; HN, high-level N-addition.
Forests 14 01207 g001
Figure 2. Soil enzyme activities after a 90-day incubation period. (a) C-related hydrolases, the sum values of β-1,4-glucosidase and cellobiohydrolase; (b) C-related oxidases, the sum values of phenol oxidase and peroxidase; (c) β-N-acetylglucosaminosidase (NAG); (d) acid phosphatase (ACP). Two-way analysis of variance (ANOVA) was used to determine the effect of N-addition, C-addition addition mode, and the interaction (N × C) between N- and C-addition treatments. Asterisks (*) indicate a significant difference (* p < 0.05, *** p < 0.001, ns. p > 0.05). Different lower-case and upper-case letters indicate significant differences among N- and C-addition treatments, respectively. Abbreviations: C0, no C-addition; CS, single C-addition; CR, repeated C-additions; CT, control; LN, low-level N-addition; HN, high-level N-addition.
Forests 14 01207 g002
Figure 3. Distribution of 13C-PLFA in microbial groups. (a) Gram-positive bacteria; (b) Gram-negative bacteria; (c) fungi; (d) the ratio of fungi to total bacteria. Total bacterial abundance is the sum of the abundances of Gram-negative and Gram-positive bacteria in soil. Two-way analysis of variance (ANOVA) was used to determine the effect of N-addition, C-addition mode, and the interaction (N × C) between N- and C-addition treatments. Asterisks (*) indicate a significant difference (* p < 0.05, ** p < 0.01, *** p < 0.001, ns. p > 0.05). Differences among N- and C-addition treatments were estimated using Tukey’s post hoc test and two-group t-test, respectively. Different lower-case and upper-case letters indicate significant differences among N- and C-addition treatments, respectively. Abbreviations: F/B, the ratio of fungi to bacteria; CS, single C-addition; CR, repeated C-additions; CT, control; LN, low-level N-addition; HN, high-level N-addition.
Forests 14 01207 g003
Figure 4. Principal coordinate analysis (PCoA) of the (a) bacterial and (b) fungal community compositions obtained from N- and C-addition treatment soils based on beta-diversity analysis. Abbreviations: CTC0, no N and C addition; CTCS, no N addition with single C addition; CTCR, no N addition with repeated C additions; LNC0, low-level N without C addition; LNCS, low-level N with single C addition; LNCR, low-level N with repeated C additions; HNC0, high-level N-addition without C-addition; HNCS, High-level N-addition with single C-addition; HNCR, high-level N-addition with repeated C-additions.
Forests 14 01207 g004
Figure 5. Partial correlations between the cumulative priming effect and soil and microbial properties under different (a) N-addition treatments or (b) C-addition modes, whereby variance of one treatment was eliminated by selecting either N- or C-addition treatment as a random factor. Differences in circle size and color indicate the level of the correlation between the priming effect and soil and microbial properties under the controlled variable. Asterisks (*) indicate a significant difference (* p < 0.05, ** p < 0.01, *** p < 0.001). Abbreviations: TC, total C; TN, total N; TP, total phosphorus; DOC, dissolved organic C; MN, mineral N; AP, available phosphorus; MBC, microbial biomass C; MBN, microbial biomass N; MBP, microbial biomass phosphorus; C-related hydrolases, the sum values of β-1,4-glucosidase and cellobiohydrolase; C-related oxidases, the sum values of phenol oxidase and peroxidase; NAG, β-N-acetylglucosaminosidase; ACP, acid phosphatase; GP, Gram-positive bacteria; GN, Gram-negative bacteria.
Forests 14 01207 g005
Figure 6. Co-occurrence networks of bacteria (a) and fungi (b) in response to cumulative priming effect (PE). Network diagram with nodes (OTUs) colored by each of the major ecological modules within co-occurrence networks of bacterial and fungal community, respectively. Mixed linear model regression analyses were used to assess to what extent the bacterial and fungal dominant modules explain variance in PE under different N-addition treatments (cf) or C-addition modes (g,h), whereby variance of one treatment was eliminated by selecting the N- or C-addition treatment as a random factor. Abbreviations: S, single C-addition; R, repeated C-additions; CT, control; LN, low-level N-addition; HN, high-level N-addition. p values represent significant levels; R2 represents the proportion of total variance explained for the dependent variable of cumulative PE.
Forests 14 01207 g006
Figure 7. The proportions of (a) dominant phyla, (b) order, and (c) genus in key bacterial and fungal assemblies. B_Mod#1 and B_Mod#3 were the key bacterial modu1es; F_Mod#1, F_Mod#4, and F_Mod#5 were the key fungal modu1es.
Forests 14 01207 g007
Figure 8. Co-occurrence network patterns of bacterial and fungal communities under different treatments. (ac) and (df) indicate co-occurrence network of bacterial and fungal communities under different N- and C-addition treatments (n = 12 for each network), respectively. A connection indicates a strong and significant correlation. The red lines represent positive correlations, whereas blue lines represent negative correlations. The node size represents the degree of OTUs. Abbreviations: avgCC, average clustering coefficient.
Forests 14 01207 g008
Table 1. Effects of long-term N-addition and C-addition modes on chemical properties of soil after a 90-day incubation period. Two-way analysis of variance (ANOVA) was used to determine the effect of N-addition, C-addition mode, and the interaction (N × C) between N- and C-addition treatments. Asterisks (*) indicate a significant difference (* p < 0.05, ** p < 0.01, *** p < 0.001, ns. p > 0.05). Multiple comparisons were followed by Tukey’s post hoc test. Different lower-case and upper-case letters indicate significant differences among N- and C-addition treatments, respectively. Abbreviations: C0, no C-addition; CS, single C-addition; CR, repeated C-additions, CT, control; LN, low-level N-addition; HN, high-level N-addition; TC, total C; TN, total N; TP, total phosphorus; DOC, dissolved organic C; MN, mineral N; AP, available phosphorus.
Soil PropertyC0CSCRTwo-Way ANOVA AnalysisAmong Group
CTLNHNCTLNHNCTLNHNNCN × CC0CSCR
pH3.31 a3.25 b3.24 b3.33 a3.30 a3.26 b3.32 a3.26 b3.20 c*******BAB
TC (g kg−1)51.02 b55.52 a52.74 b51.36 b55.49 a52.18 b57.0052.9253.37*ns.***AAA
TN (g kg−1)3.85 c4.98 a4.31 b3.68 c4.96 a4.58 b3.97 c4.22 b4.74 a***ns.***AAA
TP (g kg−1)0.910.800.810.890.790.820.880.820.84ns.ns.ns.AAA
DOC (mg kg−1)48.2245.1350.4843.91 b51.70 a54.90 a45.41 c50.57 b56.45 a***ns.ns.AAA
MN (mg kg−1)227.65 a178.70 b260.44 a208.72 b176.32 b236.10 a203.47 b169.85 b232.28 a****ns.ABB
AP (mg kg−1)5.22 a2.70 b2.50 b4.43 a1.95 b2.60 b3.49 a2.19 b2.20 b******ABB
Disclaimer/Publisher’s Note: The statements, opinions and data contained in all publications are solely those of the individual author(s) and contributor(s) and not of MDPI and/or the editor(s). MDPI and/or the editor(s) disclaim responsibility for any injury to people or property resulting from any ideas, methods, instructions or products referred to in the content.

