Article

Comparative Transcriptome Analysis Reveals Key Genes and Pathways Associated with Phosphate-Sensitive Behaviors in Cunninghamia lanceolata (Lamb.) Hook.

1
Key Laboratory of Forestry Genetics & Biotechnology of Ministry of Education, Co-Innovotion Center for the Sustainable Forestry in Southern China, Nanjing Forestry University, Nanjing 210037, China
2
Guangdong Provincial Key Laboratory of Silviculture, Protection and Utilization, Guangdong Academy of Forestry, Guangzhou 510520, China
*
Authors to whom correspondence should be addressed.
Forests 2023, 14(6), 1203; https://doi.org/10.3390/f14061203
Submission received: 4 May 2023 / Revised: 30 May 2023 / Accepted: 8 June 2023 / Published: 10 June 2023
(This article belongs to the Special Issue Abiotic Stress in Tree Species)

Abstract

:
Cunninghamia lanceolate (Lamb.) Hook. (Chinese fir) is one of the most important wood-producing species, supplying ~20% of commercial timber by plantations in China. However, the genetic potential of the bred variety is limited by soil degrading in the long term and requiring continuous replanting, and especially the shortage and supply of active and efficient phosphorus. Recently, great attention has been paid to the genotypic variation in phosphorus conversion and utilization efficiency by tree breeders. In this study, the morphological characteristics were used to evaluate the Chinese fir clonal Pi-efficiency stress. A Pi-tolerant clone and a Pi-sensitive clone were selected for RNA sequencing, respectively. In addition, gene function annotation and weighted correlation network analysis (WGCNA) were performed. A total of 60 hub genes were selected, combining phosphate accumulation under Pi-deficiency stress. We also used RNA-seq data to analyze the differences in the response of Pi-sensitive clones and Pi-tolerant clones to Pi-deficiency stress, and real-time quantitative polymerase chain reaction (RT-PCR) analyses were used to test the validity of transcriptome data. The present study provided new insights into the molecular mechanisms of Pi-efficient utilization in Chinese fir clones.

1. Introduction

Phosphorus (P) is an essential macronutrient for plants. It is the main structural component of nucleic acids, phospholipids, and other biomolecules, and also participates in many cellular activities such as energy transfer, metabolic regulation, protein activation, and so on [1,2]. Generally, plants take up P in orthophosphate (Pi) forms as H2HPO4 and HPO42− [3]. Due to the adsorption by soil particles, precipitation, or transformation into organic forms, Pi availability is often limited [1]. Strikingly, plants have evolved a range of morphological, physiological, and biochemical adaptation mechanisms (e.g., alteration of root architecture, interaction with symbiotic mycorrhizal fungi, secretion of organic acid anions, increased expression of phosphorus transporters, and changes in metabolic processes) to enhance the acquisition of Pi [4,5,6]. Because of soil phosphorus enrichment and water pollution caused by traditional fertilization methods, as well as the non-renewable nature of phosphorus resources, it has become one of the hot spots of global research to study the mechanism of high-efficiency absorption Pi of plants to excavate the genotype of high-efficiency Pi utilization [4,5,6,7,8,9]. Numerous studies on crops and trees, such as Zea mays (maize) [10], Lycopersicon esculentum (tomato) [11], Camellia oleifera [12], and Pinus massoniana [13], have shown that there are significant genotypic differences in the uptake, transport, and utilization efficiency of soil phosphorus among different species or different varieties of the same species. Therefore, using the genetic difference among species or varieties, strengthening the genetic improvement of nutrient utilization efficiency based on Pi efficiency, and increasing the bio-availability of Pi in soil may be effective ways to solve the deficiency of Pi in soil and improve the productivity of plants.
Cunninghamia lanceolata (Lamb.) Hook. (Chinese fir) is one of the most important commercial timber and afforestation species in southern China [14]. However, the low level of active Pi in the acidic soil of southern forest lands and continuous replanting on the same sites are important factors to restrict the long-term productivity of Chinese fir plantations [9]. Previous studies have shown that Pi-deficiency stress had a significant influence on biomass accumulation and distribution pattern, root system architecture, acid phosphatase activity, endogenous hormone content, and protein expression in Chinese fir [9,15,16,17]. However, the molecular mechanism of response to Pi-deficiency stress remains unclear. To understand the molecular process of the response and adaptation of Chinese fir to a Pi-deficient environment, we investigated the morphological and nutrient responses of seven elite Chinese fir clones to identify the Pi-tolerant and Pi-sensitive clones and to characterize the Pi-deficiency-responsive genes by Illumina RNA-Seq high-throughput sequencing.

2. Materials and Methods

2.1. Plant Materials and Pi Treatment

Seven elite Chinese fir clones with different genetic backgrounds were selected as plant materials (Table S1). They were multiple-propagated into clonal lines by tissue culture, using the plantlets (sprouts) collected from hedged ramets of the cuttings orchard. The regenerated plants were transplanted in containers of 10 cm in size (Height, H) × 8 cm (Bottom Diameter, BD) for 6 months for root system development, and then were transferred into pots (15.5 cm H × 10.5 cm BD) with red soil nursery substrate (pH value 5.4, alkali hydrolyzed nitrogen 52.7 mg kg−1, available phosphorus 0.5 mg kg−1, potassium 174.2 mg kg−1, cation exchange capacity 6.7 cmol kg−1, and soil acid phosphatase (P2O5) 6.6 mg·kg−1) in a plastic shed with 80% shading at 25–30 °C under natural daylight conditions. After 10 days of water irrigating only, the plantlets were subjected to the Pi supply assays.
Treatments with a supply of sufficient Pi (+P) on plantlets were achieved by irrigation with modified Hoagland nutrient solution (945 mg L−1 Ca(NO3)2·4H2O, 506 mg L−1 KNO3, 80 mg L−1 NH4NO3, 136 mg L−1 KH2PO4, 493 mg L−1 MgSO4·7H2O, 5560 mg L−1 FeSO4.7H2O, 7460 mg L−1 EDTA-Na2, 0.83 mg L−1 KI, 6.20 mg L−1 H3BO3, 22.30 mg L−1 MnSO4·H2O, 8.60 mg L−1 ZnSO4·7H2O, 0.25 mg L−1 Na2MoSO4·2H2O, 0.025 mg L−1 CuSO4·5H2O, and 0.025 mg L−1 CoCl2·6H2O; pH 5.8) [18]. While the Pi-deficiency stress (−P) plantlets were treated identically, except that the nutrient solutions contained 74.5 mg L−1 KCl instead of 136 mg L−1 KH2PO4. The plantlets of −P and +P were randomly arranged in groups, and 3 replications were performed with 30 plantlets per replication. Each pot containing one plantlet was irrigated with 30 mL of nutrient solution once every 5 days. During the experiment, no other fertilizer was applied, and all other management processing was consistent between −P and +P treatments. An entire plantlet was to be harvested after 3 months of treatment. Three biological replications of each plant sample per treatment were used to analyze the response on morphological, nutrient, and physiological traits.
Based on the results of potting, the Pi-tolerant clone and Pi-sensitive clone were selected for the next experiment. The regenerated plantlets were carefully washed when the new roots reached 2 cm in length and were transplanted into the nursery box with quartz sand. Before transplanting, the quartz sand was acidified with hydrochloric acid and washed with deionized water. The volume of each planting hole of the nursery box was 130 cm3. One hundred and twenty plants both for Pi-tolerant and Pi-sensitive clones were planted. Plantlets were maintained in an incubator at 25 °C with a 16 h photoperiod (120 μmol photons m−2 s−1). From the second day after transplanting, the plantlets were watered once every 3 days with +P or −P nutrient solutions. Root samples of treated plantlet were separately collected after 0 (the Check), 3, 6, 12, and 24 h as well as 5 and 15 daysays. The collected root samples were washed immediately with deionized water and frozen in liquid nitrogen and stored at −80 °C for RNA preparation. In addition, an entire plantlet was sampled to measure the total P content. Three biological replications were performed for each root or plant sample per condition.

2.2. Morphology Traits and Nutrient Analyses

Firstly, the height and the ground-diameter above the ground of the plantlets were measured after pot planting for 3 months; the whole plant was then dug out, and the roots were sequentially washed with clean water and then deionized water. Ten fully developed needle leaves were collected from each sampled plant at the middle of the stem, and 30 needle leaves were collected for the three biological replicates in total. Roots and needle leaf samples were scanned by an Expression 11000XL (EPSON) and analyzed by Win RHI20 (EPSON) (roots) and LA-S (Wanshen Testing Technology Co., Ltd., Hangzhou, China) (leaf analysis system). Secondly, the samples were dried at 105 °C for 30 min and then at 70 °C to a constant mass, and the dry matter mass of roots, stems, and needle leaves of each plant was weighed. Lastly, the total contents of nitrogen (N) and phosphorus (P) were measured by a spectrophotometer UV-755B (Precision Scientific Instrument Co., Ltd., Shanghai, China), and the contents of potassium (K), calcium (Ca), and magnesium (Mg) were obtained using an atomic absorption spectrophotometer Z-2300 (HITACHI) based on the methods compiled by the Society of Soil Science of China [19]. The calculation formula of membership function value was obtained from Fan’s study [20].

2.3. Total RNA Extraction, Library Construction, and RNA-Seq

Total RNA was extracted from Chinese fir samples using a Pure polyphenol plant total RNA Extraction Kit (Tian Gen Biochemical Technology Co., Ltd., Beijing, China). RNA degradation and contamination were monitored on 1% agarose gels. RNA purity was checked using a NanoPhotometer® spectrophotometer (IMPLEN, Calabasas, CA, USA), and the concentration of RNA was measured with a Qubit® RNA Assay Kit in a Qubit®2.0 Fluorometer (Life Technologies, Carlsbad, CA, USA). RNA integrity was assessed using an RNA Nano 6000 Assay Kit of an Agilent Bioanalyzer 2100 system (Agilent Technologies, Santa Clara, CA, USA). The mRNA-seq library was constructed using Illumina’s TruSeq RNA Sample Preparation Kit (Illumina Inc., San Diego, CA, USA). The poly-A mRNA was enriched using oligo (dT) magnetic beads, and the mRNA was broken into fragments in a fragmentation buffer. Using mRNA as a template, the first cDNA chain was synthesized using a six-base random primer (Random hexamers). Then, the second cDNA chains were synthesized by adding buffer, dNTPs, RNase H, and DNA polymerase I. AMPure XP beads were used to purify cDNA and double-stranded cDNA and then repaired by the terminal, plus A tail and joined the sequencing connector. Then AMPure XP beads were used to segment the size, and, finally, the cDNA library was constructed by PCR enriching. The constructed library was tested for quality and yield using the Agilent Bioanalyzer 2100 system (Agilent Technologies, Santa Clara, CA, USA) and an ABI Step One Plus Real-Time PCR System (Applied Biosystems, Foster City, CA, USA). The constructed mRNA-seq library was sequenced on the Illumina HiSeqTM 2000 (Illumina, USA) sequencing platform.
For RNA-seq, the original data generated by Base Calling sequencing were transformed into the original sequence data (Raw Data) and then deposited in the NCBI Sequence Read Archive (SRA) database with the accession number PRJNA977096. For further analysis, the original sequence data were filtered by removing the connector sequence, low-quality sequences, and reads with more than 20% of bases having a Q-value <30. The sequence of clean data was assembled into contigs using Trinity software (http://trinityrnaseq.sourceforge.net/ (accessed on 8 October 2018)) [21]. The longest transcript was selected from the potential variable splicing transcripts as the unigenes sequence of the sample. Finally, the unigenes sequence was annotated with the protein databases of NR, Swiss-Prot, KEGG, COG, KOG, GO, and Pfam using BLASTX software (http://www.ncbi.nlm.nih.gov/BLAST/, e < 0.00001 (accessed on 8 October 2018)) [22]. The unigenes’ expression abundances were represented in reads per kilobase of exon model per million mapped reads (RPKM). Differential expression analysis in the treatment groups was performed using the DESeq R package (1.10.1) [23]. The differentially expressed genes (DEGs) were extracted according to differential expressions greater than two-fold (FDR < 0.01, log2 (FC) > 1 or <−1). The KEGG database was used to analyze gene products related to metabolism and gene function in cellular processes [24]. The KOBAS software was used to test the statistical enrichment of differential expression genes in the KEGG pathways [25].

2.4. Construction of Module Genes Network and HUB Genes Identification

The WGCNA R package was utilized to construct the weighted gene co-expression network and divide related modules [26]. Firstly, the 15,172 DEGs in root at each treatment time point were combined to construct the weighted gene co-expression network. The correlation matrix was then constructed using pairwise Pearson correlations among all genes. After determining soft threshold parameters, the adjacency matrix was transformed into a topological overlap matrix, and the corresponding dissimilarity (1-TOM) was calculated. The minimum number of genes in the module was set to 30, and hierarchical clustering was carried out based on the TOM measurement method. Lastly, mRNAs with similar expression spectra were divided into the same module. The module eigengene (ME) was obtained using WGCNA to indicate the expression profiles of module genes. Finally, the phenotype data were imported into the WGCNA software package to obtain correlation-based associations between phenotypes and gene modules.
Gene connectivity in each module was determined, and hub genes were identified as the genes with the highest connectivity. The global gene co-expression network was visualized with Cytoscape_v3.5.1 [27].

2.5. Quantitative Real-Time-PCR Analysis

The differentially expressed genes (DEGs) were classified according to the annotation information, and then five significantly up-regulated genes in −P treatment were randomly selected from five gene categories for qRT-PCR analysis (Table S2). The RNA extracted in the above was reversely transcribed by RevertAid First Strand cDNA Synthesis Kit (Thermo Scientific, Waltham, MA, USA) and verified by an amplification of the internal GAPDH reference gene [28]. Using GAPDH as a housekeeping gene; each qRT-PCR reaction was then carried out in a 20 μL system according to the SYBR® Select Master Mix (Applied Biosystems, Foster City, CA, USA) manufacturer’s instructions with 10 μL SYBRTM Select Master Mix, 2.0 μL reverse-transcribed cDNA (about 100 ng), 0.5 μL forward primer (10 μmol L−1), 0.5 μL reverse primer (10 μmol L−1), and 7 μL DNase/RNase-Free distilled water. Each reaction was repeated 3 times. The relative expression was calculated with 2−ΔΔCT.

3. Results

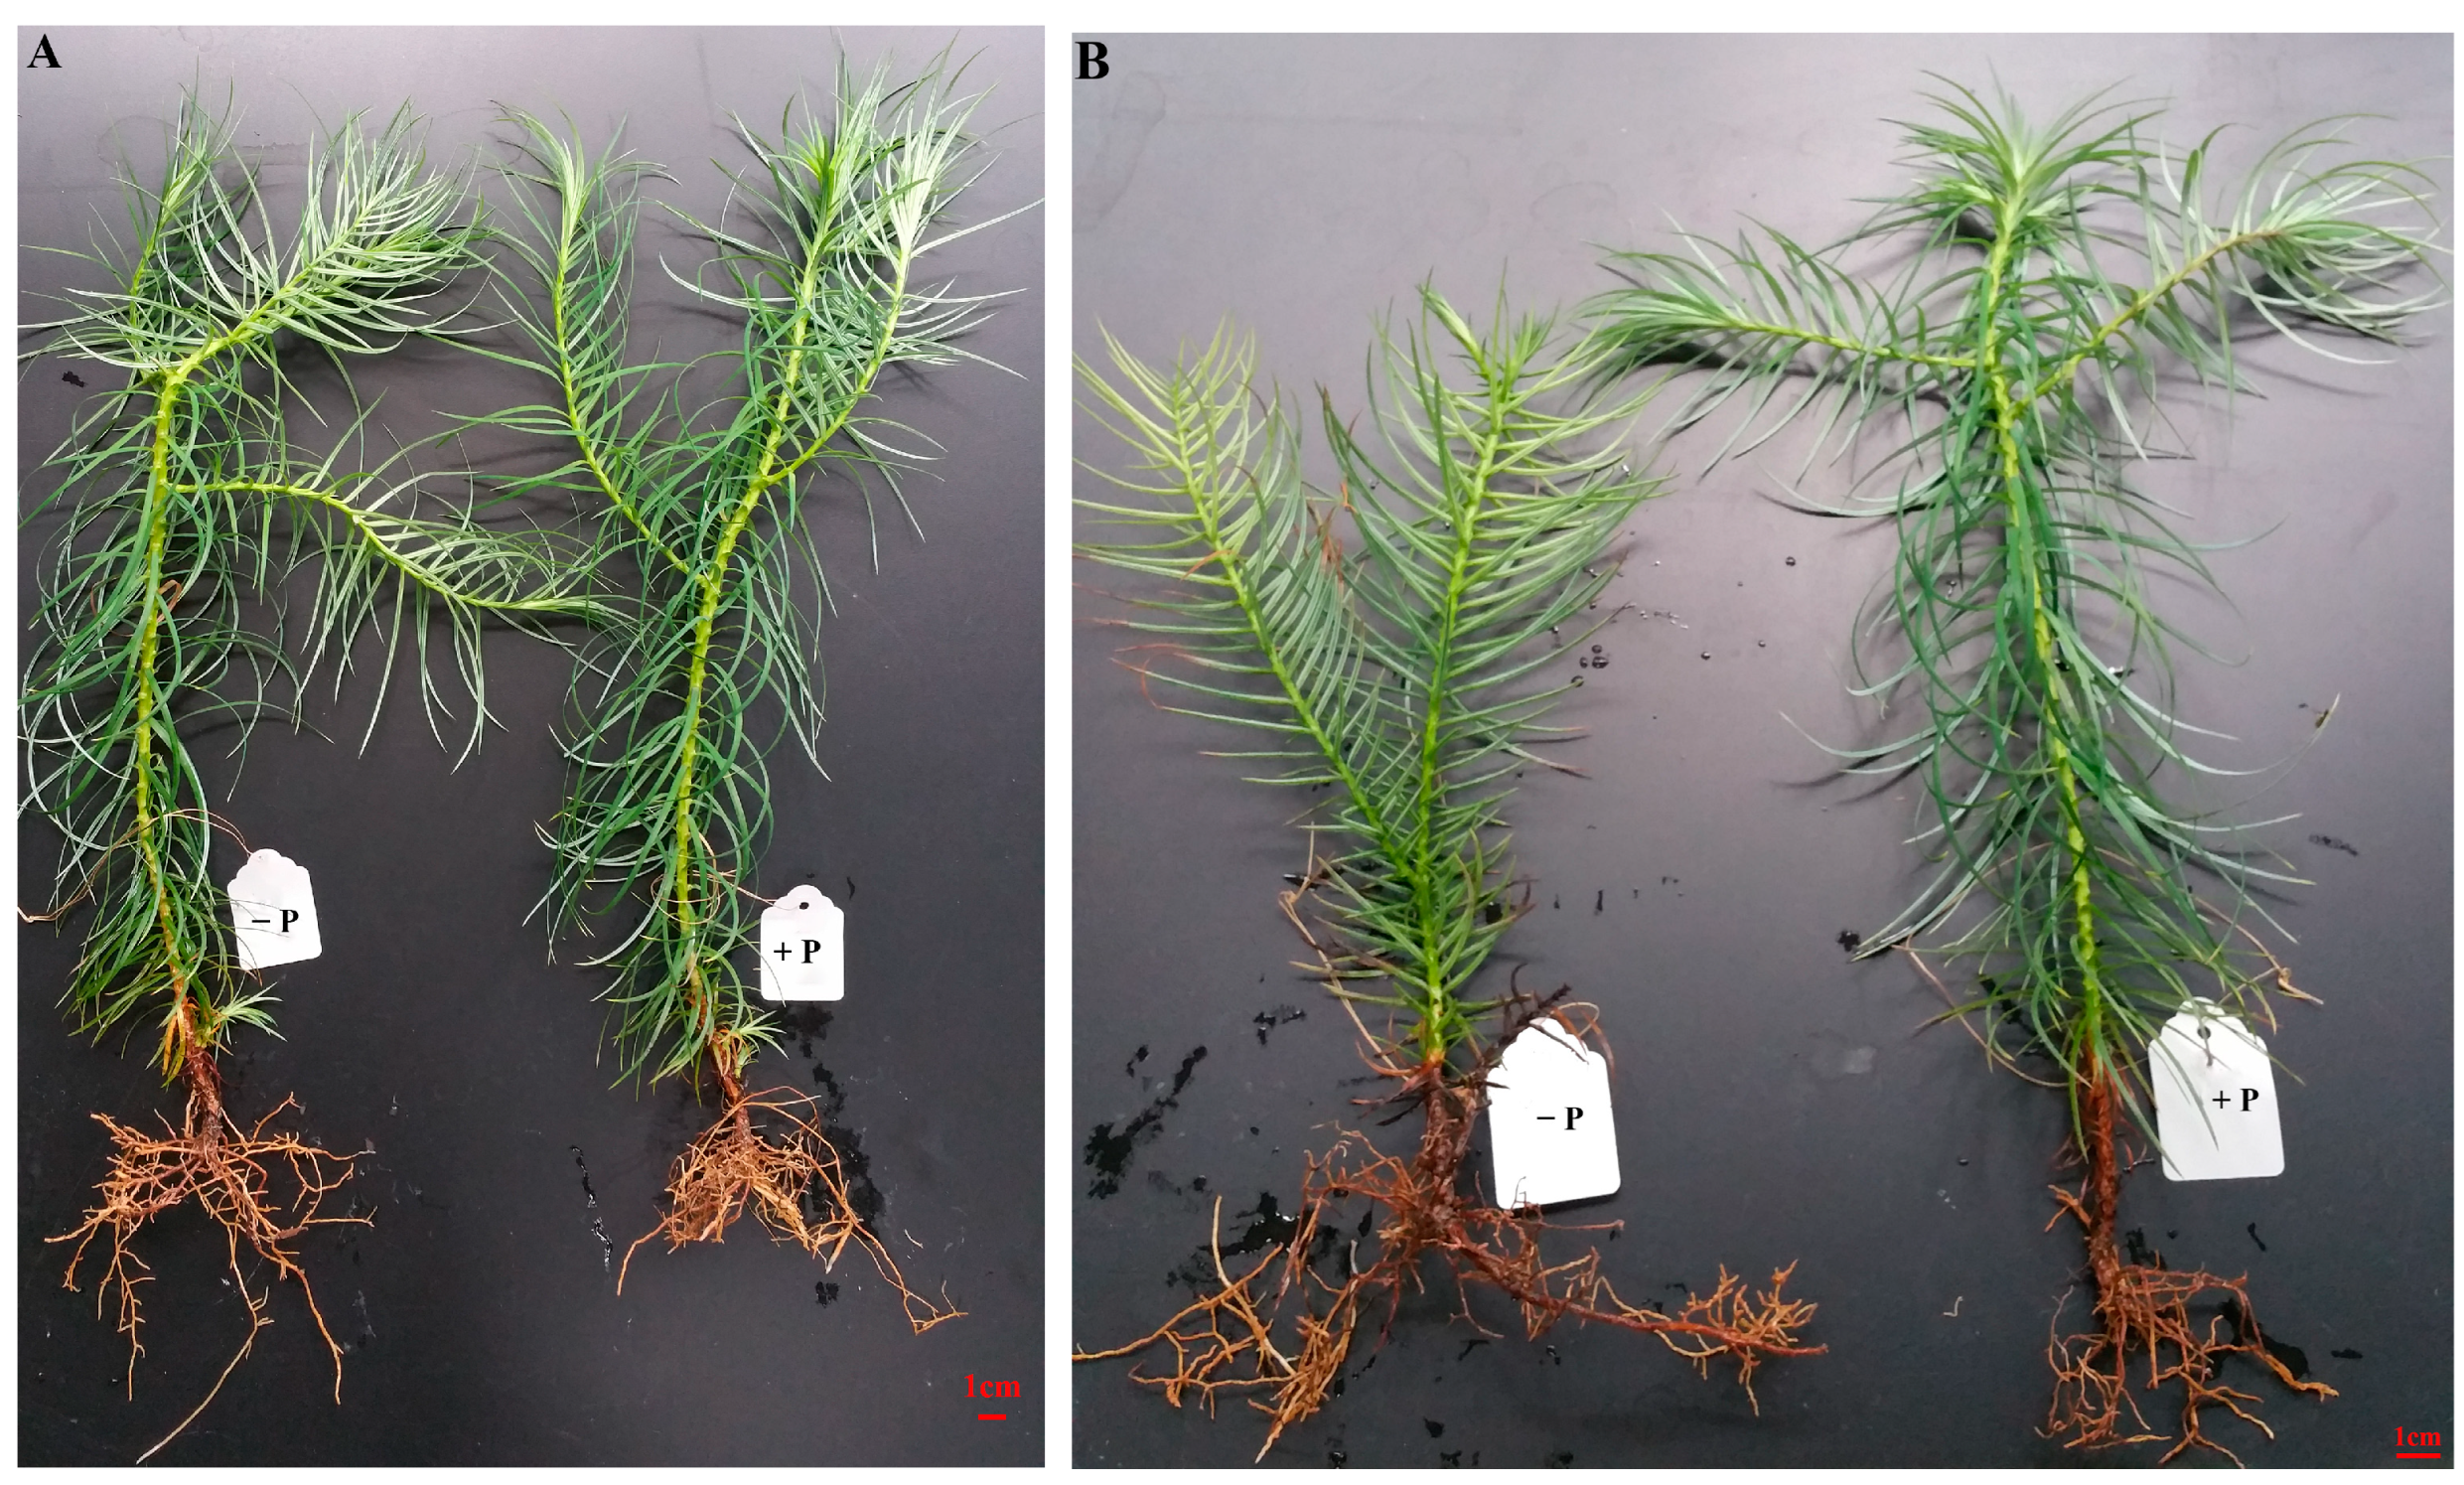
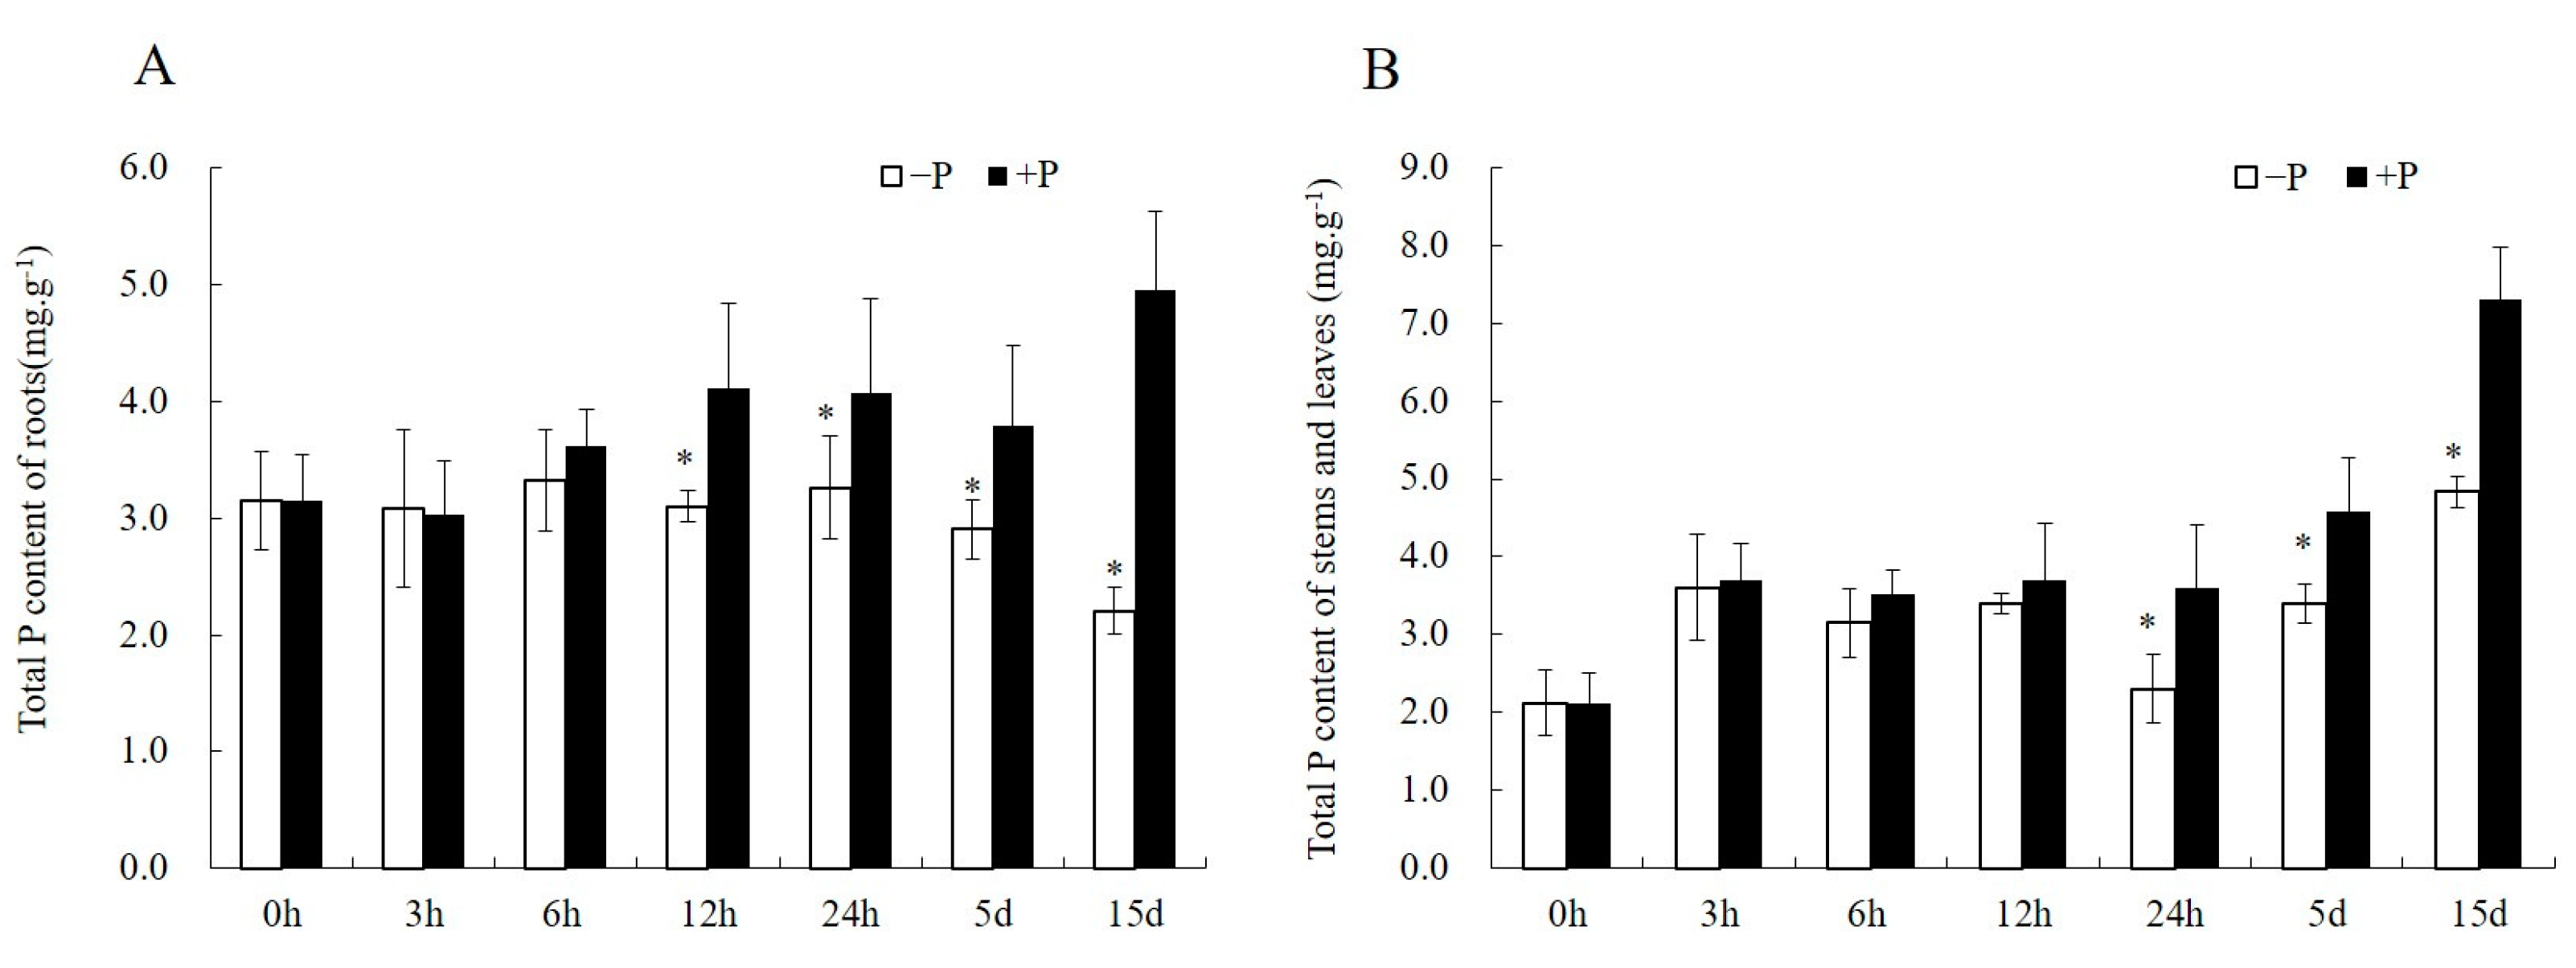
3.1. Evaluation of Clones with Different Phosphorus Efficiency Based on Morphological Changes during Pi-Deficiency Stress

The morphological characteristics, including plant height and ground-diameter above the ground, dry matter accumulation (Figure S1), root and needle morphology parameters (Figures S2 and S3), and nutrient contents (Figure S4) showed differences (p < 0.05) among clones (Table 1). Twenty morphological and nutrient traits of seven clones were selected in principal component analysis by their relative values (−P/+P). The obtained results indicated that the first three principal components explained 89.51% of the total variance (Table S3), and the root morphology was an important indicator reflecting the response of Chinese fir clones to Pi-deficiency stress. Twenty morphological and nutrient traits were also used to calculate membership function values (Table S4) and the Pi efficiency of the tested Chinese fir clones was ranked. The clone C4 had the highest score and did not show obvious abnormal morphological characteristics under Pi-deficiency stress for 3 months (Figures S1–S4). Therefore, clone C4 was selected as the Pi-tolerant clone in this study. In contrast, clone C5 had the lowest score, with the shorter plants, but a larger root system under Pi-deficiency stress than that of +P plants (Figures S1–S4); hence, C5 was identified as a Pi-sensitive clone (Figure 1).

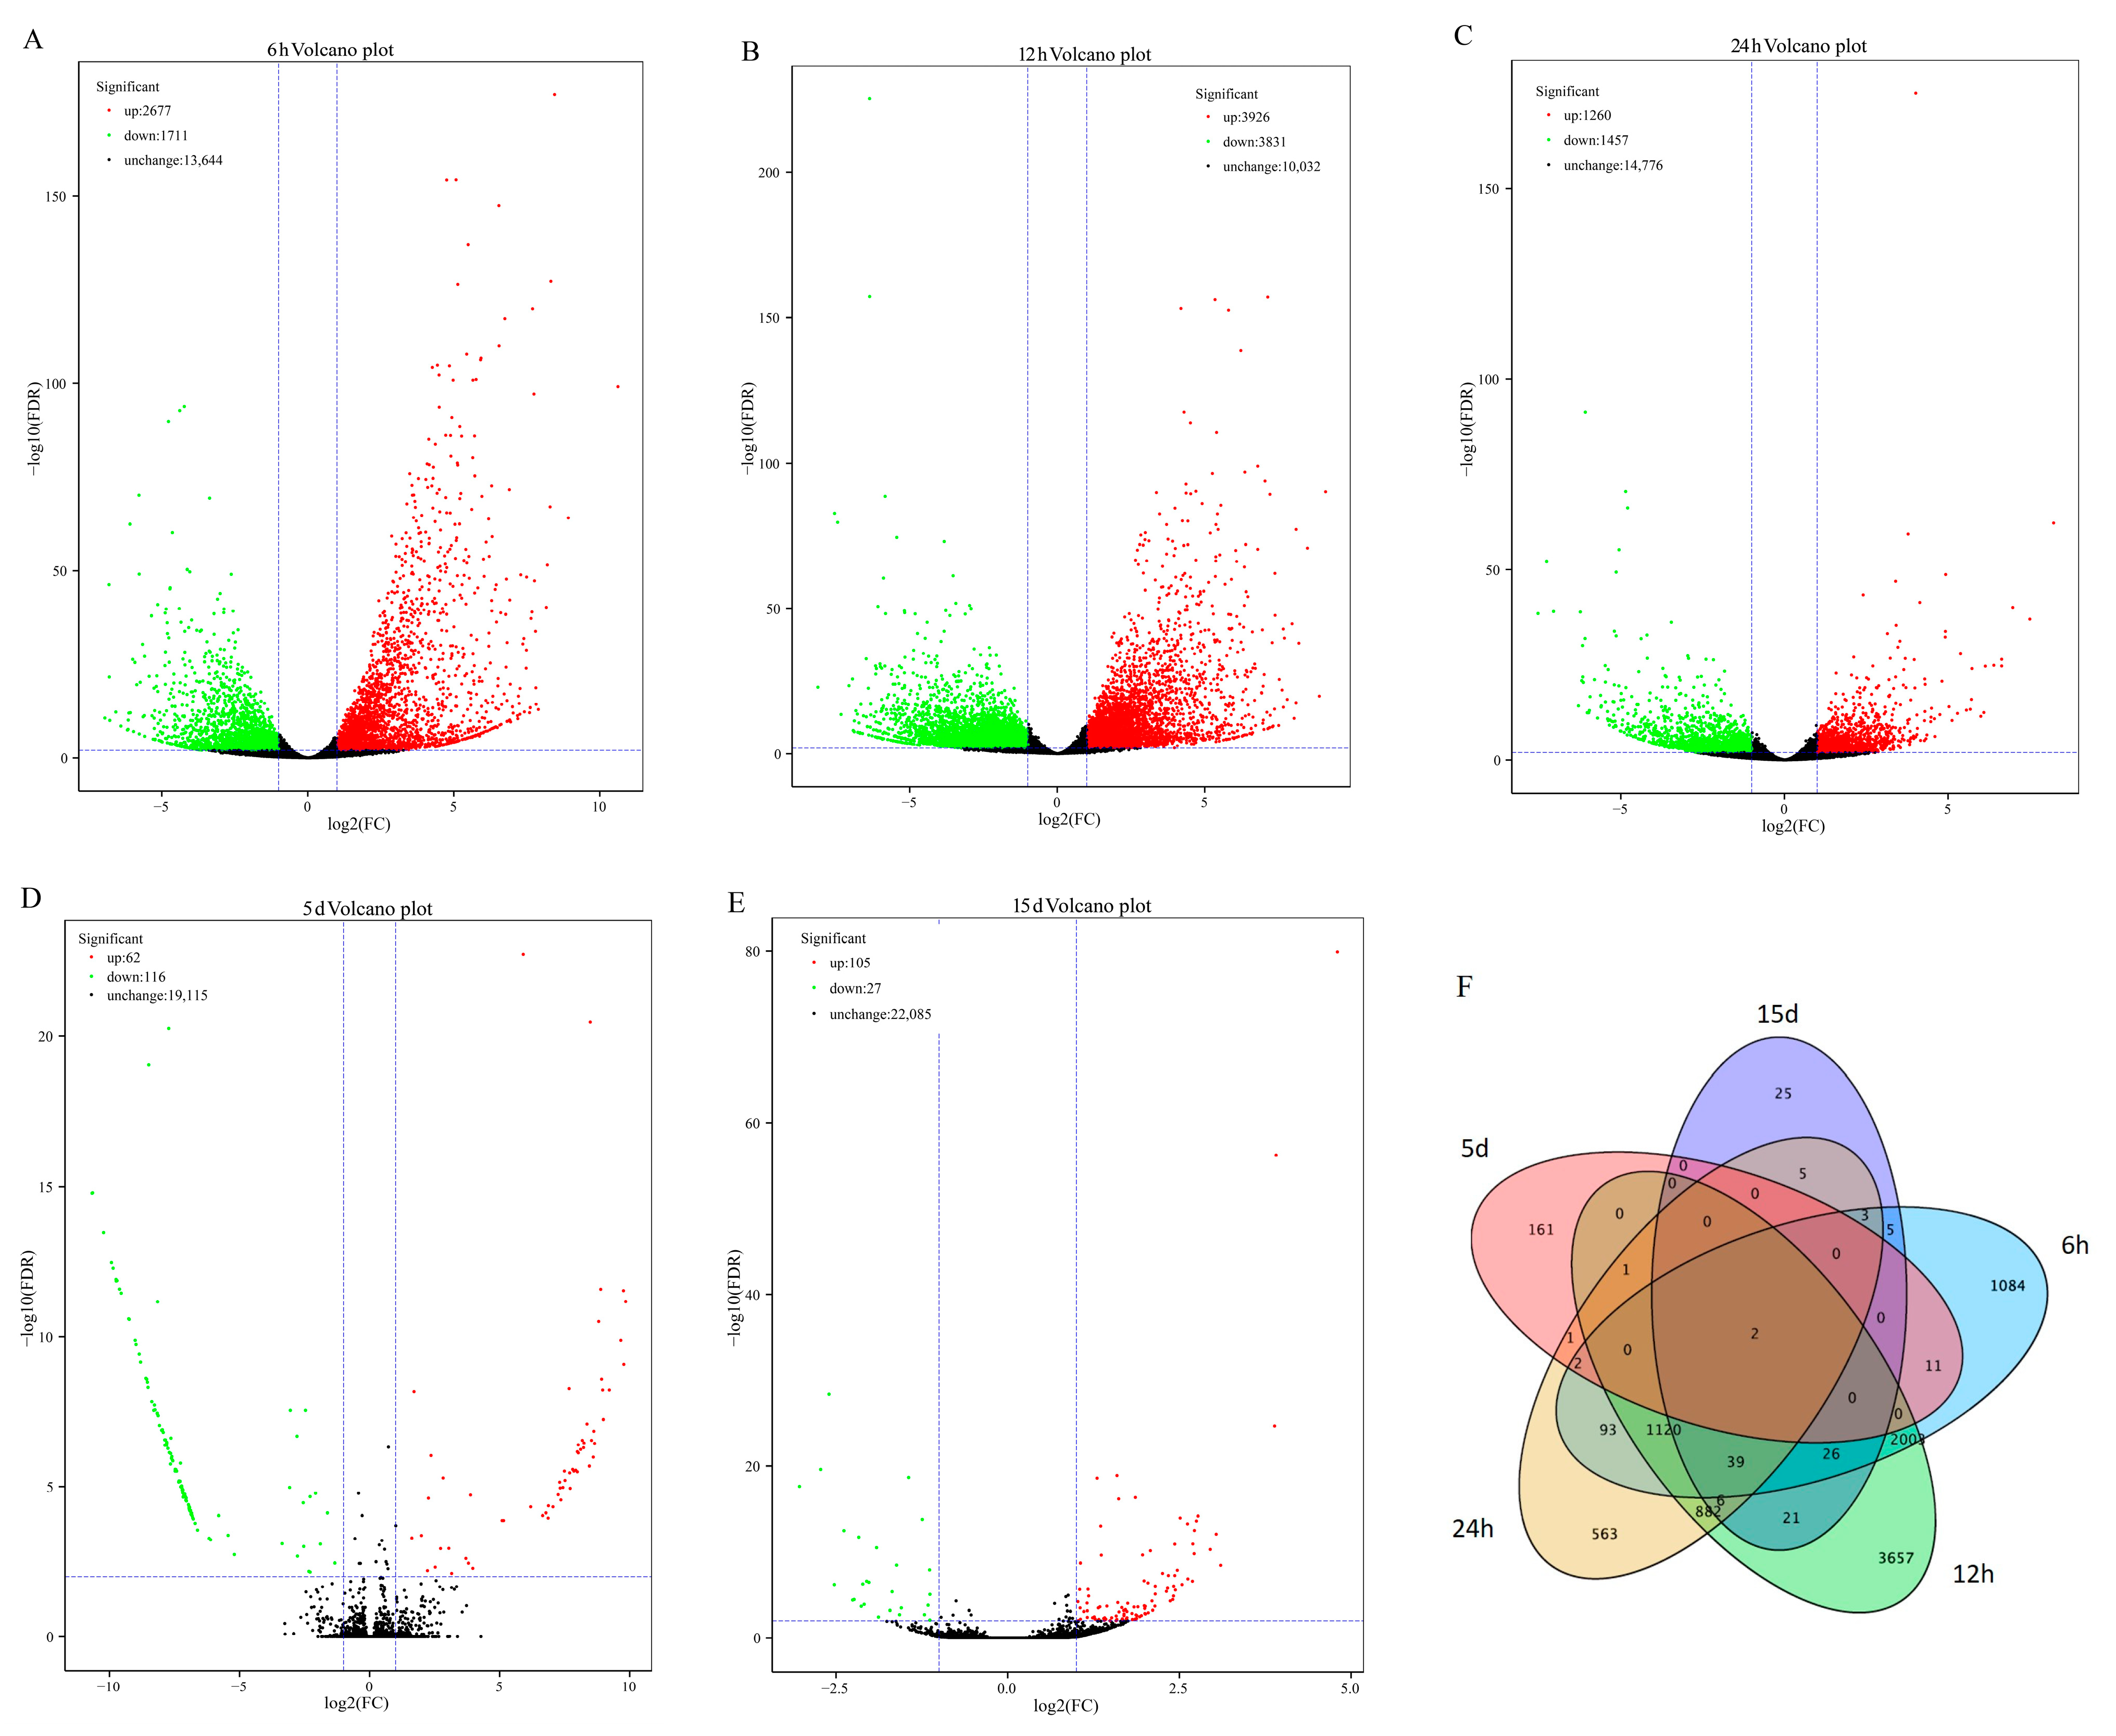
3.2. Global Profiling and Functional Annotation of the Pi-Responsive Genes in Pi-Sensitive Clones

A more detailed observation on Pi-deficiency stress was made of Pi-sensitive clones because their perception and adaptive changes to the external Pi concentration were easier to observe than Pi-tolerant clones. There was a difference in total P content between −P and +P plantlets after 6 h of Pi-deficiency stress (Figure 2), and the difference reached a significant level at 12 h of Pi-deficiency stress in roots (Figure 2A). The content of total P in stems and leaves also showed a similar trend (Figure 2B). Therefore, we inferred that the Pi-deficiency stress in this experiment was effective.
The root tissues from 0 (Check), 6, 12, and 24 h as well as 5 and 15 days of treatment were selected for RNA-seq. Collectively, a total of 239.48 Gb clean data was obtained by RNA-seq of 33 root tissues, yielding 184,068 transcripts and 91,088 unigenes after assembly, with N50 of 2437 nt and 2144 nt, respectively. There were 36,077 unigenes with lengths over 1 kb. The percentage of clean reads mapped to +P and −P were, respectively, 76.30% and 75.94% when the transcript and unigenes libraries were compared. BLASTX alignment was conducted between unigenes and the Nr, Swiss-Prot, GO, COG, KOG, eggNOG4.5, and KEGG protein databases, 50,809 annotated unigenes were obtained, out of which 48,160 were annotated in the Nr database and 6532 were homologous to the Picea sitchensis genes (Figure S5).
In total, 15,172 DEGs were identified by pairwise comparison of samples (+P_vs._ −P) at the five treatment times, including 8030 up-regulated and 7142 down-regulated genes (Figure 3A–E). The number of DEGs showed a significant decrease with the increase in treatment time. The largest number of DEGs emerged at 12 h (accounting for 51.13%), followed by 6 h (accounting for 28.92%). In addition, only two DEGs were detected in all five compared pairs (Figure 3F). DEGs were further classified using GO enrichment-based cluster analysis to provide potential clues concerning the molecular events related to their functional roles during Pi-deficiency stress (Table S5). For five treatment time points, DEGs associated with the metabolic process, cellular process, single-organism process, and response to stimulus were representative in the biological process category, catalytic activity, and binding as the predominant classifications in the molecular function category, and the most assigned classification was cell and cell parts in the cellular component category. The KEGG enrichment analysis of these DEGs showed that the pathways with the majority of entries mapped in all treatment analyses included phenylpropanoid biosynthesis and phenylalanine metabolism (Table S6). Other important pathways involving plant hormone signal transduction, starch and sucrose metabolism, terpenoid backbone biosynthesis, and diterpenoid biosynthesis, but were only found in +P_vs._ −P pairwise comparisons of 6, 12, and 24 h of treatment.

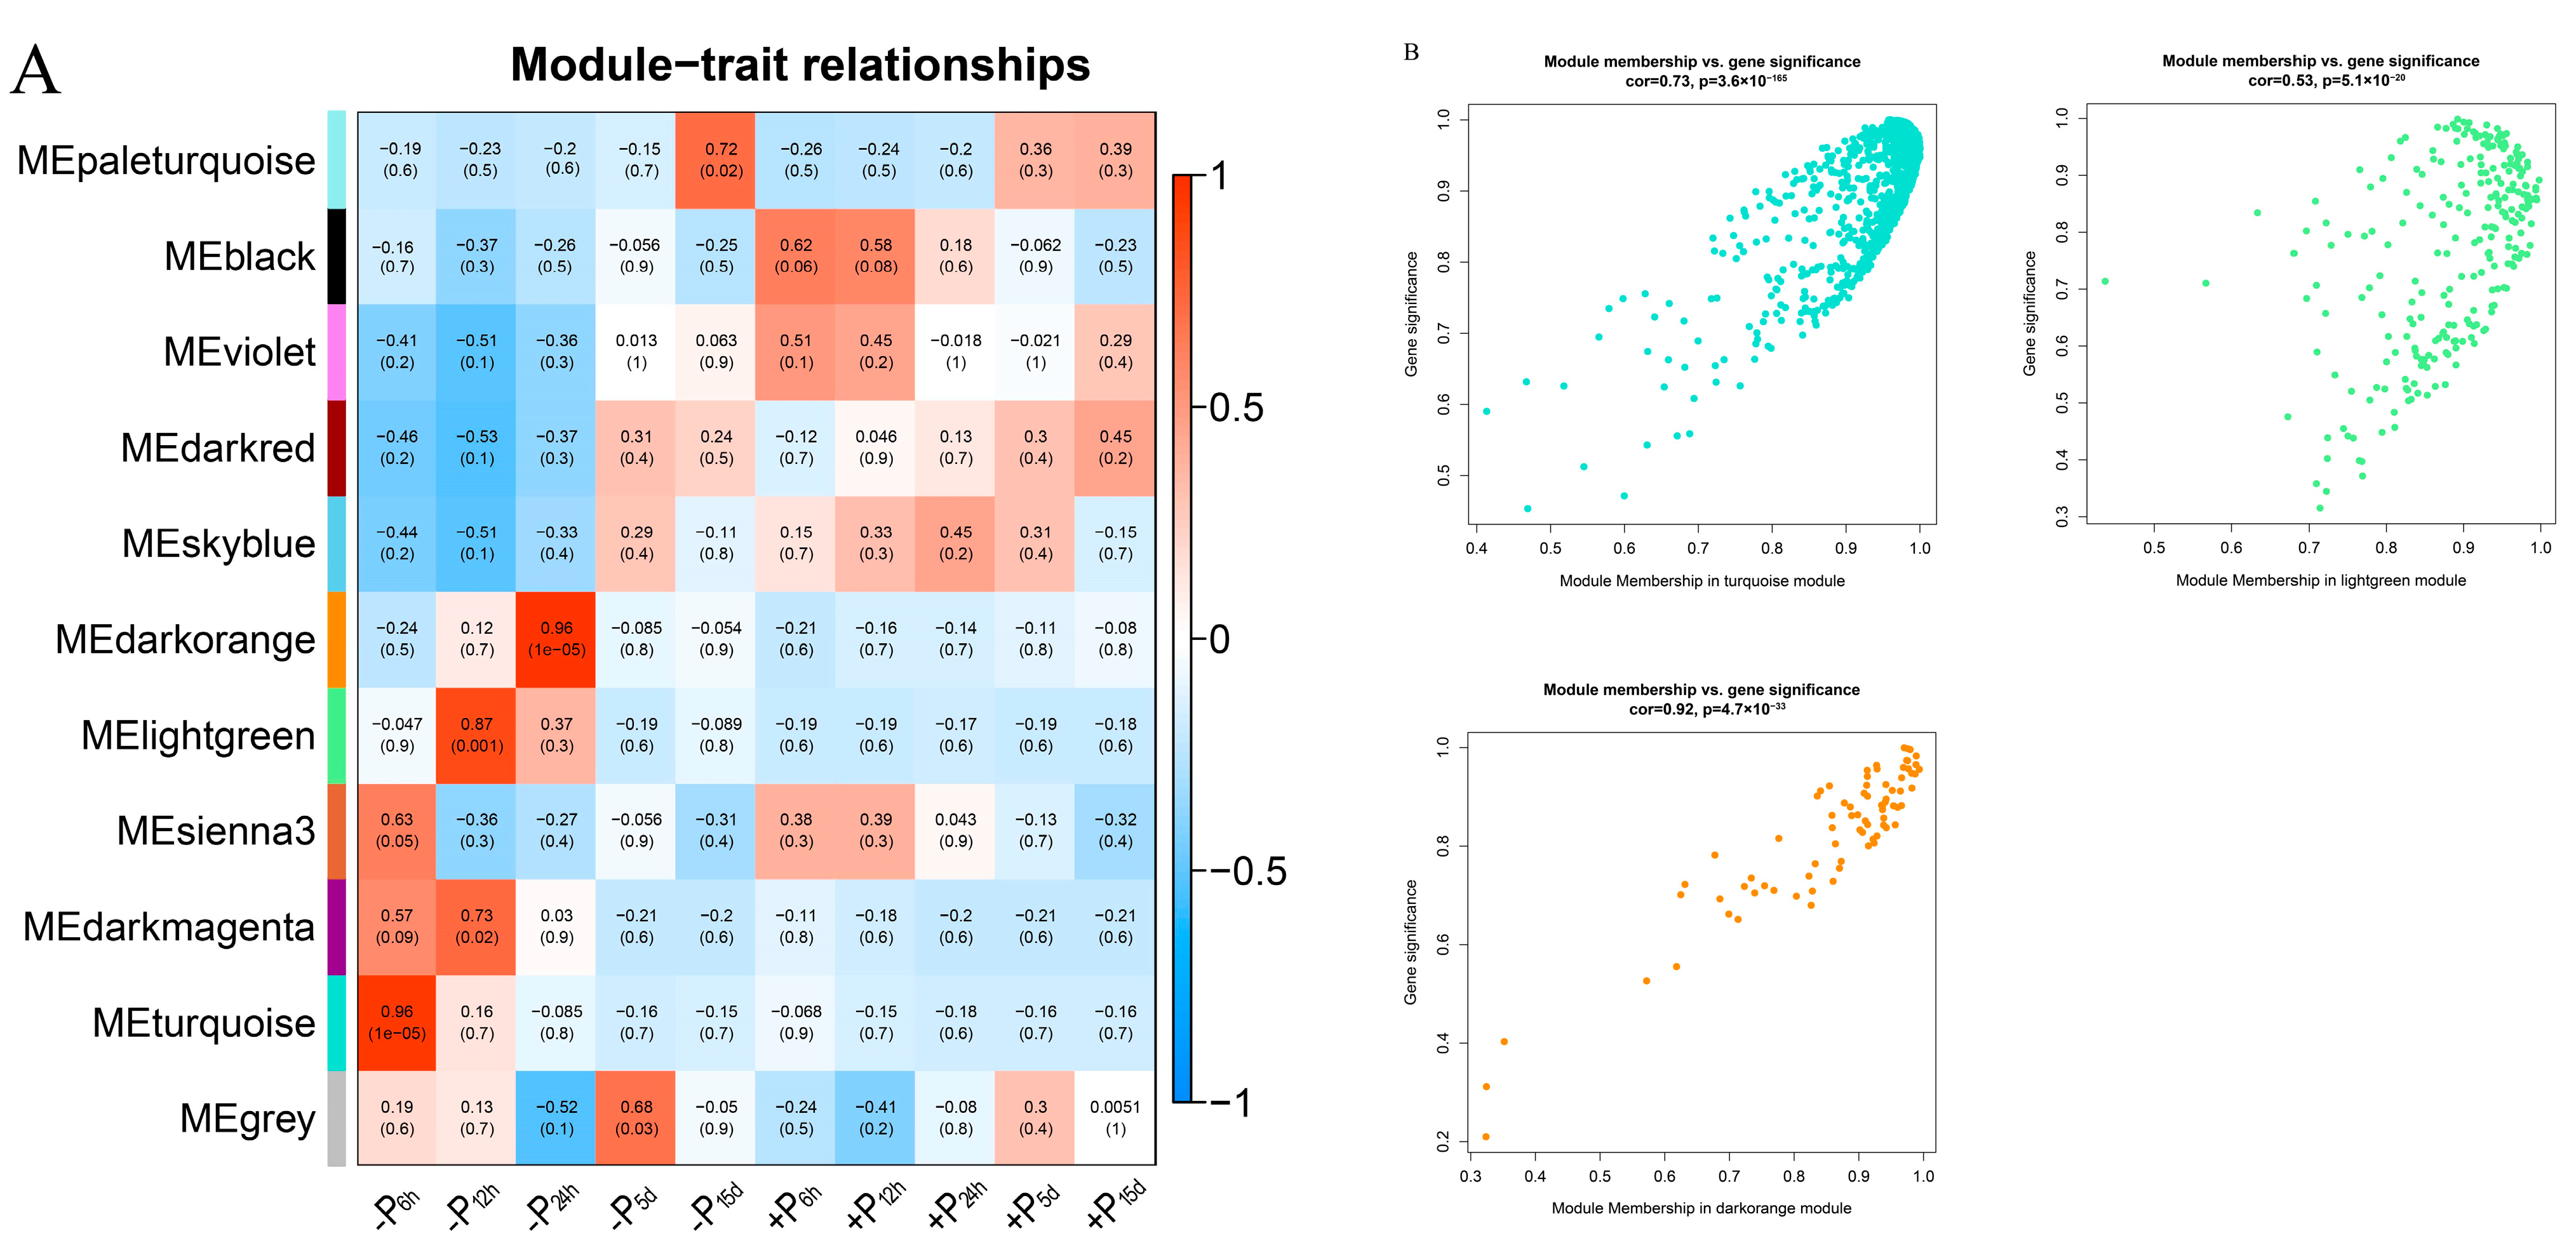
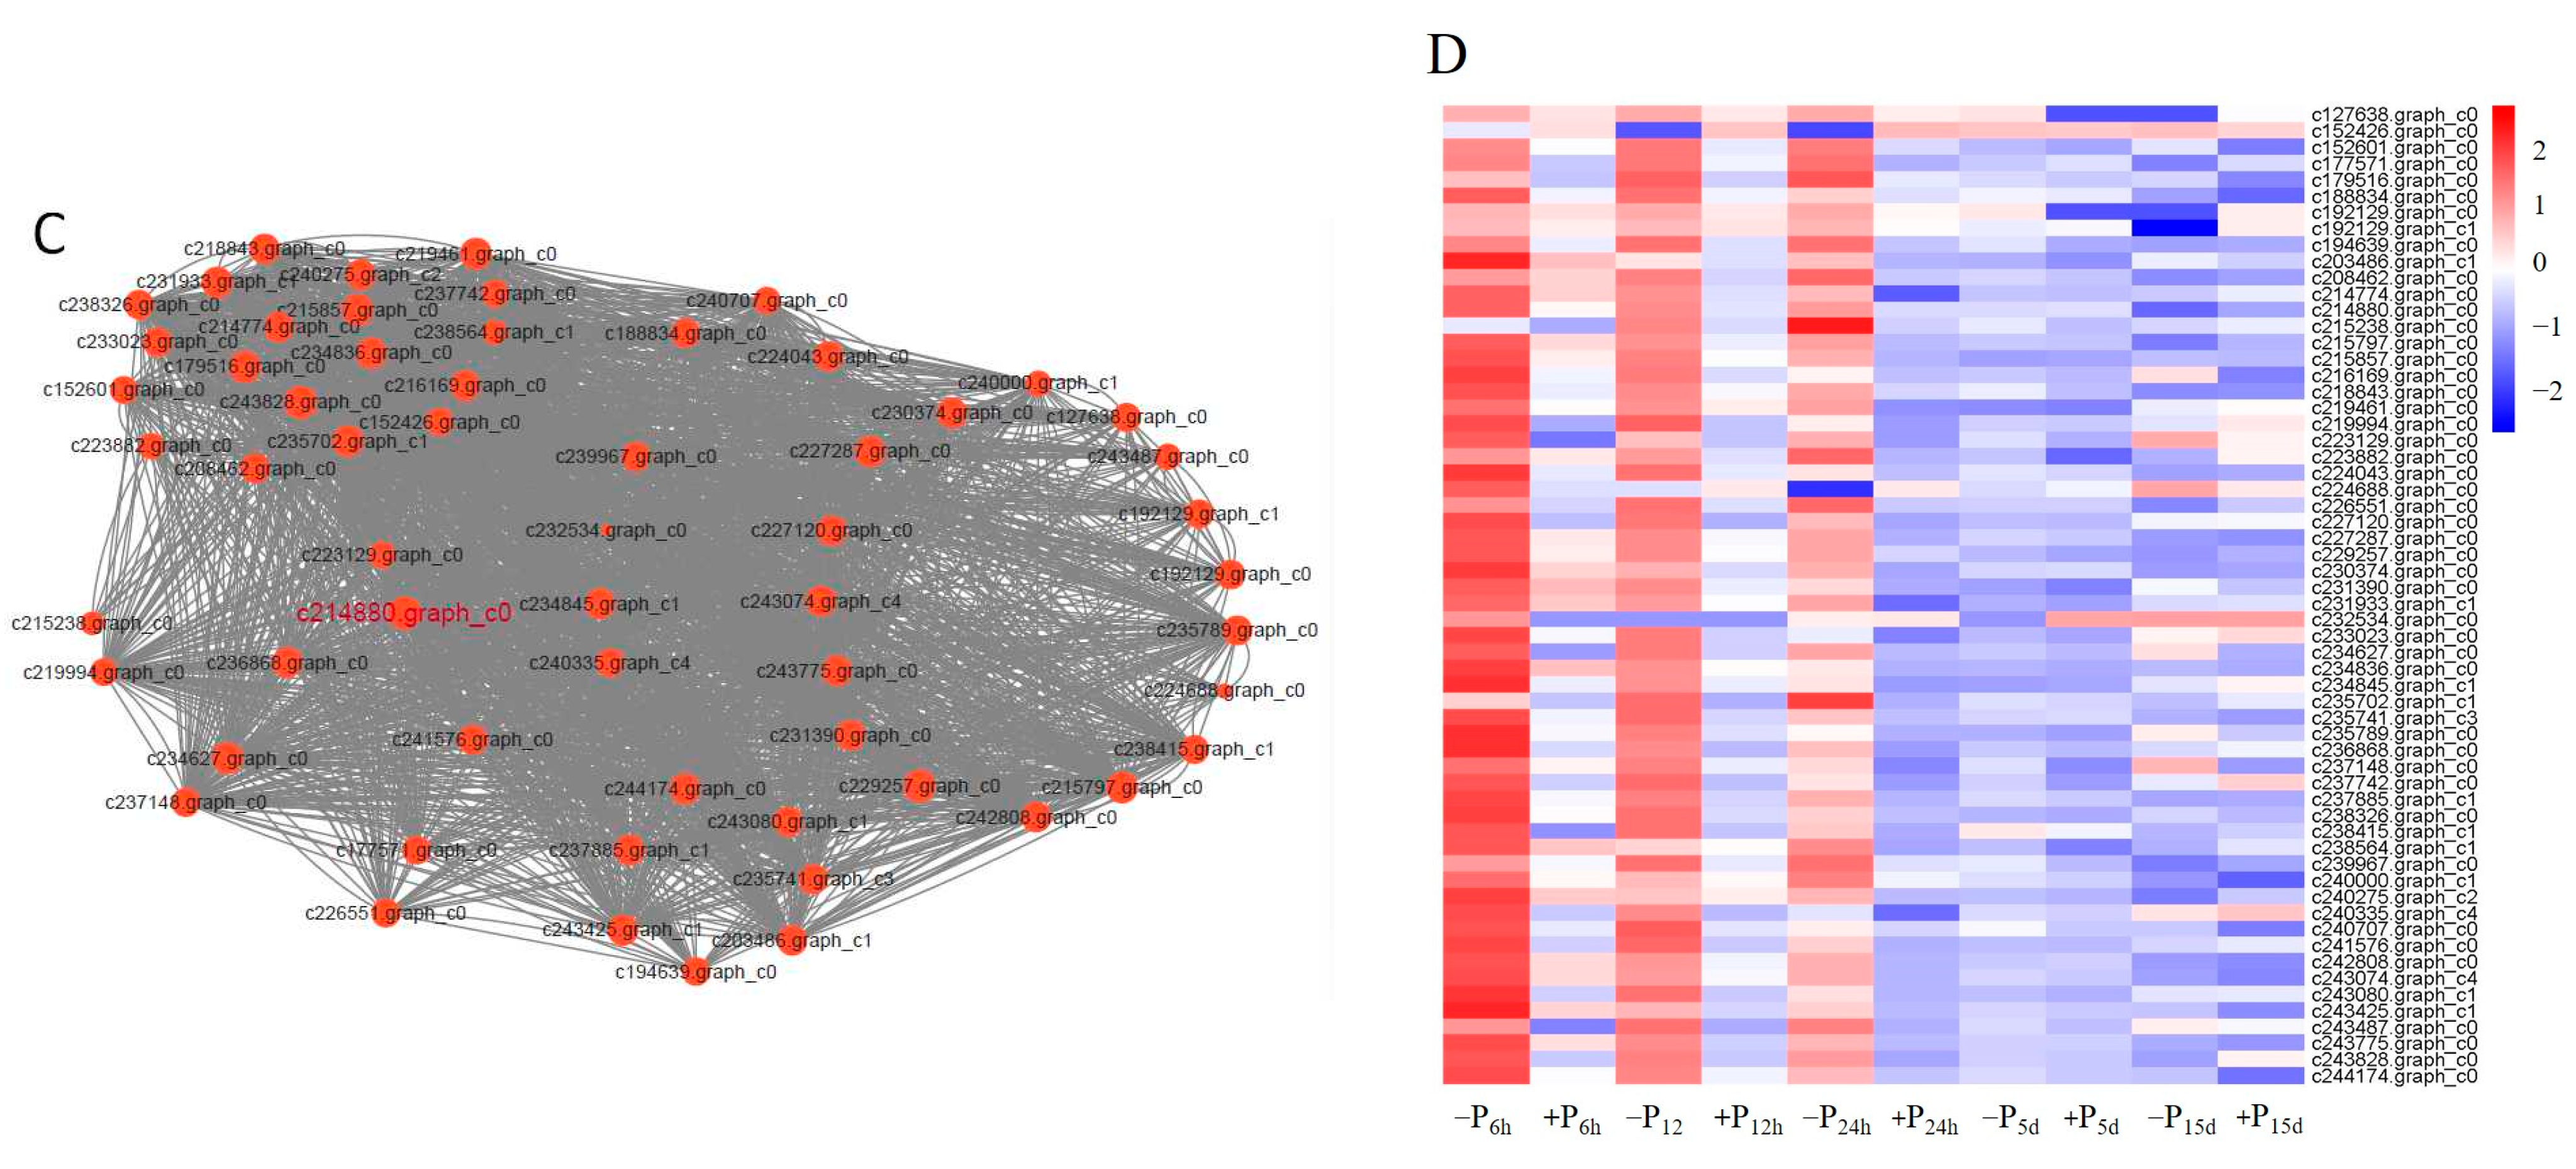
3.3. Analysis of the Gene Co-Expression Network and Selection of Hub Genes in Pi-Sensitive Clones

To identify the WGCNA modules related to phosphate accumulation during Pi-deficiency stress of Pi-sensitive clone C5, a co-expression network was constructed by combining dramatic changes in the total phosphorus content of the plant at all treatment time points with RNA-seq datasets. The DEGs screened from five timepoints constituted a gene dataset, and the gene ID in the datasets retained a unique value. The results showed a total of 9038 genes in the datasets. Then, DEGs in the datasets were divided into 11 independent modules according to WGCNA (Figure 4A). There were three modules (turquoise, light green, and dark orange) (Figure 4B) with 217 genes that were found to be significantly positively correlated to the total phosphorus content of the plant, where the absolute correlation coefficients were greater than 0.85 (p < 0.01). In addition, the trait heatmap also indicated that the samples clustered based on gene expression levels were highly correlated with the total phosphorus content of the plant at each treatment time point (Figure S6). Subsequent enrichment analyses were performed to explore the biological functions underlying the transcriptome in the three abovementioned modules. As shown in Table S7, the significantly enriched GO terms were responsible for the metabolic process, cellular process, and single-organism process. In addition, the KEGG pathways participated mainly in terpenoid backbone biosynthesis, phenylpropanoid biosynthesis, diterpenoid biosynthesis, and monoterpenoid biosynthesis (Table S8).
Furthermore, based on the eigengene connectivity (KME) values, the genes in the turquoise, light green, and dark orange modules with an absolute correlation coefficient >0.80 were selected to generate the co-expression subnetworks visualized using Cytoscape v.3.9.1 to search for putative candidates with important contributions. Then, we used the 12 algorithms of Cytohubba to screen out more crucial hub genes. The top 10 genes obtained by each algorithm were collected to generate the co-expression subnetworks of hub genes (Figure 4C). The highlighted gene (c214880.graph_c0)-encoding protein rough sheath had the highest KME value and was most closely associated with other node genes in the turquoise, light green and dark orange modules. Details of the 60 hub genes in the subnetworks are listed in Table S9. The hub genes mainly include 20 putative genes relating to the enzymes in terpenoid synthesis (17) and phenylpropanoid metabolism pathway (3), two putative genes encoding the ACC oxidase and ETR2 ethylene receptor, respectively, and five putative genes relating to dirigent-like protein, apoptosis-inducing factor, or sphingolipid metabolism. In addition, one putative gene might encode transcription factor MYB, and 19 putative genes with unknown information were also observed (Figure 4C and Table S9). The expression profile of the hub genes is shown in Figure 4D. Most genes were significantly up-regulated before 24 h Pi-deficiency stress, especially at the time point of 6 h. However, the difference of most genes of +P_vs._ −P pairwise comparisons was no longer significant at 5 and 15 days of Pi-deficiency stress. Moreover, KEGG classification analysis of these unigenes provided additional information concerning the enriched biological pathways, including terpenoid backbone biosynthesis, monoterpenoid biosynthesis, cysteine, and methionine metabolism, and diterpenoid biosynthesis (Table S10).

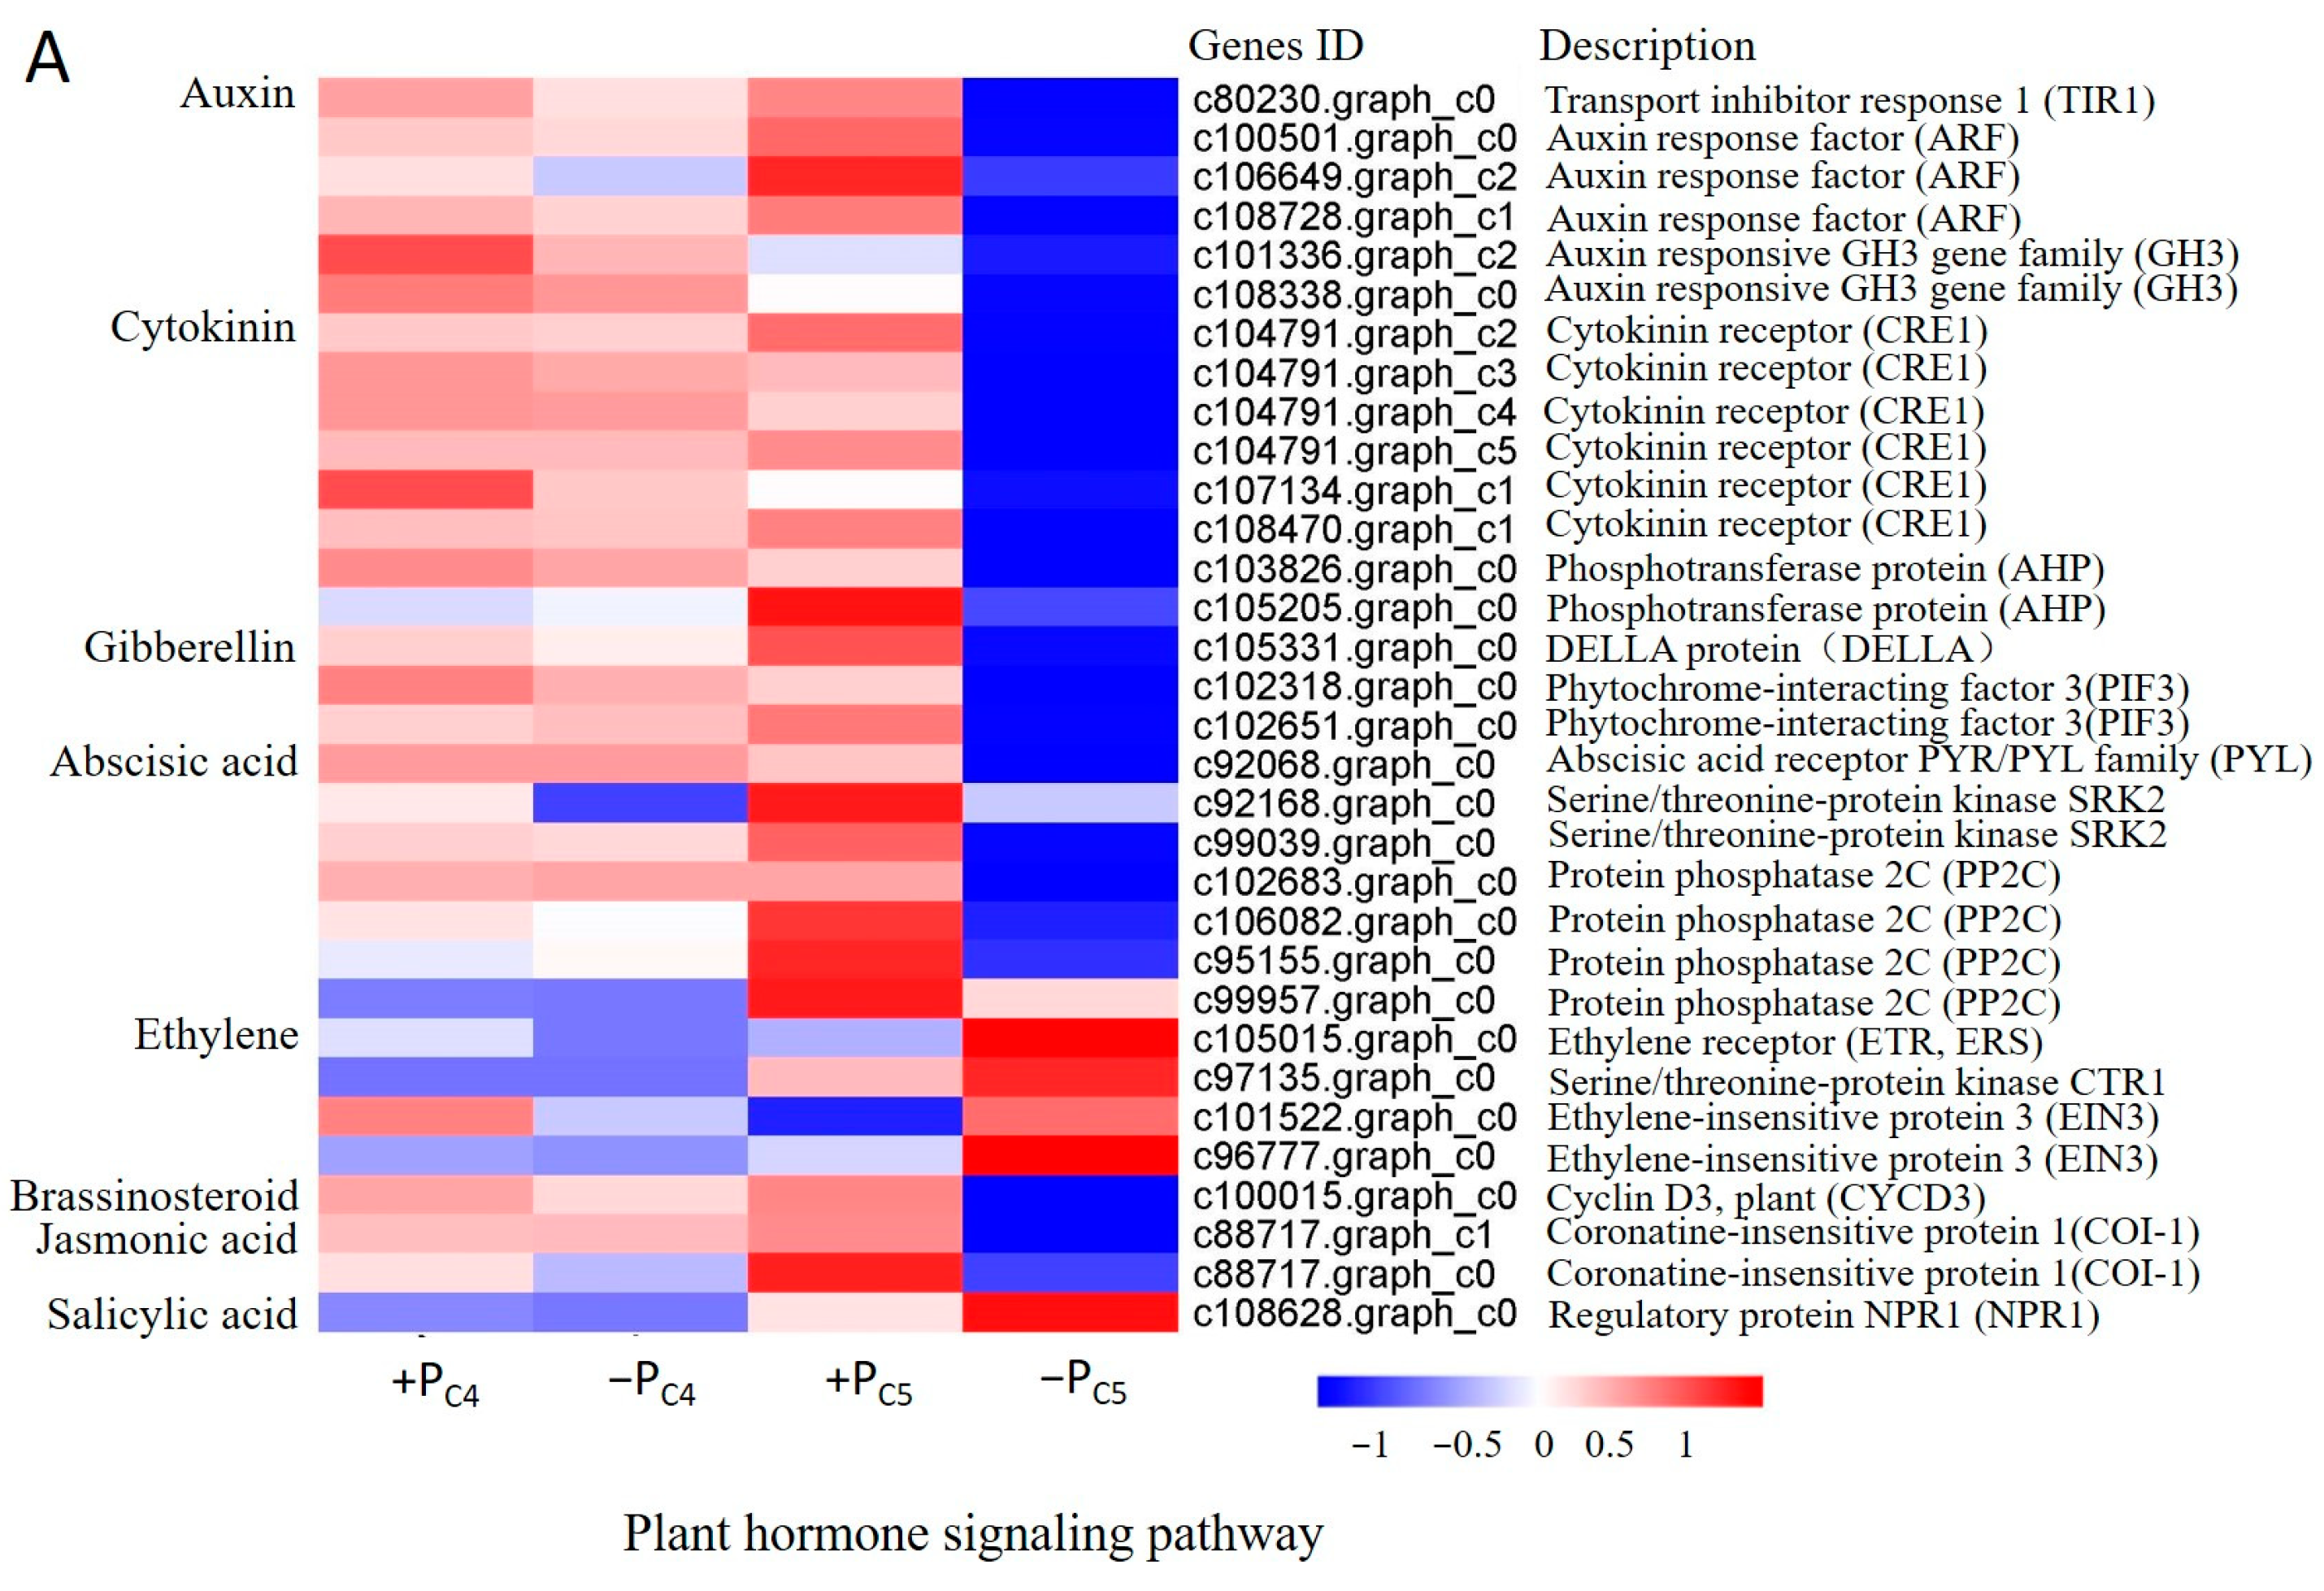
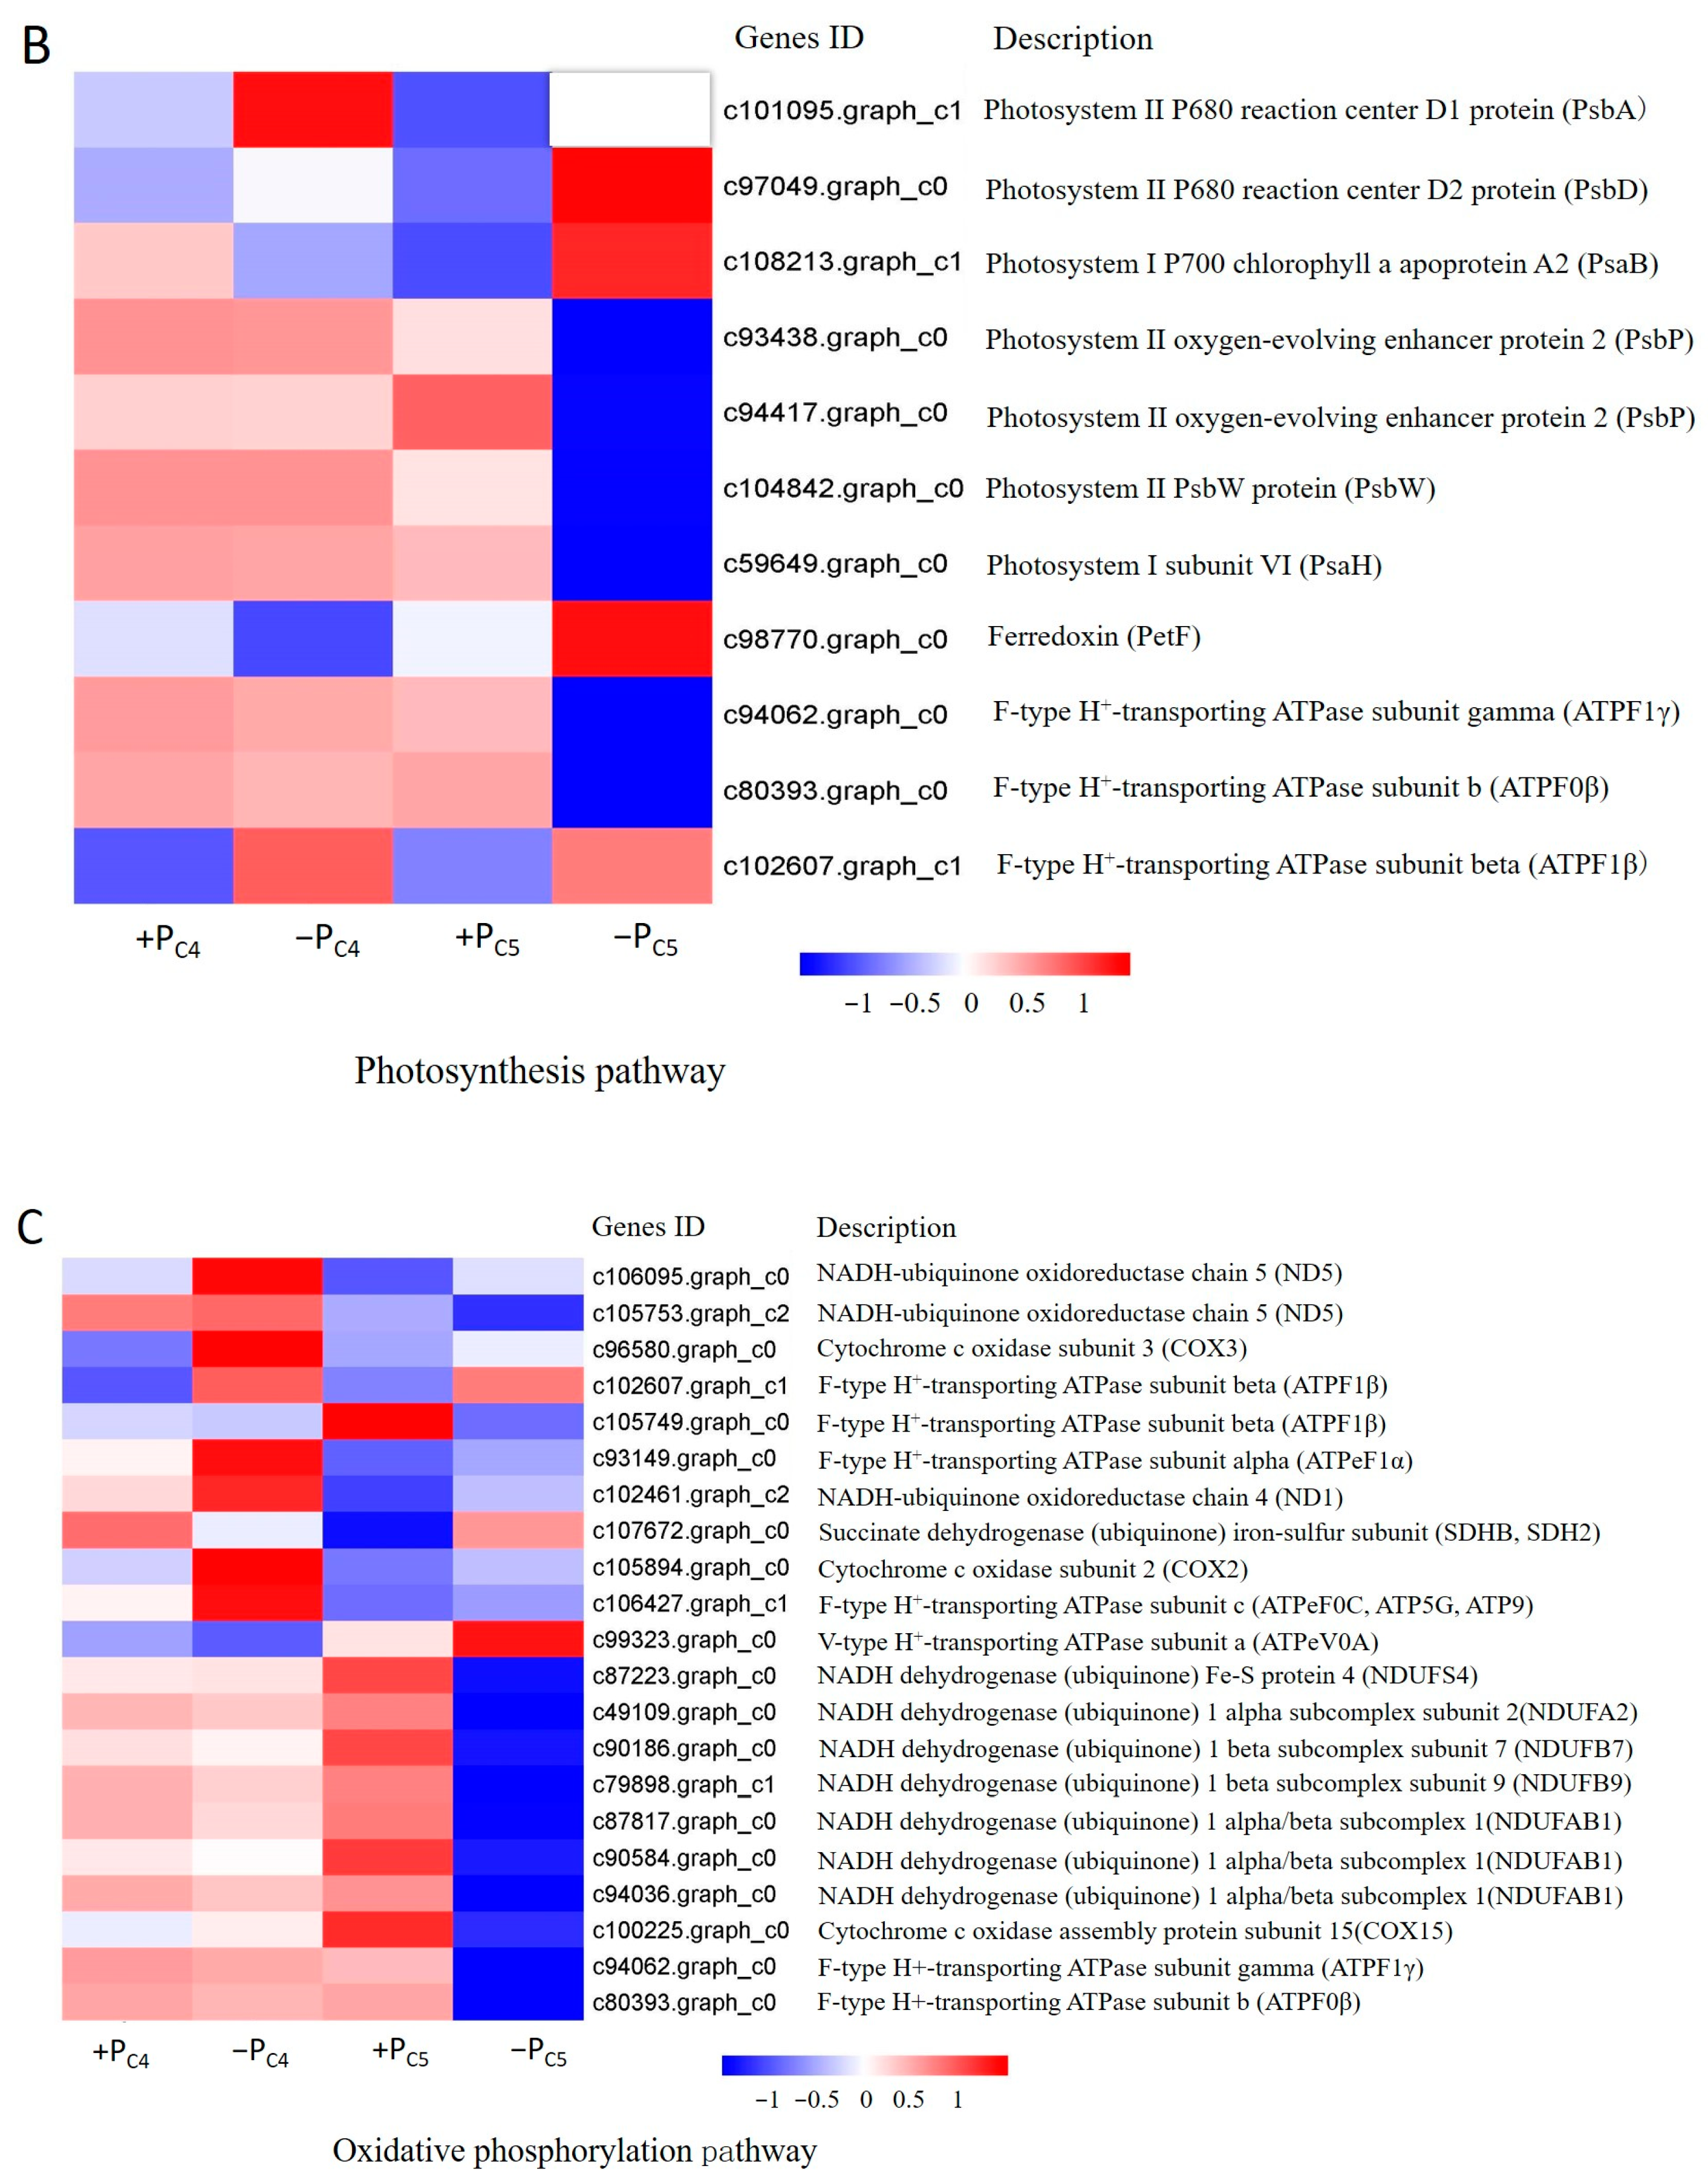
3.4. Gene-Specific Expression Analysis of Pi-Sensitive Clones

The results of the RNA-seq of Pi-sensitive clone C5 showed that 12 h of Pi-deficiency stress was a high expression timepoint of the early response gene to Pi-deficiency stress in Chinese fir clone seedlings. Hence, at 12 h of Pi-deficiency stress, the root tissue samples of Pi-tolerant clone C4 and Pi-sensitive clone C5 were selected for the second RNA-seq. A total of 96.29 GB of clean data was obtained from 12 root tissue samples. The clean data of each sample reached 7.31 GB with the percentage of Q30 base over 87.73%, and the GC content was over 43.80%. Using Trinity software for sequence assembly, 93,551 transcripts and 41,099 unigenes were obtained, with N50 of 2307 nt and 2216 nt, respectively. 17,101 of the unigenes with a size of over 1 kb were obtained with high assembly integrity. In addition, after 12 h of Pi-deficiency stress, the DEGs numbers in the roots of Pi-sensitive clone C5 were much higher than that of Pi-tolerant clone C4 (Table 2), and the number of DEGs between the two clones was 4981 under the condition of normal Pi supply, while the number was increased to 8371 under Pi-deficiency stress.
Based on the analysis of the KEGG pathway, we observed significant enrichment (p ≤ 0.05) for DEGs from different gene sets, and the top five most significant enrichment pathways were obtained (Table 3). There were significant differences in the enrichment pathways between clones with different Pi efficiencies. The most significant enrichment pathway of the up-regulated genes was oxidative phosphorylation (ko00190) in clone C4, but endocytosis (ko04144) in the C5 clone. The results also showed that plant hormone signal transduction (ko04075), photosynthesis (ko00195), and starch and sucrose metabolism (ko00500) were the three main pathways of DEG genes enrichment of C4 and C5 clones under Pi-deficiency stress.
In order to further explore the difference in phosphorus efficiency between C4 and C5, the pathways mainly enriched DEGs were classified and counted. Firstly, in the plant hormone signal transduction pathway (ko04075) (Figure 5A), a significantly down-regulated putative gene relating to GH3 (an early response gene in the auxin signaling pathway) was enriched in clone C4. However, in clone C5, the number of enriched DEGs increased significantly, including 29 up-regulated putative genes and 52 down-regulated putative genes, among which the up-regulated genes were mainly enriched in the ethylene and salicylic acid pathway, and the down-regulated genes were mainly enriched in the pathways of auxin, cytokinin, gibberellin, abscisic acid, brassinosteroid, and jasmonic acid.
In the pathway of photosynthesis (ko00195), two up-regulated putative genes of clone C4 were significantly enriched, and presumed to encode pigment protein D1 (PsbA) of the P680 reaction center and the F-type H+-ATPase β subunit (Figure 5B). Interestingly, clone C5 had both up-regulated and down-regulated putative genes significantly enriched in the photosynthesis pathway. The up-regulated putative genes might encode D1 (PsbA) and D2 (PsbD) protein, apolipoprotein A2 (PsaB) of chlorophyll α and ferredoxin (PetF) of photosystem I, and the down-regulated putative genes were related to five enzymes of photosystem II, photosystem I, and F-type H+-transporting ATPase.
Then, in the oxidative phosphorylation (ko00190) pathway (Figure 5C), four up-regulated putative genes of clone C4 were presumed to be related to NADH ubiquinone oxidoreductase chain 5 (ND5), cytochrome c oxidase subunit 3 (COX3), and F-type H+-transporting ATPase subunit beta (ATPF1 β) and alpha (ATPeF1 α), respectively. However, the enriched DEGs (7 up-regulated and 11 down-regulated) of clone C5 might encode 16 enzymes in the oxidative phosphorylation pathway. Among them, seven down-regulated genes predicted five subclasses of encoding NADH dehydrogenase, including NDUFS4, NDUFA2, NDUFB7, NDUFB9, and NDUFAB1, and four down-regulated genes predicted four kinds of F-type H+ transport ATPases.

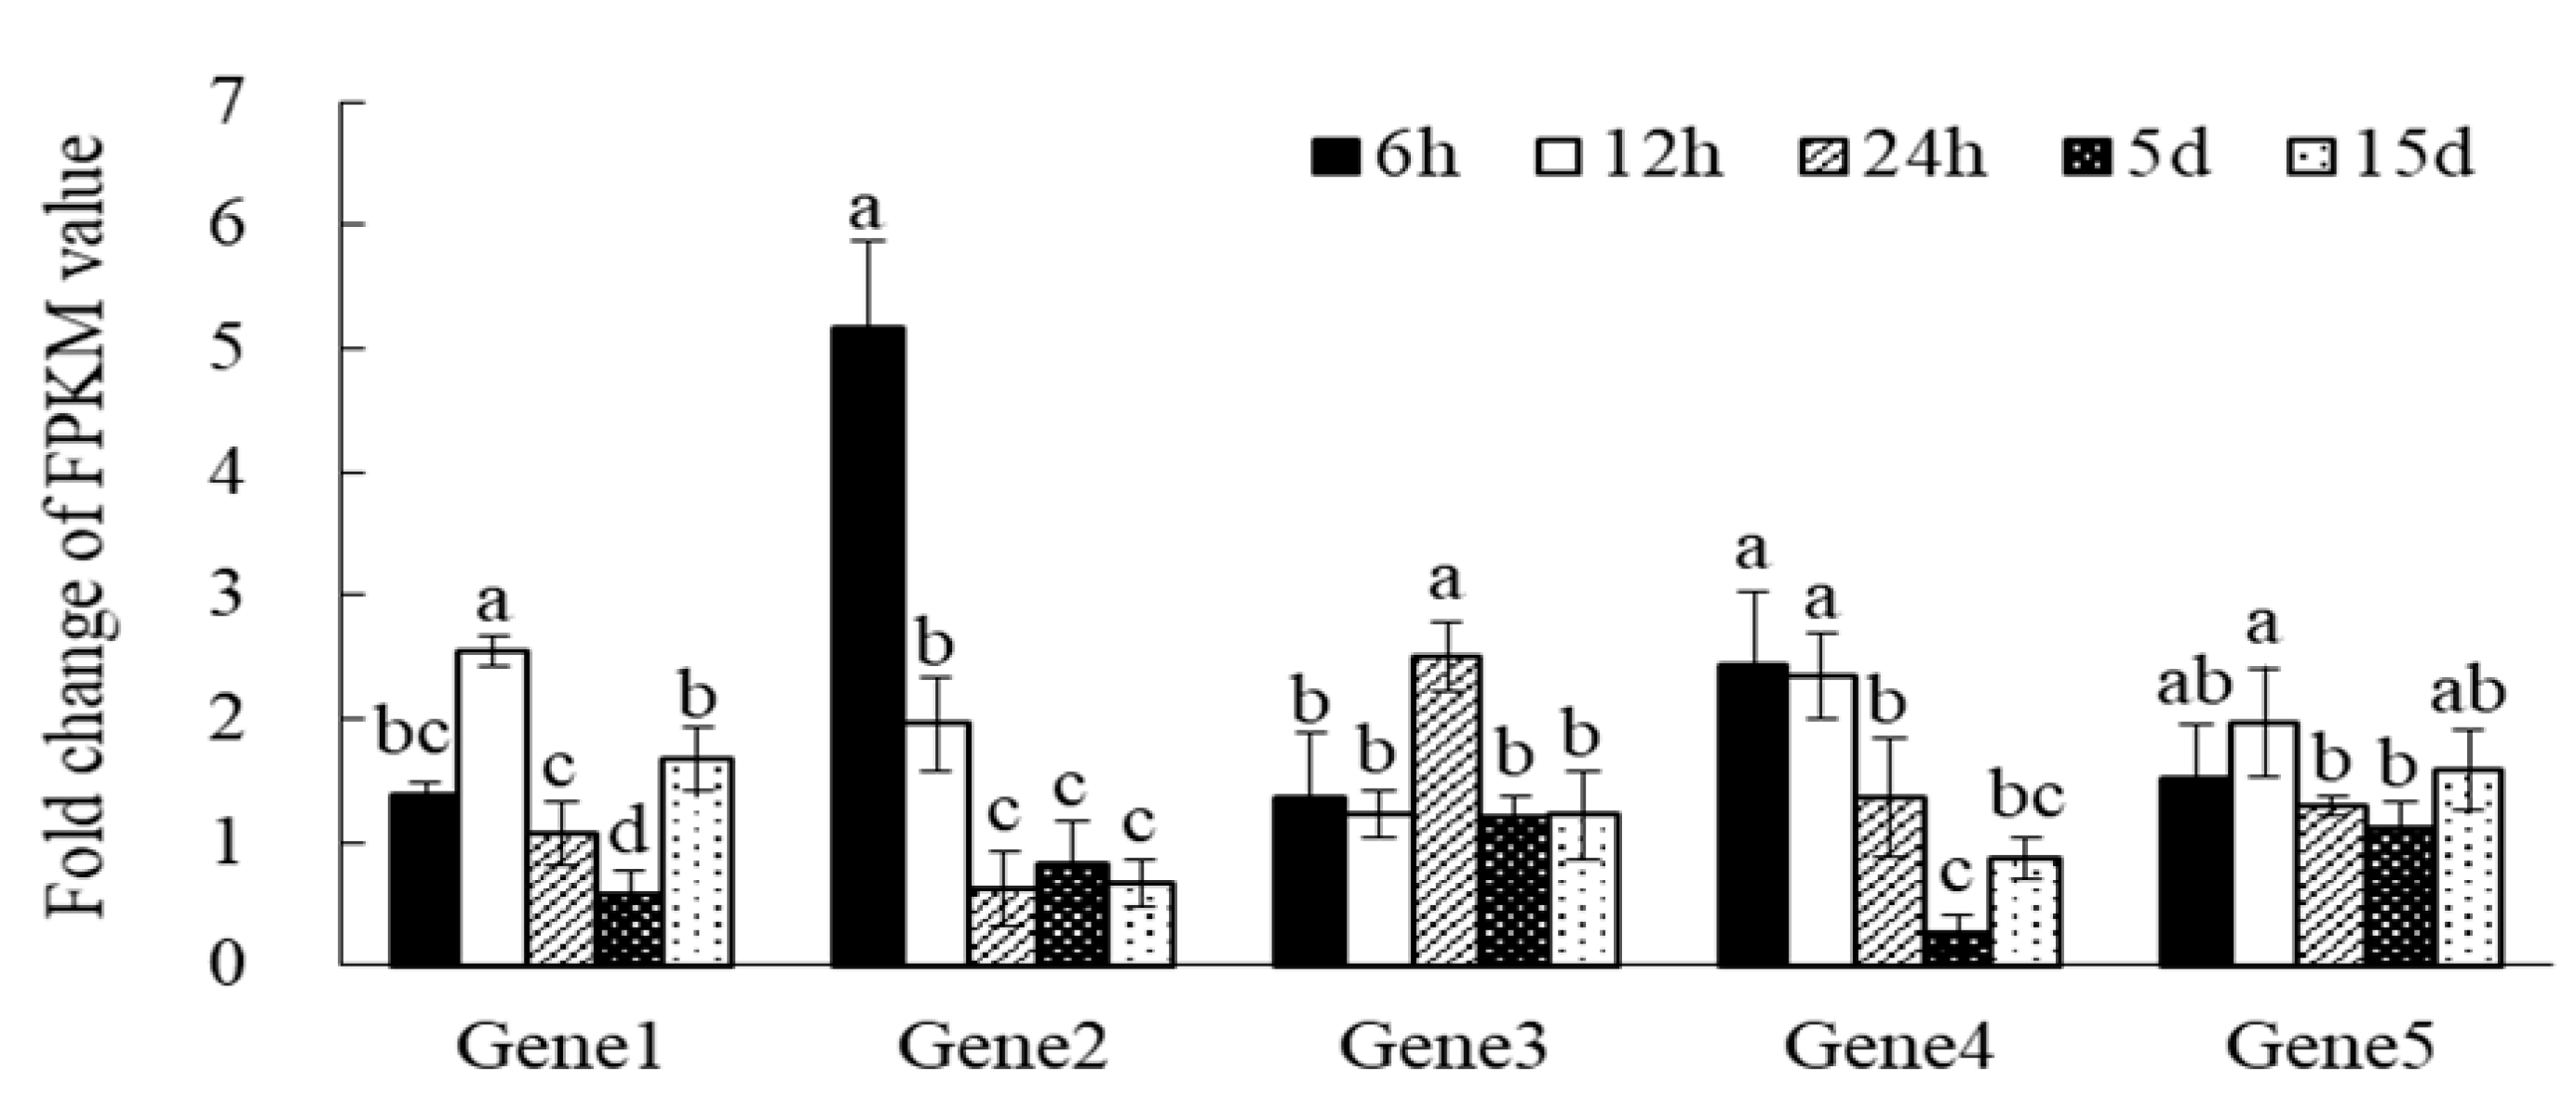
3.5. qRT-PCR Analysis of Chinese Fir Clone Genes

The results of qRT-PCR analysis showed that five putative genes were induced at different levels under Pi-deficiency stress (Figure 6). Although the differential expression multiple between qRT-PCR and expression profile analysis was not completely consistent, the changing trend of stress-induced expression was the same, indicating that the result of gene expression profile analysis was reliable.

4. Discussion

4.1. Ethylene Played an Important Role in the Early Response to Pi-Deficiency Stress of Pi-Sensitive Clone

Roots can have specific responses to changing biological or abiotic stress signals. After sensing various signals produced by the outside or itself, plants must convert these signals into intracellular signals by cell perception, signal transmission, signal amplification, gene regulation and expression, and physiological or biochemical changes. In this study, the transcriptome data of the root samples indicated that the Pi-sensitive clone C5 underwent a series of stress responses to Pi-deficiency stress. The response patterns could be simulated as shown in Figure 7. Therefore, we can make the following conjecture: firstly, Pi-deficiency stress could rapidly induce the expression of related genes of polypeptide ligand and receptor-like protein kinase in the root tissue to significantly increase (Figure 4D and Table S9). The receptor-like kinases were molecules on the cell membrane that were involved in sensing extra cellular signals. They could specifically recognize and combine with biologically active molecules, thus causing corresponding biological reactions [29]. Therefore, at the early stage of Pi-deficiency stress, the significantly increased expression of the receptor-like protein kinase-related genes might enable the root of clone C5 to quickly sense the extracellular Pi-deficiency signal and transmit it to the cell, thus activating the key signal transduction module downstream of receptor-like kinase-Mitogen Activated Protein Kinase (MAPK) cascade. In addition, there were two genes related to ACC oxidase and ETR1 ethylene receptor which also significantly increased at the early stage of Pi-deficiency stress (Figure 4C,D and Table S9). Therefore, we speculated that the MAPK cascade signal induced by the Pi-deficiency signal might participate in the regulation of ethylene synthesis and ethylene signal transduction in the root tissue of clone C5, and then activate the expression of downstream target genes and finally activate ethylene response reactions, such as stress resistance, growth and development, and synthesis of secondary metabolites [30]. The MAPK cascade had been proven to be involved in ethylene signal transduction in Arabidopsis thaliana [31]. Strader et al. [32] also found that the ethylene synthesis precursor 1-Aminocyclopropane-1-Carboxylate (ACC) at the root tip regulated the synthesis of auxin to make the concentration of auxin in the root tip elongation zone too high under Pi-deficiency stress, thus inhibiting the root elongation and promoting the formation of lateral roots and root hairs. In the present study, it was also found that exogenous ethylene could increase the endogenous ethylene content of 6-month seedlings under Pi-deficiency stress in Chinese fir, and with the increase of endogenous ethylene content, the ability to seek Pi in the roots of seedlings was enhanced, resulting in a significant increase in the phosphorus content of the shoots and roots, and the phosphorus utilization rate was also improved [33]. ACC oxidase (ACO) is the key enzyme that regulates ethylene synthesis, and the increase of its related gene expression would promote the increase of endogenous ethylene content. Therefore, we speculate that the phenomenon that the root length of clone C5 being inhibited but the root phosphorus accumulation being increased under Pi-deficiency stress might be closely related to the synthesis of ethylene in root tissue.
Secondly, during primary metabolism, plants can use cell membrane receptor proteins to establish a certain recognition mechanism and activate mitogen-activated protein kinases (MAPKs) and a variety of endogenous hormone signal transduction pathways including ethylene. Then, the plant defense response is activated [34] and the secondary metabolites are produced by the phenylpropanoid metabolic pathway, terpene biosynthesis, and the alkaloid metabolic pathway to cope with environmental changes and various biological and abiotic stresses [35]. In this study, one putative gene related to the transcription factor MYB21 and 13 genes were involved in various enzymes in the process of terpene biosynthesis, e.g., pimara-8 (14), 15-diene synthase, glycosyltransfer, cytochrome P450, and longifolene synthase, and two genes might relate to phenylpropanoid metabolism pathway, e.g., isoflavone reductase and the precursor of phenylpropanoid metabolism, and had up-regulated expression in the early stage (6, 12 and 24 h) of Pi-deficiency stress (Figure 4D and Table S9). The result suggested that the ethylene signal might induce the synthesis of secondary metabolites in the root tissue of clone C5 under Pi-deficiency stress. Various stress conditions could induce the production of plant secondary metabolites, which were regulated by a variety of plant endogenous hormones, such as ethylene (ET) and jasmonic acid (JA) [36]. Studies on Arabidopsis thaliana showed that ethylene could inhibit the synthesis of anthocyanins through positive regulation of R3-MYB-MYBL2 [37]. Ethylene had a dual regulatory effect of inhibiting and promoting the formation of plant secondary metabolites. This regulatory effect was the result of the joint action of ethylene and various factors inside and outside the cell [38]. Plant secondary metabolites not only participated in the regulation of plant growth and development but also enabled plants to effectively cope with biological and abiotic stresses [39]. Therefore, we speculated that Pi-deficiency stress might promote the synthesis and signal transduction of ethylene in the root tissue of clone C5, and ethylene might also interact with transcription factors, such as MYB, to jointly affect the expression of related genes in the synthesis of secondary metabolites, especially the terpene biosynthesis and phenylpropanoid metabolism pathway, to respond to Pi-deficiency stress.
In addition, ethylene, as an endogenous plant hormone, also participated in plant defense response [40]. In this study, it was found that some hub genes were related to defense response (Table S9), including enzymes related to the sphingolipid metabolism pathway, apoptosis-inducing factor, and dirigent-like protein. These genes also showed a significantly up-regulated expression pattern in the early stage of Pi-deficiency stress, and down-regulated expression at the 5 days and 15 days of treatment. Therefore, ethylene might also participate in the early response of Pi-sensitive clone C5 to Pi-deficiency stress through the sphingolipids metabolism pathway. As we all know, plant sphingolipids are important components of plant cell membranes. Plant sphingolipids and their metabolites are active lipid molecules with signal transduction functions. They play an important regulatory role in the process of plant cell growth, proliferation and development, cell membrane stability, cell signal transduction, plant abiotic stress response, plant pathogenic defense mechanism, and plant cell programmed death [41]. Therefore, it should be reasonable speculation that under Pi-deficiency stress, sphingolipids in the root tissue of Pi-sensitive clone C5 might participate in sensing the Pi-deficiency signal outside the cell membrane and induce programmed cell death and pathogenic defense mechanisms or other defense reactions through signal transduction, while ethylene might also participate in the defense reaction processes induced by the sphingolipid signal pathway. If the supposition was confirmed, it would provide a new idea for us to study the response mechanism of Chinese fir clones to Pi-deficiency stress.
Pi-deficiency stress might also affect the expression patterns of photosynthetic system-related genes of clone C5, such as glucuronosyltransferase, ribose-1,5-bisphosphonate carboxylase, argininosuccinate synthase, ATP synthase CF0 A subunit (Figure 4D and Table S9). It was worth noting that there were 19 genes with unknown functions involved in 60 hub genes. Therefore, it could be seen that under Pi-deficiency stress, the phosphorus accumulation process of Pi-sensitive clone C5 was the result of the joint regulation of multiple genes and the cooperation of all parties, but ethylene should be an important factor.

4.2. Pi-Deficiency Stress Suppressed the More Pi-Deficiency Response Genes Expression in Pi-Sensitive Clones than That in Pi-Tolerant Clones, Especially the Genes Involving in Plant Endogenous Hormone and ATP Synthase

The concentration of endogenous hormones and the sensitivity of plant tissues to hormones jointly regulate the growth and development of plants. Under Pi-deficiency stress, plant endogenous hormones of different Pi efficiency genotypes could regulate root growth and structural changes through different gene expression patterns [42]. The previous studies on Chinese fir had shown that the content of abscisic acid (ABA) in the roots of the high Pi use efficiencies family was higher than that in the low Pi use efficiencies family [14]. This study showed that there were significant differences in the expression patterns of genes related to hormone signal transduction between Pi-tolerant clone C4 and Pi-sensitive clone C5. In the early stage of Pi-deficiency stress, except for the significant down-regulation of putative gene presumed to code the CH3 protein in the auxin signaling pathway, most of the other endogenous hormone putative genes did not have differential expression in clone C4 detected (Figure 5A). However, in the Pi-sensitive clone C5, the number of putative genes related to endogenous hormone signal transduction with significant changes in expression had significantly increased. Most of the key genes in the ethylene signaling pathway, such as putative coding genes of ethylene receptor (ETR) and ethylene-insensitive protein 3 (EIN3), were significantly up-regulated, suggesting that Pi-deficiency stress might induce a rapid increase in ethylene content. However, key genes in the signaling pathway of auxin, gibberellin, and abscisic acid, such as auxin receptor ARF and TIR1, DELLA and PIF3 protein of gibberellin, cytokinin receptor CRE1, abscisic acid receptor PYL, SRK2, and other related genes, were down-regulated (Figure 5A). The changes in these genes’ expression patterns have been studied to be closely related to the development of lateral roots or root hairs [42,43,44]. Therefore, we believe that Pi-deficiency stress is directly or indirectly involved in regulating the growth, development, and configuration change of Chinese fir clone roots by inducing or inhibiting the expression of related genes in the plant hormone signal transduction pathway. Moreover, in the early stage of Pi-deficiency stress, this regulation was more obvious in Pi-sensitive clone C5, which might be the main internal cause of the different root morphology of Chinese fir clone with different Pi efficiency responses to Pi-deficiency stress.
The phosphorus content in plants was closely related to the process of light energy absorption, Calvin cycle, formation and transportation of assimilates during photosynthesis [45]. At the early stage of Pi-deficiency stress, the expression patterns of putative genes related to the photosynthesis pathway (ko00195) of different Pi efficiency clones in Chinese fir were noteworthy (Figure 5B). There were only two putative genes related to photosystem II P680 reaction center D1 protein (PsbA), and F-type H+-ATPase subunit beta (ATPF1B) was significantly up-regulated in Pi-tolerant clone C4, while the number of DEGs in Pi-sensitive clone C5 was significantly increased, such as photosystem II oxygen-evolving enhancer protein 2 (PsbP), photosystem I subunit VI (PsaH), ferredoxin (PetF), and many ATPase putative genes which were also down-regulated, and photosystem II P680 reaction center D1, D2 protein (PsbA, PsbD), and an apoprotein A2 (PsaB) of photosystem I P700 chlorophyll were up-regulated (Figure 5B). The results indicated that 12 h of Pi-deficiency stress should have caused damage to the structure and functional stability of the PSII and PSI photosystem of Pi-sensitive clone C5, which would have adverse effects on the final ATPase synthesis. Similar results were obtained in crops, e.g., bean, rice, and Citrus grandis [46,47,48]. In addition, the results also suggested that Pi-tolerant clone C4 could maintain a higher activity of PSII and PSI photosynthesis reaction center than that of Pi-sensitive clone C5 in the early stage of Pi-deficiency stress.
Phosphorus is the main component of ATP. The lack of phosphorus usually leads to the limitation of ATP production in plants and the lack of energy supply [46]. Our research also showed that there were significant differences in the expression patterns of the putative genes related to the protein complex of the electron transport chain between Pi-tolerant clone C4 and Pi-sensitive clone C5 (Figure 5). The putative genes related to NADH-ubiquinone oxidoreductase chain 5 (ND5), cytochrome c oxidase subunit 3 (COX3), and a variety of F-type H+-transporting ATPases were significantly up-regulated in Pi-tolerant clone C4, while most of the putative genes related to the three abovementioned enzymes in Pi-sensitive clone C5 were significantly down-regulated (Figure 5 and Figure 8). Therefore, we had reason to believe that the effect of Pi-deficiency stress on ATP synthesis of Pi-sensitive clones was greater than that of Pi-tolerant clones. In addition, due to the starch and sucrose metabolism pathway (ko00500) being significantly enriched by 51 down-regulated genes in Pi-sensitive clone C5 (Table 3), we speculated that starch and sucrose metabolism of clone C5 might have been limited in the early period of Pi-deficiency stress, and then the reduced coenzyme formed by various metabolic pathways also decreased. On the other hand, some putative genes related to the electron transport chain were also down-regulated, which eventually led to an adverse effect on the ATP synthesis of clone C5. As we all know, the decrease of ATP would have a great influence on physiological functions, including the maintenance of normal concentration of various ions inside and outside the cell, energy metabolism, signal transduction, material absorption, and transmembrane transport, which would further weaken the tolerance of plants to Pi-deficiency stress [49]. However, in Pi-tolerant clone C4, no DEGs significantly enriched by starch and sucrose metabolism pathway were detected at an early stage of Pi-deficiency stress (Table 3). It is generally known that the maintenance of sugar, fat, amino acid, and other normal metabolic processes could better ensure the supply of reduced coenzymes in the electron transport chain and maintain the rate of ATP synthesis. This might be one of the reasons that the Pi-sensitive clone C5 had more morphological changes than the Pi-tolerant clone C4 in response to the Pi-deficiency stress.

5. Conclusions

There were significant differences in plant morphology between Pi-sensitive clone C5 and Pi-tolerant clone C4 responding to Pi-deficiency stress. Clone C5 plantlets became shorter and smaller than clone C4, but the roots became more developed with increases in root length, root surface area, and root volume under Pi-deficiency stress. The plant endogenous hormones, plant secondary metabolites, e.g., terpenes and phenylpropanoid compounds, and sphingolipids jointly regulated the early response to Pi-deficiency stress in Pi-sensitive clone C5, in which ethylene acted as a key factor. Furthermore, compared with the Pi-tolerant clone C4, the number of DEGs in Pi-sensitive clone C5 increased significantly, and most of the DEGs significantly enriched by the main metabolic pathways responding to Pi-deficiency stress showed a down-regulated expression, mainly involving the putative genes relating to the pathway of plant hormone signaling, photosynthesis, and oxidative phosphorylation. While the DEGs in Pi-tolerant clone C4 significantly enriched by these metabolic pathways were up-regulated, mainly involving the putative genes relating to the PsbA, ATPF1B, and the protein complex of the electron transport chain, e.g., ND5, COX3, ATPeF1α. The increased expression of these genes should be closely related to the ability of Pi-tolerant clone C4 to maintain higher photosynthetic carbon assimilation, ATP synthesis, energy metabolism, and other physiological processes under Pi-deficiency stress, as well helping to maintain better growth than clone C5.

Supplementary Materials

The following supporting information can be downloaded at: https://www.mdpi.com/article/10.3390/f14061203/s1, Figure S1: Growth of Chinese fir clones under Pi-deficiency stress; Figure S2: The root morphology parameters of Chinese fir clones under Pi-deficiency stress; Figure S3: The needle-leaf morphology parameters of Chinese fir clones under Pi-deficiency stress; Figure S4: The nutrients content of Chinese fir clones under Pi-deficiency stress; Figure S5: Homologous species distribution in Nr database of Chinese fir clone C5; Figure S6: The trait heatmap in WGCNA; Table S1: Basic information of test materials in this study; Table S2: Five randomly selected genes and the primer sequence used in this study; Table S3: Principal components loading matrix for seven Chinese fir clones based on twenty morphological and nutrient traits; Table S4: Membership function values of seven Chinese fir clones; Table S5: GO classification analysis of the assembled unigenes in developing clone C5 roots; Table S6: KEGG pathway analysis of the assembled unigenes in developing clone C5 roots; Table S7: GO classification analysis of 217 genes from turquoise, lightgreen and darkorange modules; Table S8: KEGG pathway analysis of 217 genes from turquoise, lightgreen and darkorange modules; Table S9: The description of the hub genes; Table S10: KEGG classification analysis of the hub genes.

Author Contributions

Conducted the study and wrote the manuscript, R.W.; methodology, J.S., and J.C.; reviewed the manuscript and contributed to the discussion, J.S. and H.Z.; funding acquisition, D.H. and H.Z. All authors have read and agreed to the published version of the manuscript.

Funding

This study was supported by the National key research and development plan project sub-subject (No. 2022YFD2200201-6), the Chinese Fir Seed Industry Innovation and Industrialization Engineering Project of Fujian Province (No. ZYCX-LY-202101), the Key-Area Research and Development Program of Guangdong Province (No. 2020B020215001) and the Special Plan for the Cultivation of High-level Talents of Guangdong (No. 2014TQ01N140).

Data Availability Statement

The dataset(s) supporting the conclusions of this article are available in the NCBI’s Short Read Archive (SRA) with the BioProject accession numbers PRJNA977096.

Conflicts of Interest

The authors declare no conflict of interest.

References

  1. Shen, J.; Yuan, L.; Zhang, J.; Li, H.; Bai, Z.; Chen, X.; Zhang, W.; Zhang, F. Phosphorus dynamics: From soil to plant. Plant Physiol. 2011, 156, 997–1005. [Google Scholar] [CrossRef] [Green Version]
  2. Zeng, H.; Wang, G.; Zhang, Y.; Hu, X.; Pi, E.; Zhu, Y.; Wang, H.; Du, L. Genome-wide identification of phosphate-deficiency-responsive genes in soybean roots by high-throughput sequencing. Plant Soil 2016, 398, 207–227. [Google Scholar] [CrossRef]
  3. O’Rourke, J.; Yang, S.; Miller, S.; Bucciarelli, B.; Liu, J.; Rydeen, A.; Bozsoki, Z.; Uhde-Stone, C.; Tu, Z.; Allan, D.; et al. An RNA-Seq transcriptome analysis of orthophosphate-deficient white lupin reveals novel insights into phosphorus acclimation in plants. Plant Physiol. 2013, 161, 705–724. [Google Scholar] [CrossRef] [PubMed] [Green Version]
  4. Chiou, T.; Lin, S. Signaling network in sensing phosphate availability in plants. Annu. Rev. Plant Biol. 2011, 62, 185–206. [Google Scholar] [CrossRef] [Green Version]
  5. Plaxton, W.; Tran, H. Metabolic adaptations of phosphate-starved plants. Plant Physiol. 2011, 156, 1006–1015. [Google Scholar] [CrossRef] [PubMed] [Green Version]
  6. Richardson, A.E.; Lynch, J.P.; Ryan, P.R.; Delhaize, E.; Smith, F.A.; Smith, S.E.; Harvey, P.R.; Ryan, M.H.; Veneklaas, E.J.; Lambers, H.; et al. Plant and microbial strategies to improve the phosphorus efficiency of agriculture. Plant Soil 2011, 349, 121–156. [Google Scholar] [CrossRef]
  7. Cordell, D.; Drangert, J.; White, S. The story of phosphorus: Global food security and food for thought. Glob. Environ. Chang. 2009, 19, 292–305. [Google Scholar] [CrossRef]
  8. Cheraghi, M.; Lorestani, B.; Merrikhpour, H. Investigation of the effects of phosphate fertilizer application on the heavy metal content in agricultural soils with different cultivation patterns. Biol. Trace Elem. Res. 2012, 145, 87–92. [Google Scholar] [CrossRef]
  9. Chen, W.; Chen, R.; Zhang, Y.; Li, J.; Tigabu, M.; Ma, X.; Li, M. Cloning, Characterization and expression analysis of the phosphate starvation response gene, ClPHR1, from Chinese Fir. Forests 2020, 11, 104. [Google Scholar] [CrossRef] [Green Version]
  10. Hao, L.; Zhang, J.; Christie, P.; Li, X. Response of two maize inbred lines with contrasting phosphorus efficiency and root morphology to mycorrhizal colonization at different soil phosphorus supply levels. J. Plant Nutr. 2008, 31, 1059–1073. [Google Scholar] [CrossRef] [Green Version]
  11. Yu, X.; Wang, J.; Zhu, M.; Jiang, J. Molecular mechanism of carbohydrate metabolism participation in tomato response to low phosphorus stress. Mol. Plant Breed. 2015, 13, 2833–2842. [Google Scholar]
  12. Zeng, J.; Liu, J.; Liang, L.; Xu, A.; Guo, X.; Zhang, L.; Zhang, W.; Hu, D. Effects of scion variety on the phosphorus efficiency of grafted Camellia oleifera seedlings. Forests 2022, 13, 203. [Google Scholar] [CrossRef]
  13. Zhang, Y.; Zhou, Z.; Yang, Q. Genetic variations in root morphology and phosphorus efficiency of Pinus massoniana under heterogeneous and homogeneous low phosphorus conditions. Plant Soil 2013, 364, 93–104. [Google Scholar] [CrossRef]
  14. Chen, Z.; Wu, P.; Zou, X.; Wang, P.; Ma, J.; Ma, X. Relationship between growth and endogenous hormones of Chinese Fir seedlings under low phosphorus stress. Sci. Silvae Sin. 2016, 52, 57–67. [Google Scholar]
  15. Zou, X.; Wu, P.; Chen, N.; Wang, P.; Ma, X. Chinese fir root response to spatial and temporal heterogeneity of phosphorus availability in the soil. Can. J. For. Res. 2015, 45, 402–410. [Google Scholar] [CrossRef]
  16. Wu, P.; Ma, X.; Tigabu, M.; Wang, C.; Liu, A.; Oden, P. Root morphological plasticity and biomass production of two Chinese fir clones with high phosphorus efficiency under low phosphorus stress. Can. J. For. Res. 2011, 41, 228–234. [Google Scholar] [CrossRef]
  17. Chen, W.; Zhou, M.; Zhao, M.; Chen, R.; Tigabu, M.; Wu, P.; Li, M.; Ma, X. Transcriptome analysis provides insights into the root response of Chinese fir to phosphorus deficiency. BMC Plant Biol. 2021, 21, 525. [Google Scholar] [CrossRef] [PubMed]
  18. Hoagland, D.; Arnon, D. The water-culture method for growing plants without soil. Calif. Agric. Exp. Stn. Circ. 1950, 347, 4–32. [Google Scholar]
  19. Bao, S.D. Soil Agro-Chemistrical Analysis, 3rd ed.; Agricultural Press of China: Beijing, China, 2000; pp. 40–54. (In Chinese) [Google Scholar]
  20. Yan, C.; Song, S.; Wang, W.; Wang, C.; Li, H.; Wang, F.; Li, S.; Sun, X. Screening diverse soybean genotypes for drought tolerance by membership function value based on multiple traits and drought-tolerant coefficient of yield. BMC Plant Biol. 2020, 20, 321. [Google Scholar] [CrossRef]
  21. Grabherr, M.; Haas, B.; Yassour, M.; Levin, J.; Thompson, D.; Amit, I.; Adiconis, X.; Fan, L.; Raychowdhury, R.; Zeng, Q.; et al. Full-length transcriptome assembly from RNA-Seq data without a reference genome. Nat. Biotechnol. 2011, 29, 644–652. [Google Scholar] [CrossRef] [PubMed] [Green Version]
  22. Altschul, S.; Madden, T.; Schäffer, A.; Zhang, J.; Zhang, Z.; Miller, W.; Lipman, D. Gapped BLAST and PSI-BLAST: A new generation of protein database search programs. Nucleic Acids Res. 1997, 25, 3389–3402. [Google Scholar] [CrossRef] [PubMed] [Green Version]
  23. Wang, L.; Feng, Z.; Wang, X.; Wang, X.; Zhang, X. DEGseq: An R package for identifying differentially expressed genes from RNA-seq data. Bioinformatics 2010, 26, 136–138. [Google Scholar] [CrossRef] [PubMed] [Green Version]
  24. Kanehisa, M.; Araki, M.; Goto, S.; Hattori, M.; Hirakawa, M.; Itoh, M.; Katayama, T.; Kawashima, S.; Kawashima, S.; Okuda, S.; et al. KEGG for linking genomes to life and the environment. Nucleic Acids Res. 2008, 36, D480–D484. [Google Scholar] [CrossRef]
  25. Mao, X.; Cai, T.; Olyarchuk, J.; Wei, L. Automated genome annotation and pathway identification using the KEGG Orthology (KO) as a controlled vocabulary. Bioinformatics 2005, 21, 3787–3793. [Google Scholar] [CrossRef]
  26. Langfelder, P.; Horvath, S. WGCNA: An R package for weighted correlation network analysis. BMC Bioinform. 2008, 9, 559. [Google Scholar] [CrossRef] [Green Version]
  27. Shannon, P.; Markiel, A.; Ozier, O.; Baliga, N.S.; Wang, J.T.; Ramage, D.; Amin, N.; Schwikowski, B.; Ideker, T. Cytoscape: A software environment for integrated models of biomolecular interaction networks. Genome Res. 2003, 13, 2498–2504. [Google Scholar] [CrossRef] [PubMed]
  28. Wang, Z.; Chen, J.; Liu, W.; Luo, Z.; Wang, P.; Zhang, Y.; Zheng, R.; Shi, J. Transcriptome characteristics and six alternative expressed genes positively correlated with the phase transition of annual cambial activities in Chinese Fir (Cunninghamia lanceolata (Lamb.) Hook). PLoS ONE 2013, 8, e71562. [Google Scholar] [CrossRef] [Green Version]
  29. Shiu, S.; Bleecker, A. Expansion of the receptor-like kinase/pelle gene family and receptor-like proteins in Arabidopsis. Plant Physiol. 2003, 132, 530–543. [Google Scholar] [CrossRef] [Green Version]
  30. Fujimoto, S.; Ohta, M.; Usui, A.; Shinshi, H.; Ohme-Takagi, M. Arabidopsis ethylene-responsive element binding factors act as transcriptional activators or repressors of GCC box-mediated gene expression. Plant Cell 2000, 12, 393–404. [Google Scholar]
  31. Ouaked, F.; Rozhon, W.; Lecourieux, D.; Hirt, H. A MAPK pathway mediates ethylene signaling in plants. Embo. J. 2003, 22, 1282–1288. [Google Scholar] [CrossRef] [PubMed] [Green Version]
  32. Strader, L.C.; Chen, G.L.; Bartel, B. Ethylene directs auxin to control root cell expansion. Plant J. 2010, 64, 874–884. [Google Scholar] [CrossRef] [PubMed] [Green Version]
  33. Chen, M.; Lai, H.; Zheng, S.; Li, M.; Ma, X.; Wu, P. Effects of exogenous ethylene on growth and phosphorus use efficiency of Chinese fir seedlings under phosphorus stress. Sci. Silvae Sin. 2021, 57, 43–50. [Google Scholar]
  34. Clay, N.; Adio, A.; Denoux, C.; Jander, G.; Ausubel, F. Glucosinolate metabolites required for an Arabidopsis innate immune response. Science 2009, 323, 95–101. [Google Scholar] [CrossRef] [Green Version]
  35. Pilar López-Gresa, M.; Torres, C.; Campos, L.; Lisón, P.; Rodrigo, I.; María Bellés, J.; Conejero, V. Identification of defence metabolites in tomato plants infected by the bacterial pathogen Pseudomonas syringae. Env. Exp. Bot. 2011, 74, 216–228. [Google Scholar] [CrossRef]
  36. Diezel, C.; Allmann, S.; Baldwin, I. Mechanisms of optimal defense patterns in Nicotiana attenuata: Flowering attenuates herbivory-elicited ethylene and jasmonate signaling. J. Integr. Plant Biol. 2011, 53, 971–983. [Google Scholar] [CrossRef] [PubMed]
  37. Dubos, C.; Le Gourrierec, J.; Baudry, A.; Huep, G.; Lanet, E.; Debeaujon, I.; Routaboul, J.; Alboresi, A.; Weisshaar, B.; Lepiniec, L. MYBL2 is a new regulator of flavonoid biosynthesis in Arabidopsis thaliana. Plant J. 2008, 55, 940–953. [Google Scholar] [CrossRef] [PubMed]
  38. Jeong, C.; Chakrabarty, D.; Hahn, E.; Lee, H.; Paek, K. Effects of oxygen, carbon dioxide and ethylene on growth and bioactive compound production in bioreactor culture of ginseng adventitious roots. Biochem. Eng. J. 2006, 27, 252–263. [Google Scholar] [CrossRef]
  39. Dangl, J.; Jones, J. Plant pathogens and integrated defence responses to infection. Nature 2001, 411, 826–833. [Google Scholar] [CrossRef]
  40. Jeong, S.; Das, P.; Jeoung, S.; Song, J.; Lee, H.; Kim, Y.; Kim, W.; Park, Y.; Yoo, S.; Choi, S.; et al. Ethylene suppression of sugar-induced anthocyanin pigmentation in Arabidopsis. Plant Physiol. 2010, 154, 1514–1531. [Google Scholar] [CrossRef] [Green Version]
  41. Michaelson, L.; Napier, J.; Molino, D.; Faure, J. Plant sphingolipids: Their importance in cellular organization and adaption. Biochim. Biophys. Acta 2016, 1861, 1329–1335. [Google Scholar] [CrossRef]
  42. Nadira, U.; Ahmed, I.; Wu, F.; Zhang, G. The regulation of root growth in response to phosphorus deficiency mediated by phytohormones in a Tibetan wild barley accession. Acta Physiol. Plant. 2016, 38, 105. [Google Scholar] [CrossRef]
  43. Lei, K.; Zhou, H.; Gu, D.; An, G. The involvement of abscisic acid-insensitive mutants in low phosphate stress responses during rhizosphere acidification, anthocyanin accumulation and Pi homeostasis in Arabidopsis. Plant Sci. 2022, 322, 111358. [Google Scholar] [CrossRef] [PubMed]
  44. Perez-torres, C.; Lopezbucio, J.; Cruzramirez, A.; Ibarralaclette, E.; Dharmasiri, S.; Estelle, M.; Herrera-Estrella, L. Phosphate availability alters lateral root development in Arabidopsis by modulating auxin sensitivity via a mechanism involving the TIR1 auxin receptor. Plant Cell 2008, 20, 3258–3272. [Google Scholar] [CrossRef] [PubMed] [Green Version]
  45. Fredeen, A.; Raab, T.; Rao, I.; Terry, N. Effects of phosphorus nutrition on photosynthesis in Glycine max (L.) Merr. Planta 1990, 181, 399–405. [Google Scholar] [CrossRef]
  46. Gniazdowska, A.; Rychter, A. Nitrate uptake by bean (Phaseolus vulgaris L.) roots under phosphate deficiency. Plant Soil 2000, 226, 79–85. [Google Scholar] [CrossRef]
  47. Xu, H.; Weng, X.; Yang, Y. Effect of phosphorus deficiency on the photosynthetic characteristics of rice plants. Russ. J. Plant Physiol. 2007, 54, 741–748. [Google Scholar] [CrossRef]
  48. Meng, X.; Chen, W.; Wang, Y.; Huang, Z.; Ye, X.; Chen, L.; Yang, L. Effects of phosphorus deficiency on the absorption of mineral nutrients, photosynthetic system performance and antioxidant metabolism in Citrus grandis. PLoS ONE 2021, 16, e0246944. [Google Scholar] [CrossRef]
  49. Li, L.; Liu, C.; Lian, X. Gene expression profiles in rice roots under low phosphorus stress. Plant Mol. Biol. 2010, 72, 423–432. [Google Scholar] [CrossRef]
Figure 1. The different phenotypes in the Chinese fir clones with different Pi efficiency. (A) The Pi-tolerant clone C4. (B) The Pi-sensitive clone C5.
Forests 14 01203 g001
Figure 2. The changes of total P concentration of Pi-sensitive clone C5 under Pi-deficiency stress. (A) The total P concentration in the roots. (B) The total P concentration in the stems and leaves. Asterisks denote significant differences (p < 0.05) between −P and +P treatments, which were assessed by Student’s t-test.
Forests 14 01203 g002
Figure 3. Temporal characteristics of the Pi-responsive genes in Pi-sensitive clone C5. (AE) Volcano map of differentially expressed genes from the transcriptome data of Pi-sensitive clones. (F) Venn map of differentially expressed genes.
Forests 14 01203 g003
Figure 4. The correlation between modules and traits. (A) Module–trait relationship. Each row corresponds to a module, while each column corresponds to the phosphate accumulation in the whole plant at different treatment timepoints. Each cell contains a corresponding correlation. (B) The correlation between gene significance and module membership in the three modules with an absolute correlation coefficient >0.85 (p < 0.01). (C) Gene co-expression network of 60 hub genes in turquoise, light green, and dark orange modules. The size of the circles indicated the degree value: large indicates a high value and small indicates a low value. (D) The expression heat map of 60 hub genes.
Forests 14 01203 g004aForests 14 01203 g004b
Figure 5. Expression profile of response genes to Pi-deficiency stress in Pi-tolerant clone C4 and Pi-sensitive clones C5. (A) The DEGs significantly enriched in plant hormone signaling pathways (ko04075). (B) The DEGs significantly enriched in the photosynthesis pathway (ko00195). (C) The DEGs significantly enriched in the oxidative phosphorylation pathway (ko00190).
Forests 14 01203 g005aForests 14 01203 g005b
Figure 6. Validation of DEGS data by qRT-PCR with Gene1, Gene2, Gene3, Gene4 and Gene5 at different time point under Pi-deficiency stress. The error line in the figure represents the standard deviation of the average value (n = 3). The abscissa letters represent five randomly selected genes, Gene1: c243749.graph_c0, Gene2: c220976.graph_c1, Gene3: c236464.graph_c0, Gene4: c237148.graph_c0, Gene5: c239642.graph_c0. Different letters within each panel indicate p < 0.05, according to Duncan’s test.
Forests 14 01203 g006
Figure 7. Simulation diagram of response of Pi-sensitive clone C5 to Pi-deficiency stress.
Forests 14 01203 g007
Figure 8. Simplified schematic diagram of oxidative phosphorylation pathway of Pi-tolerant clone C4 and Pi-sensitive clone C5. Some putative genes which were significantly up-or down-regulated are shown with the corresponding grading.
Forests 14 01203 g008
Table 1. F-value in variance analysis of morphological and physiological traits after 3 months Pi-deficient stress.
TraitSource of Variation
GenotypePi ConcentrationGenotype × Pi Concentration
Plantlets height increment8.76 **9.77 **0.32
Plantlets ground-diameter increment7.41 **5.50 *0.11
Root dry mass 6.63 **8.34 **1.59
Stem dry mass9.59 **11.65 **2.86 *
Leaf dry mass9.12 **8.88 **1.64
Total dry mass10.19 **13.82 **2.08
Root-shoot ratio6.85 **1.331.55
Total root length61.31 **12.83 **1.12
Total root surface area23.85 **5.24 *0.42
Total root volume17.27 **8.03 **0.48
Average root diameter6.71 **24.66 **1.41
Leaf thickness11.24 **2.683.40 *
Leaf length9.96 **6.25 *0.87
Leaf surface area8.84 **8.26 **3.01 *
Leaf volume7.94 **8.31 **3.20 *
Leaf mass per area5.90 **8.15 **0.41
Root P content2.52 *10.97 **1.26
Total P content6.63 **15.57 **1.51
Total N content13.54 **20.20 **0.85
Total K content19.11 **22.74 **1.32
Total Ca content7.63 **16.11 **1.79
Total Mg content7.30 **16.43 **0.77
Root P utilization efficiency5.40 **17.90 **4.47 **
Total P utilization efficiency2.59 *4.69 *0.86
* Significant at p < 0.05; ** Significant at p < 0.01.
Table 2. Statistics of DEGs of Pi-sensitive and Pi-tolerant clones.
Gene SetTotal Number of DEGsUp-RegulatedDown-Regulated
+Pc5 _vs._ −Pc5812840484080
+Pc4 _vs._ −Pc4482226
+Pc5 _vs._+Pc4498126922289
−Pc5 _vs._ −Pc4837141144257
Table 3. List of the top five KEGG pathway categories significantly enriched by DEGs.
Gene SetKEGG CategoryPathway IDUPDownp-Value
+Pc4 _vs._ −Pc4Oxidative phosphorylationko001904 0.00013
Photosynthesisko001952 0.00743
Diterpenoid biosynthesisko009041 0.04714
Zeatin biosynthesisko00908 10.01785
+Pc5 _vs._ −Pc5Endocytosisko0414439 3.30 × 10⁻⁵
Plant-pathogen interactionko0462629 0.00024
Glycerophospholipid metabolismko0056421 0.00041
alpha-Linolenic acid metabolismko0059217 0.00043
Terpenoid backbone biosynthesisko0090015 0.00049
Plant hormone signal transductionko04075 520.00018
Cutin, suberine and wax biosynthesisko00073 110.00031
Other glycan degradationko00511 100.00034
Starch and sucrose metabolismko00500 510.00067
Carotenoid biosynthesisko00906 140.00084
Disclaimer/Publisher’s Note: The statements, opinions and data contained in all publications are solely those of the individual author(s) and contributor(s) and not of MDPI and/or the editor(s). MDPI and/or the editor(s) disclaim responsibility for any injury to people or property resulting from any ideas, methods, instructions or products referred to in the content.

