Article

Post-Fire Evolution of Soil Nitrogen in a Dahurian Larch (Larix gmelinii) Forest, Northeast China

Key Laboratory of Sustainable Forest Ecosystem Management-Ministry of Education, College of Forestry, Northeast Forestry University, 26 Hexing Road, Harbin 150040, China
*
Author to whom correspondence should be addressed.
Forests 2023, 14(6), 1178; https://doi.org/10.3390/f14061178
Submission received: 11 May 2023 / Revised: 31 May 2023 / Accepted: 5 June 2023 / Published: 7 June 2023
(This article belongs to the Special Issue Effects of Disturbances on Forest Soil Biochemistry)

Abstract

:
This study investigates the evolution of soil nitrogen (N) contents and forms along a 17-year wildfire chronosequence in the Daxing’an Mountains. Surface soil and subsoil samples were collected during different recovery periods after wildfires. Then, the mineral N (i.e., NH4+-N and NO3-N) and amino acid-N (AAN) contents in the soil extracts were measured and used to calculate the different ratios as indicators of the N forms. The results showed that the NH4+-N, NO3-N, and AAN contents increased immediately after the wildfire. With vegetation restoration, the NH4+-N and NO3-N contents became similar to those of unburned forests nine years and two months after the wildfire, respectively. The AAN content was mostly recovered one year post-fire. The wildfire did not lead to substantial changes in the mineral N form, but the ratio significantly increased and recovered after nine years. The soil available N form was altered by wildfires. After the wildfire, the dominant available N form changed from equivalent AAN and mineral N to a predominance of AAN in the growing season, and the predominance of AAN decreased to varying degrees in the non-growing season. With the recovery of the white birch and Dahurian larch, AAN again became the dominant N form, but the predominance of AAN was low before the freeze-up. Our study demonstrates that wildfires directly affect the soil N contents and forms, and such effects could be diminished by the restoration of the soil environment and vegetation over time.

1. Introduction

Nitrogen (N) is an essential nutrient for plants and an important limiting factor for forest productivity [1,2,3,4]. Mineral N, as an available N source, has been commonly studied in the field of plant nutrition [5,6]; however, an increasing number of studies have confirmed the utilization of organic N sources by plants over the past 30 years [7,8,9,10,11,12]. Notably, in natural ecosystems such as arctic tundra [13,14,15], alpine communities [16,17,18], and boreal forests [19,20], plants rely heavily on organic N forms (dominated by amino acids).
N is sensitive to fire. It begins to volatilize at 200 °C, and more than half of the N in organic matter is lost once the temperature exceeds 500 °C [21]. The soil N pool and availability are largely determined by the fire severity [22,23,24,25], fire frequency [26,27,28], fire type [29,30], and recovery time [31,32]. Previous studies have explored the changes that occur in the soil NH4+-N and NO3-N contents in response to wildfire and have confirmed that wildfires induce short-term increases in the mineral N content, which subsequently returns to its pre-fire level over a period of years to decades. In boreal coniferous forests, the soil NH4+-N content increases significantly 1–5 years after a wildfire and returns to (or becomes even lower than) its pre-fire level approximately 10 years post-fire [33,34,35,36]. Moreover, the soil NO3-N content initiates a temporary pulse and peaks approximately 1 year after a wildfire; after approximately 10 years, the NO3-N content remains higher than the pre-fire level and returns to or becomes lower than its pre-fire level only after approximately 25 years [35,37,38,39,40]. The preference of plants to take up different chemical forms of N exists at the species level, and the changes in soil N forms that occur following wildfires are closely linked to the restoration of vegetation [41]. While the literature has confirmed the change regulations of the soil mineral N content in wildfire chronosequences, little attention has been given to assessing the changes in soil mineral N forms (i.e., the NH4+-N/NO3-N ratio).
Recently, research advances in soil organic N sources have accelerated. In arctic tundra [13], alpine communities [16], boreal coniferous forests [19,20], and Taiga forests [42], because low temperatures limit the mineralization of organic N, the soil amino acid-N (AAN) concentration often exceeds that of mineral N, and it has been established that plants preferentially absorb AAN over mineral N [9,14,15,17]. Scarce studies have explored the effects of wildfires on soil AAN. A few studies have focused on scrub and grassland ecosystems, but no general conclusions have been drawn [43,44,45,46]. In those studies, the soil AAN in semiarid shrublands decreased by 16.67%–23.16% after a fire [45], increased by 9.3%–20.3% in savanna and subtropical humid shrub ecosystems after a fire [44,46], and was negatively correlated with the burn severity in temperate Mediterranean shrub soils [43]. Moreover, this case was also observed in burned forests. After a wildfire, Leduc and Rothstein found that the AAN content in a jack pine forest decreased gradually 4–10 years after the burn, increased rapidly 15–22 years later, and was highest 46 years later [47]. Lopez-Martin et al. found that the content of soil-extractable amino acids 7 years after a wildfire was nearly 1.4 times greater than that in an unburned forest in southern Spain [48]. At this point, the evolution of the soil AAN content in a wildfire chronosequence still needs to be supported by further research, and the form of soil available N (i.e., the AAN/mineral N ratio) based on AAN availability is a knowledge gap.
The Daxing’an Mountains are the highest-latitude region in northeast China; in this area, the forests are frequently affected by wildfires. Dahurian larch (Larix gmelinii) is the predominant tree species in this region, and previous studies have confirmed its ability to efficiently absorb and utilize NH4+-N, NO3-N, and AAN, among which the latter is the most important N form for this species [19,49]. In the Daxing’an Mountains, the soil mineral N content increased immediately after wildfires and then gradually decreased as the vegetation recovered [23,35,36,38,40]; however, the form of mineral N, the AAN content, and the form of available N have not yet been quantified. After wildfires, we currently know little about what changes occur in the contents and forms of N, such as AAN, what kind of evolution regulation occurs during the vegetation restoration process, and how these mechanisms affect vegetation restoration at different stages. Therefore, the topic of interest addressed in this research was how the soil N contents evolved along a 17-year wildfire chronosequence in a Dahurian larch forest. Furthermore, we intended to obtain further insight into the evolutionary regulation of soil N forms along this chronosequence.

2. Materials and Methods

2.1. Study Site

This research was conducted at the Huzhong Forestry Bureau, located in the Da Xing’an Mountains, northeast China (51°14′–52°25′ N, 122°39′–124°21′ E). The study area has a cold temperate continental monsoonal climate characterized by long, cold winters and short, hot summers. The mean annual temperature is −4.3 °C, and the absolute maximum temperature is 32 °C, while the absolute minimum temperature is −52 °C. The mean annual precipitation is 497.7 mm. The vegetation at this site is composed mainly of Dahurian larch (Larix gmelinii) forests. The understories are dominated by Ledum palustre, Vaccinium vitis-idaea, Carex sp., and Vicia Bungei. The soil type is Gleyic Umbri-Gelic Cambosols and Albic Umbri-Gelic Cambosols (CST: Cooperative Research Group on Chinese Soil Taxonomy, 2001), with pH values ranging from 4.5 to 5.0. The hydrolyzed N content in this area is approximately 147.19 mg/kg, while the total N content is about 5.61 g/kg.
In this study, we investigated an unburned plot and four plots representing different recovery stages to simulate a wildfire chronosequence. These plots were distributed to ensure that their topography, soil types, and pre-wildfire dominant tree species (Dahurian larch) were similar, thus ensuring comparability. The specific vegetation restoration process is shown in Table 1.

2.2. Soil Sampling and Analyses

The method of space-for-time substitution was adopted. The design consisted of three 30 × 30 m plots each of burned and unburned forest areas, and soil cores were collected by using a 5-cm-diameter hand-held sampler in each plot in June (just after the soil thaw), August (in the middle of the growing season), and October (just before the soil freeze-up) of 2017. In this study, we set two sampling depths, including the surface soil (from depths of 0 to 5 cm) and subsoil (from depths of 5 to 10 cm). Notably, due to the extremely thin soil layer in the sample plot, no subsoil samples were collected in the wildfire year. All soil samples were air-dried at 55 °C and passed through a 2 mm sieve prior to the chemical analyses.
Soil NH4+-N, NO3-N, and AAN were extracted with 1 mol L−1 KCl and stored at −20 °C before analysis. The soil NH4+-N and NO3-N concentrations were analyzed with a continuous flow analyzer (AA3, SEAL analytical, Germany) [50]. The AAN concentration was analyzed through the ninhydrin colorimetric method, and the optical absorbance (570 nm) of the samples was compared with a standard curve using leucine [51].

2.3. Statistical Analysis

Statistical processing was performed with SPSS 22.0 and Microsoft Excel 2010. One-way analysis of variance (ANOVA) was used to test the differences in the NH4+-N, NO3-N, and AAN contents and N forms. The least significant difference method (LSD) was used for multiple comparison analysis to compare the differences among means (p < 0.05). The figures were prepared using GraphPad Prism 8.0.

3. Results

3.1. Evolution of the Soil N Contents in the Wildfire Chronosequence

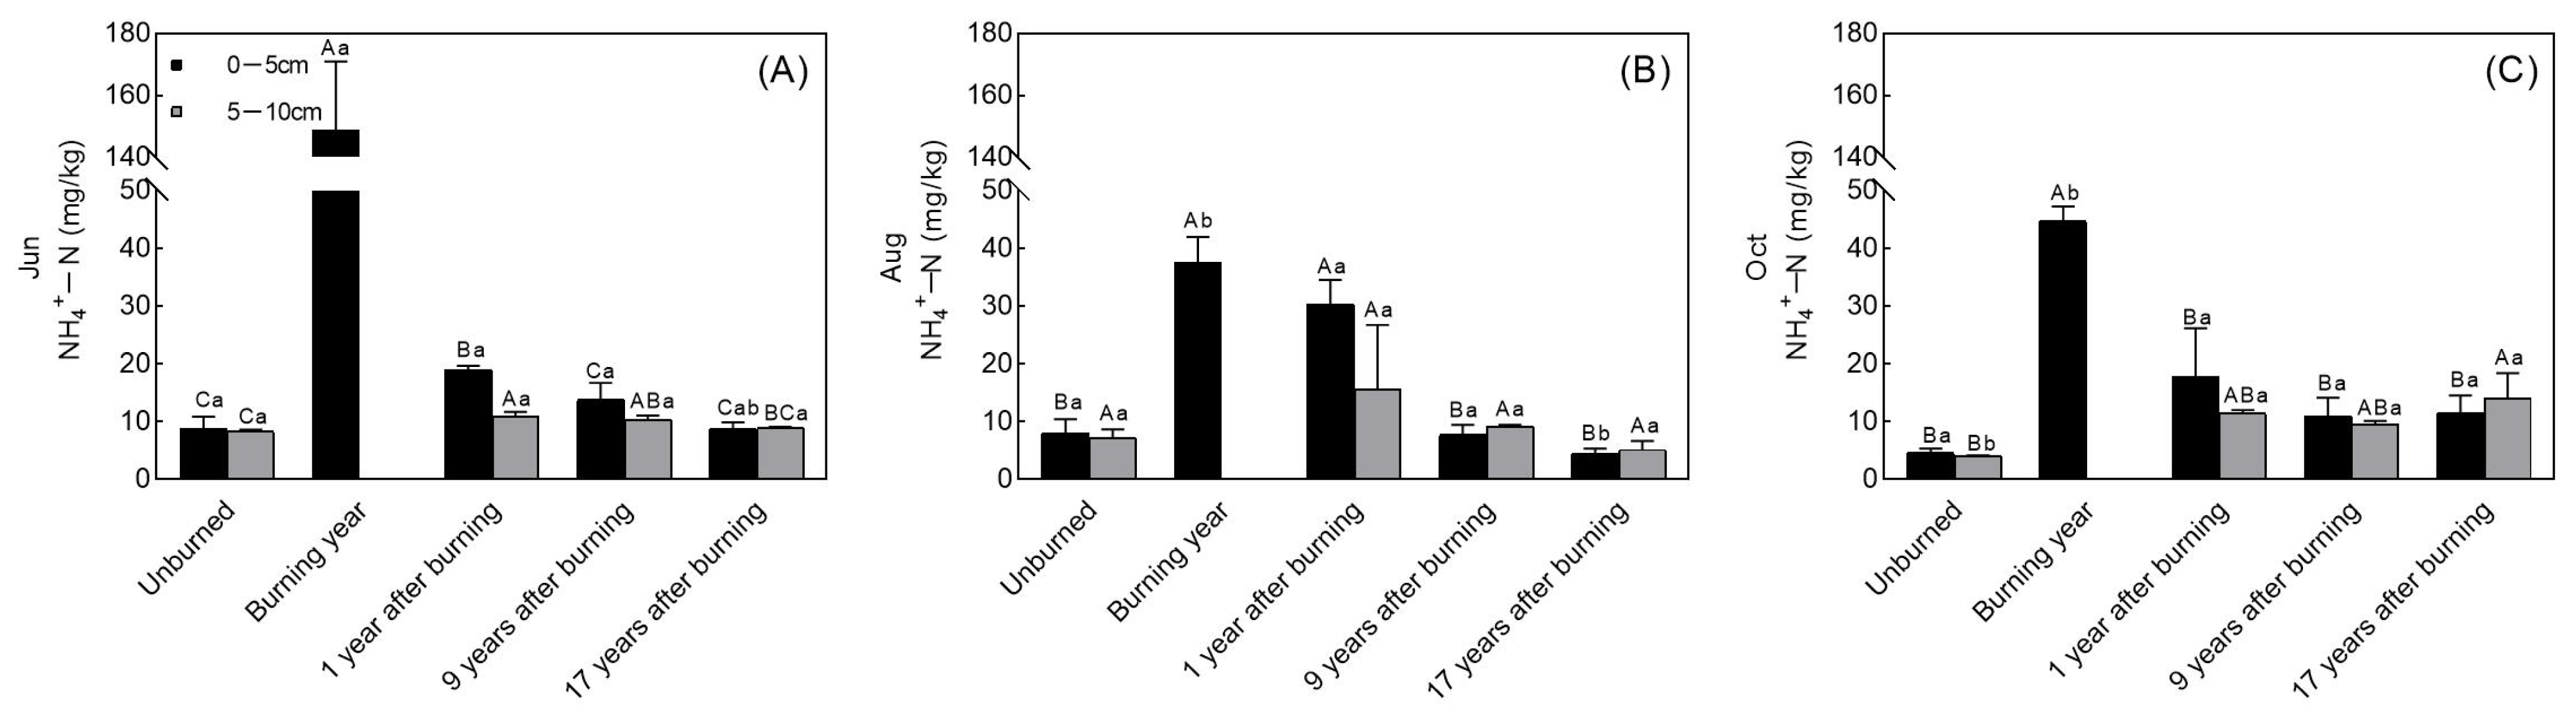
3.1.1. Soil NH4+-N Content
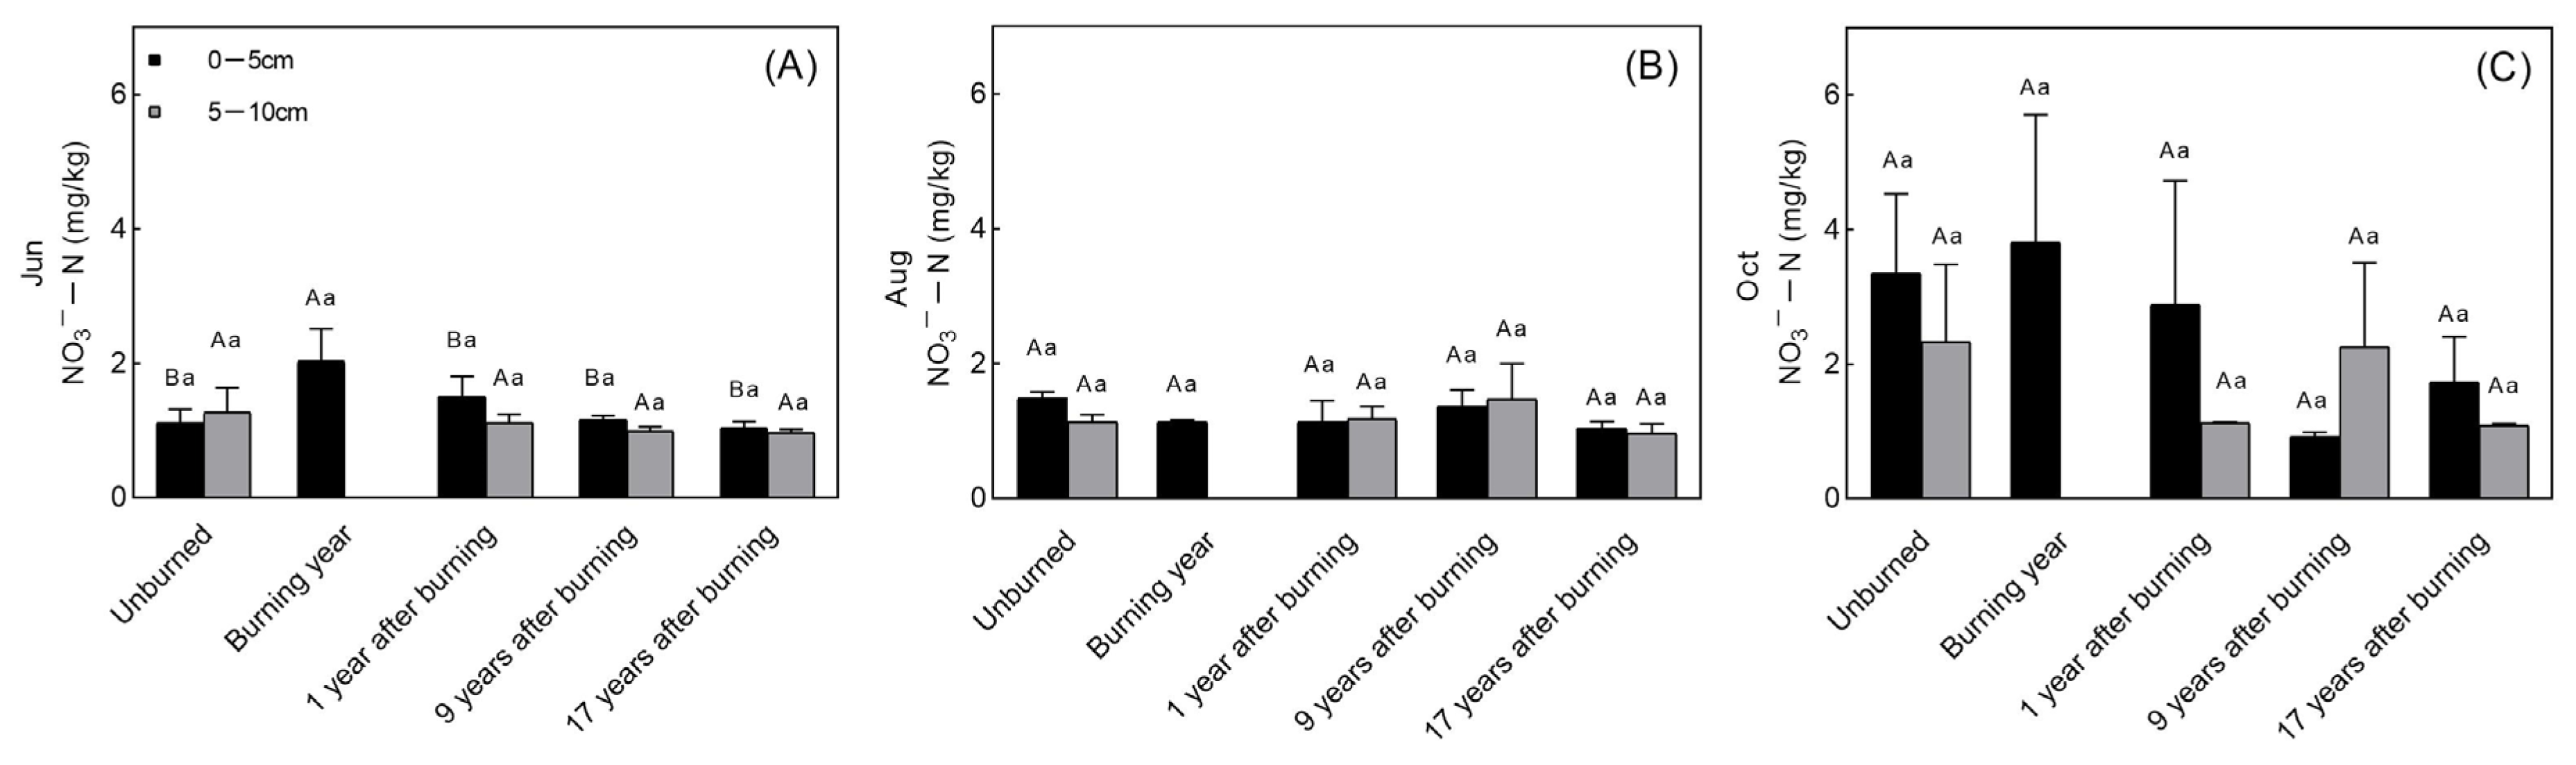
In the wildfire chronosequence, the soil NH4+-N content increased significantly in the same month of burning (June of the burning year) and subsequently declined gradually; the value was not significantly different from those observed in the unburned plots 9 years after the wildfire (Figure 1).
In the wildfire year, the NH4+-N content in the surface soil was significantly higher in the burned plots than in the unburned plots. In June, the NH4+-N contents in the burned plots were approximately 17 times higher than those in the unburned plots (p < 0.05). The NH4+-N content was 74.7% lower in August than in June (p < 0.05), and no further content changes were observed in October.
One year after burning, the soil NH4+-N contents were lower than those measured in the wildfire year but were still significantly higher than those in the unburned plots (except in October). In June, one year after burning, the NH4+-N content in the surface soil was still significantly lower (by 59.9%) than that measured in October of the burning year (p < 0.05). In August and October, this value had not changed significantly compared to June, but the NH4+-N content did not differ significantly from those in the unburned plots in October. This case was also observed in the subsoil. In June, the soil NH4+-N contents in the burned plots were significantly higher than those in the unburned plots (p < 0.05).
Nine years after burning, the NH4+-N contents in the surface soil did not differ significantly from those in the unburned plots and were not significantly different among June, August, and October. Unlike in the surface soil, the subsoil content was still significantly higher in the burned plots than in the unburned plots in June (p < 0.05).
Compared to the values measured nine years after burning, no further changes in the NH4+-N content in the surface soil were observed in the burned plots seventeen years after burning. Notably, in October, the content in surface soil was 1.5 times higher than in August, and the NH4+-N content in the subsoil was still significantly higher than that in the unburned plots (p < 0.05).

3.1.2. Soil NO3-N Content

In the wildfire chronosequence, the soil NO3-N content increased significantly in the same month as the wildfire; however, it was not significantly different from that in the unburned plots from two months to seventeen years after the wildfire (Figure 2).
In the same month as the wildfire, the NO3-N content in the surface soil increased approximately twice as much as that in the unburned plots (p < 0.05). Then, it significantly decreased, after which it was not significantly different from that in the unburned plots in August or October.
At various time points thereafter, the NO3-N content, whether in the surface soil or subsoil, did not differ significantly from that in the unburned plots.

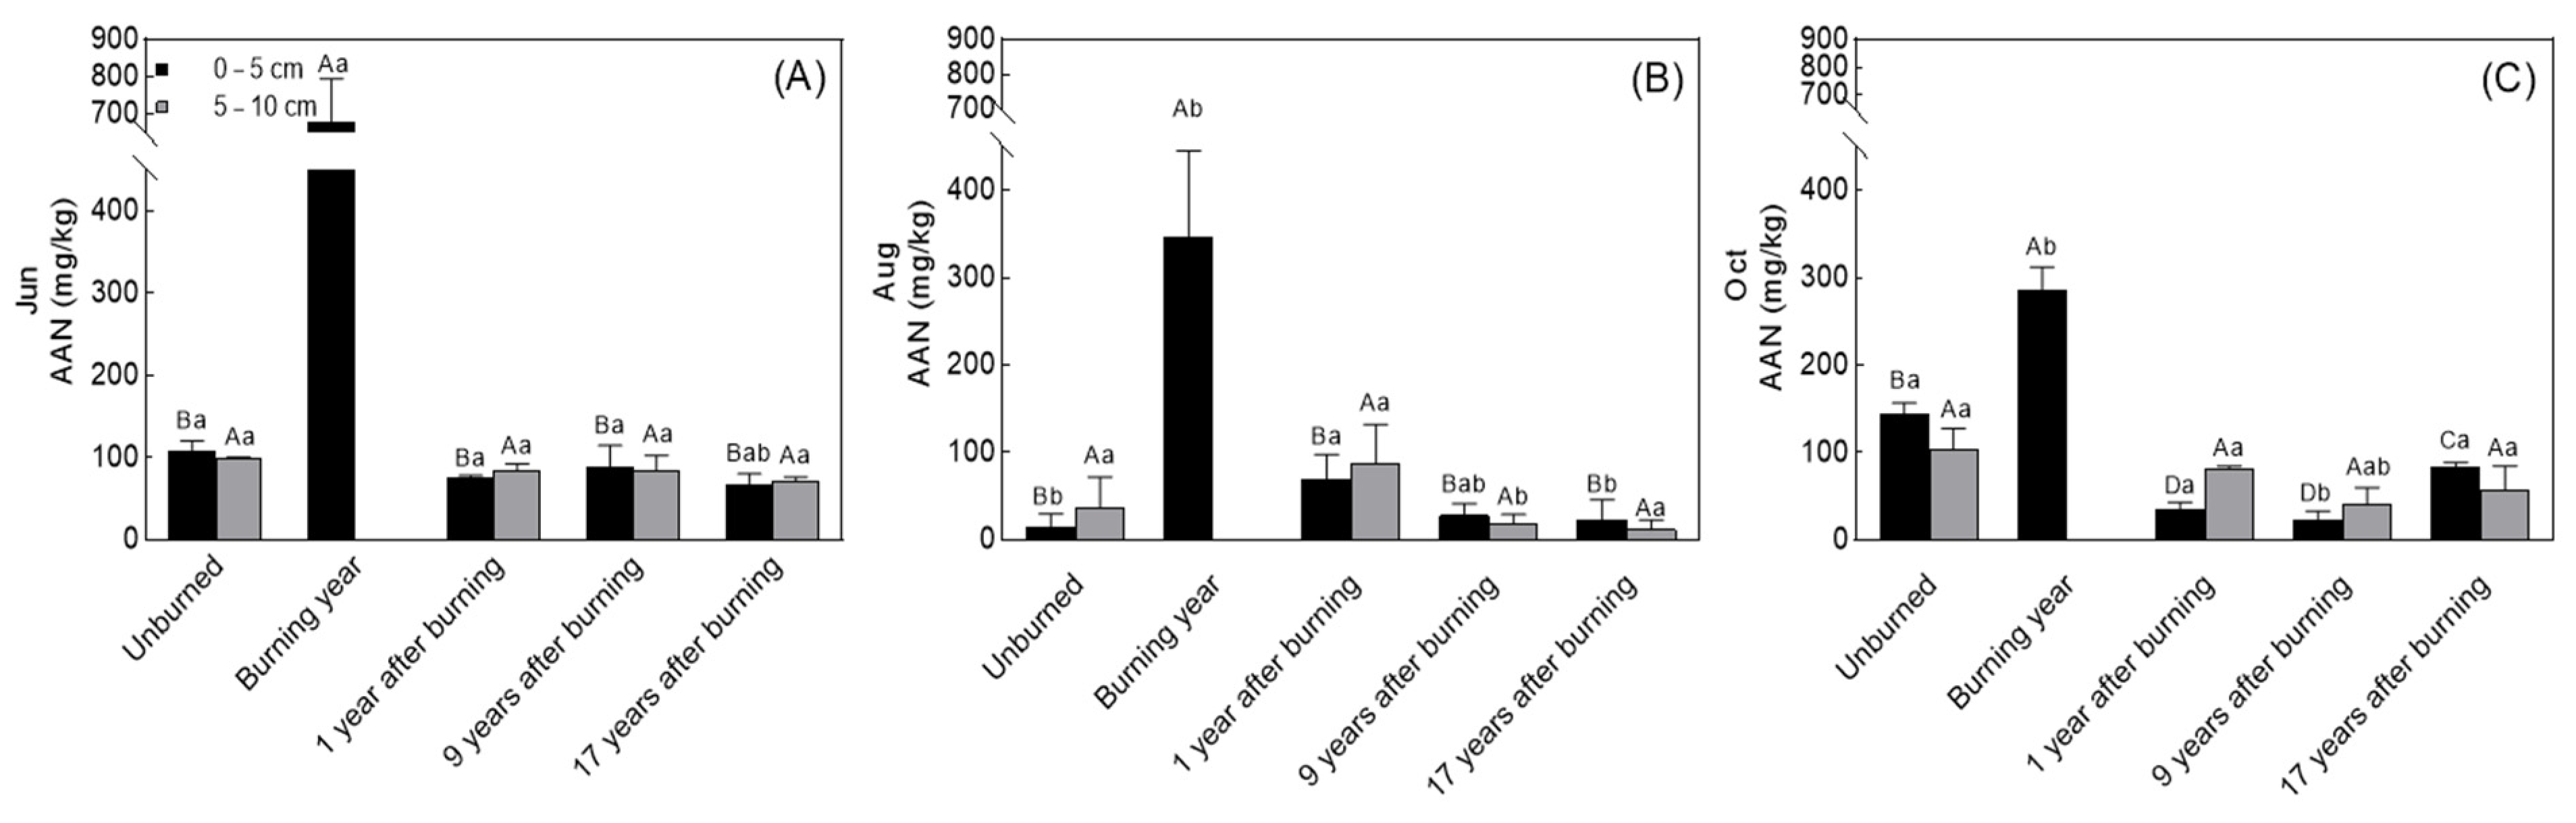
3.1.3. Soil AAN Content

In the wildfire chronosequence, the soil AAN content increased significantly in the same month as the wildfire and then gradually decreased; this content was not significantly different from that in the unburned plots from one year to seventeen years after the wildfire (except in October, when it was lower than that in the unburned plots) (Figure 3).
In the same year as the wildfire, the AAN content in the surface soil increased significantly. In June, it increased sharply from 108.83 mg·kg−1 to 676.31 mg·kg−1 (p < 0.05). In August, the AAN content was 49.0% lower than that in June (p < 0.05), and no further changes were observed in October.
In June, one year after the wildfire, the AAN content in the surface soil was significantly reduced by 73.9% compared to that measured in October of the wildfire year (p < 0.05). At this time, no differences were observed between the unburned and burned plots. In August and October, the AAN content had not changed significantly compared with June. Notably, in October, the AAN content was significantly lower in the burned plots than in the unburned plots (p < 0.05). Furthermore, no significant difference was observed in the AAN content in the subsoil between the burned plots and unburned plots, and no significant differences were noted between June, August, and October.
Nine years after burning, the AAN contents in both the surface soil and subsoil of the burned plots did not differ significantly from those in the unburned plots in June and August. The contents exhibited seasonal fluctuations, and the lowest contents in the surface soil and subsoil appeared in October and August, respectively (p < 0.05). Notably, in the surface soil, the contents were significantly lower (by 85.1%) in the burned plots than in the unburned plots in October (p < 0.05).
Seventeen years after the wildfire, the AAN content in the surface soil was still significantly lower in the burned plots than in the unburned plots in October (p < 0.05). Moreover, it was 264.3%, significantly higher than in August (p < 0.05). Furthermore, the AAN content in the subsoil did not differ significantly between the burned and unburned plots, and no seasonal fluctuations were observed.

3.2. Evolution of Soil N Forms in the Wildfire Chronosequence

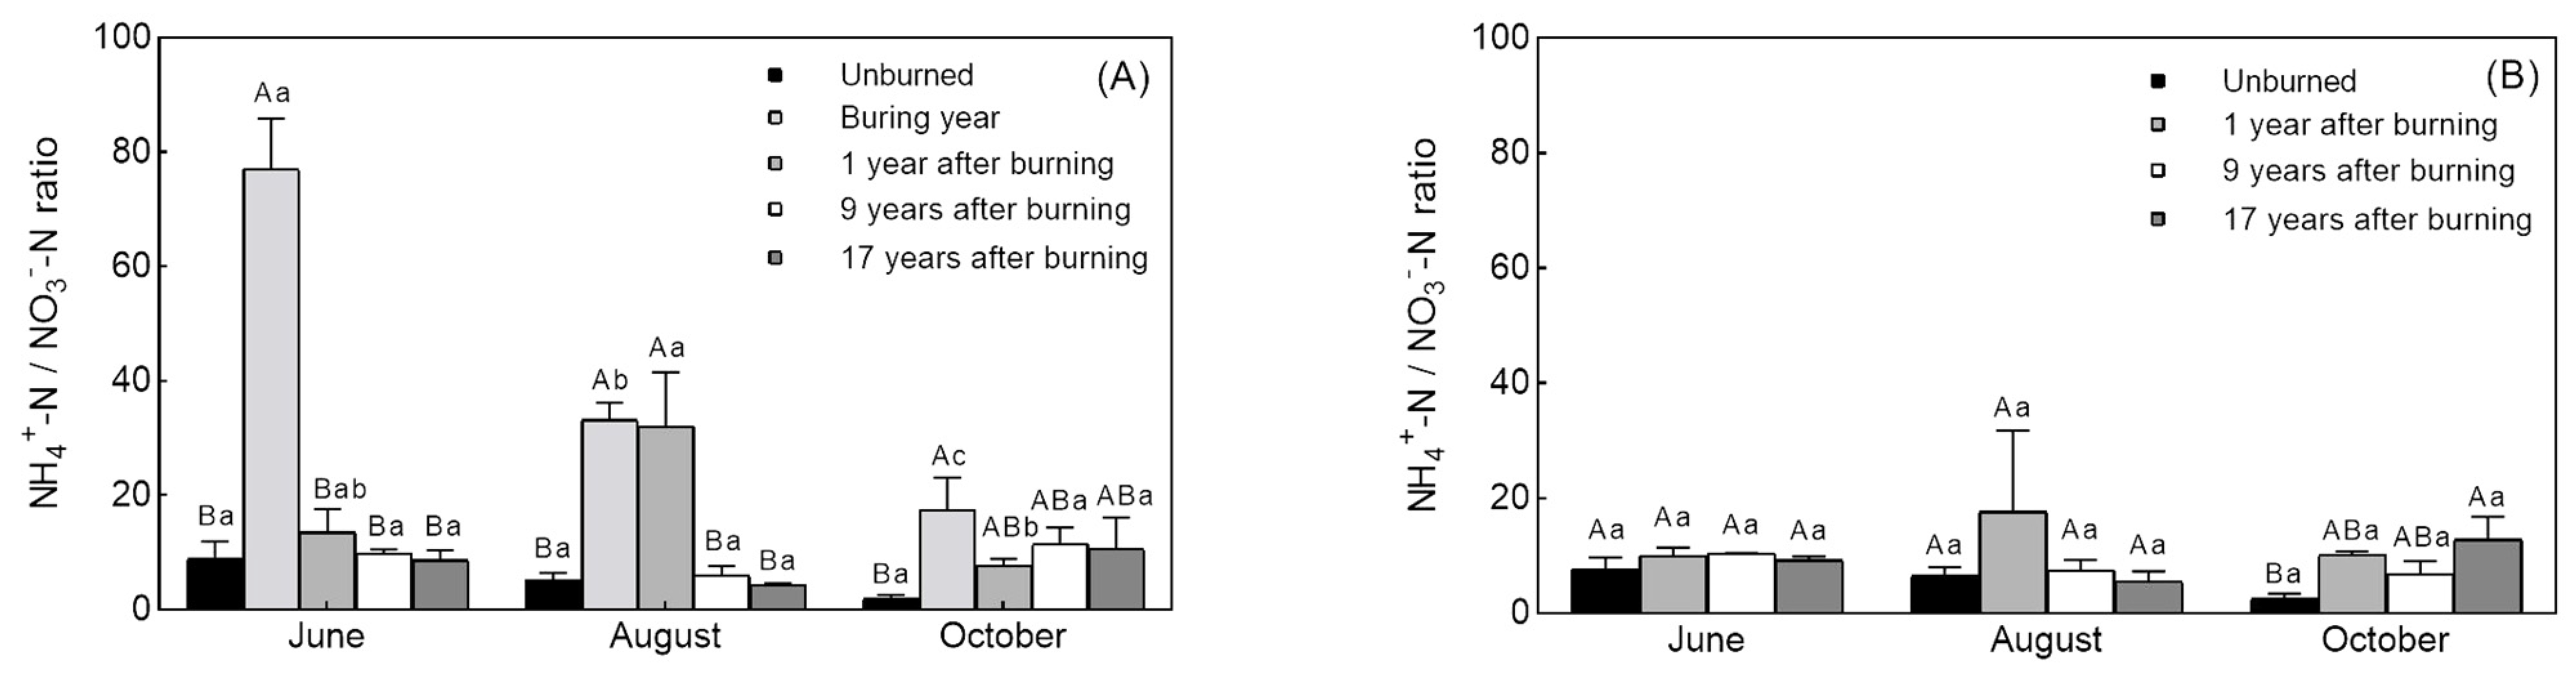
3.2.1. Form of Soil Mineral N

NH4+-N was the dominant mineral N form in the unburned plots. It was also the dominant N form in the burned plots after the wildfire. However, the NH4+-N/NO3-N ratio immediately increased after the wildfire and decreased with seasonal fluctuations; it did not differ significantly from that in the unburned plots nine years after the wildfire (Figure 4).
In the same year as the wildfire, the NH4+-N/NO3-N ratio in the surface soil of the burned plots was significantly higher than that in the unburned plots. In particular, the ratio increased sharply from 9/1 to 77/1 in June (p < 0.05). Then, it rapidly declined to 24/1 by August and to 12/1 by October (p < 0.05).
One year after burning, the NH4+-N/NO3-N ratio in the growing season was still higher in the burned plots than in the unburned plots. In June, the NH4+-N/NO3-N ratio in the surface soil did not change significantly compared to October in the wildfire year. In August, this ratio increased by 56.9% compared to June, but this difference was not significant; then, in October, it dropped by 72.8% compared to August (p < 0.05). For the subsoil, the NH4+-N/NO3-N ratio did not differ significantly between the burned and unburned plots, and there were no significant differences between June, August, and October.
Nine years and seventeen years after burning, the NH4+-N/NO3-N ratio, regardless of whether in the surface soil or subsoil, was not significantly different between the burned and unburned plots (except in the subsoil seventeen years after burning in October). In addition, there were no significant differences between June, August, and October.

3.2.2. Form of Soil-Available N

The form of available N in unburned plots showed seasonal fluctuations. The dominant form in June and October was AAN, but that in August was equal between AAN and mineral N. Severe wildfires drove significant changes in the available N form, and these changes were reflected by changes in the AAN/mineral N ratio (Figure 5).
In the same year as the wildfire, AAN was the dominant available N form at each sampled time point. The AAN/mineral N ratio in the surface soil decreased significantly to 5/1 in June (p < 0.05), then increased to 9/1 by August and decreased to 6/1 by October. Notably, the seasonal fluctuation pattern of the N form at this time was entirely different from that of the unburned plots.
One year after burning, the seasonal fluctuation pattern was similar to that in the unburned plots, and AAN was still the dominant available N form, but the AAN/mineral N ratio continued to decrease compared to that in the year of the wildfire. In June, August, and October, the AAN/mineral N ratios in the surface soil were 4/1, 2/1, and 5/1, respectively. For the subsoil, the dominant available N form was not significantly different from that in the surface soil.
Nine years and seventeen years after burning, regardless of whether in the surface soil or subsoil, the dominant available N form in burned plots was consistent with those in the unburned plots (i.e., the AAN/mineral N ratio was lowest in August). However, the AAN/mineral N ratios of both layers in October were still significantly lower in the burned plots than in the unburned plots (p < 0.05).

4. Discussion

4.1. Effect of Wildfire on the Evolution of the Soil Available N Content

4.1.1. Effect of Wildfire on the Evolution of the Soil NH4+-N Content

Our results show that a pulse in the NH4+-N content was observed in the same month as the wildfire; moreover, nine years after the wildfire was a time point of balance for post-fire forest recovery (Figure 1). The reason for the change in NH4+-N content in the wildfire chronosequence is very complicated (Table 2), which has its own emphasis at different time points.
In the same month as the wildfire, the soil NH4+-N content in the burned plots was approximately 17 times higher than that in unburned plots; this observed difference was significantly higher than that noticed in previous studies in Dahurian larch forest [35,36,38]. Unlike other studies conducted several months after the wildfire, we conducted continuous observations beginning three days after burning, and it is nearly certain that the NH4+-N content reached its maximum three days after the wildfire. The pulse in the NH4+-N content observed at this time was the result of the deposition of nutrient-rich ash from vegetation and litter [33,52]. In August, the significant decline in soil NH4+-N content can be attributed to soil erosion resulting from concentrated rainfall. Because wildfires can destroy the structure of the surface soil [53,54], the soil porosity significantly decreases following a wildfire [55], resulting in a significant increase in the surface runoff rate [56,57,58]. In October, the soil NH4+-N content had not changed further, suggesting that the NH4+-N inputs and outputs were in equilibrium [36,59].
The soil NH4+-N content decreased one year after the wildfire but was still significantly higher (2.1–3.8 times) than that in unburned plots. Our results are consistent with previous studies performed on Dahurian larch forests, which showed that the soil NH4+-N content increased 1.4–4.7 times one year after the wildfire [35,36]. The above results indicate that the effect of the wildfire on the soil NH4+-N content gradually diminished. No seasonal fluctuations in the NH4+-N content were observed; this may have been related to the fact that the vegetation, including nitrogen-fixing plants, had not recovered during this period.
Nine years after burning, the effect of the wildfire on the soil NH4+-N had diminished. At this time, ash leaching, biological organic matter mineralization, and soil erosion were no longer the main mechanisms responsible for the changes in the soil NH4+-N content. Young white birch trees were widely distributed in the recovery plots, and soil microorganisms were further restored [36]. The soil NH4+-N contents were not significantly different between June, August, and October, indicating that the NH4+-N inputs and outputs were in equilibrium.
Seventeen years after the wildfire, the soil NH4+-N content was relatively stable compared to nine years after burning. However, the soil NH4+-N content showed obvious seasonal fluctuation at this time. This fluctuation may have been related to the preferential absorption of NH4+-N by young Dahurian larch trees in the restoration plots during this period [19,49]. Therefore, the content decreased significantly during the growing season.

4.1.2. Effect of Wildfire on the Evolution of the Soil NO3-N Content

This study shows that the soil NO3-N content initiated a temporary pulse after the wildfire. This could be attributable to the deposition of nutrient-rich ash. In August, a high pH value may have promoted the establishment of autotrophic nitrifiers [60], and the higher NH4+-N substrate availability and temperature may have improved nitrification [57]. However, the NO3-N content obviously decreased due to the amount of leaching exceeding the amount of nitrification based on our data, and the NO3-N content in this wildfire chronosequence did not differ significantly from that in unburned plots since that time (Figure 2). The factors controlling the change in NO3-N content in different periods are summarized in Table 2.
We contend that the effect of the wildfire on the soil NO3-N did not disappear. Hu et al. found that the NO3-N content in a burned Dahurian larch forest was lower than that in the unburned plots 29 years after the wildfire [40]. Although we found that the NO3-N content did not differ significantly between the burned and unburned plots 2 months after burning, its mean in the wildfire chronosequence continued to decline during the non-growing season (except at the sampling point nine years after the wildfire). Hence, we cannot rule out the possibility that this content will continue to decrease at longer time scales. Similar to previous studies, we also found that the NO3-N content increased in early winter [61,62,63], suggesting that some natural conditions (temperature, humidity, litter, etc.) were beneficial for NO3-N accumulation in winter.

4.1.3. Effect of Wildfire on the Evolution of the Soil AAN Content

Leduc and Rothstein [47] found that the soil AAN content in jack pine forests fluctuated along a 55-year wildfire chronosequence, first decreasing gradually 4–10 years after burning and then increasing. Our findings support this conclusion that the AAN content decreased gradually during the ten years after burning, and we further identified a law of immediate changes after the wildfire (Figure 3). The factors controlling the change in AAN content in wildfire chronosequence are summarized in Table 2.
In the same month as the wildfire, the soil AAN content in the burned plots increased significantly due to the decomposition of a large number of nitrogenous organic compounds produced by the burning of aboveground plants [64]. In August, the soil AAN content dropped sharply by 49.0%, influenced by various factors, such as the elevated pH value [65], AAN mineralization [66,67,68], AAN leaching, and soil erosion. In October, the soil protease activity and AAN mineralization were limited by low temperatures [69], and AAN leaching was almost stagnated by reduced rainfall. The inputs and outputs of AAN showed no further changes.
One year after the wildfire, the vegetation conditions in the burned plots were not further restored compared to the same year as the wildfire, and the AAN content was further reduced. At this time, the soil AAN had almost no direct input from the decomposition of fresh litter, and the output to plants was basically stagnant. Climate factors, such as temperature and rainfall, drove changes in the soil AAN content during this period [66].
Nine years after the wildfire, young white birch trees were widely distributed in the restoration plots, and their litter was easily decomposed by soil microorganisms. The relatively high soil AAN contents measured in June may have been derived from the increased decomposition of nitrogenous organic compounds under repeated freeze–thaw cycles [70]. In August and October, the AAN content gradually decreased due to plant absorption and low-temperature inhibition, respectively [19,69].
Seventeen years after the wildfire, the forest was dominated by young Dahurian larch trees. In October, the soil AAN content was still significantly lower in the burned plots than in the unburned plots. This suggests that the effect of the wildfire on the soil AAN content had not disappeared at this point post-fire.

4.2. Effect of Wildfire on the Evolution of Soil N Forms

4.2.1. Effect of Wildfire on the Evolution of the Soil Mineral N Form

The soil mineral N form in the Dahurian larch forest did not change substantially after the wildfire. However, the NH4+-N/NO3-N ratio increased immediately after burning and then decreased as vegetation restoration progressed (Figure 4).
The change in the NH4+-N/NO3-N ratio in the wildfire chronosequence was driven mainly by the change in the soil NH4+-N content, except in October in the year of the wildfire (Figure 1). This reduced ratio was also related to the relatively high NO3-N content in October (Figure 2). This may have been caused by the increase in the NO3-N content often lagging behind that of the NH4+-N content [40].

4.2.2. Effect of Wildfire on the Evolution of the Soil Available N Form

Dahurian larch uses AAN and mineral N as the available N sources, especially AAN (e.g., N in the form of glycine and glutamic) [19,49]. We found that the dominant available N form changed from equivalent AAN and mineral N to a predominance of AAN in the growing season after the wildfire, and the predominance of AAN decreased to varying degrees in the non-growing season (Figure 5).
In the same year as the wildfire, the AAN and mineral N contents both first increased and then decreased, and whether they were increasing or decreasing, the mineral N change was greater than the AAN change (Figure 1 and Figure 3). Changes in the available N forms were driven mainly by NH4+-N.
One year after burning, decomposable plant-derived organic matter was absent in the burned plots. Both the AAN and mineral N contents had decreased, with the former decreasing slightly more than the latter (Figure 1 and Figure 3). Thus, the predominance of AAN continued to decrease.
Thereafter, the mineral N and AAN contents in the burned plots did not differ significantly from those in the unburned plots (except in October), and the seasonal fluctuation patterns of the available N form were also consistent. This result was probably related to vegetation restoration. Previous studies have confirmed that white birch and Dahurian larch mainly absorb AAN [19,49]. Our research confirmed that the predominance of AAN in these plots decreased obviously during the growing season. However, we found that the AAN/mineral N ratio in the burned plots still did not match that of the unburned plots.

5. Conclusions

The present study sheds light on the dynamic changes that occurred in the soil N contents and forms associated with retrogressive vegetation succession and season along a 17-year wildfire chronosequence in a Dahurian larch forest in northeast China. We found that both the mineral N and AAN contents exhibited pulsed increases after the wildfire, with NH4+-N (which accounted for more than 85% of the mineral N) taking a much longer time to recover than AAN. However, the seasonal AAN fluctuations were found to be more sensitive to fire disturbances than other N forms. Moreover, the N content of the subsoil was almost unaffected by the wildfire. Our results also showed that the wildfire did not alter the mineral N form; that is, NH4+-N was always the dominant form in the chronosequence. However, the NH4+-N/NO3-N ratio increased immediately after the wildfire. Furthermore, the soil available N form in the growing season was altered by wildfires and changed from an equivalent balance between AAN and mineral N to a predominance of AAN. This result was related not only to wildfire disturbance-driven changes in the soil N contents but also to retrogressive vegetation succession. This conclusion further supports the view that soil AAN is the predominant N source in cold temperate coniferous forests in the Daxing’an Mountains. After a wildfire, there are significant changes in wild plants, animals, and soil properties, which can last for decades or even centuries. All wildfires should be avoided as much as possible to maintain the stability of forest ecosystems.

Author Contributions

Conceptualization, Y.Z.; formal analysis, J.W. and J.K.; writing—original draft preparation, J.W.; writing—review and editing, J.W.; supervision, X.C. All authors have read and agreed to the published version of the manuscript.

Funding

This research was funded by the National Natural Science Foundation of China, grant number 31570597.

Data Availability Statement

The data presented in this study are available on request from the corresponding author. The data are not publicly available due to privacy.

Conflicts of Interest

The authors declare that they have no known competing financial interests or personal relationships that could have appeared to influence the work reported in this paper.

References

  1. Camarero, J.; Carrer, M. Bridging long-term wood functioning and nitrogen deposition to better understand changes in tree growth and forest productivity. Tree Physiol. 2017, 37, 1–3. [Google Scholar] [CrossRef] [PubMed] [Green Version]
  2. Nordin, A.; Högberg, P.; Näsholm, T. Soil nitrogen form and plant nitrogen uptake along a boreal forest productivity gradient. Oecologia 2001, 129, 125–132. [Google Scholar] [CrossRef] [PubMed]
  3. Wolf, K.; Veldkamp, E.; Homeier, J.; Martinson, G.O. Nitrogen availability links forest productivity, soil nitrous oxide and nitric oxide fluxes of a tropical montane forest in southern Ecuador. Glob. Biogeochem. Cycle 2011, 25, GB4009. [Google Scholar] [CrossRef]
  4. Yang, H. Effects of nitrogen and phosphorus addition on leaf nutrient characteristics in a subtropical forest. Trees 2018, 32, 383–391. [Google Scholar] [CrossRef]
  5. Chapin, F.S. The mineral nutrition of wild plants. Annu. Rev. Ecol. Syst. 1980, 11, 233–260. [Google Scholar] [CrossRef]
  6. Imsande, J.; Touraine, B. N Demand and the Regulation of Nitrate Uptake. Plant Physiol. 1994, 105, 3–7. [Google Scholar] [CrossRef] [Green Version]
  7. Chapin, F.S.; Moilanen, L.; Kielland, K. Preferential use of organic nitrogen for growth by a nonmycorrhizal Arctic sedge. Nature 1993, 361, 150–153. [Google Scholar] [CrossRef]
  8. Inselsbacher, E.; Nasholm, T. The below-ground perspective of forest plants: Soil provides mainly organic nitrogen for plants and mycorrhizal fungi. New Phytol. 2012, 195, 329–334. [Google Scholar] [CrossRef]
  9. Kielland, K. Role of free amino acids in the nitrogen economy of arctic cryptogams. Ecoscience 1997, 4, 75–79. [Google Scholar] [CrossRef]
  10. Lim, H.; Jamtgard, S.; Oren, R.; Gruffman, L.; Kunz, S.; Nasholm, T.; Inselsbacher, E. Organic nitrogen enhances nitrogen nutrition and early growth of Pinus sylvestris seedlings. Tree Physiol. 2022, 42, 513–522. [Google Scholar] [CrossRef]
  11. Nasholm, T.; Kielland, K.; Ganeteg, U. Uptake of organic nitrogen by plants. New Phytol. 2009, 182, 31–48. [Google Scholar] [CrossRef] [PubMed]
  12. Schimel, J.P.; Bennett, J. Nitrogen mineralization: Challenges of a changing paradigm. Ecology 2004, 85, 591–602. [Google Scholar] [CrossRef]
  13. Bret-Harte, M.S.; Mack, M.C.; Shaver, G.R.; Huebner, D.C.; Johnston, M.; Mojica, C.A.; Pizano, C.; Reiskind, J.A. The response of Arctic vegetation and soils following an unusually severe tundra fire. Philos. Trans. R. Soc. B-Biol. Sci. 2013, 368, 20120490. [Google Scholar] [CrossRef] [PubMed] [Green Version]
  14. Homyak, P.M.; Slessarev, E.W.; Hagerty, S.; Greene, A.C.; Marchus, K.; Dowdy, K.; Iverson, S.; Schimel, J.P. Amino acids dominate diffusive nitrogen fluxes across soil depths in acidic tussock tundra. New Phytol. 2021, 231, 2162–2173. [Google Scholar] [CrossRef] [PubMed]
  15. Weintraub, M.N.; Schimel, J.P. The seasonal dynamics of amino acids and other nutrients in Alaskan Arctic tundra soils. Biogeochemistry 2005, 73, 359–380. [Google Scholar] [CrossRef]
  16. Feng, Y.; Wang, J.; Yuan, K.; Zong, W.; Guo, D. Vegetation affects pool size and composition of amino acids in Tibetan alpine meadow soils. Geoderma 2018, 310, 44–52. [Google Scholar] [CrossRef]
  17. Miller, A.E.; Bowman, W.D. Alpine plants show species-level differences in the uptake of organic and inorganic nitrogen. Plant Soil 2003, 250, 283–292. [Google Scholar] [CrossRef]
  18. Zhang, Z.; Yuan, Y.; Liu, Q.; Yin, H. Plant nitrogen acquisition from inorganic and organic sources via root and mycelia pathways in ectomycorrhizal alpine forests. Soil Biol. Biochem. 2019, 136, 107517. [Google Scholar] [CrossRef]
  19. Gao, L.; Cui, X.; Hill, P.W.; Guo, Y. Uptake of various nitrogen forms by co-existing plant species in temperate and cold-temperate forests in northeast China. Appl. Soil Ecol. 2020, 147, 103398. [Google Scholar] [CrossRef]
  20. Näsholm, T.; Ekblad, A.; Nordin, A.; Giesler, R.; Högberg, M.; Högberg, P. Boreal forest plants take up organic nitrogen. Nature 1998, 392, 914–916. [Google Scholar] [CrossRef]
  21. Knicker, H. How does fire affect the nature and stability of soil organic nitrogen and carbon? A review. Biogeochemistry 2007, 85, 91–118. [Google Scholar] [CrossRef]
  22. Fernandez-Garcia, V.; Marcos, E.; Fernandez-Guisuraga, J.M.; Taboada, A.; Suarez-Seoane, S.; Calvo, L. Impact of burn severity on soil properties in a Pinus pinaster ecosystem immediately after fire. Int. J. Wildland Fire 2019, 28, 354–364. [Google Scholar] [CrossRef]
  23. Guo, A.; Guo, Y.; Cui, X. Effects of Different Intensities of Fire Disturbances on Soil Nutrients in a Pinus massoniana Forest in the Greater Xing’ an Mountain. J. North-East For. Univ. 2011, 39, 69–71. [Google Scholar] [CrossRef]
  24. Li, B.; Liu, G.; Li, W.; Liu, X. Effects of different wildfire intensities on soil organic carbon and soil nutrients in Pinus tabulaeformis forests in Pingquan County, Hebei Province. Ecol. Sci. 2018, 37, 35–44. [Google Scholar] [CrossRef]
  25. Vega, J.A.; Fontúrbel, T.; Merino, A.; Fernández, C.; Ferreiro, A.; Jiménez, E. Testing the ability of visual indicators of soil burn severity to reflect changes in soil chemical and microbial properties in pine forests and shrubland. Plant Soil 2013, 369, 73–91. [Google Scholar] [CrossRef]
  26. Hinojosa, M.B.; Albert-Belda, E.; Gomez-Munoz, B.; Moreno, J.M. High fire frequency reduces soil fertility underneath woody plant canopies of Mediterranean ecosystems. Sci. Total Environ. 2021, 752, 141877. [Google Scholar] [CrossRef]
  27. Muqaddas, B.; Chen, C.R.; Lewis, T.; Wild, C. Temporal dynamics of carbon and nitrogen in the surface soil and forest floor under different prescribed burning regimes. For. Ecol. Manag. 2016, 382, 110–119. [Google Scholar] [CrossRef]
  28. Nichols, L.; Shinneman, D.J.; McIlroy, S.K.; de Graaff, M.-A. Fire frequency impacts soil properties and processes in sagebrush steppe ecosystems of the Columbia Basin. Appl. Soil Ecol. 2021, 165, 103967. [Google Scholar] [CrossRef]
  29. Mugica, L.; Canals, R.M.; San Emeterio, L. Changes in soil nitrogen dynamics caused by prescribed fires in dense gorse lands in SW Pyrenees. Sci. Total Environ. 2018, 639, 175–185. [Google Scholar] [CrossRef]
  30. San Emeterio, L.; Mugica, L.; Ugarte, M.D.; Goicoa, T.; Canals, R.M. Sustainability of traditional pastoral fires in highlands under global change: Effects on soil function and nutrient cycling. Agric. Ecosyst. Environ. 2016, 235, 155–163. [Google Scholar] [CrossRef]
  31. Bowd, E.J.; Banks, S.C.; Strong, C.L.; Lindenmayer, D.B. Long-term impacts of wildfire and logging on forest soils. Nat. Geosci. 2019, 12, 113–118. [Google Scholar] [CrossRef]
  32. Durán, J.; Rodríguez, A.; Fernández-Palacios, J.M.; Gallardo, A. Changes in soil N and P availability in a Pinus canariensis fire chronosequence. For. Ecol. Manag. 2008, 256, 384–387. [Google Scholar] [CrossRef]
  33. Prieto-Fernandez, A.; Villar, M.C.; Carballas, M.; Carballas, T.T. Short-term effects of a wildfire on the nitrogen status and its mineralization kinetics in an atlantic forest soil. Soil Biol. Biochem. 1994, 25, 1657–1664. [Google Scholar] [CrossRef]
  34. Prieto-Fernandez, A.; Carballas, M.; Carballas, T. Inorganic and organic N pools in soils burned or heated: Immediate alterations and evolution after forest wildfires. Geoderma 2004, 121, 291–306. [Google Scholar] [CrossRef]
  35. Song, L.; He, P.; Cui, X. Effects of severe forest fire on soil habitat factors in Greater Xing an Mountains. Chin. J. Ecol. 2015, 34, 1809–1814. [Google Scholar] [CrossRef]
  36. Kong, J.; Yang, J. Short-and long-term effects of fire on soil properties in a Dahurian larch forest in Great Xingan Mountains. Chin. J. Ecol. 2014, 33, 1445–1450. [Google Scholar] [CrossRef]
  37. Koyama, A.; Kavanagh, K.L.; Stephan, K. Wildfire Effects on Soil Gross Nitrogen Transformation Rates in Coniferous Forests of Central Idaho, USA. Ecosystems 2010, 13, 1112–1126. [Google Scholar] [CrossRef]
  38. Zhu, G.; Hu, T.; Li, F.; Zhao, B.; Sun, L. Soil nitrogen mineralization rate and its impact factors in Larix gmelinii forest after different years fire disturbance. J. Cent. South Univ. For. Technol. 2018, 38, 88–96. [Google Scholar] [CrossRef]
  39. Driscoll, K.G.; Arocena, J.M.; Massicotte, H.B. Post-fire soil nitrogen content and vegetation composition in Sub-Boreal spruce forests of British Columbia’s central interior, Canada. For. Ecol. Manag. 1999, 121, 227–237. [Google Scholar] [CrossRef]
  40. Hu, T.; Hu, H.; Li, F.; Zhao, B.; Wu, S.; Zhu, G.; Sun, L. Long-term effects of post-fire restoration types on nitrogen mineralisation in a Dahurian larch (Larix gmelinii) forest in boreal China. Sci. Total Environ. 2019, 679, 237–247. [Google Scholar] [CrossRef]
  41. Harrison, K.A.; Bol, R.; Bardgett, R.D. Do plant species with different growth strategies vary in their ability to compete with soil microbes for chemical forms of nitrogen? Soil Biol. Biochem. 2008, 40, 228–237. [Google Scholar] [CrossRef]
  42. Kielland, K.; McFarland, J.; Olson, K. Amino acid uptake in deciduous and coniferous taiga ecosystems. Plant Soil 2006, 288, 297–307. [Google Scholar] [CrossRef]
  43. DeBano, L.F.; Eberlein, G.E.; Dunn, P.H. Effects of Burning on Chaparral Soils: I. Soil Nitrogen. Soil Sci. Soc. Am. J. 1979, 43, 504–509. [Google Scholar] [CrossRef]
  44. Richards, A.E.; Brackin, R.; Lindsay, D.A.J.; Schmidt, S. Effect of fire and tree-grass patches on soil nitrogen in Australian tropical savannas. Austral. Ecol. 2012, 37, 668–677. [Google Scholar] [CrossRef]
  45. Sanchez, J.P.; Lazzari, M.A. Impact of Fire on Soil Nitrogen Forms in Central Semiarid Argentina. Arid. Soil Res. Rehabil. 1999, 13, 81–90. [Google Scholar] [CrossRef]
  46. Schmidt, S.; Stewart, G.R. Waterlogging and fire impacts on nitrogen availability and utilization in a subtropical wet heathland (wallum). Plant Cell Environ. 1997, 20, 1231–1241. [Google Scholar] [CrossRef]
  47. Leduc, S.D.; Rothstein, D.E. Plant-available organic and mineral nitrogen shift in dominance with forest stand age. Ecology 2010, 91, 708–720. [Google Scholar] [CrossRef]
  48. Lopez-Martin, M.; Nowak, K.M.; Miltner, A.; Knicker, H. Incorporation of N from burnt and unburnt N-15 grass residues into the peptidic fraction of fire affected and unaffected soils. J. Soils Sediments 2017, 17, 1554–1564. [Google Scholar] [CrossRef]
  49. Zhang, R.; Guo, Y.; Cui, X. Nitrogen Forms on the Growth of Larix gmelinii Seedings. J. North-East For. Univ. 2017, 45, 16–19. [Google Scholar] [CrossRef]
  50. Yingli, Z.; Anmin, X.; Haobo, S.; Aisheng, M. Determination study and improvement of nitrate and available phosphorus in soil by Continuous Flow Analytical System. Soil Fertil. Sci. China 2008, 26, 77–80. [Google Scholar]
  51. Moore, S.; Stein, W.H. A modified ninhydrin reagent for the photometric determination of amino acids and related compounds. J. Biol. Chem. 1954, 211, 907–913. [Google Scholar] [CrossRef] [PubMed]
  52. Wan, S.; Hui, D.; Luo, Y. Fire effects on nitrogen pools and dynamics in terrestrial ecosystems: A meta-analysis. Ecol. Appl. 2001, 11, 1349–1365. [Google Scholar] [CrossRef]
  53. Mataix-Solera, J.; Gómez, I.; Navarro-Pedreo, J.; Guerrero, C.; Moral, R. Soil organic matter and aggregates affected by wildfire in a Pinus halepensis forest in a Mediterranean environment. Int. J. Wildland Fire 2002, 11, 107–114. [Google Scholar] [CrossRef]
  54. Yildiz, O.; Esen, D.; Karaoz, O.M.; Sarginci, M.; Toprak, B.; Soysal, Y. Effects of different site preparation methods on soil carbon and nutrient removal from Eastern beech regeneration sites in Turkey’s Black Sea region. Appl. Soil Ecol. 2010, 45, 49–55. [Google Scholar] [CrossRef]
  55. Neary, D.G.; Klopatek, C.C.; DeBano, L.F.; Ffolliott, P.F. Fire effects on belowground sustainability: A review and synthesis. For. Ecol. Manag. 1999, 122, 51–71. [Google Scholar] [CrossRef]
  56. Granged, A.J.P.; Jordán, A.; Zavala, L.M.; Muñoz-Rojas, M.; Mataix-Solera, J. Short-term effects of experimental fire for a soil under eucalyptus forest (SE Australia). Geoderma 2011, 167–168, 125–134. [Google Scholar] [CrossRef]
  57. Heydari, M.; Rostamy, A.; Najafi, F.; Dey, D.C. Effect of fire severity on physical and biochemical soil properties in Zagros oak (Quercus brantii Lindl.) forests in Iran. J. For. Res. 2017, 28, 95–104. [Google Scholar] [CrossRef]
  58. Varela, M.E.; Benito, E.; Keizer, J.J. Influence of wildfire severity on soil physical degradation in two pine forest stands of NW Spain. Catena 2015, 133, 342–348. [Google Scholar] [CrossRef]
  59. Leiros, M.; Trasar-Cepeda, C.; Seoane, S.; Gil-Sotres, F. Dependence of mineralization of soil organic matter on temperature and moisture. Soil Biol. Biochem. 1999, 31, 327–335. [Google Scholar] [CrossRef]
  60. Bauhus, J.; Khanna, P.K.; Raison, R.J. The effect of fire on carbon and nitrogen mineralization and nitrification in an Australian forest soil. Aust. J. Soil Res. 1993, 31, 621–639. [Google Scholar] [CrossRef]
  61. Duan, W.; Zheng, W.; Yan, W.; Liang, X.; Li, S. Seasonal dynamics of nitrogen mineralization in soils of Cinnamomum camphora and Pinus massoniana plantations. J. Cent. South Univ. For. Technol. 2011, 31, 96–100. [Google Scholar] [CrossRef]
  62. Durán, J.; Rodríguez, A.; Fernández-Palacios, J.M.; Gallardo, A. Changes in net N mineralization rates and soil N and P pools in a pine forest wildfire chronosequence. Biol. Fertil. Soils 2009, 45, 781–788. [Google Scholar] [CrossRef]
  63. Xiao, H.Y.; Liu, B.; Yu, Z.P.; Wan, X.H.; Sang, C.P.; Zhou, F.W.; Huang, Z.Q. Seasonal dynamics of soil mineral nitrogen pools and nitrogen mineralization rate in different forests in subtropical China. J. Appl. Ecol. 2017, 28, 730–738. [Google Scholar] [CrossRef]
  64. Warren, C.R.; Taranto, M.T. Temporal variation in pools of amino acids, inorganic and microbial N in a temperate grassland soil. Soil Biol. Biochem. 2010, 42, 353–359. [Google Scholar] [CrossRef]
  65. Read, D.J.; Bajwa, R. Some nutritional aspects of the biology of ericaceous mycorrhizas. Proc. R. Soc. Edinburgh. Sect. B Biol. Sci. 1985, 85, 317–331. [Google Scholar] [CrossRef]
  66. Brzostek, E.R.; Finzi, A.C. Substrate supply, fine roots, and temperature control proteolytic enzyme activity in temperate forest soils. Ecology 2011, 92, 892–902. [Google Scholar] [CrossRef]
  67. Brzostek, E.R.; Finzi, A.C. Seasonal variation in the temperature sensitivity of proteolytic enzyme activity in temperate forest soils. J. Geophys. Res.-Biogeosci. 2012, 117, G01018. [Google Scholar] [CrossRef]
  68. Goncalves, J.L.M.; Carlyle, J.C. Modelling the influence of moisture and temperature on net nitrogen mineralization in a forested sandy soil. Soil Biol. Biochem. 1994, 26, 1557–1564. [Google Scholar] [CrossRef]
  69. Ladd, J.N. Properties of proteolytic enzymes extracted from soil. Soil Biol. Biochem. 1972, 4, 227–237. [Google Scholar] [CrossRef]
  70. Ivarson, K.C.; Sowden, F.J. Effect of frost action and storage of soil at freezing temperatures on the free amino acids, free sugars and respiratory activity of soil. Can. J. Soil Sci. 1970, 50, 191–198. [Google Scholar] [CrossRef]
Figure 1. Dynamic changes in soil NH4+-N content were observed in the wildfire chronosequence. (A) June, (B) August, and (C) October. The results are presented here as means (±standard error). Different capital letters indicate significant difference (p < 0.05) in the wildfire chronosequence, and different small letters indicate significant difference (p < 0.05) in different months.
Forests 14 01178 g001
Figure 2. Dynamic changes in soil NO3-N content were observed in the wildfire chronosequence. (A) June, (B) August, and (C) October. The results are presented here as means (±standard error). Different capital letters indicate significant difference (p < 0.05) in the wildfire chronosequence, and different small letters indicate significant difference (p < 0.05) in different months.
Forests 14 01178 g002
Figure 3. Dynamic changes in soil AAN content were observed in the wildfire chronosequence. (A) June, (B) August, and (C) October. The results are presented here as means (±standard error). Different capital letters indicate significant difference (p < 0.05) in the wildfire chronosequence, and different small letters indicate significant difference (p < 0.05) in different months.
Forests 14 01178 g003
Figure 4. Dynamic changes in the soil mineral N form in the wildfire chronosequence. (A) surface soil, (B) subsoil. The results are presented here as means (±standard error). Different capital letters indicate significant difference (p < 0.05) in the wildfire chronosequence, and different small letters indicate significant difference (p < 0.05) in different months.
Forests 14 01178 g004
Figure 5. Dynamic changes in the soil available N form in the wildfire chronosequence. (A) surface soil, (B) subsoil. The results are presented here as means (±standard error). Different capital letters indicate significant difference (p < 0.05) in the wildfire chronosequence, and different small letters indicate significant difference (p < 0.05) in different months.
Forests 14 01178 g005
Table 1. Characteristic of sampling plots.
Fire TimeFire Area (ha)Cause of FireCanopy Density (%)Mortality (%)Community StructureSoil Type (CST)
Unburned————700Tree Larix gmelinii, Betula platyphylla
Shrub Ledum palustre, Rhododendron dauricum
Herb Deyeuxia angustifolia
Gleyic Umbri-Gelic Cambosols
20175.1Lightning fire10>82The plot is mainly scarred trunks or their remnants Gleyic Umbri-Gelic Cambosols
201640.0Lightning fire10>83The plot is mainly scarred trunks or their remnantsGleyic Umbri-Gelic Cambosols
2008473.5Human-caused fire40>90Tree Populus davidiana, Betula platyphylla
Shrub Ledum palustre, Betula fruticosa var. ovalifolia Rhododendron dauricum
Herb Deyeuxia angustifolia
Gleyic Umbri-Gelic Cambosols
20002400.0Lightning fire50>90Tree Larix gmelinii, Betula platyphylla
Shrub Ledum palustre Rhododendron dauricum
Herb Deyeuxia angustifolia
Gleyic Umbri-Gelic Cambosols
CST, Chinese Soil Taxonomy.
Table 2. Summary of the factors influencing or controlling the change in soil N contents in the wildfire chronosequence.
Wildfire ChronosequenceSampling Time aFactors Affect Soil N Change b
Increasing FactorsTurnover FactorsDecreasing FactorsR. Error
DepositionDeco. DCDeco. RInput VRRele. RCAmmonificationNitrationCombustionErosionLeach LAbsorption
NH4+-N
The same year of burningJune: +*,/c +
August: +*, −* +
October: +*, + +
One year after burningJune: +*, −* +
August: +*, + +
October: +*,− +
Nine years after burningJune: +, − +
August: −, − +
October: +, + +
Seventeen years after burningJune: +, − +
August: −, − +
October: +, + +
NO3-N
The same year of burningJune: +*,/ +
August: −, − +
October: +, + +
One year after burningJune: +, − +
August: −, − +
October: −,+ +
Nine years after burningJune: +, − +
August: −, + +
October: −, − +
Seventeen years after burningJune: −, no +
August: −, + +
October: −, + +
AAN
The same year of burningJune: +*,/
August: +*, −*
October: +*, −
One year after burningJune: −, −*
August: +, +
October: −*, −
Nine years after burningJune: −, +
August: −,−
October: −*, −
Seventeen years after burningJune: +, +
August: +, −
October: −*, +
a The symbols +*, −*, +, −, and no mean significant increase, significant decrease, insignificant increase, insignificant decrease, and no detectable change, respectively. The first symbol compared to unburned plots, and the last symbol compared to the previous sampling time, all of which were estimated according to Figure 1, Figure 2 and Figure 3. b Deposition: deposition or accumulation of nutrient-rich ash or AAN from burnt vegetation, litter, and/or organic soil; Deco. DC: decomposition of fire-derived aboveground plant debris and carbonized particles incorporated into the soil; Deco. R: decomposition of fire-derived dead roots; Input VR: input of nitrogenous compounds by vegetation recovery; Rele. RC: release nitrogen from damaged plant roots and microbial cells by seasonal freeze–thaw cycle; Combustion: direct losses via combustion and/or high-temperature volatilization; Erosion: soil erosion loss; Leach L: leaching loss; Absorption: absorption of available N by vegetation and microorganisms; Ammonification: AAN ammonification; Nitration: NH4+-N nitration; and R. Error: random error. c Within a row, √ represents influencing factor, and √+ and √ represent increasing and decreasing factors in the turnover factor, respectively. Boldface indicates the most likely controlling or dominant factor. Notably, most influence factors were practically observed in the field, except those for freeze–thaw release, turnover, and leaching loss, which were just inferences drawn from environmental changes in the site. For a given factor within a raw, whether it is a controlling/dominant one or not, was also a qualitative estimation, and further investigations are required to quantify the effect of each factor.
Disclaimer/Publisher’s Note: The statements, opinions and data contained in all publications are solely those of the individual author(s) and contributor(s) and not of MDPI and/or the editor(s). MDPI and/or the editor(s) disclaim responsibility for any injury to people or property resulting from any ideas, methods, instructions or products referred to in the content.

