Article

Soil Quality Evaluation and Dominant Factor Analysis of Economic Forest in Loess Area of Northern Shaanxi

1
College of Life Science, Yan’an University, Yan’an 716000, China
2
China Institute of Water Resources and Hydropower Research, Beijing 100038, China
*
Author to whom correspondence should be addressed.
Forests 2023, 14(6), 1179; https://doi.org/10.3390/f14061179
Submission received: 21 April 2023 / Revised: 23 May 2023 / Accepted: 4 June 2023 / Published: 7 June 2023
(This article belongs to the Special Issue Effects of Natural Disturbances and Human Activities on Forest Soils)

Abstract

:
Choosing economically important trees and establishing planting patterns can improve soil quality in economic forests. To clarify the soil quality status of the main economic forest land distributed in northern Shaanxi, the research object in this study was jujube and apple economic forests, and the control was grassland. By evaluating 17 soil indicators, the minimum data set (MDS) and structural equation model (SEM) were used to analyze the soil quality status and its dominant factors under different economic forests and land preparation methods. The results showed that (1) compared with grassland, the economic forest has a certain improvement and promotion in soil’s properties, mainly in the water-holding capacity and available nutrients. Compared to the undisturbed slope, the level bench had better physical and chemical properties. (2) Six indicators were identified as the minimum data set for assessing soil quality, including the soil organic carbon, saturated water content, bulk density, alkaline nitrogen, sand, and total capillary porosity. In addition, structural equation model analysis showed that the soil organic carbon, saturated water content, alkaline nitrogen, and capillary porosity were the dominant factors affecting soil quality in the study area. (3) Jujube trees exhibited the highest soil quality and the best restoration effect, followed by apple trees, while grassland had the poorest restoration effect. The soil quality of undisturbed slopes under different land preparation methods was lower than that of the level bench land preparation. The outcomes of this study are to provide data support and a theoretical basis for improving soil quality, enhancing ecological benefits, and selecting and managing economic forest species, in the study area and similar regions in the future.

1. Introduction

Soil is an important part of terrestrial ecosystems, a critical carrier for maintaining the survival and development of animals and plants [1], and the basis of plant growth [2]. However, factors such as insufficient precipitation, severe soil erosion, sparse vegetation, and others can hurt soil, thereby reducing soil quality and productivity. As a typical area in the loess area of northern Shaanxi [3,4,5], in recent years, the implementation of returning farmland to the forest (grass) and another forestry ecological engineering construction, as well as the use of artificial afforestation, aerial seeding afforestation, and closed forest ecological restoration measures, have been implemented [6]. The soil quality in the study area has been improved, and the ecological benefits have been significantly enhanced. Soil quality is important for maintaining biological production, protecting environmental quality, and promoting animal and plant health. It is also a powerful tool for revealing soil degradation and ecosystem health [7].
Soil quality can reflect the soil management and production capacity [8]. Owing to its complex soil structure and rich functions, a single soil indicator evaluation cannot fully and accurately represent the comprehensive characteristics of the soil. It is necessary to comprehensively evaluate the physical, chemical, and biological characteristics to increase the accuracy of the evaluation [9]. In recent years, many researchers have conducted extensive research on soil quality evaluation methods [10,11,12]. Model methods, such as vague mathematics and dimensionality reduction, have been introduced into soil quality research at different spatial and temporal scales including ecological restoration areas, artificial forest land, and mixed forest land [13,14]. The soil quality index method, which is a more objective and practical method for evaluating soil quality, has been widely used by researchers [15,16], mainly for the sustainable development of grassland, farmland, and forest land [17,18]. Tian et al. [19] used principal component analysis to evaluate the relationship between the soil quality evaluation indicator (SQI) and crop yield in maize and wheat fields based on the minimum data set. The results showed that the SQI played an important role in improving the crop yield and had an essential guiding significance for the management and practice of the SQI in later stages. Scholars evaluated the potential of different vegetation types by studying their effects on the soil quality under drought stress and in wetland ecosystems, providing references for future vegetation selection [20,21]. Currently, research on soil quality evaluation mostly focuses on conventional arbor forest land or shrub forest land [22,23], and pays more attention to ecological benefits. The research objectives include different land use and management methods, soil types, natural vegetation restoration models [24,25,26,27], and so on. Studies on the soil quality of economic forest land under different land preparation methods in the loess area have been comparatively scarce. However, since the project of returning farmland to the forest (grass) was carried out in 1999, jujube and apple trees have been planted in large areas as economically important forest tree species for soil erosion control in loess hilly areas and as an important industrial basis for farmers in poor mountainous areas to eliminate poverty and become rich [28,29]. A previous study showed that the area of economic forests has reached 947,000 hm2 in northern Shaanxi [30], but studies on economic forests have mainly focused on the economic cost, planting layout, and planting mode. Few studies have evaluated the soil quality of economic forests, and the differences in soil quality among different economic forest species are even smaller in the loess area of northern Shaanxi. Strengthening monitoring and research on the soil quality of economic forest land has important significance for the selection of suitable tree species, the establishment of planting patterns in the process of economic forest construction in the study area, and promoting the sustainable development of economic forest land. Therefore, we hypothesize that the physicochemical properties of soil evaluation indexes are differentiated under different vegetation types as well as different land preparation methods and have important effects on the soil quality in the study area. In view of this, this study aims (1) to investigate the differences in soil quality evaluation indicators among different vegetation types; (2) to explore the quality of the soil under different vegetation types and land preparation methods by calculating the soil quality index, and establish a minimum data set suitable for soil quality evaluation in the study area; (3) to identify the major soil factors that affect the soil quality in the study area.

2. Materials and Methods
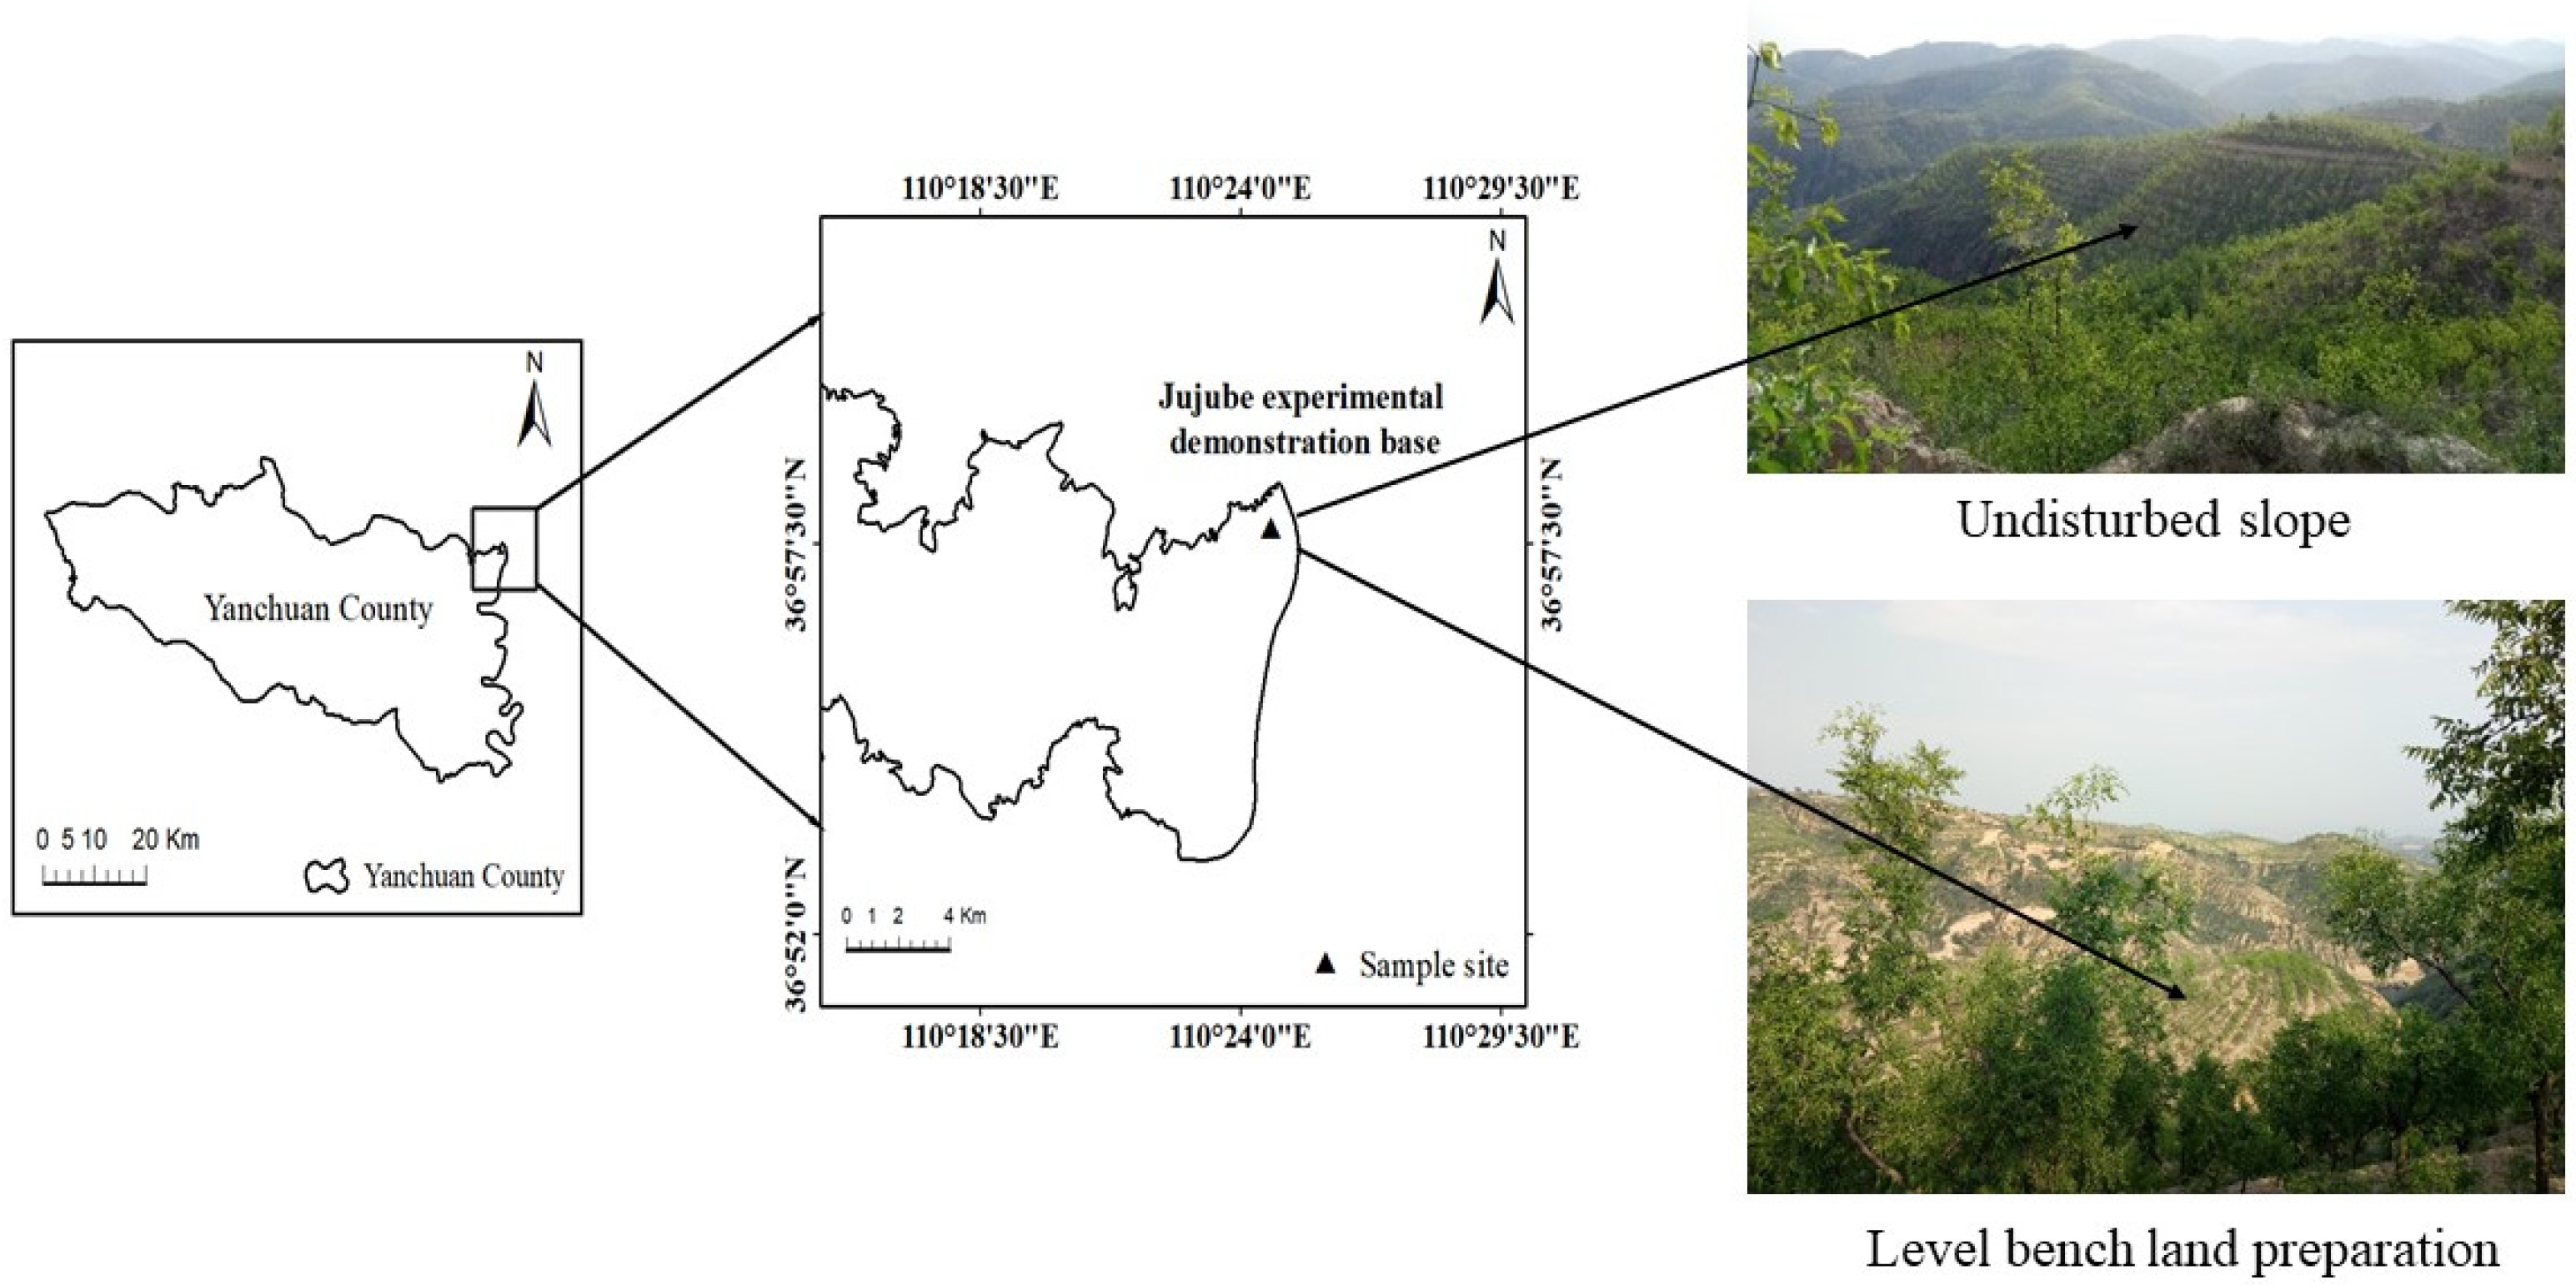
2.1. Study Area

The Qijiashan jujube experimental demonstration base (36°57′ N, 110°29′ E) is located in the northeast of Yan’an City, Shaanxi Province, China (Figure 1). The area is a hilly and gully loess region. The soil type is loessal soil, situated at an average altitude of 850 m, experiencing cold and dry winters and hot summers accompanied by concentrated rainfall. The annual average precipitation stands at 500 mm, with uneven spatial and temporal distribution throughout the year. The rainfall is mainly concentrated from July to September, featuring thunderstorms with short-term heavy rainfall patterns that align with the temperate continental monsoon climate. The vegetation in the study area mainly comprises Zizyphus jujube Mill, Malus pumila Mill, and Ziziphus jujuba Mill. var. spinosa [31].

2.2. Plot Design and Soil Sampling

By utilizing the space substitution method instead of the conventional time substitution method [32], the sampling quadrats were selected based on the principles of representativeness and typicality. Through preliminary research and fieldwork, the group selected mountain jujube forests and apple forests which were abandoned for the same number of years; a grassland abandoned for the same number of years was selected as the control. A total of six standard sample plots were set (jujube tree (level bench), jujube tree (undisturbed slope), apple tree (level bench), apple tree (undisturbed slope), grassland (level bench), grassland (undisturbed slope) [31]. To avoid any impact on the sampling of rainfall, no precipitation occurred seven days before sampling. In each sample plot, 3 soil profiles (1 m deep) were excavated, and soil samples were collected by the ring knife method with a sampling interval of 20 cm. The soil samples were collected and naturally air-dried in the laboratory for the determination of physical and chemical properties. Detailed information about the sample plots can be found in Table 1.

2.3. Measurement of Indicators

Soil moisture content (SMC) was measured using the drying method, and soil bulk density (BD), total capillary porosity (TCP), saturated water content (SWC), and capillary water-holding capacity (CWHC) were measured using the ring knife immersion method [33]. Clay, silt, and sand were determined using a laser particle size analyzer (soil particle size classification was based on the American soil texture grading standard) [34]. Soil pH and electrical conductivity (EC) were assessed on the pHS-320 high precision intelligent acidity meter and DDS-608 multifunctional conductivity meter, respectively. Available nitrogen (AN), available potassium (AK), and available phosphorus (AP) were determined by alkaline hydrolysis diffusion method, ammonium acetate extraction flame photometric method, and 0.5 mol/L sodium bicarbonate method, respectively, and soil organic matter by the potassium dichromate volumetric method–dilute heat method [35].

2.4. Soil Index Evaluation Methods

Principal component analysis (PCA) was used to reduce the dimensionality and group 17 physicochemical factors. Finally, the soil indicators that had significant effects on soil quality were selected as the minimum data set for soil quality evaluation [36]. The main calculation process included: PCA was used to calculate the norm value grouping and weight calculation of the 17 physicochemical factors; based on the positive or negative correlation between the soil indicator values and soil quality evaluation, the membership function was used for calculation [37]; according to the membership degree and weight values of each soil evaluation index for different vegetation types, the soil quality index for different vegetation types was obtained by multiplying and accumulating the two values. A higher soil quality index indicated a better soil quality restoration effect for the vegetation.
The soil quality evaluation indicator (SQI) was calculated using the weighted evaluation method [38].
S Q I = i = 1 n R i × F ( x i )
where SQI is the soil quality evaluation indicator, Ri is the weighted value of each indicator, n is the number of evaluation indicators, and F(xi) is the membership value of each indicator.

2.5. Statistical Analysis

The data were processed and analyzed using Excel 2016 and SPSS 22.0, including one-way ANOVA and principal component analysis. One-way ANOVA was used to analyze the differences between various indicators under different vegetation types and different land preparation methods. Principal component analysis was used for grouping various indicators. Origin 2021, Amos 24.0, and ArcMap 10.2 were used for correlation analysis, structural equation modeling (SEM), and sample mapping.

3. Results

3.1. Statistical Differences between Soil Quality Evaluation Indicators under Different Vegetation Types and Different Land Preparation Methods

From Table 2, except for the CWHC, NWC, clay, silt, and sand, the differences between the soil physical indicators of the different vegetation types were not significant (p > 0.05) (Table 2). The specific differences between the vegetation types in the soil physical indicators were manifested as jujube trees > apple trees > grassland. It was comprehensively found that the soil physical indicators of the economic forest land were higher, especially in terms of the soil water-retention capacity and physical structure. In terms of the soil chemical properties, there were significant differences in the SOC, TP, and EC among the different vegetation types (p < 0.05), whereas other chemical indicators were not significantly different (p > 0.05) (Table 2). The SOC and TP contents of grassland were lower than those of jujube and apple trees, whereas the EC was the highest. The combined soil chemical indicators showed that the economic forest had a higher capacity to provide quick-acting nutrients to the vegetation. Comparing different land preparation methods, except for the NWC and sand, there were no significant differences in other physical indicators under different land preparation methods. In terms of the soil chemical indicators, there were significant differences (p < 0.05) in the TP and SOC between different land preparation methods, while other chemical indicators were not significant. Overall, the soil physical and chemical indicators under different soil preparation methods showed level bench land preparation > undisturbed slope.

3.2. Evaluation of Soil Quality

3.2.1. Characteristics of Soil Indicator Components Based on the Minimum Data Set

To reduce the number of indicators and minimize data redundancy caused by the high correlation between evaluation indicators, principal component analysis (PCA) was performed on 17 indicators. The results are shown in Table 3. In total, 5 principal components with eigenvalues greater than 1 were obtained, and the cumulative explanatory power was 80.003%, indicating that the explanatory power of the 5 principal components was strong. After screening all indicators, those with load values of ≥0.5 were classified as Group 1. If the same indicator appeared in two principal components at the same time, it was merged into the group with a lower correlation according to the correlation (Table 3). Then, the correlation analysis was performed on the indicators in each group. If two indicators in the same group had a significant correlation, the indicator with a higher norm value was retained. Finally, the minimum data set of the soil quality evaluation indicators in this study was determined to be the BD, SWC, SOC, AN, silt, and TCP. The SOC and SWC have relatively large weights and are crucial for the evaluation of the soil quality.

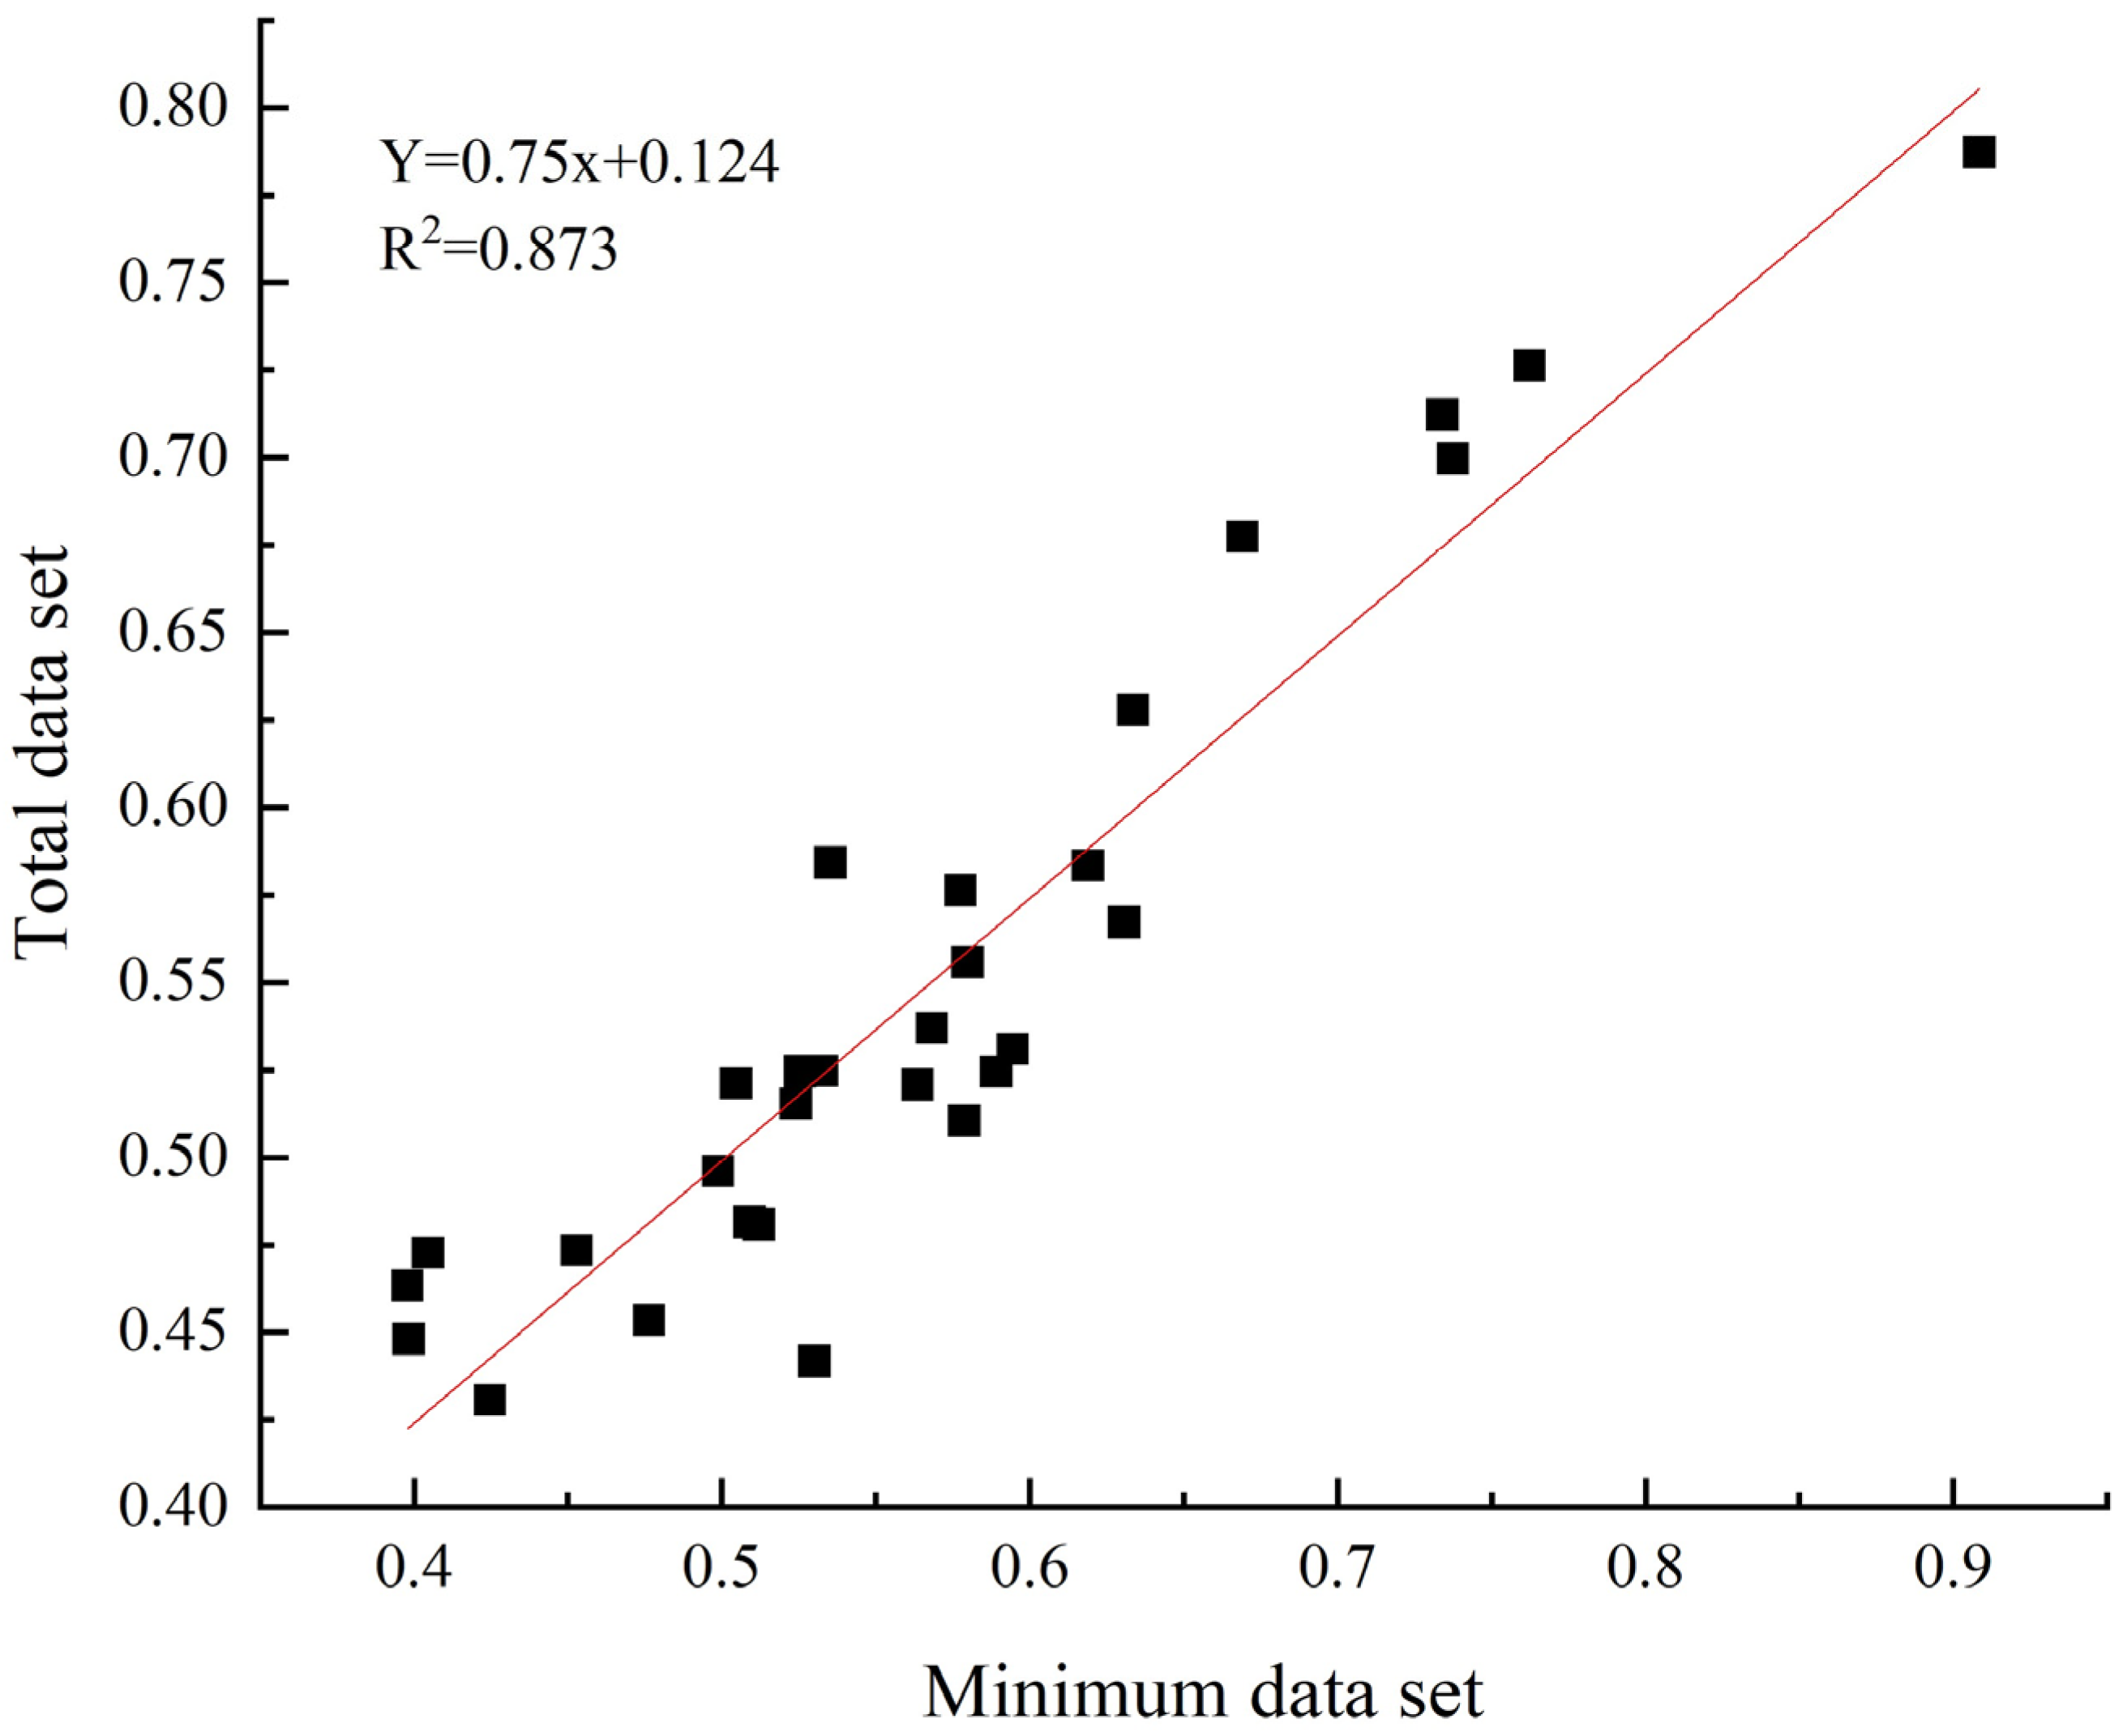
3.2.2. Soil Quality Assessment Based on a Minimum Data Set

By using the minimum data set to calculate the soil quality index of different vegetation types under different land preparation methods in the study area (Table 4), it was found that the SQI values of the economic forest land were higher than those of the grassland, specifically manifested as jujube trees > apple trees > grassland. When comparing the different land preparation methods, it was found that the SQI level bench land preparation was higher than those of the undisturbed slope for the same vegetation type, indicating that the level bench land preparation method had a positive effect on improving the soil quality. Moreover, as shown in Figure 2, there was a good linear relationship between the minimum data set and the total data set (y = 0.75x + 0.124), with an R2 value of 0.837. A higher R2 value indicated a better fitting effect, suggesting that the soil quality index calculated based on the MDS method could be used for soil quality evaluation in the study area.

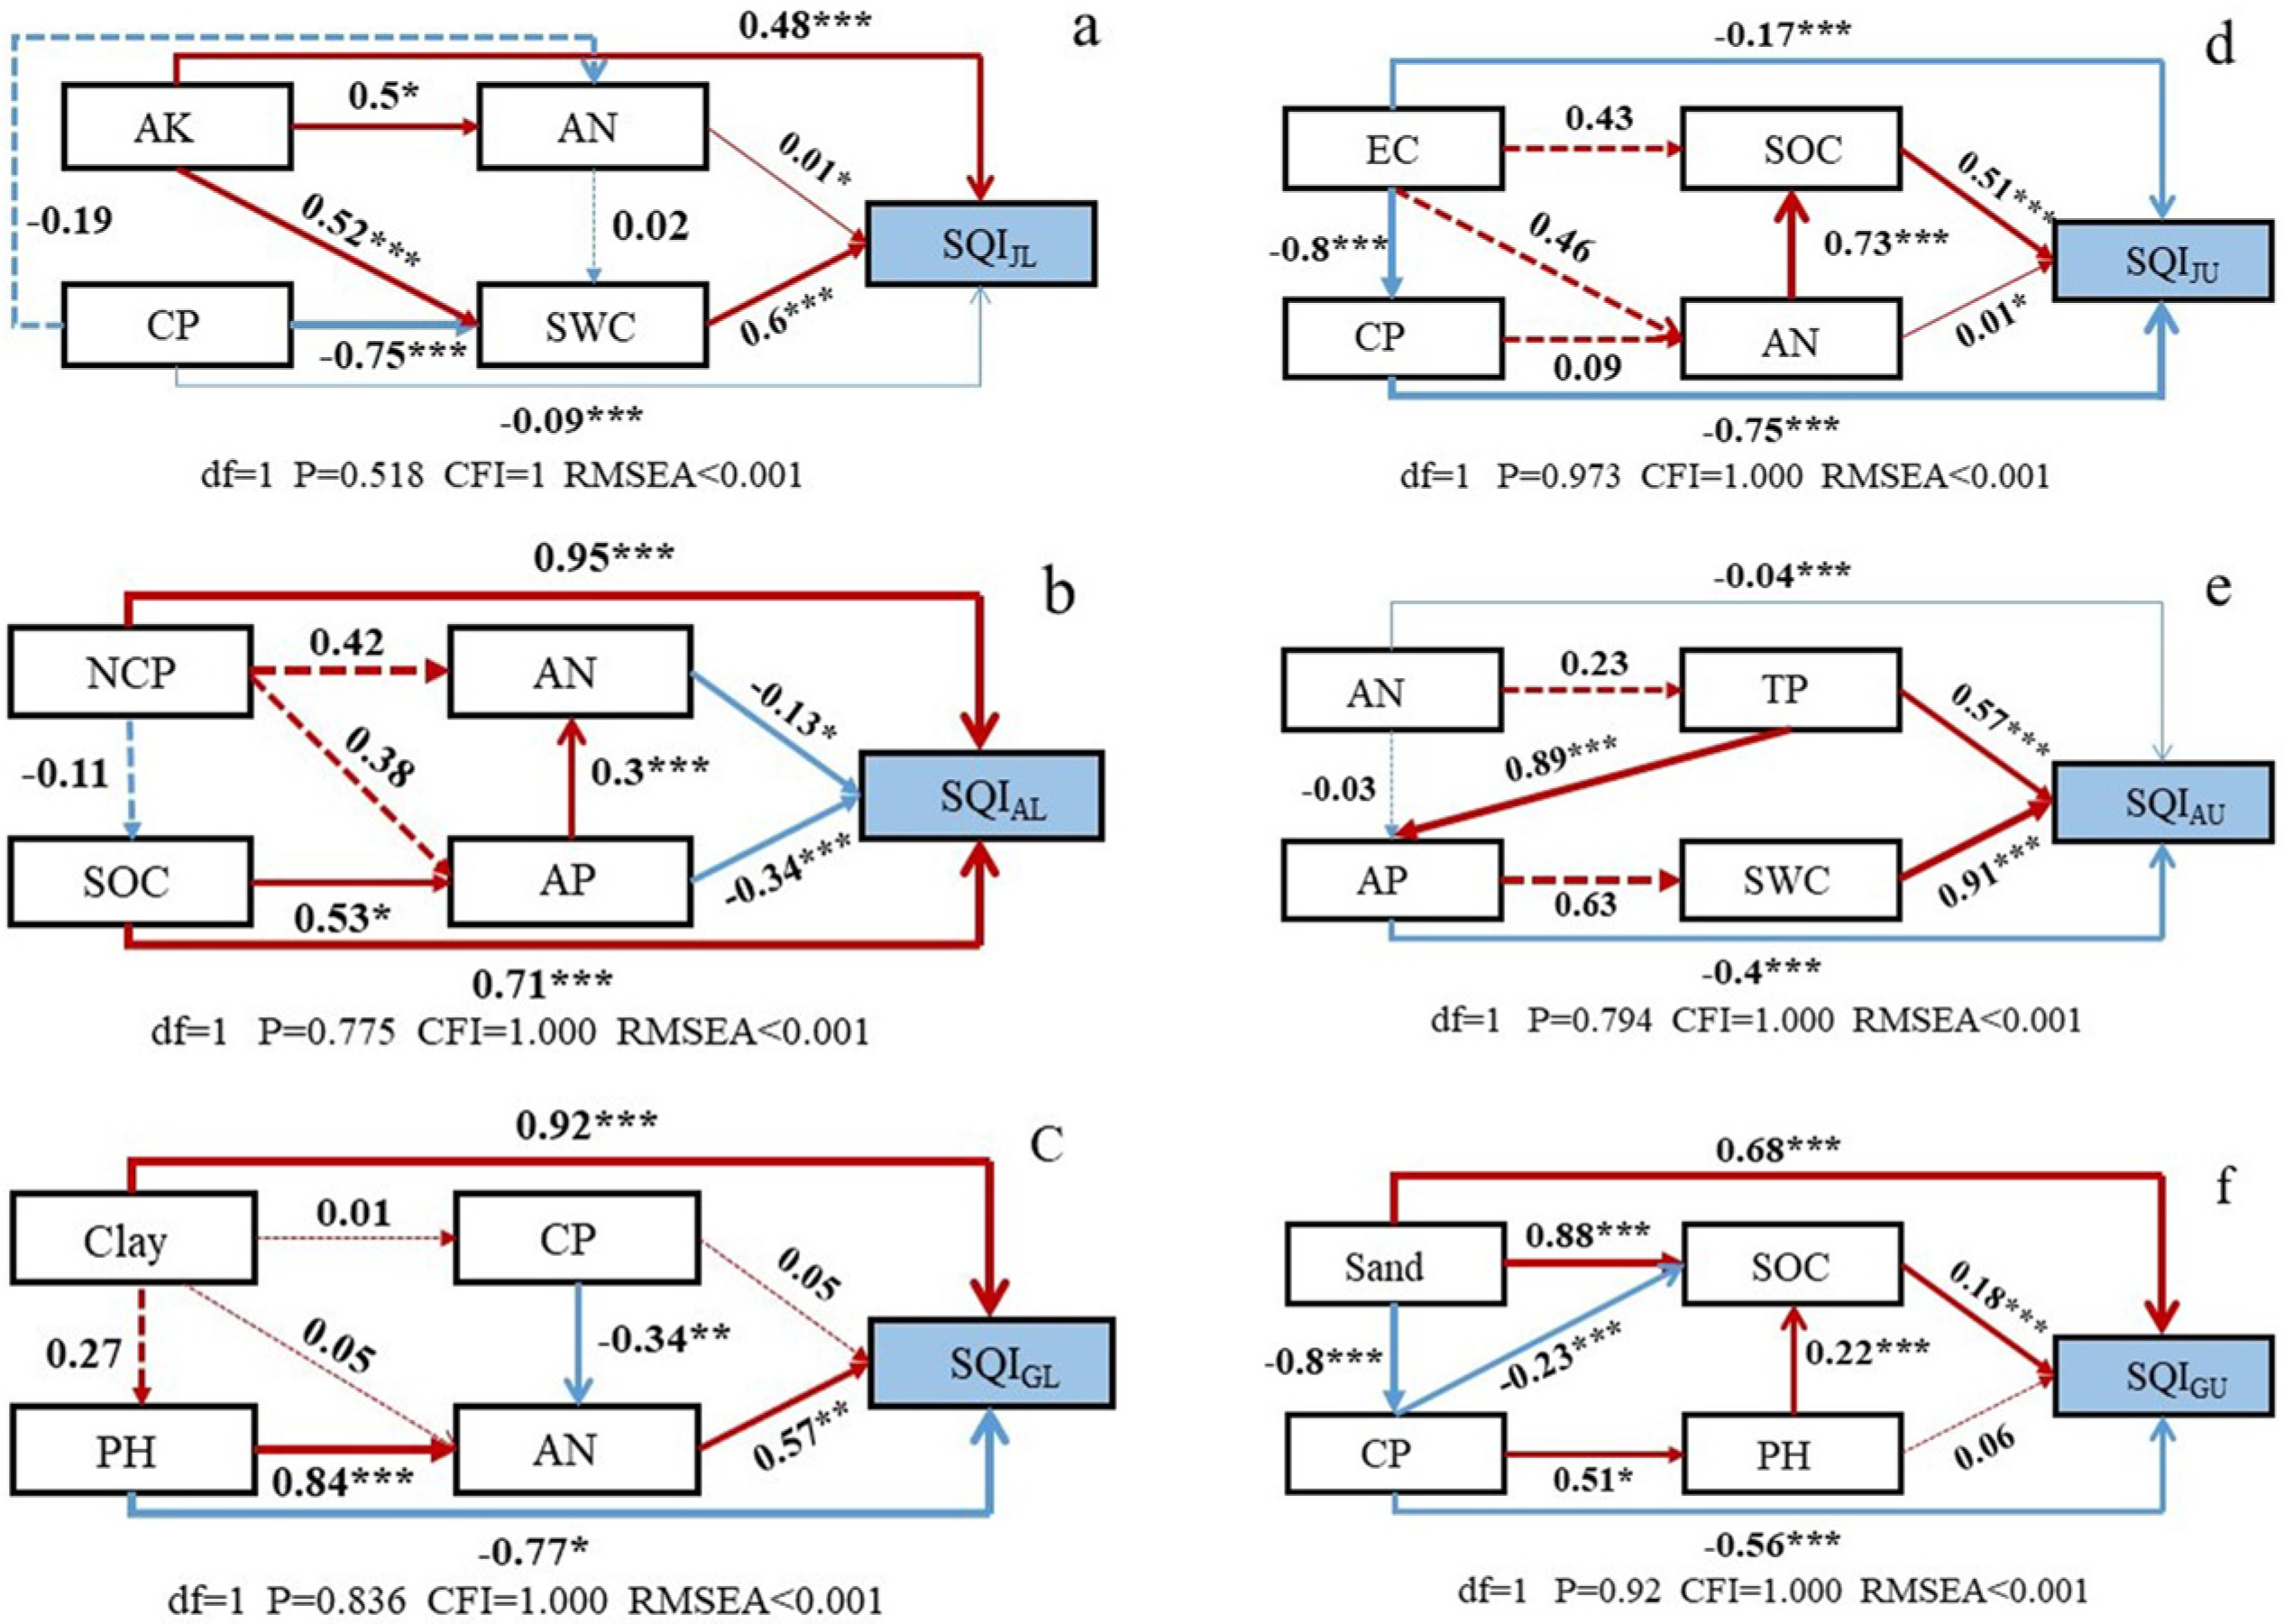
3.3. Effects of Dominant Factors on Soil Quality

The direct and indirect effects of the dominant factors on the SQI under different vegetation types and land preparation methods were analyzed using a structural equation model. The results are shown in Figure 3. Among the different vegetation types, the SWC and SOC had a greater impact on the SQI of the forest lands and had a direct positive impact. The AP has a direct negative impact on the SQI of the apple forest land. The soil texture has a significant influence on the grassland and has a direct positive impact. The soil nutrient indicators have little effect on the grassland SQI. The AN had a certain influence on the SQI of the different vegetation types, but its influence intensity was low. Porosity influences the SQI of different vegetation types. By comparing different soil preparation methods, it was found that chemical indicators were the main factors affecting the SQI of different vegetation types in the level bench land preparation.
The Inclusion of soil organic carbon and available nutrients had a significant impact on the SQI of the level bench forest land, whereas clay and the pH had a significant impact on the SQI of the level bench grassland. The physical indicators have a significant impact on the SQI of different vegetation types on an undisturbed slope. The CP and SWC had a significant influence on the SQI of the forest land on the undisturbed slope, and sand had a significant influence on the SQI of the grassland. The SOC and CP had a significant influence on the jujube trees and grassland and had a greater significant influence on the jujube SQI. Soil water and carbon had a direct positive impact on the SQI of the economic forest land on the undisturbed slope.

4. Discussion

4.1. Difference Analysis of Soil’s Physical and Chemical Properties of Different Vegetation Types

Vegetation can affect the transformation of the soil’s physical structure and the circulation and distribution of nutrient resources in the ecosystem by changing the quality and quantity of litter and the abiotic environment through its physiological activities [39]. This study shows that compared with grassland, the economic forest has more advantages in improving soil’s physical and chemical properties. This may be due to the large amount of litter and humus on the surface of forest land, the high content of organic matter, the improvement in the soil’s structure, and the increase in the soil’s aggregate stability [40]. Simultaneously, owing to the improvement in plant roots in the soil [41] and the interference of human activities on the economic forest land, the physical and chemical properties of the soil are improved. The grassland surface litter is less and relatively bare. The climate is dry, and soil moisture evaporation is strong in the study area, resulting in a low soil moisture content in the grassland. The soil environment for vegetation growth is poor, and litter is easily photolyzed under strong light, which ultimately leads to difficulties in the formation and accumulation of grassland nutrients [41]. Some studies have also shown that land preparation methods have an important impact on changes in the physical and chemical properties of the soil [42,43]. The soil environment and conditions can be improved by transforming the undisturbed slope in other ways to improve the soil’s texture, physical and chemical properties, and nutrient conditions [44,45].
The results of this study indicated that the level bench has a stronger impact on the physical and chemical properties of the soil, which may be due to the influence of the slope on runoff, whereas the level bench land preparation changed the slope of the original vegetation growth, reduced the runoff speed, increased the effective water storage of plants, and enhanced the occurrence of infiltration [46]. Simultaneously, the soil preparation of level benches has a strong ability to retain runoff and litter, which strengthens the humification, enriches the nutrient elements in the surface layer, and increases the soil’s nutrient content [44,47,48]. This effectively improves the properties of the soil. The undisturbed slope condition has weak interception effects on the soil’s moisture and nutrients, which is not conducive to improving the soil’s properties [49].

4.2. Evaluation of Soil Quality Based on the Minimum Data Set

Many domestic and foreign scholars [38,50,51,52] often incorporate organic matter, soil bulk density, alkaline nitrogen, porosity, and other indicators into the minimum data set when studying the quality status of soil to evaluate soil quality. In this study, the SOC, SWC, BD, TCP, silt, and AN were selected as the soil quality evaluation indicators, which is consistent with most domestic and foreign research results. This study also showed that the SOC and SWC are important indicators of soil quality, similar to previous studies [26,53]. Studies have shown that compared with TDS, the MDS method is widely used, because the MDS method can improve work efficiency, and reduce time and cost [54,55,56]. This study indicates that the soil quality index calculated based on the MDS method applies to the study area. Therefore, the MDS method can replace TDS for evaluating soil quality in the study area [37].
This study showed that the economic forest land is conducive to soil restoration and possesses a higher soil quality in the study area, which may be due to the strong human disturbance of the economic forest land, such as regular weeding, loosening of soil, and fertilization. Compared with apple trees, jujube trees have more developed roots [57], and different vegetation types have different microclimates on their underlying surfaces. The accumulation of litter and rhizosphere sediments affects the activity of soil microorganisms, changes the rate of carbon conversion, and affects soil quality [58,59]. The results of this study demonstrate that changing the land preparation methods is beneficial for improving soil quality. This is because the level of terrace land preparation plays an important role in reducing runoff, reducing soil erosion, increasing soil nutrient flux, improving soil fertility, and increasing crop yield [60]. However, the lack of reasonable maintenance and natural and man-made interactions will destroy the structure and strength of land preparation, resulting in the complete failure of the land preparation method [31,45].
Scientific management is the key to sustainable development. Relevant studies have shown that a reasonable combination of land preparation methods and vegetation types can achieve sustainable land restoration and create the greatest socio-ecological-economic benefits [61]. The excessive use of sloping land leads to soil carbon loss and stoichiometric imbalance, resulting in soil degradation and reduced ecosystem services [62].

4.3. Effects of Dominant Factors on Soil Quality

Factors affecting soil quality differ significantly under different environmental conditions. This study demonstrates that the dominant factors that affect the SQI among different vegetation types show differences. According to the correlation between the indicator, SQI, and the path coefficient, SWC, and SOC were the main factors affecting the SQI in the economic forest land, mainly because the soil’s water and carbon play an important role in vegetation growth. Soil organic carbon controls many soil physical, chemical, and biological processes that affect plant growth and sustainability [63] and plays a key role in soil function. At the same time, studies have shown that the SWC is an important water-holding indicator that affects plant growth and ecological processes [26,64]. During the growth of vegetation, changes in soil moisture directly affect the growth of plants, and owing to differences in vegetation types and coverage, it affects evaporation, seepage, soil structure, and soil water-holding capacity [65]. Simultaneously, the AN affected almost all vegetation types in this study. As an important nutrient indicator of soil, it has an important impact on soil quality evaluation [66]. This study also showed that the CP plays an important role in the SQI of different vegetation types, and related studies have shown that porosity is related to soil water and air movement and the supply of vegetation nutrients [67]. When the soil porosity increases, the better the soil water retention [68]. In summary, when improving the soil quality of the economic forest land in the future research area, addressing water and carbon issues is crucial, and nutrient accumulation cannot be ignored.
This study shows that the SWC and CP have a significant impact on the SQI of different vegetation types under the undisturbed slope, and the SOC and AN have a significant impact on the SQI of different vegetation types under the level bench land preparation. This is because the undisturbed slope erosion is serious and the water-retention capacity is poor [69]. Effectively holding water is an important factor in improving soil quality and promoting vegetation growth. Level bench land preparation can effectively improve the ability of water collection and retention to a certain extent [70]. However, due to natural and anthropogenic factors, soil quality is reduced. Without reasonable maintenance, the soil will be damaged in the event of heavy rainfall, leading to nutrient loss and soil quality reduction. The accumulation of soil organic carbon, N, P, K, and other nutrient elements mainly depends on the combination of vegetation type, community structure, and soil preparation method [71], which is consistent with the results of this study. Therefore, water conservation and soil consolidation are important for improving the soil quality of economic forest lands on the undisturbed slope in the future. Relevant studies have shown that the use of agroforestry on sloping land and inter-row intercropping [72] plays a significant role in solving such problems. When land preparation methods change, the impact of scientific management methods and planting patterns on nutrients should be considered.

5. Conclusions

This study showed that the physicochemical properties of soil evaluation indicators were different under different vegetation types and land preparation methods. The MDS selection based on principal component analysis was correlated with the soil quality evaluation, and the soil quality of the economic forest land was higher in the soil quality assessment under different vegetation types as well as different land preparation methods; it showed that the soil quality of the level bench land preparation was higher than that of the undisturbed slope under different land preparation methods, which had a positive effect on the improvement in the soil’s quality. Furthermore, using structural equation modeling, it was concluded that the SOC, SWC, AN, and CP were the dominant factors affecting the soil quality of different vegetation types in the study area, among which the SWC and CP had a greater influence on the soil quality of the intact slopes, and the SOC and CP had a greater influence on the soil quality of the level bench land preparation. Therefore, the current maintenance, as well as improvement in soil quality, needs to pay attention to the water–carbon status as well as the nutrient accumulation status.

Author Contributions

Conceptualization, T.X., N.A. and F.Q.; methodology, T.X., N.A. and C.L.; software, T.X.; validation, T.X., N.A. and G.L.; formal analysis, T.X.; investigation, T.X. and N.A.; data curation, T.X.; writing—original draft preparation, T.X.; writing—review and editing, T.X. and N.A.; visualization, T.X. and N.A.; supervision, F.Q., N.A., G.L. and C.L.; project administration, N.A. All authors have read and agreed to the published version of the manuscript.

Funding

This study was funded by the National Natural Science Foundation of China (U2243601, 32060297), China Institute of Water Resources and Hydropower Research (IWHR) R & D Support Programs (SC0145B012023, SC0202A012018). And The APC was funded by National Natural Science Foundation of China (U2243601).

Institutional Review Board Statement

Not applicable.

Informed Consent Statement

Not applicable.

Data Availability Statement

Not applicable.

Acknowledgments

The authors greatly appreciate the assistance of Rui Gao, Jiafeng Qin, Kaixuan Zang, Jiahao Shi, Zhengzheng Nan, Qianwen Ren, Jie Wang, and Zeyang Wu.

Conflicts of Interest

The authors declare that they have no known competing financial interest or personal relationships that could have appeared to influence the work reported in this paper.

References

  1. Chen, L.; Fang, K.; Wei, B.; Qin, S.; Feng, X.; Hu, T.; Ji, C.; Yang, Y. Soil carbon persistence governed by plant input and mineral protection at regional and global scales. Ecol. Lett. 2021, 24, 1018–1028. [Google Scholar] [CrossRef] [PubMed]
  2. Zhang, T. Protecting Soil Health of Cultivated Land to Promote High-Quality Development of Agriculture in China. Soils 2021, 53, 1–4. [Google Scholar] [CrossRef]
  3. Weng, C. Prevention and control of soil erosion in slope-type economic forestland. China Soil Water Conserv. 2004, 11, 40–41. [Google Scholar] [CrossRef]
  4. Zuazo, V.H.D.; Pleguezuelo, C.R.R. Soil-erosion and runoff prevention by plant covers: A review. In Sustainable Agriculture; Springer: Dordrecht, The Netherlands, 2009; pp. 785–811. [Google Scholar]
  5. Sterk, G. Causes, consequences and control of wind erosion in Sahelian Africa: A review. Land Degrad. Dev. 2003, 14, 95–108. [Google Scholar] [CrossRef]
  6. Wang, Q.; He, S. Research on ecological construction and green industry development planning of Yangtze River Economic Belt: A case study of Wushan county. For. Constr. 2022, 04, 41–46. [Google Scholar]
  7. Doran, J.W.; Parkin, T.B. Defining and assessing soil quality. Defin. Soil Qual. Sustain. Environ. 1994, 35, 1–21. [Google Scholar]
  8. Tian, Y.; Xu, Z.; Wang, Y.; He, J.; Wang, Z. Soil quality evaluation for different forest plantation of sandy land in Yinchuan Plain, Ningxia. Acta Ecol. Sin. 2023, 4, 1–11. [Google Scholar]
  9. Huang, T.; Yue, X.; Ge, X.; Wang, X. Evaluation of soil quality on gully region of loess plateau based on principal component analysis. Agric. Res. Arid Areas 2010, 28, 141–147. [Google Scholar]
  10. Sefati, Z.; Khalilimoghadam, B.; Nadian, H. Assessing urban soil quality by improving the method for soil environmental quality evaluation in a saline groundwater area of Iran. Catena 2019, 173, 471–480. [Google Scholar] [CrossRef]
  11. Valani, G.P.; Vezzani, F.M.; Cavalieri-Polizeli, K.M.V. Soil quality: Evaluation of on-farm assessments in relation to analytical index. Soil Tillage Res. 2020, 198, 104565. [Google Scholar] [CrossRef]
  12. Tian, Y.; Xu, Z.; Wang, J.; Wang, Z. Evaluation of Soil Quality for Different Types of Land Use Based on Minimum Dataset in the Typical Desert Steppe in Ningxia, China. J. Adv. Transp. 2022, 2022, 7506189. [Google Scholar] [CrossRef]
  13. Zhou, M.; Xiao, Y.; Li, Y.; Zhang, X.; Wang, G.; Jin, J.; Ding, G.; Liu, X. Soil quality index evaluation model in responses to six-year fertilization practices in Mollisols. Arch. Agron. Soil Sci. 2022, 68, 180–194. [Google Scholar] [CrossRef]
  14. Yu, P.; Liu, S.; Zhang, L.; Li, Q.; Zhou, D. Selecting the minimum data set and quantitative soil quality indexing of alkaline soils under different land uses in northeastern China. Sci. Total Environ. 2018, 616, 564–571. [Google Scholar] [CrossRef]
  15. Van Leeuwen, J.P.; Creamer, R.E.; Cluzeau, D.; Debeljak, M.; Gatti, F.; Henriksen, C.B.; Kuzmanovski, V.; Menta, C.; Pérès, G.; Picaud, C. Modeling of soil functions for assessing soil quality: Soil biodiversity and habitat provisioning. Front. Environ. Sci. 2019, 7, 113. [Google Scholar] [CrossRef]
  16. Hemati, Z.; Selvalakshmi, S.; Xia, S.; Yang, X. Identification of indicators: Monitoring the impacts of rubber plantations on soil quality in Xishuangbanna, Southwest China. Ecol. Indic. 2020, 116, 106491. [Google Scholar] [CrossRef]
  17. Li, F.; Zhang, X.; Zhao, Y.; Song, M.; Liang, J. Soil quality assessment of reclaimed land in the urban-rural fringe. Catena 2023, 220, 106692. [Google Scholar] [CrossRef]
  18. Segura, C.; Jiménez, M.N.; Fernández-Ondoño, E.; Navarro, F.B. Effects of Afforestation on Plant Diversity and Soil Quality in Semiarid SE Spain. Forests 2021, 12, 1730. [Google Scholar] [CrossRef]
  19. Tian, K.; Zhang, B.; Zhang, H.; Huang, B.; Darilek, J.L.; Zhao, Y.; Yang, J. Evaluation of soil quality in major grain-producing region of the North China Plain: Integrating minimum data set and established critical limits. Ecol. Indic. 2020, 117, 106613. [Google Scholar] [CrossRef]
  20. Xiao, L.; Zhao, M.; Liu, G.; Li, P.; Liu, F.; Xue, S. Soil biochemical index-based assessment of the effect of drought stress on the rhizosphere soil quality in three typical grass species in the Loess Plateau, China. J. Soils Sediments 2022, 22, 2982–2994. [Google Scholar] [CrossRef]
  21. Zhang, Y.; Wang, L.; Jiang, J.; Zhang, J.; Zhang, Z.; Zhang, M. Application of soil quality index to determine the effects of different vegetation types on soil quality in the Yellow River Delta wetland. Ecol. Indic. 2022, 141, 109116. [Google Scholar] [CrossRef]
  22. Jimenez, L.C.Z.; Queiroz, H.M.; Cherubin, M.R.; Ferreira, T.O. Applying the Soil Management Assessment Framework (SMAF) to Assess Mangrove Soil Quality. Sustainability 2022, 14, 3085. [Google Scholar] [CrossRef]
  23. Zhang, Y.; Xu, X.; Li, Z.; Liu, M.; Xu, C.; Zhang, R.; Luo, W. Effects of vegetation restoration on soil quality in degraded karst landscapes of southwest China. Sci. Total Environ. 2019, 650, 2657–2665. [Google Scholar] [CrossRef] [PubMed]
  24. Mesfin, D.; Assefa, E.; Simane, B. Soil quality index under different land-use types: The case of Choke Mountain agroecosystems, upper Blue Nile Basin, Ethiopia. Can. J. Soil Sci. 2023, 103, 285–296. [Google Scholar] [CrossRef]
  25. AbdelRahman, M.A.; Saleh, A.M.; Arafat, S.M. Assessment of land suitability using a soil-indicator-based approach in a geomatics environment. Sci. Rep. 2022, 12, 18113. [Google Scholar] [CrossRef] [PubMed]
  26. Zhang, Z.; Ai, N.; Liu, G.; Liu, C.; Qiang, F. Soil quality evaluation of various microtopography types at different restoration modes in the loess area of Northern Shaanxi. Catena 2021, 207, 105633. [Google Scholar] [CrossRef]
  27. Peng, S.; Chen, A.; Fang, H.; Wu, J.; Liu, G. Effects of vegetation restoration types on soil quality in Yuanmou dry-hot valley, China. Soil Sci. Plant Nutr. 2013, 59, 347–360. [Google Scholar] [CrossRef] [Green Version]
  28. Zhang, L.; He, R.; Liu, H.; Chen, X.; Yin, H. Evaluation on Ecological Benefits of the Jujube Economic Forest along the Yellow River in Loess Plateau. J. Shanxi Agric. Sci. 2021, 49, 382–386. [Google Scholar]
  29. Tian, J.; Dang, X.; Yang, Z.; Li, P.; Cao, X.-S.; Fan, L.-X.; Li, L. Analysis of water security risk of cash forest expansion in the Loess Plateau in terms of water footprint:A case study of apple planting. J. Nat. Resour. 2022, 37, 2750–2762. [Google Scholar] [CrossRef]
  30. Ge, Y.; Ren, F. Spatial Distribution and Characteristics of Economic Forest Resources in Shaanxi Province. For. Inventory Plan. 2019, 44, 36–41. [Google Scholar]
  31. Xiang, T.; Gao, R.; Qiang, F.; Yang, N.; Liu, G.; Liu, C.; Ai, N. Coupling Relationship between Soil Organic Carbon Storage and Soil Water Storage in Abandoned Economic Forests in the Loess Hilly Areas. Forests 2023, 14, 221. [Google Scholar] [CrossRef]
  32. Ma, J.; Xiao, X.; Bu, R.; Doughty, R.; Hu, Y.; Chen, B.; Li, X.; Zhao, B. Application of the space-for-time substitution method in validating long-term biomass predictions of a forest landscape model. Environ. Model. Softw. 2017, 94, 127–139. [Google Scholar] [CrossRef]
  33. Institute of Soil Science; Chinese Academy of Sciences. Soil Physical Properties Determination Method; Science Press: Beijing, China, 1978; pp. 2, 4, 6. [Google Scholar]
  34. Gee, G.W.; Or, D. 2.4 Particle-size analysis. In Methods of Soil Analysis: Part 4 Physical Methods; John Wiley & Sons: Hoboken, NJ, USA, 2002; Volume 5, pp. 255–293. [Google Scholar]
  35. Bao, S. Soil Agrochemical Analysis; China Agriculture Press: Beijing, China, 2000; pp. 2–10. [Google Scholar]
  36. Pang, S.L.; Zhi-Yang, O.U.; Shen, W.H.; Hou, Y.R.; Huang, X.R.; Zheng, W.; Academy, G.F. Edaphic characteristics of different regeneration patterns in karst mountainous areas of Guangxi. J. Cent. South Univ. For. Technol. 2016, 36, 60–66. [Google Scholar]
  37. Shao, G.; Ai, J.; Sun, Q.; Hou, L.; Dong, Y. Soil quality assessment under different forest types in the Mount Tai, central Eastern China. Ecol. Indic. 2020, 115, 106439. [Google Scholar] [CrossRef]
  38. Jin, H.; Shi, D.; Lou, Y.B.; Zhang, J.; Ye, Q.; Jiang, N. Evaluation of the quality of cultivated-layer soil based on different degrees of erosion in sloping farmland with purple soil in China. CATENA 2021, 198, 105048. [Google Scholar] [CrossRef]
  39. Li, H.; Wang, B.; Cao, Y.; Liu, Q.; Li, D. Difference Feature of Planted Vegetation Biomass and Litter Biomass for Three Plantations and Their Relationship with Soil Nutrients in Lvliang Mountainous Region. Bull. Bot. Res. 2016, 36, 573–580. [Google Scholar]
  40. Yawei, H.; Ruoxiu, S.; Mingshuang, S.; Zhengle, S.; Chang, L.; Qintao, X.; Junting, L.; Jianjun, Z. Effects of land use types on the stoichiometric characteristics of soil C:N:P and the physical and chemical properties of soil in western Shanxi loess region. Arid Zone Res. 2021, 38, 990–999. [Google Scholar] [CrossRef]
  41. Zhang, Z.; Liu, G.; Ai, N.; Liu, C.; Zong, Q.; Hao, B.; Liu, J. Soil quality evaluation of main vegetation types after conversion of farmland to forest in Wuqi County. J. Arid Land Resour. Environ. 2021, 35, 81–87. [Google Scholar] [CrossRef]
  42. Yu, Y.; Wei, W.; Chen, L.; Feng, T.; Daryanto, S.; Wang, L. Land preparation and vegetation type jointly determine soil conditions after long-term land stabilization measures in a typical hilly catchment, Loess Plateau of China. J. Soils Sediments 2017, 17, 144–156. [Google Scholar] [CrossRef]
  43. Bock, M.D.; Van Rees, K.C. Mechanical site preparation impacts on soil properties and vegetation communities in the Northwest Territories. Can. J. For. Res. 2002, 32, 1381–1392. [Google Scholar] [CrossRef]
  44. Feng, T.; Wei, W.; Chen, L.; Cerdà, A.; Yang, L.; Yu, Y. Combining land preparation and vegetation restoration for optimal soil eco-hydrological services in the Loess Plateau, China. Sci. Total Environ. 2019, 657, 535–547. [Google Scholar] [CrossRef]
  45. Wei, W.; Chen, D.; Wang, L.; Daryanto, S.; Chen, L.; Yu, Y.; Lu, Y.; Sun, G.; Feng, T. Global synthesis of the classifications, distributions, benefits and issues of terracing. Earth-Sci. Rev. 2016, 159, 388–403. [Google Scholar] [CrossRef] [Green Version]
  46. Querejeta, J.I.; Rolda’n, A.; Albaladejo, J.; Castillo, V. Soil physical properties and moisture content affected by site preparation in the afforestation of a semiarid rangeland. Soil Sci. Soc. Am. J. 2000, 64, 2087–2096. [Google Scholar] [CrossRef]
  47. Wang, Z.; Duan, J.; Gao, W. Study on the benefits of slope runoff control afforestation in the loess gully area of Longdong. Soil Water Conserv. China 2018, 1, 58–61. [Google Scholar] [CrossRef]
  48. Wenli, Y.; Pingzong, Z.; Jingkun, Y. Effect of Horizontal Planting Camellia oleifera on Soil Physicochemical Properties in Red Soil Slope Land. J. Soil Water Conserv. 2017, 31, 315–320. [Google Scholar] [CrossRef]
  49. Wang, L.; Wang, Q.; Wei, S.; Shao, M.; Li, Y. Soil desiccation for Loess soils on natural and regrown areas. For. Ecol. Manag. 2008, 255, 2467–2477. [Google Scholar] [CrossRef]
  50. Kisaka, M.O.; Shisanya, C.; Cournac, L.; Manlay, J.R.; Gitari, H.; Muriuki, J. Integrating no-tillage with agroforestry augments soil quality indicators in kenya’s dry-land agroecosystems. Soil Tillage Res. 2023, 227, 105586. [Google Scholar] [CrossRef]
  51. Wanng, P.; Jia, L.; Du, J.; Zhang, J.; Mu, X.; Ding, W. Improvement of soil quality by Chinese dwarf cherry cultivation in the Loess Plateau steep hill region. Acta Pratacult. Sin. 2017, 26, 65–74. [Google Scholar]
  52. Vasu, D.; Tiwari, G.; Sahoo, S.; Dash, B.; Jangir, A.; Sharma, R.P.; Naitam, R.; Tiwary, P.; Karthikeyan, K.; Chandran, P. A minimum data set of soil morphological properties for quantifying soil quality in coastal agroecosystems. Catena 2021, 198, 105042. [Google Scholar] [CrossRef]
  53. Gao, R.; Ai, N.; Liu, G.; Liu, C.; Zhang, Z. Soil C:N:P Stoichiometric Characteristics and Soil Quality Evaluation under Different Restoration Modes in the Loess Region of Northern Shaanxi Province. Forests 2022, 13, 913. [Google Scholar] [CrossRef]
  54. Nabiollahi, K.; Taghizadeh-Mehrjardi, R.; Kerry, R.; Moradian, S. Assessment of soil quality indices for salt-affected agricultural land in Kurdistan Province, Iran. Ecol. Indic. 2017, 83, 482–494. [Google Scholar] [CrossRef]
  55. Yu-Dong, C.; Huo-Yan, W.; Jian-Min, Z.; Lu, X.; Bai-Shu, Z.; Yong-Cun, Z.; Xiao-Qin, C. Minimum data set for assessing soil quality in farmland of northeast China. Pedosphere 2013, 23, 564–576. [Google Scholar]
  56. Zhang, G.; Bai, J.; Xi, M.; Zhao, Q.; Lu, Q.; Jia, J. Soil quality assessment of coastal wetlands in the Yellow River Delta of China based on the minimum data set. Ecol. Indic. 2016, 66, 458–466. [Google Scholar] [CrossRef] [Green Version]
  57. Huang, Y.; Xin, Z. Effects of different ecological restoration models on deep soil organic carbon in loess remnant gully area. Acta Ecol. Sin. 2020, 40, 11. [Google Scholar]
  58. Deng, L.; Han, Q.S.; Zhang, C.; Tang, Z.S.; Shangguan, Z.P. Above-ground and below-ground ecosystem biomass accumulation and carbon sequestration with Caragana korshinskii Kom plantation development. Land Degrad. Dev. 2017, 28, 906–917. [Google Scholar] [CrossRef]
  59. Zhang, Z.-Y.; Qiang, F.-F.; Liu, G.-Q.; Liu, C.-H.; Ai, N. Distribution characteristics of soil microbial communities and their responses to environmental factors in the sea buckthorn forest in the water-wind erosion crisscross region. Front. Microbiol. 2022, 13, 1098952. [Google Scholar] [CrossRef]
  60. Arunrat, N.; Sereenonchai, S.; Kongsurakan, P.; Hatano, R. Assessing soil organic carbon, soil nutrients and soil erodibility under terraced paddy fields and upland rice in Northern Thailand. Agronomy 2022, 12, 537. [Google Scholar] [CrossRef]
  61. Yu, Y.; Wei, W.; Chen, L.; Feng, T.; Daryanto, S. Quantifying the effects of precipitation, vegetation, and land preparation techniques on runoff and soil erosion in a Loess watershed of China. Sci. Total Environ. 2019, 652, 755–764. [Google Scholar] [CrossRef]
  62. Tao, T.; Liu, L.; Small, G.E.; Chen, J.; Wang, Y.; Sun, X. The effects of land management patterns on soil carbon sequestration and C:N:P stoichiometry in sloping croplands in southern China. Agric. Ecosyst. Environ. 2021, 320, 107584. [Google Scholar] [CrossRef]
  63. Lal, R. Soil carbon sequestration impacts on global climate change and food security. Science 2004, 304, 1623–1627. [Google Scholar] [CrossRef] [Green Version]
  64. Brar, S.K.; Dhaliwal, S.S.; Sharma, V.; Sharma, S.; Kaur, M. Soil Quality Assessment in Diversified Long-Term Experimentation Under Different Agriculturally Based Cropping Systems. J. Soil Sci. Plant Nutr. 2023, 23, 1727–1739. [Google Scholar] [CrossRef]
  65. Cui, Z.; Wu, G.-L.; Huang, Z.; Liu, Y. Fine roots determine soil infiltration potential than soil water content in semi-arid grassland soils. J. Hydrol. 2019, 578, 124023. [Google Scholar] [CrossRef]
  66. Chen, J.; Yu, Z.; Ouyang, J.; Van Mensvoort, M. Factors affecting soil quality changes in the North China Plain: A case study of Quzhou County. Agric. Syst. 2006, 91, 171–188. [Google Scholar] [CrossRef]
  67. Xue, J.-F.; Qi, Z.-W.; Chen, J.-L.; Cui, W.-H.; Lin, W.; Gao, Z.-Q. Dynamic of Soil Porosity and Water Content under Tillage during Summer Fallow in the Dryland Wheat Fields of the Loess Plateau in China. Land 2023, 12, 230. [Google Scholar] [CrossRef]
  68. Geroy, I.; Gribb, M.; Marshall, H.-P.; Chandler, D.; Benner, S.G.; McNamara, J.P. Aspect influences on soil water retention and storage. Hydrol. Processes 2011, 25, 3836–3842. [Google Scholar] [CrossRef]
  69. Albaladejo Montoro, J.; Alvarez Rogel, J.; Querejeta, J.; Díaz, E.; Castillo, V. Three hydro-seeding revegetation techniques for soil erosion control on anthropic steep slopes. Land Degrad. Dev. 2000, 11, 315–325. [Google Scholar] [CrossRef]
  70. Wei, W.; Feng, X.; Yang, L.; Chen, L.; Feng, T.; Chen, D. The effects of terracing and vegetation on soil moisture retention in a dry hilly catchment in China. Sci. Total Environ. 2019, 647, 1323–1332. [Google Scholar] [CrossRef]
  71. Zhang, Z.; Ai, N.; Liu, G.; Liu, C.; Zong, Q.; Liu, J.; Hao, B. Soil quality characteristics of forests and grasslands returned from farmland and their responses to precipitation in the Loess Region of Northern Shaanxi, China. Trans. Chin. Soc. Agric. Eng. 2020, 36, 73–80. [Google Scholar]
  72. Ling, Q.; Gao, X.; Zhao, X.; Huang, J.; Li, H.; Li, L.; Sun, W.; Wu, P. Soil water effects of agroforestry in rainfed jujube (Ziziphus jujube Mill.) orchards on loess hillslopes in Northwest China. Agric. Ecosyst. Environ. 2017, 247, 343–351. [Google Scholar] [CrossRef]
Figure 1. Location of the sampling sites.
Forests 14 01179 g001
Figure 2. Linear fitting relationship between the minimum data set and the total.
Forests 14 01179 g002
Figure 3. Effects of different main control factors on the SQI. (ac) represent the level bench of jujube, apple tree, and grassland, respectively; (df) represent the undisturbed slopes of jujube trees, apple trees, and grassland, respectively. The red arrow indicates a significant positive impact, the blue arrow indicates a significant negative impact, the dotted arrow indicates an insignificant impact, and the thickness indicates the size of the path coefficient. *** represents a significant correlation at the 0.001 level, ** represents a significant correlation at the 0.01 level, and * represents a significant correlation at the 0.05 level.
Forests 14 01179 g003
Table 1. Information on the sample plot.
Sample NumberPlot TypeSoil
Type
Altitude
(m)
Slope Gradient (°)Vegetation Coverage (%)Land Preparation MethodTending Method
1JLLoessal
soil
836040Level benchRainfed/no fertilization
2JULoessal
soil
8602543Undisturbed slopeRainfed/no fertilization
3ALLoessal
soil
900050Level benchRainfed/no fertilization
4AULoessal
soil
9032852Undisturbed slopeRainfed/no fertilization
5GLLoessal
soil
905082Level benchRainfed/no fertilization
6GULoessal
soil
9043080Undisturbed slopeRainfed/no fertilization
Note: JL, JU, AL, AU, GL, and GU represent the Jujube tree (Level bench), Jujube tree (Undisturbed slope), Apple tree (Level bench), Apple tree (Undisturbed slope), Grassland (Level bench), Grassland (Undisturbed slope).
Table 2. Statistical differences between soil quality evaluation indicators under different vegetation types and different land preparation methods.
Soil
Indicator
Jujube TreeApple TreeGrassland
Level BenchUndisturbed SlopeLevel BenchUndisturbed SlopeLevel BenchUndisturbed Slope
BD1.2 ± 0.09 Aa1.21 ± 0.08 Aa1.16 ± 0.07 Aa1.21 ± 0.04 Aa1.16 ± 0.04 Aa1.19 ± 0.04 Aa
SWC39.57 ± 3.56 Aa39.57 ± 1.56 Aa40.35 ± 1.58 Aa39.19 ± 1.34 Aa39.6 ± 0.99 Aa40.41 ± 1.9 Aa
CWHC33.66 ± 1.1 Bb33.59 ± 1.52 Bb35.64 ± 1.42 Aa33.8 ± 0.93 ABab34.06 ± 1.4 ABab34.91 ± 0.26 ABab
TCP45.9 ± 1.63 Aa46.98 ± 0.5 Aa46.87 ± 1.61 Aa46.83 ± 0.8 Aa46.01 ± 1.82 Aa46.5 ± 1.14 Aa
pH8.46 ± 0.01 Aa8.46 ± 0.03 Aa8.46 ± 0.06 Aa8.49 ± 0.07 Aa8.51 ± 0.01 Aa8.47 ± 0.1 Aa
EC72.56 ± 8.36 Bb69.2 ± 3.22 Bb73.48 ± 1.18 Ab74.69 ± 3.42 Bb92.06 ± 16.44 Aa73.64 ± 2.64 Bb
AN0.13 ± 0.06 Aa0.1 ± 0.04 Aa0.15 ± 0.04 Aa0.13 ± 0.02 Aa0.16 ± 0.05 Aa0.13 ± 0.1 Aa
AP30.44 ± 8.11 Aa27.1 ± 11.84 Aa19.5 ± 1.31 Aa20.28 ± 16.24 Aa14.29 ± 8.73 Aa15.5 ± 14.23 Aa
AK28.7 ± 12.16 Aa22.08 ± 12.08 Aa26.68 ± 11.12 Aa23.36 ± 10.48 Aa25.62 ± 6.48 Aa21.56 ± 11.91 Aa
SOC7.36 ± 0.81 Aa7.27 ± 0.84 Aa4.08 ± 1.27 Ab3.21 ± 1.41 BCbc2.56 ± 1.04 BCbc2.39 ± 0.54 Cc
NWC12.25 ± 1.08 Aa11.94 ± 1.5 aBb10.58 ± 0.86 BCbc10.16 ± 1.21 Cc8.37 ± 0.86 Dd5.84 ± 0.25 Ee
NCP6.06 ± 2.61 Aa6.3 ± 1.37 Aa5.35 ± 1.55 Aa5.96 ± 1.15 Aa6.41 ± 1.1 Aa6.35 ± 1.71 Aa
CP39.84 ± 1.46 Aa40.68 ± 1.47 Aa41.48 ± 3.02 Aa40.91 ± 1.2 Aa39.6 ± 2.33 Aa40.15 ± 0.61 Aa
TP543.88 ± 21.21 ABab404.18 ± 29.37 Cc523.24 ± 32.19 ABab562.33 ± 76.92 Aa510.16 ± 112.13 ABab451.9 ± 22.26 BCbc
Clay4.13 ± 0.37 CDcd4.69 ± 0.09 ABab4.42 ± 0.32 BCbc4.29 ± 0.14 CDcd3.94 ± 0.22 Dd4.79 ± 0.14 Aa
Silt74.29 ± 1.11 Bb79.12 ± 1.26 Aa75.82 ± 0.78 Bb75.08 ± 2.04 Bb75.65 ± 0.93 Bb76.21 ± 0.94 Bb
Sand21.57 ± 1.35 Aa16.18 ± 1.2 Cc19.76 ± 1.1 Bb16.03 ± 0.98 Cc20.4 ± 0.96 ABab18.99 ± 0.91 Bb
Note: The single factor variance Duncan method was used to analyze the differences between the same indicator among different vegetation types and different soil preparation methods (p < 0.05). Lowercase letters represent different vegetation types, uppercase letters represent different soil preparation methods, and different letters indicate significant differences. Bulk density: BD; saturated water content: SWC; capillary water-holding capacity: CWHC; total capillary porosity: TCP; electrical conductivity: EC; available nitrogen: AN; available phosphorus: AP; available potassium: AK; total phosphorus: TP; soil organic carbon: SOC; natural water content: NWC; non-capillary porosity: NCP; capillary porosity: CP.
Table 3. Principal component analysis of soil quality indicators.
Soil IndicatorPC1PC2PC3PC4PC5ClassingNormCommunalityWeight
BD−0.923 −0.190 0.042 0.074 −0.121 11.7150.8230.181
SWC0.894 −0.005 0.011 0.361 0.106 11.6600.9190.202
NCP0.870 −0.135 0.196 −0.085 0.258 11.616
Silt−0.083 −0.896 −0.038 −0.004 −0.250 21.5450.5900.130
Sand0.115 0.773 0.030 −0.027 0.021 21.333
Clay0.210 −0.769 −0.020 0.108 0.318 21.326
TP0.032 0.716 0.087 −0.267 0.175 21.235
SOC0.055 −0.100 0.927 −0.016 0.115 31.5290.9290.205
NWC−0.070 0.042 0.872 0.053 0.110 31.438
AP0.180 0.252 0.782 −0.079 0.114 31.289
TCP0.125 −0.210 0.031 0.844 0.039 41.2840.7020.155
CWHC0.478 0.145 −0.371 0.684 −0.125 41.040
CP−0.663 −0.033 −0.148 0.676 −0.194 41.028
EC0.301 0.377 −0.293 −0.610 −0.081 40.928
AN0.228 0.189 −0.057 −0.214 0.826 51.2090.5760.127
AK0.334 0.276 0.372 −0.017 0.737 51.079
pH−0.029 0.128 −0.222 −0.143 −0.730 51.069
Eigenvalue variance (%)3.452 2.972 2.719 2.313 2.145
contribution rate (%)20.306 17.483 15.993 13.606 12.615
Accumulative
contribution rate (%)
20.306 37.790 53.782 67.388 80.003
Table 4. The soil quality evaluation results of different vegetation types and land preparation methods based on the minimum data set.
Vegetation
Type
Jujube TreeApple TreeGrassland
Level
Bench
Undisturbed SlopeLevel
Bench
Undisturbed SlopeLevel BenchUndisturbed Slope
SQI-MDS0.630.590.590.530.540.52
Disclaimer/Publisher’s Note: The statements, opinions and data contained in all publications are solely those of the individual author(s) and contributor(s) and not of MDPI and/or the editor(s). MDPI and/or the editor(s) disclaim responsibility for any injury to people or property resulting from any ideas, methods, instructions or products referred to in the content.

