

Mangrove Resource Mapping Using Remote Sensing in the Philippines: A Systematic Review and Meta-Analysis


Abstract
:1. Introduction
2. Materials and Methods
3. Results
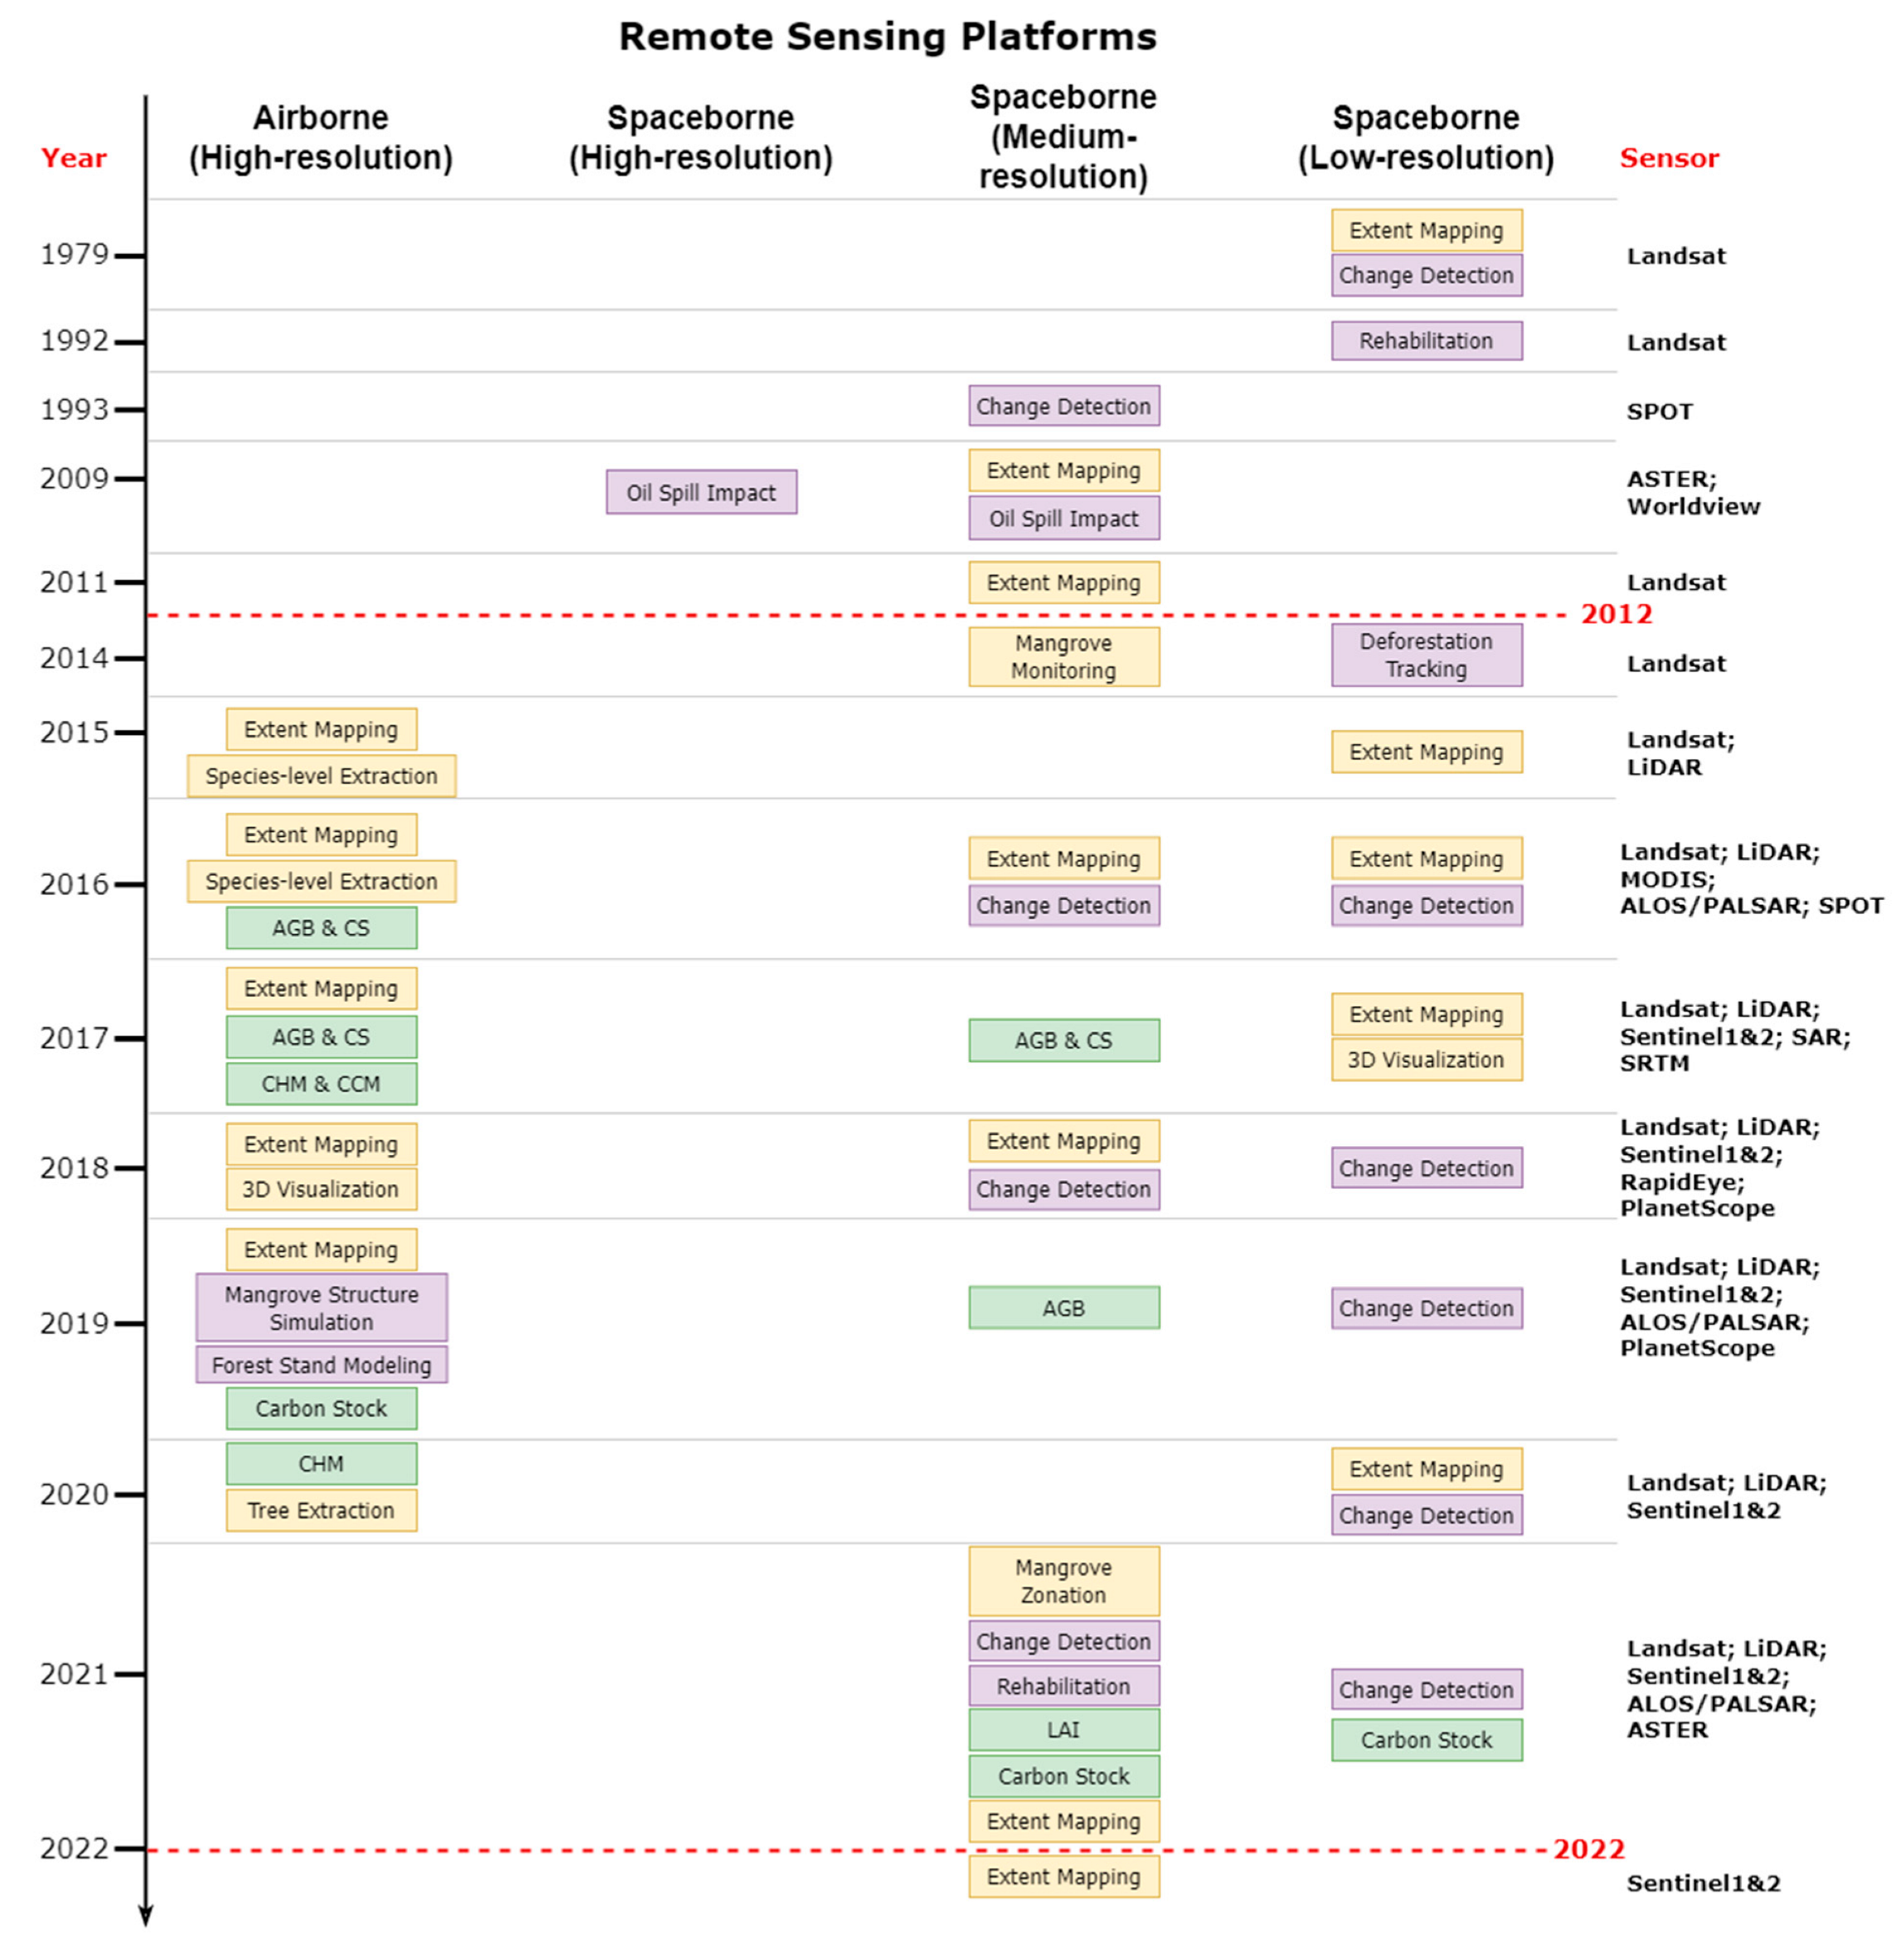
3.1. Trend of Mangrove Resource Mapping Using RS in the Philippines
3.2. Early Years of Mangrove Resource Extraction Using RS
3.3. Expansion of RS Uses in Mangrove Resources Mapping
3.4. RS Data Types
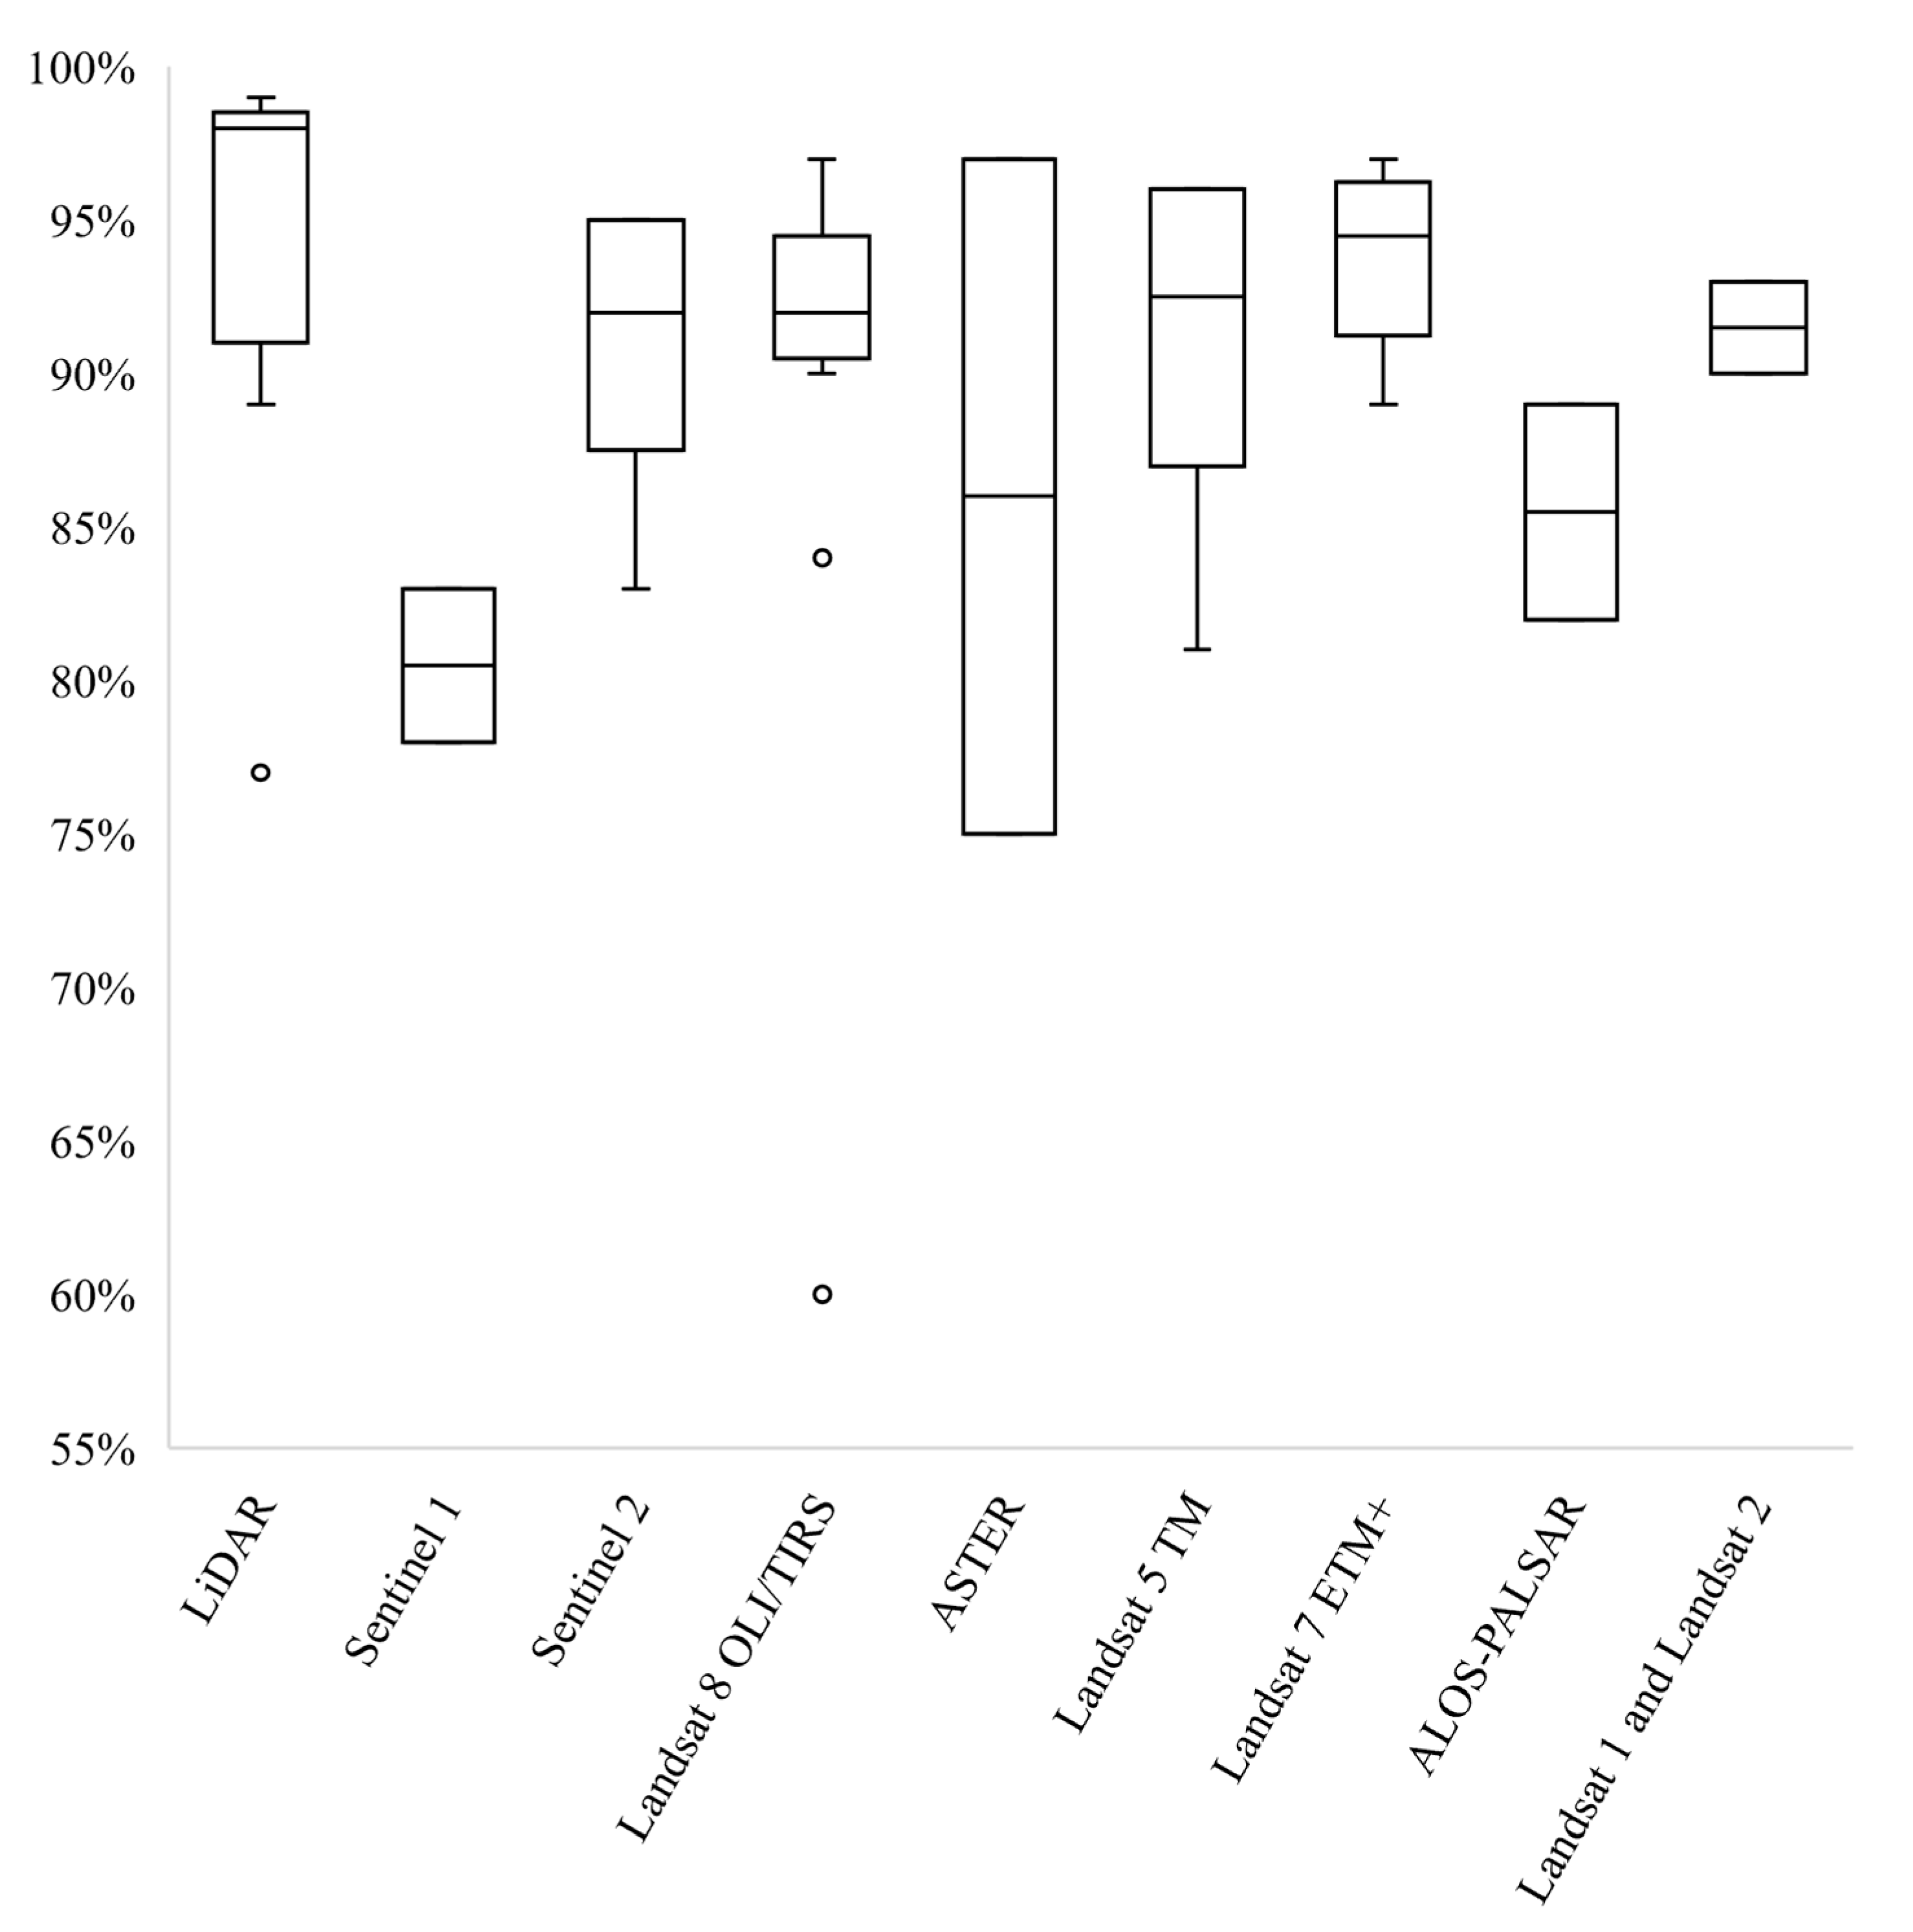
3.5. Sensor Types and Performance
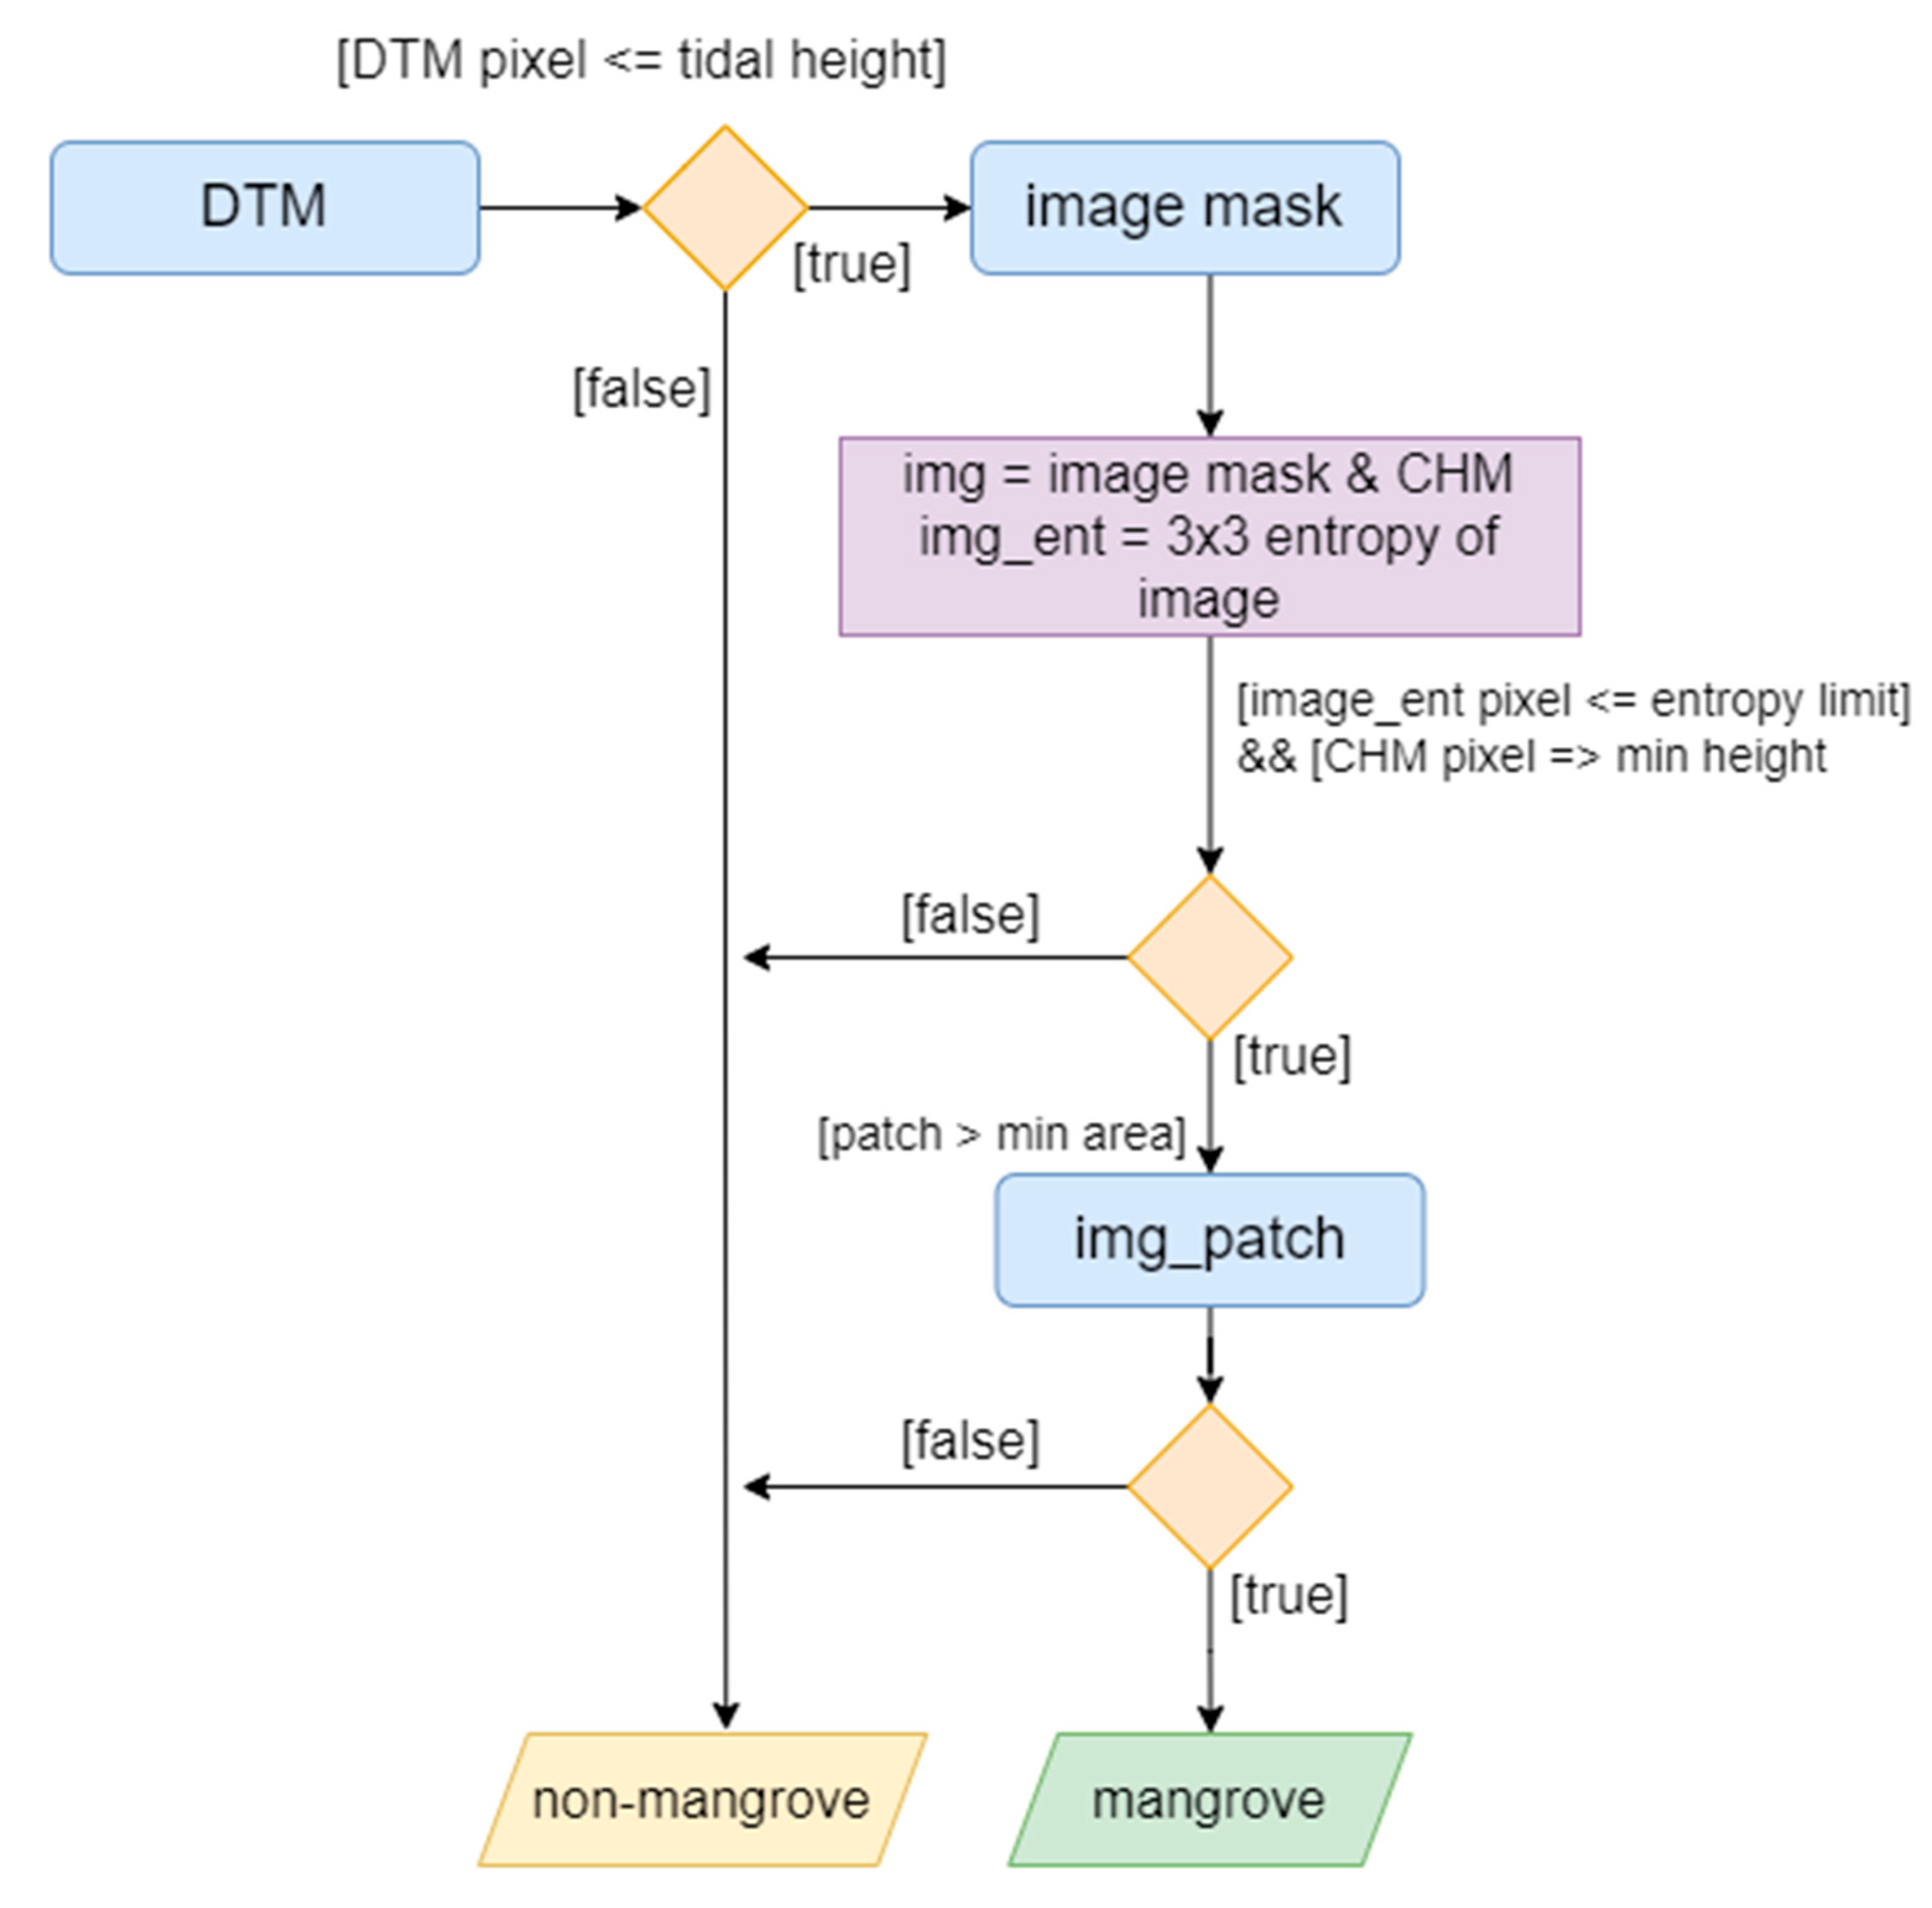
3.6. Mangrove Resource Mapping Methods
4. Discussion
4.1. Research Status of Mangrove Classification and RS in the Philippines
4.2. Sensor Types in Mangrove Resource Mapping
4.3. Different Approaches in Discriminating Mangroves from Other Land Cover
4.4. Mangrove Biomass and Carbon Stock Estimation
5. Conclusions
- RS in the Philippines started in 1979, just when remotely sensed data started to be used in mangrove resource mapping in the early 1970s. In 2015, research on the same topic was boosted after the UP-DREAM LiDAR project was implemented.
- As an archipelagic country, there are still many areas in the Philippines that need to be assessed and can be subjected to future RS studies in mangroves.
- Institutions that could find or are supported by external funders are more likely to publish studies in mangrove resource mapping using RS, especially in acquiring high-resolution datasets.
- Medium to low-resolution spaceborne satellite (e.g., Landsat 1 and 2, Sentinel-1 and 2, and SPOT-4) data are still commonly used in mangrove resource mapping. This is because, aside from the fact that spaceborne RS platforms have been available since the 1970s, it has also been made available to the public for free, with less pre-processing and less technical expertise required.
- Among the various machine learning approaches used in mangrove ecosystem discrimination, SVM has generally been shown to be the most effective in mangrove-extent mapping, particularly when LiDAR and other high-resolution datasets are being used. However, despite processing medium to low-resolution datasets, promising results can still be achieved using proper algorithms.
- In mapping mangroves at the species level, the airborne (LiDAR) RS platform has the upper hand. This is because a spatial resolution closer to the size of the plant canopy has higher overall accuracy results. MVI has proven to be effective in discriminating mangroves from other land cover even using different medium to low-resolution datasets.
- The efficiency of optical data as a biomass predictor is relatively higher with the use of vegetation indices, because it is driven by the potential of the vegetation indices to highlight plant intrinsic properties that are well related to biomass vigor. The utilization of optical data can still achieve promising results by using the newly introduced biomass predictive model.
- Although very high-resolution data can improve accuracy in mangrove-extent mapping, AGB estimation, and CS estimation, the cost of data acquisition and massive data storage requirements are significant drawbacks that limit the application at large scales. This explains why most published research papers used low to medium-resolution data for classification and estimation.
- Low to medium-resolution data can be challenging when being used for species-level identification due to the complexity of canopy overlap.
- The inaccessibility of higher-resolution datasets hinders other researchers in exploring other opportunities in mangrove resource mapping.
- In utilizing SAR data, foliage in the forest canopies attenuates the backscatter produced by the double bounce response, such that the radar wave may not penetrate deeper into the canopy due to the size of the wavelength and the high moisture conditions.
- Quantification of the impacts and recovery of mangroves influenced by oil spills, considering that these are among the multiple stressors of mangrove ecosystems.
- The design and implementation of novel machine learning algorithms for monitoring mangrove ecosystems in the context of blue carbon programs must be put into consideration.
- The publication of RS data from the country’s very own satellite images can be of great help to achieve better results in mapping the extent and biophysical characteristics of mangroves.
- The need for a robust comparative analysis between remotely sensed mangrove monitoring such as distribution mapping, species-level classification, and biophysical characterization and field collected data (ground truthing) to achieve a better model is vital.
- In the near future, an increasing trend in using different platforms, such as cloud computing, is anticipated in monitoring mangrove ecosystems at a larger scale. Cloud computing platforms such as Google Earth Engine can do most of the pre-processing phase of RS datasets at larger scales. Through this, a thorough monitoring of mangrove forest change on a regional or national scale, as well as its biophysical characteristics, is attainable.
Author Contributions
Funding
Institutional Review Board Statement
Informed Consent Statement
Acknowledgments
Conflicts of Interest
References
- Afonso, F.; Félix, P.M.; Chainho, P.; Heumüller, J.A.; de Lima, R.F.; Ribeiro, F.; Brito, A.C. Assessing Ecosystem Services in Mangroves: Insights from São Tomé Island (Central Africa). Front. Environ. Sci. 2021, 9, 501673. [Google Scholar] [CrossRef]
- Friess, D.A.; Rogers, K.; Lovelock, C.E.; Krauss, K.W.; Hamilton, S.E.; Lee, S.Y.; Lucas, R.; Primavera, J.; Rajkaran, A.; Shi, S. The State of the World’s Mangrove Forests: Past, Present, and Future. Annu. Rev. Environ. Resour. 2019, 44, 89–115. [Google Scholar] [CrossRef]
- Menéndez, P.; Losada, I.J.; Beck, M.; Torres-Ortega, S.; Espejo, A.; Narayan, S.; Díaz-Simal, P.; Lange, G.-M. Valuing the protection services of mangroves at national scale: The Philippines. Ecosyst. Serv. 2018, 34, 24–36. [Google Scholar] [CrossRef]
- Himes-Cornell, A.; Grose, S.O.; Pendleton, L. Mangrove Ecosystem Service Values and Methodological Approaches to Valuation: Where Do We Stand? Front. Mar. Sci. 2018, 5, 376. [Google Scholar] [CrossRef]
- Spalding, M.; Parrett, C.L. Global patterns in mangrove recreation and tourism. Mar. Policy 2019, 110, 103540. [Google Scholar] [CrossRef]
- Murdiyarso, D.; Purbopuspito, J.; Kauffman, J.B.; Warren, M.W.; Sasmito, S.D.; Donato, D.C.; Manuri, S.; Krisnawati, H.; Taberima, S.; Kurnianto, S. The potential of Indonesian mangrove forests for global climate change mitigation. Nat. Clim. Chang. 2015, 5, 1089–1092. [Google Scholar] [CrossRef]
- Lukman, K.M.; Uchiyama, Y.; Quevedo, J.M.D.; Harding, D.; Kohsaka, R. Land Use Changes Assessment using a triangulated framework: Perception Interviews, Land-Use/Land Cover Observation, and Spatial Planning Analysis in Tanjung Batu and Derawan Island, Indonesia. Hum. Ecol. 2021, 49, 551–564. [Google Scholar] [CrossRef]
- Kh’ng, X.Y.; Teh, S.Y.; Koh, H.L. Modeling the mitigation effect of coastal forests on tsunami. InAIP Conf. Proc. 2017, 1870, 040009. [Google Scholar] [CrossRef]
- Onyena, A.P.; Sam, K. A review of the threat of oil exploitation to mangrove ecosystem: Insights from Niger Delta, Nigeria. Glob. Ecol. Conserv. 2020, 22, e00961. [Google Scholar] [CrossRef]
- Macreadie, P.I.; Costa, M.D.P.; Atwood, T.B.; Friess, D.A.; Kelleway, J.J.; Kennedy, H.; Lovelock, C.E.; Serrano, O.; Duarte, C.M. Blue carbon as a natural climate solution. Nat. Rev. Earth Environ. 2021, 2, 826–839. [Google Scholar] [CrossRef]
- Akhand, A.; Watanabe, K.; Chanda, A.; Tokoro, T.; Chakraborty, K.; Moki, H.; Tanaya, T.; Ghosh, J.; Kuwae, T. Lateral carbon fluxes and CO2 evasion from a subtropical mangrove-seagrass-coral continuum. Sci. Total. Environ. 2021, 752, 142190. [Google Scholar] [CrossRef]
- Spalding, M. The Global Distribution and Status of Mangrove Ecosystems. In International Newsletter of Coastal Management; Intercoast Network; University of Rhode Island: Narragansett, RI, USA, 1997; pp. 20–21. [Google Scholar]
- Plata-Rocha, W.; Monjardin-Armenta, S.A.; Pacheco-Angulo, C.E.; Rangel-Peraza, J.G.; Franco-Ochoa, C.; Mora-Felix, Z.D. Proximate and Underlying Deforestation Causes in a Tropical Basin through Specialized Consultation and Spatial Logistic Regression Modeling. Land 2021, 10, 186. [Google Scholar] [CrossRef]
- Benítez-Torres, J.A.; Roé-Sosa, A.; Amábilis-Sosa, L.E. Enhancing Environmental Services in Candelaria River by Restoring Ecological Connectivity. In Water Availability and Management in Mexico; Springer: Cham, Germany, 2020; pp. 151–170. [Google Scholar] [CrossRef]
- Abino, A.C.; Castillo, J.A.A.; Lee, Y.J. Assessment of species diversity, biomass and carbon sequestration potential of a natural mangrove stand in Samar, the Philippines. For. Sci. Technol. 2013, 10, 2–8. [Google Scholar] [CrossRef]
- Long, J.B.; Giri, C. Mapping the Philippines’ Mangrove Forests Using Landsat Imagery. Sensors 2011, 11, 2972. [Google Scholar] [CrossRef]
- Brown, W.H.; Fischer, A.F. Philippine mangrove swamps. In Minor Products of Philippine Forests I, Bureau of Forestry Bull; Brown, W.H., Ed.; Bureau of Printing: Manila, Philippines, 1920; pp. 9–125. Available online: https://bit.ly/3D5E5BG (accessed on 15 August 2022).
- Adame, M.F.; Connolly, R.M.; Turschwell, M.P.; Lovelock, C.E.; Fatoyinbo, T.; Lagomasino, D.; Goldberg, L.A.; Holdorf, J.; Friess, D.A.; Sasmito, S.D.; et al. Future carbon emissions from global mangrove forest loss. Glob. Chang. Biol. 2021, 27, 2856–2866. [Google Scholar] [CrossRef]
- Pham, T.D.; Yoshino, K. Impacts of mangrove management systems on mangrove changes in the Northern Coast of Vietnam. Tropics 2016, 24, 141–151. [Google Scholar] [CrossRef]
- Duke, N.; Nagelkerken, I.; Agardy, T.; Wells, S.; van Lavieren, H. Threats and drivers of change. In The Importance of Mangroves to People: A Call to Action; van Bochove, J.W., Sullivan, E., Nakamura, T., Eds.; United Nations Environment Programme World Conservation Monitoring Centre: Cambridge, UK, 2014; pp. 69–88. Available online: https://researchonline.jcu.edu.au/35529/ (accessed on 15 August 2022).
- Mariano, H.; Aguilos, M.; Dagoc, F.L.; Sumalinab, B.; Amparado, R. Abandoned Fishpond Reversal to Mangrove Forest: Will the Carbon Storage Potential Match the Natural Stand 30 Years after Reforestation? Forests 2022, 13, 847. [Google Scholar] [CrossRef]
- Mariano, H.G.; Dagoc, F.L.S.; Espra, A.S.; Amparado, R.F., Jr. Mangrove diversity, taxonomic classification, and mor-phological characteristics of natural and reforested mangrove forests in selected municipalities of Zamboanga Del Sur, Mindanao Island, Philippines. J. Biodivers. Environ. Sci. 2019, 15, 86–99. Available online: https://bit.ly/3cZa0cr (accessed on 14 August 2022).
- Osing, P.K.A.S.; Jondonero, M.A.P.; Suson, P.D.; Guihawan, J.Q.; Amparado, R.F., Jr. Species composition and diversity in a natural and reforested mangrove forests in Panguil Bay, Mindanao, Philippines. J. Biodivers. Environ. Sci. 2019, 15, 88–102. Available online: https://bit.ly/3D6AjrL (accessed on 14 August 2022).
- Tomppo, E.; Olsson, H.; Ståhl, G.; Nilsson, M.; Hagner, O.; Katila, M. Combining national forest inventory field plots and remote sensing data for forest databases. Remote Sens. Environ. 2008, 112, 1982–1999. [Google Scholar] [CrossRef]
- Maxwell, A.E.; Warner, T.A.; Fang, F. Implementation of machine-learning classification in remote sensing: An applied review. Int. J. Remote Sens. 2018, 39, 2784–2817. [Google Scholar] [CrossRef]
- Gu, J.; Wang, Z.; Kuen, J.; Ma, L.; Shahroudy, A.; Shuai, B.; Liu, T.; Wang, X.; Wang, G.; Cai, J.; et al. Recent advances in convolutional neural networks. Pattern Recognit. 2018, 77, 354–377. [Google Scholar] [CrossRef]
- Adeli, S.; Salehi, B.; Mahdianpari, M.; Quackenbush, L.J.; Brisco, B.; Tamiminia, H.; Shaw, S. Wetland Monitoring Using SAR Data: A Meta-Analysis and Comprehensive Review. Remote Sens. 2020, 12, 2190. [Google Scholar] [CrossRef]
- Shen, X.; Zhang, Z.; Zhai, C.; Li, R. A Meta-Analysis of the Overall Accuracy of Extent and Species of the Coastal Mangroves. J. Peking Univ. 2022, 58, 135–146. [Google Scholar] [CrossRef]
- Mahdianpari, M.; Granger, J.E.; Mohammadimanesh, F.; Salehi, B.; Brisco, B.; Homayouni, S.; Gill, E.; Huberty, B.; Lang, M. Meta-Analysis of Wetland Classification Using Remote Sensing: A Systematic Review of a 40-Year Trend in North America. Remote Sens. 2020, 12, 1882. [Google Scholar] [CrossRef]
- Zolkos, S.; Goetz, S.; Dubayah, R. A meta-analysis of terrestrial aboveground biomass estimation using lidar remote sensing. Remote Sens. Environ. 2013, 128, 289–298. [Google Scholar] [CrossRef]
- Pham, T.D.; Yokoya, N.; Bui, D.T.; Yoshino, K.; Friess, D.A. Remote Sensing Approaches for Monitoring Mangrove Species, Structure, and Biomass: Opportunities and Challenges. Remote Sens. 2019, 11, 230. [Google Scholar] [CrossRef]
- Vo, T.Q.; Kuenzer, C.; Oppelt, N. How remote sensing supports mangrove ecosystem service valuation: A case study in Ca Mau province, Vietnam. Ecosyst. Serv. 2015, 14, 67–75. [Google Scholar] [CrossRef]
- Gliner, J.A.; Morgan, G.A.; Harmon, R.J. Meta-Analysis: Formulation and Interpretation. J. Am. Acad. Child Adolesc. Psychiatry 2003, 42, 1376–1379. [Google Scholar] [CrossRef]
- Mengist, W.; Soromessa, T.; Legese, G. Method for conducting systematic literature review and meta-analysis for environmental science research. Methodsx 2020, 7, 100777. [Google Scholar] [CrossRef]
- Hammer, Ø.; Harper, D.A.T.; Ryan, P.D. PAST: Paleontological Statistics software package for education and data analysis. Palaeontol. Electron. 2001, 4, 9. Available online: http://palaeo-electronica.org/2001_1/past/issue1_01.htm (accessed on 13 August 2022).
- Liberati, M.; Tetzlaff, J.; Altman, D.G.; PRISMA Group. Preferred reporting items for systematic reviews and meta-analyses: The PRISMA statement. PLoS Med. 2009, 6, e1000097. [Google Scholar] [CrossRef] [PubMed]
- Cabello, K.E.; Germentil, M.Q.; Blanco, A.C.; Macatulad, E.G.; Iii, S.G.S. Post-disaster assessment of mangrove forest recovery in lawaan-balangiga, eastern samar using ndvi time series analysis. ISPRS Ann. Photogramm. Remote Sens. Spat. Inf. Sci. 2021, 3, 243–250. [Google Scholar] [CrossRef]
- Jumawan, J.H.; Macandog, D.M. GIS weighted suitability analysis as decision support tool for mangrove rehabilitation in Oriental Mindoro, Philippines. J. Ecosyst. Sci. Eco-Gov. 2021, 3, 1–13. Available online: https://bit.ly/3Rv4Ow2 (accessed on 14 August 2022).
- Neri, M.P.; Baloloy, A.B.; Blanco, A.C. Limitation Assessment and Workflow Refinement of the Mangrove Vegetation Index (MVI)-Based Mapping Methodology Using Sentinel-2 Imagery; The International Archives of Photogrammetry, Remote Sensing and Spatial Information Sciences: Quezon City, Philippines, 2021; pp. 235–242. [Google Scholar] [CrossRef]
- Nesperos, V.J.; Villanueva, C.M.; Garcia, J.; Gevaña, D. Assessment of blue carbon stock of mangrove vegetation in Infanta, Quezon, Philippines. Ecosyst. Dev. J. 2021, 11, 48–60. Available online: https://bit.ly/3AX5Jye (accessed on 14 August 2022).
- Lachowski, H.M.; Dietrich, D.L.; Umali, R.; Aquino, E.; Basa, V. Landsat assisted forest land-cover assessment of the Philippine Islands. Photogramm. Eng. Remote Sens. 1997, 45, 1387–1391. Available online: https://bit.ly/3Bxb2pH (accessed on 15 August 2022).
- Batadlan, B.D.; Paringit, E.C.; Santillan, J.R.; Caparas, A.S.; Fabila, J.L. Analysis of Background Variations in Computed Spectral Vegetation Indices and Its Implications for Mapping Mangrove Forests Using Satellite Imagery. In Proceedings of the 4th ERDT Conference, Manila, Philippines, 11 September 2009. [Google Scholar] [CrossRef]
- Liu, D.S.; Iverson, L.R.; Brown, S. Rates and patterns of deforestation in the Philippines: Application of geographic information system analysis. For. Ecol. Manag. 1993, 57, 1–16. [Google Scholar] [CrossRef]
- Long, J.; Napton, D.; Giri, C.; Graesser, J. A Mapping and Monitoring Assessment of the Philippines’ Mangrove Forests from 1990 to 2010. J. Coast. Res. 2014, 294, 260–271. [Google Scholar] [CrossRef]
- Paw, J.N.; Diamante, D.A.D.; Robles, N.A.; Chua, T.E.; Quitos, L.N., Jr.; Cargamento, A.G.A. Site Selection for Brackishwater Aquaculture Development and Mangrove Reforestation in Lingayen Gulf, Philippines Using Geographic Information Systems. In Proceedings of the Canadian Conference on GIS, Ottawa, ON, Canada, 24–26 March 1992; Available online: https://hdl.handle.net/20.500.12348/3043 (accessed on 15 August 2022).
- Paringit, E.C.; Santillan, J.R. Analysis of multi-temporal remotely sensed images of the Taklong Island National Marine Reserve (TINMAR) to assess impacts of the 2006 Guimaras oil spill. In Proceedings of the 3rd Engineering Research and Development for Technology (ERDT) Conference, Mandaluyong City, Philippines, 11 September 2009; Available online: https://bit.ly/3eAwj8w (accessed on 15 August 2022).
- Bragais, M.A.; Magcale-Macandog, D.B.; Arizapa, J.L.; Manalo, K.M. Vulnerability Assessment Using Lidar Data in Silangsta. Rosa Subwatershed, Philippines; The International Archives of Photogrammetry, Remote Sensing and Spatial Information Sciences: Prague, Czech Republic, 2016; pp. 1397–1401. [Google Scholar] [CrossRef]
- Makinano-Santillan, M.; Bolastig, C.G.; Santillan, J.R. Aboveground biomass estimation of mangroves in Siargao Island, Philippines using Sentinel-1 image. In Proceedings of the 40th Asian Conference on RS (ACRS 2019), Daejeon Convention Center (DCC), Daejeon, Korea, 14–18 October 2019; Available online: https://bit.ly/3RtnHPV (accessed on 14 August 2022).
- Argamosa, R.J.L.; Blanco, A.; Baloloy, A.B.; Candido, C.G.; Dumalag, J.B.L.C.; Dimapilis, L.L.C.; Paringit, E. Modelling above ground biomass of mangrove forest using sentinel-1 imagery. ISPRS Ann. Photogramm. Remote Sens. Spat. Inf. Sci. 2018, 4, 13–20. [Google Scholar] [CrossRef]
- Baloloy, A.B.; Blanco, A.C.; Ana, R.R.C.S.; Nadaoka, K. Development and application of a new mangrove vegetation index (MVI) for rapid and accurate mangrove mapping. ISPRS J. Photogramm. Remote Sens. 2020, 166, 95–117. [Google Scholar] [CrossRef]
- Baloloy, A.B.; Blanco, A.C.; Sharma, S.; Nadaoka, K. Development of a Rapid Mangrove Zonation Mapping Workflow Using Sentinel 2-Derived Indices and Biophysical Dataset. Front. Remote Sens. 2021, 2, 730238. [Google Scholar] [CrossRef]
- Buitre, M.; Zhang, H.; Lin, H. The Mangrove Forests Change and Impacts from Tropical Cyclones in the Philippines Using Time Series Satellite Imagery. Remote Sens. 2019, 11, 688. [Google Scholar] [CrossRef]
- Madanguit, C.J.G.; Oñez, J.P.L.; Tan, H.G.; Villanueva, M.D.; Ordaneza, J.E.; Aurelio, R.M.; Novero, A.U. Application of support vector machine (SVM) and quick unbiased efficient statistical tree (QUEST) algorithms on mangrove and agri-cultural resource mapping using LiDAR datasets. Int. J. Appl. Environ. Sci. 2017, 12, 1821–1830. Available online: https://bit.ly/3et4A9Y (accessed on 14 August 2022).
- Monzon, A.K.; Reyes, S.R.; Veridiano, R.K.; Tumaneng, R.; De Alban, J.D. Synergy of Optical and Sar Data for Mapping and Monitoring Mangroves; The International Archives of Photogrammetry, Remote Sensing and Spatial Information Sciences: Prague, Czech Republic, 2016; pp. 259–266. [Google Scholar] [CrossRef]
- Songcuan, A.J.; Baloloy, A.B.; Blanco, A.C.; David, L.T. Mangrove Forest Extent Mapping in Siargao Island, Surigao Del Norte, Philippines Using Support Vector Machine (SMM) Classification. In Proceedings of the 36th Asian Conference on RS (ACRS), Quezon City, Metro Manila, Philippines, 19–23 October 2015; Available online: https://bit.ly/3cYqa5Q (accessed on 13 August 2022).
- Fallarcuna, B.; Perez, G.J. Forest cover dynamics in the Philippines from Landsat-derived global forest cover dataset (2000–2012). J. Philipp. Geosci. Remote Sens. Soc. 2016, 2, 4–17. Available online: https://bit.ly/3qitLij (accessed on 13 August 2022).
- Marshall, A.; Bühne, H.S.T.; Bland, L.; Pettorelli, N. Assessing ecosystem collapse risk in ecosystems dominated by foundation species: The case of fringe mangroves. Ecol. Indic. 2018, 91, 128–137. [Google Scholar] [CrossRef]
- Giri, C.; Ochieng, E.; Tieszen, L.L.; Zhu, Z.; Singh, A.; Loveland, T.; Masek, J.; Duke, N. Status and distribution of mangrove forests of the world using earth observation satellite data. Glob. Ecol. Biogeogr. 2011, 20, 154–159. [Google Scholar] [CrossRef]
- Faelga, R.A.G.; Paringit, E.C.; Perez, G.J.P.; Argamosa, R.J.L.; Ibanez, C.A.G.; Posilero, M.A.V.; Tandoc, F.A.M.; Zaragosa, G.P. Separability and variability of Rhizophoraceae and Avicenniaceae in a natural mangrove forest using point density distribution from LiDAR data. J. Philipp. Geosci. Remote Sens. Soc. 2015, 18–25. Available online: https://bit.ly/3x4NwNU (accessed on 14 August 2022).
- Baloloy, A.B.; Blanco, A.; Candido, C.G.; Argamosa, R.J.L.; Dumalag, J.B.L.C.; Dimapilis, L.L.C.; Paringit, E. Estimation of mangrove forest aboveground biomass using multispectral bands, vegetation indices and biophysical variables derived from optical satellite imageries: Rapideye, planetscope and sentinel-2. ISPRS Ann. Photogramm. Remote Sens. Spat. Inf. Sci. 2018, 4, 29–36. [Google Scholar] [CrossRef]
- Castillo, J.A.A. Assessing and Mapping of Carbon in Biomass and Soil of Mangrove Forest and Competing Land Uses in the Philippines. Ph.D. Thesis, University of Southern Quensland, Queensland, Australia, 2017. Available online: https://eprints.usq.edu.au/34443/ (accessed on 13 August 2022).
- Darmawan, S.; Sari, D.K.; Takeuchi, W.; Wikantika, K.; Hernawati, R. Development of aboveground mangrove forests’ biomass dataset for Southeast Asia based on ALOS-PALSAR 25-m mosaic. J. Appl. Remote Sens. 2019, 13, 044519. [Google Scholar] [CrossRef]
- Francisco, R.R.T.; Blanco, A.C.; Manalili, M.A.G.; Gatdula, N.B.; Songcuan, A.J.G.; Landicho, K.P.C.; Reyes, R.B.; Apura, R.J.A. Mapping of Blue Carbon Ecosystems: Effect of Proximity, Activity Types and Frequency of Visits in the Accuracy of Participatory Maps; The International Archives of Photogrammetry, Remote Sensing and Spatial Information Sciences: Casablanca, Morocco, 2019; pp. 83–88. [Google Scholar] [CrossRef]
- Pillodar, F.O.; Mero, D.C.; Mostrales, D.S.; Astillero, S.G.; Ignacio, M.T.T. Estimation of Aboveground Biomass and Carbon Stock of Bacolod Protected Landscape and Seascape Using LiDAR Data and GIS. Int. J. Adv. Agric. Environ. Eng. 2016, 4, 1. [Google Scholar] [CrossRef]
- Venturillo, R.M. Spatio-temporal mapping, biomass, and carbon stock assessment of mangrove forest in Aborlan, Pa-lawan, Philippines. J. Nature Stud. 2016, 15, 90–103. Available online: https://bit.ly/3qiqi3d (accessed on 13 August 2022).
- Domingo, G.A.; Mallillin, M.M.; Perez, A.M.C.; Claridades, A.R.C.; Tamondong, A.M. 3D Visualization of Mangrove and Aquaculture Conversion in Banate Bay, Iloilo; The International Archives of Photogrammetry, Remote Sensing and Spatial Information Sciences: Kuala Lumpur, Malaysia, 2017; pp. 53–60. [Google Scholar] [CrossRef]
- Domingo, G.A.; Claridades, A.R.C.; Tupas, M.E.A. Unmanned Aerial Vehicle (UAV) Survey-Assisted 3d Mangrove Tree Modeling; The International Archives of Photogrammetry, Remote Sensing and Spatial Information Sciences: Dehradun, India, 2018; pp. 123–127. [Google Scholar] [CrossRef]
- Estacio, I.; Blanco, A. Simulating Species Dominance in Mixed Mangrove Forests Considering Species-Specific Responses to Shading, Salinity, and Inundation Frequency. Adv. Intell. Syst. 2020, 9, 167–183. [Google Scholar] [CrossRef]
- Estacio, I.; Quinton, K.; Macatulad, E.; Salmo, S. A species-specific individual-based Simulation model of mixed mangrove forest stands. In Proceedings of the 9th International Conference on Simulation and Modeling Methodologies, Technologies and Applications (SIMULTECH 2019), Ateneo de Manila, Philippines, 7–9 July 2021. [Google Scholar] [CrossRef]
- Martinez, K.P.; Burgos, D.F.M.; Blanco, A.C.; Iii, S.G.S. Multi-sensor approach to leaf area index estimation using statistical machine learning models: A case on mangrove forests. ISPRS Ann. Photogramm. Remote Sens. Spat. Inf. Sci. 2021, 3, 109–115. [Google Scholar] [CrossRef]
- Graciosa, J.C.A.; Violanda, R.R.; Diola, A.G.; Porpetcho, W.P.; Dy, D.T.; Otadoy, R.E.S. A Context-Based Approach in Mangrove Patches Extraction from LiDAR Data: A Case Study in Pinamungajan, Cebu, Central Philippines. In Proceedings of the Asian Conference on RS (ACRS), Quezon City, Philippines, 19–23 October 2015; Available online: https://bit.ly/3qqs2Hq (accessed on 12 August 2022).
- Jalbuena, R.L.; Peralta, R.V.; Tamondong, A.M. Object-Based Image Analysis for Mangroves Extraction Using LiDAR Datasets and Orthophoto. In Proceedings of the Asian Conference on RS (ACRS), Quezon City, Philippines, 19–23 October 2015; Available online: https://bit.ly/3TU1V9k (accessed on 12 August 2022).
- Castillo, J.A.A.; Apan, A.A.; Maraseni, T.N.; Salmo, S.G., III. Estimation and mapping of above-ground biomass of mangrove forests and their replacement land uses in the Philippines using Sentinel imagery. ISPRS J. Photogramm. Remote Sens. 2017, 134, 70–85. [Google Scholar] [CrossRef]
- Faelga, R.A.G.; Paringit, E.C.; Perez, G.J.P.; Ibanez, C.A.G.; Argamosa, R.A.L.; Posilero, M.A.V.; Zaragosa, G.P.; Tandoc, F.A.M.; Malabanan, M.V. Mangrove Plantation Forest Assessment Using Structural Attributes Derived from Light Detection and Ranging (LIDAR) Data; The International Archives of Photogrammetry, Remote Sensing and Spatial Information Sciences: Prague, Czech Republic, 2016; pp. 617–623. [Google Scholar] [CrossRef]
- Gevana, D.; Camacho, L.; Carandang, A.; Camacho, S.; Im, S. Land use characterization and change detection of a small mangrove area in Banacon Island, Bohol, Philippines using a maximum likelihood classification method. For. Sci. Technol. 2015, 11, 197–205. [Google Scholar] [CrossRef]
- Redondo, A.F.S.; Dagoc, K.M.F.; Ignacio, M.T.T.; Sanchez, R.R.G.; Tampus, A.D. Seagrass mapping and assessment using RS in the Municipality of Kauswagan, Lanao del Norte, Philippines. J. Biodivers. Environ. Sci. 2017, 11, 74–88. Available online: https://bit.ly/3RMz45e (accessed on 13 August 2022).
- Songcuan, A.J.; Baloloy, A.B.; Blanco, A.C.; David, L.T. Mangrove Forest Extent Mapping in Southwestern Luzon Using 2015 Landsat Imagery. In Proceedings of the 36th Asian Conference on RS (ACRS), Quezon City, Philippines, 19–23 October 2015. [Google Scholar] [CrossRef]
- Alon, A.S.; Festijo, E.D.; Juanico, D.E.O. An Object-Based Supervised Nearest Neighbor Method for Extraction of Rhizophora in Mangrove Forest from LiDAR Data and Orthophoto. In Proceedings of the 2019 IEEE 9th International Conference on System Engineering and Technology (ICSET), Shah Alam, Malaysia, 7 October 2019. [Google Scholar] [CrossRef]
- Alon, A.S.; Festijo, E.D.; Casuat, C.D. Tree Extraction of Airborne LiDAR Data Based on Coordinates of Deep Learning Object Detection from Orthophoto over Complex Mangrove Forest. Int. J. Emerg. Trends Eng. Res. 2020, 8, 2107–2111. [Google Scholar] [CrossRef]
- Cabili, J.R.C.; Torres, M.A.; Ignacio, M.T.T.; Dagoc, K.M.F.; Guihawan, J.Q. Object-Based Image Analysis for Extraction of Mangrove Forests in Rehabilitated Areas of Bacolod, Lanao Del Norte, Philippines using Lidar Data and GIS. J. Appl. Sci. Res. 2018, 14, 6–10. [Google Scholar] [CrossRef]
- Campomanes, F.; Pada, A.; Silapan, J. Mangrove Classification Using Support Vector Machines and Random Forest Algorithm: A Comparative Study. In Proceedings of the 6th International Conference on Geographic Object-Based Image Analysis, GEOBIA 2016, Enschede, Netherlands, 14–16 September 2016. [Google Scholar] [CrossRef]
- Cubillas, J.E.; Japitana, M. The Application of Support Vector Machine (SVM) Using Cielab Color Model, Color Intensity and Color Constancy as Features for Ortho Image Classification of Benthic Habitats in Hinatuan, Surigao Del Sur, Philippines; The International Archives of Photogrammetry, Remote Sensing and Spatial Information Sciences: Prague, Czech Republic, 2016; pp. 189–194. [Google Scholar] [CrossRef]
- David, L.C.; Ballado, A.J. Application of Object-Based Image Analysis and Support Vector Machine in Mapping Mangrove Forest Using LiDAR and Orthophoto: A Case Study in Calatagan, Batangas. In Proceedings of the 36th Asian Conference on RS (ACRS), Quezon City, Philippines, 19–23 October 2015. [Google Scholar] [CrossRef]
- David, L.C.G.; Ballado, A.H. Mapping Mangrove Forest from LiDAR Data Using Object-Based Image Analysis and Support Vector Machine: The Case of Calatagan, Batangas. In Proceedings of the 2015 International Conference on Humanoid, Nanotechnology, Information Technology, Communication and Control, Environment and Management (HNICEM), Cebu, Philippines, 9–12 December 2015. [Google Scholar] [CrossRef]
- David, L.C.G.; Ballado, A.J. Object-Based Land Use and Land Cover Mapping from LiDAR Data and Orthophoto Application of Decision Tree-Based Data Selection for SVM Classification. In Proceedings of the 2016 IEEE Region 10 Humanitarian Technology Conference (R10-HTC), Dayalbagh, Agra, India, 21–23 December 2016. [Google Scholar] [CrossRef]
- Guihawan, J.Q.; Tabugo, S.R.M.; Amparado, R.F.; Arriesgado, O.I.; Burlat, C.S.; Ignacio, M.T.T. Mapping of Agricultural and Coastal Resources in the Municipality of Bacolod, Lanao del Norte using LiDAR datasets and GIS. In Proceedings of the International Conference on Environment and Forest Conservation, Dapitan City, Philippines, 18–21 November 2018; Available online: https://bit.ly/3qnsYwy (accessed on 13 August 2022).
- Japitana, M.V.; Cubillas, J.E.D. Benthic Habitat Classification and Mapping Using Support Vector Machine Algorithm in Hinatuan, Surigao del Sur, Philippines. 2015. Available online: https://bit.ly/semanticscholar2015 (accessed on 10 August 2022).
- Luna, D.A.; Ocampo, D.V.; Quiñones, S.G.L.; Rivera, E.C.; Sejalbo, C.G.; Zara, P.R.; Hizon, K.B.M.; Reyes, J.A.V.D.; Ticzon, V.S.; Macandog, D.M. Coastal Objects: Mangrove Area Extraction Using Remote Sensing and Aerial LiDAR Data in Roxas, Oriental Mindoro. Environ. Ecol. Res. 2017, 5, 282–288. [Google Scholar] [CrossRef]
- Pada, A.V.; Silapan, J.; Cabanlit, M.A.; Campomanes, F.; Garcia, J.J. Mangrove Forest Cover Extraction of the Coastal Areas of Negros Occidental, Western Visayas, Philippines Using Lidar Data; The International Archives of Photogrammetry, Remote Sensing and Spatial Information Sciences: Prague, Czech Republic, 2016; pp. 73–79. [Google Scholar] [CrossRef]
- Bunting, P.; Rosenqvist, A.; Hilarides, L.; Lucas, R.M.; Thomas, N. Global Mangrove Watch: Updated 2010 Mangrove Forest Extent (v2.5). Remote Sens. 2022, 14, 1034. [Google Scholar] [CrossRef]
- De Alban, J.T.; Monzon, A.V.; Veridiano, R.A.; Rico, E.B.; Pales, J.C.; Tumaneng, R.D. Forest Change Detection and Biomass Estimation using ALOS/PALSAR Data in support of REDD+ Readiness Activities in Palawan, Philippines. K&C Science Report–Phase 3. 2016. Available online: https://bit.ly/3elfcHN (accessed on 12 August 2022).
- Conopio, M.; Baloloy, A.B.; Medina, J.; Blanco, A.C. Spatio-Temporal Mapping and Analysis of Mangrove Extents around Manila Bay Using Landsat Satellite Imagery and Mangrove Vegetation Index (MVI); The International Archives of Photogrammetry, Remote Sensing and Spatial Information Sciences: Quezon City, Philippines, 2021; pp. 103–108. [Google Scholar] [CrossRef]
- Jia, M.; Zhang, Y.; Wang, Z.; Song, K.; Ren, C. Mapping the distribution of mangrove species in the Core Zone of Mai Po Marshes Nature Reserve, Hong Kong, using hyperspectral data and high-resolution data. Int. J. Appl. Earth Obs. Geoinf. 2014, 33, 226–231. [Google Scholar] [CrossRef]
- Kamal, M.; Phinn, S. Hyperspectral Data for Mangrove Species Mapping: A Comparison of Pixel-Based and Object-Based Approach. Remote Sens. 2011, 3, 2222–2242. [Google Scholar] [CrossRef]
- Kamal, M.; Phinn, S.; Johansen, K. Object-Based Approach for Multi-Scale Mangrove Composition Mapping Using Multi-Resolution Image Datasets. Remote Sens. 2015, 7, 4753–4783. [Google Scholar] [CrossRef]
- Pagkalinawan, E.H. Mangrove Forest mapping using Landsat 8 images. In State of the Mangrove Summit: Northwestern Luzon Proceedings; Salmo, S.G., III, Favis, A.M.T., Ting, M.N.S., Eds.; Ateneo de Manila University: Quezon City, Philippines, 2015; Volume 7, pp. 60–64. [Google Scholar] [CrossRef]
- Quevedo, J.M.D.; Uchiyama, Y.; Kohsaka, R. Community perceptions of long-term mangrove cover changes and its drivers from a typhoon-prone province in the Philippines. AMBIO 2021, 51, 972–989. [Google Scholar] [CrossRef]
- Gevaña, D.T.; Camacho, L.D.; Pulhin, J.M. Conserving Mangroves for Their Blue Carbon: Insights and Prospects for Community-Based Mangrove Management in Southeast Asia. Coast. Res. Lib. 2018, 25, 579–588. [Google Scholar] [CrossRef]
- Salmo, S.G., III. Mangrove blue carbon in the Verde Island Passage. In Nature is 30 (Climate Strategy); Conservation International Philippines: Quezon City, Philippines, 2019; ISBN 978-971-94594-3-9. Available online: https://bit.ly/archium26 (accessed on 13 August 2022).
- USAID. BLEADERS [Building Low Emission Alternatives to Develop Economic Resilience and Sustainability]. Assessment of Carbon Sequestration Potential of Mangrove Forests in the Talon-talon and Mampang Treevolution Sites of Zamboanga City. United States Agency for International Development (USAID). 2017; pp. 1–57. Available online: https://pdf.usaid.gov/pdf_docs/PA00TC68.pdf (accessed on 14 August 2022).
- Muhd-Ekhzarizal, M.E.; Mohd-Hasmadi, I.; Hamdan, O.; Mohamad-Roslan, M.K.; Noor-Shaila, S. Estimation of aboveground biomass in mangrove forests using vegetation indices from SPOT-5 image. J. Trop. For. Sci. 2018, 30, 224–233. [Google Scholar] [CrossRef]
- Valenzuela, R.B.; Yeo-Chang, Y.; Park, M.S.; Chun, J.-N. Local People’s Participation in Mangrove Restoration Projects and Impacts on Social Capital and Livelihood: A Case Study in the Philippines. Forests 2020, 11, 580. [Google Scholar] [CrossRef]
- Zaragosa, M.J.G.; Aranico, E.C.; Tampus, A.D.; Amparado, R.F., Jr. Carbon stock assessment of three different vegetative covers in Kapatagan, Lanao del Norte, Philippines. AES Int. J. Bioflux Soc. 2016, 8, 205–220. Available online: https://bit.ly/3D77dso (accessed on 13 August 2022).
- Pongon, R.S.; Aranico, E.C.; Dagoc, F.L.S.; Amparado, R.F., Jr. Carbon stock assessment of bamboo plantations in Northern Mindanao, Philippines. J. Biodivers. Environ. Sci. 2016, 9, 97–112. Available online: https://bit.ly/3QsCVmG (accessed on 12 August 2022).
- Herold, M.; Johns, T. Linking requirements with capabilities for deforestation monitoring in the context of the UNFCCC-REDD process. Environ. Res. Lett. 2007, 2, 045025. [Google Scholar] [CrossRef]
- Blanco, A.; Tamondong, A.M.; Perez, A.M.C.; Ang, M.R.C.O.; Paringit, E. The Phillidar 2 Program: National RESOURCE inventory of the Philippines Using Lidar and Other Remotely Sensed Data; ISPRS The International Archives of the Photogrammetry, Remote Sensing and Spatial Information Sciences: Berlin, Germany, 2015; pp. 1123–1127. [Google Scholar] [CrossRef]
- Gao, J. A comparative study on spatial and spectral resolutions of satellite data in mapping mangrove forests. Int. J. Remote Sens. 1999, 20, 2823–2833. [Google Scholar] [CrossRef]
- Green, E.P.; Clark, C.D.; Mumby, P.J.; Edwards, A.J.; Ellis, A.C. Remote sensing techniques for mangrove mapping. Int. J. Remote Sens. 1998, 19, 935–956. [Google Scholar] [CrossRef]
- Wessel, M.; Brandmeier, M.; Tiede, D. Evaluation of Different Machine Learning Algorithms for Scalable Classification of Tree Types and Tree Species Based on Sentinel-2 Data. Remote Sens. 2018, 10, 1419. [Google Scholar] [CrossRef]
- Hościło, A.; Lewandowska, A. Mapping Forest Type and Tree Species on a Regional Scale Using Multi-Temporal Sentinel-2 Data. Remote Sens. 2019, 11, 929. [Google Scholar] [CrossRef]
- Zeng, L.; Wardlow, B.D.; Xiang, D.; Hu, S.; Li, D. A review of vegetation phenological metrics extraction using time-series, multispectral satellite data. Remote Sens. Environ. 2020, 237, 111511. [Google Scholar] [CrossRef]
- Deng, W.; Zhang, X.; Luo, J.; Peng, Y. South China Sea Environment Monitoring Using Remote Sensing Techniques. J. Coast. Res. 2020, 95, 29–33. [Google Scholar] [CrossRef]
- Connolly, R.M.; Connolly, F.N.; Hayes, M.A. Oil spill from the Era: Mangroves taking eons to recover. Mar. Pollut. Bull. 2020, 153, 110965. [Google Scholar] [CrossRef]
- Denison, S.; Forster, P.M.; Smith, C.J. Guidance on emissions metrics for nationally determined contributions under the Paris Agreement. Environ. Res. Lett. 2019, 14, 124002. [Google Scholar] [CrossRef]
- Gu, X.; Zhao, H.; Peng, C.; Guo, X.; Lin, Q.; Yang, Q.; Chen, L. The mangrove blue carbon sink potential: Evidence from three net primary production assessment methods. For. Ecol. Manag. 2022, 504, 119848. [Google Scholar] [CrossRef]
- Jennerjahn, T.C. Relevance and magnitude of ‘Blue Carbon’ storage in mangrove sediments: Carbon accumulation rates vs. stocks, sources vs. sinks. Estuar. Coast. Shelf Sci. 2020, 247, 107027. [Google Scholar] [CrossRef]
- Jia, P.; Huang, W.; Zhang, Z.; Cheng, J.; Xiao, Y. The Carbon Sink of Mangrove Ecological Restoration between 1988–2020 in Qinglan Bay, Hainan Island, China. Forests 2022, 13, 1547. [Google Scholar] [CrossRef]
- Huang, K.; Yang, G.; Yuan, Y.; Sun, W.; Meng, X.; Ge, Y. Optical and SAR images Combined Mangrove Index based on multi-feature fusion. Sci. Remote Sens. 2022, 5, 100040. [Google Scholar] [CrossRef]
- Maurya, K.; Mahajan, S.; Chaube, N. Remote sensing techniques: Mapping and monitoring of mangrove ecosystem—A review. Complex Intell. Syst. 2021, 7, 2797–2818. [Google Scholar] [CrossRef]


| Number | Attribute | Description |
|---|---|---|
| 1 | Title | — |
| 2 | Author(s) | — |
| 3 | Year | — |
| 4 | Keywords | — |
| 5 | Publisher | Journal Name |
| 6 | Study Area | Provinces |
| 7 | Spatial Resolution | Meters |
| 8 | Frequency 1 | RGB bands, NIR, SWIR1, SWIR2, etc. |
| 9 | Sensor | RS sensors |
| 10 | Classifier 1 | SVM, KNN, MLC, etc. |
| 11 | Objective | Extent mapping, AGB, CS, etc. |
| 12 | Performance | Percentage |
| 13 | Funding Agencies | — |
| Year | Journal/Conference |
|---|---|
| 1979 | Photogrammetric Engineering and Remote Sensing |
| 1992 | Canadian Conference on Remote Sensing |
| 1993 | Forest Ecology and Management |
| 2009 | ERDT Conference |
| 2011 | Sensors |
| 2014 | Journal on Coastal Research |
| 2015 | Asian Conference on Remote Sensing; School Journal |
| 2016 | HNICEM; ISPRS Annals of Photogrammetry, Remote Sensing and Spatial Information Sciences; Journal of the Philippine Geosciences and Remote Sensing Society; The International Archives of the Photogrammetry, Remote Sensing and Spatial Information Sciences; Journal of Nature Studies |
| 2017 | USQ; ISPRS Annals of Photogrammetry, Remote Sensing and Spatial Information Sciences; Environment and Ecology Research; International Journal of Applied Environmental Science; International Journal of Advances In Agricultural and Environmental Engineering; American Journal of Environment and Climate |
| 2018 | ISPRS Annals of Photogrammetry, Remote Sensing and Spatial Information Sciences; Journal of Applied Sciences Research; Ecological Indicators |
| 2019 | International Conference on Sytems Engineering and Technology; Remote Sensing; ISPRS Annals of Photogrammetry, Remote Sensing and Spatial Information Sciences; Journal of Applied Remote Sensing; SIMULTECH; The International Archives of the Photogrammetry, Remote Sensing and Spatial Information Sciences; ACRS |
| 2020 | International Journal of Emerging Trends in Engineering Research; ISPRS Annals of Photogrammetry, Remote Sensing and Spatial Information Sciences; Publiscience; IEEE |
| 2021 | Frontiers in Remote Sensing; ISPRS Annals of Photogrammetry, Remote Sensing and Spatial Information Sciences; Journal of Ecosystem Science and Eco-Governance; The International Archives of the Photogrammetry, Remote Sensing and Spatial Information Sciences; Ecosystems and Development Journal; Ambio |
| 2022 | Remote Sensing |
| Sensors | Accuracy | Objective | References |
|---|---|---|---|
| ASTER | 75% | EM | [42] |
| Landsat 5 TM | 81% | EM | [75] |
| Landsat 5 TM; Landsat 7 ETM+; MODIS; SPOT-4 | 87–92% | EM | [56] |
| Landsat 7 ETM+; Landsat 5 TM | 96% | EM | [42] |
| Landsat 7 ETM+; Landsat 8 OLI/TIRS | 97% | EM | [16] |
| Landsat 8 OLI/TIRS | 90–95% | EM | [55,57,75,76] |
| LiDAR | 77–99% | EM | [53,71,72,74,77,78,79,80,81,82,83,84,85,86,87,88,89] |
| Sentinel-2 | 95% | EM | [39,51,90] |
| Sentinel-2; Landsat 8 OLI/TIRS | 92% | EM | [50] |
| Landsat 1; Landsat 2; Landsat 7 ETM+; Landsat 5 TM; Landsat 8 OLI/TIRS | 93% | 3DV | [66,67] |
| LiDAR | 99% | AGBCS | [64] |
| ALOS-PALSAR | 82% | AGBCS | [62] |
| Sentinel-1 | 59–78% | AGBCS | [48,49] |
| Sentinel-1; Sentinel-2 | 83% | AGBCS | [73] |
| Sentinel-2; RapidEye; PlanetScope | 92% | AGBCS | [60] |
| SRTM/SAR | 86% | AGBCS | [61] |
| Landsat 5 TM; Landsat 7 ETM+; Landsat 8 OLI/TIRS | 96% | AGBCS | [40] |
| PlanetScope; Sentinel-2 | 68% | AGBCS | [63] |
| ALOS-PALSAR | 89% | CD | [91] |
| Landsat 1; Landsat 2 | 90% | CD | [41] |
| Landsat 5 TM; Landsat 7 ETM+; Landsat 8 OLI/TIRS | 92% | CD | [92] |
| Landsat 8 OLI/TIRS | 60–92% | CD | [32,52] |
| Sentinel-2 | 89% | LAI | [70] |
| ASTER; Worldview-1 | 97% | OSI | [48] |
| Sensors | Algorithm * | Accuracy | References |
|---|---|---|---|
| Landsat 7 ETM+; Landsat 8 OLI/TIRS | ISODATA | 97% | [16] |
| ASTER | Vegetation Indices | 75% | [42] |
| Landsat 7 ETM+; Landsat 5 TM | Decision Trees | 96% | [44] |
| Sentinel-2; Landsat 8 OLI/TIRS | MVI | 92% | [50] |
| Sentinel-2 | ANN; MLC | 95% | [51] |
| XGBoost | 95% | [90] | |
| LiDAR | SVM; QUEST | 97% | [53] |
| SVM | 99% | [87,89] | |
| OBIA; SVM; NN | 91–98% | [70,80] | |
| Context-based algorithm (see Figure 8) | 93% | [71] | |
| MDC | 77% | [74] | |
| OBIA; NN | 99% | [78] | |
| SVM; RF | 98% | [81] | |
| OBIA; SVM | 90–98% | [82,83,84,88] | |
| OBIA | 94% | [86] | |
| Decision Tree; SVM | 89% | [85] | |
| Landsat 8 OLI/TIRS | SVM | 92–95% | [55,77] |
| RF | 92% | [57] | |
| MLC | 90% | [76] | |
| Landsat 5 TM | MLC | 81% | [75] |
| Landsat 8 OLI/TIRS | ISODATA | 82% | [96] |
| Sensors | Algorithm * | Accuracy | References |
|---|---|---|---|
| Sentinel-1 | RF | 78% | [48,49] |
| Sentinel-2; RapidEye; PlanetScope | ANN | 92% | [60] |
| Sentinel-1 SAR; Sentinel-2 | WEKA ML algorithms (see Table 6) | 83–86% | [61,73] |
| ALOS-PALSAR | Rule-based algorithm | 82% | [62] |
| Landsat 5 TM; Landsat 7 ETM+; Landsat 8 OLI/TIRS | SCP | 96% | [40] |
| Algorithm | Classifier Type | Key Description |
|---|---|---|
| ElasticNet | Functions | Coordinate-descent-based regression for elastic-net-related problem |
| GaussianProcesses | Functions | Gaussian processes for regression |
| IsotonicRegression | Functions | Learns an isotonic regression model |
| LeastMedSq | Functions | Least median squared linear regression |
| MultilayerPerceptron | Functions | Backpropagation to classify instances |
| PaceRegression | Functions | Pace regression linear models |
| RBFNetwork | Functions | Normalized Gaussian radial basis function network |
| RBFRegressor | Functions | Supervised radial basis function networks |
| SMOreg | Functions | Support vector machine for regression |
| AlternatingModelTree | Trees | An alternating model tree by minimizing squared error |
| DecisionStump | Trees | Building and using a decision stump |
| RandomForest | Trees | Construction a forest of random trees |
| RandomTree | Trees | Tree construction based on K randomly chosen attributes |
| REPTree | Trees | Fast decision tree learner |
| IBk | Lazy | K-nearest neighbor classifier |
| KStar | Lazy | Instance-based classifier |
| LWL | Lazy | Locally weighted learning |
| Institution | Externally Funded | Internally Funded | Other Funding Source |
|---|---|---|---|
| University of the Philippines Cebu | 2 | ||
| Ateneo de Manila University | 1 | ||
| Caraga State University-Butuan | 3 | 1 | |
| DENR | 1 | ||
| International | 7 | 1 | 1 |
| Mapúa Institute of Technology | 3 | ||
| Mindanao State University-Iligan Institute of Technology | 3 | ||
| Mindanao State University-Marawi City | 1 | ||
| NAMRIA | 1 | ||
| NEDA | 1 | ||
| Philippine Science High School-Western Visayas Campus | 1 | ||
| Technological Institute of the Philippines | 2 | ||
| University of San Carlos-Cebu | 1 | ||
| University of the Philippines Diliman | 19 | 1 | 2 |
| University of the Philippines Los Baños | 2 | ||
| University of the Philippines Mindanao | 1 | ||
| Others | 2 | ||
| Total | 49 | 2 | 6 |
Disclaimer/Publisher’s Note: The statements, opinions and data contained in all publications are solely those of the individual author(s) and contributor(s) and not of MDPI and/or the editor(s). MDPI and/or the editor(s) disclaim responsibility for any injury to people or property resulting from any ideas, methods, instructions or products referred to in the content. |
© 2023 by the authors. Licensee MDPI, Basel, Switzerland. This article is an open access article distributed under the terms and conditions of the Creative Commons Attribution (CC BY) license (https://creativecommons.org/licenses/by/4.0/).
Share and Cite
Pillodar, F.; Suson, P.; Aguilos, M.; Amparado, R., Jr. Mangrove Resource Mapping Using Remote Sensing in the Philippines: A Systematic Review and Meta-Analysis. Forests 2023, 14, 1080. https://doi.org/10.3390/f14061080
Pillodar F, Suson P, Aguilos M, Amparado R Jr. Mangrove Resource Mapping Using Remote Sensing in the Philippines: A Systematic Review and Meta-Analysis. Forests. 2023; 14(6):1080. https://doi.org/10.3390/f14061080
Chicago/Turabian StylePillodar, Fejaycris, Peter Suson, Maricar Aguilos, and Ruben Amparado, Jr. 2023. "Mangrove Resource Mapping Using Remote Sensing in the Philippines: A Systematic Review and Meta-Analysis" Forests 14, no. 6: 1080. https://doi.org/10.3390/f14061080