

Trees Adjust the Shape of Branch Unions to Increase Their Load-Bearing Capacity

Faculty of Resource Management, University of Applied Sciences and Arts, Büsgenweg 1a, 37077 Göttingen, Germany
Forests 2023, 14(5), 1041; https://doi.org/10.3390/f14051041
Submission received: 7 April 2023
/
Revised: 7 May 2023
/
Accepted: 16 May 2023
/
Published: 18 May 2023
(This article belongs to the Special Issue Tree Stability and Tree Risk Analysis)
Abstract
:The likelihood of branch union failure often needs to be assessed in tree risk assessment. Most of the guidance used in practice is based on the shape of these forks, specifically the shape (“U” or “V”), the angle between the branches, the presence of lateral bulges, and the aspect ratio of the branches. This study extends previous studies with a novel approach to the biomechanical analysis of fork shape and contributes results from destructive tests on two important European tree species, using comparatively large trees. Surprisingly, many samples deviated from the expected pattern of constant or decreasing cross-sectional area from the trunk beyond the fork. The results show three mechanisms that counteract the potential weakening at a bifurcation, two of which have not been documented before: an increase in section modulus from the stem base to where the stems part, an increase in section modulus caused by lateral bulging, and an increase in section modulus in the branches caused by an adjusted shape. Neither the shape of the forks nor the amount of included bark had a significant impact on their strength. Like several previous studies, the results of this study caution against the use of simple rules to assess the likelihood of branch union failure. The increasing availability of “digital twins” of urban trees may help us to use these results to assess the shape of branch unions in a quantitative way.
1. Introduction
Many urban trees require periodic inspection by arborists to ensure that there is no unnecessarily high risk to people or property in the vicinity of the tree. For this risk assessment, arborists need guidance that is scientifically validated.
Codominant stems are one feature that frequently causes concern. According to research, codominant unions can be less stable than lateral branch unions. An influential textbook [1] boldly states “with a high probability, a V-shaped crotch will break apart without a suitable crown bracing system”, while [2] claim that V-shaped forks are an “absolute misconstruction” when loaded with tension.
However, in analyzing several thousand trees assessed by tree risk assessors prior to storms, three different studies in North America showed that trees with apparent “weak forks” had actually failed significantly less often than expected [3,4] or that this “defect” had no effect on failure frequency [5]. Additionally, in an evaluation of 3954 failed and non-failed park trees after the 1987 storm in the United Kingdom [6], “weak forks”, including those with decay, had no statistically significant effect on the probability of failure.
The ability to more accurately identify less stable branch unions would allow arborists to reduce failures while avoiding unnecessary cabling, bracing, felling, or preventive reduction pruning.
Two indicators of fork stability have been especially prominent in European arboriculture: the shape of the branch union (“V” or “U”), and the presence of lateral bulges [7,8,9,10]. Depending on the publication, “V”-shaped forks are assumed to build up internal growth pressures, pushing the stems apart; to produce reaction wood that pushes the stems against each other; or to grow in such a way that they lean so much inward that the stems press against each other under their own weight. Prominent wood bulges at the sides of and in the plane with the included bark (often referred to as “ears”) have been considered by some authors to be more susceptible to failure than other morphological forms, while others hypothesize that “V”-shaped forks without bulges are particularly susceptible to failure. However, none of these speculations have ever been successfully scientifically tested.
A recent study on hazel forks showed that bulges do not indicate weak forks [11]. This is in accordance with the advice given by the International Society of Arboriculture (ISA) that “a bulge is caused by new tissue formed as a response to movement. The additional wood that is formed reinforces the wood structure at the weak area” [12].
Other parameters that have been shown to affect the strength of branch unions are the branch angle at the bifurcation, included bark, and the diameter ratio of the parent and lateral branch (Table 1). Only in two species was evidence found that the breaking strength of V-shaped forks was lower than that of U-shaped forks [13]. The same study is also the only one that found an influence of the angle between the branches in a fork, yet only for one of the species studied. Other indicators that have been proposed to aid the inspection are growth depressions on the inner side of codominant stems, either in the form of a dent in the stem or a groove along the inner side of the two stems [14].
Most of these parameters are difficult to assess quantitatively in the short time available per tree for regular risk assessments of larger tree populations. This is especially true since critical branch unions in the crown must be inspected from the ground. Therefore, a better understanding of the shape of bifurcations and the biomechanical consequences might help tree risk assessors to better identify weak forks.
There are at least two constraints on the shape of the bifurcation and the changes in cross-section along the bifurcation: Leonard da Vinci’s rule [23,24,25], also known as the area-preserving rule [26], or as part of the pipe model theory [25,27] and the constant stress hypothesis [28,29,30]. These theories have rarely been tested on urban tree branch unions. Where they have been studied, stems are assumed to be elliptical, and analyses are based on two perpendicular diameters per stem. This may oversimplify the complex shape of stem bifurcations in urban trees.
The objectives of this study were to measure the geometric form of differently shaped bifurcations, to analyze the differences in geometry and determine the biomechanical consequences on the load-bearing capacity. More than 90 codominant stems were loaded to failure. Data were collected to construct detailed 3D models of more than 120 trees and analyzed using finite element analysis.
2. Materials and Methods
2.1. Destructive Pulling Tests
In a series of experiments in 2009, 2018, 2019, and 2021, forks of 94 mature trees were loaded to fracture in closed managed forest stands close to Göttingen (81 Fagus sylvatica L.) and Heidelberg (13 Acer pseudoplatanus L.) in Germany (Table 2). Trunk diameter below the union ranged from 18 cm to 30 cm in Acer and 17 cm to 66 cm in Fagus. After the test, the forks were classified into the following categories based on their shape and the presence of included bark: (1) without included bark, (2) with included bark and no lateral bulges, (3) with included bark and blunt lateral bulges, and (4) with included bark, pointed lateral bulges, and sometimes hidden cracks. These cracks were not visible before the destructive tests, but became apparent only after the experiments because of discolored wood. Bifurcations were also classified according to their form, either as “U”- or “V”-shaped. Classifications of the form and the shape of the bulges were carried out subjectively by a team of arborists; included bark was measured as detailed below.
Forks were pulled apart either directly in the tree or on the ground with TreeQinetic pulling test equipment (Argus Electronic, Rostock, Germany). While the larger branch was secured against a neighboring tree, the smaller branch was pulled with a winch. This resulted either in a failure of the fork itself or, if it was particularly strong, in the fracture of the stem directly above the fork. Therefore, as in other publications, the term failure refers not only to a tearing apart of the fork, but also to the fracture of the stems above the fork. Bending stress (σ) (MPa) was calculated as follows:
where F is the maximum force (kN), L is the distance (m) between the point of application of the force and the branch attachment (measured parallel to the longitudinal axis of the branch), ϕ is the angle between the branch axis and the rope that secured it, and a and b are the inside-bark stem diameters (m) in the direction of force and perpendicular to it in one plane at the level where the pith splits in two.
The influence of the shape, the diameter ratio of the stems, the angle of bifurcation, the presence and form of bulges, and the extent of included bark on the stress at failure was statistically analyzed with ANOVA for categorical factors, and correlation analysis for continuous variables. The area of included bark and the total area of the split surface above the partition of the pith were measured in scaled images with ImageJ 1.53 [31], and included bark was quantified as the ratio of these quantities.
2.2. Morphological Analysis
About 120 scaled 3D models of forks of various species (mainly Fagus sylvatica L., Fraxinus excelsior L., Tilia cordata Mill., Acer pseudoplatanus L., and Acer campestre L.) growing in and around Göttingen, Germany (Table 3), were created photogrammetrically using the software Metashape 1.8 (Agisoft, St. Petersburg, Russia). Roughly half of the trees were growing in peri-urban forests, while the other half were solitary trees growing in the city. A total of 50 to 100 photos were taken with a Canon 70D camera and a Canon EFS 10–22 mm lens (Canon, Uxbridge, Middlesex, UK). Trees were equipped with scale bars with fiducial markers to allow the easy scaling of the models. The section moduli of stem and branch cross-sections were estimated in several planes spaced 10 cm apart from below to above the bifurcation. The analyzed section of the stem extended well below the swollen part and any bulges of the bifurcation. The section moduli of cross-sections in the plane of the bifurcation and perpendicular to it were estimated by finite element analysis. The location of the measurement is given in multiples of the median stem diameter below the bifurcation, with zero at the point of stem division. Above the bifurcation, the sum of the section moduli of the branches was used. To represent the changes across the bifurcations, which vary greatly in size, all section moduli were normalized by the median of the section modulus of the stem below the bifurcation. Bifurcations were generally classified as “U”- or “V”-shaped, but a small sample of clearly subordinate lateral branches was included for comparison. The branch attachment angle was measured in the software CloudCompare 2.12.4 [32] (EDF, Paris, France). The branch aspect ratio was calculated from the medians of branch cross-sectional area.
2.3. Statistical Analysis
Data were analyzed with R 4.2.3 [33]. Wherever possible, statistical analyses have been included in the figures.
3. Results
3.1. Breaking Stress
For both beech (Fagus sylvatica) and sycamore (Acer pseudoplatanus), Yuen’s t-test revealed that “V”- and “U”-shaped forks did not differ significantly in breaking stress (Figure 1a). Of the groups based on the presence of included bark and the presence and shape of lateral bulges, only one group was found to have significantly reduced breaking stress. These were forks with included bark, cracks, and “pointed” lateral bulges that occurred in the beech samples (Figure 1b). The amount of included bark did not correlate significantly with stress at failure in either species (Figure 1c).
3.2. Morphological Analyses
3.2.1. Leonardo’s Rule
The sum of the cross-sectional areas of branches equaled the area of the stem in bifurcations classified as side branches, but was significantly lower in all other types. In both V- and U-shaped forks, the sum of the cross-sections of the branches was 16% ± 1.7% lower than that of the stem below where it was unaffected by bulging. This ratio of cross-sections did not change significantly with changing co-dominance, which was defined using the branch aspect ratio, nor with branch attachment angle.
3.2.2. Section Modulus and Bending Stress
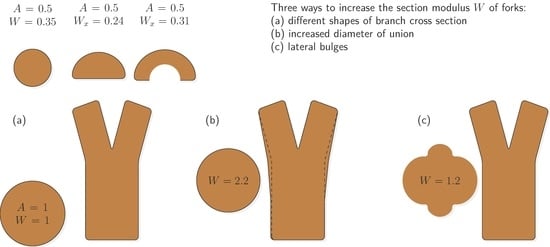
The shapes of the stems were often so complex that they could not be approximated using simple circles or ellipses. Finite element method (FEM) analyses show that these shapes may be mechanical optimizations. For example, the maximum stresses in the marginal fibers that could lead to primary failure under bending load are similar to those of a full circle for cross-sections of the same area when a distinct groove is formed. However, they are increased by more than 50% for a nearly semicircular cross-section (Figure 2).
The sum of the relative section moduli above codominant bifurcations was on average half as high as the section modulus of the stem below, regardless of the type of junction (Figure 3). In subordinate branches, this ratio reached a mean value of 0.71 and was significantly different (p < 0.05) from the U- and V-shaped unions.
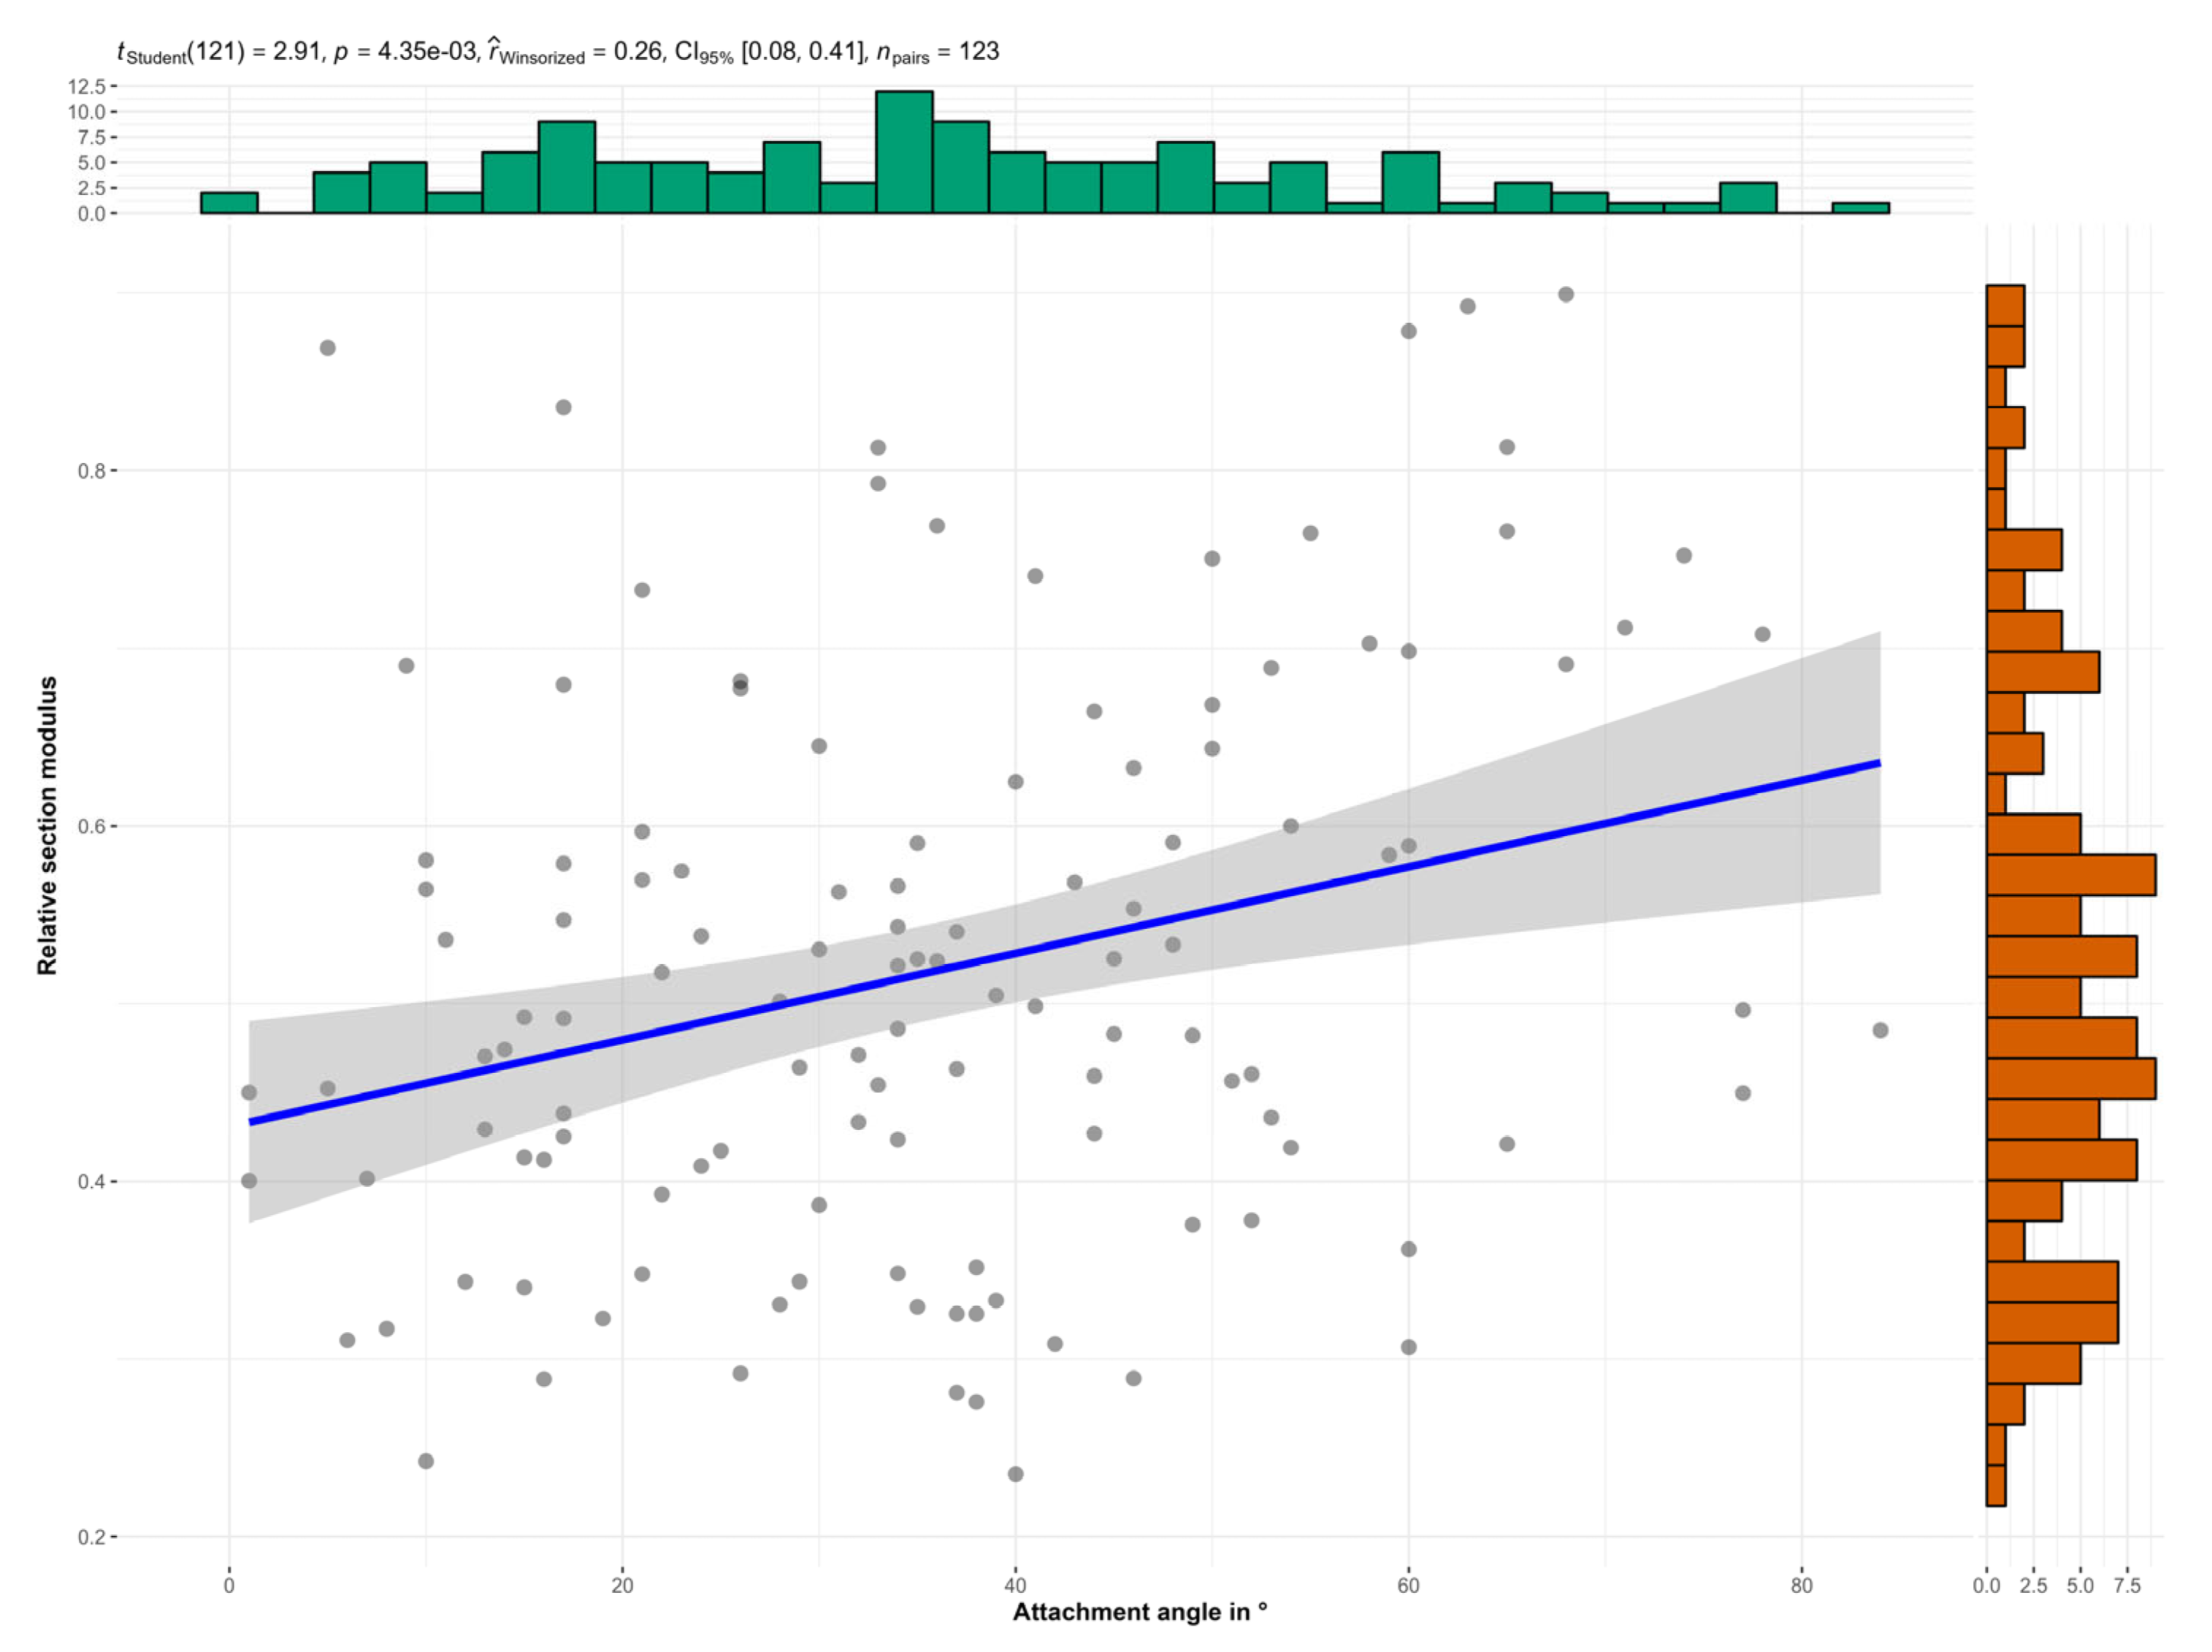
The relative section modulus decreased with the branch aspect ratio and increased with the branch attachment angle (Figure 4 and Figure 5).
Regardless of the form of the bifurcation and the tree species, the section modulus of the stem tended to increase towards the junction for most of the trees (Figure 6).
Thus, two different patterns emerged in relation to the change in section moduli from the trunk below the bifurcation through the bifurcation point to the trunks above. While in one very small group of trees (13 percent of the sample), the section moduli or their sum decreased steadily from the bottom to the top, in the other group there was a pronounced maximum in the region of the bifurcation (Figure 7). For some bifurcations, there was a significant decrease in the section modulus above the bifurcation (Figure 7). There was no fundamental difference between U and V forks and no significant effect of branch attachment angles.
4. Discussion
The likelihood of fork failure must frequently be assessed during tree inspection. Most of the guidance used in practice is based on the shape of these forks, especially on the form (“U” or “V”), the angle between branches, the presence of lateral bulges, and the branch aspect ratio. However, observational studies indicate that the practical predictive ability of these traits is limited at best [3,4,5,6].
Two of the major constraints that govern stem growth are mechanical stability [28,29,30] and hydraulic architecture [23,24,25]. The uniform stress hypothesis assumes a growth pattern where stem diameters decrease towards the crown in proportion to the linearly decreasing bending moment [28] and a tapering mode of α = 1/3 [34]. On the other hand, if a stem divides into two branches, the total conductive cross-sectional area of the two branches should correspond to the conductive cross-sectional area of the stem below the fork (assuming constant hydraulic conductivity) in order to ensure the conduction of water into the crown. This is known as Leonardo’s rule [23]. Since the conductive sapwood area is rarely measured in such studies, the total cross-sectional area is taken as a simplification [35,36,37,38,39]:
where the Leonardo exponent is [37] and d and di are the diameters of the stem and the N daughter branches, respectively.
However, by keeping the cross-sectional area constant across the fork, the load-bearing capacity of the branches will decrease more than the load they must carry: the circular cross-section of a stem with half the area above the fork (but not half the load) has only about one-third of the load-bearing capacity of the stem, and a semi-circular cross-section due to the confined conditions in V-shaped forks has only less than one-fourth (Figure 2). Thus, bifurcations, when following Leonardo’s rule without further adaptation, may be an inherently weak part of the tree, regardless of their shape.
Trees can, however, adapt to strain in the plants’ tissue by thigmomorphogenesis [40,41,42]. This has been shown in bifurcations of hazel [43]. The central thesis of this study is that these biomechanical adaptations can be detected and analyzed in high-resolution 3D models of real forks. Since the availability of “digital twins” of urban trees is continuously increasing, indicators of the likelihood of failure derived from such models could aid in tree risk assessment and make the process more transparent and objective.
This study extends previous studies with a novel approach to the biomechanical analysis of the shape of forks and contributes the results of destructive tests on beech (Fagus sylvatica) and sycamore (Acer pseudoplatanus), two important European tree species, using comparatively large trees.
Surprisingly, many samples deviated from the expected pattern of constant or decreasing cross-sectional area from the stem beyond the bifurcation. Instead, area and section modulus increased acropetally (Figure 7), indicating a mechanical adaptation of the basal part of the union. In fact, Figure 2 and Figure 7 exemplify three mechanisms to counteract the potential weakening in a bifurcation, two of which have not been documented before:
- Increasing section modulus from the stem base up to where the stems part;
- An increase in the section modulus caused by lateral bulges;
- An increase in the section modulus of the branches caused by an optimized shape.
The increase in section modulus by lateral bulges is consistent with results shown for hazel [11]. The formation of grooves, sometimes misleadingly referred to as growth depression [14], could significantly improve the situation of the branches from a biomechanical perspective (Figure 2).
So far, for tree risk assessors, the shape of a union is the only indicator of its risk of failure. A number of indicators have been proposed and tested in destructive tests in recent years (Table 1).
This study found no effect of shape (“U” or “V”) on strength in F. sylvatica and A. pseudoplatanus, unlike a previous study [13], where it had a considerable influence on strength in two of the three species studied. This could be explained by the growth of bulges that often form in V-shaped junctions and have recently been shown to contribute to load-bearing capacity [11] and an increasing section modulus. For technical reasons, the measurement of 3D models of the destructively measured bifurcation failed.
One measure used to describe the codominance of stems is their diameter ratio. In most studies, load-bearing capacity decreased when this ratio approached one [13,16,22,44]. There might be a threshold value of around 0.7–0.8 [22], beyond which load-bearing capacity decreases. The present study found no significant effect of branch aspect ratio in F. sylvatica and A. pseudoplatanus, maybe because the spread in the data was rather low (the branch aspect ratio of the samples ranged from 0.7 to 1).
Although many practitioners suggest that branch attachment angle is a predictor of junction stability, in this study, as in many previous studies [13,15,16,17,22], the angle between two stems had no effect on load-bearing capacity. Its determination during tree assessment would also not be practically feasible.
Included bark, although hard to quantify during tree risk assessment, is another indicator of strength that is often mentioned. This study could confirm a significant effect in one of the species studied. In A. pseudoplatanus, the spread of values might have been too low for significant results. Included bark in itself cannot reduce the strength of a union. The slight reduction in strength due to included bark found in some (but not all) studies could, on the one hand, be an artifact of the mechanical evaluation of fracture tests if the included bark was not taken into account in the choice of the reference plane for the mechanical calculations. It is also possible that the included bark merely acts as an obstacle to the optimal shaping of the stems. This is indicated by the analysis of the section modulus in the 3D models. Included bark would then be another consequence of the confined space in the fork, such as the semicircular, biomechanically unfavorable shape of the cross-sections in the fork, although in some tree species, included bark is also common in U-shaped forks [13].
5. Conclusions
Like several previous studies, the results of this study caution against using simple rules to assess the likelihood of branch union failure. There are several mechanisms that trees use to compensate for increased bending stress. With new technologies [45,46,47,48,49,50], these may become quantifiable to help assess tree risk. Arborists may already include lateral bulges, a girth increasing upwards to the fork, and reinforcing ribs at the branches above the fork in their assessment. V-shaped forks without these traits might be at a higher risk of failure. Further studies could test the effect of distally increasing section moduli in branch unions and the optimized shape of branch cross-sections.
Funding
This research received no external funding.
Institutional Review Board Statement
Not applicable.
Informed Consent Statement
Not applicable.
Data Availability Statement
The data presented in this study are available on request from the corresponding author. The data are not publicly available due to privacy restrictions.
Acknowledgments
The destructive tests were performed by M. Bentler, K. Funke, P. Gerhäuser, F. Gerstner, C.-H. Natrup, M. Oertel, and M. Schuster. The 3D models of most of the beech trees were been prepared by V. Kranz.
Conflicts of Interest
The authors declare no conflict of interest.
References
- Wessolly, L.; Erb, M. Handbuch der Baumstatik und Baumkontrolle; Patzer: Berlin, Germany; Hannover, Germany, 2014; ISBN 978-3-87617-128-9. [Google Scholar]
- Mattheck, C.; Breloer, H. Handbuch der Schadenskunde von Bäumen; Rombach Wissenschaft: Baden-Baden, Germany, 1993; Volume 4. [Google Scholar]
- Koeser, A.K.; Smiley, E.T.; Hauer, R.J.; Kane, B.; Klein, R.W.; Landry, S.M.; Sherwood, M. Can Professionals Gauge Likelihood of Failure?—Insights from Tropical Storm Matthew. Urban For. Urban Green. 2020, 52, 126701. [Google Scholar] [CrossRef]
- Nelson, M.F.; Klein, R.W.; Koeser, A.K.; Landry, S.M.; Kane, B. The Impact of Visual Defects and Neighboring Trees on Wind-Related Tree Failures. Forests 2022, 13, 978. [Google Scholar] [CrossRef]
- Kane, B.; Finn, J.T. Factors Affecting Branch Failures in Open-Grown Trees during a Snowstorm in Massachusetts, USA. SpringerPlus 2014, 3, 720. [Google Scholar] [CrossRef] [PubMed]
- Gibbs, J.N.; Greig, B.J.W. Survey of Parkland Trees after the Great Storm of October 16, 1987. Arboric. J. 1990, 14, 321–347. [Google Scholar] [CrossRef]
- Mattheck, C.; Vorberg, U. The Biomechanics of Tree Fork Design. Bot. Acta 1991, 104, 399–404. [Google Scholar] [CrossRef]
- Wäldchen, M. Die Beurteilung von Zwieseln. AFZ-Der Wald 2007, 61, 406–407. [Google Scholar]
- Wessolly, L.; Erb, M. Manual of Tree Statics and Tree Inspection; Patzer Verlag: Berlin, Germany; Hannover, Germany, 2016; ISBN 978-3-87617-143-2. [Google Scholar]
- Mattheck, C. Aktualisierte Feldanleitung Für Baumkontrollen; Forschungszentrum Karlsruhe GmbH: Karlsruhe, Germany, 2007. [Google Scholar]
- Slater, D. The Mechanical Effects of Bulges Developed around Bark-Included Branch Junctions of Hazel (Corylus avellana L.) and Other Trees. Trees 2021, 35, 513–526. [Google Scholar] [CrossRef]
- Dunster, J.A.; Smiley, E.T.; Matheny, N.; Lilly, S. Tree Risk Assessment Manual; International Society of Arboriculture: Champaign, IL, USA, 2013. [Google Scholar]
- Kane, B.; Farrell, R.; Zedaker, S.M.; Loferski, J.R.; Smith, D.W. Failure Mode and Prediction of the Strength of Branch Attachments. Arboric. Urban For. 2008, 34, 308–316. [Google Scholar] [CrossRef]
- Sinn, T. Handbuch Baumstatik: Schadsymptome und Messverfahren zur Feststellung der Stand- und Bruchsicherheit; Quelle & Meyer Verlag: Wiebelsheim, Germany, 2022; ISBN 978-3-494-01922-2. [Google Scholar]
- Lilly, S.; Sydnor, T. Comparison of Branch Failure during Static Loading of Silver and Norway Maples. J. Arboric. 1995, 21, 302–305. [Google Scholar] [CrossRef]
- Gilman, E.F. Branch-to-Stem Diameter Ratio Affects Strength of Attachment. J. Arboric. 2003, 29, 291–293. [Google Scholar] [CrossRef]
- Pfisterer, J.A.; Spatz, H.C.; Erforth, D.; Heinz, M. Untersuchungen zur Biegebruchfestigkeit von Astgabeln und Reiteraten der Hasel (Corylus avellana L.). In Proceedings of the Deutsche Baumpflegetage, Augsburg, Germany, 22–24 April 2003; pp. 158–235. [Google Scholar]
- Smiley, E.T. Does Included Bark Reduce the Strength of Codominant Stems? J. Arboric. 2003, 29, 104–106. [Google Scholar] [CrossRef]
- Slater, D.; Ennos, R. Interlocking Wood Grain Patterns Provide Improved Wood Strength Properties in Forks of Hazel (Corylus avellana L.). Arboric. J. 2015, 37, 21–32. [Google Scholar] [CrossRef]
- Walkden, E. Modelling the Strength of the Branch Attachments. Arboric. J. 2016, 38, 109–119. [Google Scholar] [CrossRef]
- Rathjens, R.; Sydnor, T.D.; Grabosky, J.; Dahle, G. Structural Pruning in Callery Pear Does Not Change Apparent Branch Union Strength in Seventh Year Static Load Field Testing. AUF 2021, 47, 123–130. [Google Scholar] [CrossRef]
- Dahle, G.A.; Eckenrode, R.T.; Smiley, E.T.; DeVallance, D.; Holásková, I. Can Mechanical Strain and Aspect Ratio Be Used to Determine Codominant Unions in Red Maple without Included Bark. Forests 2022, 13, 1007. [Google Scholar] [CrossRef]
- Zimmermann, M.H. Xylem Structure and the Ascent of Sap; Springer Series in Wood Science; Springer: Berlin/Heidelberg, Germanyy, 1983; ISBN 978-3-662-22629-2. [Google Scholar]
- Tyree, M.T.; Ewers, F.W. The Hydraulic Architecture of Trees and Other Woody Plants. N. Phytol. 1991, 119, 345–360. [Google Scholar] [CrossRef]
- Shinozaki, K.; Yoda, K.; Hozumi, K.; Kira, T. A Quantitative Analysis of Plant Form—The Pipe Model Theorie I. Basic Analyses. Jpn. J. Ecol. 1964, 14, 97–104. [Google Scholar]
- Nikinmaa, E. Analyses of the Growth of Scots Pine; Matching Structure with Function. Acta For. Fenn. 1992, 235, 68p. [Google Scholar] [CrossRef]
- Shinozaki, K.; Yoda, K.; Hozumi, K.; Kira, T. A Quantitative Analysis of Plant Form—The Pipe Model Theorie II. Further Evidence of the Theory and Its Application in Forest Ecology. Jpn. J. Ecol. 1964, 14, 133–139. [Google Scholar]
- Metzger, C. Der Wind als maßgebender Faktor für das Wachsthum der Bäume. Mündener Forstl. Hefte 1893, 3, 35–86. [Google Scholar]
- Ylinen, A. Über die Mechanische Schaftformtheorie der Bäume; Silva Fennica; Technische Hochschule in Finnland: Helsinki, Finnland, 1952; p. 50. [Google Scholar]
- Büsgen, M.; Münch, E. Bau und Leben unserer Waldbäume; Fischer: Jena, Germany, 1927. [Google Scholar]
- Schneider, C.A.; Rasband, W.S.; Eliceiri, K.W. NIH Image to ImageJ: 25 Years of Image Analysis. Nat. Methods 2012, 9, 671–675. [Google Scholar] [CrossRef] [PubMed]
- CloudCompare—Open Source Project. Available online: www.cloudcompare.org (accessed on 15 April 2023).
- R Core Team. R: A Language and Environment for Statistical Computing; R Foundation for Statistical Computing: Vienna, Austria, 2021. [Google Scholar]
- Niklas, K.J.; Spatz, H.-C. Plant Physics; The University of Chicago Press: Chicago, IL, USA; London, UK, 2012; ISBN 978-0-226-58632-8. [Google Scholar]
- Oppelt, A.L.; Kurth, W.; Godbold, D.L. Topology, Scaling Relations and Leonardo’s Rule in Root Systems from African Tree Species. Tree Physiol. 2001, 21, 117–128. [Google Scholar] [CrossRef] [PubMed]
- Sone, K.; Suzuki, A.A.; Miyazawa, S.-I.; Noguchi, K.; Terashima, I. Maintenance Mechanisms of the Pipe Model Relationship and Leonardo Da Vinci’s Rule in the Branching Architecture of Acer Rufinerve Trees. J. Plant Res. 2009, 122, 41–52. [Google Scholar] [CrossRef] [PubMed]
- Eloy, C. Leonardo’s Rule, Self-Similarity, and Wind-Induced Stresses in Trees. Phys. Rev. Lett. 2011, 107, 258101. [Google Scholar] [CrossRef]
- Sotolongo-Costa, O.; Villasana-Mercado, P.; Sánchez-Calderón, L.; Rodríguez-Vargas, I. Statistical Hydraulic Model for the Leonardo’s Rule. arXiv 2020, arXiv:2009.10310. [Google Scholar] [CrossRef]
- Minamino, R.; Tateno, M. Tree Branching: Leonardo Da Vinci’s Rule versus Biomechanical Models. PLoS ONE 2014, 9, e93535. [Google Scholar] [CrossRef]
- Jaffe, M.J.; Forbes, S. Thigmomorphogenesis: The Effect of Mechanical Perturbation on Plants. Plant Growth Regul. 1993, 12, 313–324. [Google Scholar] [CrossRef]
- Tateno, M. Increase in Lodging Safety Factor of Thigmomorphogenically Dwarfed Shoots of Mulberry Tree. Physiol. Plant. 1991, 81, 239–243. [Google Scholar] [CrossRef]
- Telewski, F.W.; Pruyn, M.L. Thigmomorphogenesis: A Dose Response to Flexing in Ulmus Americana Seedlings. Tree Physiol. 1998, 18, 65–68. [Google Scholar] [CrossRef]
- Slater, D.; Ennos, R. An Assessment of the Remodeling of Bifurcations in Hazel (Corylus avellana L.) in Response to Bracing, Drilling, and Splitting. Arboric. Urban For. 2016, 42, 355–370. [Google Scholar] [CrossRef]
- Slater, D.; Ennos, A.R. Determining the Mechanical Properties of Hazel Forks by Testing Their Component Parts. Trees 2013, 27, 1515–1524. [Google Scholar] [CrossRef]
- Arseniou, G.; MacFarlane, D.W.; Calders, K.; Baker, M. Accuracy Differences in Aboveground Woody Biomass Estimation with Terrestrial Laser Scanning for Trees in Urban and Rural Forests and Different Leaf Conditions. Trees 2023, 37, 761–779. [Google Scholar] [CrossRef]
- Guo, Y.; Luka, A.; Wei, Y. Modeling Urban Tree Growth for Digital Twins: Transformation of Point Clouds into Parametric Crown Models. J. Digit. Landsc. Archit. 2022, 30, 213–223. [Google Scholar] [CrossRef]
- Arseniou, G.; MacFarlane, D.W.; Seidel, D. Measuring the Contribution of Leaves to the Structural Complexity of Urban Tree Crowns with Terrestrial Laser Scanning. Remote Sens. 2021, 13, 2773. [Google Scholar] [CrossRef]
- Kükenbrink, D.; Gardi, O.; Morsdorf, F.; Thürig, E.; Schellenberger, A.; Mathys, L. Above-Ground Biomass References for Urban Trees from Terrestrial Laser Scanning Data. Ann. Bot. 2021, 128, 709–724. [Google Scholar] [CrossRef] [PubMed]
- Blackman, R.; Yuan, F. Detecting Long-Term Urban Forest Cover Change and Impacts of Natural Disasters Using High-Resolution Aerial Images and LIDAR Data. Remote Sens. 2020, 12, 1820. [Google Scholar] [CrossRef]
- Li, X.; Chen, W.Y.; Sanesi, G.; Lafortezza, R. Remote Sensing in Urban Forestry: Recent Applications and Future Directions. Remote Sens. 2019, 11, 1144. [Google Scholar] [CrossRef]
Figure 1.
Results of destructive tests. Each panel gives the test statistic (t/F), level of significance (p), effect size (δ, ξ, r), confidence interval of effect size (CI), and sample size (n). (a) Stress at failure did not differ between “U”- and “V”-shaped bifurcations. (b) Only forks with hidden cracks had a significantly reduced stress at failure. (c) In both species, an increasing proportion of included bark (IB) did not significantly reduce stress at failure. Four forks broke in such a way that IB could not be measured accurately. Red dots: trimmed mean. Blue lines: Linear regression. Gray band: 95% confidence interval. The colors of data points indicate categories as given on the abscissa.

Figure 2.
Bending stress in three cross-sections of the same area. (a): circle, (b): half circle, (c): actual branch cross-section of an Acer campestre. Maximum stress in the real cross-section (2.9–3.3 N/mm²) is lower than in the half circle (3.3–4.5 N/mm²) and comparable to a circle (3.1 N/mm²).
Figure 2.
Bending stress in three cross-sections of the same area. (a): circle, (b): half circle, (c): actual branch cross-section of an Acer campestre. Maximum stress in the real cross-section (2.9–3.3 N/mm²) is lower than in the half circle (3.3–4.5 N/mm²) and comparable to a circle (3.1 N/mm²).

Figure 3.
Sum of section moduli of stems above the bifurcation divided by the section modulus of the stem below. S: subordinate branch, U and V: form of codominant bifurcation. There were no significant differences between U- and V-shaped bifurcations. Top: test statistic (F), level of significance (p), effect size (ξ), confidence interval of effect size (CI), and sample size (n). The colors of data points indicate categories as given on the abscissa.

Figure 4.
The relative section modulus significantly decreased with the branch aspect ratio, i.e., the area of the smaller branch divided by the area of the larger branch. Top: test statistic (t), level of significance (p), effect size (coefficient of correlation r), confidence interval of effect size (CI), and sample size (n). Blue line: Linear regression. Gray band: 95% confidence interval.

Figure 5.
The relative section modulus significantly increased with the branch attachment angle, i.e., the angle formed by the two branches. Top: test statistic (t), level of significance (p), effect size (coefficient of correlation r), confidence interval of effect size (CI), and sample size (n). Blue line: Linear regression. Gray band: 95% confidence interval.

Figure 6.
The stem section modulus (normalized by the median section modulus of the stem) significantly increases from the stem base towards the bifurcation (relative distance 0). Top: test statistic (t), level of significance (p), effect size (coefficient of correlation r), confidence interval of effect size (CI), and sample size (n). Blue line: Linear regression. Gray band: 95% confidence interval.

Figure 7.
Contrasting pattern of change in section modulus in F. sylvatica (top) and F. excelsior (bottom) in the stem and branches (a). Green: trunk, red: branches. (b): 3D models, (c): finite element analysis of two cross-sections of the beech. Note the effect of lateral bulges on section modulus in the bifurcation of the beech: maximum bending stress is 13 percent lower in the bulging section of the stem with a V-shaped bifurcation. Blue line: Linear regression. Gray band: 95% confidence interval.


| Species | Shape: U/V | Diameter Ratio | Bifurcation Angle | Included Bark |
|---|---|---|---|---|
| Sycamore maple 1 | - | - | - | - |
| Red Maple | * | * | - | * |
| Silver Maple | - | |||
| Norway maple | - | |||
| European beech 1 | - | - | - | - |
| Hazelnut | * | - | * | |
| Pedunculate oak | * | |||
| Sawtooth oak | * | * | * | * |
| Callery pear | */- | * |
1 this study. * Adverse condition (V-shape, diameter ratio close to unity, tight bifurcation angle, or large amount of included bark) significantly reduced strength, no effect found.
Table 2.
Sample sizes (n) and range of basal diameters (min–max) of bifurcations in destructive pulling tests.
Table 2.
Sample sizes (n) and range of basal diameters (min–max) of bifurcations in destructive pulling tests.
| Species | Shape | n | Basal Diameter, cm |
|---|---|---|---|
| A. pseudoplatanus | U | 5 | 20.1–34.4 |
| V | 8 | 18.1–29.0 | |
| F. sylvatica | U | 22 | 18.1–44.9 |
| V | 58 | 16.6–52.5 |
Table 3.
Sample sizes and range of diameter (min–max) below the bifurcation. Diameters were calculated from circles of equivalent area of the cross-section.
Table 3.
Sample sizes and range of diameter (min–max) below the bifurcation. Diameters were calculated from circles of equivalent area of the cross-section.
| Species | n | Basal Diameter, cm |
|---|---|---|
| Fagus sylvatica | 33 | 12.7–116.2 |
| Acer pseudoplatanus | 25 | 30.9–89.1 |
| Fraxinus excelsior | 21 | 4.9–96.7 |
| Acer campestre | 19 | 19.8–44.4 |
| Tilia cordata | 17 | 29.5–78.8 |
| Prunus avium | 6 | 31.8–63.9 |
| Quercus robur | 2 | 75.2–114.1 |
Disclaimer/Publisher’s Note: The statements, opinions and data contained in all publications are solely those of the individual author(s) and contributor(s) and not of MDPI and/or the editor(s). MDPI and/or the editor(s) disclaim responsibility for any injury to people or property resulting from any ideas, methods, instructions or products referred to in the content. |
© 2023 by the author. Licensee MDPI, Basel, Switzerland. This article is an open access article distributed under the terms and conditions of the Creative Commons Attribution (CC BY) license (https://creativecommons.org/licenses/by/4.0/).
Share and Cite
MDPI and ACS Style
Rust, S. Trees Adjust the Shape of Branch Unions to Increase Their Load-Bearing Capacity. Forests 2023, 14, 1041. https://doi.org/10.3390/f14051041
AMA Style
Rust S. Trees Adjust the Shape of Branch Unions to Increase Their Load-Bearing Capacity. Forests. 2023; 14(5):1041. https://doi.org/10.3390/f14051041
Chicago/Turabian StyleRust, Steffen. 2023. "Trees Adjust the Shape of Branch Unions to Increase Their Load-Bearing Capacity" Forests 14, no. 5: 1041. https://doi.org/10.3390/f14051041
Note that from the first issue of 2016, this journal uses article numbers instead of page numbers. See further details here.