Article

Forest Bioeconomy in Ghana: Understanding the Potential Indicators for Its Sustainable Development

1
Department of Forestry Technologies and Constructions, Faculty of Forestry and Wood Sciences, Czech University of Life Sciences Prague, Kamýcka 129, Prague 6, 165 00 Suchdol, Czech Republic
2
Department of Environmental Management, School of Environmental Sciences, Federal University of Technology, Owerri, P.M.B. 1526, Owerri 460114, Imo State, Nigeria
3
Department of Soil Science “Luiz de Queiroz”, College of Agriculture, University of São Paulo, 11 Pádua Dias Avenue, Piracicaba 13418-900, SP, Brazil
*
Author to whom correspondence should be addressed.
Forests 2023, 14(4), 804; https://doi.org/10.3390/f14040804
Submission received: 21 March 2023 / Revised: 9 April 2023 / Accepted: 11 April 2023 / Published: 14 April 2023
(This article belongs to the Section Forest Ecology and Management)

Abstract

:
This study was aimed at assessing the indicators of a sustainable forest bioeconomy in Ghana for three decades (1990–2020). Sustainable development in a forest bioeconomy is a system geared towards improving people’s socioeconomic and environmental situation through forestry, yet in Ghana, it is neither heard about nor well understood by many people. A good knowledge about the forest bioeconomic system will enhance people to become custodians of the forest ecosystems instead of being destroyers. Field and secondary data were collected and analyzed using IBM SPSS 29.0, CANOCO 5.0, and ArcGIS 10.5. The study showed that larger areas of forest were found in decade 1 (1990–1999) relative to decade 2 (2000–2009) and decade 3 (2010–2020). Forests’ contributions to GDP vary between the forest–vegetation belts and regions, decreasing rapidly from 1990 to 2020. Population growth, agricultural activities, and commodity-driven deforestation ranked highest in the list of the drivers of deforestation. A reduction in deforestation might bring about a reduction in carbon emissions; however, the economic repercussions are negative as the contribution of forest to GDP, income, and employment will fall as trade-offs. Findings from the study will significantly help to bring lasting solutions to deforestation and enhance the sustainable forest bioeconomy. The study has unveiled remote drivers of forest loss that have been long overlooked by previous studies. A sustainable enlightenment campaign and routine informal education of the rural people are highly necessary. This is because some of the peoples’ reasons for deforestation and preference for forest products compared with modern resources seem convincing and logical.

1. Introduction

Forests (whether natural or planted) provide a wealth of services and goods to humans, animals, and the environment, such as carbon storage, biodiversity habitat, water filtration, climate mitigation, timber and non-timber products, wild foods and medicines, tourism, and aesthetic values [1,2]. In recent years, there has been a large increase in scientific publications and studies on the bioeconomy [3,4,5]. Broadly speaking, the bioeconomy is an anchorage for ecosystem services and resource use efficiency [4]. It has also been defined as a diverse component associated with the production of all ecosystem services [5]. Similarly, as a relatively close concept, ‘forest bioeconomy’ could be defined as an activity that utilizes wood and other non-wood products (e.g., fruits and mushrooms) collected from forests for economic and industrial activities. The forest bioeconomy also consists of forest-associated activities including the harnessing, transporting, and processing of forest biomass. The basic principle of the bioeconomy is sustainability, which needs to be continuously monitored for all activities of the bioeconomy. In general terms, sustainability is a systemic approach that integrates economic, environmental, and social sectors [6]. In forestry, the initial understanding of sustainability was mostly based on sustainable timber yield. However, presently, sustainability in forestry has metamorphosed to a more complex concept with a multidimensional approach, including social, ecological, and economic dimensions that are given simultaneous consideration [7]. Further, some authors have broadened the concept to accommodate spiritual and cultural dimensions [8,9].
This paradigm shift in the concept of sustainability is attributed to the rapid decline of the limited natural resources of the Earth, caused by rising over-utilization, which is consequently posing severe threats to human and environmental safety. According to some authors, human exploitation of natural resources has attained diminishing returns, wherein the biophysical limits of the Earth has already been reached [10]. Therefore, a multidimensional approach, such as the sustainable forest bioeconomy, enhances a holistic assessment and management of the forest system by considering all the related dimensions. For instance, the growth or loss of a forest has diverse causes and effects that cut across economic, socio-cultural, and ecological attributes. These attributes combine to serve as indicators of the sustainable forest bioeconomy. Therefore, the sustainable forest bioeconomy is the uncompromising stewardship and use of forests and forest ecosystems in a way, and at a rate, that conserves their regeneration, biodiversity, productivity, and naturalness. It is also the ability to use forests to accomplish, at the present and in the future, essential ecological, economic, and socio-cultural services at local, national, and global levels, without harming other ecosystems [8]. An illustration of the multidimensional approach in a sustainable forest bioeconomy includes the regulation of the economic, socio-cultural, and ecological indicators. For example, a rise in gross domestic product (GDP) (economic) could impact people’s well-being (social) and forest resources (ecological). In other words, deforestation might contribute to GDP, which might improve the economic status of the government and individuals, but this might impact the communities and forest ecosystems, including the forest area, growing stocks, forest net primary productivity (NPP), soil quality, climate, rural people’s livelihood, and other indicators.
Forest loss by deforestation is a common act in sub-Saharan Africa (SSA) and other developing countries [11]. It involves the clearing or thinning of forests by humans for various reasons including farming, grazing, building, mining of mineral and forest resources, and other purposes [12]. Deforestation has continuously grown over the years at high rates, especially in the tropical regions of developing countries [11,13,14,15]. It is one of the largest drivers of greenhouse gas emissions (CO2, NO2, and methane), biodiversity loss, and the constrained ecosystem services. Although deforestation is driven by several interconnected processes and factors [16], agricultural land use expansion, including cropland, pastures, and tree crops, has been the main remote cause of tropical deforestation [17,18,19]. Deforestation is, to a large extent, attributed to the rapid emissions of CO2, which in turn have influenced the atmospheric condition, leading to global environmental changes including climate change. The increase in energy-related emissions of CO2 is driven by many factors that are connected to deforestation such as agriculture, GDP per capita, population growth, infrastructural development, and urbanization [20,21,22,23]. Growth in population brings with it an increase in the quantity of goods and services that need to be provided, thereby increasing deforestation, as well as the production of GHGs [24].
In the case of Africa and other tropical countries in the developing world, most of the GHG emissions are caused by deforestation [25]. This is because in SSA, more than 75% of the population rely on forests and savannahs for their livelihood, and a projected 20% of the daily income of rural and poor households emanates from the forest ecosystems [26]. For instance, a study of forest areas in Ghana from 2004 to 2008 revealed that in economic terms, timber producers’ income ranges from 5000 to 50,000 Ghanaian cedis [27]. Further, the recent increase in population growth and high level of poverty in SSA have caused a high rise in agricultural land extensions. There have been severe encroachments into the forests as well as high dependence on forests and other natural resources for sustenance and income [28]. It has been revealed that about 90% of poor households in SSA obtain energy from firewood, charcoal, and wood fuel, which are products of forests [29]. Furthermore, the high rate of corruption, inequalities in governance, poor policies, and political instabilities are also important indicators for the forest bioeconomy because they contribute intensively to a change in forest areas [30]. However, some individuals are ignorant of the negative impacts of deforestation, and yet even if they know, they have no other means of survival.
In most developed nations, the management of forests have been placed as a high priority in terms of socio-economic and environmental policies, but these are far from being adopted in most developing countries in Africa, such as in Ghana. It is on this background that the idea of this work was conceived.
This study aimed at assessing the indicators of sustainable forest bioeconomy in Ghana between the years 1990 and 2020. The study area, study periods, and topic were of great interest because sustainable development in forest bioeconomy is a system geared towards improving socioeconomic development and the environment through forests, yet in Ghana, it is neither heard of by many nor well understood. Notwithstanding, the country is among the tropical African countries with forest belts that directly or indirectly provide people with livelihoods. It is of interest to clearly identify and thoroughly define the indicators of the sustainable forest bioeconomy, especially among rural people. This will enable them the ability to be re-oriented in terms of the potential of forests for their present and future generations. A good level of knowledge about the forest bioeconomic system will encourage people to become good stewards of the forest ecosystems instead of being destroyers. This study will help people, especially those in the local communities, to realize that if sustainably managed, forests are not just sources of food and wood energy but also serve as carbon sinks for climate change mitigation; as a storehouse for unlimited wealth; as sources of the healthiest nutritional foods; and as the natural purifiers of air, water, and soil. The study will help to close the gap in knowledge about the sustainable forest bioeconomy in Ghana because there has not been any study on this topic in the entire country. The research will help to identify livelihood activities undertaken by the people that should be prioritized to reduce deforestation and, in turn, contribute to the sustainable forest bioeconomy. Findings from this work will serve as a foundation for subsequent studies on this topic. The work will provide support as multipurpose research that will be of benefit to professionals from different fields, including those in forestry and agriculture, environmental economists, planners, ecologists, politicians, technocrats, poor farmers, and many other stakeholders. To achieve the aim of this study, the following research questions were developed: (i) How do the changes in land use/cover influence forest area and growing stock as indicators of a sustainable forest bioeconomy? (ii) What are the main forest species that were important for sustainable forest bioeconomy during the three decades of study? (iii) Does forest contribution to GDP in the five different forest belts and regions of Ghana differ? (iv) What are the key drivers of deforestation, and to what extent do they affect the sustainable forest bioeconomy in Ghana?

2. Materials and Method
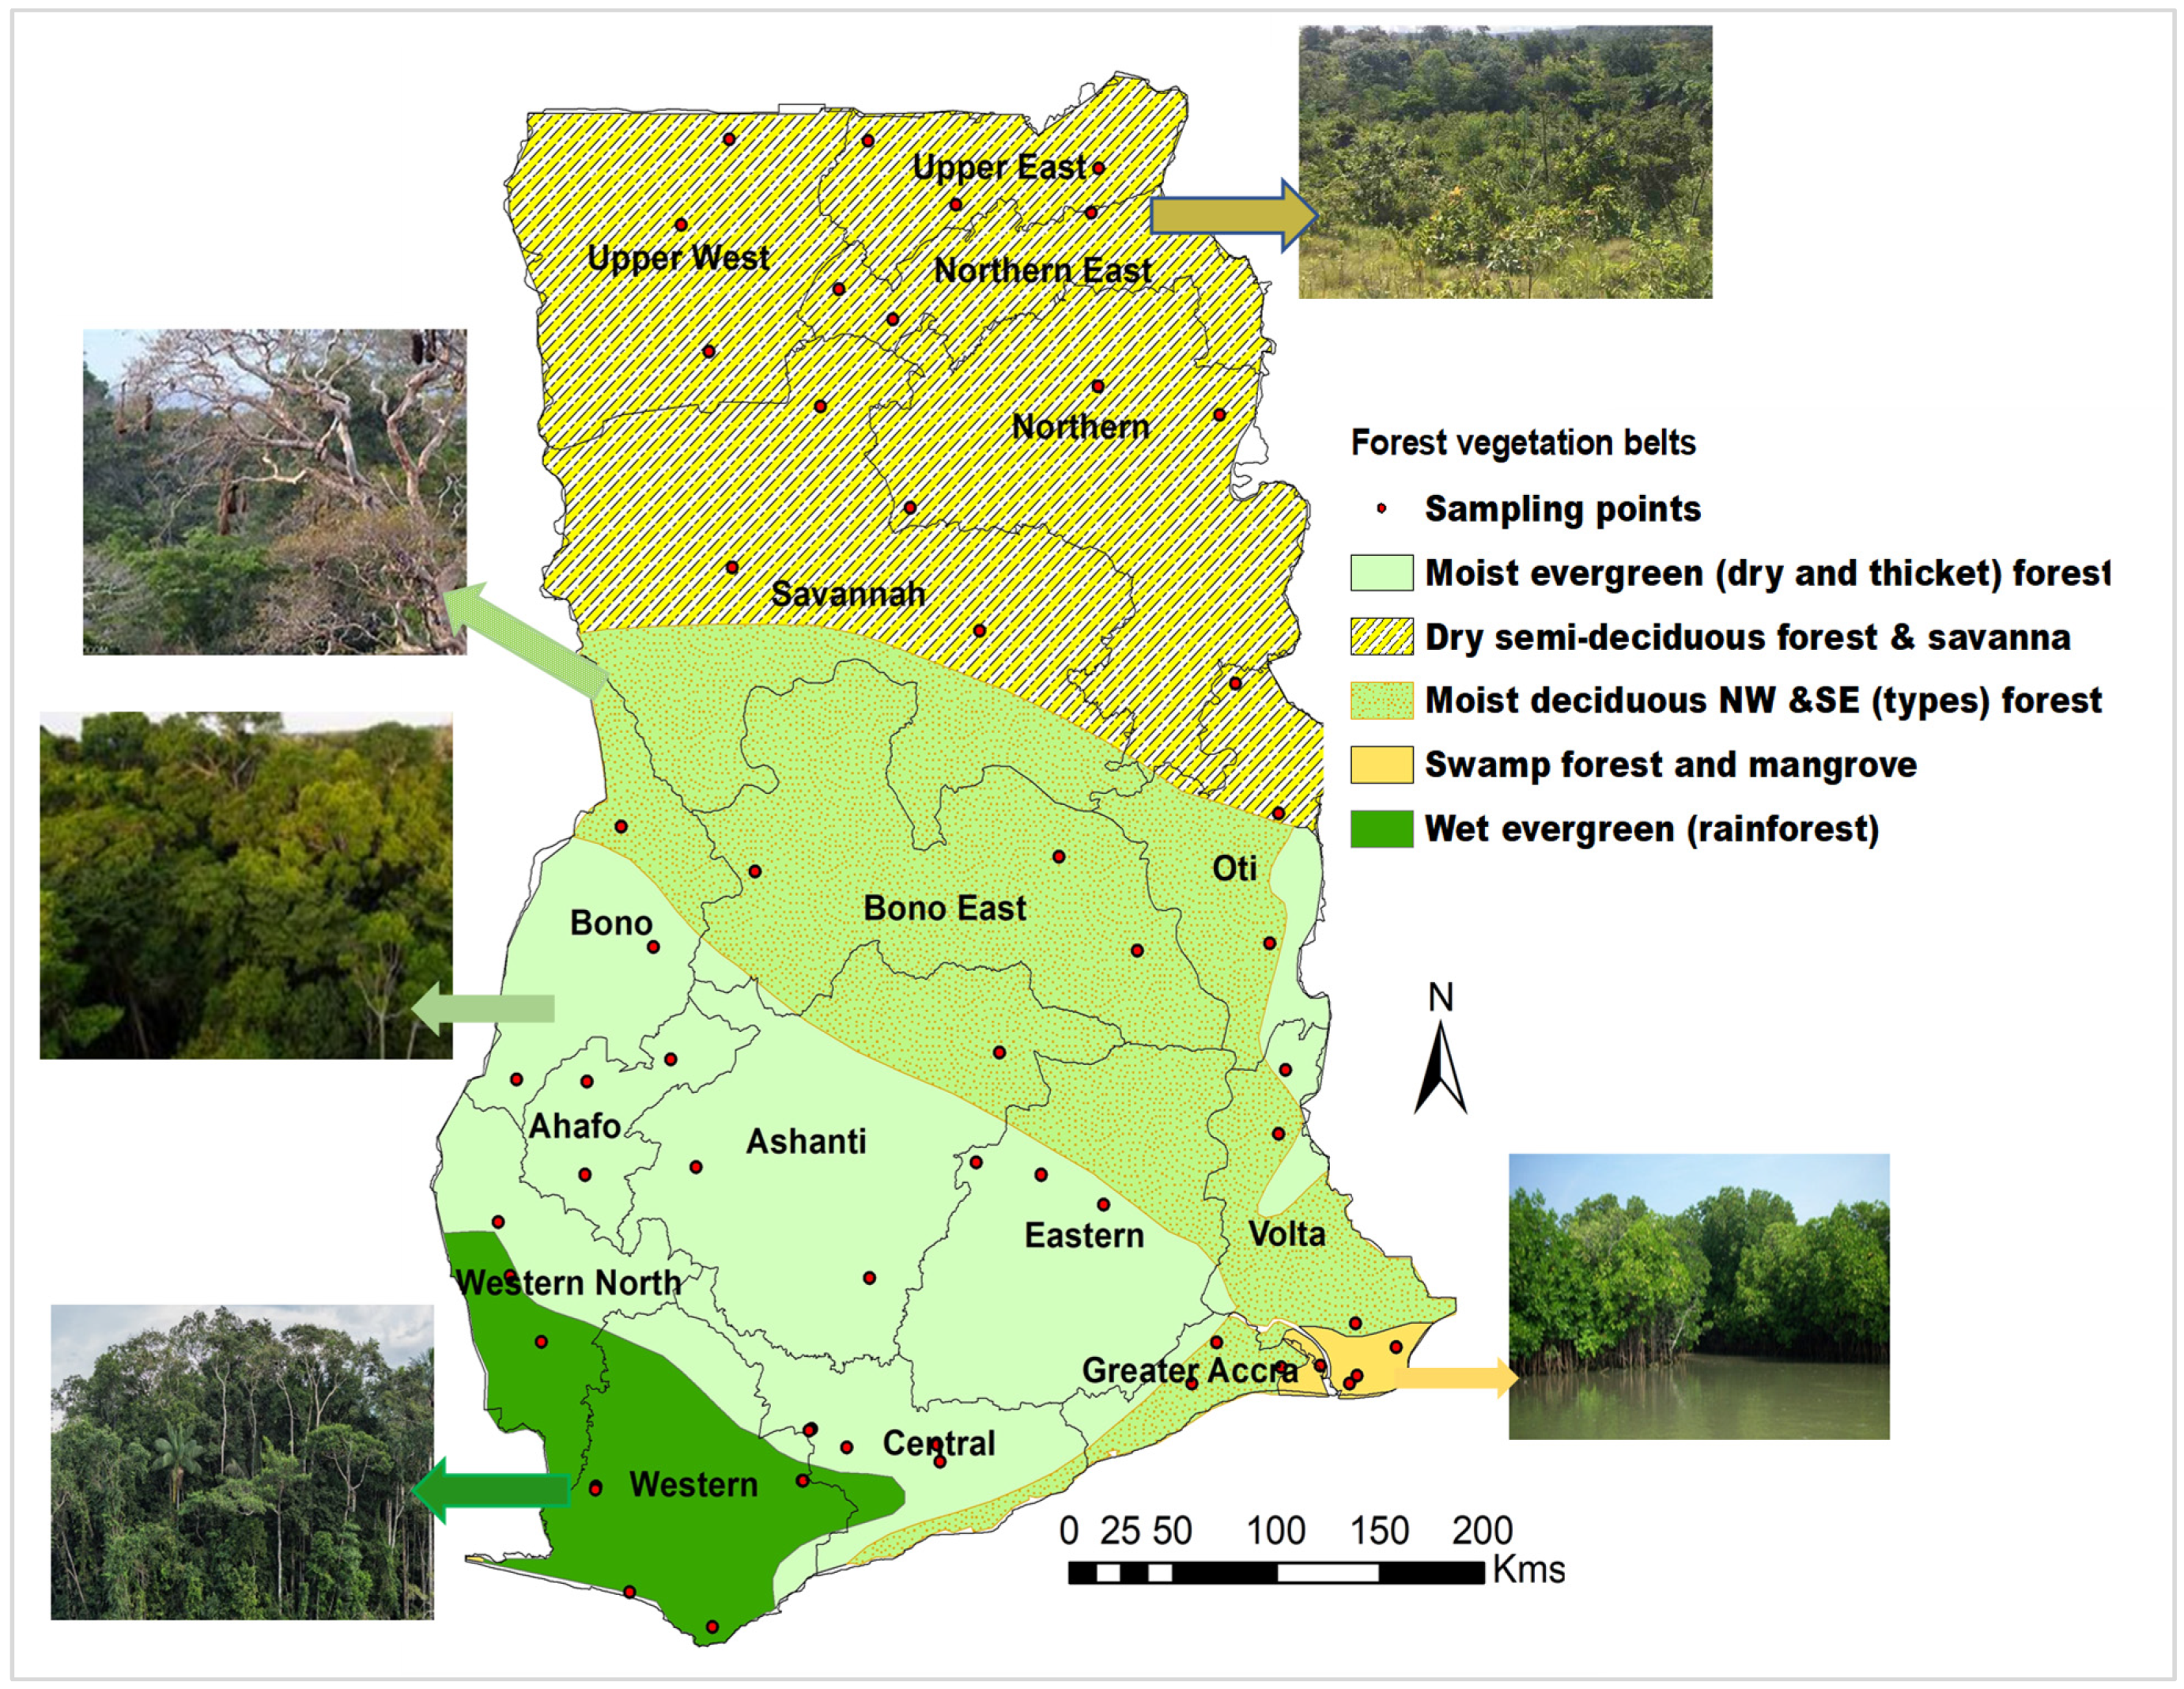
2.1. Study Area

Geopolitically, Ghana is a country in the west of sub-Saharan Africa that lies between latitudes 4°44′ and 11°15′ N and longitudes 3°15′ W and 1°12′ E, with a land area of 238,539 km2 [31]. Ghana is bordered northwards by Burkina Faso, eastwards by Togo, westwards by the Ivory Coast, and southwards by the Atlantic Ocean. The current population of the country is estimated at 30.8 million people, with a population growth rate of about 2.2% per annum [32]. Contemporarily, Ghana has sixteen administrative regions (Figure 1).
Ghana is one of the countries in sub-Saharan Africa (SSA) that has been known for large hectares of forest areas. There are five dominant forest–vegetation belts, namely, wet evergreen rainforest, moist evergreen (dry and thick) forest, moist deciduous (NW and SE types) forest, dry semi-deciduous forest and savannah, and swamp forest and mangrove (Figure 2). The wet evergreen rainforest and the moist evergreen (dry and thick) forests are found in the south and south-west, while the swamp forest and mangrove vegetation are predominantly in the south-east. On the other hand, the moist deciduous (NW and SE types) forest and the dry semi-deciduous forest and savannah are commonly found in the central and northern regions of the country, respectively (Figure 2). The country is among the SSA countries that have a rapid deforestation rate per year. In 2020 alone, the country recorded more than 14,000 hectares of forest loss [33]. Generally, Ghana is characterized by a tropical climate with distinct wet and dry seasons [34,35]. The country experiences temporal and spatial temperature variations depending on seasonal changes and ecological zone. The mean annual temperature is generally high—above 24 °C. Mean annual rainfall is about 736.6 mm, and rainfall generally decreases from the south to the north [36]. Economically, the GDP growth of the country is 3.3%, with an inflation rate of 29.8% and an unemployment rate of 13.4% [37,38]. Currently, over 3.4 million people in Ghana are living in extreme poverty on less than USD 1.90 per day, with the majority of them living in rural areas [38].

2.2. Data Collection and Analyses

Data for this study were collected using both primary and secondary sources. The secondary sources used include materials from peer-reviewed journals; books; book chapters; NGOs and government-established institutions and agencies such as the Ghana Statistical Services and the Ministry of Food and Agriculture, Commerce and Industries; and important international organizations such as the United Nations’ Food and Agricultural Organization (FAO) (Table 1).
Other sources of data for this work were the Forest Resources Assessment (FRA); World Bank; World Income Inequalities Databases (WID); and National Aeronautics and Space Administration (NASA), where some satellite imageries including land use/cover changes were retrieved. In the application of the primary data source, the researchers made use of a field survey by using a hand-held GPS to locate the sampling sites in each forest–vegetation belt (Figure 2; Table A1). By visiting the sites between November 2021 and October 2022, data related to the forest indicators including the common tree species were collected. Past literature (from published articles and government institutional documents), foresters, and plant ecologists were consulted for the identification of the tree species. In addition, the farmers, foresters, and experts in the field were interviewed to obtain valid information about the drivers of deforestation as well as their sociocultural and political perceptions on deforestation (Table 2). However, data on most variables investigated were derived from secondary sources, yet visits to the people and the forest belts helped to collect more relevant data and reconcile the information acquired from the secondary sources.
For the remote sensing and geospatial related data, ArcGIS 10.5 was used in projecting the data to the same coordinate system (WGS_1984_UTM_Zone_30N). Secondly, the data were reclassified to support land use/cover change (LUCC) analyses at a regional scale [39]. The main LUC classes identified during the periods of the investigation were forests, agricultural areas, savannah, mangrove, settlements, open mining areas, wetlands, waterbodies, and others.

2.3. Selection of Indicators for Sustainable Forest Bioeconomy

The indicators for a sustainable forest bioeconomy were selected on the basis of reviewed scientific literature and documents from different sources including (1) Guidelines from the European Forest Institute (EFI), which is an international organization established by the European states [40]; (2) the European Forest Institute on Implementing Criteria and Indicators for Sustainable Forest Management in Europe [41]; (3) a Report on Pan-European Criteria and Indicators for Sustainable Forest Management—Experiences from Liechtenstein [42]; (4) a work on bioeconomy mapping indicators and methodology, a case study of the forest sector in Latvia by Dagnija et al. [43]; and (5) The Contribution of Sustainable Development Goals and Forest-Related Indicators to National Bioeconomy Progress Monitoring [44]. From the above literature and with experience from the study country, the following indicators were chosen as the most indicators for sustainable forest bioeconomy in Ghana: forest area, forest growing stock, forest area loss by deforestation drivers, forest tree cover and loss by drivers of deforestation, forest deadwood volume, forest contribution to GDP, employment in a forest-based sector, and forest soil quality and productivity (such as organic matter content and net primary productivity).

2.4. Selection of Drivers for Deforestation (Forest Loss) Using the Literature, Interviews, and a Questionnaire

In order to acquire professional knowledge regarding the key drivers for deforestation, top publishers in the topic who have papers based in Ghana were consulted. They were interviewed, and a structured questionnaire that included a list of 38 current and potential or future drivers of deforestation was developed from 25 reviewed studies. The drivers were grouped on the basis of decades (Decade 1: 1990–1999, Decade 2: 2000–2009, and Decade 3: 2010–2020). They were also listed in two main categories (direct and indirect drivers). The direct drivers of deforestation were identified as the human and biophysical factors. The human factors were farming, grazing, mining, building/settlements, exploitation for biofuel, timber, and NWFPs, while the biophysical factors were climate change, soil degradation, pests and diseases, and wildfire. On the other hand, the indirect drivers of deforestation were listed as demographic, socio-cultural, economic, and political factors. The clustering of indirect drivers was performed according to Geist and Lambin [16]. The ranking of the drivers followed a Likert scale approach. This scale ranged from 0 to 5, with 0 representing zero influence and 5 representing strong influence. In addition, the interviewees, especially the experts, were provided with the detailed definitions of each proposed/potential drivers. Besides recommending the most drivers, they also placed them in accordance with the decades where they had much impact on the forest. The questionnaire was sent to the top known researchers in this field, especially those who are experts in Ghana. In addition, selected individuals who live and work in Ghana as farmers and/or foresters in the 16 regions were also involved. In sum, 15 out of 20 experts, and 30 out of 40 farmers and foresters, that were contacted returned their completed questionnaires. To improve the reliability of the answers given in the questionnaire, the Delphi approach was applied [45]. The questionnaires were returned to the interviewees together with the synthesized information of the group. By review and adoption of results of the first Delphi round, the variance in the driver ranks were reduced, and consensus was reached. The drivers were reduced to 21 out of 38 on the basis of the derived final rating from the experts, literature, and farmers and foresters. A total of 21 drivers out of 38 had a rating of at least 50% from each of the three categorized (selected) evaluations (experts, literature, and farmers and foresters).

2.5. Geospatial and Statistical Analyses

Data were analyzed using IBM SPSS (version 29.0, Armonk, NY, USA), CANOCO (version 5.0, Wageningen, The Netherlands) [46], and/or ArcGIS (version 10.5, Redlands, CA, USA) [47] software packages. Data were transformed where necessary to meet the requirements and suitable values used for the analyses. From the described sources (Table 1), information on the LUCC, contributions of forest to GDP, and the percentage of the population that exploited forests for different benefits were spatially mapped and presented on the basis of the forest–vegetation belts and regions using the GIS spatial analytical tools. The top 21 drivers of deforestation and the identified common tree species were analyzed using the multivariate ordination of Canoco 5.0 to show their distributions across the decades and forest belts. To determine the interrelationships among the indicators of sustainable forest bioeconomy, the pairwise correlation adjusted to Bonferroni significance levels at 0.01 and 0.05 was used in the IBM SPSS 29.0 (SPSS Inc., Armonk, NY, USA) statistical software.

3. Results and Discussion

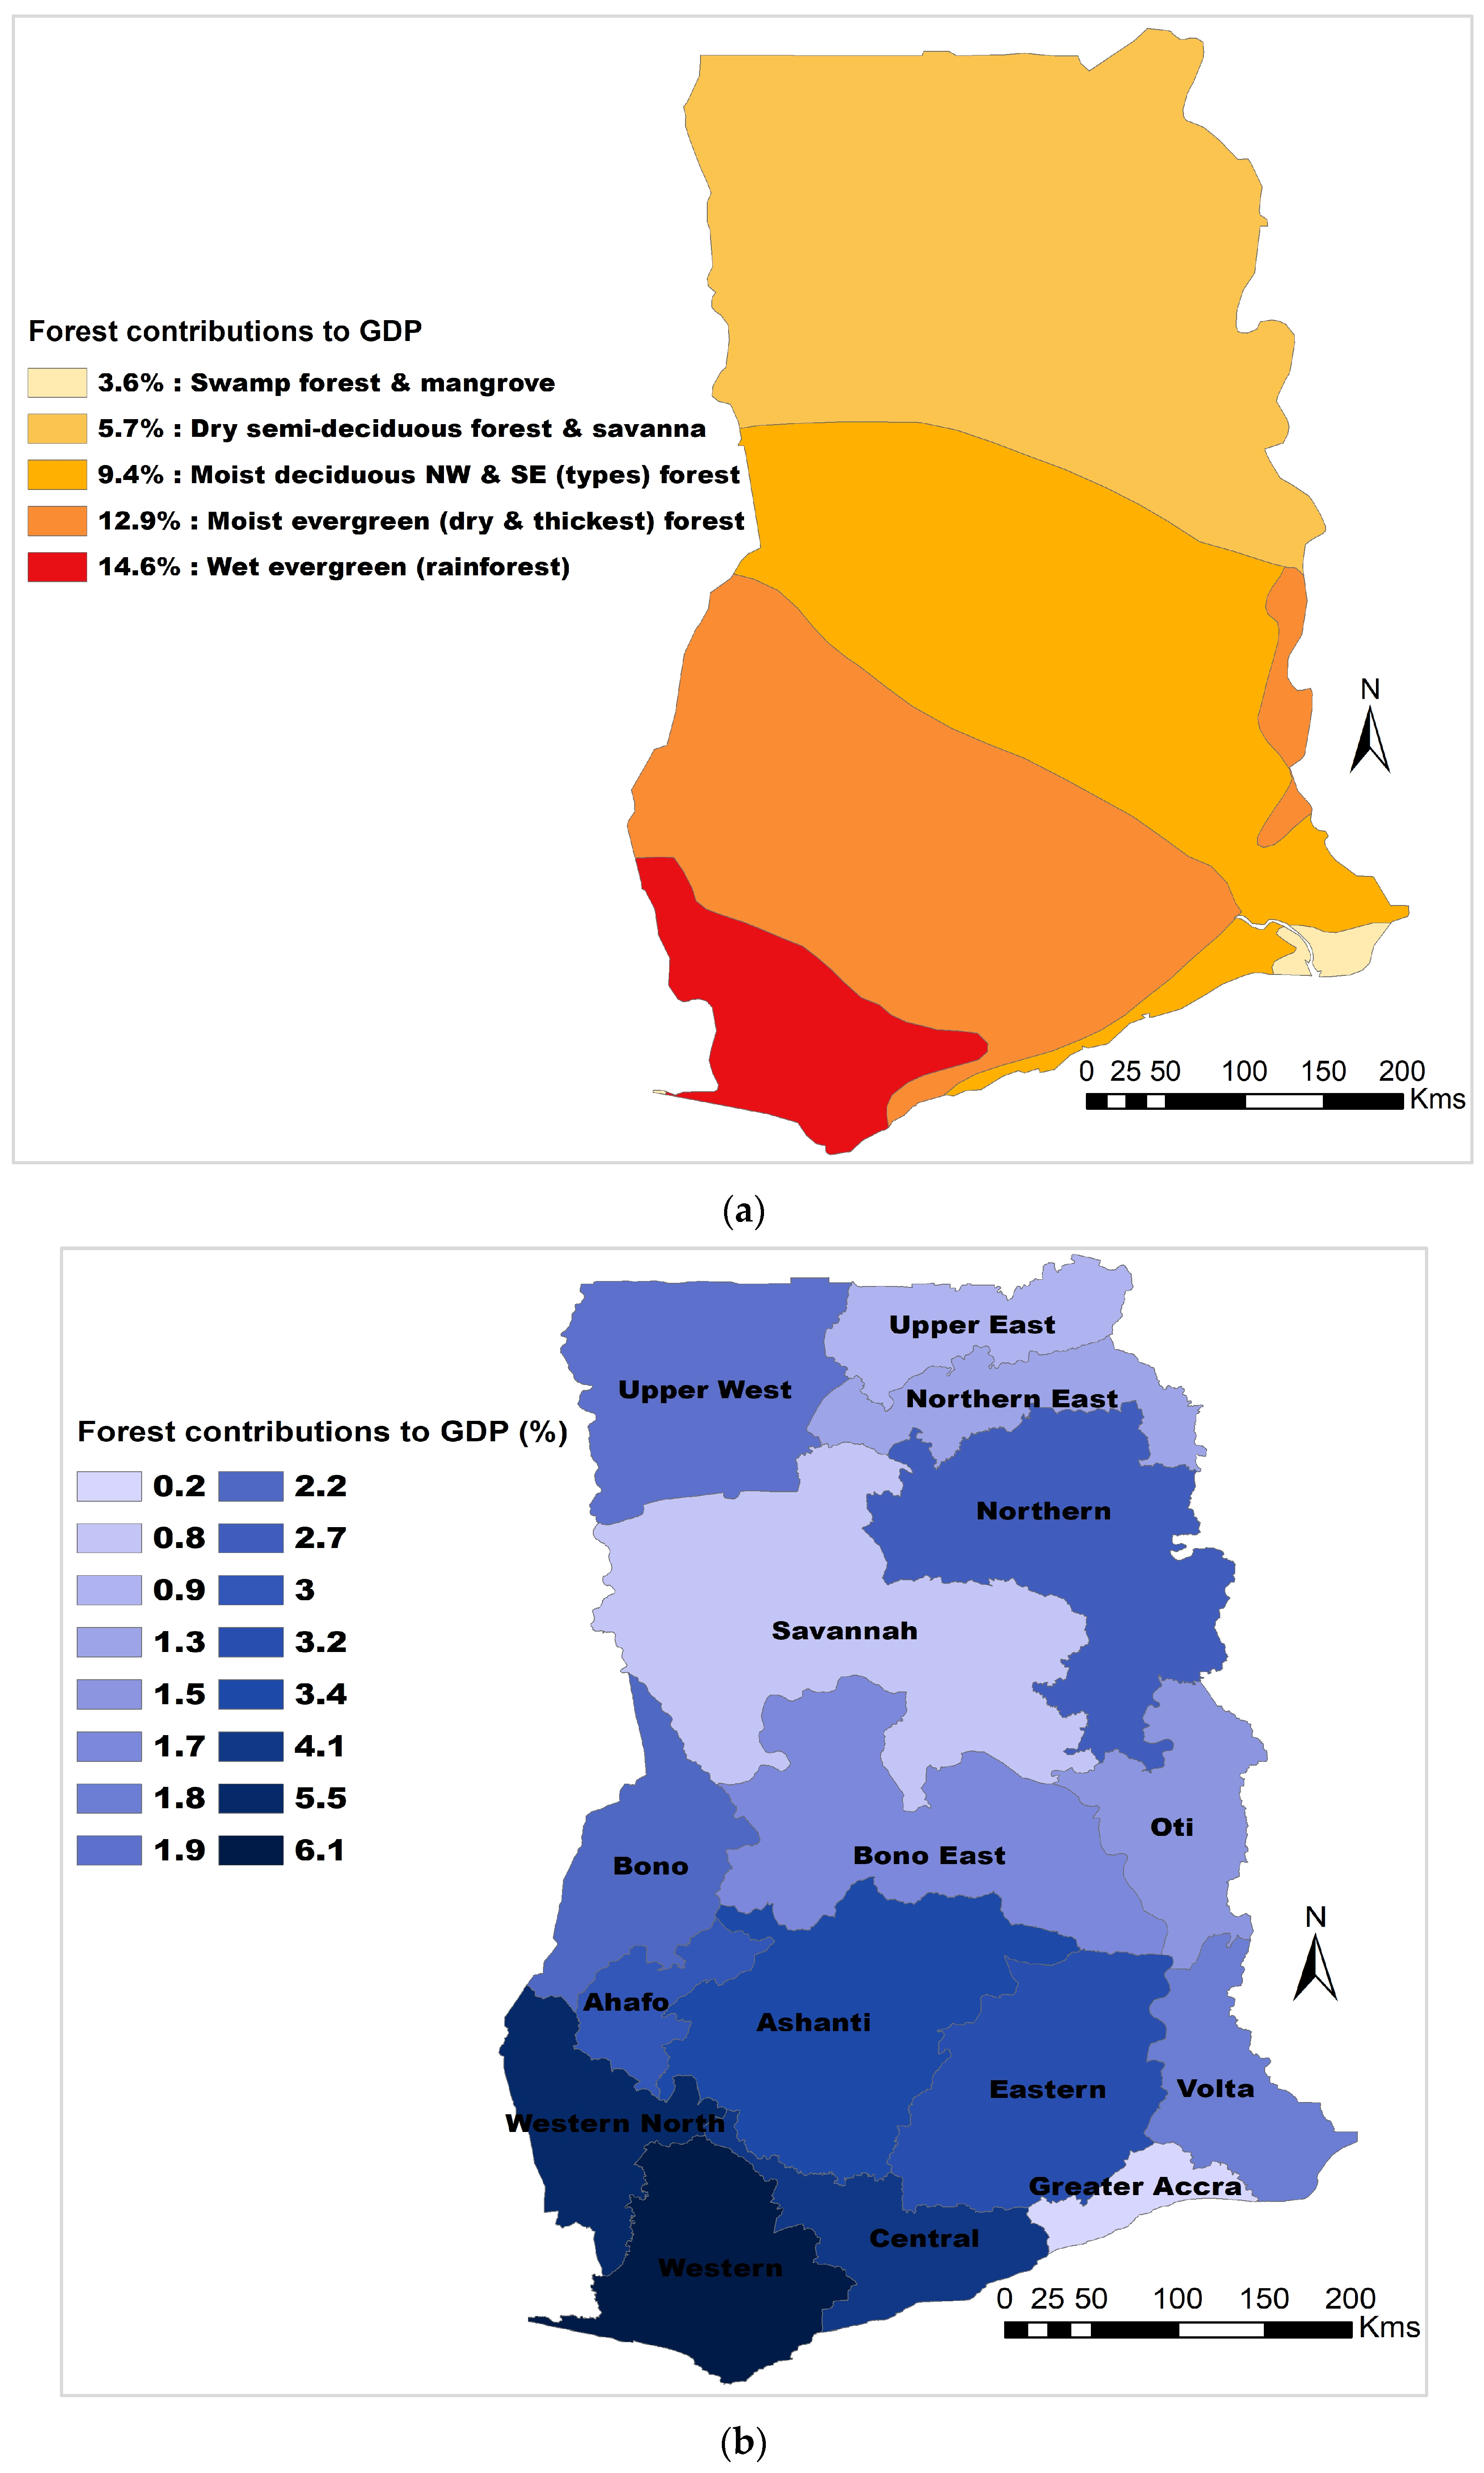
3.1. Forest Contributions to GDP as an Indicator of Sustainable Development in Forest Bioeconomy

Historically, Ghana is among the countries that have been enriching their GDP through forest products, but lately the contributions of forest to GDP has substantially decreased (Figure 3), a scenario that has affected the sustainable forest bioeconomy in the region.
The results showed that during the study periods, forest contributions to GDP vary between the forest–vegetation belts and regions. For example, wet evergreen (rainforest) (14.6%) and moist evergreen (12.9%) forests had the highest contributions to GDP, while dry semi-deciduous forest and savanna (5.7%) and swamp forest and mangrove (3.6%) recorded the lowest contributions to GDP (Figure 3a). In terms of regions, the west and southern regions (such as Western, Western North, Ahafo, Ashanti, Eastern, Central, and Bono) accounted for the regions with the highest forest contributions to the national GDP (Figure 3b). In 1990, forest contribution to GDP was USD 72.35 million, which was higher than the total contributions from 2010 to 2020 summed together (Figure 3c). However, there has been fluctuations in the country’s GDP growth, yet the lowest percentages were recorded in the immediate past decades. In addition to serving as a direct source of export-timbers that enriches Ghana’s economy, the evergreen forests provide shade to livestock, food, and cash crops, thus influencing farmers’ adoption of cocoa agroforestry and integrated crop–livestock–forest systems [48]. The decline in forest contributions to GDP is probably attributed to the decrease in forest area during the period. Many studies have affirmed the impact of forest loss on its contribution to GDP [49,50,51]. In Cameroon, for instance, a study reported that reduction in deforestation was successful in minimizing CO2, but the trade-off effect was a relatively low forestry’s contribution to GDP [49]. In India, some studies have demonstrated that frequent vegetation loss by fires and grazing claimed about 16% of the total forest area, which has influenced species diversity and economic development [52,53]. Consistent with the findings from this work, other studies have reported a huge decline in the forest area in Ghana [54], a situation that has negatively impacted forests’ quota in terms of the nation’s economic growth [54,55]. A study in Japan by Wen et al. [56] analyzed seven bioeconomy sectors with the aim of establishing the leading contributing sectors to GDP. They found that forestry and forest-related products have significant contributions to the country’s GDP.

3.2. Use of Forests for Biofuel and Livelihood: An Indicator of Sustainable Forest Bioeconomy

The study further observed that 8.1% of the population use the rainforest and its resources as sources of income and livelihood, whereas the swamp forest and mangrove had only 1.9% of the population depending on it (Figure 4a). With respect to regions, a higher percentage of the population depends on forests for income, livelihood, and bioenergy in the south as compared to either the east or northern regions of the country (Figure 4b,c). Generally, the findings from this study showed that people, particularly in the rural communities, rely on the forests to eke out their livings. Consistent with these findings, other studies on the global level also revealed that about 1 billion of the world’s poorest people depend on forests for their livelihoods [57,58]. Moreover, in the tropical developing countries, the potential of forest and its associated products in supporting people’s livelihoods, especially among the poor rural dwellers, has also been observed by many researchers [59,60,61,62,63,64]. In Zambia, for instance, forest provided 70% of the country’s energy needs [65]. The study also observed that forest supplies rural people with varieties of wild foods including nutritious vegetables, mushrooms, and edible insects. They revealed that at the national level, forests provide revenue for the government from taxes, fees, royalties, and other charges levied on forest-based activities. The study concluded that although forests have an important poverty mitigation function, they are not a means alone to move most people out of poverty. Apart from biofuel, forests provide non-wood forest products (NWFPs), which have minimal or zero negative impacts on the forest. These NWFPs sustain the rural people and promote sustainable forest bioeconomy campaign [59]. The roles of forests in supporting, maintaining, and satisfying rural consumption; diversifying their incomes; and meeting their basic needs are extremely important, especially for those experiencing transient poverty [64]. However, local people, out of poverty and being left with no other options, engage in the cutting of trees for energy, a practice which in most cases goes against their wishes, considering the other numerous benefits they derive from forests [66]. Meanwhile, in some cases, the local people collect deadwood and/or tree branches only. Studies have shown that in most developing countries, the governments and the richer citizens are culprits for large areas of deforestation [60,61,62,63]. In Cambodia, for example, deforestation for timber has been reported as a primary driver of ‘shadow state’ activities that operate through illicit, corrupt, and patrimonial networks of state authorities [60].

3.3. Land Use/Cover Changes

Land use/cover change (LUCC) is an emerging threat to the resilience of socioeconomic and ecological systems because it is often related to land degradation, including forest loss [67]. It has been acknowledged that the drivers of LUCC are often complex and interrelated between anthropogenic (social, political, economic, demographic, technological, cultural) and biophysical factors with direct or indirect impacts on the people, economy, and environment [68]. It is on this background that this study investigated the land use/cover transitions that have shown drastic transformations between 1990 and 2020 (Figure 5). Larger areas of forest were found in decade 1 (1990–1999) (Figure 5a) relative to decade 2 (2000–2009) (Figure 5b) and decade 3 (2010–2020) (Figure 5c). On the other hand, decade 2 and decade 3 had the largest areas for agriculture and settlement as compared with decade 1. In line with this study, many studies in developing countries have reported consistent rapid changes in land use/cover in recent years when compared with many decades ago [68,69,70,71,72,73]. These changes have been associated with population explosion, industrialized agriculture, and uncontrollably acute deforestation [16,68]. For instance, deforestation was considered the primary cause of land use/cover change in tropical settings and is typically a consequence of diverse factors including population growth, urbanization, agricultural expansion, and logging [16]. Another study in Ghana that aimed at identifying the driving forces of land use/cover change by a mixed-methods approach observed that rural population growth was the main driver of the changes [68]. Similarly, a study performed to investigate the dynamics of LUCC in Burkina Faso between 1999 and 2011 agrees with our findings that more forest areas were found in the past decades, while the present decades have more arable areas due to the growing demand for food as the population increases [70]. In the Western Region of Ghana, which is covered by evergreen forests, Koranteng et al. [74] discovered significant changes in the landscape from 1990 to 2020. They attributed the changes to deforestation through agriculture.

3.4. Drivers of Forest Loss and Carbon Emissions: As Vital Indicators

The study observed that sustainable development in the forest bioeconomy has been adversely affected in the country by several drivers (Figure 6). Agricultural activities and commodity-driven deforestation ranked highest in the list of the drivers, and their trend increased severely over time (Figure 6a). For instance, in 1990, forest loss through commodity-driven deforestation was 28,798 hectares, while 2020 had 132,308 hectares, which was more than a 350% increase. Similarly, agriculture as a top driver of forest loss increased by more than 700% between 1990 (13,239 ha) and 2020 (118,675 ha). It was also discovered that the increase in deforestation rate was relatively associated with potential carbon emissions, which became higher from 2010 (Figure 6b). In addition to the top drivers, other drivers of deforestation and their influences in the different decades varied (Figure 7). Farming activities, population growth, and climate change were long-term drivers because they cut across the three decades, while wildfire, illiteracy rate, and pests and diseases were mostly associated with decade 1. It is convincing that the rapid growth in human population will have a profound impact on forests. This is because a rise in population means a rise in human demand for food, shelter, and other basic needs and comfort [24].
Thus, satisfying these growing needs of humans required creating more land areas for agriculture, houses, and infrastructure that consequently caused deforestation and the creation of substantial impacts on the environment including emissions of carbon [16,17,18,19,75]. It has been reported that West Africa is responsible for a large portion of carbon emissions from deforestation at an average annual emission of 350 Tg/year. The regional net global warming potential (GWP) between 1990 and 2019 was estimated to be 11.44 Pg, and Nigeria (18.7%), Mali (15%) and Ghana (13.2%) had the highest GWP from deforestation activities [76]. The recent growth in the population of these countries might be held responsible. The strong links between population growth, deforestation, carbon emissions, and GDP have been studied globally [20,21,22,23,77,78,79,80]. Several studies have revealed that reductions in deforestation-induced activities over time could positively bring a tangible reduction the CO2 emissions [49,81].
In contrast to this study, a study in Indonesia emphasized that migration played a highly significant role in the deforestation activities in the region [82]. However, migration could contribute to the loss of forest, but in the case of this study, the impacts of migration was insignificant. This is because most activities of deforestation take place in the rural areas of Ghana, and rural–urban drift is a common type of migration in the country.
Sociocultural and political factors are drivers of deforestation that have been often overlooked in many studies. This study discovered that these drivers, including population and agriculture, need to be remotely addressed so as to achieve sustainable development in the forest bioeconomy in Ghana. Socio-culturally, some of the rural populace affirmed that they prefer thatch and mud houses to modern buildings, while others prefer food cooked with firewood as opposed to either gas or electricity [83]. During the course of this study, it was found that besides farming and infrastructural development, some of the local people have ‘strong preferences’ towards certain traditions and beliefs, making them become attached to the forests. For example, the preference of chewing-sticks from the forest trees instead of modern toothpastes and brushes, with a belief that the chewing-sticks are healthier for teeth and gums, improve the strength and whiteness of their teeth, and provide them with the finest breath. According to them, the modern style of cleaning teeth destroys human health, teeth, and gums; leads to removal of ones’ teeth at younger age; and propagates health issues because of the chemicals associated with the toothpastes. Some of the people prefer heating their rooms with wood energy to modern heating systems. Similarly, some prefer the smoking and drying of food (fish, meat, and agricultural products) with bioenergy as opposed to the modern smoking/drying facilities. Politically, the findings from the study revealed unsound policies, weak governance, lack of law enforcement, landlessness, unclear allocation of rights, impoverishment of the rural people, and lack of investments and financial resources as factors characterized by the government. In sum, these are drivers that are remotely piloting the forest degradation movements. According to Tan et al. [84], these are contentious issues that require careful management.

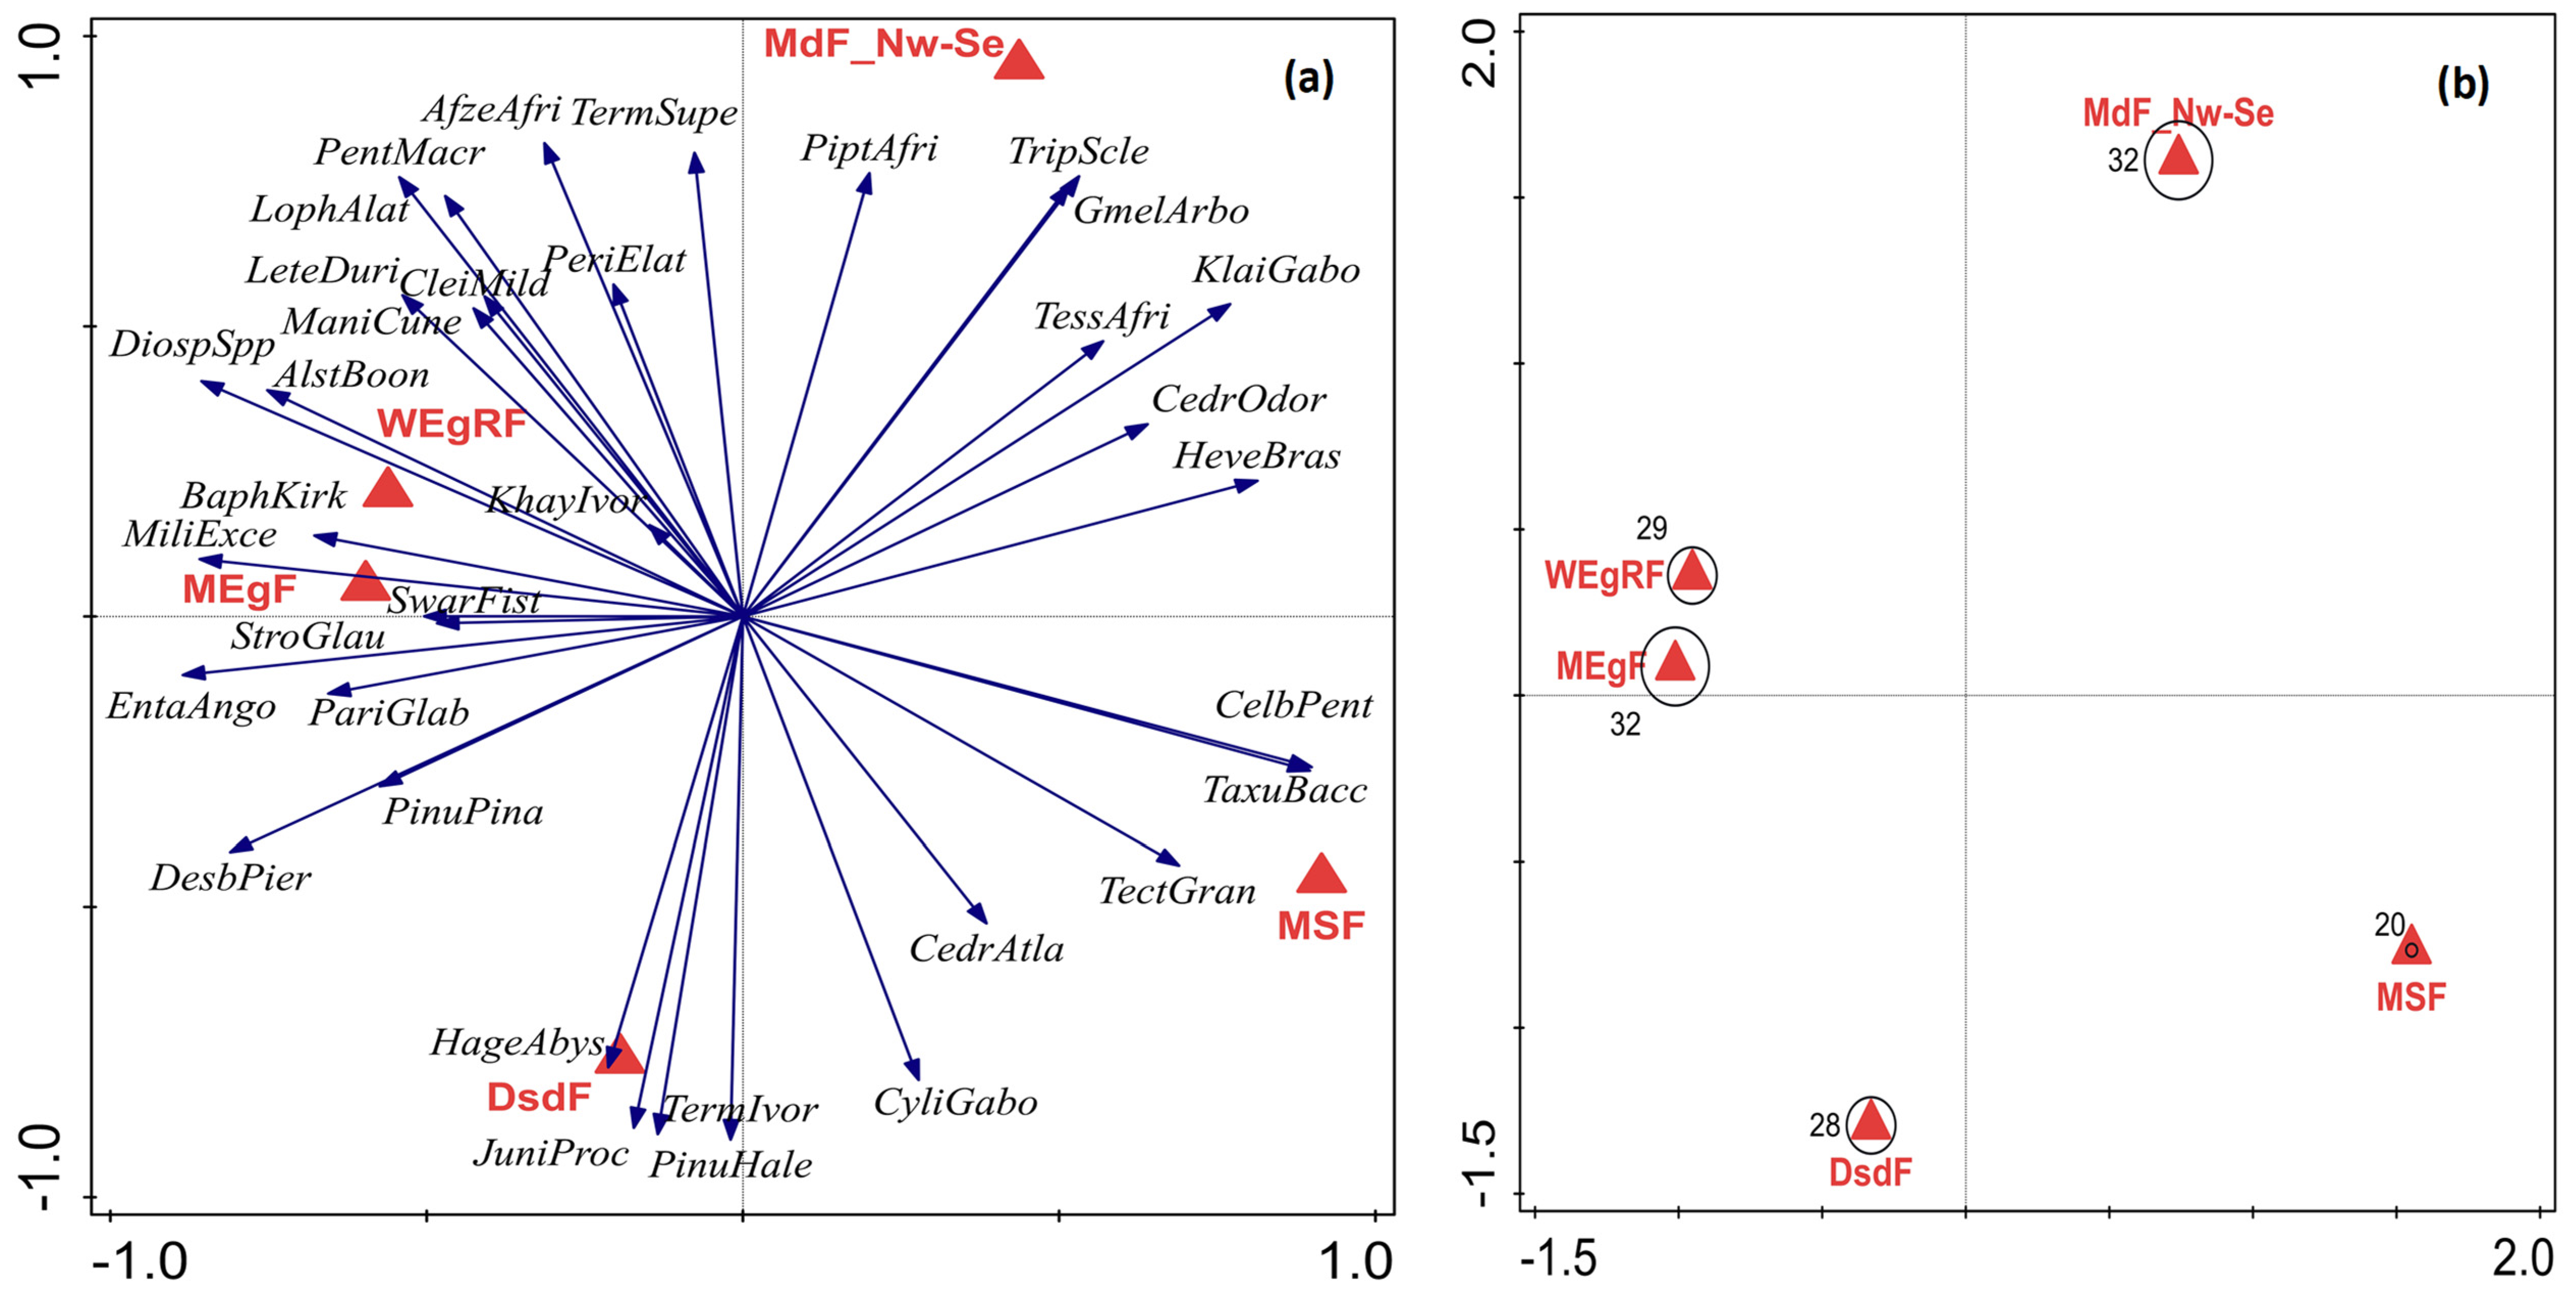
3.5. Common Forest Tree Species

An investigation of the common forest tree species and their spatial distributions across the forest–vegetation belts became necessary as to ascertain their contributions to a sustainable forest bioeconomy (Figure 8). Diospyros spp., Pentaclethra macrophlla, Letestua durissima, Lophira alata, Milicia excels, Baphia kirkii, Cleistanthus mildbraedii, and Swrtzia fistuloides were dominant in the wet and moist evergreen forests, while Piptadeniastrum africanum, Triplochiton scleraxylon, and Gmelina arborea were common in the moist deciduous forest (Figure 8a). On the other hand, the dry semi-deciduous forest and savannah, as well as the swamp forest and mangrove, had Juniperus procera, Pinus halepensis, Pinus pinaster, Cedrus atlantica, Hagenia abyssinica, and Taxus baccata. Thirty-five major tree species were identified across the forest–vegetation belts, with the moist evergreen and moist deciduous forests recording the highest of 32 species each (Figure 8b). Some species were found in almost all the forest–vegetation belts. These were Tectona grandis, Cedrela odorata, Terminalia superba, Klainedoxa gabonensis, Hevea brasiliensis, Cylicodiscus gabonensis, Pinus halepensis, Hagenia abyssinica, Desbordesia pierreana, Parinari glabra, and Swrtzia fistuloides (Figure 9).
These particular trees are mostly natives of the region and are essential promoters of sustainable forest bioeconomy. This is because they have the potential to survive (different threats such as climate change, wildfires, and pests) in all the forest belts and are exploited by the people for livelihoods. Further, these classes of tree species improve soil organic carbon and organic matter, which in turn enhances forest area, growing stocks, and NPP, thus increasing the sustainability of forest bioeconomy [85,86,87,88,89].

3.6. Employment in Forestry and Forest-Based Sector(s)

The study indicated that employment rate in forestry and the forest-based sector as an indicator of sustainable forest bioeconomy decreased with time. In the evergreen forest, 5.5% (3.1% male, 2.1% female) of the population were employed in decade 1, and 4.1% for decades 2 and 3 (Figure 10). In all the forest belts, decade 1 recorded the highest percentages of persons employed in forestry and the forest-based sector when compared with decade 2 and decade 3. In Cameroon, for instance, a study reported that reductions in deforestation was positive in the reduction of atmospheric CO2, but led to a decrease in employment in the forestry sector and forestry’s contribution to GDP [49]. In truth, a decrease in deforestation will lower carbon emissions, but inevitably the economic consequences are negative because the contribution of forest to GDP and employment will reduce. To ameliorate this unacceptable scenario, the government and stakeholders in Ghana should fully adopt the Reducing Emissions from Deforestation and Degradation (REDD+) initiatives or some other financial rewarding systems such that the economic losses incurred in reducing deforestation and carbon emission could be compensated as in the cases of Brazil, Costa Rica, and Colombia [90,91].

3.7. Correlation among Variables Relating to Forest Bioeconomy

To further test the hypothesis regarding the variability or interactions among the indicators of sustainable forest bioeconomy, the pairwise correlation adjusted to Bonferroni significance levels at 0.01 and 0.05 was used. This correlation test is deemed important because it helped to ascertain the correlation between or among the variables, thus providing more insight or understanding on how the variables inter-relate, or interfere and influence, one another. The population growth and forest area showed significantly high positive and negative correlations with all the indicators of the sustainable forest bioeconomy investigated (Table 3). This is because a rapid growth in human population always has a critical influence on several factors such as forest contribution to GDP, gross domestic growth rate, forest growing stocks, forest soil quality, and forest net primary productivity [68,70,71,74]. On the other hand, a severe change in forest area through deforestation will strongly affect other indicators of the forest bioeconomy [92,93]. The volume of deadwood as an indicator of sustainable forest bioeconomy showed a significant positive relationship with forest protected area, population, forest growing stocks, forest soil organic matter, and net primary productivity. Additionally, it revealed a significant negative interrelationship with forest loss, tree cover loss, poverty rate, and forest use for biofuel. Similarly, forest use for biofuel and forest growing stocks had significant associations with 90% of all the indicators of sustainable forest bioeconomy. For example, a recent study in Nigeria observed that due to growth in population, available resources become insufficient, thereby creating more impoverished people [80]. The authors further stated that the poor people, especially those in the rural area, depend totally on the forests for food and bioenergy, which has not only caused reduction in forest areas and forest stocking but has increased CO2 emissions and poor soil including low SOM [80]. In Malaysia, a study demonstrated that forests have a large influence on carbon emissions, and thus forest loss through deforestation increases the emissions of the GHGs and global climate change as an effect [93]. The benefits and relationships between deadwood and other indicators of sustainable forest bioeconomy have been investigated in different regions [94]. According to Bujoczek et al. [95], in order to conserve the biodiversity and maintain forest richness, it is pertinent to retain deadwood at different stages of decay, considering environmental, economic, and social benefits. Furthermore, in the tropical rainforests of Malaysian Borneo, Saner et al. [96] observed a strong connection among deadwood, soil carbon, soil organic matter, and net primary productivity. Although the potential of deadwood in the biodiversity of forest trees and soil can never be underestimated, deadwood volume was found in more fertile and moist areas of the forest [95]. This is in support of the fact that deadwood volume has a significant and positive correlation with forest stocks, NPP, and soil nutrient enrichment (that is, SOM).

4. Conclusions and Recommendations

In the three decades of investigation, the study showed that larger areas of forest were found in decade 1 (1990–1999) relative to decade 2 (2000–2009) and decade 3 (2010–2020). Forests’ contributions to GDP varied between the forest–vegetation belts and regions, decreasing rapidly from 1990 to 2020. The highest forest contributions to GDP were found in the wet evergreen (rainforest) and moist evergreen forests in comparison with the other forest belts. The study also observed that a higher percentage of the people depend on forests for income, livelihood, and bioenergy in the south than the other regions of the country. This was probably because of the areas of forests, population size, and economic status of the people in the southern part. Agricultural activities and commodity-driven deforestation (such as infrastructural development, logging for biofuel and timber) ranked highest in the list of the drivers, and their trend increased severely over time. On the other hand, population growth and climate change were long-term drivers of deforestation because they cut across the three decades of study. Tectona grandis, Cedrela odorata, Terminalia superba, Klainedoxa gabonensis, Hevea brasiliensis, Cylicodiscus gabonensis, Pinus halepensis, Hagenia abyssinica, Desbordesia pierreana, Parinari glabra, and Swrtzia fistuloides were identified as the common species important for forest bioeconomy in the study. The employment rate in forestry and forest-based sector as an indicator of sustainable forest bioeconomy decreased with time. The population growth and forest area showed significantly high positive and negative correlations with all the indicators of sustainable forest bioeconomy investigated. Further, the study discovered that the volume of deadwood as an indicator of sustainable forest bioeconomy showed a significant positive relationship with forest protected area, population, forest growing stocks, forest soil organic matter, and net primary productivity, but a negative correlation with poverty rate and forest use for biofuel.
The study signifies that the sustainable forest bioeconomy is indeed a multidimensional approach involving economic, social, and environmental indicators, and thus a direct or indirect impact in one will definitely influence the others positively or negatively. For example, deforestation might increase GDP, income, and/or an individual’s well-being, but there might be a reduction in forest areas that could lead to decline in employment rate, forest stocks, net primary productivity, poor soil, and increased carbon emissions. On the other hand, a reduction in deforestation might bring about a reduction in carbon emissions; however, the economic repercussions are negative as the contribution of forest to GDP, income, and employment will fall as trade-offs.
Findings from the study will really help to bring lasting solutions to deforestation and enhance the sustainable forest bioeconomy. This is because the study has unveiled remote drivers of forest loss that have been long overlooked by previous studies. For example, the sociocultural and political drivers have always been overlooked. Although adoption of some control measures such as the REDD+ and other environmental tax and financial incentives are good policies, as obtainable in some countries such as Brazil, Indonesia, Costa Rica, Colombia and others, more might be achieved from these policies by addressing sociocultural and political factors. A sustainable enlightenment campaign and routine informal education of the rural people are highly necessary. This is because some of the peoples’ reasons for preferring forest products to modern resources seem convincing and logical. There should be regular and intensive enlightenment campaigns and workshops as well as house-to-house visits to the people using strong health-related evidence to convince them. They should be convinced as to why they should embrace modern toothpastes and brushes instead of chewing-sticks from the forest trees, for example. However, there are eco-forest guards in some regions, and the government should recruit more personnel to safeguard most forests from illegal and unsustainable logging. Annually or bi-annually, monetary compensations should be given to communities whose forest(s) are more protected and denser. Ghana is a tropical and coastal country with enough sunlight and sea; thus, the government should extract renewable energy from these sustainable energy sources and provide the rural communities with solar-powered cooking stoves. This will drastically reduce pressure on the forest.

Author Contributions

Conceptualization, I.N. and H.M.; methodology, C.N.; software, C.N.; validation, all authors; formal analysis, C.N.; investigation, I.N. and C.N.; resources, I.N. and C.N.; data curation, C.N.; writing—original draft preparation, C.N. and I.N.; writing—review and editing, all authors; visualization, all authors; supervision, H.M.; project administration, I.N. and H.M.; funding acquisition, I.N. and H.M. All authors have read and agreed to the published version of the manuscript.

Funding

This work was supported by the Operational Program Research, Development and Education, the Ministry of Education of the Czech Republic, grant no. CZ.02.1.01/0.0/0.0/16_019/0000803.

Institutional Review Board Statement

Not applicable.

Informed Consent Statement

Not applicable.

Data Availability Statement

The data presented in this study are available on request from the corresponding author. The data are not publicly available due to the processing of data relative to different sources—some of them retrieved throughout extensive interview campaigns, others through institutional databases, while some were from the published literature.

Acknowledgments

The Faculty of Forestry and Wood Sciences, Czech University of Life Sciences is acknowledged. Support from individuals who were interviewed in Ghana is also acknowledged.

Conflicts of Interest

The authors declare no conflict of interest.

Appendix A

Table A1. Forest–vegetation belts, regions, and the geographical coordinates for the sampling points.
Forest-Vegetation BeltsRegionsLatitudeLongitude
Wet evergreen rainforestWestern region5.39599−2.53939
Wet evergreen rainforestWestern region4.820614−2.0327
Wet evergreen rainforestWestern region5.419696−1.64301
Wet evergreen rainforestWestern region5.418745−1.63782
Wet evergreen rainforestWestern region4.96286−2.39281
Wet evergreen rainforestWestern region5.38217−2.54018
Wet evergreen rainforestWestern North region5.986077−2.7766
Wet evergreen rainforestWestern North region6.474528−2.96298
Wet evergreen rainforestWestern North region6.255623−2.91215
Moist evergreen (dry and thick) forestCentral region5.55462−1.44816
Moist evergreen (dry and thick) forestCentral region5.495595−1.04152
Moist evergreen (dry and thick) forestCentral region5.630502−1.60065
Moist evergreen (dry and thick) forestEastern region6.546458−0.33025
Moist evergreen (dry and thick) forestEastern region6.666549−0.60226
Moist evergreen (dry and thick) forestEastern region6.716578−0.88435
Moist evergreen (dry and thick) forestAhafo region6.666549−2.58694
Moist evergreen (dry and thick) forestAhafo region7.046641−2.57687
Moist evergreen (dry and thick) forestAhafo region7.136618−2.21418
Moist evergreen (dry and thick) forestAshanti region6.246104−1.34778
Moist evergreen (dry and thick) forestAshanti region6.696567−2.10336
Moist evergreen (dry and thick) forestAshanti region7.166607−0.7836
Moist evergreen (dry and thick) forestBono region7.056041−2.88434
Moist evergreen (dry and thick) forestBono region8.089444−2.42917
Moist evergreen (dry and thick) forestBono region7.596912−2.28934
Moist deciduous (NW and SE types) forestBono East region7.966366−0.52589
Moist deciduous (NW and SE types) forestBono East region7.581511−0.18408
Moist deciduous (NW and SE types) forestBono East region7.904813−1.84654
Moist deciduous (NW and SE types) forestOti region7.6123120.390794
Moist deciduous (NW and SE types) forestOti region8.1432790.429637
Moist deciduous (NW and SE types) forestOti region8.6735420.243193
Moist deciduous (NW and SE types) forestVolta region6.0619950.763683
Moist deciduous (NW and SE types) ForestVolta region7.0944010.461256
Moist deciduous (NW and SE types) ForestVolta region6.8339260.429637
Dry semi-deciduous forest and savannaSavannah region8.888897−0.86903
Dry semi-deciduous forest and savannaSavannah region9.804188−1.56147
Dry semi-deciduous forest and savannaSavannah region9.146967−1.94689
Dry semi-deciduous forest and savannaNorthern region9.7714450.173559
Dry semi-deciduous forest and savannaNorthern region9.886262−0.3547
Dry semi-deciduous forest and savannaNorthern region9.390705−1.17107
Dry semi-deciduous forest and savannaNorthern East region10.1599−1.24719
Dry semi-deciduous forest and savannaNorthern East region10.59689−0.38406
Dry semi-deciduous forest and savannaNorthern East region10.28482−1.48202
Dry semi-deciduous forest and savannaUpper West region10.89618−1.95801
Dry semi-deciduous forest and savannaUpper West region10.54698−2.16744
Dry semi-deciduous forest and savannaUpper West region10.02869−2.04686
Dry semi-deciduous forest and savannaUpper East region10.62808−0.97429
Dry semi-deciduous forest and savannaUpper East region10.88995−1.35509
Dry semi-deciduous forest and savannaUpper East region10.77775−0.35233
Swamp forest and mangroveGreat Accra region5.8833690.441012
Swamp forest and mangroveGreat Accra region5.9844830.161449
Swamp forest and mangroveGreat Accra region5.8152990.052582
Swamp forest and mangroveGreat Accra region5.8475170.771192
Swamp forest and mangroveGreat Accra region5.9643030.941969
Swamp forest and mangroveGreat Accra region5.8899870.611088
Swamp forest and mangroveGreat Accra region5.8156620.739171

References

  1. Food and Agricultural Organization of the United Nations. Global Forest Resources Assessment 2010; Food and Agricultural Organization of the United Nations: Rome, Italy, 2010. [Google Scholar]
  2. Myers, S.S.; Gaffikin, L.; Golden, C.D.; Ostfeld, R.S.; Redford, K.H.; Ricketts, T.H.; Turner, W.R.; Osofsky, S.A. Human health impacts of ecosystem alteration. Proc. Nat. Acad. Sci. USA 2013, 110, 18753–18760. [Google Scholar] [CrossRef] [PubMed] [Green Version]
  3. Helming, K.; Daedlow, K.; Paul, C.; Techen, A.-K.; Bartke, S.; Bartkowski, B.; Kaiser, D.; Wollschläger, U.; Vogel, H.-J. Managing soil functions for a sustainable bioeconomy—Assessment framework and state of the art. Land Degrad. Dev. 2018, 29, 3112–3126. [Google Scholar] [CrossRef] [Green Version]
  4. Masiero, M.; Secco, L.; Pettenella, D.; Da Re, R.; Bernö, H.; Carreira, A.; Dobrovolsky, A.; Giertlieova, B.; Giurca, A.; Holmgren, S.; et al. Bioeconomy perception by future stakeholders: Hearing from European forestry students. Ambio 2020, 49, 1925–1942. [Google Scholar] [CrossRef] [PubMed]
  5. Wei, X.; Liu, Q.; Aqing, P.U. Knowledge mapping of bioeconomy: A bibliometric analysis. J. Clean. Prod. 2022, 373, 133824. [Google Scholar] [CrossRef]
  6. Karvonen, J.; Halder, P.; Kangas, J.; Leskinen, P. Indicators and tools for assessing sustainability impacts of the forest bioeconomy. For. Ecosyst. 2017, 4, 1–20. [Google Scholar] [CrossRef] [Green Version]
  7. Tuomasjukka, D.; Berg, S.; Lindner, M. Managing sustainability of Fennoscandian forests and their use by Law and/or agreement: For whom and which purpose? Sustainability 2013, 6, 18–49. [Google Scholar] [CrossRef] [Green Version]
  8. MCPEF. Resolution H1. General Guidelines for the Sustainable Management of Forests in Europe. In Proceedings of the Second Ministerial Conference on the Protection of Forests in Europe, Helsinki, Finland, 16–17 June 1993; pp. 1–5. [Google Scholar]
  9. Leskinen, P.; Kähkönen, T.; Lähtinen, K.; Pasanen, K.; Pitkänen, S.; Sironen, S.; Myllyviita, T.; Sikanen, L.; Asikainen, A. Moniulotteinen Kestävyyden Arviointikehikko Puuenergian Tuotannolle; Suomen Ympäristö 9; Suomen ympäristökeskus: Helsinki, Finland, 2012; ISSN 1796-7637. (English translated). [Google Scholar]
  10. Mancini, M.S.; Galli, A.; Niccolucci, V.; Lin, D.; Bastianoni, S.; Wackernagel, M.; Marchettini, N. Ecological footprint: Refining the carbon footprint calculation. Ecol. Indic. 2015, 61, 390–403. [Google Scholar] [CrossRef]
  11. Vancutsem, C. Long-term (1990–2019) monitoring of forest cover changes in the 11 humid tropics. Sci. Advanc. 2021, 7, eabe1603. [Google Scholar]
  12. Pimm, S.L. Deforestation. Encyclopedia Britannica. 22 March 2022. Available online: https://www.britannica.com/science/deforestation (accessed on 4 January 2023).
  13. Hansen, M.C. High-resolution global maps of 21st-century forest cover change. Science 2013, 342, 850–853. [Google Scholar] [CrossRef] [Green Version]
  14. FAO. Global Forest Resources Assessment. 2020. Available online: https://fra-data.fao.org (accessed on 23 December 2022).
  15. FAO. Introduction and Status of the Forestry Sector in Ghana. 2022. Available online: http://www.fao.org/3/ab567e/AB567E02.htm (accessed on 23 December 2022).
  16. Geist, H.J.; Lambin, E.F. Proximate causes and underlying driving forces of tropical 20 deforestation. BioScience 2002, 52, 143–150. [Google Scholar] [CrossRef] [Green Version]
  17. Curtis, P.G.; Slay, C.M.; Harris, N.L.; Tyukavina, A.; Hansen, M.C. Classifying drivers 22 of global forest loss. Science 2018, 361, 1108–1111. [Google Scholar] [CrossRef] [PubMed]
  18. De Sy, V.; Herold, M.; Achard, F.; Asner, G.P.; Held, A.; Kellndorfer, J.; Verbesselt, J. Synergies of multiple remote sensing data sources for REDD+ monitoring. Curr. Opin. Environ. Sustain. 2012, 4, 696–706. [Google Scholar] [CrossRef]
  19. Busch, J.; Ferretti-Gallon, K. What drives deforestation and what stops it? A meta-analysis. Rev. Environ. Econ. Policy 2017, 11, 3–23. [Google Scholar] [CrossRef] [Green Version]
  20. Xu, X.; Ang, B. Analysing residential energy consumption using index decomposition analysis. Appl. Energy 2014, 113, 342–351. [Google Scholar] [CrossRef]
  21. Yao, X.; Huang, R.; Song, M. How to reduce carbon emissions of small and medium enterprises (SMEs,) by knowledge sharing in china. Prod. Plan. Control 2019, 30, 881–892. [Google Scholar] [CrossRef]
  22. Liu, Z.; Zhao, T. Contribution of price/expenditure factors of residential energy consumption in China from 1993 to 2011: A decomposition analysis. Energy Convers. Manag. 2015, 98, 401–410. [Google Scholar] [CrossRef]
  23. Fan, J.-L.; Zhang, Y.-J.; Wang, B. The impact of urbanization on residential energy consumption in China: An aggregated and disaggregated analysis. Renew. Sustain. Energy Rev. 2017, 75, 220–233. [Google Scholar] [CrossRef]
  24. International Monetary Fund. World Economic Outlook. Chapter 4—Climate Change and the Global Economy. 2008. Available online: www.imf.org/external/pubs/ft/weo/2008/01/pdf/c4.pdf (accessed on 10 January 2023).
  25. Li, Y.; Brando, P.M.; Morton, D.C.; Lawrence, D.M.; Yang, H.; Randerson, J.T. Deforestation-induced climate change reduces carbon storage in remaining tropical forests. Nat. Commun. 2022, 13, 1964. [Google Scholar] [CrossRef]
  26. World Bank Group. State and Trends of Carbon Pricing 2019. Washington, DC, USA. 2019. Available online: http://hdl.handle.net/10986/31755 (accessed on 21 January 2023).
  27. Obiri, B.D.; Damnyag, L. Socio-economic contribution of illegal chainsaw milling to the Ghanaian rural economy. Ghana J. For. 2011, 27, 50–67. [Google Scholar]
  28. International Centre for Research in Agroforestry (ICRAF). Making Sub-Saharan African Forests Work for People and Nature: Policy Approaches in a Changing Global Environment; World Forests, Society and Environment (WFSE) of the International Union of Forest Research Organizations (IUFRO), World Agroforestry Centre (ICRAF), the Center for International Forestry Research (CIFOR) and the Finish Forest Research Institute (METLA) Special Project; World Agroforestry: Montpellier, France, 2009. [Google Scholar]
  29. United Nations Environment Programme (UNEP). Emissions Gap Report 2019 (UNEP). Available online: www.unenvironment.org/resources/emissions-gap-report (accessed on 29 December 2022).
  30. Geist, H.J.; Lambin, E.F. What Drives Deforestation? A Meta-Analysis of Proximate an Underlying Cause of Deforestation Based on Sub national Case Study Evidence; LUCC International Project Office, University of Louvain: Louvain-la-Neuve, Belgium, 2001. [Google Scholar]
  31. Armah, F.A.; Odoi, J.O.; Yengoh, G.T.; Obiri, S.; Yawson, D.O.; Afrifa, E.K.A. Food security and climate change in drought-sensitive savanna zones of Ghana. Mitig. Adapt. Strateg. Glob. Chang. 2011, 16, 291–306. [Google Scholar] [CrossRef]
  32. Ghana Statistical Service. Ghana—Population and Housing Census 2021. Summary of Final Report; Ghana Statistical Service: Accra, Ghana, 2011.
  33. Mongabay. Deforestation Statistics for Ghana. 2022. Accessed from rainforests.mongabay.com. Available online: https://rainforests.mongabay.com/deforestation/archive/Ghana.htm (accessed on 7 January 2023).
  34. Frimpong, Y.; Oluwoye, J.; Crawford, L. Causes of delay and cost overruns in construction of groundwater projects in a developing country; Ghana as a case study. Int. J. Proj. Manag. 2003, 21, 321–326. [Google Scholar] [CrossRef]
  35. Donkor, A.K.; Bonzongo, J.C.; Nartey, V.K.; Adotey, D.K. Mercury in different environmental compartments of the Pra River Basin, Ghana. Sci. Total Environ. 2006, 368, 164–176. [Google Scholar] [CrossRef] [PubMed]
  36. Environmental Protection Agency (EPA). National Action Programme to Combat Drought and Desertification; Ghanian Environmental Protection Agency: Accra, Ghana, 2000.
  37. Awuah, I.B. Report from the Ministry of Employment and Labour Relations of Ghana. In Parliamentarian Review and Address on 10 March 2022. Accra, Ghana. Available online: https://www.pulse.com.gh/news/local/ghanas-unemployment-rate-stands-at-13-labourminister/x3qykqy# (accessed on 1 February 2023).
  38. Sasu, D.D. Research Expert Covering Primarily Society and Agricultural Topics for Africa, Particularly Ghana and Nigeria. 2022. Available online: https://www.statista.com/statistics/1245342/number-of-people-living-in-extreme-poverty-in-ghana-by-area (accessed on 30 January 2023).
  39. Friedl, M.A.; Sulla-Menashe, D.; Tan, B.; Schneider, A.; Ramankutty, N.; Sibley, A.; Huang, X. MODIS collection 5 global land cover: Algorithm refinements and characterization of new datasets. Remote Sens. Environ. 2010, 114, 168–182. [Google Scholar] [CrossRef]
  40. Wolfslehner, B.; Linser, S.; Pülzl, H.; Bastrup-Birk, A.; Camia, A.; Marchetti, M. Forest bioeconomy—A new scope for sustainability indicators. Sci. Policy 2016, 4, 1–32. [Google Scholar] [CrossRef]
  41. European Forest Institute. Implementing Criteria and Indicators for Sustainable Forest Management in Europe. 2013. Available online: https://ci-sfm.org/ (accessed on 2 February 2023).
  42. Requardt, A.; Kohl, M.; Nascher, F. Reporting on Pan-European Criteria and Indicators for Sustainable Forest Management—Experiences from Liechtenstein. Liechtenstein. 2007. Available online: https://foresteurope.org/wp-content/uploads/2017/03/CI_4pages.pdf (accessed on 30 January 2023).
  43. Dagnija, B.; Indra, M.; Lauma, Z.; Liga, S. Bioeconomy mapping indicators and methodology. Case study about forest sector in Latvia. Energy Procedia 2017, 128, 363–367. [Google Scholar]
  44. Linser, S.; Lier, M. The Contribution of Sustainable Development Goals and Forest-Related Indicators to National Bioeconomy Progress Monitoring. Sustainability 2020, 12, 2898. [Google Scholar] [CrossRef] [Green Version]
  45. Okoli, C.; Pawlowski, S.D. The Delphi method as a research tool: An example, design considerations and applications. Inf. Manag. 2004, 42, 15–29. [Google Scholar] [CrossRef] [Green Version]
  46. Ter Braak, C.J.F.; Smilauer, P. Canoco 5, Windows Release (5.12). Software for Multivariate Data Exploration, Testing, and Summarization; Biometris, Plant Research International: Wageningen, The Netherlands, 2012. [Google Scholar]
  47. ESRI. ArcGIS Desktop: Release 10; Environmental Systems Research Institute: Redlands, CA, USA, 2009. [Google Scholar]
  48. Kaba, J.S.; Otu-Nyanteh, A.; Abunyewa, A.A. The role of shade trees in influencing farmers’ adoption of cocoa agroforestry systems: Insight from semi-deciduous rain forest agroecological zone of Ghana. NJAS-Wageningen J. Life Sci. 2020, 92, 100332. [Google Scholar] [CrossRef]
  49. Epule, E.T.; Peng, C.; Lepage, L.; Chen, Z. Policy options towards deforestation reduction in Cameroon: An analysis based on a systematic approach. Land Use Policy 2014, 36, 405–415. [Google Scholar] [CrossRef]
  50. Jackson, E.A. Assessment of Forest Valuation to GDP Contribution in Sierra Leone. For. Res. 2015, 4, 143. [Google Scholar] [CrossRef] [Green Version]
  51. Andrée, B.P.J.; Chamorro, A.; Spencer, P.; Koomen, E.; Dogo, H. Revisiting the relation between economic growth and the environment; a global assessment of deforestation, pollution and carbon emission. Renew. Sustain. Energy Rev. 2019, 114, 109221. [Google Scholar] [CrossRef]
  52. Haripriya, G.S. Integrating environmental and economic accounting: An application to the forest resources in India. Environ. Resour. Econ. 2000, 19, 73–95. [Google Scholar] [CrossRef]
  53. Haripriya, G.S. Integrating forest resources into the system of national accounts in Maharashtra, India. Environ. Dev. Econ. 2000, 5, 143–156. [Google Scholar] [CrossRef]
  54. Oduro, K.A.; Mohren, G.M.J.; Pena-Claros, M.; Kyereh, B.; Arts, B. Tracing forest resource development in Ghana through forest transition pathways. Land Use Policy 2015, 48, 63–72. [Google Scholar] [CrossRef]
  55. Ghana Statistical Service. Revised Gross Domestic Product, and Population and Housing Census Summary of Final Report; Ghana Statistical Service; National Account Statistics: Accra, Ghana, 2012. [Google Scholar]
  56. Wen, X.; Quacoe, D.; Quacoe, D.; Appiah, K.; Ada Danso, B. Analysis on bioeconomy’s contribution to GDP: Evidence from Japan. Sustainability 2019, 11, 712. [Google Scholar] [CrossRef] [Green Version]
  57. Arnold, J.E.M.; Powell, B.; Shanley, P.; Sunderland, T.C.H. Editorial: Forests, biodiversity and food security. Int. For. Rev. 2011, 13, 259–264. [Google Scholar] [CrossRef]
  58. Agrawal, A.; Cashore, B.; Hardin, R.; Shepherd, G.; Benson, C.; Miller, D. Economic Contributions of Forests. Background Paper 1, United Nations Forum on Forests (UNFF), 10th Session, Istanbul, Turkey. 2013. Available online: https://static.un.org/esa/forests/wp-content/uploads/2015/12/EcoContrForests.pdf (accessed on 8 January 2023).
  59. Malleson, R.; Asaha, S.; Egot, M.; Kshatriya, M.; Marshall, E.; Obeng-Okrah, K.; Sunderland, T. Non-timber forest products income from forest landscapes of Cameroon, Ghana and Nigeria–an incidental or integral contribution to sustaining rural livelihoods? Int. For. Rev. 2014, 16, 261–277. [Google Scholar] [CrossRef] [Green Version]
  60. Markus, K. Deforestation, cattle capitalism and neodevelopmentalism in the Chico Mendes Extractive Reserve, Brazil. J. Peasant Stud. 2020, 47, 464–482. [Google Scholar]
  61. Courtney, W.; Ida, T.; Thuon, T. Under the canopy of development aid: Illegal logging and the shadow state. J. Peasant Stud. 2022, 27, 1–32. [Google Scholar] [CrossRef]
  62. Getu, D.A.; Duncan, J.; van Dijk, H. Development, governmentality and the sedentary state: The productive safety net programme in Ethiopia’s Somali pastoral periphery. J. Peasant Stud. 2022, 49, 1158–1180. [Google Scholar]
  63. Maritza, P.; Kaulard, A. Forest as nature or forest as territory? Knowledge, power, and climate change conservation in the Peruvian Amazon. J. Peasant Stud. 2022. [Google Scholar] [CrossRef]
  64. Jagger, P.; Cheek, J.Z.; Miller, D.; Ryan, C.; Shyamsundar, P.; Sills, E. The Role of Forests and Trees in Poverty Dynamics. For. Policy Econ. 2022, 140, 102750. [Google Scholar] [CrossRef]
  65. Jumbe, C.; Samue, B.; Madeleen, H. Contribution of Dry Forests to Rural Livelihoods and the National Economy in Zambia. In Proceedings of the Governing Shared Resources: Connecting Local Experience to Global Challenges, The Twelfth Biennial Conference of the International Association for the Study of Commons, Cheltenham, UK, 14–18 July 2008; Available online: https://hdl.handle.net/10535/99 (accessed on 22 December 2022).
  66. Francesconi, W.; Vanegas-Cubillos, M.; Bax, V. Carbon footprints forest degradation and deforestation by Basic-Needs Populations: A review. Carbon Footprint. 2022, 1, 10. [Google Scholar] [CrossRef]
  67. Lambin, E.F.; Meyfroidt, P. Land use transitions: Socio-ecological feedback versus socio-economic change. Land Use Policy 2010, 27, 108–118. [Google Scholar] [CrossRef]
  68. Kleemann, J.; Baysal, G.; Bulley, H.N.; Fürst, C. Assessing driving forces of land use and land cover change by a mixed-method approach in north-eastern Ghana, West Africa. J. Environ. Manag. 2017, 196, 411–442. [Google Scholar] [CrossRef]
  69. Geist, H.; McConnell, W.; Lambin, E.F.; Moran, E.; Alves, D.; Rudel, T. Causes and trajectories of land-use/cover change. In Land-Use and Land-Cover Change; Springer: Berlin, Heidelberg, 2006; pp. 41–70. [Google Scholar]
  70. Zoungrana, B.J.-B.; Conrad, C.; Amekudzi, L.K.; Thiel, M.; Da, E.D.; Forkuor, G.; Löw, F. Multi-temporal landsat images and ancillary data for land use/cover change (LULCC) detection in the Southwest of Burkina Faso, West Africa. Remote. Sens. 2015, 7, 12076–12102. [Google Scholar] [CrossRef] [Green Version]
  71. Nwaogu, C.; Okeke, O.J.; Fadipe, O.O.; Bashiru, K.A.; Pechanec, V. Is Nigeria losing its natural vegetation and landscape? Assessing the landuse-landcover change trajectories and effects in Onitsha using remote sensing and GIS. Open Geosci. 2017, 9, 707–718. [Google Scholar] [CrossRef] [Green Version]
  72. Nwaogu, C.; Nwankwoala, H. Effects of Human-Induced Landscape Changes on Biodiversity Conservation of Soil and Plants in Different Land-Use, Southern Nigeria. In Proceedings of the 5th International/Global Biodiversity Conservation Conference (GBCC), Prague, Czech Republic, 25–26 September 2018. [Google Scholar]
  73. Nwaogu, C. Landscape Transitions in Space and Time in Diverse Land Use: The Geoinformatics and Statistical Approach; Publikace neprosla redkcni jazykovou upravou; University of Palacky Press: Olomouc, Czech Republic, 2020. [Google Scholar]
  74. Koranteng, A.; Zawila-Niedzwiecki, T.; Adu-Poku, I. Remote sensing study of land use/cover change in West Africa. J. Environ. Prot. Sustain. Dev. 2016, 2, 17–31. [Google Scholar]
  75. IPBES. Global Assessment Report on Biodiversity and Ecosystem Services of the 17 Intergovernmental Science-Policy Platform on Biodiversity and Ecosystem Services; IPBES: Bonn, Germany, 2019; Available online: https://www.ipbes.net/global-assessment (accessed on 20 December 2022).
  76. Abdulraheem, K.A.; Adeniran, J.A.; Aremu, A.S. Carbon and precursor gases emission from forest and non-forest land sources in West Africa. Int. J. Environ. Sci. Technol. 2022, 19, 12003–12018. [Google Scholar] [CrossRef]
  77. Iyang, M.P.; Esohe, K.P. Deforestations, Environmental Sustainability and Health Implications in Nigeria. Int. J. Sci. Environ. Technol. 2014, 3, 502–517. [Google Scholar]
  78. Crippa, M.; Oreggioni, G.; Guizzardi, D.; Muntean, M.; Schaaf, E.; Lo Vullo, E.; Solazzo, E.; Monforti-Ferrario, F.; Olivier, J.G.J.; Vignati, E. Fossil CO2 and GHG Emissions of All World Countries-2019 Report; EUR 29849 EN; Publications Office of the European Union: Luxembourg, 2019. [Google Scholar]
  79. Mahmooda, H.; Alkhateeba, T.T.Y.; Furqan, M. Industrialization, Urbanization and CO2 Emissions in Saudi Arabia: Asymmetry Analysis. Energy Rep. 2020, 6, 1553–1560. [Google Scholar] [CrossRef]
  80. Musa, K.S.; Maijama, R.; Yakubu, M. Deforestation, Sectoral CO2 Emissions and Environmental Pollution Nexus: Evidence from Nigeria. Asian Res. J. Curr. Sci. 2022, 4, 161–181. [Google Scholar]
  81. Eliasch, J. Climate Change: Financing Global Forests; MPG Press: Bodmin, UK, 2008. [Google Scholar]
  82. Darmawan, R.; Klasen, S.; Nuryartono, N. Migration and deforestation in Indonesia, Efforts Discussion Paper Series, No. 19, 2016, GOEDOC, Dokumenten- und Publikationsserver der Georg-August-Universität, Göttingen. Available online: https://nbn-resolving.de/urn:nbn:de:gbv:7-webdoc-3967-7 (accessed on 6 January 2023).
  83. Guha, S.; Ismail, M.D. Socio-Cultural Changes of Tribes and Their Impacts on Environment with Special Reference to Santhal in West Bengal. Glob. J. Interdiscip. Soc. Sci. 2015, 4, 148–156. [Google Scholar]
  84. Tan, P.Y.; Feng, Y.; Hwang, Y.H. Deforestation in a tropical compact city part a: Understanding its socio-ecological impact. Smart Sustain. Built Environ. 2016, 5, 47–72. [Google Scholar] [CrossRef]
  85. Sapkota, I.P.; Odén, P.C. Gap characteristics and their effects on regeneration, dominance and early growth of woody species. J. Plant Ecol. 2009, 2, 21–29. [Google Scholar] [CrossRef] [Green Version]
  86. Agboadoh, D.M.Y. Soil Organic Carbon Stocks in Croplands of the Bechem Forest District, Ghana. Master’s Thesis, Kwame Nkrumah University of Science and Technology, Kumasi, Ghana, 2011. Unpublished. [Google Scholar]
  87. Chiti, T.; Grieco, E.; Perugini, L.; Rey, A.; Valentini, R. Efect of the replacement of tropical forests with tree plantations on soil organic carbon levels in the Jomoro district, Ghana. Plant Soil 2013, 375, 47–59. [Google Scholar] [CrossRef]
  88. Olorunfemi, I.E.; Fasinmirin, J.T.; Olufayo, A.A.; Komolafe, A.A. Total carbon and nitrogen stocks under diferent land use/land cover types in the Southwestern region of Nigeria. Geoderma Reg. 2020, 22, e00320. [Google Scholar] [CrossRef]
  89. Olorunfemi, I.E.; Olufayo, A.A.; Fasinmirin, J.T.; Komolafe, A.A. Dynamics of land use land cover and its impact on carbon stocks in Sub-Saharan Africa: An overview. Environ. Dev. Sustain. 2022, 24, 40–76. [Google Scholar] [CrossRef]
  90. Tollefson, J. Paying to save the rainforests. Nature 2009, 460, 936–937. [Google Scholar] [CrossRef]
  91. Barbier, E.B.; Lozano, R.; Rodríguez, C.M.; Troëng, S. Adopt a carbon tax to protect tropical forests. Nature 2020, 578, 213–216. [Google Scholar] [CrossRef] [Green Version]
  92. Adebayo, T.S. Testing the EKC hypothesis in Indonesia: Empirical evidence from the ARDL-based bounds and wavelet coherence approaches. Appl. Econ. 2021, 28, 78–100. [Google Scholar]
  93. Raihan, A.; Begum, R.A.; Nizam, M.; Said, M.; Pereira, J.J. Dynamic impacts of energy use, agricultural land expansion, and deforestation on CO2 emissions in Malaysia. Environ. Ecol. Stat. 2022, 29, 477–507. [Google Scholar] [CrossRef]
  94. Kunttu, P.; Junninen, K.; Kouki, J. Dead wood as an indicator of forest naturalness: A comparison of methods. For. Ecol. Manage. 2015, 353, 30–40. [Google Scholar] [CrossRef]
  95. Bujoczek, L.; Bujoczek, M.; Zięba, S. How much, why and where? Deadwood in forest ecosystems: The case of Poland. Ecol. Indic. 2021, 121, 107027. [Google Scholar] [CrossRef]
  96. Saner, P.; Loh, Y.Y.; Ong, R.C.; Hector, A. Carbon stocks and fluxes in tropical lowland dipterocarp rainforests in Sabah, Malaysian Borneo. PLoS ONE 2012, 7, e29642. [Google Scholar] [CrossRef] [PubMed] [Green Version]
Figure 1. African map showing Ghana (the study area) and the current 16 administrative regions.
Forests 14 00804 g001
Figure 2. Forest–vegetation belts. Image of the forest features/layers, regions, and sampling locations.
Forests 14 00804 g002
Figure 3. Forest contributions to the nation’s GDP from 1990 to 2020 (a) on the basis of forest–vegetation belts, (b) on the basis of the regions, and (c) on the basis of years.
Forests 14 00804 g003aForests 14 00804 g003b
Figure 4. Percentage of the population that use forests and their resources as sources of income and liveliwood in terms of (a) the forest–vegetation belts, (b) the regions, and (c) the regional distribution of people who depend on forests for wood/bioenergy.
Forests 14 00804 g004aForests 14 00804 g004b
Figure 5. Land use/cover in the three decades 1990–2020, showing average change between (a) 1990 and 1999, (b) 2000 and 2009, and (c) 2010 and 2020.
Forests 14 00804 g005
Figure 6. Forest loss (in hectres) from 1990 to 2020 by (a) individual drivers and (b) combination of all the drivers and carbon emission estimate.
Forests 14 00804 g006
Figure 7. Drivers of deforestation (forest loss) in the study decades: Decade 1 (1990–1999), Decade 2 (2000–2009), Decade 3 (2010–2020), and Decade 1–3 (1990–2020), and the extent of their influences in the different decades investigated. Description of abbreviation: NWFPs = non-wood forest products; LogComTim = logging for commercial purposes such as timber; InfraDev = infrastructural development such as building of markets, schools, hospitals, roads, etc.; OHDLog = forest deforestation for other household benefits; CivilComCon = Civil/communual conflicts; Gam & Hunt = wildlife gathering for game and hunting; Pol & Gov = political and governance drivers such as unsound policies, weak governance, lack of law enforcement, landlessness, unclear allocation of rights, impoverishment of the rural people, and lack of investments and financial resources.
Forests 14 00804 g007
Figure 8. Biplot from the multivariate analysis of ordination showing the forest–vegetation belts with (a) their associated common tree species that promote sustainable forest bioeconomy and (b) the total number and distribution of tree species for each forest–vegetation belt. Description of the abbreviations are as follows: for the species: Diospyros spp. = DiospSpp, Pentaclethra macrophlla = PentMacro, Letestua durissima = LeteDuri, Lophira alata = LophAlat, Milicia excels = MiliExce, Baphia kirkii = BaphKirk, Cleistanthus mildbraedii = CleiMild, Cylicodiscus gabonensis = CyliGabo, Desbordesia pierreana = DesbPier, Manilkara cuneifolia = ManiCune, Parinari glabra = PariGlab, Strombosia glaucescens = StroGlau, Swrtzia fistuloides = SwarFist, Tessmania Africana = TessAfri, Klainedoxa gabonensis = KlaiGabo, Afzelia africana spp. = AfzeAfri, Piptadeniastrum africanum = PiptAfri, Triplochiton scleraxylon = TripScle, Gmelina arborea = GmelArbo, Juniperus procera = JuniProc, Pinus halepensis = PinuHale, Pinus pinaster = PinuPina, Cedrus atlantica = CedrAtla, Hagenia abyssinica = HageAbys, Taxus baccata = TaxuBacc, Hevea brasiliensis = HeveBras, Celba pentandra = CelbPent, Alstonia boonei = AlstBoon, Khaya ivorensis = KhayIvor, Pericopsis elata = PeriElat, Terminalia superba = TermSupe, Terminalia ivorensis = TermIvor, Entandrophragma angolense = EntaAngo, Cedrela odorata = CedrOdor, Tectona grandis = TectGran. For the vegetation zones: wet evergreen rainforest = WEgRF; moist evergreen (dry and thick) forest = MEgF; moist deciduous (NW and SE types) forest = MDF_Nw-Se; dry semi-deciduous forest and savannah = DsdF; and swamp forest and mangrove = MSF.
Forests 14 00804 g008
Figure 9. Biplot from the multivariate analysis of ordination showing the proportion of each key tree species that enhanced sustainable forest bioeconomy in each forest–vegetation belt. Description of the abbreviations are shown in Figure 8.
Forests 14 00804 g009
Figure 10. Percentage of total population employed in forestry and forest-based or related sectors in the forest belts during the three decades.
Forests 14 00804 g010
Table 1. Data sources and variables/measures.
Indicator/MeasureSources
Administrative regionsGlobal coordinates
https://data.humdata.org/dataset/cod-ab-gha;
Forest–vegetation belts-www.omap.africanmarineatlas.org (accessed on 7 January 2023)
Sampling points- Field sampling and survey, hand-held GPS.
Land use-cover and changes, 1990–2020- Digital and satellite imageries from
https://eros.usgs.gov/westafrica/land-cover/land-use-and-land-cover-trends-west-Africa (accessed on 8 January 2023);
- www.nasa.gov (accessed on 8 January 2023).
Forest areas and loss, 1990–2020- FAO’s Global Forest Resources Assessments
Reports
Forest tree cover and loss, 1990–2020- FAO’s Global Forest Resources Assessments
Reports
Forest growing stocks, 1990–2020- FAO’s Global Forest Resources Assessments
(main and country reports)
Contributions of forest to GDP, 1990–2020- Ghana Statistical Services database
- World Bank websites
Country’s GDP, rates of illiteracy, poverty, and infrastructural development- Ghana Statistical Services database
- World Bank websites
- Other reports and documents
Uses of forests: farming, mining, bioenergy, timber, NWFPs, etc.- Ghana Statistical Services database
- World Bank websites
- Reports of Timber Industry Development
Division
- Forestry Commission.
- Other reports and documents
Biophysical: climate, wildfire, soil, net primary productivity (NPP), pests and diseases, carbon emissions- Ministry of Food and Agriculture database
- Forestry Commission
- Energy Commission
- Published literature
- FAOSTATS websites
- ISRIC Soil geographic databases:
https://www.isric.org/explore/soil-geographic-databases (accessed on 15 December 2022)
- Moderate resolution imaging
Spectroradiometer (MODIS) on NASA’s Terra
satellite: https://neo.gsfc.nasa.gov/ (accessed on 27 December 2022)
Population and settlement, 1990–2020- Ghana statistical services database
Forest-based employment, migration, civil/communal conflicts- Ghana statistical services database
- Other published literature
Drivers of deforestation, socio-cultural and political views, and stands on deforestation- Field sampling and survey (online and physical)
using literature, interviews, questionnaires
Common forest tree species- Field sampling and survey
- Past literature (published articles and NGOs/government institutional documents)
- Foresters and plant ecologists
Table 2. Summary table of the number of experts, farmers, and foresters who chose the variables as drivers of deforestation in the interviews, with emphasis by the authors in the literature.
Group/Class of DriversCurrent Drivers of DeforestationInterviews: % (no.) of Experts (n = 15) Who Endorsed the DriverInterviews: % (no.)
of Farmers and Foresters (n = 30)
Who Mentioned
the Driver
Literature: % (no.) of Authors (n = 25) Who Indicated the Driver
Direct driver: anthropogenic or humanPopulation growth (rural and urban)100% (15)100% (30)100% (25)
Agricultural intensification (modern and conventional)100% (15)90% (27)84% (21)
Use of forest for biofuel80% (12)73% (22)80% (20)
Use of forest for timber100% (15)100% (30)100% (25)
Use of forest for NWFPs53% (8)57% (17)52% (13)
Construction and building (settlements, canoes, etc.)60% (9)63% (19)64% (16)
Mining87% (13)90% (27)92% (23)
Wildfire53% (8)50% (15)52% (13)
Overgrazing/livestock60% (9)53% (16)56% (14)
Wildlife (game and hunting)53% (8)50% (15)52% (13)
Infrastructural development (road, schools, markets, hospitals, etc.)53% (8)57% (17)56% (14)
Direct driver: biophysicalSoil quality (e.g., degradation, SOM)67% (10)60% (18)60% (15)
Topography33% (5)27% (8)24% (6)
Rainfall variability73% (11)67% (20)68% (17)
Temperature variability60% (9)53% (16)56% (14)
Wind intensity47% (7)53% (16)48% (12)
Pests and diseases53% (8)50% (15)52% (13)
Indirect driver: socio-cultural and economicCivil/communual conflicts53% (8)50% (15)52% (13)
Migration53% (8)57% (17)56% (14)
Religious beliefs and patterns13% (2)20% (6)28% (7)
Cultural/traditional beliefs60% (9)70% (21)72% (18)
Illiteracy rate (level of education)53% (8)77% (23)68% (17)
Land tenure system20% (3)23% (7)16% (4)
Poverty rate (e.g., Rising living standard)93% (14)100% (30)96% (24)
Rural farmers lack of capital27% (4)17% (5)12% (3)
Foreign agricultural medium-scale investments0% (0)3% (1)0% (0)
International funding/development aid0% (0)0% (0)0% (0)
Credits by family, bank, government, or NGO6% (1)10% (3)4% (1)
Labour shortage13% (2)6% (2)8% (2)
Political/governanceUnsound policies60% (9)77% (23)52% (13)
Weak governance53% (8)60% (18)72% (18)
Lack of law enforcements73% (11)73% (22)56% (14)
Landlessness53% (8)70% (21)52% (13)
Unclear allocation of rights53% (8)63% (19)56% (14)
Impoverishments of the rural people87% (13)80% (24)68% (17)
Lack of investments and financial resources67% (10)86% (26)72% (18)
National agricultural programmes13% (2)13% (4)12% (3)
Fertilizer subsidies6% (1)10% (3)8% (2)
In bold are the drivers and values that had at least 50% ranking in the three respective sources.
Table 3. Summary of correlation analysis for the investigated variables that are associated with the forest bioeconomy in Ghana (1990–2020).
Dead
Wood
For
Prot Area
PopFor
CoGDP
GDP GroFor
GroStok
For
Area
For
Loss
Tree
CovLoss
Pov
Rate
For
Biofuel
For
NonBiofuel
Rain
Fall
TempSOMNPP
Dead Wood1.00
ForProtArea0.86 *1.00
Pop−0.97 **−0.93 *1.00
ForCoGDP0.730.70−0.76 *1.00
GDPGro0.390.28−0.37 *0.451.00
ForGroStok0.99 *0.86−0.98 *0.75 *0.411.00
ForArea0.92 *0.90 *−0.91 *0.66 *0.340.91 *1.00
ForLoss−0.77 *−0.610.78 *−0.55 *−0.32−0.77 *−0.60 *1.00
TreeCovLoss−0.95 *−0.780.92 *−0.66−0.34−0.94 *−0.84 *0.831.00
PovRate0.6 1 **0.71 **−0.63 **0.33−0.51 *0.62 *0.62 *−0.47 *−0.551.00
ForBiofuel−0.86 *−0.90 *0.89 **−0.71 *−0.32−0.86 *−0.88 *0.55 *0.62 *−0.58 *1.00
ForNonBiofuel−0.86−0.840.88 **−0.65−0.28−0.83 *−0.79 *0.660.79−0.60 *0.771.00
Rainfall0.61 *0.070.000.180.000.55 *0.51 *0.230.000.00−0.030.001.00
Temp0.57 *0.000.000.010.000.48 *0.36 *0.000.000.000.090.000.511.00
SOM0.95 *0.87 *−0.96 *0.69 *0.360.95 **0.89 *−0.80 *−0.910.64−0.82 *−0.890.44−0.321.00
NPP0.96 *0.70−0.98 *0.73 *0.340.86 **0.91 *−0.71 *−0.900.64−0.91−0.87 *0.500.57 *0.94 *1.00
* = correlation was significant at the 0.01 p-value; ** = correlation was significant at the 0.05 p-value. Description of the abbreviations: ForProtArea = forest protected area; Pop = population; ForCoGDP = forest contribution to GDP; GDPGro = gross domestic growth rate; ForGroStok = forest growing stocks; ForArea = forest area; ForLoss = forest loss; TreCovLos = tree cover loss; PovRate = poverty rate; ForBiofuel = forest use as biofuel; ForNonBiofuel = forest use for non-biofuel; Temp = temperature rate; SOM = soil organic matter-an indicator of soil quality; NPP = forest net primary productivity.
Disclaimer/Publisher’s Note: The statements, opinions and data contained in all publications are solely those of the individual author(s) and contributor(s) and not of MDPI and/or the editor(s). MDPI and/or the editor(s) disclaim responsibility for any injury to people or property resulting from any ideas, methods, instructions or products referred to in the content.

