Article

Molecular Ecological Network Structure and Potential Function of the Bacterial Community in the Soil Profile under Indigenous Tree Plantations in Subtropical China

1
Guangxi Key Laboratory of Forest Ecology and Conservation, College of Forestry, Guangxi University, Nanning 530004, China
2
Experimental Centre of Tropical Forestry, Chinese Academy of Forestry, Pingxiang 532600, China
3
Guangxi Youyiguan Forest Ecosystem Research Station, Pingxiang 532600, China
*
Author to whom correspondence should be addressed.
Forests 2023, 14(4), 803; https://doi.org/10.3390/f14040803
Submission received: 14 March 2023 / Revised: 9 April 2023 / Accepted: 10 April 2023 / Published: 14 April 2023

Abstract

:
The soil profile is a strong and complex physicochemical gradient that greatly affects bacterial community structure and function between soil layers. However, little is known about molecular ecological network structure and bacterial community function under differing soil profiles in planted forests. Four typical native tree species (Pinus massoniana Lamb., Castanopsis hystrix Miq., Mytilaria laosensis Lec., and Michelia macclurei Dandy) plantations were selected from subtropical China as the research object. We evaluated molecular ecological network structure as well as potential function of the soil bacterial community at different soil depths (0–20, 20–40, and 40–60 cm) within native tree plantations. Our results showed that (1) compared to the topsoil (0–20 cm), the bacterial molecular ecological network scale increased within the middle layer (20–40 cm) and the subsoil (40–60 cm), and the interaction between species was stronger; (2) module hubs and connectors were the key bacterial groups in each soil layer and increased with increasing soil depth; (3) the dominant functional groups of the bacterial communities in each soil layer were chemoheterotrophy, aerobic chemoheterotrophy, cellulolysis, ureolysis, nitrogen fixation, and nitrate reduction, and they were related to soil carbon and nitrogen cycling; and (4) the different molecular ecological network structures along with relative bacterial functional group abundances among diverse soil layers were mainly affected by soil organic carbon (SOC), NO3-N, NH4+-N, available phosphorus (AP), and total phosphorus (TP). Our study provides a theoretical foundation for bacterial community structure together with function within soil profiles of native tree plantations in subtropical regions.

1. Introduction

Soil microorganisms are the driving force of biogeochemical cycles in terrestrial ecosystems. Their functions are not limited to the surface soil and have a critical effect on deep soil [1,2]. Bacteria, the main soil microbiome components, are rich in diversity. They decompose and transform organic substances quickly and efficiently, thereby affecting plants’ ability to obtain nutrients from the soil [3,4]. Previous changes in bacterial communities in soil may hamper the functioning of these communities, leading to shifts in biogeochemical cycles [5,6]. To take an example, as discovered by Xu et al. [7], some bacterial functional groups associated with carbon (C) and nitrogen (N) cycling (e.g., aerobic ammoxidation, nitrate reduction, chitin decomposition, etc.) changed significantly with soil depth because of altered compositions of bacterial communities between two alpine ecosystems (meadow and shrub). However, there have been many studies regarding bacterial community diversity, structure, and function in soil profiles [8,9], but the soil depth gradient response of the interaction between bacteria remains largely unclear [10,11]. Within a complex ecosystem, interactions between species may be more crucial for ecosystem functions than species richness and diversity [12,13]. Consequently, it is significant to explore the interaction between soil bacteria in understanding the function of the terrestrial ecosystem.
In recent years, molecular ecology networks (MENs) have become the most effective analysis tool to reveal the relationship between bacteria and the relationship between bacteria and environment [14,15]. At present, there are many studies analyzing the molecular ecological networks of interspecific relations of bacterial communities in agricultural soil profiles [16]. However, few studies have been conducted to analyze molecular ecological networks for bacterial communities in forest soil, especially their structure in the forest soil profile.
Planted forests are an indispensable part of global forest resources, which have a critical effect on wood supply, ecological environment improvement, and climate change responses [17]. As demand for wood and awareness of ecological and environmental protection increase in China, large-scale afforestation and reforestation have made China’s artificial forest area rank first in the world, at 79.5428 million hm2 [18]. The change in forest management strategies from pursuing the single goal of wood production to improving the service quality and benefit of ecosystems and cultivating high-value native broadleaved forests has become the development trend in plantation management in subtropical China, which will gradually increase the area of native tree plantations [19,20]. Nonetheless, molecular ecological network structure and function for bacterial communities under the soil profiles in indigenous tree plantations in subtropical areas remain unclear.
In this study, we selected four typical native tree species (Pinus massoniana Lamb., Castanopsis hystrix Miq., Mytilaria laosensis Lec., and Michelia macclurei Dandy) as research objects of subtropical native tree plantations. Pinus massoniana Lamb. is one of the most important endemic coniferous timber species [21], whereas Castanopsis hystrix Miq., Mytilaria laosensis Lec., and Michelia macclurei Dandy are economically important native broadleaf timber species in subtropical China [22]. Based on bacterial 16S rRNA high-throughput sequencing data at diverse soil depths (0–20, 20–40, 40–60 cm) of each stand, molecular ecological network analysis and the functional annotation of prokaryotic taxa (FAPROTAX) function prediction approach were used for exploring the following scientific questions: (i) Does soil profile depth significantly affect the molecular ecological network structure as well as possible soil bacterial community function within native tree plantations? (ii) What are the dominant factors regulating the structural differences in the bacterial community molecular ecological network at soil profile depth? (iii) Are the dominant factors leading to functional differences in soil bacterial communities at various depths of the soil profile consistent with bacterial molecular ecological network structure? Insights into these questions will contribute to a theoretical basis for further understanding bacterial community structure and function in soil profiles of native tree plantations in subtropical regions.

2. Materials and Methods

2.1. Overview of the Study Site and Collection of Soil Samples

This study was carried out at the Experimental Center of Tropical Forestry of the Chinese Academy of Forestry (22°10′ N, 106°50′ E) in Pingxiang City, Guangxi Zhuang Autonomous Region, China. This area has a humid and semi-humid south subtropical monsoon climate with clearly separated rainy and dry seasons. The yearly rainfall can be about 1400 mm, which mostly occurs during the rainy season that extends from April to September; the yearly average temperature reaches 21 °C, and the average monthly maximal and minimal temperatures are 26.3 and 12.1 °C, respectively. Its topography primarily includes low hills and mountains (altitude, 430–680 m). The soil mainly contains red soil in line with Chinese soil classification, which is the same as oxisol in the USDA Soil Taxonomy. The soil thickness is generally greater than 80 cm [21,23].
In August 2016, four pure plantations (Pinus massoniana Lamb., Castanopsis hystrix Miq., Mytilaria laosensis Lec., and Michelia macclurei Dandy) with similar site conditions (soil type, altitude, slope, and aspect) and the same management measures were selected. Four artificial pure forests were planted (density: 2500 plants/hm2) on the cutting site of a Cunninghamia lanceolata (Lamb.) Hook. plantation. The Pinus massoniana Lamb. and Castanopsis hystrix Miq. plantations were created in 1983, whereas Mytilaria laosensis Lec. and Michelia macclurei Dandy plantations were created in 1981. This experiment set up three plots of 20 m × 20 m on every stand; intervals between plots were at least 20 m. For every plot, we chose three sampling sites at random along the left diagonal, and soil samples from the topsoil (0–20 cm), middle layer (20–40 cm), and subsoil (40–60 cm) were collected with a soil drill (5.0 cm in inner diameter). After removing impurities such as animal and plant residues and stones, the soil samples from the same layer were blended for forming the mixed sample and placed in a sterile sampling bag, which was stored in a biological ice bag before being brought to the laboratory. Fresh mixed samples were divided into three batches in the laboratory. The first batch of fresh soil samples was immediately stored in a −80 °C refrigerator after passing through a 2 mm steel sieve, for high-throughput sequencing of soil bacteria. The second batch was immediately stored in a 4 °C refrigerator after passing through a 2 mm steel sieve, for ammonium and nitrate nitrogen content detection. The third part was dried with indoor natural air and passed through a 0.25 mm sieve for determining soil physicochemical characteristics.

2.2. Soil Physicochemical Characteristic Measurement

We analyzed soil water content (SWC) according to Lu [24] and measured soil pH value with potentiometry (water-to-soil ratio of 2.5:1, v/w) ( PHS-3C laboratory pH meter, Shanghai Jinhuan Instrument Co., LTD, Shanghai, China). Additionally, the potassium dichromate oxidation method was adopted to analyze soil organic carbon (SOC) concentration, whereas an automatic chemical analyzer (Smartchem200, Alliance, Paris, France) was used for analyzing total nitrogen (TN) concentration following digestion with concentrated sulfuric acid and perchloric acid. Additionally, an automatic chemical analyzer (Smartchem 200, Alliance, France) was utilized to determine nitrate nitrogen (NO3-N) and ammonium nitrogen (NH4+-N) levels following alkali solution diffusion and calcium sulfate leaching. Sodium hydroxide alkali melting-molybdenum–antimony resistance colorimetry [24] was utilized for determining total phosphorus (TP) content, and the available phosphorus (AP) content was determined with an automatic chemical analyzer (Smartchem 200, Alliance, Paris, France) following double acid leaching.

2.3. Isolation of Soil Bacterial DNA, PCR Amplification, and High-Throughput Sequencing (HTS)

By adopting the PowerSoil®DNA Isolation Kit (Mo Bio Laboratories Inc., Carlsbad, CA, USA), we isolated soil bacterial DNA. UV–Vis spectrophotometry (Thermo Nano-Drop 2000, Thermo Fisher Scientific, Waltham, MA, USA) as well as 1.2% agarose gel electrophoresis (AGE) was conducted to verify total DNA quality. Universal primers 515F (5′-GTGCCAGCMGCCGCGGTAA-3′) and 926R (5′-CCGTCAATTCMTTTGAGTTT-3′) were utilized for amplifying the bacterial 16S rRNA gene V4-V5 region.
The gene library was constructed using PCR amplification in two steps. The first PCR amplification reaction volume consisted of 5 × buffer (10 μL), dNTP (1 μL, 10 mmol/L), F/R inner primers (1 μL, 10 μmol/L), 1U Phusion high-fidelity DNA polymerase, and 5–50 ng DNA template, topped up to 50 μL with ddH2O. The reaction was carried out under the following conditions: 2 min under 94 °C, 25 × (30 s under 94 °C, 30 s under 56 °C, and 30 s under 72 °C), and 5 min under 72 °C. Then, 2% AGE was conducted to confirm PCR products, followed by recovery with the AxyPrep DNA gel extraction kit (AXYGEN Axygen Scientific Inc., San Francisco, CA, USA) for second PCR amplification comprising 5 × buffer (8 μL), dNTP (1 μL, 10 mmol/L), Phusion high-fidelity DNA polymerase (0.8 U), F/R inner primers (1 μL, 10 μmoL/L) each, and 5 μL DNA template, topped up to 40 μL with ddH2O. The reaction conditions for the second amplification were 94 °C for 2 min, 8 × (30 s under 94 °C, 30 s under 56 °C, and 30 s under 72 °C), as well as 5 min under 72 °C. Later, 2% AGE was conducted to verify PCR products, followed by recovery using the AxyPrep DNA gel extraction kit (Axygen Scientific Inc., San Francisco, CA, USA) as well as quantification through FTC-3000TM RT-PCR. Gene library construction was completed by mixing the PCR products. Illumina MiSeq (TinyGene Bio-Tech (Shanghai) Co., Ltd., Shanghai, China) was adopted for HTS of the 16S rRNA at a 2 × 300 bp read length. The 16S rRNA gene sequencing data were deposited in NCBI SRA with BioProject ID PRJNA 886117.

2.4. Bioinformatic Analysis

According to the barcode obtained with the Illumina platform sequencing, PE was read to distinguish each sample; the sequence quality was controlled and filtered. Quality control of effective sequences was performed using Trimmomatic software. The alignment of effective sequences was completed using FLASH software (Version 1.2.11, Johns Hopkins University, Baltimore, MD, USA). Later, we aligned paired reads to one sequence based on overlapping regions among the PE reads, with the minimal overlapping length of 10 bp and a 0.2 maximal mismatch ratio within aligned sequence overlapping areas. Optimized sequences were obtained by filtering out singletons from the aligned long reads using the software package Mothur (Version 1.33.3. Ann Arbor, MI, USA)
Next, we clustered optimal sequences into operational taxonomic units (OTUs) with the USEARCH software package. Briefly, the optimized sequences were clustered at 97% similarity for obtaining typical OTU sequences using UPARSE. Subsequently, UCHIME was utilized to eliminate PCR amplification-derived chimeras from the representative OTU sequences. Finally, the Greengene (Release 13.5, http://greengenes.secondgenome.com/, accessed on 17 October 2018) database was used to compare typical OTU sequences acquired for species annotation (confidence threshold = 0.8) using Mothur (classify.seqs).
The establishment of bacterial molecular ecological networks was based on OTU information [14]. Logarithmically transformed (log10) OTU data were used for calculating Pearson correlations of any two OTUs by using the MENA platform (http://ieg4.rccc.ou.edu/MENA, accessed on 23 April 2021). By adopting random matrix theory (RMT), this step built a bacterial molecular ecological network, followed by calculation of network topology parameters, including network nodes, edges, average clustering coefficient, average degree, modularity and average path distance [25,26]. According to the node intra- and inter-module connectivity (Zi and Pi, respectively), all nodes within the network were classified into four types [27]: (i) module hub (Zi ≥ 2.5, Pi < 0.62); (ii) connector (Zi < 2.5, Pi ≥ 0.62); (iii) network hub (Zi ≥ 2.5, Pi ≥ 0.62); and (iv) peripheral nodes (Zi < 2.5, Pi < 0.62). For molecular ecological networks, network hubs, module hubs, and connectors have usually been considered key species [27]. This study visualized molecular ecological network structure using Cytoscape v3.7.1 (http://manual.cytoscape.org/en/stable/, accessed on 25 April 2021).
Functional annotation of prokaryotic taxa (FAPROTAX) can be used for predicting bacterial community functions based on OTU data of 16S rRNA, which mainly include over 7600 functional annotations in over 80 functional groups (such as methanogenesis, nitrate respiration, plant pathogens, and fermentation) obtained in at least 4600 prokaryotes [28]. FAPROTAX has become an analytical tool for studying the biogeochemical cycle and key bacterial functions of bacteria–bacteria and plant–bacteria interactions [29]. The functional groups of the bacterial communities within native plantation soil profiles were analyzed with the FAPROTAX platform (http://www.loucalab.com/archive/FAPROTAX/, accessed on 20 June 2021).

2.5. Statistical Analysis

This study utilized one-way analysis of variance (ANOVA) for detecting significance of differences in physicochemical characters of soils and functional groups of dominant bacteria among different soil layers, followed by Tukey’s HSD multiple comparisons, which were carried out with SPSS (Version 24.0, IBM, Chicago, IL, USA). Hierarchical clustering was employed to cluster the representative bacterial molecular ecological network modules, and Pearson correlation coefficients were utilized for analyzing association of soil physicochemical characters with representative modules (module characteristic OTU) within the same soil layer. These calculations were completed with the MENA platform (http://ieg4.rccc.ou.edu/MENA, accessed on 23 April 2021). We used the Pearson correlation coefficient to determine which physicochemical factors were associated with the soil bacterial community functional groups.

3. Results

3.1. Alterations of Soil Physicochemical Character in Native Tree Plantations

The SWC, SOC, TN, NO3-N, NH4+-N, AP, and TP of native tree plantations declined as soil depth increased (Table 1). Topsoil SWC remarkably increased compared with the other two soil layers (p < 0.05), but the middle layer was not significantly different compared with the subsoil (p > 0.05). SOC, TN, and NO3-N significantly differed among the three soil layers. Topsoil NH4+-N was remarkably elevated within the subsoil; however, the middle layer was not significantly different compared with the topsoil and subsoil. TP in the topsoil and middle layer did not exhibit any significant difference, but both were remarkably elevated compared with the subsoil. The different amounts of AP among the three soil layers were not significant.

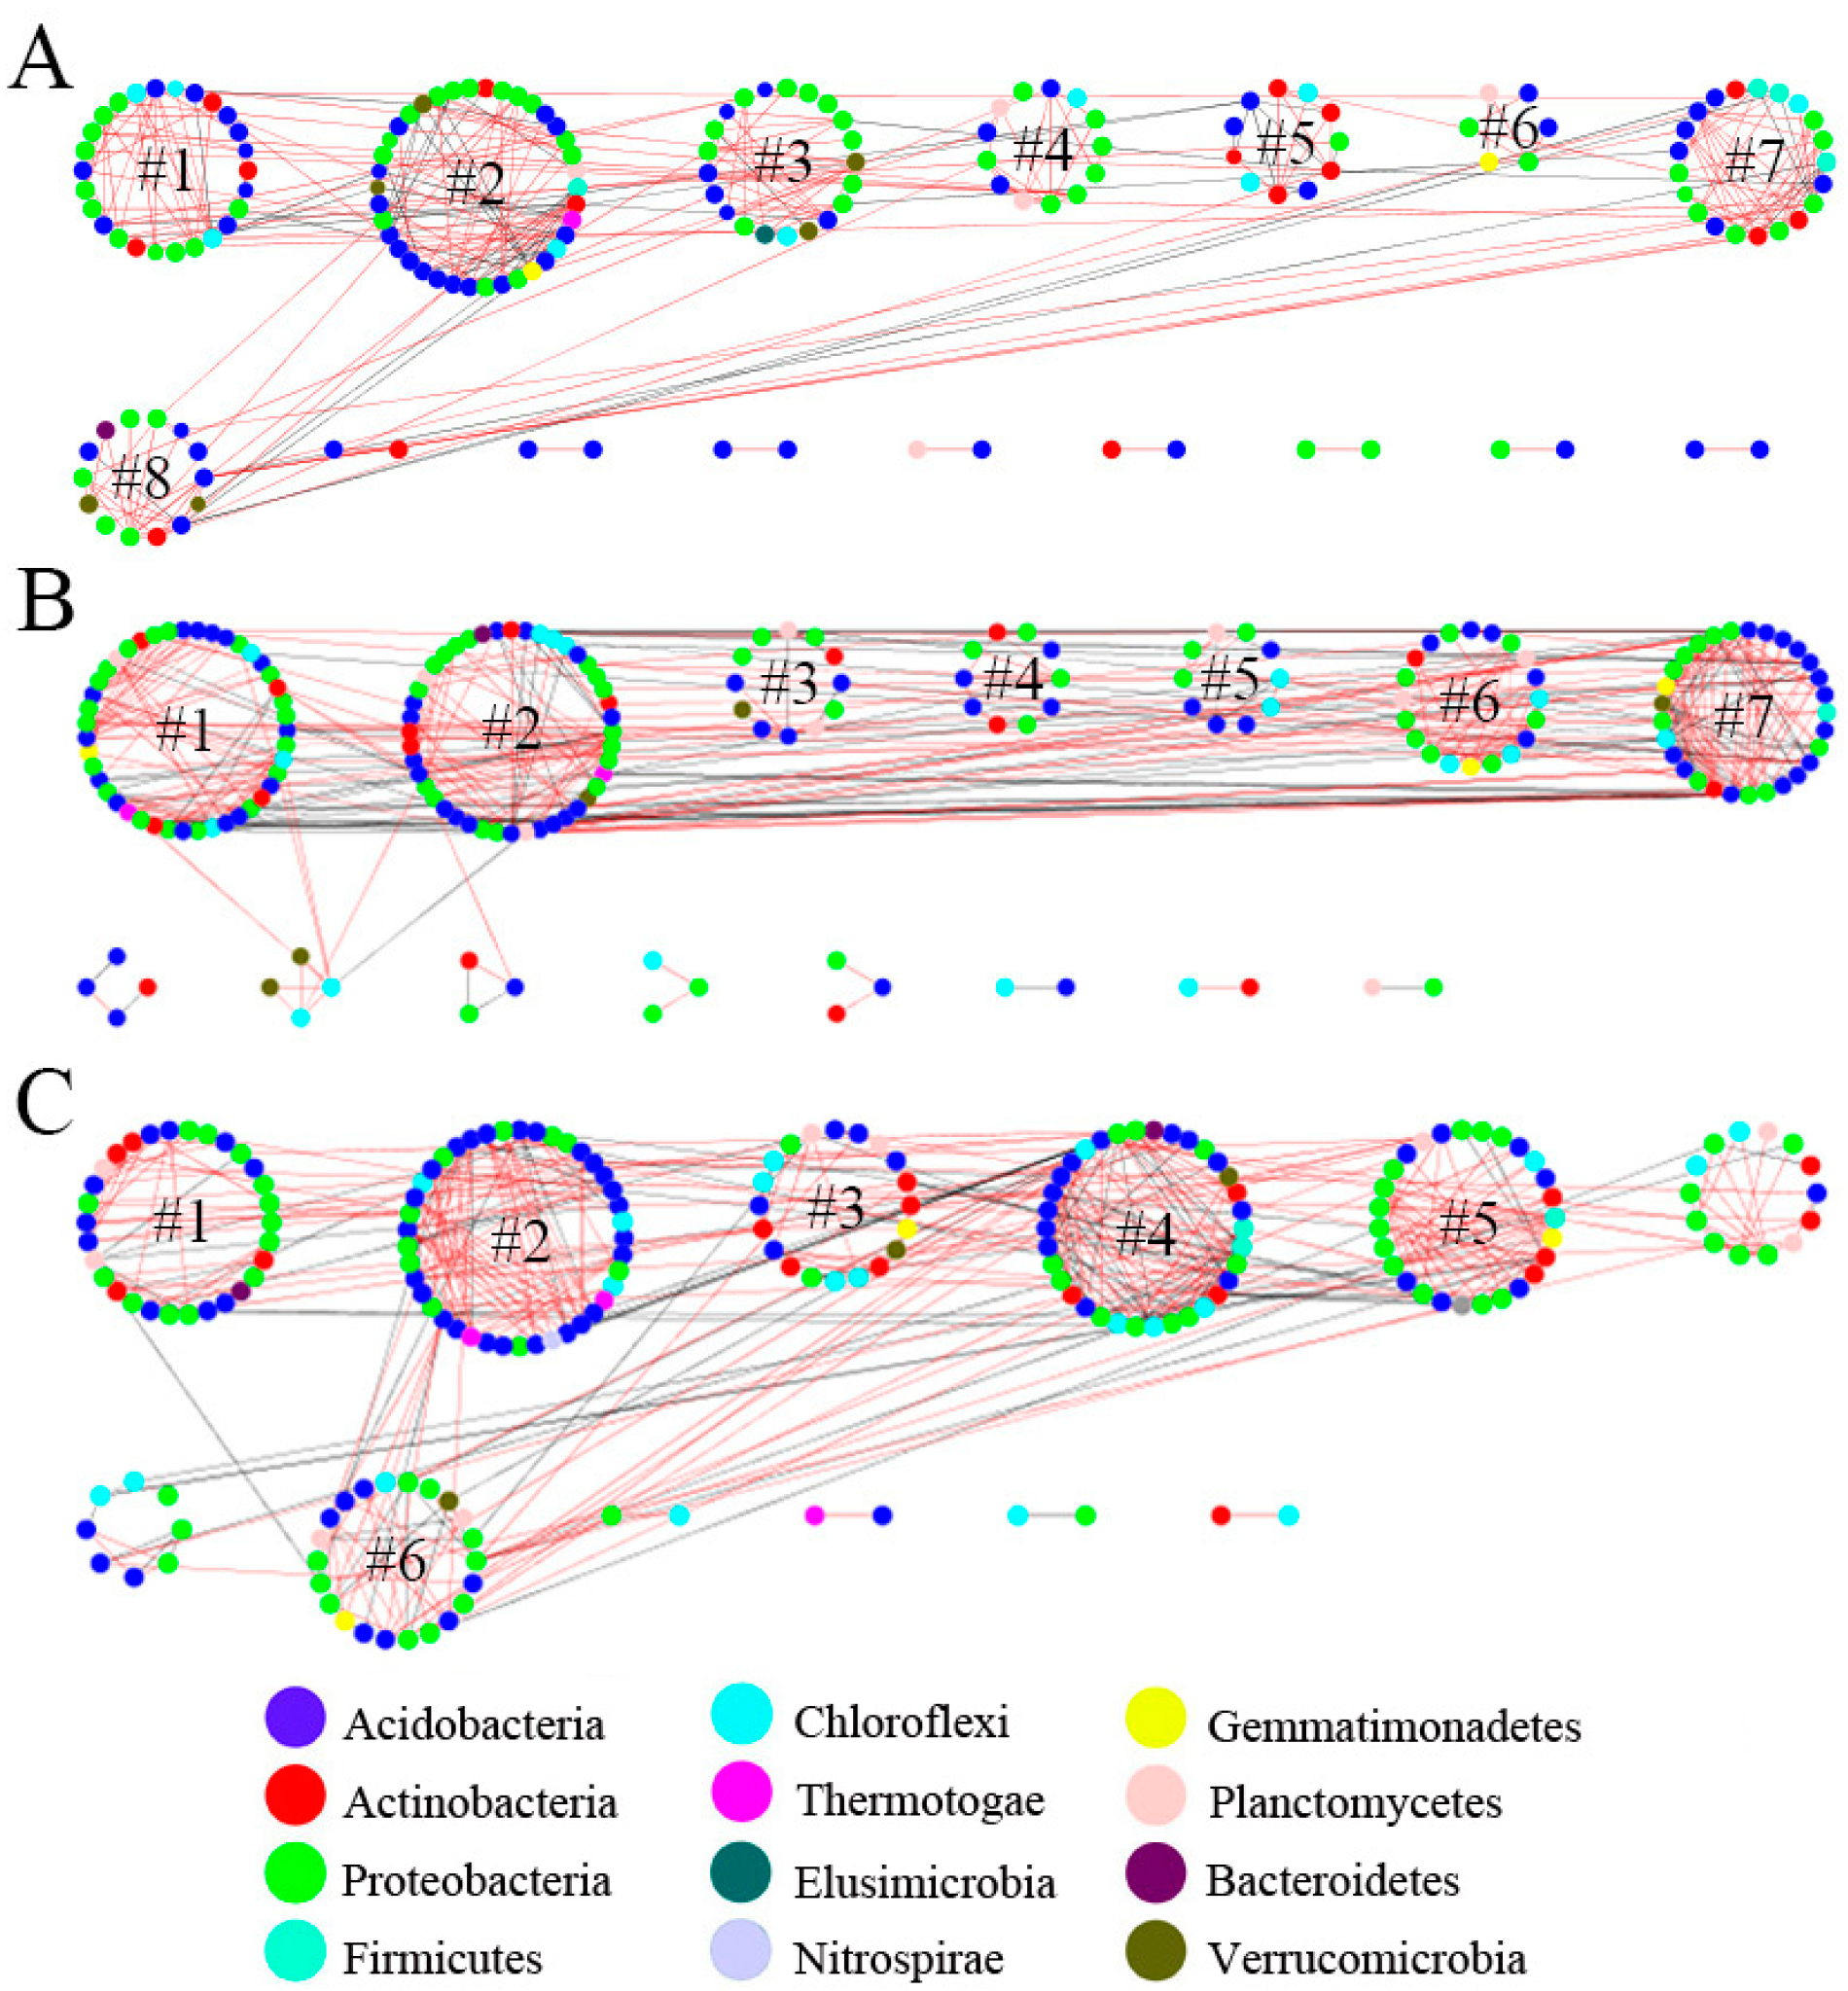
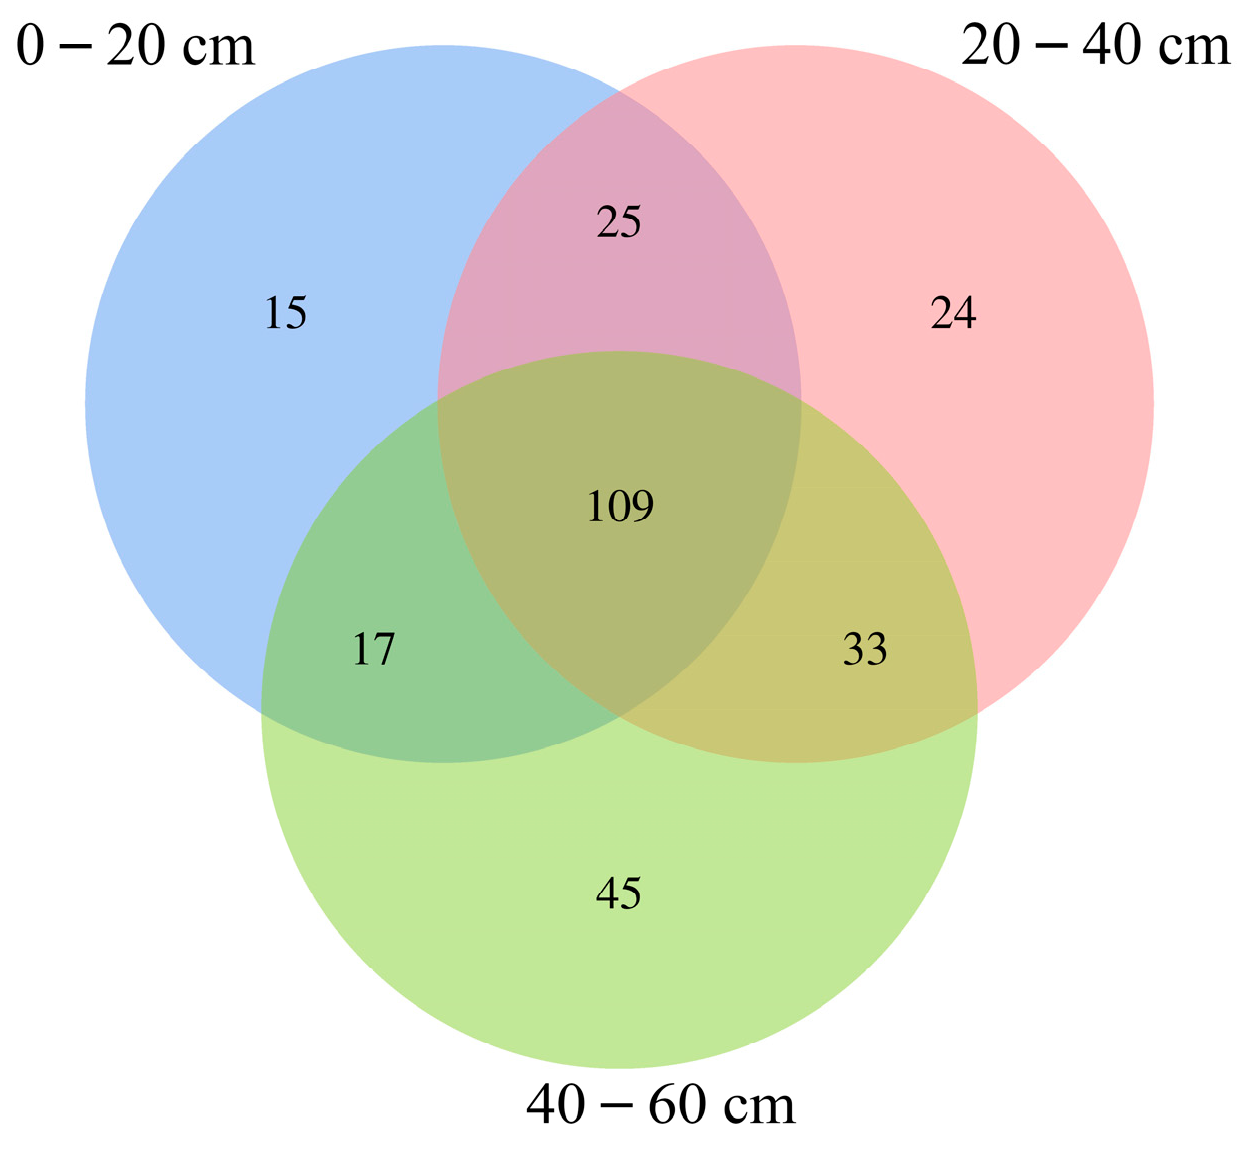
3.2. Characteristics of Bacterial Molecular Ecological Network Structure within Soil Profiles of Native Tree Plantations

The network topology parameters showed that the threshold value for the soil bacterial molecular ecological network in three soil layers was 0.760, and R2 of the power law was around 0.8 (Table 2), in line with the power law [13]. Additionally, average path distance and average clustering coefficient, together with the modularity index for the bacterial molecular ecological network in each soil layer increased compared with those in a random network, which indicated that these three bacterial molecular ecological networks built in this study conform to basic network features, including small world, scale-free, and modular [13].
Topological parameters for the soil bacterial molecular ecological network among the three soil layers showed that the total links, total nodes, and average clustering coefficients were as follows: topsoil < middle layer < subsoil. The average degree was as follows: topsoil < subsoil < middle layer, and the average path distance and modularity index were topsoil > subsoil > middle layer (Table 2 and Figure 1). Meanwhile, the positive connections for the soil bacterial molecular ecological network within the topsoil, middle layer, and subsoil accounted for 78.98%, 70.70%, and 66.28% of the total edges, respectively.

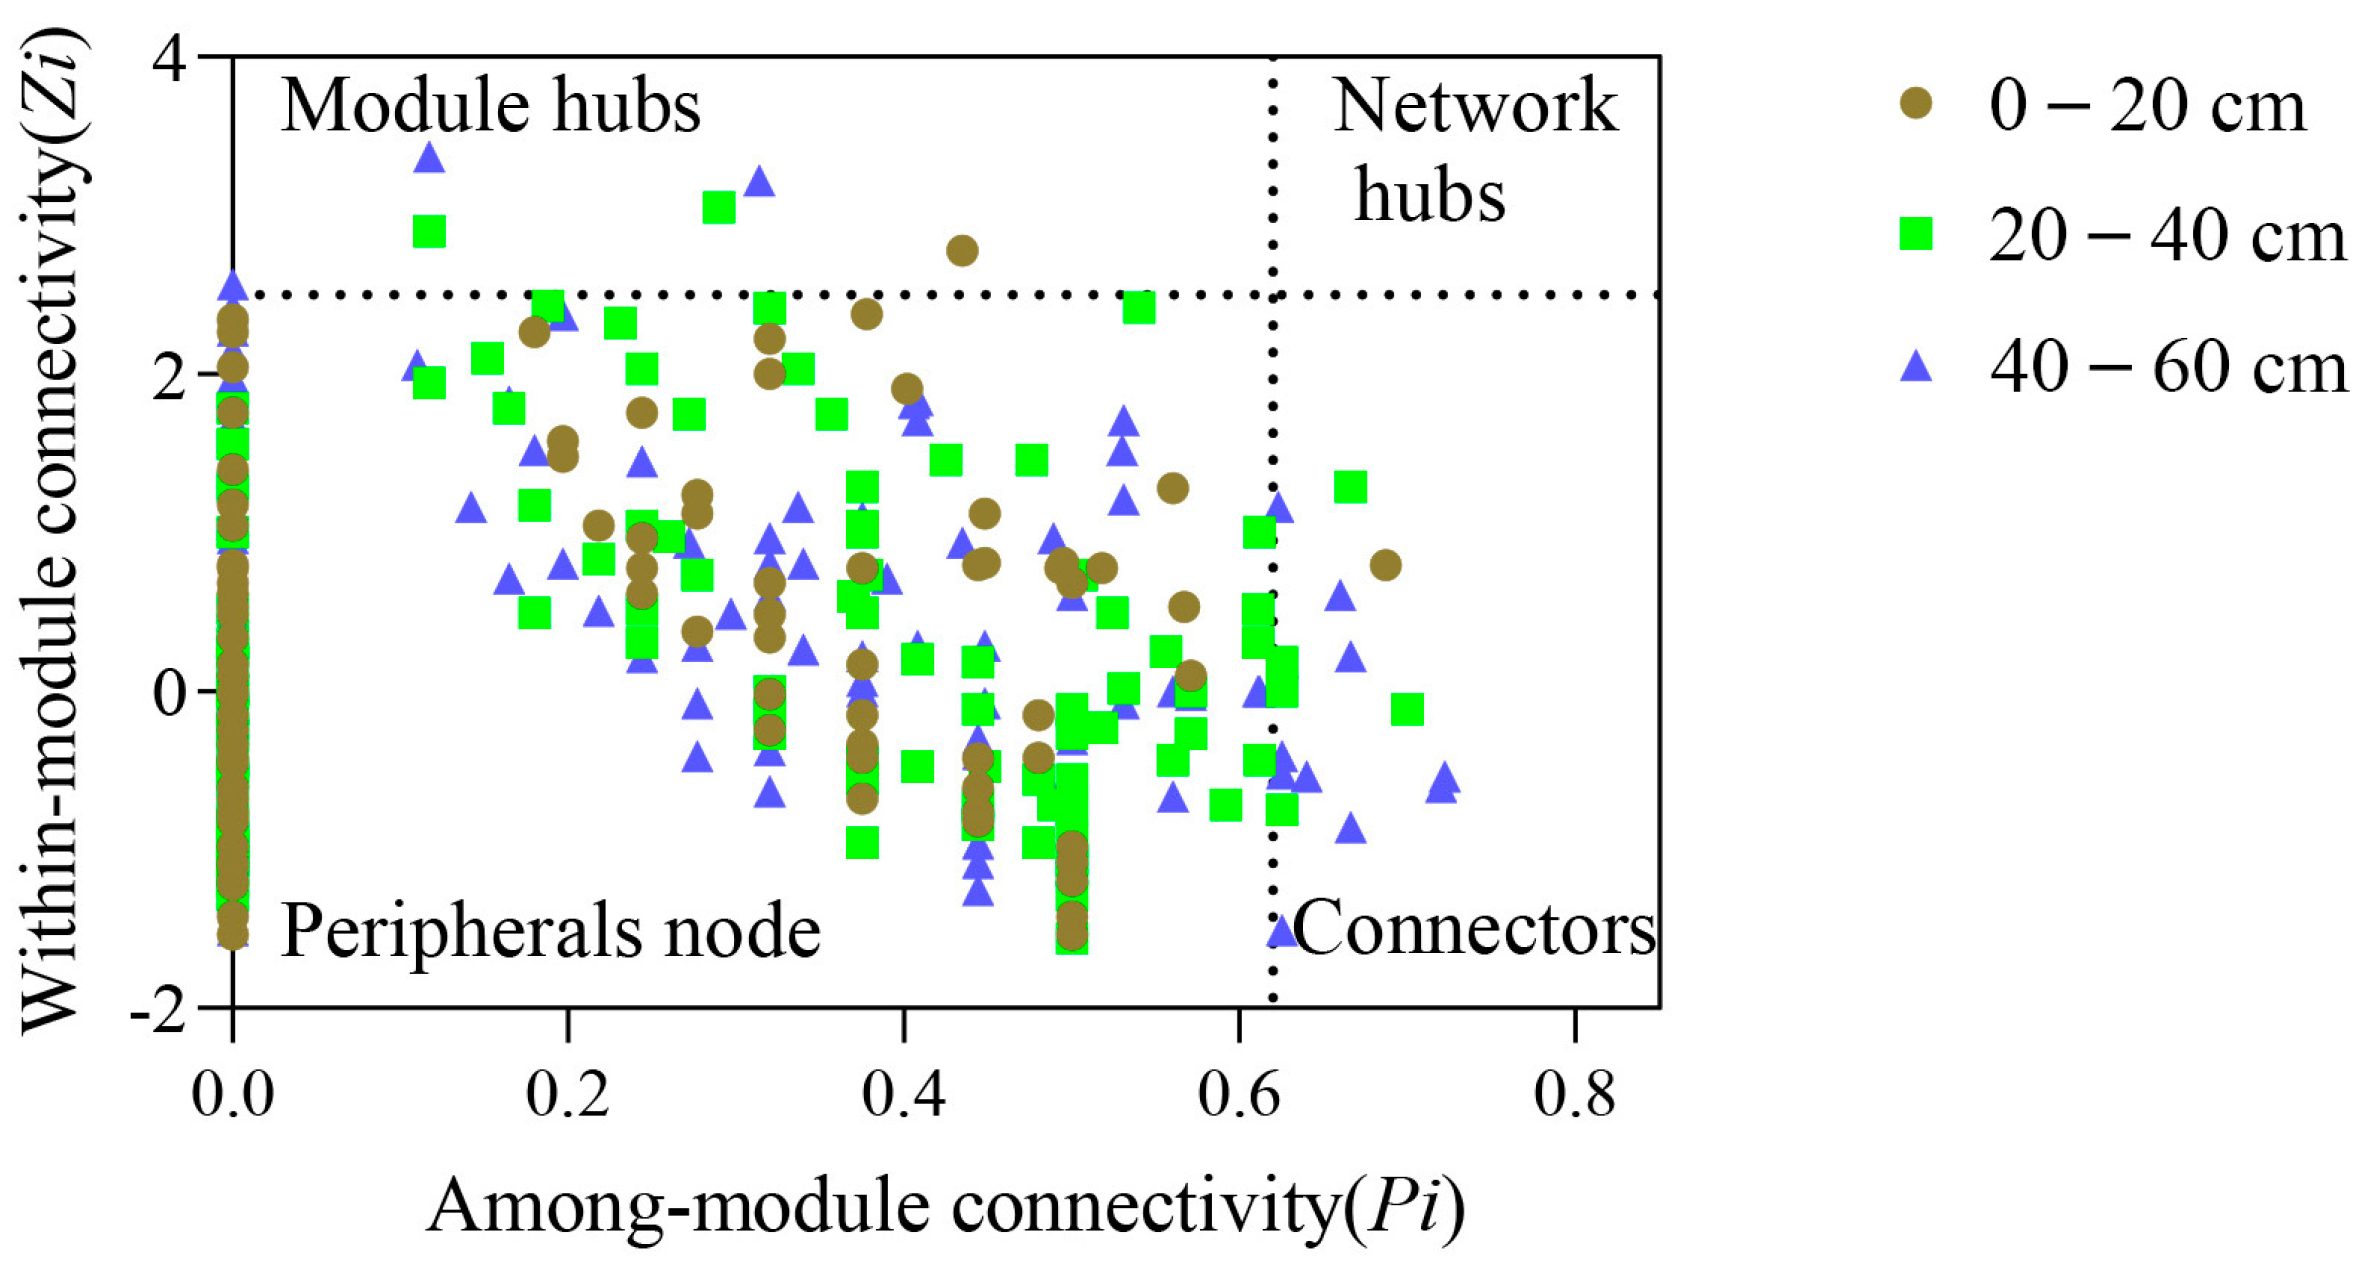
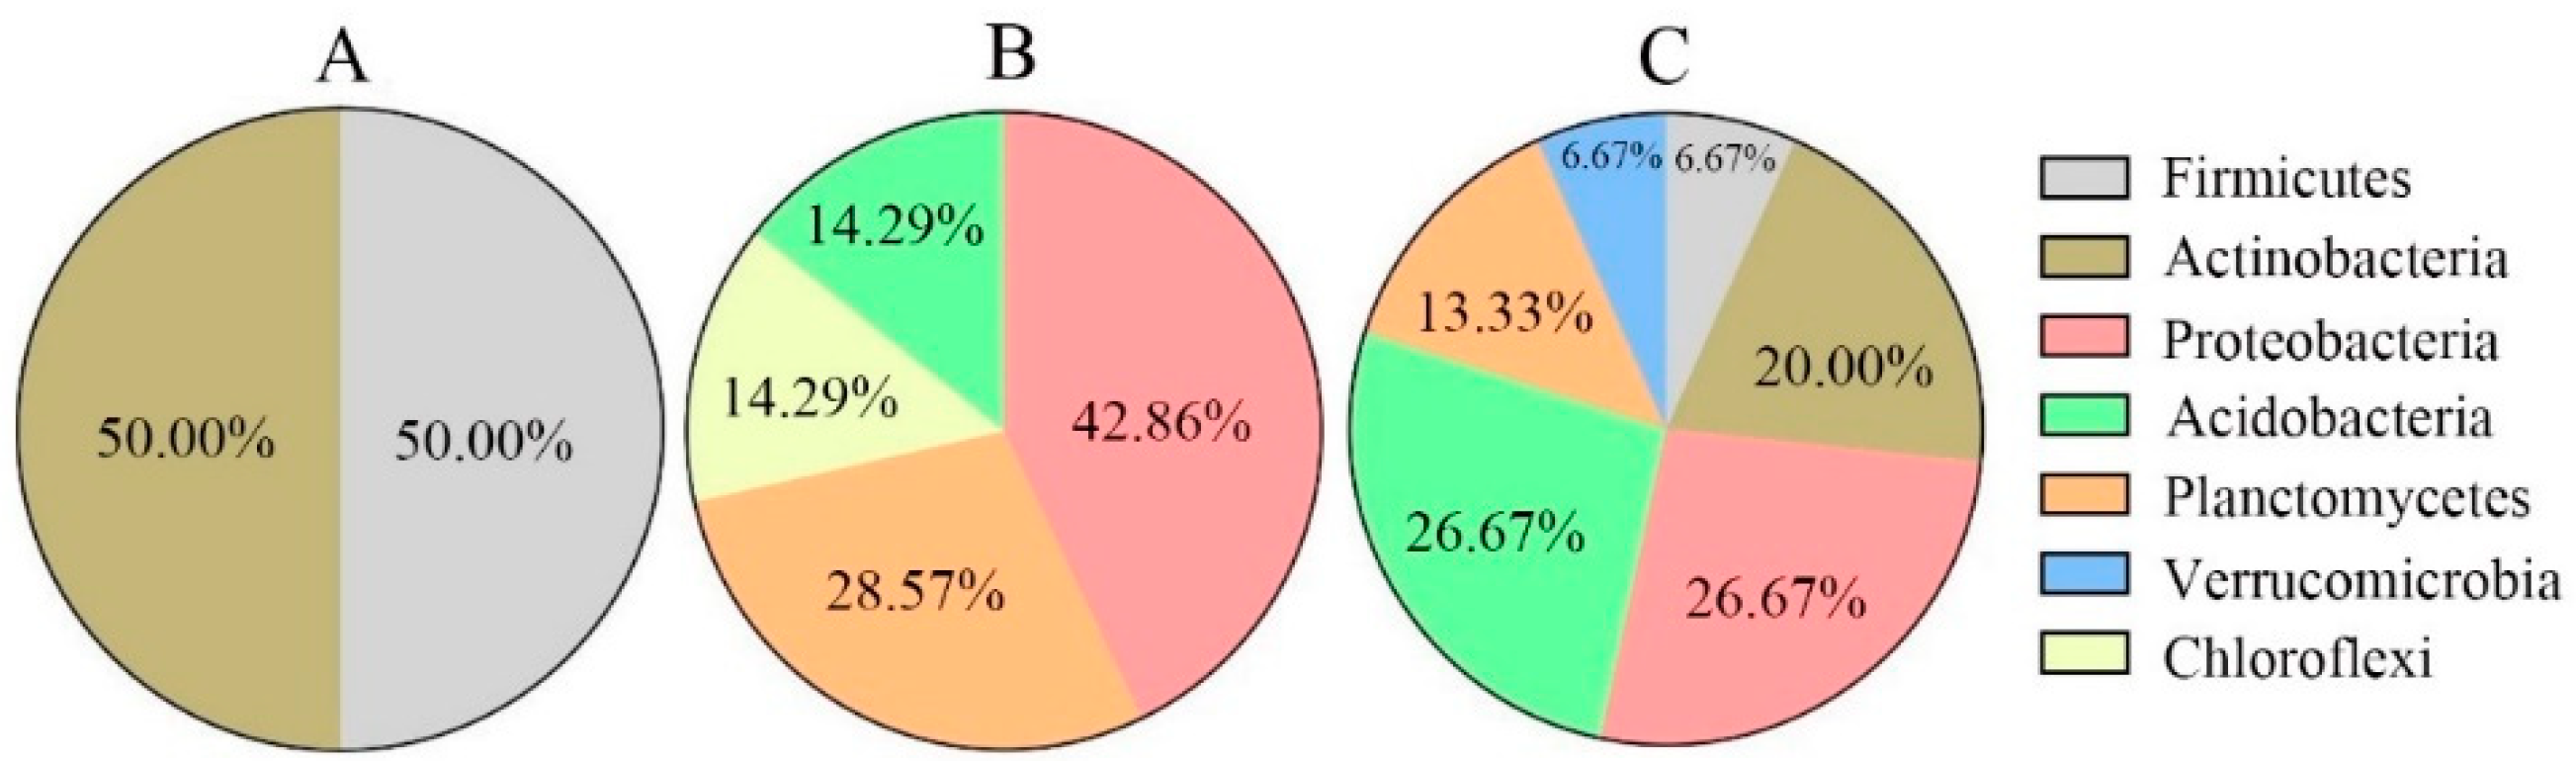
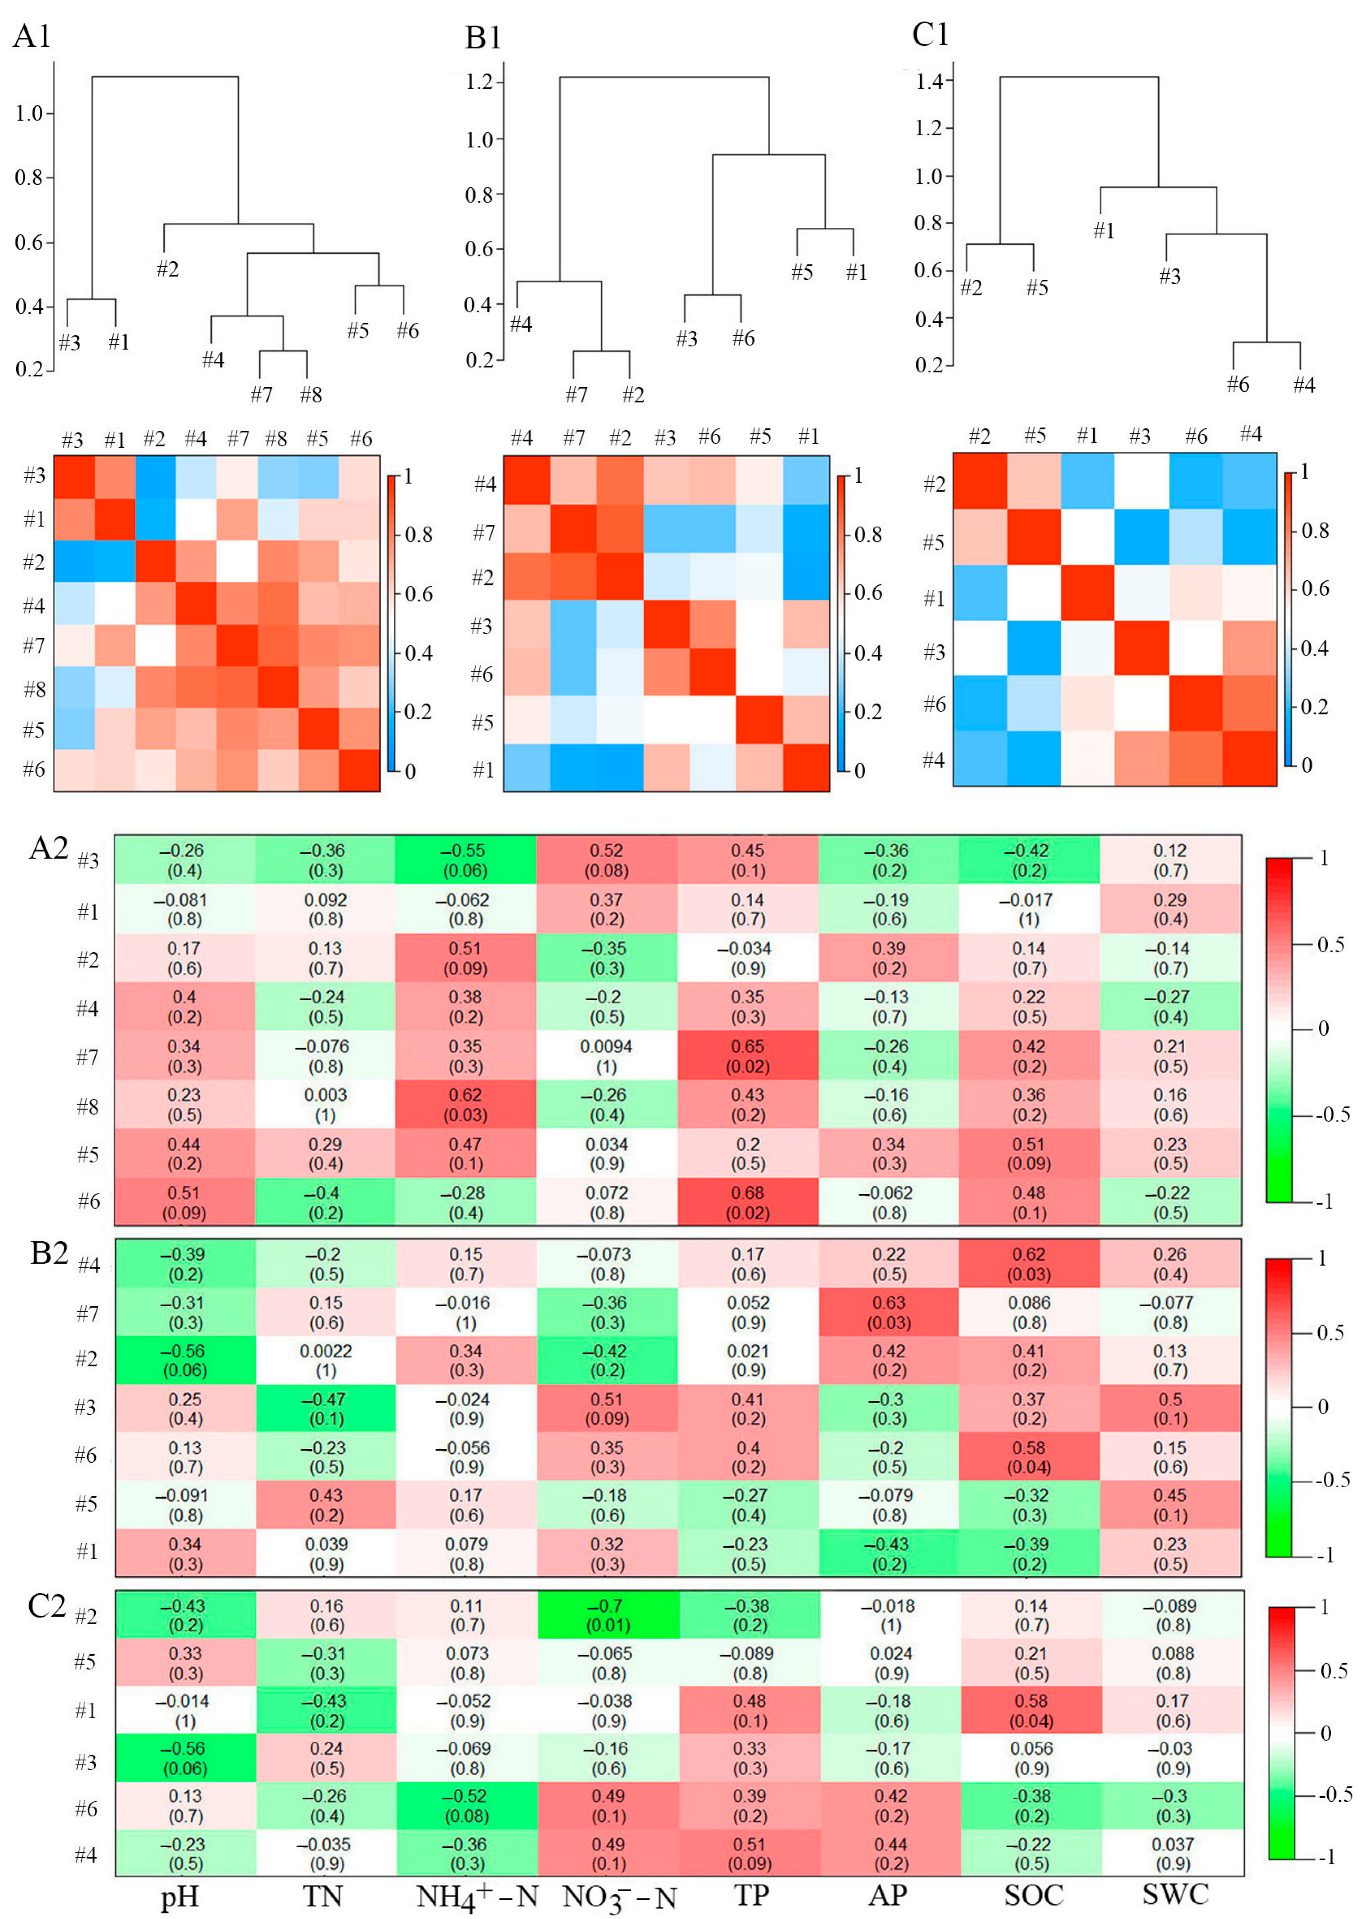
3.3. Topological Functions of Bacterial Molecular Ecological Network Nodes within Soil Profiles of Native Tree Plantations

The soil bacterial molecular ecological network (OTU level) showed 268 non-repeating nodes in the three soil layers (Figure 2). Among them, there were 109 shared nodes in the three soil layers and 15, 24 and 45 unique nodes in the surface, middle, and bottom layers, respectively. Further statistics revealed that peripheral nodes were dominant in all soil layers (topsoil: 98.80%; middle level: 96.34%; subsoil: 92.65%) without network hubs (Figure 3). There were two key nodes on the soil surface, one module hub, and one connector, that belonged to Actinobacteria and Firmicutes, respectively (each accounting for 50.00%) (Figure 3 and Figure 4A). There were seven key nodes in the middle layer, including two module hubs and five connectors, belonging to four bacterial phyla, of which Proteobacteria accounts for the largest proportion (42.86%), followed by Planctomycetes (28.57%); Chloroflexi was the key endemic bacteria (Figure 3 and Figure 4B). There were fifteen key nodes in the subsoil, including three module hubs and twelve connectors that belonged to six bacterial phyla: Proteobacteria (26.67%), Acidobacteria (26.67%), Actinobacteria (20.00%), Planctomycetes (13.33%), Firmicutes (6.67%), and Verrucomicrobia (6.67%) (Figure 3 and Figure 4C).

3.4. Functions of Soil Physicochemical Characteristics in Bacterial Molecular Ecological Network Structure

From the view of the module hierarchy among the bacterial molecular ecological networks in each soil layer, modules 1 and 3 were closely related; modules 5 and 6 were closely related; modules 4, 7, and 8 were closely related; and module 2 was different from the other modules in the topsoil (Figure 5(A1)). Modules 2, 4, and 7 were closely linked; modules 1 and 5 were closely linked; and modules 3 and 6 were closely linked in the middle layer (Figure 5(B1)). Modules 2 and 5 were closely connected; modules 3, 4, and 6 were closely connected; and module 1 was distinctly different from the other modules in the subsoil (Figure 5(C1)).
The effects of physicochemical characteristics of soil on bacterial molecular ecological network structure were different among different soil layers. In the topsoil, NH4+-N showed a significantly positive relation to module 8 (r = 0.62, p < 0.05), whereas TP showed a significantly positive relation to module 6 (r = 0.68, p < 0.05) and module 7 (r = 0.65, p < 0.05) (Figure 5(A2)). In the middle layer, AP showed a significantly positive relation to module 7 (r = 0.63, p < 0.05), whereas SOC showed a significantly positive relation to module 4 (r = 0.62, p < 0.05), together with module 6 (r = 0.58, p < 0.05) (Figure 5(B2)). In the subsoil, NO3-N showed a significantly negative relation to module 2 (r = −0.7, p < 0.05), while SOC showed a significantly positive relation to module 1 (r = 0.58, p < 0.05) (Figure 5(C2)). Overall, SOC, NO3-N, NH4+-N, AP, and TP accounted for dominant parameters that affected bacterial molecular ecological network structure within the soil profile.

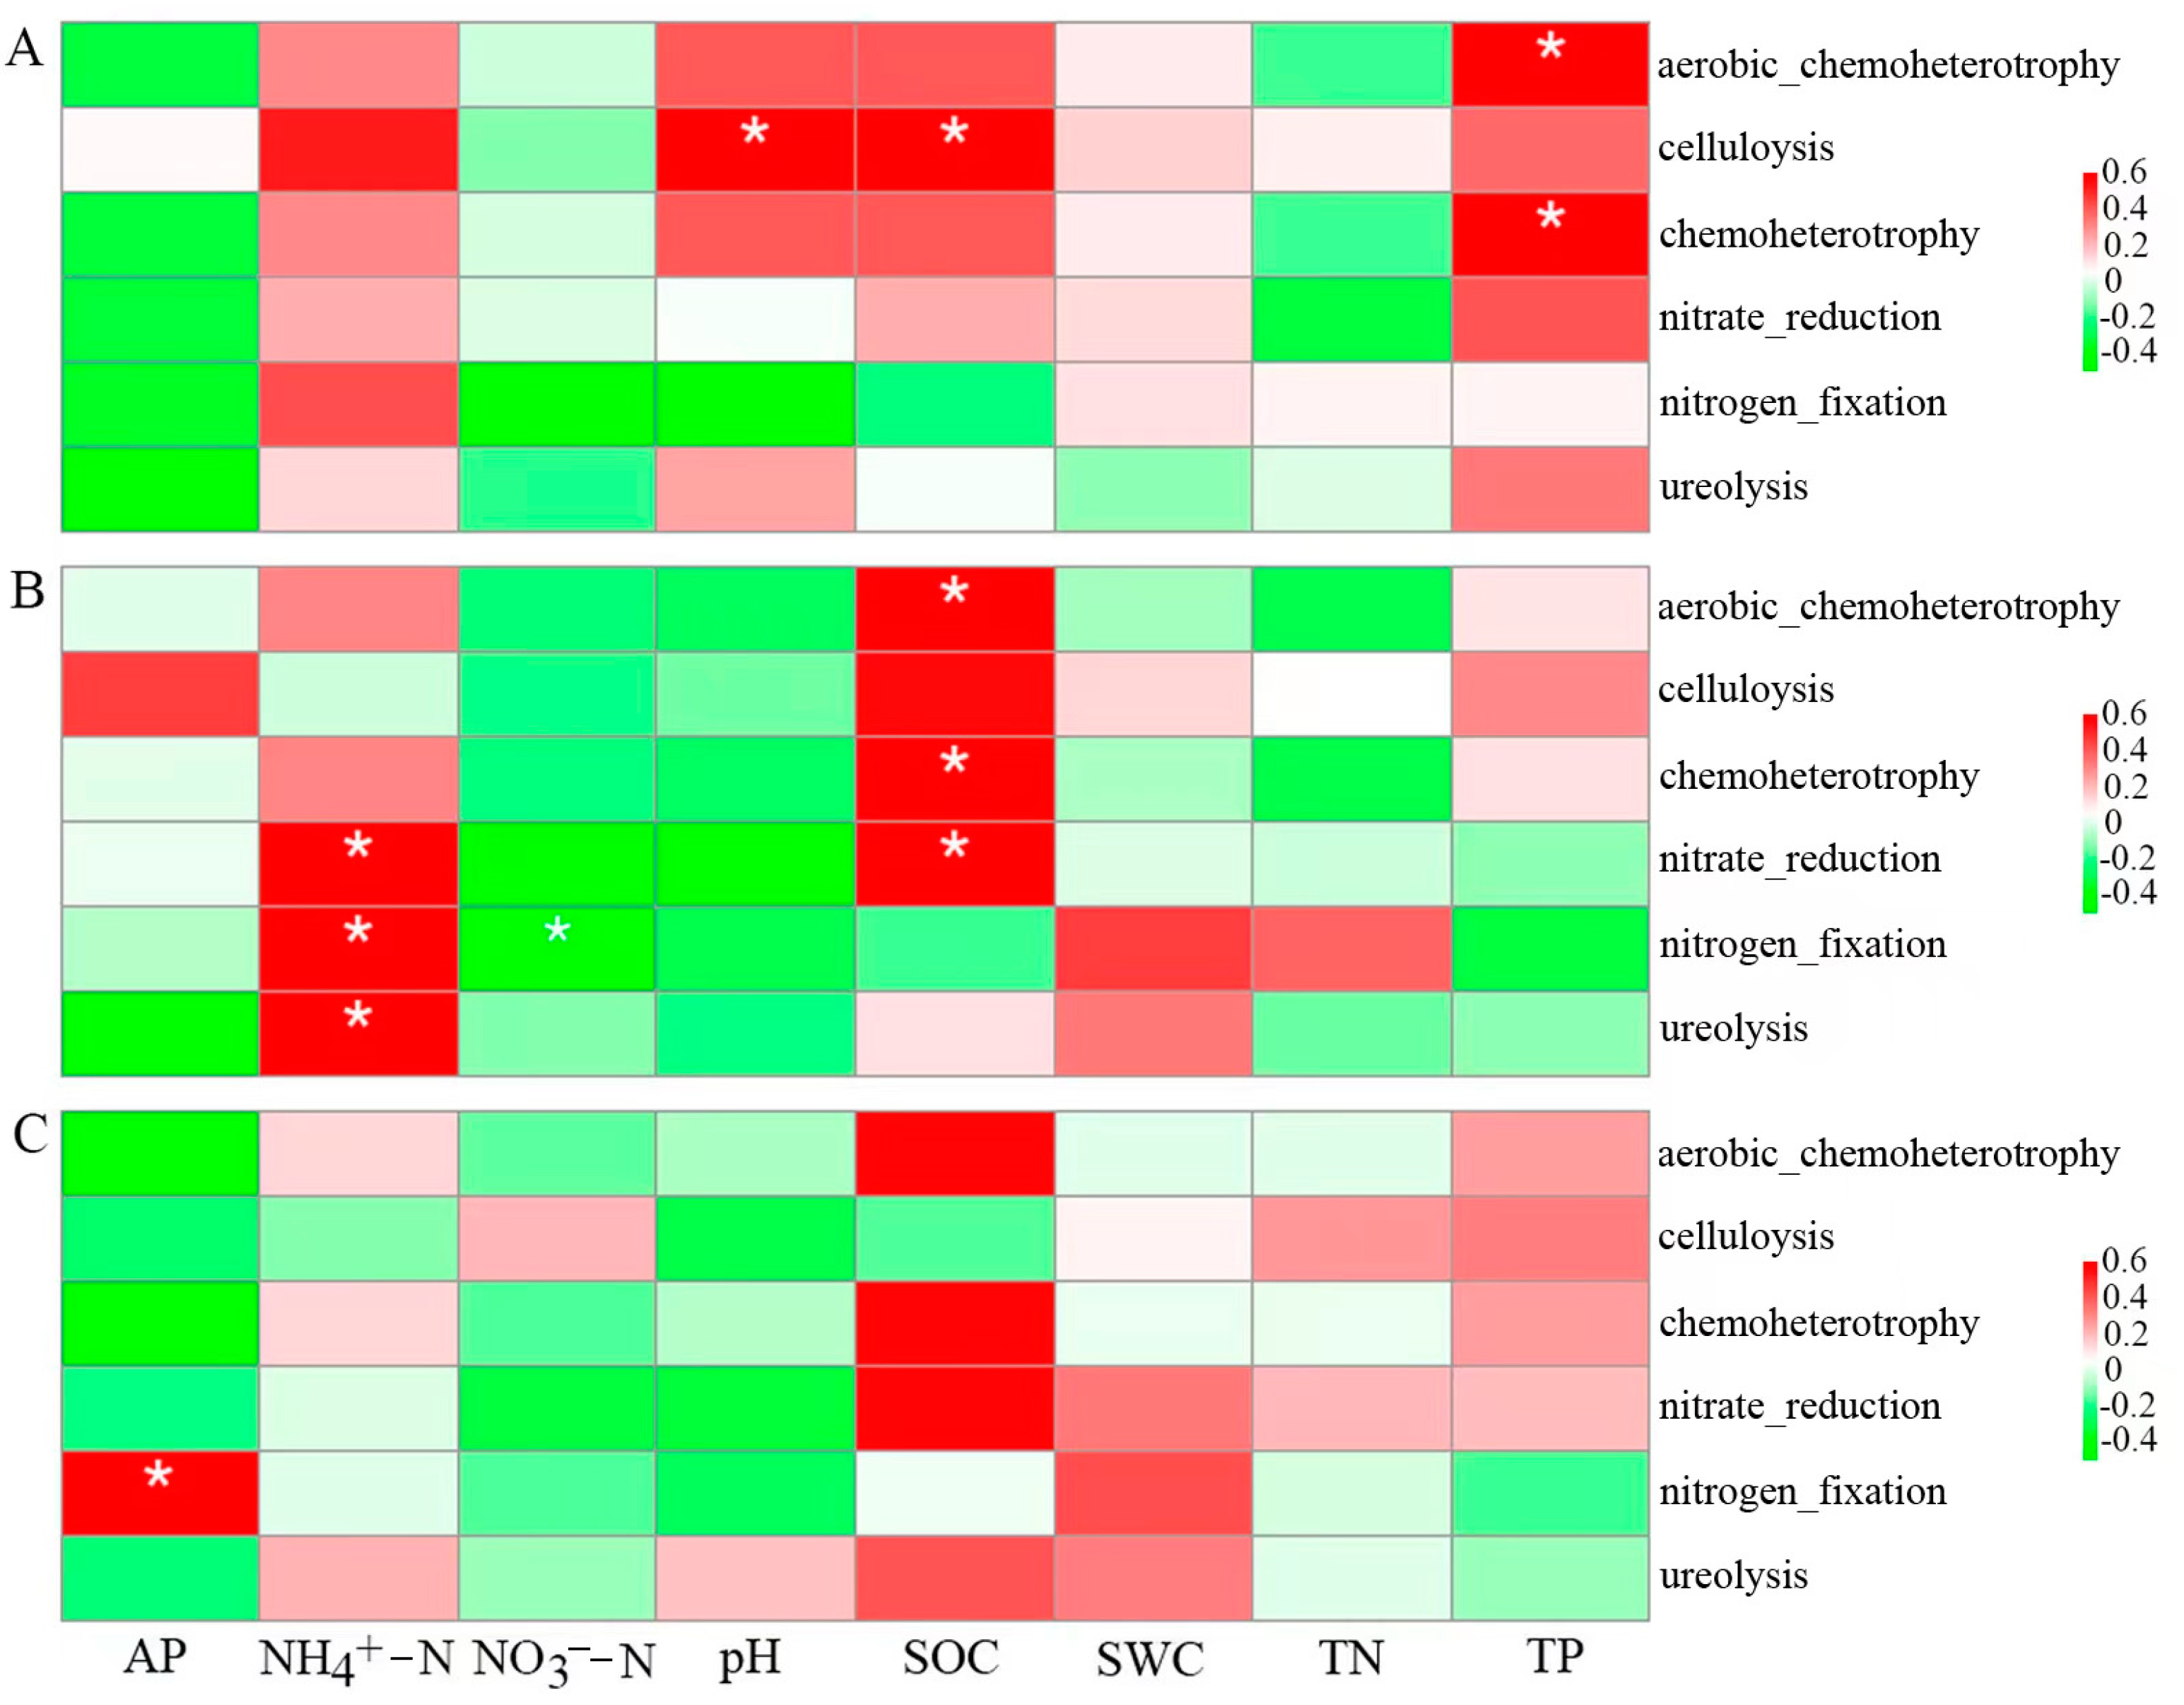
3.5. FAPROTAX Bacterial Functional Estimation within the Soil Profile in Native Tree Plantations

Results of soil bacterial community functional group annotation showed that the number of functional groups of the topsoil, middle layer, and subsoil were 43, 46, and 46, respectively, and the relative abundances of identified OTUs were 65.1426%, 55.6798%, and 58.5035%, respectively (Table 3). Based on a relative abundance greater than 0.5% in each soil layer, the six dominant functional groups of the soil bacterial community were determined as follows: chemoheterotrophic, aerobic chemoheterotrophic, cellulolysis, urea hydrolysis, nitrogen fixation, and nitrate reduction. ANOVA revealed that different soil layers were not significantly different in chemoheterotrophic, aerobic chemoheterotrophic, cellulolysis, nitrogen fixation, and nitrate reduction (p > 0.05). Urea hydrolysis within topsoil was remarkably elevated compared with the middle layer and subsoil (p < 0.05), but the latter two were not significantly different (p > 0.05) (Figure 6).
Pearson correlation analysis further showed that soil physicochemical properties had different effects on the dominant bacterial functional groups in each soil layer (Figure 7). In the topsoil, chemoheterotrophic and aerobic chemoheterotrophs were significantly positively correlated with soil TP (p < 0.05), and cellulolysis was significantly positively correlated with soil pH and SOC (p < 0.05) (Figure 7A). In the middle layer, chemoheterotrophic, aerobic chemoheterotrophic, and nitrate reduction were significantly positively correlated with SOC (p < 0.05); nitrate reduction, nitrogen fixation, and urea hydrolysis were significantly positively correlated with soil NH4+-N (p < 0.05); and nitrogen fixation was significantly negatively correlated with NO3-N (p < 0.05) (Figure 7B). Subsoil nitrogen fixation was significantly and positively correlated with AP (p < 0.05) (Figure 7C). Overall, soil pH, SOC, NH4+-N, NO3-N, TP, and AP were the dominant factors affecting the dominant functional groups of the bacterial communities in the soil profile.

4. Discussion

4.1. Function of Soil Profile Depth in Bacterial Molecular Ecological Network Structure

We found that edge and numbers, along with negative connections of soil bacterial molecular ecological networks within native tree plantations increased with increasing soil depth (Table 2 and Figure 1), which indicated a larger soil bacterial molecular ecological network scale [25] and stronger competition among subsoil bacteria [30]. Mundra et al. showed that numbers of negative connections of soil bacterial molecular ecological networks in Betula pubescens forests in Norway increased with increasing soil depth [31], conforming to our findings. The reason may be that nutrients (SWC, SOC, TN, NO3-N, NH4+-N, AP and TP) decreased with increasing soil depth (Table 1), resulting in relatively limited nutrients in the subsoil, promoting the succession of bacterial communities with more efficient nutrient utilization efficiency [32,33]. Competition between bacteria is reduced in soils with relatively abundant nutrients [34], whereas bacteria need to meet their own needs through stronger competition in relatively scarce resources [35].
Average connectivity and clustering coefficient represent the molecular ecological network complexity and community organization order, respectively. The above indexes in the middle layer and subsoil in native tree plantations significantly increased compared with topsoil, which suggested a more complex and organized bacterial molecular ecological network and community organization in the middle and subsoil layers than those in the topsoil (Table 2 and Figure 1). Xu et al. revealed that the average clustering coefficient of topsoil (0–20 cm) in a Tibetan Plateau meadow was lower than that of subsoil (30–70 cm) [7]. Further, these two indices of farmland elevated with an increase in soil depth in Tianjin, China [16]. These results were consistent with those of this study.
Network average path distance represents the matter/energy/information transfer efficiency between the species. A smaller average path distance indicates greater matter/energy/information transfer efficiency between species; however, the response to disturbance is also more sensitive. The modularity index is a measure of the degree of modularity of a network structure and is commonly used to represent the system’s resistance to external interference. The higher the modularity index, the stronger the resistance to external interference [25]. According to our results, for the bacterial molecular ecological network, average path distance and modularity index in the topsoil of native tree plantations were significantly greater than those in the middle layer and subsoil (Table 2 and Figure 1), conforming to the study by Bai et al. [36] on the modularity index of bacterial network structure in paddy soil, indicating that topsoil bacterial community structure remained relatively stable when the external environment changed; however, the bacterial community structure in the other two soil layers was easily disturbed.
Module connectors and hubs represent the key species during community composition and have a critical effect on keeping community structural stability [27]. Their removal can cause significant changes in structures and functions of bacterial communities [37]. In this study, we found that the modular hubs and connectors of soil bacteria networks on plantations increased with increasing soil depth (Figure 3), indicating the relative stability of topsoil bacterial communities. However, more modular hubs and connectors were needed in the middle and bottom layers for maintaining bacterial community structural stability. Meanwhile, Firmicutes and Actinobacteria represented key phyla within the topsoil; Proteobacteria, Planctomycetes, Acidobacteria, and Chloroflexi within middle layer; and Proteobacteria, Acidobacteria, Actinobacteria, Planctomycetes, Firmicutes, and Verrucomicrobia within the subsoil (Figure 4). This is because Firmicutes, Actinobacteria, Proteobacteria, and Acidobacteria were relatively abundant in each soil layer (Figure 4) and were more likely to survive under environmental interference and participate in constructing the molecular ecological network structure [38]. Additionally, different types of bacteria have varied life forms and functions. For example, Acidobacteria have a slow metabolism and easily become key species when their living environment is affected. They are all important participants in biochemical cycling processes such as carbon and nitrogen cycling in the soil. Firmicutes can improve the phosphorus content in the soil as phosphate-solubilizing bacteria and participate in nitrogen fixation [39] and have an important effect on lignocellulose degradation [40]. Actinobacteria are often involved in the degradation of some stable polymer compounds, such as lignin and cellulose, and also have a crucial effect on soil carbon source decomposition [41,42]. Chloroflexi promote starch degradation and accelerate the anti-interference ability of functions related to the carbon cycle [43].
Soil physicochemical characteristics such as soil carbon, nitrogen, and phosphorus content are the main energy sources and nutrients of soil bacteria [44] and are also key factors that regulate different structures of soil bacterial communities among different soil layers [45]. This study found that soil NH4+-N and TP were critical factors that affect topsoil bacterial molecular ecological network structure, while SOC and AP were the key factors affecting the bacterial molecular ecological network structure within the middle layer; additionally, SOC and NO3-N accounted for critical factors that affected subsoil bacterial molecular ecological network structure (Figure 5). Based on the results, bacterial molecular ecological network structures among different soil layers were significantly affected by soil physicochemical characteristics such as SOC, NO3-N, NH4+-N, TP, and AP, partially conforming to earlier observations from subtropical broadleaved forests [46] and dryland-to-paddy conversion [47] in China.

4.2. Function of Soil Profile Depth in Soil Bacterial Community Function

Soil bacteria represent soil microbial groups with the highest complexity and diversity, whose potential functions are crucial for forest productivity [48]. They can directly participate in a variety of ecosystem service processes related to biogeochemical cycles, including carbon and nitrogen cycles [49]. In this study, chemoheterotrophy and aerobic heterotrophy had the highest abundance in each soil layer, indicating that numerous bacteria obtain energy and carbon by means of soil organic matter decomposition [50,51]. Pearson correlation analysis further found that chemoheterotrophy and aerobic heterotrophy showed a markedly positive relation to SOC (p < 0.05), indicating that alterations of the soil carbon pool is the possible major factor driving soil bacterial functional group function [52]. In addition, cellulolysis was markedly positively related to soil pH (p < 0.05), indicating that an increase in soil pH could improve the abundance of cellulolysis and hence, promote carbon cycling. Liang et al. found that the soil pH of different land use modes (natural secondary forest, shrub, coniferous forest, pine, and farmland) had a significant impact on the cellulose hydrolysis type among eastern mountain regions in Liaoning province, China [53], conforming to our findings.
More than 80% of global nitrogen emissions can be attributed to soil microbial activity [54], mainly soil bacteria-mediated soil nitrogen cycles, including aerobic nitrification and anaerobic denitrification [55]. In this study, the three dominant functional groups (ureolysis, nitrogen fixation, nitrate reduction) were involved in soil nitrogen cycling (nitrogen fixation, nitrification, denitrification, etc.). Ureolysis was significantly different among the topsoil, middle layer, and subsoil (p < 0.05), but the middle layer was not significantly different from subsoil (p > 0.05). Nitrogen fixation and nitrate reduction were not significantly different in each soil layer (p > 0.05). Xu et al. found that ureolysis of shrubs in the Tibetan Plateau changed significantly depending on soil profile (p < 0.05), while nitrate reduction did not exhibit any significant difference in all soil layers (p > 0.05) [7], conforming to our findings. Pearson correlation analysis further found that nitrogen fixation, ureolysis, and nitrate reduction were significantly correlated with SOC, NH4+-N, NO3-N, and AP. Previous studies have also shown various soil physicochemical characteristics (e.g., SOC, pH, NH4+-N, and NO3-N) significantly affected the soil bacteria-driven N cycle process [53].
Overall, this study only discussed the molecular ecological network structure and potential function of a bacterial community in the soil profile of forest plantations in summer and could not reflect the effect of seasonal changes on the structure and function of the soil bacterial community.

5. Conclusions

The soil bacterial molecular ecological network structure experienced remarkable changes owing to variation in soil chemical properties in subtropical native plantations. The molecular ecological network structure in middle and bottom soil layer bacteria displayed increased complexity compared with topsoil, and the interactions between bacteria were strong. The dominant functional groups of the bacteria involved in carbon and nitrogen cycling in each soil layer were chemoheterotrophy, aerobic chemoheterotrophy, cellulolysis, nitrogen fixation, ureolysis, and nitrate reduction. SOC, NO3-N, NH4+-N, AP, and TP accounted for major factors that regulated differences in molecular ecological network structure and dominant bacterial functional group abundances among the diverse soil layers. Future studies may focus on the effects of seasonal variation on the molecular ecological network structure and potential function of the soil bacterial community under the planted forests in this region, which will contribute to a comprehensive understanding of the structure and function of the soil bacterial community in forest plantations.

Author Contributions

Conceptualization, L.Q. and Y.W.; methodology, L.Q. and Y.W.; software, Y.W., S.X., Z.X. and J.T.; validation, L.Q. and Y.W.; formal analysis, L.Q.; investigation, L.Q. and A.M.; writing—original draft preparation, L.Q. and Y.W.; writing—review and editing, L.Q. and Y.W.; funding acquisition, L.Q. and L.T. All authors have read and agreed to the published version of the manuscript.

Funding

This research was funded by the National Natural Science Foundation of China (No. 31560109) and the Guangxi Natural Science Foundation of Guangxi Province (No. 2016JJA130091).

Data Availability Statement

The soil physicochemical data presented in this study are available on request from the corresponding author. All 16S rRNA gene sequencing data from this study are available in NCBI SRA under the study accession number PRJNA886117.

Conflicts of Interest

The authors declare no conflict of interest.

References

  1. Eilers, K.G.; Debenport, S.; Anderson, S.; Fierer, N. Digging deeper to find unique microbial communities: The strong effect of depth on the structure of bacterial and archaeal communities in soil. Soil Biol. Biochem. 2012, 50, 58–65. [Google Scholar] [CrossRef]
  2. Li, X.; Sun, J.; Wang, H.; Li, X.; Wang, J.; Zhang, H. Changes in the soil microbial phospholipid fatty acid profile with depth in three soil types of paddy fields in China. Geoderma 2017, 290, 69–74. [Google Scholar] [CrossRef]
  3. Fierer, N.; Lef, J.W.; Adams, B.J.; Nielsen, U.N.; Bates, S.T.; Lauber, C.L.; Owens, S.; Gilbert, J.A.; Wall, D.H.; Caporaso, J.G. Cross-biome metagenomic analyses of soil microbial communities and their functional attributes. Proc. Natl. Acad. Sci. USA 2012, 109, 21390–21395. [Google Scholar] [CrossRef] [PubMed] [Green Version]
  4. Cheng, X.; Yun, Y.; Wang, H.; Ma, L.; Tian, W.; Man, B.; Liu, C. Contrasting bacterial communities and their assembly processes in karst soils under different land use. Sci. Total Environ. 2021, 751, 142263. [Google Scholar] [CrossRef] [PubMed]
  5. Kim, H.M.; Lee, M.J.; Jung, J.Y.; Hwang, C.Y.; Kim, M.; Ro, H.M.; Chun, J.; Lee, Y.K. Vertical distribution of bacterial community is associated with the degree of soil organic matter decomposition in the active layer of moist acidic tundra. J. Microbiol. 2016, 54, 713–723. [Google Scholar] [CrossRef]
  6. Wang, M.; Tian, J.; Bu, Z.; Lamit, L.J.; Chen, H.; Zhu, Q.; Peng, C. Structural and functional differentiation of the microbial community in the surface and subsurface peat of two minerotrophic fens in China. Plant Soil 2019, 437, 21–40. [Google Scholar] [CrossRef]
  7. Xu, T.; Chen, X.; Hou, Y.; Zhu, B. Changes in microbial biomass, community composition and diversity, and functioning with soil depth in two alpine ecosystems on the Tibetan plateau. Plant Soil 2020, 459, 137–153. [Google Scholar] [CrossRef]
  8. Fierer, N.; Schimel, J.P.; Holden, P.A. Variations in microbial community composition through two soil depth profiles. Soil Biol. Biochem. 2003, 35, 167–176. [Google Scholar] [CrossRef]
  9. Zhao, X.; Yang, L.; Yu, Z.; Peng, N.; Xiao, L.; Yin, D.; Qin, B. Characterization of depth-related microbial communities in lake sediment by denaturing gradient gel electrophoresis of amplified 16S rRNA fragments. J. Environ. Sci. 2008, 20, 224–230. [Google Scholar] [CrossRef]
  10. Tang, Y.; Yu, G.; Zhang, X.; Wang, Q.; Ge, J.; Liu, S. Changes in nitrogen-cycling microbial communities with depth in temperate and subtropical forest soils. Appl. Soil Ecol. 2018, 124, 218–228. [Google Scholar] [CrossRef]
  11. Liu, R.; Zhang, Y.; Hu, X.; Wan, S.; Wang, H.; Liang, C.; Chen, F. Litter manipulation effects on microbial communities and enzymatic activities vary with soil depth in a subtropical Chinese fir plantation. For. Ecol. Manag. 2021, 480, 118641. [Google Scholar] [CrossRef]
  12. Montoya, J.M.; Pimm, S.L.; Sole, R.V. Ecological networks and their fragility. Nature 2006, 442, 259–264. [Google Scholar] [CrossRef]
  13. Zhou, J.; Deng, Y.; Luo, F.; He, Z.; Tu, Q.; Zhi, X. Functional molecular ecological networks. mBio 2010, 1, e00160–e00169. [Google Scholar] [CrossRef] [PubMed] [Green Version]
  14. Deng, Y.; Jiang, Y.; Yang, Y.; He, Z.; Luo, F.; Zhou, J. Molecular ecological network analyses. BMC Bioinf. 2012, 13, 113. [Google Scholar] [CrossRef] [Green Version]
  15. Ma, J.; Lu, Y.; Chen, F.; Li, X.; Xiao, D.; Wang, H. Molecular Ecological Network Complexity Drives Stand Resilience of Soil Bacteria to Mining Disturbances among Typical Damaged Ecosystems in China. Microorganisms 2020, 8, 433. [Google Scholar] [CrossRef] [Green Version]
  16. Yu, H.; Xue, D.; Wang, Y.; Zheng, W.; Zhang, G.; Wang, Z.L. Molecular ecological network analysis of the response of soil microbial communities to depth gradients in farmland soils. Microbiol. Open 2020, 9, e983. [Google Scholar] [CrossRef]
  17. Liu, S.; Yang, Y.; Wang, H. Development strategy and management countermeasures of planted forests in China: Transforming from timber-centered single objective management towards multi-purpose management for enhancing quality and benefits of ecosystem services. Acta Ecol. Sin. 2018, 38, 1–10. [Google Scholar]
  18. State Forestry and Grassland Administration. China Forest Resources Rreport (2014–2018); China Forestry Press: Beijing, China, 2020.
  19. Wan, X.; Huang, Z.; He, Z.; Yu, Z.; Wang, M.; David, R.M.; Yang, Y. Soil C: N ratio is the major determinant of soil microbial community structure in subtropical coniferous and broadleaf forest plantations. Plant Soil 2015, 387, 103–116. [Google Scholar] [CrossRef]
  20. You, Y.; Xu, H.; Wu, X.; Zhou, X.; Tan, X.; Li, M.; Wen, Y.; Zhu, H.; Cai, D.; Huang, X. Native broadleaf tree species stimulate topsoil nutrient transformation by changing microbial community composition and physiological function, but not biomass in subtropical plantations with low P status. For. Ecol. Manag. 2020, 477, 118491. [Google Scholar] [CrossRef]
  21. He, Y.; Qin, L.; Li, Z.; Liang, X.; Shao, M.; Tan, L. Carbon storage capacity of monoculture and mixed-species plantations in subtropical China. For. Ecol. Manag. 2013, 295, 193–198. [Google Scholar] [CrossRef]
  22. Wang, H.; Liu, S.R.; Mo, J.M.; Wang, J.X.; Makeschin, F.; Wolff, M. Soil organic carbon stock and chemical composition in four plantations of indigenous tree species in subtropical China. Ecol. Res. 2010, 25, 1071–1079. [Google Scholar] [CrossRef]
  23. Wang, H.; Liu, S.; Wang, J.; Shi, Z.; Lu, L.; Zeng, J.; Ming, A.; Tang, J.; Yu, H. Effects of tree species mixture on soil organic carbon stocks and greenhouse gas fluxes in subtropical plantations in China. For. Ecol. Manag. 2013, 300, 4–13. [Google Scholar] [CrossRef]
  24. Lu, R. Methods for Agrochemical Analysis of Soil; China Agricultural Science and Technology Press: Beijing, China, 2000. [Google Scholar]
  25. Zhou, J.; Deng, Y.; Luo, F.; He, Z.; Yang, Y. Phylogenetic molecular ecological network of soil microbial communities in response to elevated CO2. Mbio 2011, 2, e0012211. [Google Scholar] [CrossRef] [Green Version]
  26. Langille, M.G.; Zaneveld, J.; Caporaso, J.G.; McDonald, D.; Knights, D.; Reyes, J.A.; Clemente, J.C.; Burkepile, D.E.; Vega Thurber, R.L.; Knight, R.; et al. Predictive functional profiling of microbial communities using 16S rRNA marker gene sequences. Nat. Biotechnol. 2013, 31, 814–821. [Google Scholar] [CrossRef] [PubMed]
  27. Olesen, J.M.; Bascompte, J.; Dupont, Y.L.; Jordano, P. The modularity of pollination networks. Proc. Natl. Acad. Sci. USA 2007, 104, 19891–19896. [Google Scholar] [CrossRef] [Green Version]
  28. Louca, S.; Parfrey, L.W.; Doebeli, M. Decoupling function and taxonomy in the global ocean microbiome. Science 2016, 353, 1272–1277. [Google Scholar] [CrossRef]
  29. Sansupa, C.; Wahdan, S.F.M.; Hossen, S.; Disayathanoowat, T.; Wubet, T.; Purahong, W. Can we use functional annotation of prokaryotic taxa (FAPROTAX) to assign the ecological functions of soil bacteria? Appl. Sci. 2021, 11, 688. [Google Scholar] [CrossRef]
  30. Layeghifard, M.; Hwang, D.M.; Guttman, D.S. Disentangling interactions in the microbiome: A network perspective. Trends Microbiol. 2017, 25, 217–228. [Google Scholar] [CrossRef] [PubMed]
  31. Mundra, S.; Kjonaas, O.J.; Morgado, L.N.; Krabberod, A.K.; Ransedokken, Y.; Kauserud, H. Soil depth matters: Shift in composition and inter-kingdom co-occurrence patterns of microorganisms in forest soils. FEMS Microbiol. Ecol. 2021, 97, fiab022. [Google Scholar] [CrossRef]
  32. Morrien, E.; Hannula, S.E.; Snoek, L.B.; Helmsing, N.R.; Zweers, H.; de Hollander, M.; Soto, R.L.; Bouffaud, M.L.; Buee, M.; Dimmers, W.; et al. Soil networks become more connected and take up more carbon as nature restoration progresses. Nat. Commun. 2017, 8, 14349. [Google Scholar] [CrossRef] [Green Version]
  33. Wagg, C.; Schlaeppi, K.; Banerjee, S.; Kuramae, E.E.; van der Heijden, M.G.A. Fungal-bacterial diversity and microbiome complexity predict ecosystem functioning. Nat. Commun. 2019, 10, 4841. [Google Scholar] [CrossRef] [Green Version]
  34. Gu, Y.; Wang, Y.; Lu, S.; Xiang, Q.; Yu, X.; Zhao, K.; Zou, L.; Chen, Q.; Tu, S.; Zhang, X. Long-term fertilization structures bacterial and archaeal communities along soil depth gradient in a paddy soil. Front. Microbiol. 2017, 8, 1516. [Google Scholar] [CrossRef] [Green Version]
  35. de Menezes, A.B.; Richardson, A.E.; Thrall, P.H. Linking fungal-bacterial co-occurrences to soil ecosystem function. Curr. Opin. Microbiol. 2017, 37, 135–141. [Google Scholar] [CrossRef]
  36. Bai, R.; Wang, J.T.; Deng, Y.; He, J.Z.; Feng, K.; Zhang, L.M. Microbial community and functional structure significantly varied among distinct types of paddy soils but responded differently along gradients of soil depth layers. Front. Microbiol. 2017, 8, 945. [Google Scholar] [CrossRef]
  37. Delgado-Baquerizo, M.; Eldridge, D.J.; Hamonts, K.; Reich, P.B.; Singh, B.K. Experimentally testing the species-habitat size relationship on soil bacteria: A proof of concept. Soil Biol. Biochem. 2018, 123, 200–206. [Google Scholar] [CrossRef] [Green Version]
  38. An, Q.; Xu, M.; Zhang, X.; Jiao, K.; Zhang, C. Soil bacterial community composition and functional potentials along the vertical vegetation transection on Mount Segrila, Tibaet, China. Chin. J. Appl. Ecol. 2021, 32, 2147–2157. [Google Scholar]
  39. Ahamed Bakeri, S.; Thakib Maidin, M.S.; Mohd Masri, M.M. Soil bacterial biodiversity in development of secondary loggedover forest to oil palm plantation in mineral soil of Belaga, Sarawak. J. Oil Palm Res. 2019, 31, 394–411. [Google Scholar] [CrossRef]
  40. Jurado, M.; Lopez, M.J.; Suarez-Estrella, F.; Vargas-Garcia, M.C.; Lopez-Gonzalez, J.A.; Moreno, J. Exploiting composting biodiversity: Study of the persistent and biotechnologically relevant microorganisms from lignocellulose-based composting. Bioresour. Technol. 2014, 162, 283–293. [Google Scholar] [CrossRef]
  41. Kirby, R. Actinomycetes and lignin degradation. Adv. Appl. Microbiol. 2005, 58, 125–168. [Google Scholar]
  42. Kramer, C.; Gleixner, G. Soil organic matter in soil depth profiles: Distinct carbon preferences of microbial groups during carbon transformation. Soil Biol. Biochem. 2008, 40, 425–433. [Google Scholar] [CrossRef]
  43. Yang, L.; Barnard, R.; Kuzyakov, Y.; Tian, J. Bacterial communities drive the resistance of soil multifunctionality to land-use change in karst soils. Eur. J. Soil Biol. 2021, 104, 103313. [Google Scholar] [CrossRef]
  44. Øvreås, L.; Torsvik, V. Microbial diversity and community structure in two different agricultural soil communities. Microb. Ecol. 1998, 36, 303–315. [Google Scholar] [CrossRef]
  45. Chu, H.; Sun, H.; Tripathi, B.M.; Adams, J.M.; Huang, R.; Zhang, Y.; Shi, Y. Bacterial community dissimilarity between the surface and subsurface soils equals horizontal differences over several kilometers in the western Tibetan Plateau. Environ. Microbiol. 2016, 18, 1523–1533. [Google Scholar] [CrossRef]
  46. Ma, Y.; Feng, C.; Wang, Z.; Huang, C.; Huang, X.; Wang, W.; Yang, S.; Fu, S.; Chen, H. Restoration in degraded subtropical broadleaved forests induces changes in soil bacterial communities. Glob. Ecol. Conserv. 2021, 30, e01775. [Google Scholar] [CrossRef]
  47. Li, X.; Zhang, Q.; Ma, J.; Yang, Y.; Wang, Y.; Fu, C. Flooding irrigation weakens the molecular ecological network complexity of soil microbes during the process of dryland-to-paddy conversion. Int. J. Environ. Res. Public Health 2020, 17, 561. [Google Scholar] [CrossRef] [PubMed] [Green Version]
  48. Cheng, J.; Zhao, M.; Cong, J.; Qi, Q.; Xiao, Y.; Cong, W.; Deng, Y.; Zhou, J.; Zhang, Y. Soil pH exerts stronger impacts than vegetation type and plant diversity on soil bacterial community composition in subtropical broad-leaved forests. Plant Soil 2020, 450, 273–286. [Google Scholar] [CrossRef]
  49. Lladó, S.; López-Mondéja, R.; Baldria, P. Forest soil bacteria: Diversity, involvement in ecosystem processes, and response to global change. Microbiol. Mol. Biol. Rev. 2017, 81, e00063-16. [Google Scholar] [CrossRef] [Green Version]
  50. Almonacid-Muñoz, L.; Herrera, H.; Fuentes-Ramírez, A.; Vargas-Gaete, R.; Larama, G.; Jara, R.; Fernández-Urrutia, C.; da Silva Valadares, R.B. Tree cover species modify the diversity of rhizosphere-associated microorganisms in nothofagus obliqua (Mirb.) oerst temperate forests in south-central Chile. Forests 2022, 13, 756. [Google Scholar] [CrossRef]
  51. Sun, W.; Li, Z.; Lei, J.; Liu, X. Bacterial communities of forest soils along different elevations: Diversity, structure, and functional composition with potential impacts on CO2 emission. Microorganisms 2022, 10, 766. [Google Scholar] [CrossRef]
  52. O’Donnell, A.G.; Seasman, M.; Macrae, A.; Waite, I.; Davies, J.T. Plants and fertilisers as drivers of change in microbial community structure and function in soils. Plant Soil 2001, 232, 135–145. [Google Scholar] [CrossRef]
  53. Liang, S.; Deng, J.; Jiang, Y.; Wu, S.; Zhou, Y.; Zhu, W. Functional distribution of bacterial community under different land use patterns based on FaProTax function prediction. Pol. J. Environ. Stud. 2020, 29, 1245–1261. [Google Scholar] [CrossRef] [PubMed]
  54. Brackin, R.; Robinson, N.; Lakshmanan, P.; Schmidt, S. Microbial function in adjacent subtropical forest and agricultural soil. Soil Biol. Biochem. 2013, 57, 68–77. [Google Scholar] [CrossRef]
  55. Martin, J.F.; Reddy, K.R. Interaction and spatial distribution of wetland nitrogen processes. Ecol. Modell. 1997, 105, 1–21. [Google Scholar] [CrossRef]
Figure 1. The molecular ecological network of soil bacteria in the topsoil (0–20 cm) (A), middle layer (20–40 cm) (B), and subsoil (40–60 cm) (C) of native tree plantations. Each node represents an OTU of bacteria, and the color of the node represents the phylum level of bacteria. The red line indicates the positive interaction between nodes, and the gray line indicates the negative interaction between nodes. #k, Module k, k = 1, 2, 3, …….
Forests 14 00803 g001
Figure 2. Venn diagram of node distribution of bacterial molecular ecological network in three soil layers.
Forests 14 00803 g002
Figure 3. Topological role distribution of bacterial molecular ecological network nodes in three soil layers.
Forests 14 00803 g003
Figure 4. Distribution patterns of key phylum in topsoil (A), middle layer (B), and subsoil (C) of native tree plantation.
Forests 14 00803 g004
Figure 5. Hierarchical structure of three soil bacterial molecular ecological network modules and its correlation with soil physical and chemical properties. (A1,B1,C1) represent the hierarchical structure diagram and heat diagram of representative modules of soil bacterial molecular ecological network in the topsoil, middle layer, and subsoil, respectively. Among them, the upper part was the hierarchical clustering structure diagram based on the Pearson correlation between representative modules, and the lower part was the heat map based on the Pearson correlation between representative modules. Red indicates a high correlation, and blue indicates a low correlation. (A2,B2,C2) represent the correlation heat map between the representative modules of soil bacterial molecular ecological network and soil physicochemical properties in the topsoil, middle layer, and subsoil, respectively. In those figures, red indicates a high positive correlation, and green indicates a high negative correlation. In each figure, the numbers without brackets and those with brackets represent correlation coefficient (r) and significance (P), respectively. #k, Module k, k= 1, 2, 3, ……. SWC: soil water content; SOC: soil organic carbon; TN: total nitrogen; NH4+-N: ammoniacal nitrogen; NO3-N: nitrate nitrogen; TP: total phosphorus; AP: available phosphorus.
Forests 14 00803 g005
Figure 6. Comparison of relative abundance of the six dominant bacterial functional groups in soil profiles of native tree plantations. Different lowercase letters represent significant differences among different soil layers at 0.05 level.
Forests 14 00803 g006
Figure 7. Correlation between the six dominant bacterial functional groups and soil physicochemical properties in topsoil (A), middle layer (B), and subsoil (C). * p < 0.05. SWC: soil water content; SOC: soil organic carbon; TN: total nitrogen; NH4+-N: ammoniacal nitrogen; NO3-N: nitrate nitrogen; TP: total phosphorus; AP: available phosphorus.
Forests 14 00803 g007
Table 1. Changes in physicochemical properties of soil profiles in native tree plantations (mean ± SD, n = 12).
Soil LayerSWC
(%)
pHSOC
(g/kg)
TN
(g/kg)
NH4+-N
(mg/kg)
NO3-N
(mg/kg)
TP
(g/kg)
AP
(mg/kg)
0–20 cm31.32 ± 2.56 a4.17 ± 0.24 a21.17 ± 2.11 a1.43 ± 0.34 a19.38 ± 5.49 a4.42 ± 0.63 a1.26 ± 0.49 a13.85 ± 3.64 a
20–40 cm28.02 ± 2.92 b4.23 ± 0.31 a12.05 ± 1.87 b1.10 ± 0.20 b15.07 ± 7.09 ab3.20 ± 1.06 b0.96 ± 0.44 a11.76 ± 4.98 a
40–60 cm25.86 ± 3.69 b4.27 ± 0.25 a9.58 ± 1.62 c0.74 ± 0.17 c10.07 ± 6.37 b1.93 ± 0.87 c0.43 ± 0.22 b9.99 ± 5.27 a
SWC: soil water content; SOC: soil organic carbon; TN: total nitrogen; NH4+-N: ammoniacal nitrogen; NO3-N: nitrate nitrogen; TP: total phosphorus; AP: available phosphorus. Different lowercase letters represent significant differences among the different soil layers at a level of 0.05.
Table 2. Topological parameters of molecular ecological networks and random network of the bacterial community in the soil profiles of native tree plantations.
Soil LayerMolecular Ecological NetworksRandom Networks
CutoffTotal NodesTotal LinksR2 of Power LawThe Number of Positive ConnectionsThe Number of Negative ConnectionsAverage DegreeAverage Clustering CoefficientAverage Path Dis-tanceModularity Index
(Module Number)
Average Clustering CoefficientAverage Path DistanceModularity Index
0–20 cm0.761663330.752263704.0120.2034.4510.669 (16)0.029 ± 0.0093.665 ± 0.0510.475 ± 0.009
20–40 cm0.761914880.8133451435.110.2254.1480.586 (15)0.049 ± 0.0093.308 ± 0.0430.400 ± 0.007
40–60 cm0.762045190.7963441755.0880.2354.2040.623 (12)0.042 ± 0.0083.359 ± 0.0350.406 ± 0.007
Table 3. Relative abundance of bacterial functional groups in the soil profile of native tree plantations.
Bacterial Functional GroupRelative Abundance (%)
0–20 cm20–40 cm40–60 cm
chemoheterotrophy26.303721.666921.7211
aerobic chemoheterotrophy25.8136 21.1417 21.2079
cellulolysis4.38234.9789 4.3766
ureolysis5.1485 2.7107 2.8567
nitrogen fixation0.5692 0.6592 0.8078
nitrate reduction0.6468 0.5049 0.7700
methanotrophy0.0115 0.0199 0.0178
methanol_oxidation0.01910.04440.0738
methylotrophy0.03060.06430.0916
aerobic_ammonia_oxidation0.00110.00100.0022
aerobic_nitrite_oxidation0.01460.09790.2692
nitrification0.01570.09890.2714
sulfur_respiration0.00000.00060.0015
respiration_of_sulfur_compounds0.00000.00060.0015
chitinolysis0.00040.00020.0002
nitrite_ammonification0.0938 0.2136 0.3710
nitrite_respiration0.09380.21360.3710
dark_thiosulfate_oxidation0.0731 0.0210 0.0135
dark_oxidation_of_sulfur_compounds0.07360.02120.0135
manganese_oxidation0.00860.01190.0175
fermentation0.28500.37080.5907
invertebrate_parasites0.0017 0.0021 0.0038
human_pathogens_pneumonia0.00000.00120.0013
human_pathogens_gastroenteritis0.09380.21360.3710
human_pathogens_diarrhea0.09380.21360.3710
human_pathogens_all0.11860.25040.4334
human_gut0.09460.21360.3724
human_associated0.11950.25040.4349
mammal_gut0.09460.21360.3724
animal_parasites_or_symbionts0.23560.37610.5379
plant_pathogen0.05700.02920.0433
aromatic_hydrocarbon_degradation0.00060.00140.0021
aromatic_compound_degradation0.03360.06650.1346
liphatic_non_methane_hydrocarbon_degradation0.00060.00140.0021
hydrocarbon_degradation0.01210.02140.0199
iron_respiration0.03040.04550.0482
nitrate_respiration0.11170.24140.4375
nitrogen_respiration0.1117 0.2414 0.4375
fumarate_respiration0.09380.21360.3710
intracellular_parasites0.12950.10840.0770
predatory_or_exoparasitic0.03680.04380.0694
chloroplasts0.00450.01030.0084
nonphotosynthetic_cyanobacteria0.03820.02100.0239
aerobic_anoxygenic_phototrophy0.00100.00060.0051
photoheterotrophy0.02190.02870.0393
phototrophy0.02190.02870.0393
Total65.142655.679858.5035
Disclaimer/Publisher’s Note: The statements, opinions and data contained in all publications are solely those of the individual author(s) and contributor(s) and not of MDPI and/or the editor(s). MDPI and/or the editor(s) disclaim responsibility for any injury to people or property resulting from any ideas, methods, instructions or products referred to in the content.

