Article

Stand Structure Management and Tree Diversity Conservation Based on Using Stand Factors: A Case Study in the Longwan National Nature Reserve

1
State Environmental Protection Key Laboratory of Wetland Ecology and Vegetation Restoration, School of Environment, Northeast Normal University, Changchun 130117, China
2
Key Laboratory for Vegetation Ecology, Ministry of Education, Northeast Normal University, Changchun 130117, China
3
Jilin Provincial Academy of Forestry Sciences, Changchun 130033, China
4
Jilin Longwan National Nature Reserve Administration, Tonghua 135102, China
5
School of Environment and Ecology, Tibet University, Lhasa 850012, China
*
Authors to whom correspondence should be addressed.
Forests 2023, 14(4), 750; https://doi.org/10.3390/f14040750
Submission received: 8 February 2023 / Revised: 2 April 2023 / Accepted: 4 April 2023 / Published: 6 April 2023
(This article belongs to the Special Issue Forest Ecosystem Services and Landscape Design)

Abstract

:
The management of stand structure and the protection of species diversity are crucial to forest ecosystem service functions. Changbai Mountain is one of the three major forest regions in Northeast China, and understanding the characteristics of stand structure and the allometric relationship between stand structure variables and the correlation between stand factors and species diversity is the basis for achieving effective forest management and ecological function improvement. In this study, the typical deciduous broad-leaved mixed forest and coniferous and broad-leaved mixed forest of the Longwan Nature Reserve in the Changbai Mountain were taken as the research objects, and the stand structure and diversity were investigated in detail. Allometric growth equations were established using the breast height diameter (DBH), tree height, and crown width of the main dominant species. Pearson correlation analysis was conducted on the stand structure and diversity of the forest community. The experimental results showed that young forests with small diameters and small individuals were the main part of the stands. Optimal allometric growth models of the main tree species (Acer mandshuricum, Ulmus davidiana var. japonica, Juglans mandshurica, Acer mono, and Tilia amurensis) were 0.807D0.646, 0608D0.381H0.390, 0.502D0.533H0.295, 0.795D0.540H0.157, and 0.541D0.484H0.301, respectively, with R2 values ranging between 0.6 and 0.8, indicating a good fit for the models. Furthermore, tree density, crown width, and DBH were the main factors affecting tree diversity. The research results will provide theoretical support for the efficient management of forest stand structure and diversity conservation in the Longwan Reserve.

1. Introduction

The plant community structure, and diversity characteristics have always been a hot issue in ecological research, which determines the niche and competition pattern of a species within the community and has an important impact on the sustainable supply of ecosystem functions [1,2,3]. Unlike ecosystems such as grasslands and farmlands, plant community structure and diversity play a more important role in evaluating the ecological functions of forests [4,5], and a reasonable and healthy community structure is widely recognized as the foundation for forests to perform a variety of ecological functions [6]. Arbors, as the primary component of forest vegetation, have drought and salinity tolerance, as well as various ecological service functions, such as species diversity maintenance, water conservation, and carbon fixation [7,8], and are the primary contributors for the forest ecosystem to perform ecological functions [9]. Therefore, analyzing the community structure characteristics and the effects of stand structure on tree growth and diversity is of great practical and scientific significance for forest conservation and the stability of an ecosystem structure and function [10,11].
The study of allometric growth is a crucial aspect of managing forest community structure [12], where stand structure can strongly influence forest growth [13]. Tree crown is a key parameter in characterizing individual tree growth [14], and studies have shown that DBH and tree height are important stand variables that affect tree growth and that all have significant allometric growth relationships with tree crowns [15,16,17]. Some studies have suggested that, compared to other models, the power function model is the best allometric growth model for stand variables and tree crowns [18,19]. Curtis and Reukema first developed a tree growth model using the tree height, DBH, and crown of Pseudotsuga sinensis [20]. Several researchers investigated the DBH and crown width of Pinus sylvestris L. located throughout the Czech Republic, and estimated the ideal spacing for tree growth through their allometric growth relationship [21]. In addition, research has shown that the relationship between DBH, tree height, and crown width of common tree species in Uganda and the northeastern United States conformed to the allometric growth model, which was used by local forest managers to estimate the growth of trees, thereby developing reasonable forest management strategies [22,23]. However, differences in forest type, growth environment, and species can greatly affect the relationship between tree growth and stand variables, even though there have been many allometric growth models for specific species in different regions based on DBH, tree height, and crown width [24]. Currently, there is limited research on forest allometric growth in the Changbai Mountains region of northeastern China.
In addition to the study of allometric growth of trees, the conservation of plant diversity is also an important part of forest ecosystem management [25]. Many ways to protect plant diversity are related to community structures [26], including height, crown width, canopy density and density [27,28,29,30]. For example, there was a significant negative correlation between the height of Corylus cornuta and the richness of understory species [31]. The differences in plant diversity in the herb layers of forests between evergreen and deciduous cover types were mainly related to crown width [32]. Similarly, tree density and canopy density were also important factors affecting species composition [33] when the planting density of trees was at a medium level, which was conducive to the increase in shrub diversity in the Mediterranean forest [34]. Additionally, one study emphasized that adjusting stand density would help enhance plant diversity [35]. However, there are few studies on the relationship between tree diversity and the stand structure of temperate forests in the Changbai Mountains, Northeast China.
Longwan Nature Reserve is a coniferous and broad-leaved mixed forest and deciduous broad-leaved mixed forest that formed after logging, and is an important object of natural forest protection and forest community restoration [36]. It has a unique plant community composition and biodiversity, dominated by northern temperate plants, with high vegetation coverage and good water and soil conservation [37]. Furthermore, the reserve contains a variety of rare wetlands with special causes, as well as numerous types of national rare and protected animals and plants that play an important role in maintaining biodiversity, water conservation, and carbon fixation, and have extremely important ecological significance and economic value [38]. In view of this area, where the relevant research on the community structure characteristics and the effects of stand structure on tree growth and diversity is still lacking, this study took Longwan Nature Reserve as the research object and addressed the following questions: (1) Which stand factors have significant effects on tree growth? Establish the optimal allometric growth models between stand variables and crown width of the main dominant species; and (2) What were the main stand factors affecting the tree layer species diversity?

2. Materials and Methods

2.1. Study Sites

Longwan National Nature Reserve is located in the Huinan County, Tonghua City, Jilin Province, China, and belongs to the middle section of the Longgang Mountains of Changbai Mountain, with an area of approximately 15,061 hm2, geographical coordinates of 125°13′55″ E–126°32′02″ E, 42°16′20″ N–42°26′57″ N, and an altitude of 449–1233 m. The area belongs to the continental monsoon climate of the north temperate zone, with abundant rainfall in summer and minimum precipitation in winter, with an average annual precipitation of 704.2 mm, an average annual temperature of 4.1 °C, a frost-free period of 110–120 days, and dark brown zonal soil. In addition, according to the local resource archives, Longwan National Nature Reserve was formerly a coniferous and broad-leaved mixed forest that was excessively logged in the 1960s. At present, the community is a secondary forest formed by natural regeneration, and most trees are 40–60 years old. The forest types are mainly deciduous broad-leaved mixed forest and a small amount of coniferous and broad-leaved mixed forest. The composition of plant species is relatively rich, and the main trees are Juglans mandshurica, Tilia amurensis, Ulmus japonica, and Acer mono [39,40].

2.2. Survey of Plant Communities

In July–August 2019, 25 monitoring sample plots were set up in the reserve to investigate the species distribution and community structure characteristics of the arbor layer in Longwan Nature Reserve (Figure 1). The sample plots were of deciduous broad-leaved mixed forest and coniferous and broad-leaved mixed forest vegetation types. Moreover, trees with a DBH larger than 5 cm were investigated, and dead trees were not included in this study. Three sample squares of 20 m × 30 m were set up in each sample plot, and the species name, number, height, DBH, crown width, and other data of the species in the quadrat were recorded. The Chinese Virtual Herbarium (https://www.cvh.ac.cn/, accessed on 21 February 2021) was used to identify and review the species recorded in the survey.

2.3. Measurement Indicators and Measurement Methods

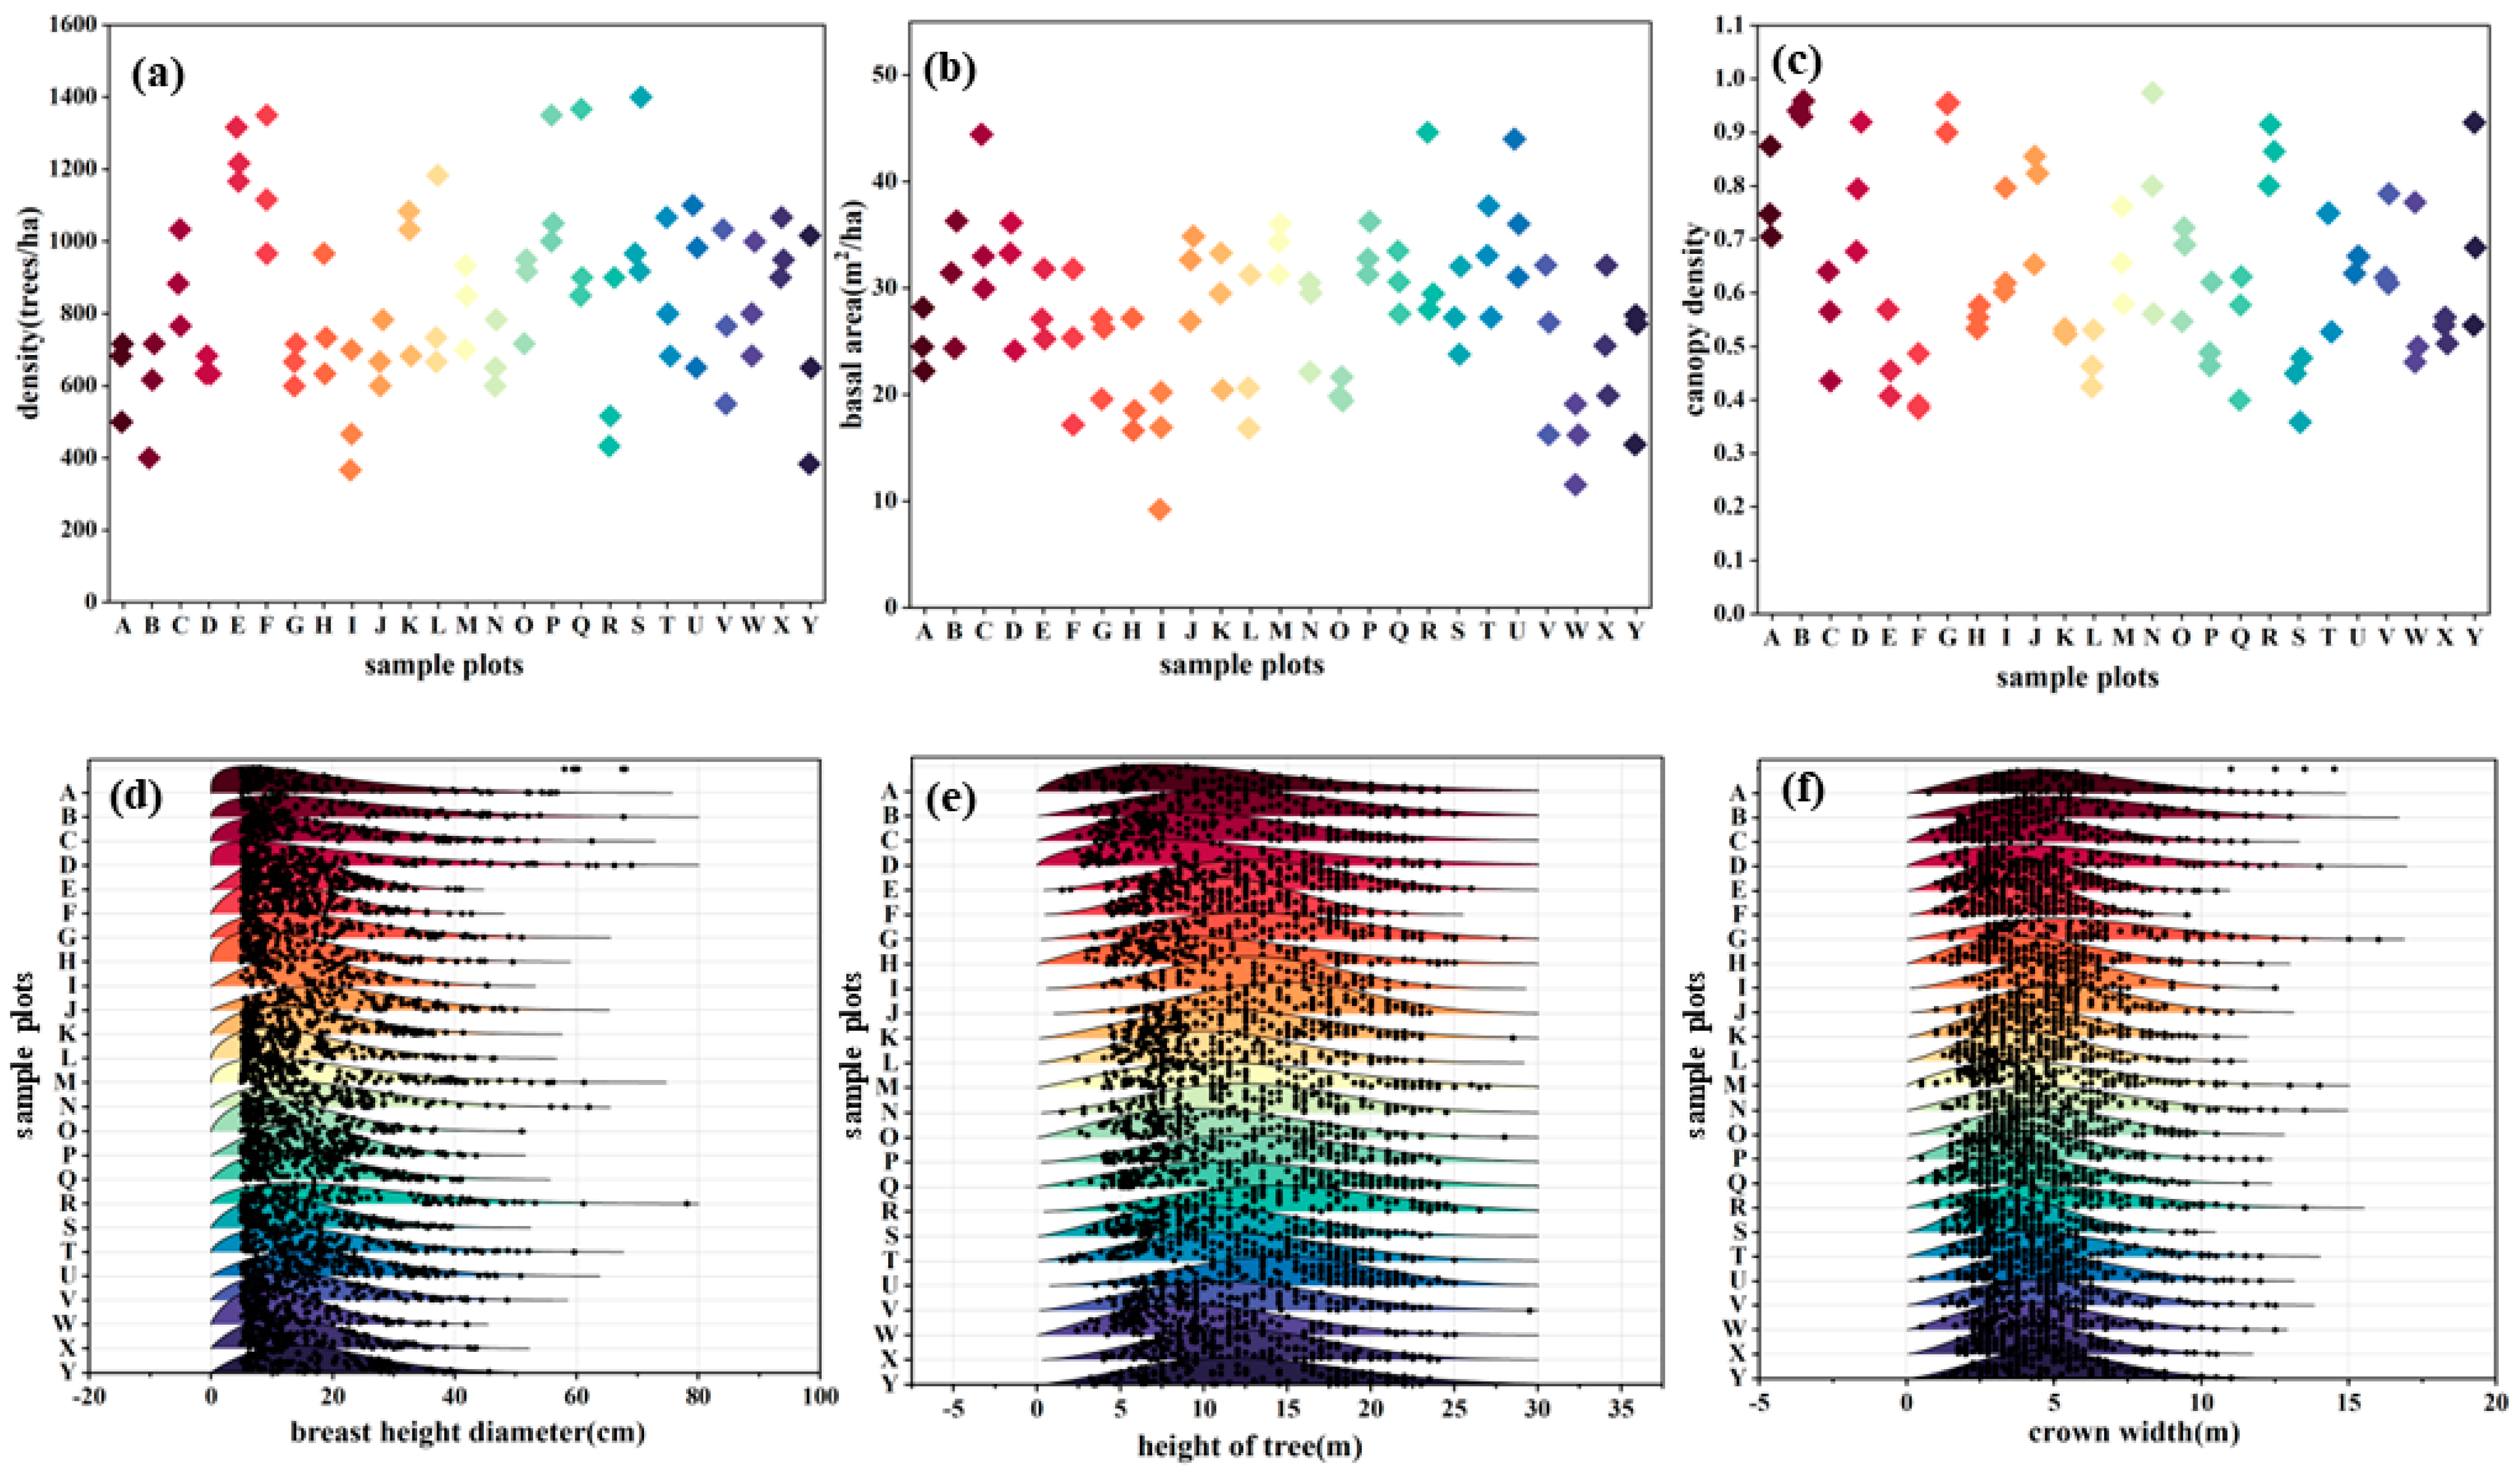
2.3.1. Stand Structure

To describe the functional status of species in the community, the importance value (IV) was used as the dominance index of each species in the community and was calculated as follows [41]:
IV = (relative height + relative abundance + relative coverage)/3
The community structure of the tree layer was measured by density, DBH, tree height, crown width, basal area, and canopy density.

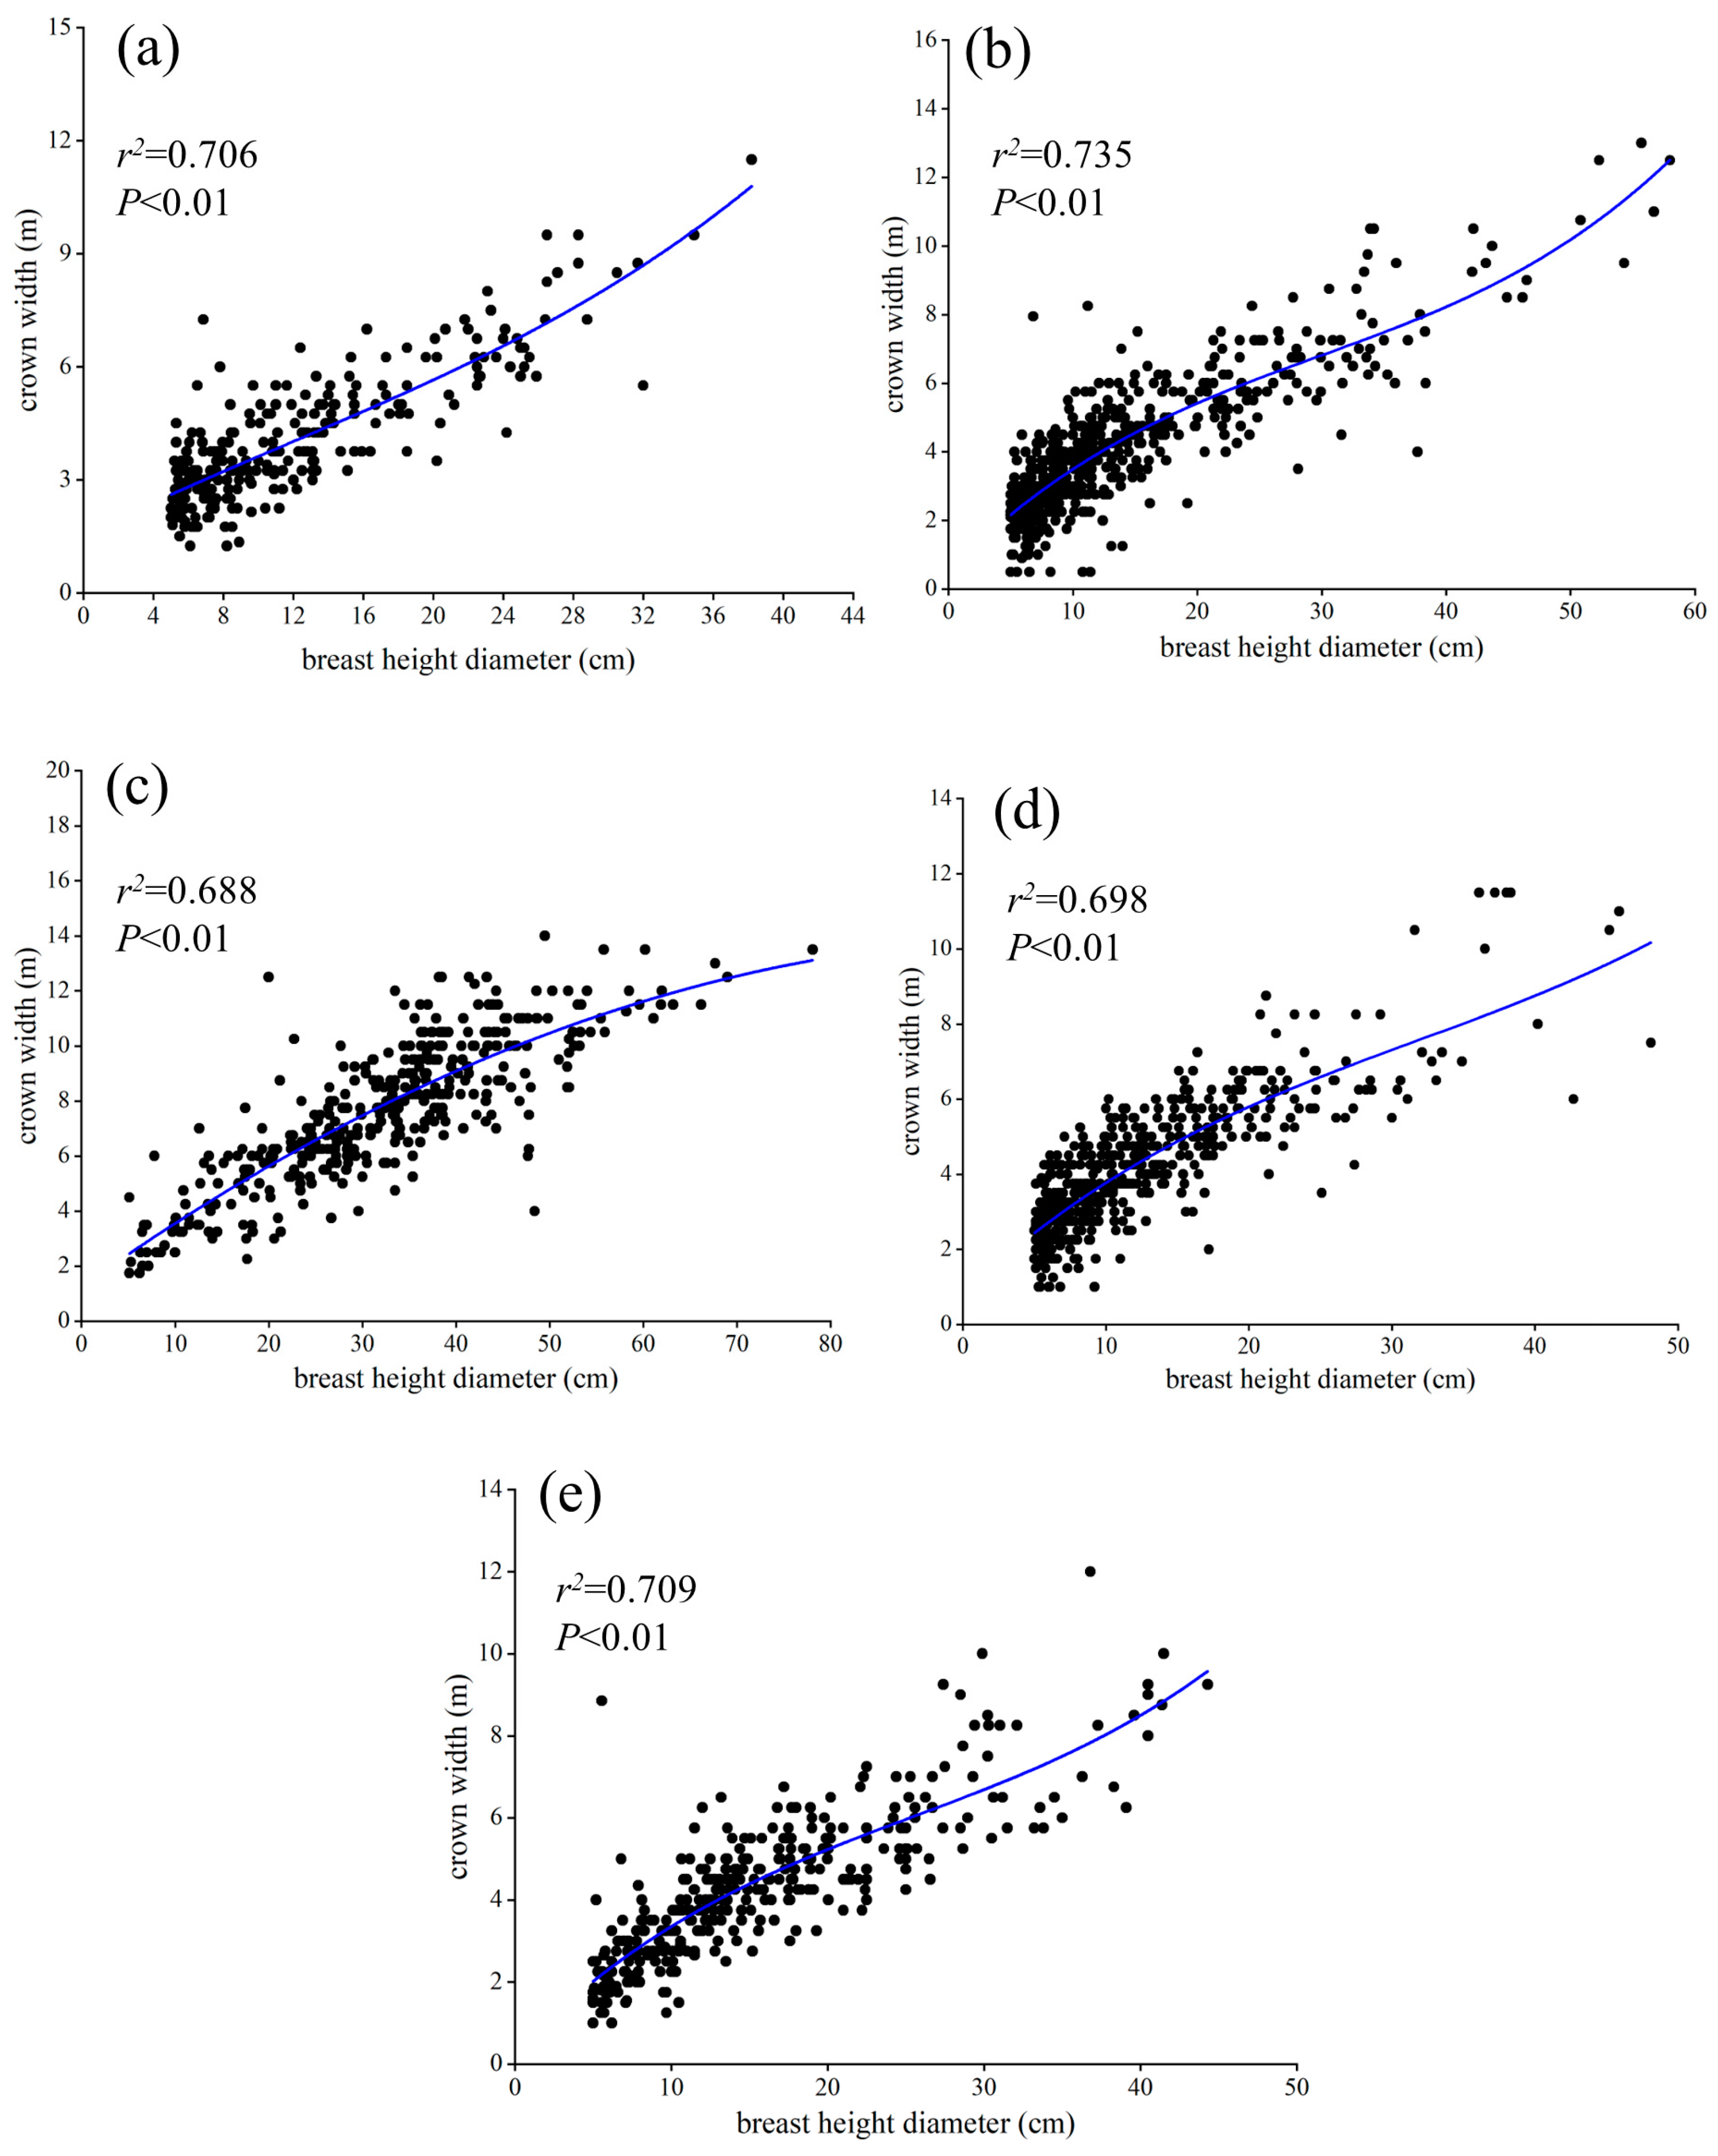
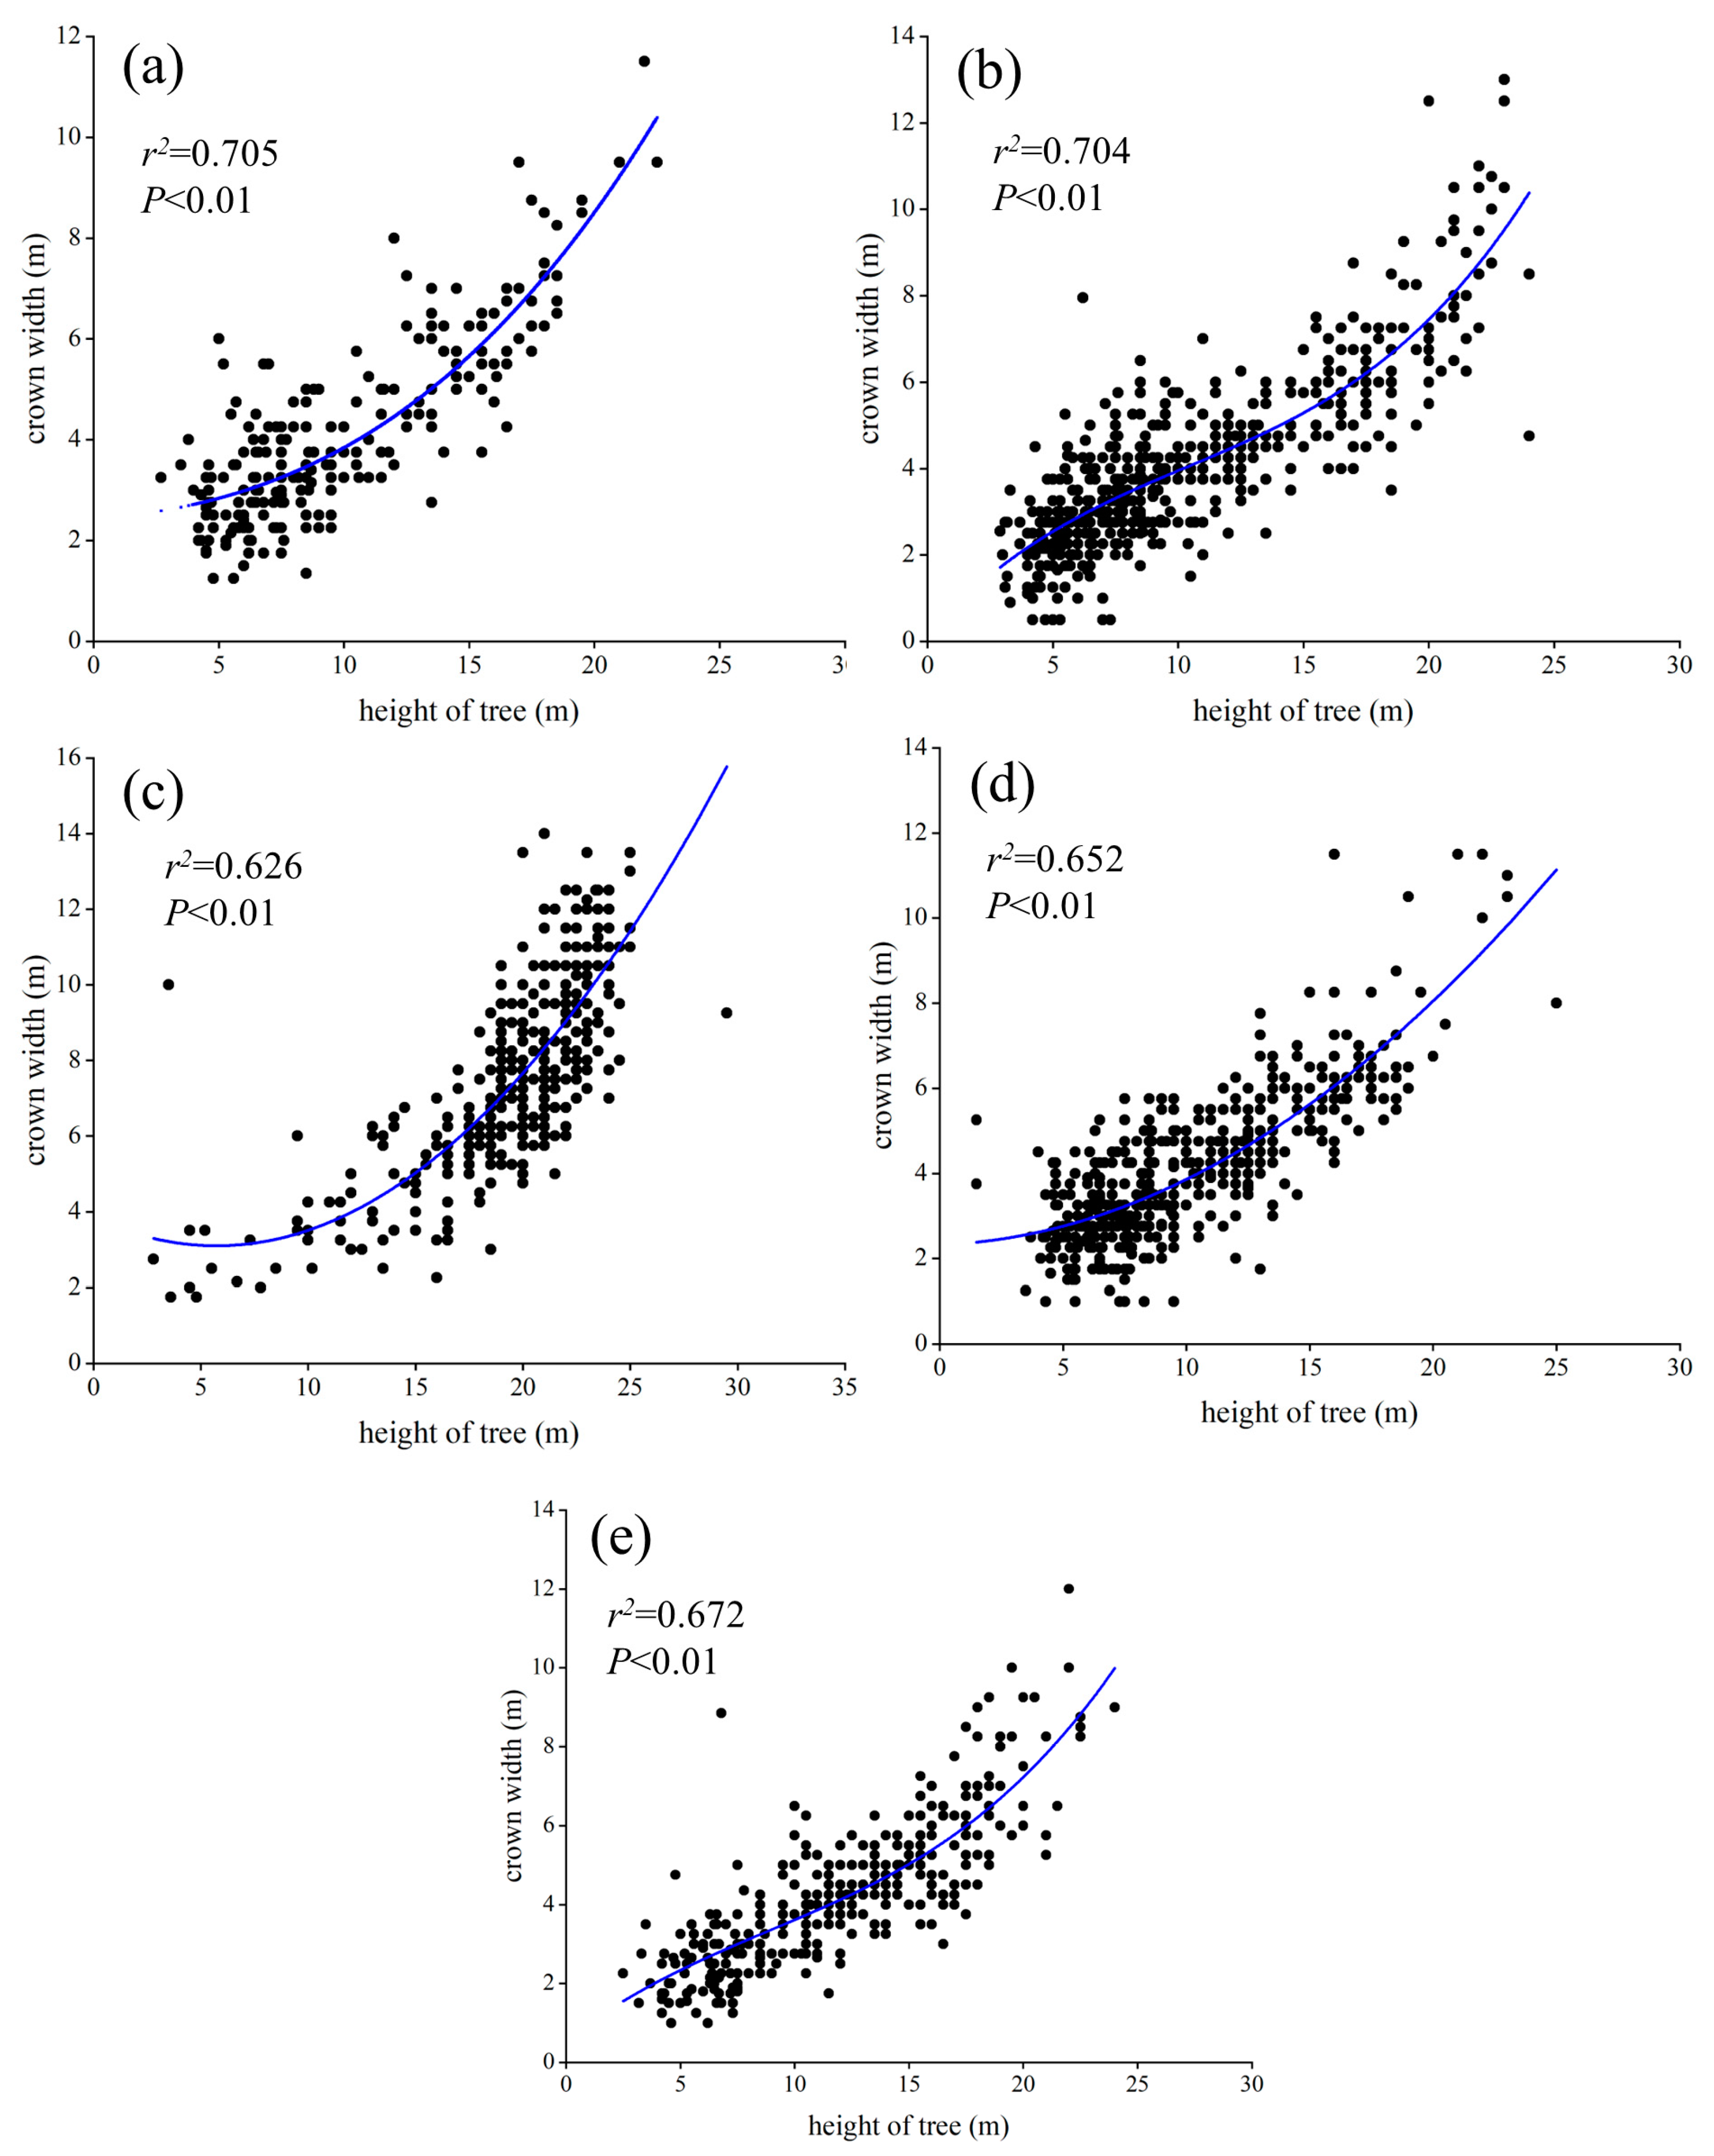
2.3.2. Construction of Allometric Growth Equation

Using stand variables such as DBH and tree height as independent variables and crown width as the dependent variable, scatter plots were created for the main dominant species (Acer mandshuricum, Ulmus japonica, Juglans mandshurica, Acer mono and Tilia amurensis) in the Longwan Nature Reserve. The trend line type and significance were determined to identify the main stand variables that affected crown width. A multiparameter allometric growth equation was established using the crown width as the dependent variable (y) and the stand structure factors as the independent variables (x). The model with the smallest residual sum of squares (RSS) and the largest determination coefficient (R2) was selected as the optimal model. The expression of the multiparameter allometric growth equation is as follows:
y = a x 1 b x 2 c ,
where y represents the crown width data of the dominant species and x represents the stand variables of the DBH and tree height. The model parameters are denoted by a, b, and c.
To estimate the parameters of the prediction model, multiple linear regression was used in this study. As the prediction model is nonlinear, it was transformed into a linear model. The equation after the transformation is ln(y) = lna + b ln(x1) + c ln(x2).

2.3.3. Plant Community Species Diversity

The species diversity index of trees adopted the richness index, diversity index and evenness index, and the calculation formulas were as follows [42]:
Richness index:
R = S,
where S represents the number of species in the plant community.
The species diversity indexes were expressed by the Simpson index (D) and the Shannon–Wiener index (H).
Simpson index:
D = 1 i = 1 s P i 2 ,
where S represents the number of species in the plant community, and Pi is the proportion of the ith species in the total number of species.
Shannon–Wiener index:
H = i = 1 S P i ln ( P i ) ,
where S represents the number of species in the plant community, and Pi is the proportion of the ith species in the total number of species.
Species evenness indexes were expressed by the Pielou index (JSW) and the Alatalo index (Ea).
Pielou index:
J s w = i = 1 s P i ln P i ln S ,
where S represents the number of species in the plant community, and Pi is the proportion of the ith species in the total number of species.
Alatalo index:
E a = 1 i = 1 S P i 2 1 exp ( i = 1 S P i l n P i ) 1 ,
where S represents the number of species in the plant community, and Pi is the proportion of the ith species in the total number of species.

2.4. Data Analysis

Data sorting and mapping were carried out using Excel 2019 (Microsoft Corporation, Redmond, WA, USA). Multiple linear regression was used to calculate the parameters of the allometric growth equation, and Pearson correlation was used to analyze the relationship between stand factors and plant diversity indexes (SPSS 22.0, IBM Corporation, Chicago, IL, USA).

3. Results

3.1. Species Composition and Stand Structure

All 25 sample plots in the Longwan Nature Reserve belonged to the mixed deciduous broad-leaved forest and coniferous and broad-leaved mixed forest community types, with 14 families, 22 genera, and 36 species of trees (Table S1). Juglans mandshurica was an important species in several sample plots, including A, B, C, D, M, R, T, and Y, with proportions ranging from 23.47 to 46.73%. The dominant species in sample plots F, K, and L was Tilia amurensis, which accounted for 29.10%, 20.53%, and 24.85%, respectively. The dominant species in sample plots H, O, and Q was Ulmus japonica, with proportions of 18.21%, 25.82%, and 42.28%, respectively. Sample plots G and J had Acer mono as the dominant species, with proportions of 23.65% and 25.11%, respectively. Sample plots I and P had Larix gmelinii (Rupr.) Kuzen. as the dominant species, with proportions of 27.24% and 33.91%, respectively. Sample plots N and V had Acer mandshuricum as the dominant species, with proportions of 35.77% and 28.65%, respectively. Sample plots S and W had Fraxinus mandschurica Rupr. as the dominant species, with proportions of 30.25% and 30.21%, respectively. The dominant species in sample plots E, U, and X were Betula platyphylla Suk., Tilia mandschurica Rupr.et Maxim., and Quercus mongolica Fisch.exLedeb., respectively. The proportions of the dominant species in these sample plots were 22.60%, 23.61%, and 22.10%, respectively (Table S1).
The distribution range of tree layer density in the surveyed sample plots was 367–1400 trees/ha (Figure 2a). About 60% of the sample plots had a density between 600 and 1100 trees/ha. Most sample plots had a basal area concentrated between 15 and 35 m2/ha. However, sample plots I and W had relatively low basal areas of only 9.22 m2/ha and 11.53 m2/ha, respectively (Figure 2b). More than 70% of the sample plots had a canopy density concentrated between 0.4 and 0.8 (Figure 2c). The DBH of the surveyed sample plots ranged from 5 to 25 cm (Figure 2d). Most sample plots had trees with a height between 5 and 17 m (Figure 2e), and the crown width was concentrated between 3 and 7 m (Figure 2f).

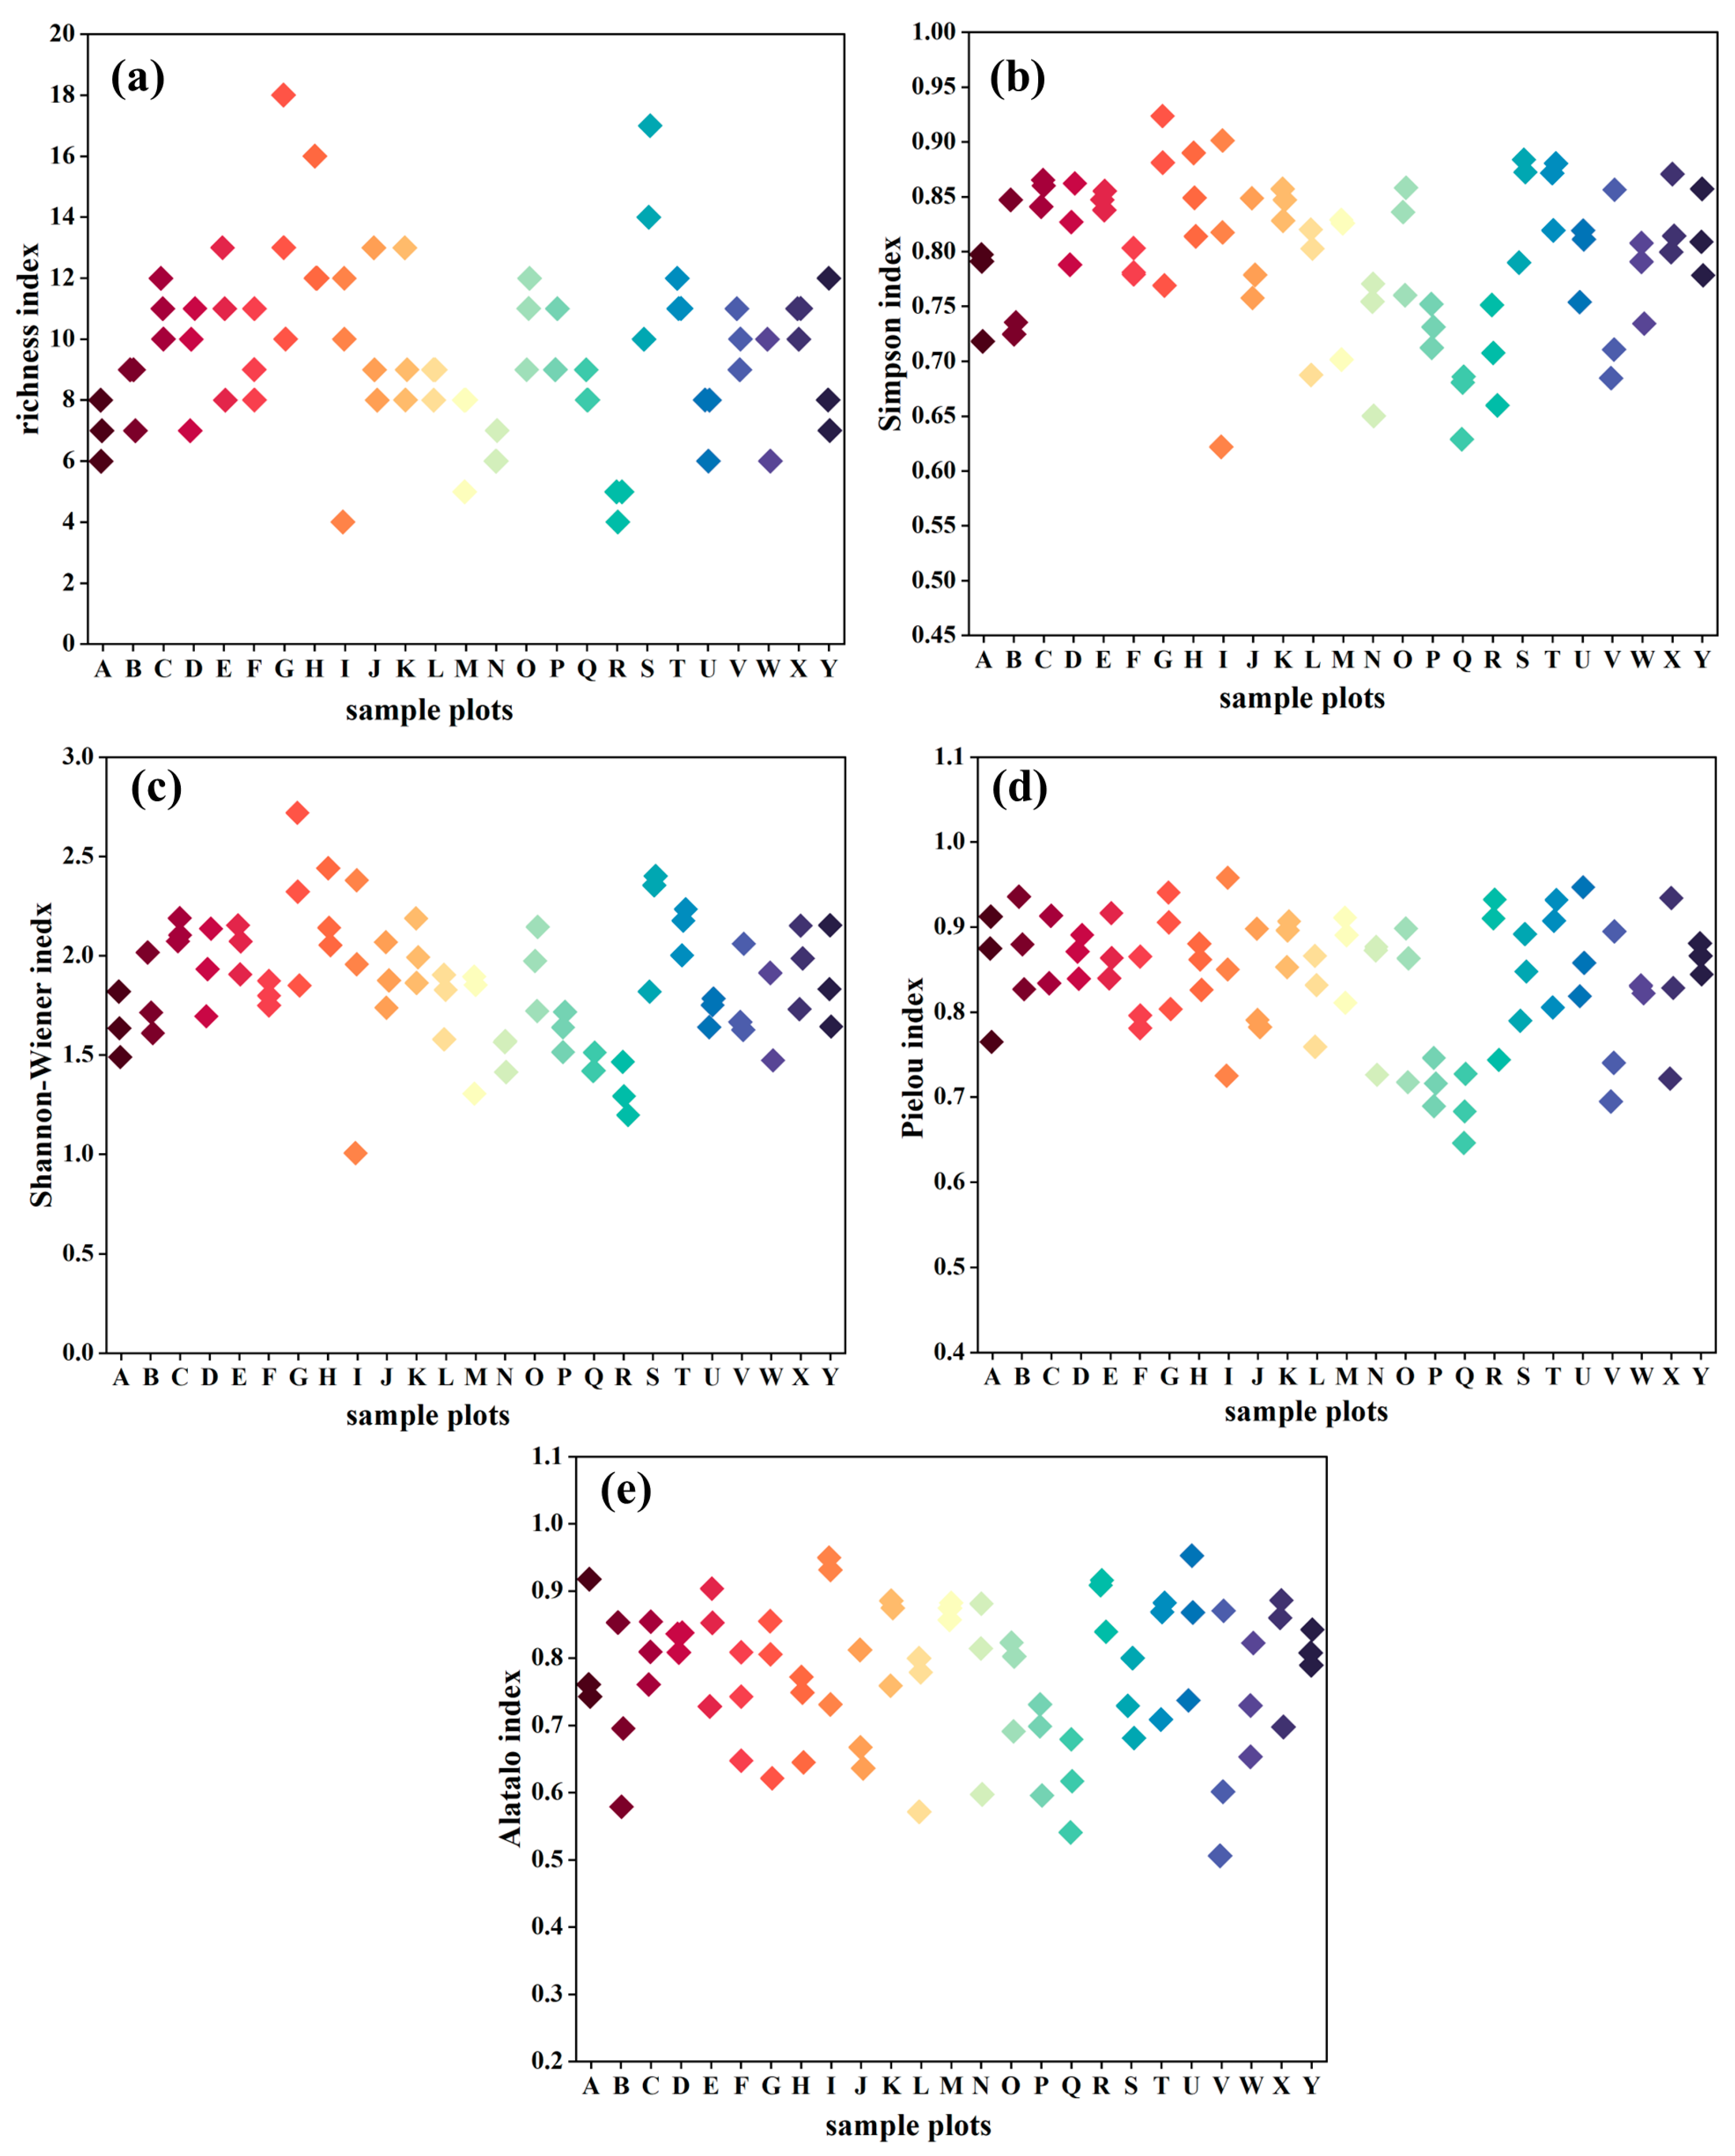
3.2. Distribution Characteristics of Species Diversity

The distribution range of species richness was 4–18, and the number of species in most sample plots was 7–13 (Figure 3a). The Simpson index was basically above 0.65 (Figure 3b); the distribution characteristics of the Shannon–Wiener index and the richness index in various plots were similar (Figure 3c), and the Shannon–Wiener index in most sample plots was mainly concentrated in the range of 1.5–2.5. The Pielou index was basically above 0.7 (Figure 3d), and the Alatalo index was concentrated in the range of 0.6–0.9 (Figure 3e).

3.3. Allometric Growth Models of DBH, Tree Height, and Crown Width

The DBH, tree height, and crown width of the main dominant species (Acer mandshuricum, Ulmus japonica, Juglans mandshurica, Acer mono and Tilia amurensis) in the Longwan Nature Reserve all had significant correlations (p < 0.01) (Figure 4 and Figure 5). To better understand these correlations, we established two allometric growth models: CW = aDb and CW = aDbHc. By comparing the R2 and RSS values of the two models, the optimal models for Acer mandshuricum, Ulmus japonica, Juglans mandshurica, Acer mono, and Tilia amurensis were 0.807D0.646, 0.608D0.381H0.390, 0.502D0.533H0.295, 0.795D0.540H0.157, and 0.541D0.484H0.301, respectively (Table 1), with R2 values between 0.6 and 0.8, indicating that the constructed model had good fitting effects.

3.4. Correlation Analysis of Community Structure and Species Diversity

Tree density had a significant positive correlation with species richness (p < 0.01) and had a significant negative effect on the Pielou index and Alatalo index (p < 0.05); DBH had a significant negative impact on species richness (p < 0.05) and had a significant positive correlation with the Pielou index and Alatalo index (p < 0.05); crown width had a significant negative correlation with species richness (p < 0.05) and a significant positive correlation with the Pielou index and Alatalo index (p < 0.01) (Table 2).

4. Discussion

4.1. Tree-Layer Community Structure and Diversity

The community structure and diversity of plants are important biological characteristics at the level of ecological organization, reflecting the composition and spatial configuration of a species [43]. The survey found that the Longwan Nature Reserve was relatively rich in plant species, with a total of 36 species of trees belonging to 14 families and 22 genera in the sample plots. Among these species, Juglans mandshurica, Ulmus japonica and Tilia amurensis were the main dominant species, and the number of individuals such as Alnus cremastogyne, Acer komarovii, and Salix matsudana was small, but they enriched the composition of species and increased the species diversity of arbors (Table S1). The density of the 25 sample plots was 367–1400 trees/hm2, the distribution range of the DBH was 5–25 cm, and the tree height was mainly concentrated at 5–17 m (Figure 2), which was different from the typical broad-leaved mature forest in the Changbai Mountain area (the density of trees was 400–600 trees/hm2, the average DBH was 24–28 cm, and the height was 15–20 m) [44]. The analysis of plant diversity showed that the richness index of the tree layer was 4–18, the Simpson index was concentrated in the range of 0.65–0.9, the Shannon–Wiener index was 1.32–2.30, and the Pielou and Alatalo indexes were concentrated at 0.7–0.95 and 0.6–0.9, respectively (Figure 3), which were basically consistent with the species diversity of the broad-leaved mixed forest in the Changbai Mountain [44]. In addition, the differences in species diversity among the plots were mainly related to the proportion of dominant species, the differences in understory environments and nutrient limitation, resulting in some differences in species richness, diversity, and evenness among the surveyed sample plots [45,46,47,48]. In summary, young forests with small diameters and small individuals were the main part of the stands in the Longwan Nature Reserve, and the degree of fluctuation in DBH, tree height, and canopy density was large, indicating that these sample plots were in a relatively intense succession stage and had not yet recovered to the zonal vegetation−coniferous and broadleaved mixed forest in the secondary succession process after logging.

4.2. Allometric Growth Models of DBH, Tree Height, and Crown Width

Research on individual tree growth is crucial for managing forest community structure and stand management [49]. Several studies have demonstrated that the DBH and tree height are the most significant factors in the allometric growth relationship between tree crown and stand variables. Both factors have a significant allometric growth relationship with crown width [50]. The allometric growth model has become a standard for evaluating forest growth scientifically and guiding forest management decisions [51]. For instance, Jenkins, Sawadogo, and others investigated the stand structure of common tree species in the eastern United States and west Africa. They estimated the growth and space required for tree growth in the region by creating allometric growth equations for DBH, tree height, and tree crown [52,53]. Similarly, a study investigated stand variables such as DBH and tree height of ash trees growing in Oakville, Canada, and established allometric growth equations for DBH, tree height, and crown width. This model may be used to estimate the growth of ash trees in Oakville with similar climate and management environments [54]. Our study also found that the DBH and tree height significantly affect crown width. The crown gradually increased with increasing DBH and tree height (Figure 4 and Figure 5). Among them, the optimal models for Acer mandshuricum, Ulmus japonica, Juglans mandshurica, Acer mono and Tilia amurensis were 0.807D0.646, 0.608D0.381H0.390, 0.502D0.533H0.295, 0.795D0.540H0.157, and 0.541D0.484H0.301, respectively, and the R2 values were between 0.6 and 0.8 (Table 1), indicating that the models have a good fitting effect. In summary, allometric growth models can provide guidance for nurturing and thinning trees and forest management in the Longwan Nature Reserve.

4.3. Impact of Plant Community Structure on Diversity

There is a coupling relationship between forest community structure and species diversity. For instance, tree density is an important factor affecting species composition and diversity [33]. There was a negative correlation between the stand density and species richness of Pinus tabulaeformis Carr. and Pinus massoniana Lamb. forests, and plant diversity was the highest at medium density [55,56]. In addition, a study showed that as the Tumbesian dry forest stand density decreased, species richness decreased significantly [57]. Our results suggested that stand density had a positive effect on species richness and had a significant negative correlation with species evenness (Table 2). With the increase in tree density, although species diversity did not change significantly, the species composition of the tree layer changed, and the evenness decreased. Moreover, one study suggested that the shading of Sitka spruce and western hemlock was detrimental to the survival and growth of vascular plants [58], which was closely related to the crown width of arbors. Similarly, the average DBH was also a major factor affecting species composition. One study of mountain forests in western Hungary found that the DBH of trees significantly influenced species composition and diversity in the understory [59]. Our experimental results showed that the DBH and crown width had negative effects on species richness, while both had a significant positive correlation with evenness (Table 2): with the increase in the DBH and crown width, the evenness of the tree layer increased. It is worth noting that in this study, the stand factors (density, DBH, crown width) were only significantly related to species richness and evenness, but had no significant correlation with the Simpson and Shannon–Wiener diversity indexes, which may be due to its plentiful water and heat resources, soil fertility, and the fact that the species with similar niches had a harmonious interspecific relationship. Consequently, there was no significant impact on the species diversity indexes of the tree layer. Some studies have indicated that the individual size of arbors significantly affects species diversity in forest ecosystems. For instance, it has been shown that the average height of plants decreases, which is conducive to the improvement of plant diversity [30], and a significant correlation between tree height and plant diversity has been found in subtropical montane forests [60]. In contrast, there was no significant correlation between species diversity and tree height in our study, which indicated that stand size was not the limiting factor for tree species diversity in the Longwan Nature Reserve, probably because most of the species were young stands and the difference in tree heights was not significant. The comprehensive analysis of the stand structural characteristics revealed that tree density, DBH and crown width were the main factors influencing temperate forest diversity in the Changbai Mountain region of Northeast China. This study can identify ways to effectively improve species diversity by exploring the coupling relationship between community structure and plant diversity, which is beneficial to the conservation of plant diversity and the stability of forest ecological functions.

5. Conclusions

The tree layer community of the forest ecosystem in the Longwan Nature Reserve belongs to the secondary forest formed by natural regeneration, and the forest types are mainly deciduous broad-leaved mixed forest and a small amount of coniferous broad-leaved mixed forest. The trees with small diameters and small individuals were the main part of the stand, and more importantly, DBH, tree height and canopy density fluctuated greatly, which was in an intense succession stage. The results indicated that the optimal allometric growth models of the main tree species (Acer mandshuricum, Ulmus japonica, Juglans mandshurica, Acer mono and Tilia amurensis) were 0.807D0.646, 0608D0.381H0.390, 0.502D0.533H0.295, 0.795D0.540H0.157, and 0.541D0.484H0.301, respectively. In addition, density, DBH, and crown width were the main factors affecting the richness index and evenness index of the tree layer. Considering that forest ecosystems have many important ecological functions, this study could provide a scientific basis for the optimal allocation of forest resources, the protection of plant diversity, and the stability of ecological functions.

Supplementary Materials

The following supporting information can be downloaded at: https://www.mdpi.com/article/10.3390/f14040750/s1, Table S1: Proportion (%) of importance value of species at different sample plots.

Author Contributions

Conceptualization, Y.L.; data curation, X.W.; formal analysis, C.Z.; investigation, J.L.; software, H.J.; writing—original draft, Z.L.; writing—review and editing, L.S. All authors have read and agreed to the published version of the manuscript.

Funding

This work was supported in part by the National Natural Science Foundation of China (Grant No. 32271624) and the National Key R&D Program of China (Grant No. 2022YFF1300900).

Data Availability Statement

The data presented in this study are available on request from the corresponding author.

Conflicts of Interest

The authors declare no conflict of interest.

References

  1. Symstad, A.J.; Chapin, F.S.; Wall, D.H.; Gross, K.L.; Huenneke, L.F.; Mittelbach, G.G.; Peters, D.P.; Tilman, D. Long-term and large-scale perspectives on the relationship between biodiversity and ecosystem functioning. Bioscience 2003, 53, 89–98. [Google Scholar] [CrossRef] [Green Version]
  2. Xu, M.; Ma, L.; Jia, Y.; Liu, M. Integrating the effects of latitude and altitude on the spatial differentiation of plant community diversity in a mountainous ecosystem in China. PLoS ONE 2017, 12, e0174231. [Google Scholar] [CrossRef] [Green Version]
  3. Lasch, P.; Lindner, M.; Erhard, M.; Suckow, F.; Wenzel, A. Regional impact assessment on forest structure and functions under climate change—The Brandenburg case study. For. Ecol. Manag. 2002, 162, 73–86. [Google Scholar] [CrossRef]
  4. Pastorella, F.; Paletto, A. Stand structure indices as tools to support forest management: An application in Trentino forests (Italy). J. Trop. For. Sci. 2013, 59, 159–168. [Google Scholar] [CrossRef] [Green Version]
  5. Ali, A. Forest stand structure and functioning: Current knowledge and future challenges. Ecol. Indic. 2019, 98, 665–677. [Google Scholar] [CrossRef]
  6. Zhang, T.; Chen, Y.; Wang, W.; Chen, Y.; Liu, X. Characteristics of Plant Community and Its Relationship with Groundwater Depth of the Desert Riparian Zone in the Lower Reaches of the Ugan River, Northwest China. Water 2022, 14, 1663. [Google Scholar] [CrossRef]
  7. Li, J.; Ren, Z.; Zhou, Z. Ecosystem services and their values: A case study in the Qinba mountains of China. Ecol. Res. 2006, 21, 597–604. [Google Scholar] [CrossRef]
  8. Guo, Z.; Xiao, X.; Gan, Y.; Zheng, Y. Ecosystem functions, services and their values–a case study in Xingshan County of China. Ecol. Econ. 2001, 38, 141–154. [Google Scholar] [CrossRef]
  9. Mori, A.S.; Lertzman, K.P.; Gustafsson, L. Biodiversity and ecosystem services in forest ecosystems: A research agenda for applied forest ecology. J. Appl. Ecol. 2017, 54, 12–27. [Google Scholar] [CrossRef]
  10. Staudhammer, C.L.; LeMay, V.M. Introduction and evaluation of possible indices of stand structural diversity. Can. J. For. Res 2001, 31, 1105–1115. [Google Scholar] [CrossRef]
  11. Ouyang, S.; Xiang, W.; Gou, M.; Chen, L.; Lei, P.; Xiao, W.; Forrester, D.I. Stability in subtropical forests: The role of tree species diversity, stand structure, environmental and socio-economic conditions. Glob. Ecol. Biogeogr. 2021, 30, 500–513. [Google Scholar] [CrossRef]
  12. Cifuentes Jara, M.; Henry, M.; Réjou-Méchain, M.; Wayson, C.; Zapata-Cuartas, M.; Piotto, D.; Westfall, J. Guidelines for documenting and reporting tree allometric equations. Ann. For. Sci. 2015, 7, 763–768. [Google Scholar] [CrossRef] [Green Version]
  13. Forrester, D.I. Linking forest growth with stand structure: Tree size inequality, tree growth or resource partitioning and the asymmetry of competition. For. Ecol. Manag. 2019, 447, 139–157. [Google Scholar] [CrossRef]
  14. Pretzsch, H.; Biber, P.; Uhl, E.; Dahlhausen, J.; Rötzer, T.; Caldentey, J. Crown size and growing space requirement of common tree species in urban centres, parks, and forests—ScienceDirect. Urban For. Urban Green. 2015, 14, 466–479. [Google Scholar] [CrossRef] [Green Version]
  15. Subedi, T.; Bhandari, S.K.; Pandey, N. Form factor and volume equations for individual trees of Shorea robusta in Western low land of Nepal. Austrian J. For. Sci. 2021, 138, 143–166. [Google Scholar]
  16. Víquez, E.; Pérez, D. Effect of pruning on tree growth, yield, and wood properties of Tectona grandis plantations in Costa Rica. Silva Fenn. 2005, 39, 381. [Google Scholar] [CrossRef]
  17. Laubhann, D.; Sterba, H.; Reinds, G.J.; De Vries, W. The impact of atmospheric deposition and climate on forest growth in European monitoring plots: An individual tree growth model. For. Ecol. Manag. 2009, 258, 1751–1761. [Google Scholar] [CrossRef]
  18. Ruark, G.A.; Martin, G.L.; Bockheim, J.G. Comparison of constant and variable allometric ratios for estimating Populus tremuloides biomass. For. Sci. 1987, 33, 294–300. [Google Scholar] [CrossRef]
  19. Kusmana, C.; Hidayat, T.; Tiryana, T.; Rusdiana, O. Allometric models for above-and below-ground biomass of Sonneratia spp. Glob. Ecol. Conserv. 2018, 15, e00417. [Google Scholar] [CrossRef]
  20. Curtis, R.O.; Reukema, D.L. Crown Development and Site Estimates in a Douglas-Fir Plantation Spacing Test. For. Sci. 1970, 16, 287–301. [Google Scholar] [CrossRef]
  21. Sharma, R.P.; Bílek, L.; Vacek, Z.; Vacek, S. Modelling crown width–diameter relationship for Scots pine in the central Europe. Trees 2017, 31, 1875–1889. [Google Scholar] [CrossRef]
  22. Tumwebaze, R. Allometric biomass equations for tree species used in agroforestry systems in Uganda. Agrofor. Syst. 2013, 87, 781–795. [Google Scholar] [CrossRef]
  23. Troxel, B.; Piana, M.; Ashton, M.S.; Murphy-Dunning, C. Relationships between bole and crown size for young urban trees in the northeastern USA. Urban For. Urban Green. 2013, 12, 144–153. [Google Scholar] [CrossRef]
  24. Semenzato, P.; Cattaneo, D.; Dainese, M. Growth prediction for five tree species in an Italian urban forest. Urban For. Urban Green. 2011, 10, 169–176. [Google Scholar] [CrossRef]
  25. Rametsteiner, E.; Simula, M. Forest certification—An instrument to promote sustainable forest management? J. Environ. Manag. 2003, 67, 87–98. [Google Scholar] [CrossRef] [PubMed]
  26. Berger, A.L.; Puettmann, K.J. Overstory composition and stand structure influence herbaceous plant diversity in the mixed aspen forest of northern Minnesota. Am. Midl. Nat. 2000, 143, 111–125. [Google Scholar] [CrossRef]
  27. Martins, A.C.; Willig, M.R.; Presley, S.J.; Marinho-Filho, J. Effects of forest height and vertical complexity on abundance and biodiversity of bats in Amazonia. For. Ecol. Manag. 2017, 391, 427–435. [Google Scholar] [CrossRef]
  28. Ishii, H.T.; Tanabe, S.I.; Hiura, T. Exploring the relationships among canopy structure, stand productivity, and biodiversity of temperate forest ecosystems. For. Sci. 2004, 50, 342–355. [Google Scholar] [CrossRef]
  29. Kern, C.C.; Montgomery, R.A.; Reich, P.B.; Strong, T.F. Harvest-created canopy gaps increase species and functional trait diversity of the forest ground-layer community. For. Sci. 2014, 60, 335–344. [Google Scholar] [CrossRef]
  30. Brokaw, N.; Busing, R.T. Niche versus chance and tree diversity in forest gaps. Trends Ecol. Evol. 2000, 15, 183–188. [Google Scholar] [CrossRef]
  31. Spehn, E.M.; Joshi, J.; Schmid, B.; Diemer, M.; Körner, C. Above-ground resource use increases with plant species richness in experimental grassland ecosystems. Funct. Ecol. 2000, 14, 326–337. [Google Scholar] [CrossRef]
  32. Auclair, A.N.; Goff, F.G. Diversity relations of upland forests in the western Great Lakes area. Am. Nat. 1971, 105, 499–528. [Google Scholar] [CrossRef]
  33. Pitkänen, S. Correlation between stand structure and ground vegetation: An analytical approach. Plant Ecol. 1997, 131, 109–126. [Google Scholar] [CrossRef]
  34. Oliver, P.A.T. Patterns of shrub diversity and tree regeneration across topographic and stand-structural gradients in a Mediterranean forest. For. Syst. 2015, 24, 11. [Google Scholar] [CrossRef] [Green Version]
  35. Barbier, S.; Gosselin, F.; Balandier, P. Influence of tree species on understory vegetation diversity and mechanisms involved—A critical review for temperate and boreal forests. For. Ecol. Manag. 2008, 254, 1–15. [Google Scholar] [CrossRef]
  36. Ma, L.; Sun, G.Q.; Qu, Y.; Li, J.Q. Applying systematic conservation planning to constitute a protection strategy for broad-leaved Korean pine forests in Changbai Mountains, China. J. Mt. Sci. 2016, 13, 493–507. [Google Scholar] [CrossRef]
  37. Song, H.-J.; Ye, J.; Shi, S.; Zhang, Z.-C.; Kuang, X.; Xing, D.-L.; Yuan, Z.-Q.; Lin, F.; Wang, X.-G.; Hao, Z.-Q. Woody plant species composition and community structure in residual fragments of broad-leaved Korean pine mixed forests in Changbai Mountains area. J. Appl. Ecol. 2014, 25, 1239–1249. [Google Scholar]
  38. Xue, D.; Tisdell, C. Valuing ecological functions of biodiversity in Changbaishan Mountain Biosphere Reserve in northeast China. Biodivers. Conserv. 2001, 10, 467–481. [Google Scholar] [CrossRef]
  39. Li, Y.; Wang, X.; He, C.; Jiang, H.; Sheng, L. Multi-environment factors dominate plant community structure and diversity in an ombrotrophic bog: The water level is the main regulating mechanism. Front. Environ. Sci. 2022, 10, 1032068. [Google Scholar] [CrossRef]
  40. Wang, X.; Bai, X.; Ma, L.; He, C.; Jiang, H.; Sheng, L.; Luo, W. Snow depths’ impact on soil microbial activities and carbon dioxide fluxes from a temperate wetland in Northeast China. Sci. Rep. 2020, 10, 8709. [Google Scholar] [CrossRef]
  41. Curtis, J.T.; McIntosh, R.P. An upland forest continuum in the prairie-forest border region of Wisconsin. Ecology 1951, 32, 476–496. [Google Scholar] [CrossRef]
  42. Ma, K.; Huang, J.; Yu, S.; Chen, L. Studies on the Diversity of Plant Communities in Dongling Mountain Area of Beijing: II Abundance, Evenness and Species Diversity. J. Ecol. 1995, 15, 268–277. (In Chinese) [Google Scholar]
  43. Zhang, L.; Du, H.; Yang, Z.; Song, T.; Zeng, F.; Peng, W.; Huang, G. Topography and Soil Properties Determine Biomass and Productivity Indirectly via Community Structural and Species Diversity in Karst Forest, Southwest China. Sustainability 2022, 14, 7644. [Google Scholar] [CrossRef]
  44. Wu, X.; Zhu, B.; Zhao, S.; Piao, S.; Fang, J. Comparison of community structure and species diversity of mixed forests of deciduous broad-leaved tree and Korean pine in Northeast China. Biol. Divers. 2004, 12, 174–181. (In Chinese) [Google Scholar]
  45. Zhang, Y.; Chen, H.Y.; Taylor, A. Multiple drivers of plant diversity in forest ecosystems. Glob. Ecol. Biogeogr. 2014, 23, 885–893. [Google Scholar] [CrossRef]
  46. Hejda, M.; Pyšek, P.; Jarošík, V. Impact of invasive plants on the species richness, diversity and composition of invaded communities. J. Ecol. 2009, 97, 393–403. [Google Scholar] [CrossRef]
  47. Pekin, B.K.; Boer, M.M.; Wittkuhn, R.S.; Macfarlane, C.; Grierson, P.F. Plant diversity is linked to nutrient limitation of dominant species in a world biodiversity hotspot. J. Veg. Sci. 2012, 23, 745–754. [Google Scholar] [CrossRef]
  48. Wright, J.S. Plant diversity in tropical forests: A review of mechanisms of species coexistence. Oecologia 2002, 130, 1–14. [Google Scholar] [CrossRef]
  49. Özçelik, R.; Diamantopoulou, M.J.; Brooks, J.R.; Wiant, H.V.L., Jr. Estimating tree bole volume using artificial neural network models for four species in Turkey. J. Environ. Manag. 2010, 91, 742–753. [Google Scholar] [CrossRef]
  50. Santos, A. Tree allometry and crown shape of four tree species in Atlantic rain forest, south-east Brazil. J. Trop. Ecol. 2002, 18, 245–260. [Google Scholar] [CrossRef] [Green Version]
  51. Yang, J.; Zhang, M.; Zhang, J.; Lu, H.; Hauer, R.J. Allometric Growth of Common Urban Tree Species in Qingdao City of Eastern China. Forests 2023, 14, 472. [Google Scholar] [CrossRef]
  52. Jenkins, J.C.; Chojnacky, D.C.; Heath, L.S.; Birdsey, R.A. National-scale biomass estimators for United States tree species. For. Sci. 2003, 49, 12–35. [Google Scholar] [CrossRef]
  53. Sawadogo, L.; Savadogo, P.; Tiveau, D.; Dayamba, S.D.; Zida, D.; Nouvellet, Y.; Oden, P.C.; Guinko, S. Allometric prediction of above-ground biomass of eleven woody tree species in the Sudanian savanna-woodland of West Africa. J. For. Res. 2020, 21, 475–481. [Google Scholar] [CrossRef]
  54. Peper, P.J.; Alzate, C.P.; McNeil, J.W.; Hashemi, J. Allometric equations for urban ash trees (Fraxinus spp.) in Oakville, Southern Ontario, Canada. Urban For. Urban Green. 2014, 13, 175–183. [Google Scholar] [CrossRef]
  55. Sun, S.; Gao, X.; Bao, W.; Wang, Z. Effects of Plantation Density of Pinus tabulaeformis on the Growth and Community Structure of Pinus tabulaeformis in the Upper Reaches of Minjiang River. J. Appl. Environ. Biol. 2005, 11, 8–13. (In Chinese) [Google Scholar]
  56. Li, F.; Pan, P.; Ni, J.; Lai, G.; Ouyang, X.; Xu, H.; Guo, L.; Wu, Z.; Yi, Z. Effects of spatial structure of aerial seeding Pinus massoniana forest on understory vegetation diversity. J. Northeast. For. Univ. 2016, 44, 6. (In Chinese) [Google Scholar]
  57. Espinosa, C.I.; Cabrera, O.; Luzuriaga, A.L.; Escudero, A. What Factors Affect Diversity and Species Composition of Endangered Tumbesian Dry Forests in Southern Ecuador? Biotropica 2011, 43, 15–22. [Google Scholar] [CrossRef] [Green Version]
  58. Schoonmaker, P.; McKee, A. Species composition and diversity during secondary succession of coniferous forests in the western Cascade Mountains of Oregon. For. Sci. 1988, 34, 960–979. [Google Scholar] [CrossRef]
  59. Király, I.; Ódor, P. The effect of stand structure and tree species composition on epiphytic bryophytes in mixed deciduous–coniferous forests of Western Hungary. Biol. Conserv. 2010, 143, 2063–2069. [Google Scholar] [CrossRef]
  60. Zhang, C.; Li, X.; Chen, L.; Xie, G.; Liu, C.; Pei, S. Effects of topographical and edaphic factors on tree community structure and diversity of subtropical mountain forests in the Lower Lancang River Basin. Forests 2016, 7, 222. [Google Scholar] [CrossRef] [Green Version]
Figure 1. Distribution of survey sample plots in the Longwan Nature Reserve.
Forests 14 00750 g001
Figure 2. Community structure characteristics of the arbor layer. (ac) Data distribution of density, basal area and canopy density of three quadrats in sample plots; (df) data distribution and Weibull curve of DBH, tree height, and crown width. In (df), the vertical axes represent the plot numbers A–Y of the survey sample.
Forests 14 00750 g002
Figure 3. Distribution characteristics of species diversity in three quadrats of the sample plots. (a) Species richness index of three quadrats in sample plots; (b) Simpson index of three quadrats in sample plots; (c) Shannon–Wiener index of three quadrats in sample plots; (d) Pielou index of three quadrats in sample plots; (e) Alatalo index of three quadrats in sample plots.
Forests 14 00750 g003
Figure 4. Scatterplot of DBH and crown width. The lines in (ae) represent the optimal curve fitting between DBH and crown width of the main dominant species. (a) Acer mandshuricum; (b) Ulmus japonica; (c) Juglans mandshurica; (d) Acer mono; (e) Tilia amurensis.
Forests 14 00750 g004
Figure 5. Scatterplot of tree height and crown width. The lines in figures (ae) represent the optimal curve fitting between the height of the tree and crown width of the main dominant species. (a) Acer mandshuricum; (b) Ulmus japonica; (c) Juglans mandshurica; (d) Acer mono; (e) Tilia amurensis.
Forests 14 00750 g005
Table 1. Parameter estimation of prediction models and significance testing of optimal models.
SpeciesModelParameter EstimationEvaluation IndexSignificance Test
abcR2RSSF-Valuep-Value
Acer mandshuricumCW = aDb0.8070.646 0.62415.750382.5900.000
CW = aDbHc0.5050.7160.2730.55117.773
Ulmus japonicaCW = aDb0.6850.682 0.57957.574
CW = aDbHc0.6080.3810.3900.60753.785422.3070.000
Juglans mandshuricaCW = aDb0.7280.678 0.71616.549
CW = aDbHc0.5020.5330.2950.73814.264534.0890.000
Acer monoCW = aDb0.8270.644 0.61834.490
CW = aDbHc0.7950.5400.1570.63630.290477.960.000
Tilia amurensisCW = aDb0.6370.698 0.70819.521
CW = aDbHc0.5410.4840.3010.78217.926460.4260.000
Note: D: breast height diameter; H: height of tree; CW: crown width.
Table 2. Correlation analysis of community structure and species diversity.
RaDaHaJswEaDyDBHTHCWBCCD
Ra1
Da0.658 **1
Ha0.853 **0.919 **1
Jsw0.1080.630 **0.466 **1
Ea−0.2040.430 **0.1370.672 **1
Dy0.321 **0.0600.128−0.271 *−0.248 *1
DBH−0.265 *−0.077−0.1610.243 *0.232 *−0.346 **1
TH−0.215−0.136−0.1940.0610.192−0.0960.700 **1
CW−0.229 *−0.028−0.0430.298 **0.253 *−0.677 **0.561 **0.392 **1
BC−0.033−0.006−0.0350.0920.0440.322 **0.546 **0.369 **0.1391
CD−0.0810.0670.0280.1960.186−0.481 **0.762 **0.480 **0.721 **0.1911
Note: * indicates a significant correlation at the 0.05 level, ** indicates a significant correlation at the 0.01 level. Ra: richness index; Da: Simpson index; Ha: Shannon–Wiener index; JSW: Pielou index. Ea: Alatalo index; Dy: density; DBH: breast height diameter; TH: height of tree; CW: crown width; BC: basal area; CD: canopy density.
Disclaimer/Publisher’s Note: The statements, opinions and data contained in all publications are solely those of the individual author(s) and contributor(s) and not of MDPI and/or the editor(s). MDPI and/or the editor(s) disclaim responsibility for any injury to people or property resulting from any ideas, methods, instructions or products referred to in the content.

